
Sustainable Systems Engineering Using Life Cycle Assessment: Application of Artificial Intelligence for Predicting Agro-Environmental Footprint

 , and
, and
Abstract
1. Introduction
2. Materials and Methods
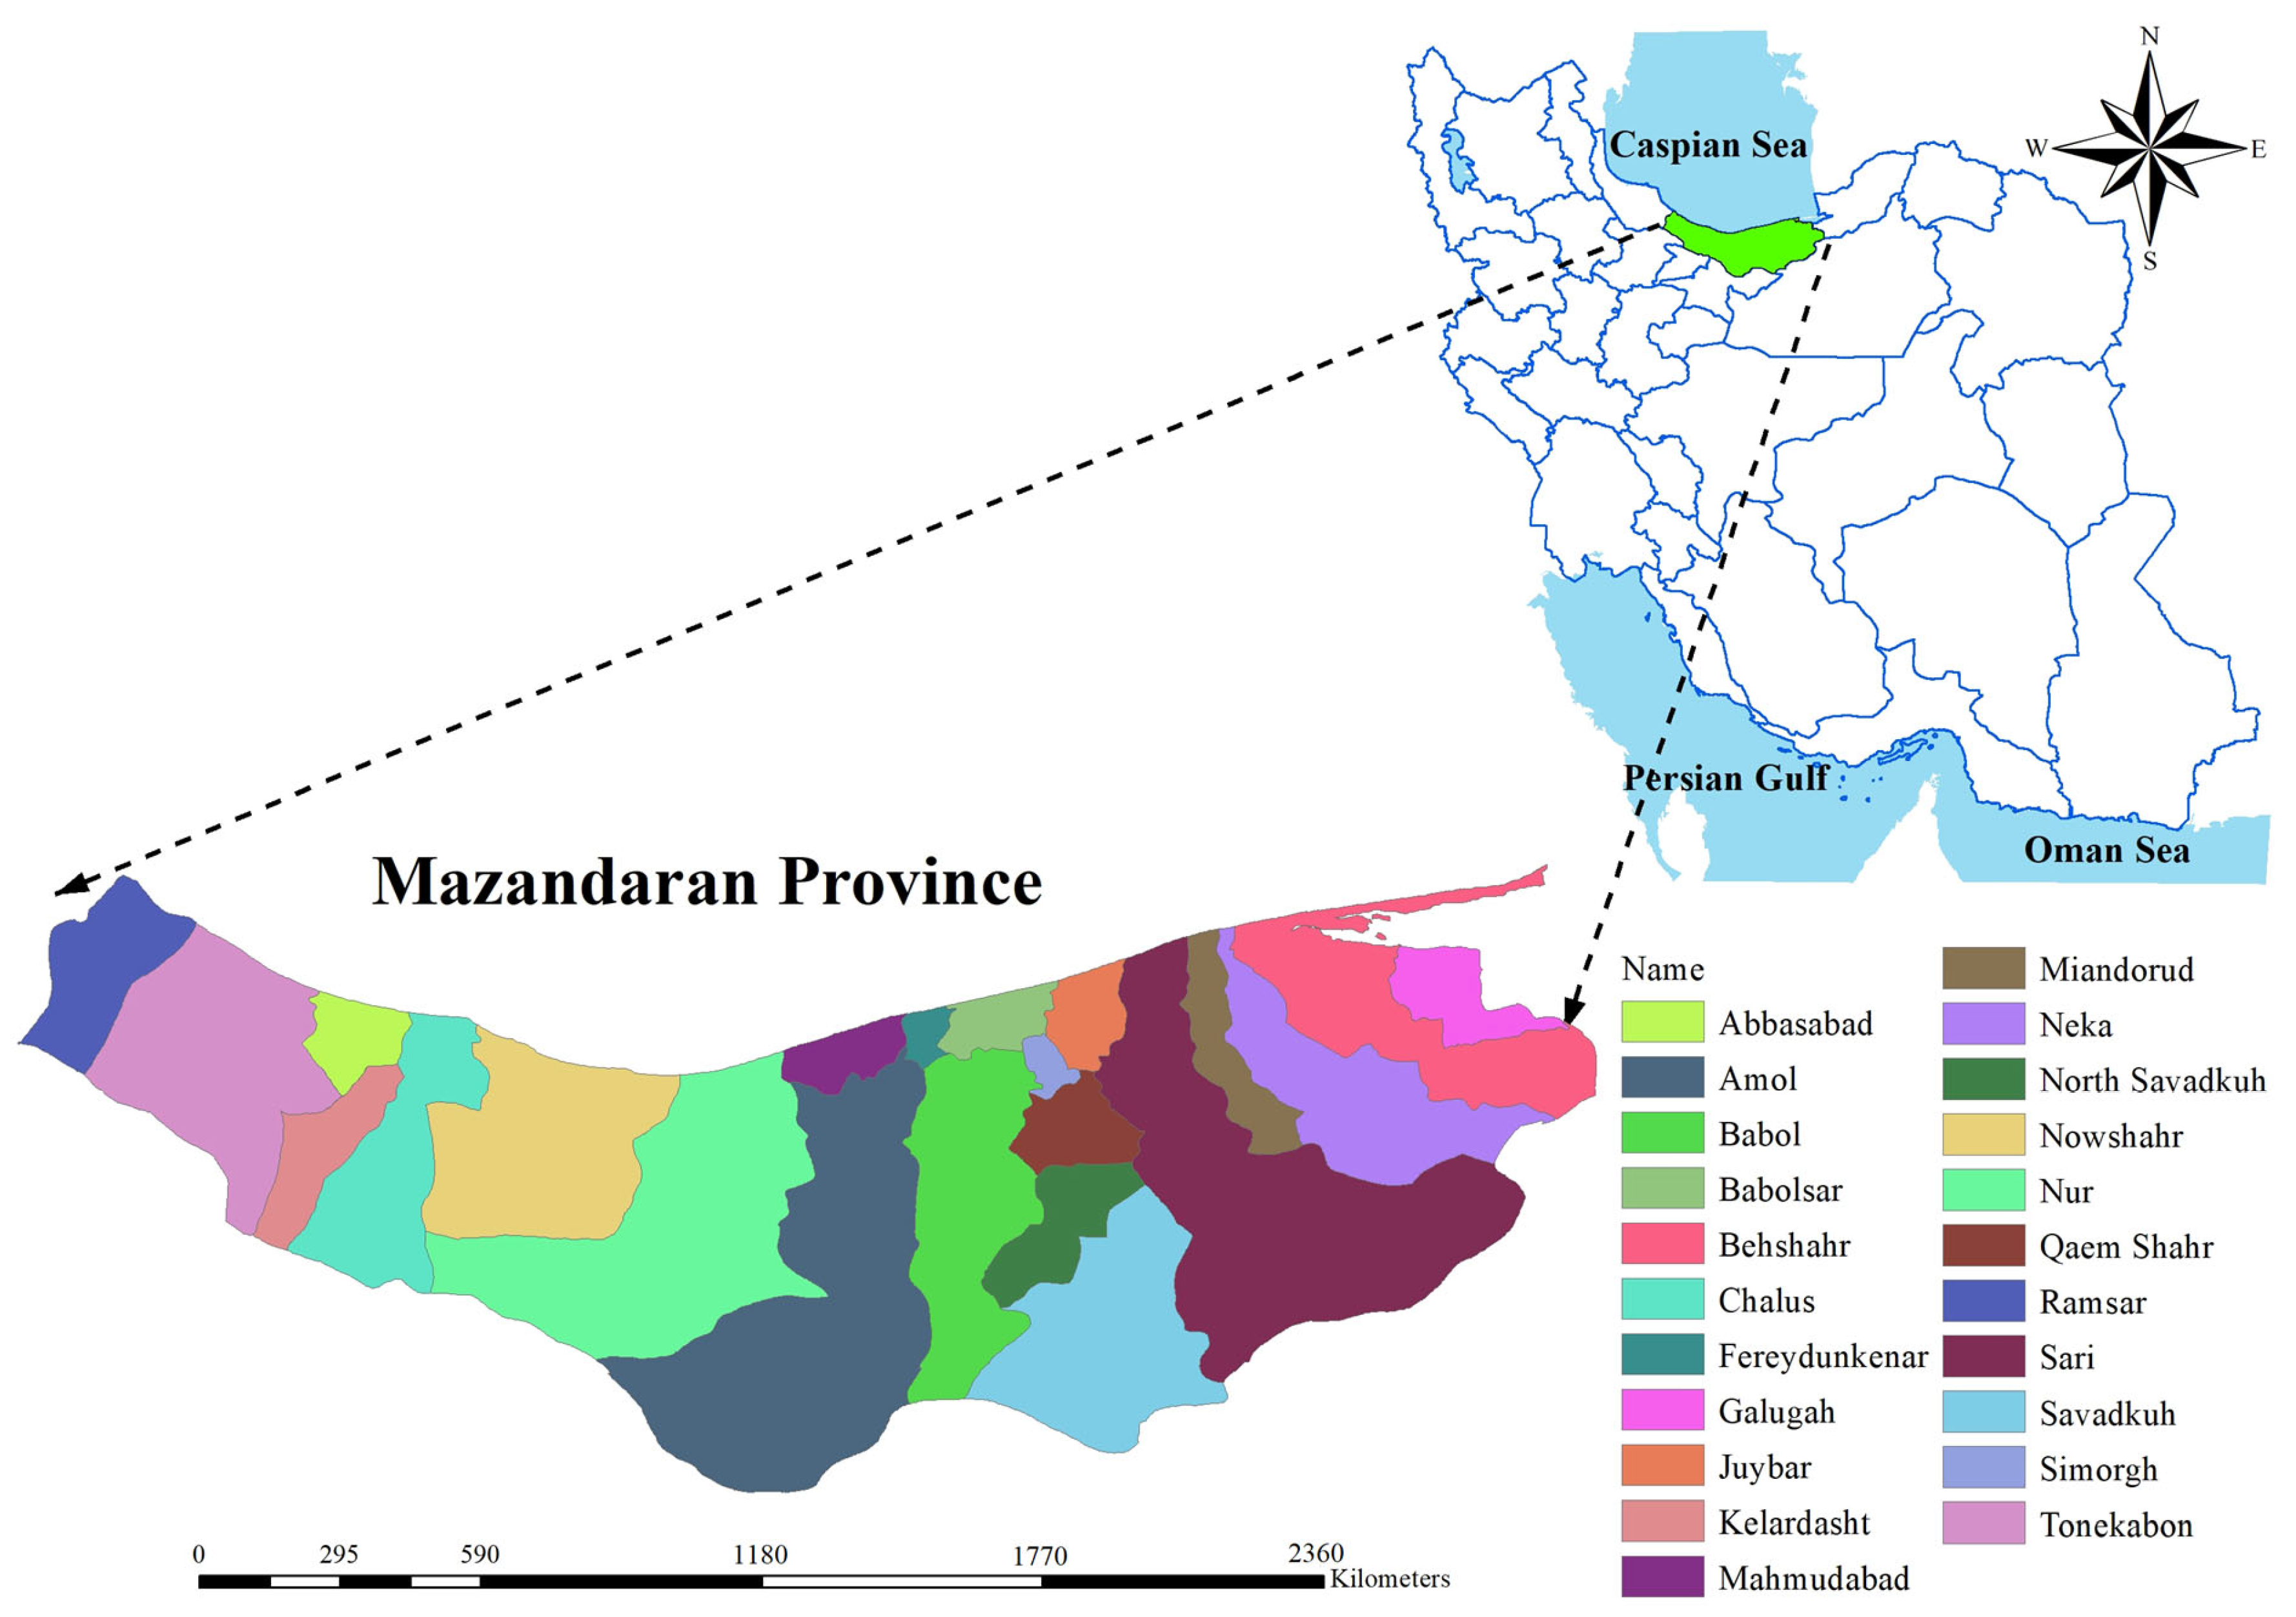
2.1. Study Region and Farming System Description
- (1)
- Soybean cultivation after rapeseed harvest;
- (2)
- Soybean cultivation after wheat harvest;
- (3)
- Soybean cultivation after six months of fallow.
2.2. LCA of Soybean Production
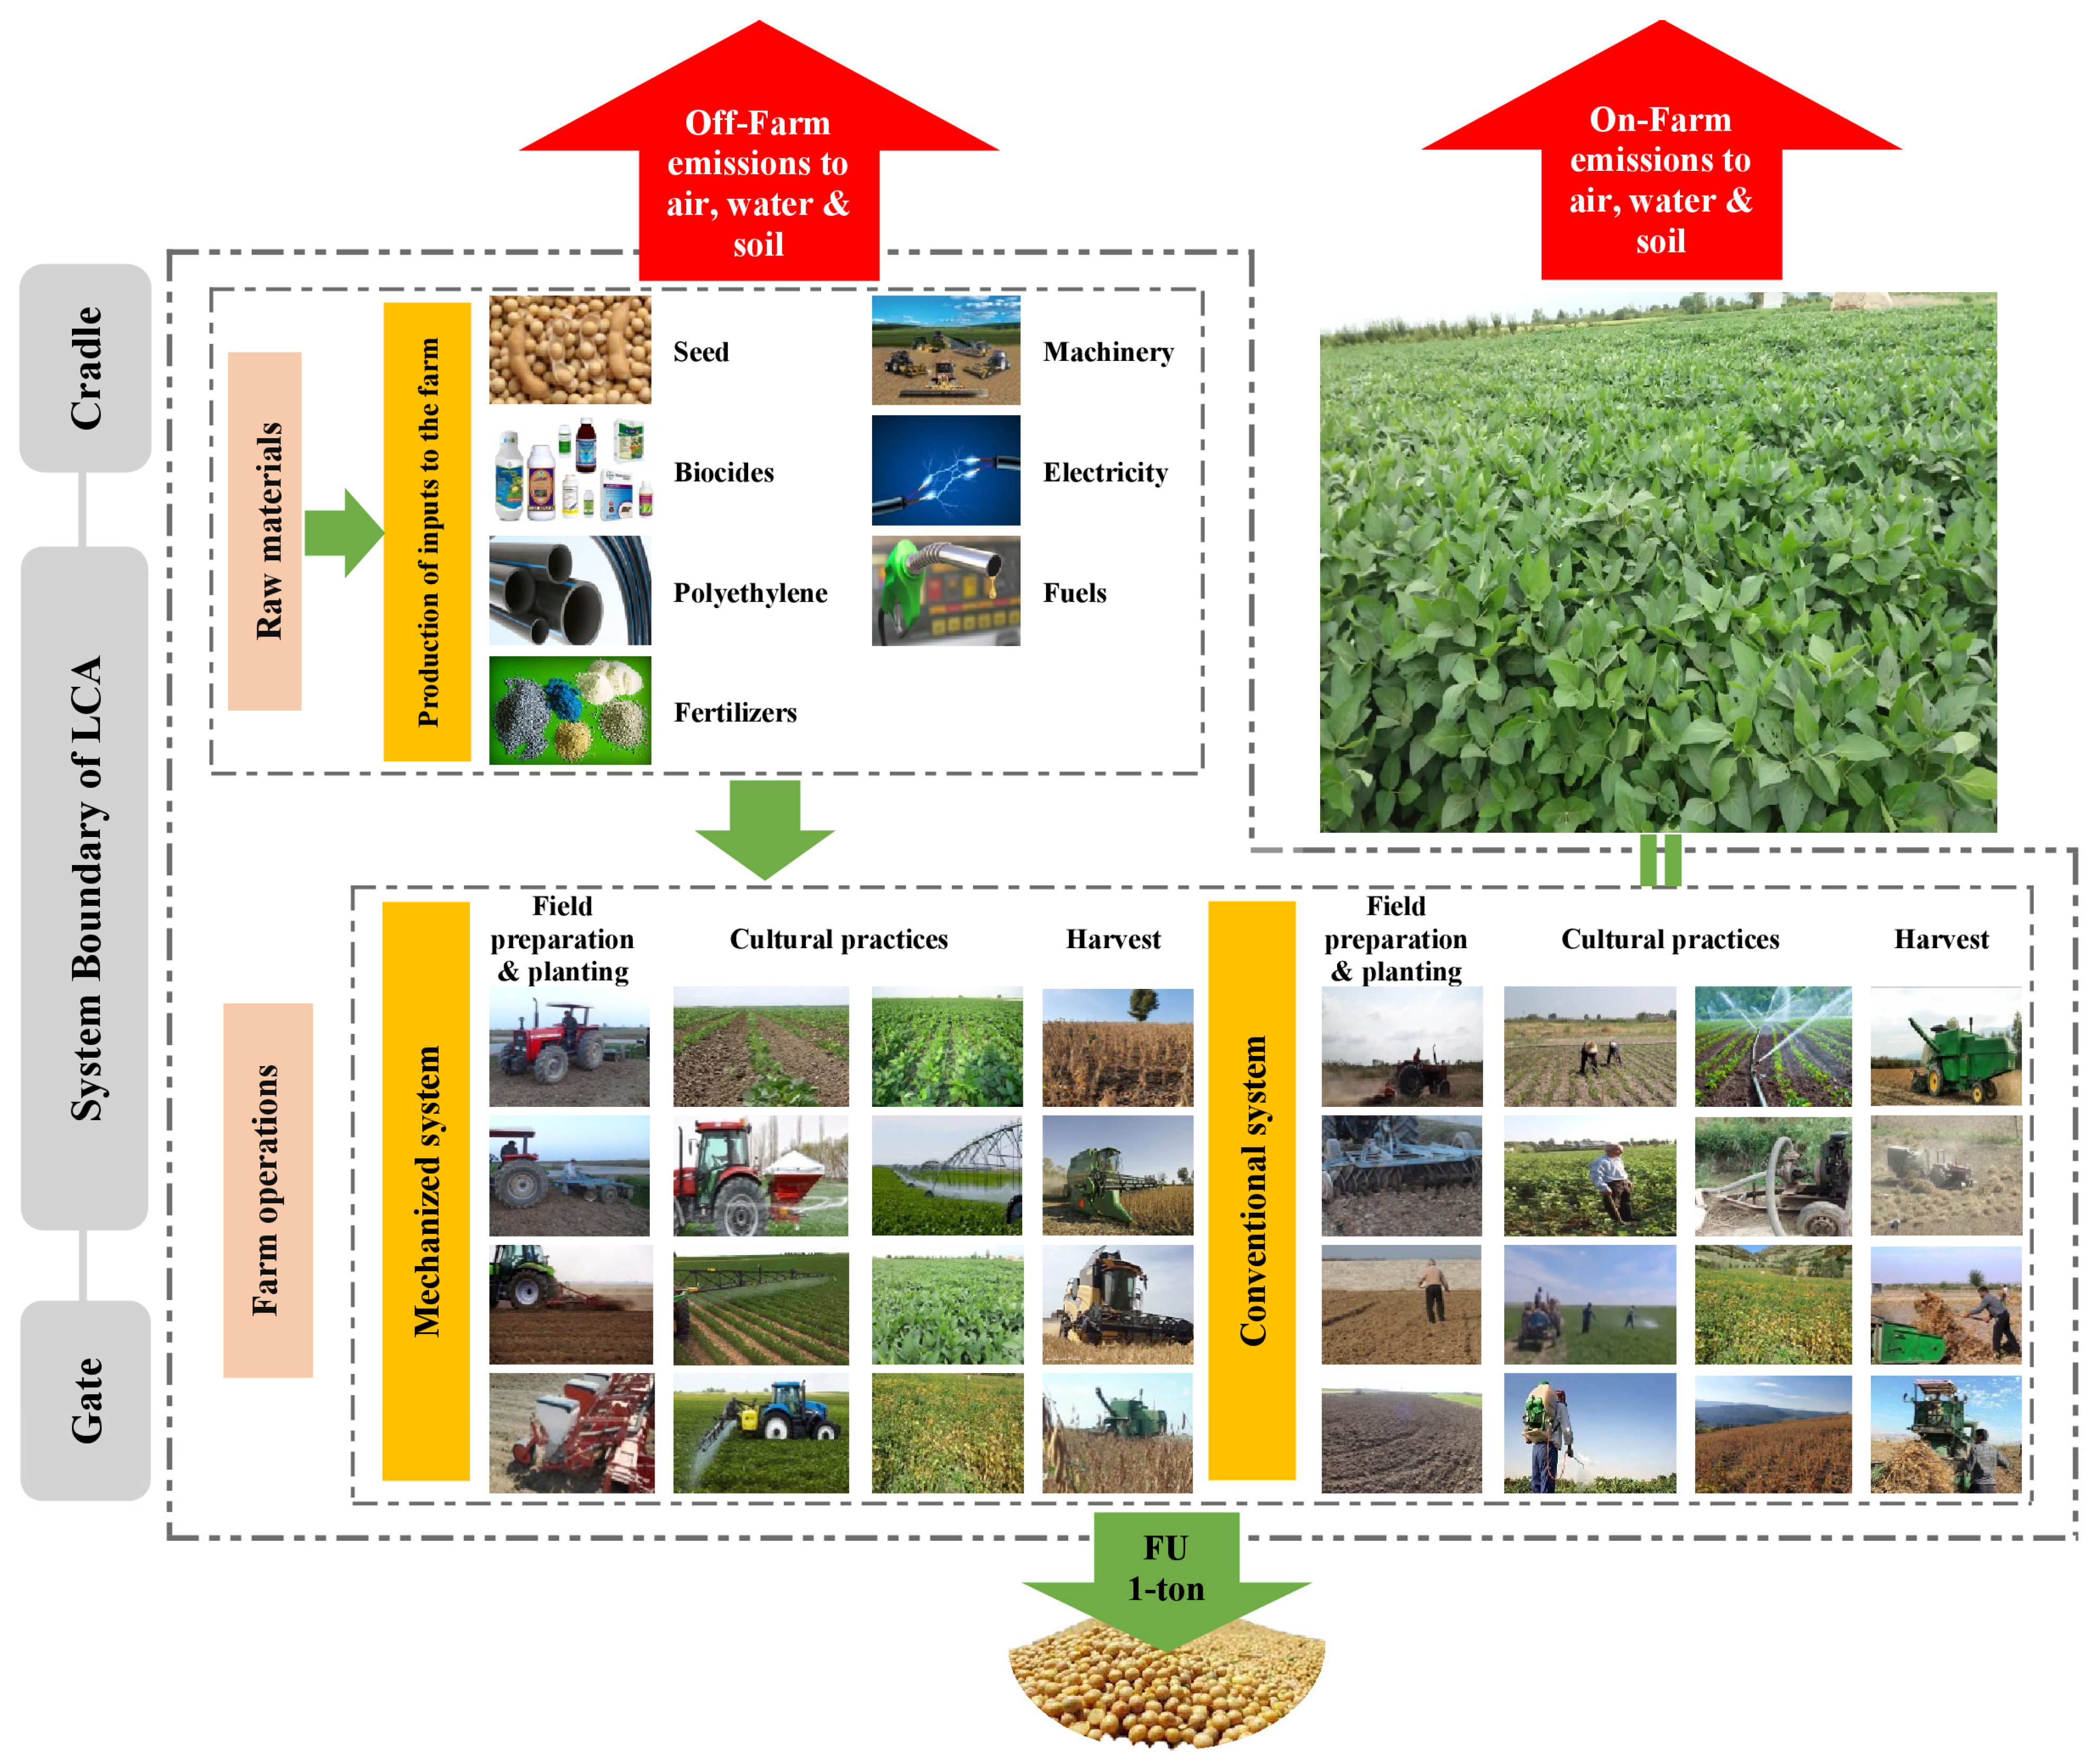
2.2.1. Goal, Functional Unit, and System Boundary
2.2.2. LCI Analysis and Data Collection
- Background systems (cradle-to-gate) data: Data related to this section include the environmental impacts of production, distribution, and transportation of inputs (e.g., biocides, chemical fertilizers, electricity, and fuels). In the present study, the data used in this section were adapted from the EcoInvent3.5 database available in SimaPro software v. 9.0.0.49.
- Foreground systems (gate-to-gate) data: Data associated with this section include the number of inputs (fertilizers, biocides, and fuels, etc.), and outputs, i.e., soybean seed, and emissions in water, soil, and air caused by input application on the farm (from the planting to harvesting of soybean).
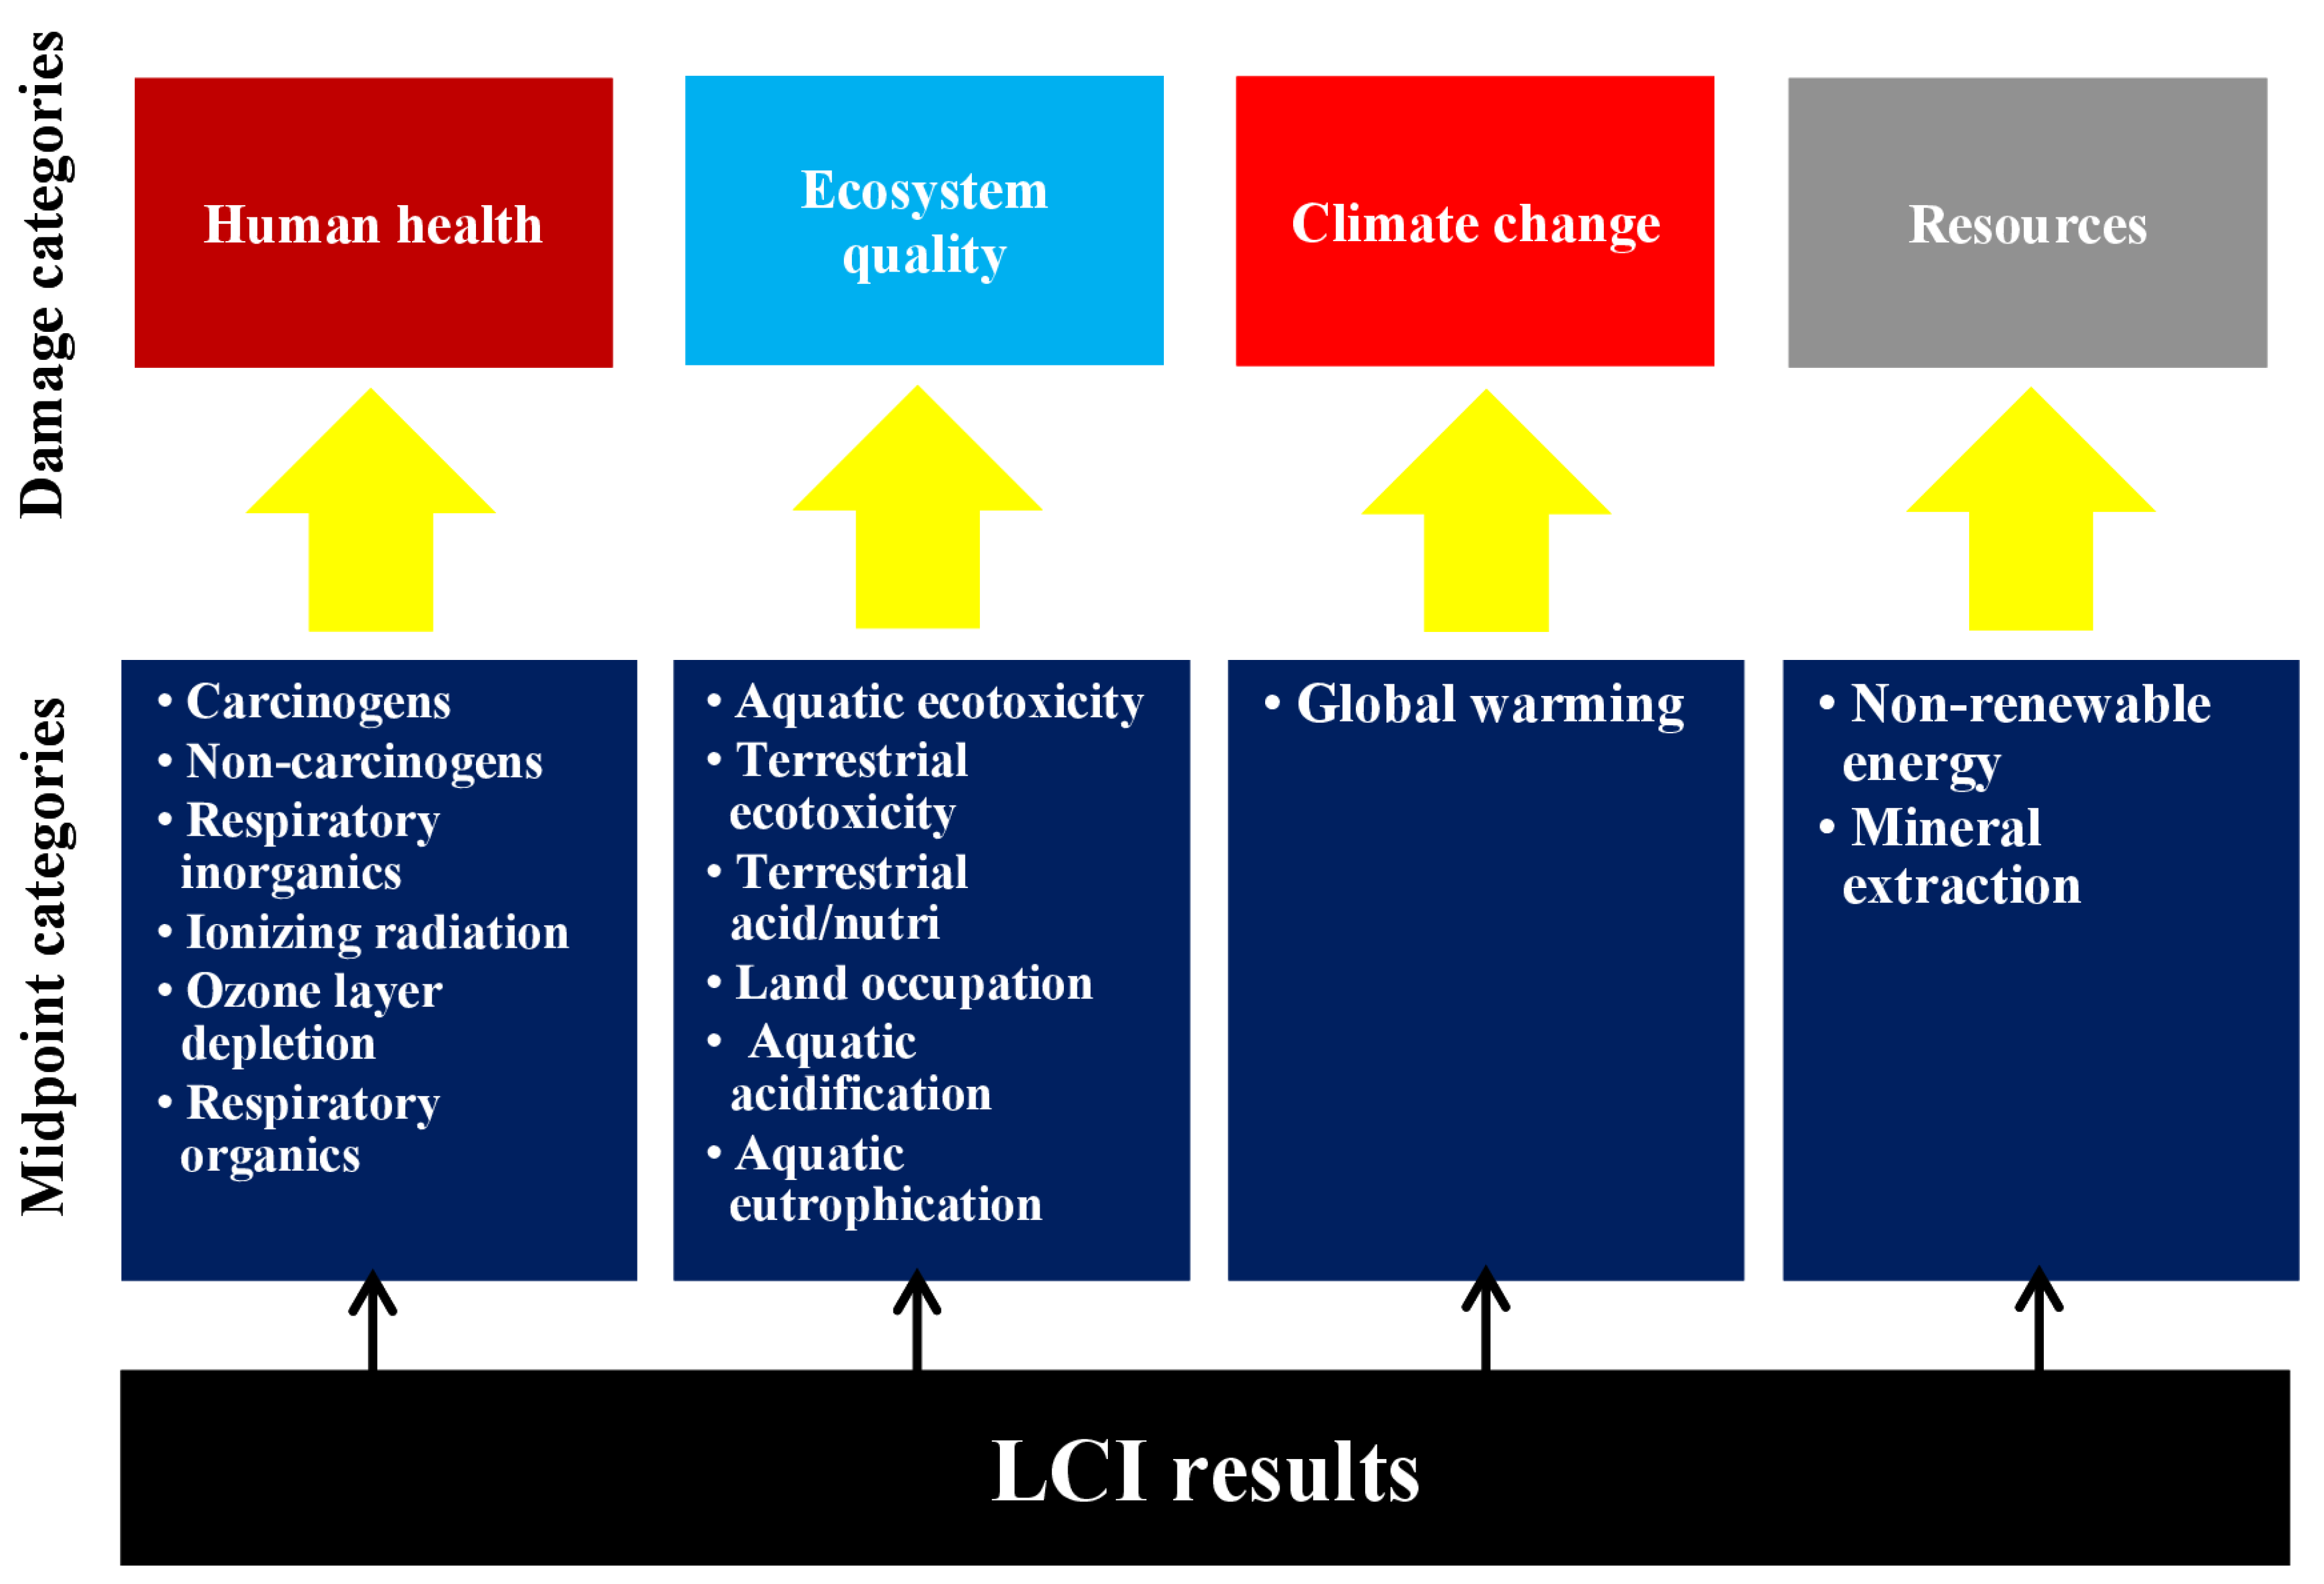
2.2.3. Assessing the Impacts of Soybean Production
2.3. ANFIS-FCM Method
2.4. ANN Method
2.5. Model Validation
3. Results
3.1. EIA of Soybean Production Scenarios
3.1.1. Results of Damage Assessment
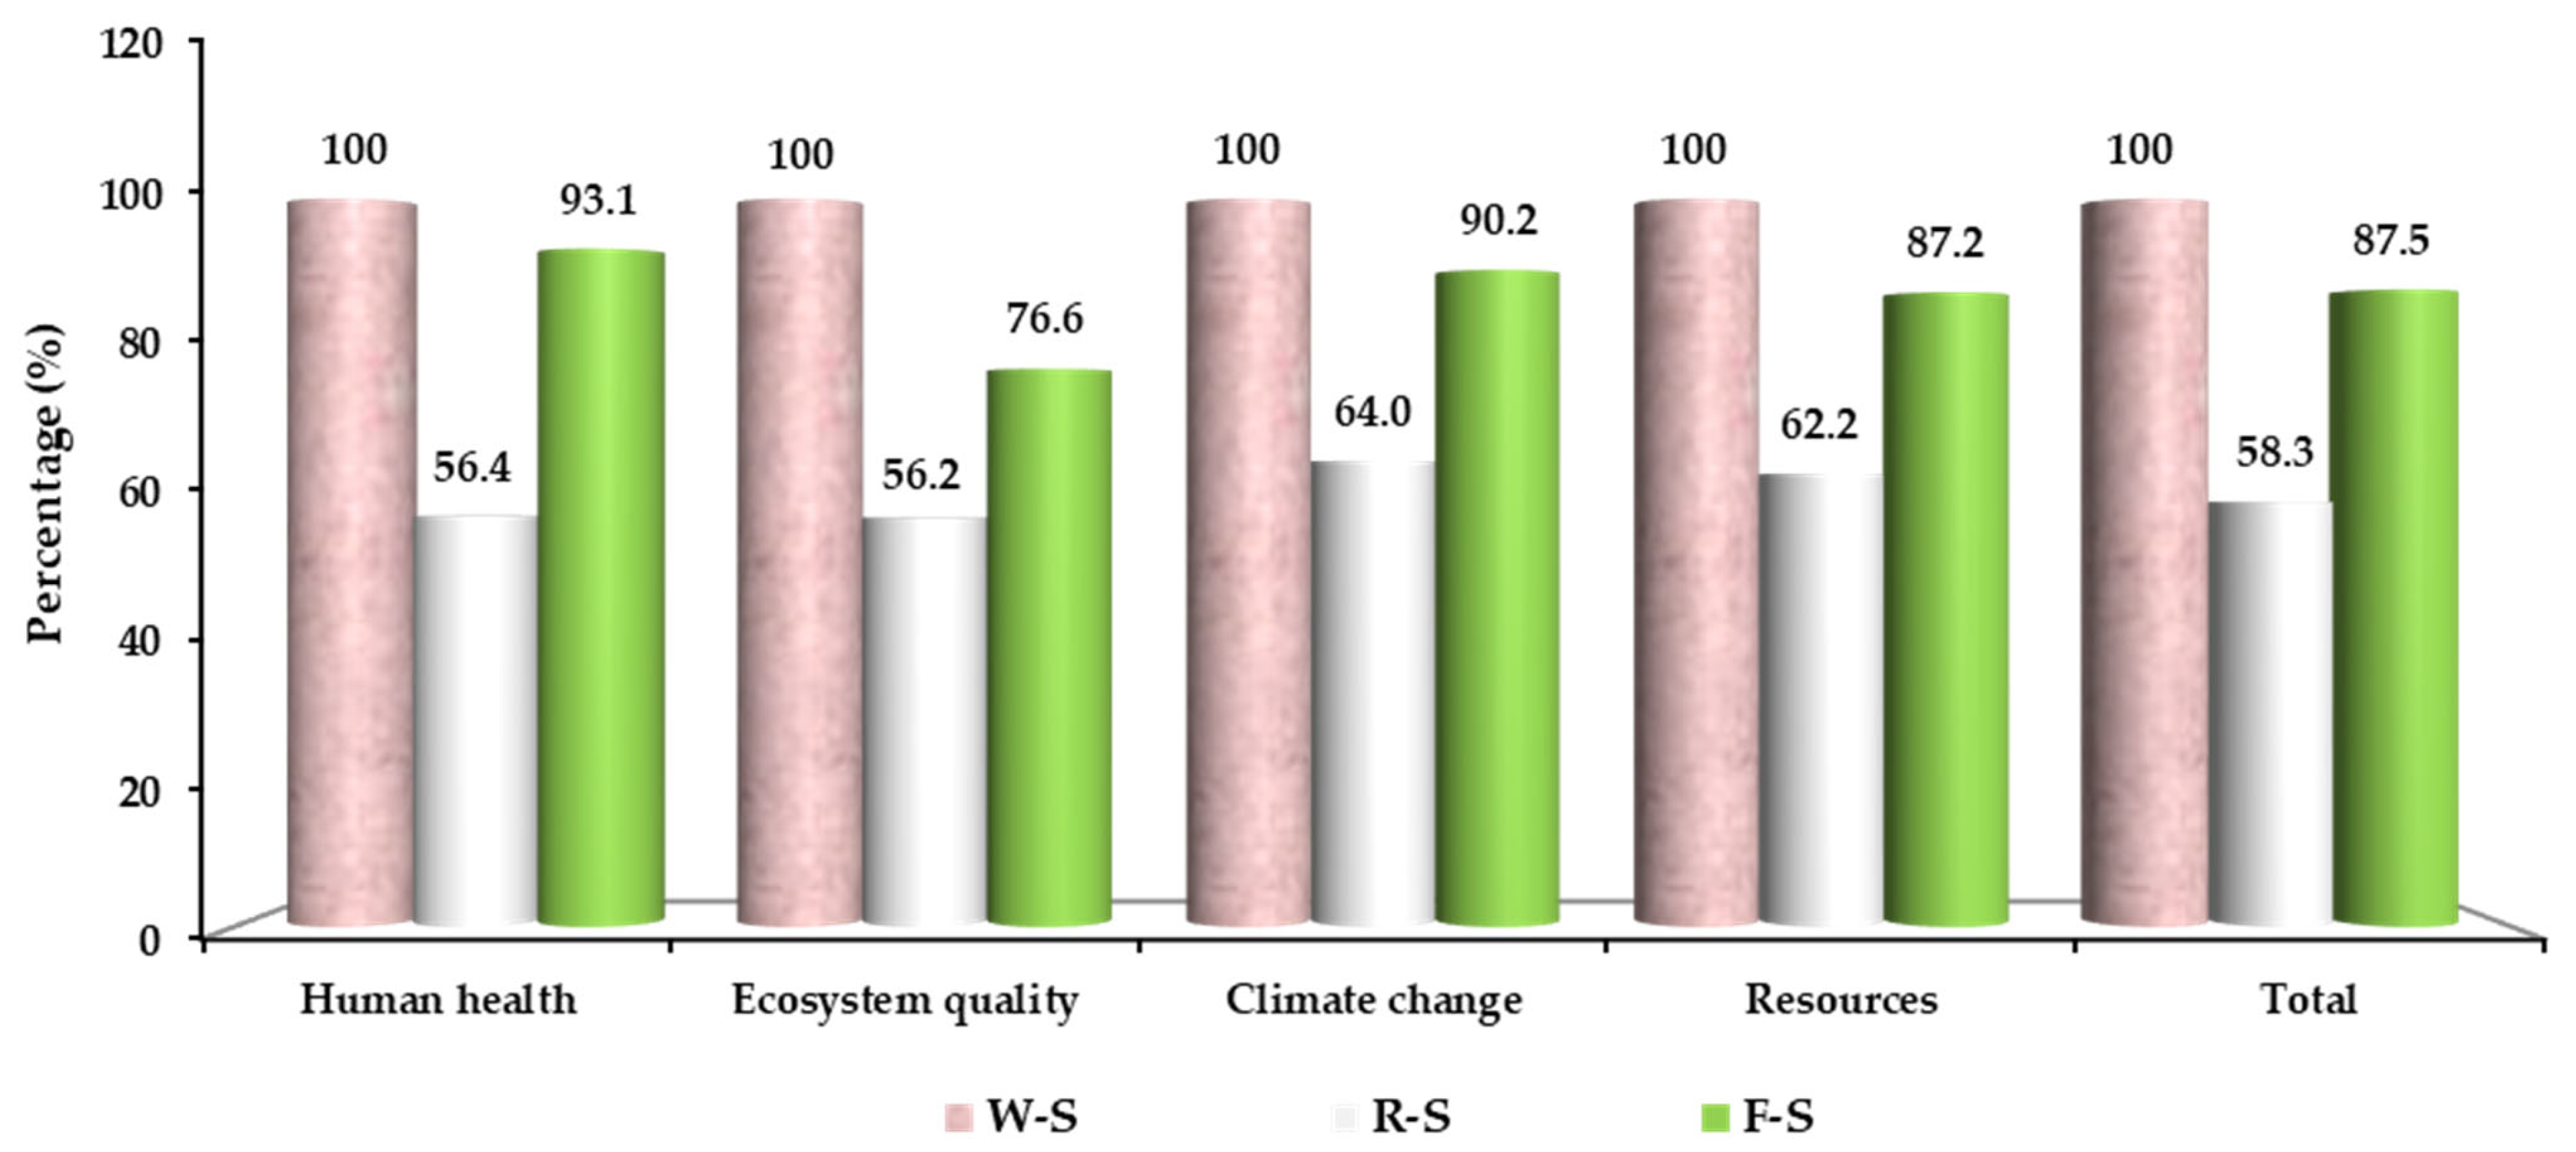
3.1.2. Comparison of Environmental Damages among Various Scenarios
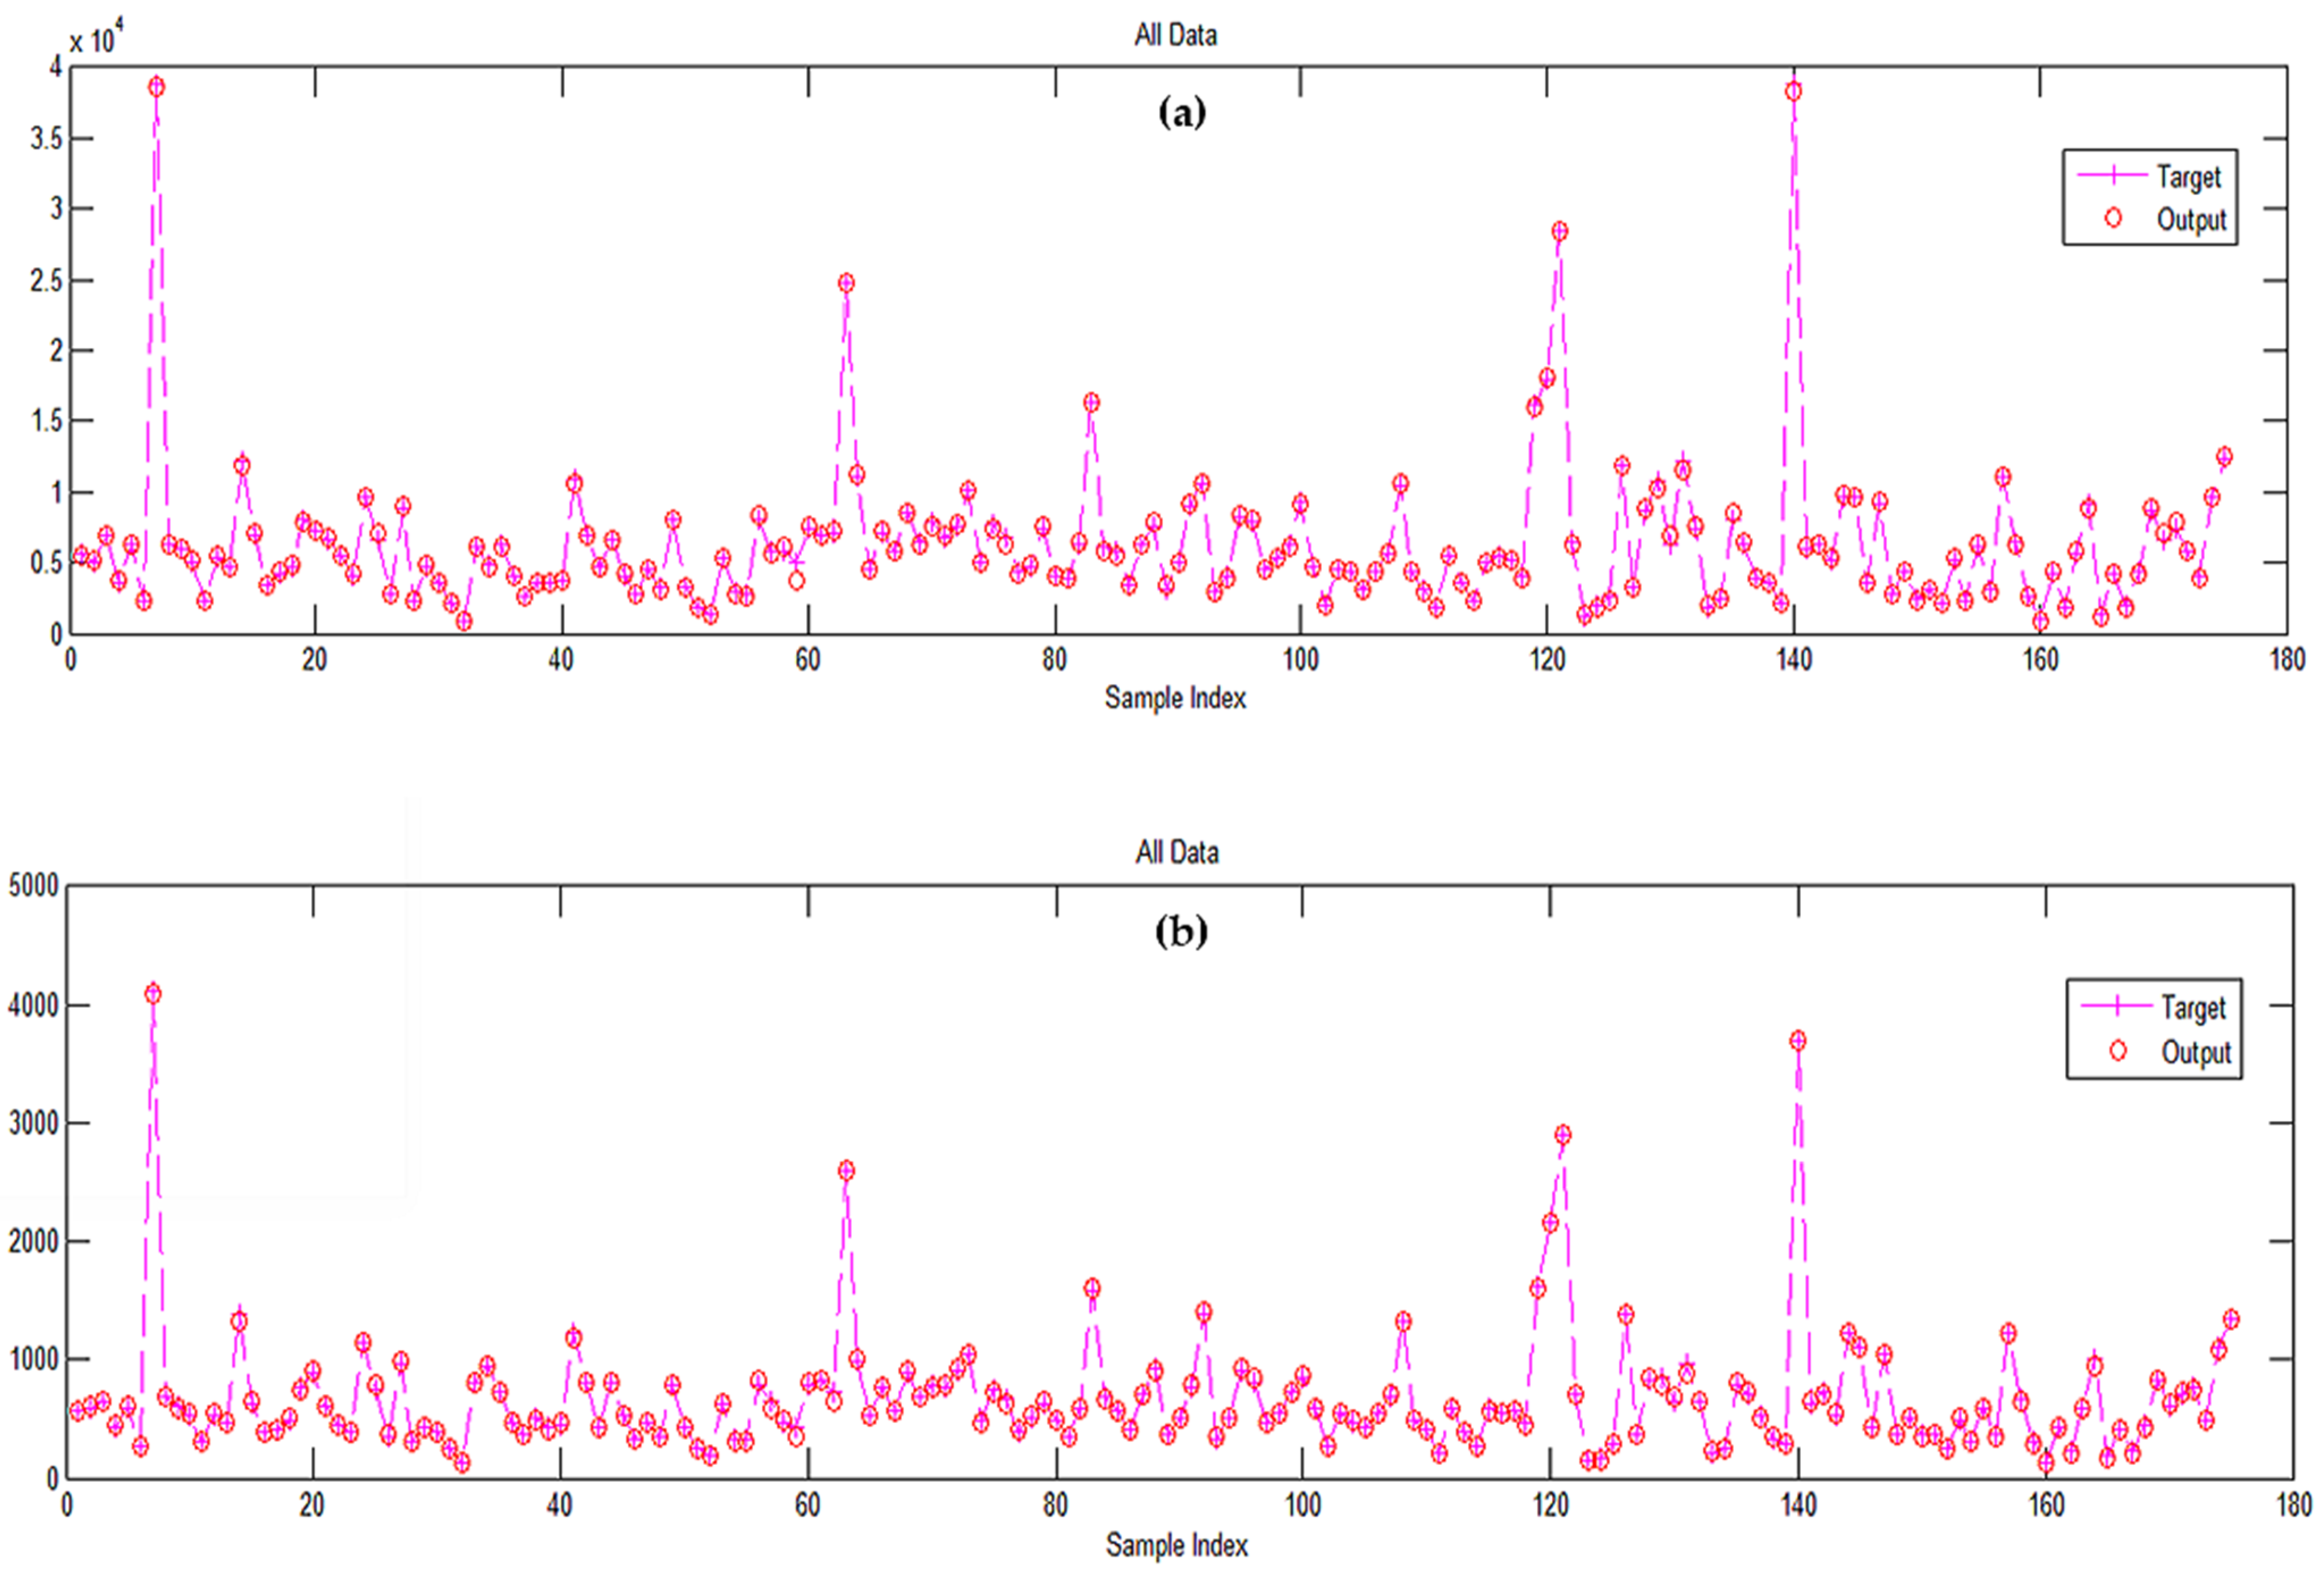
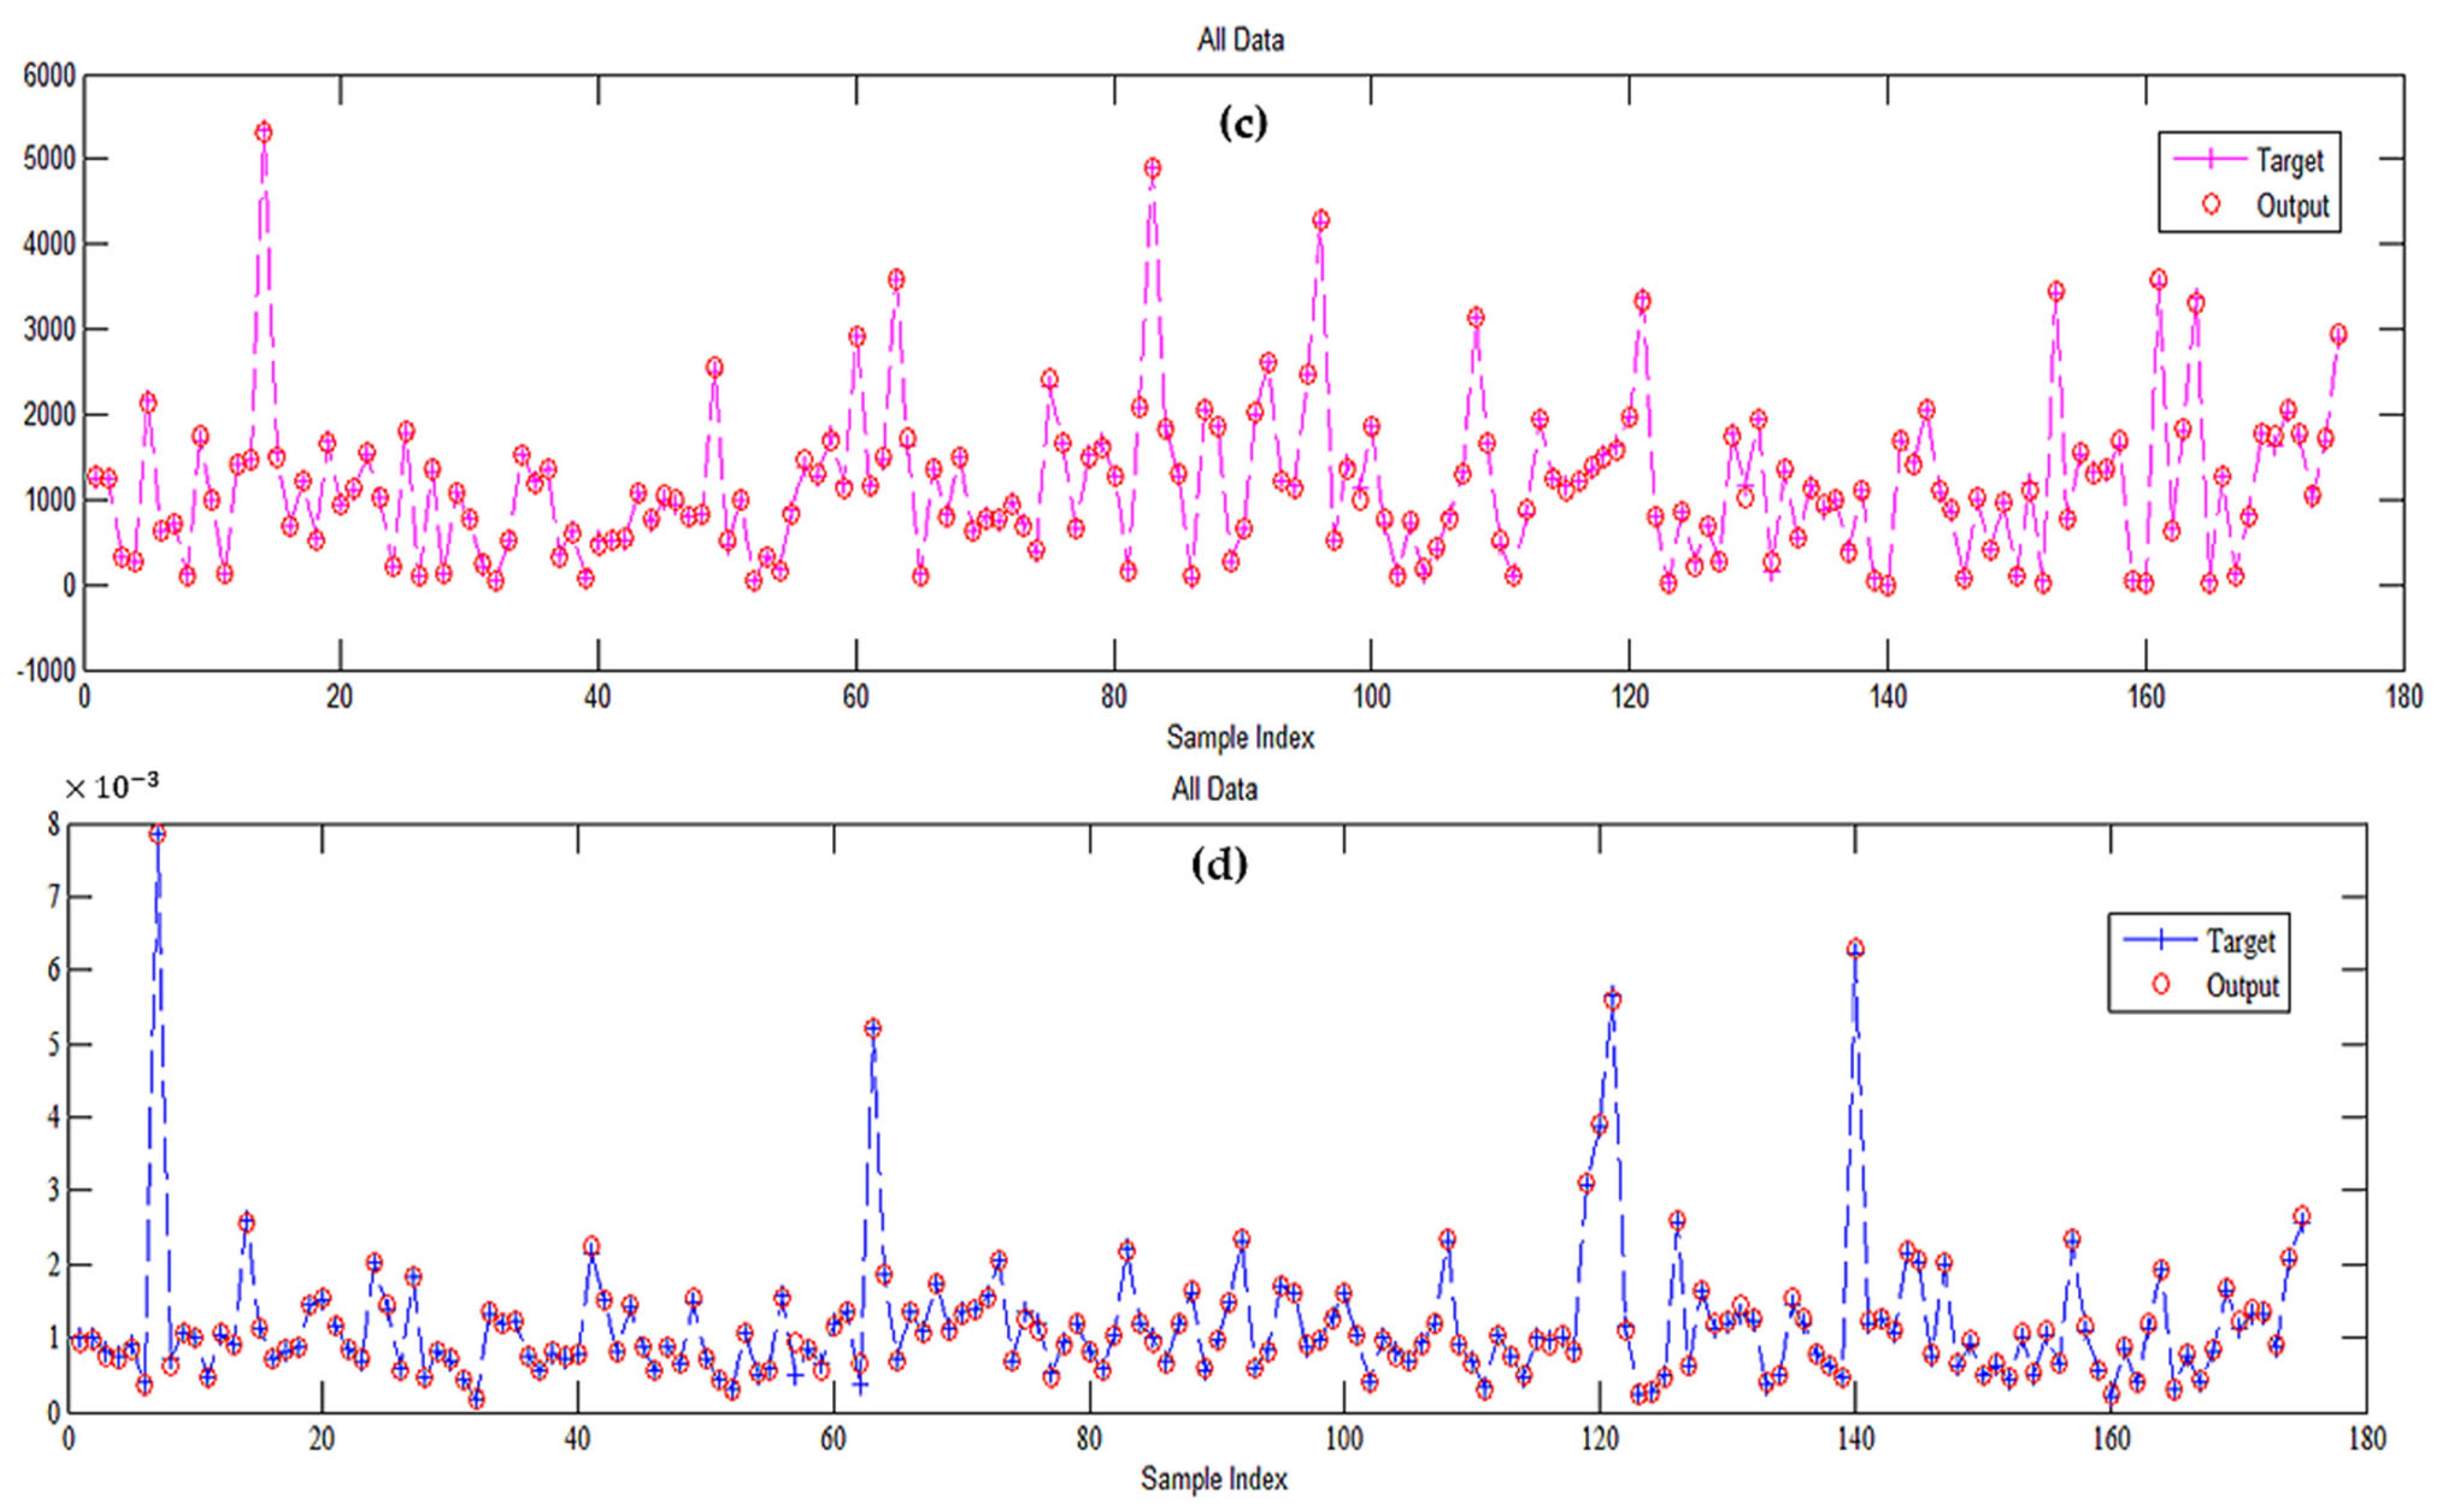
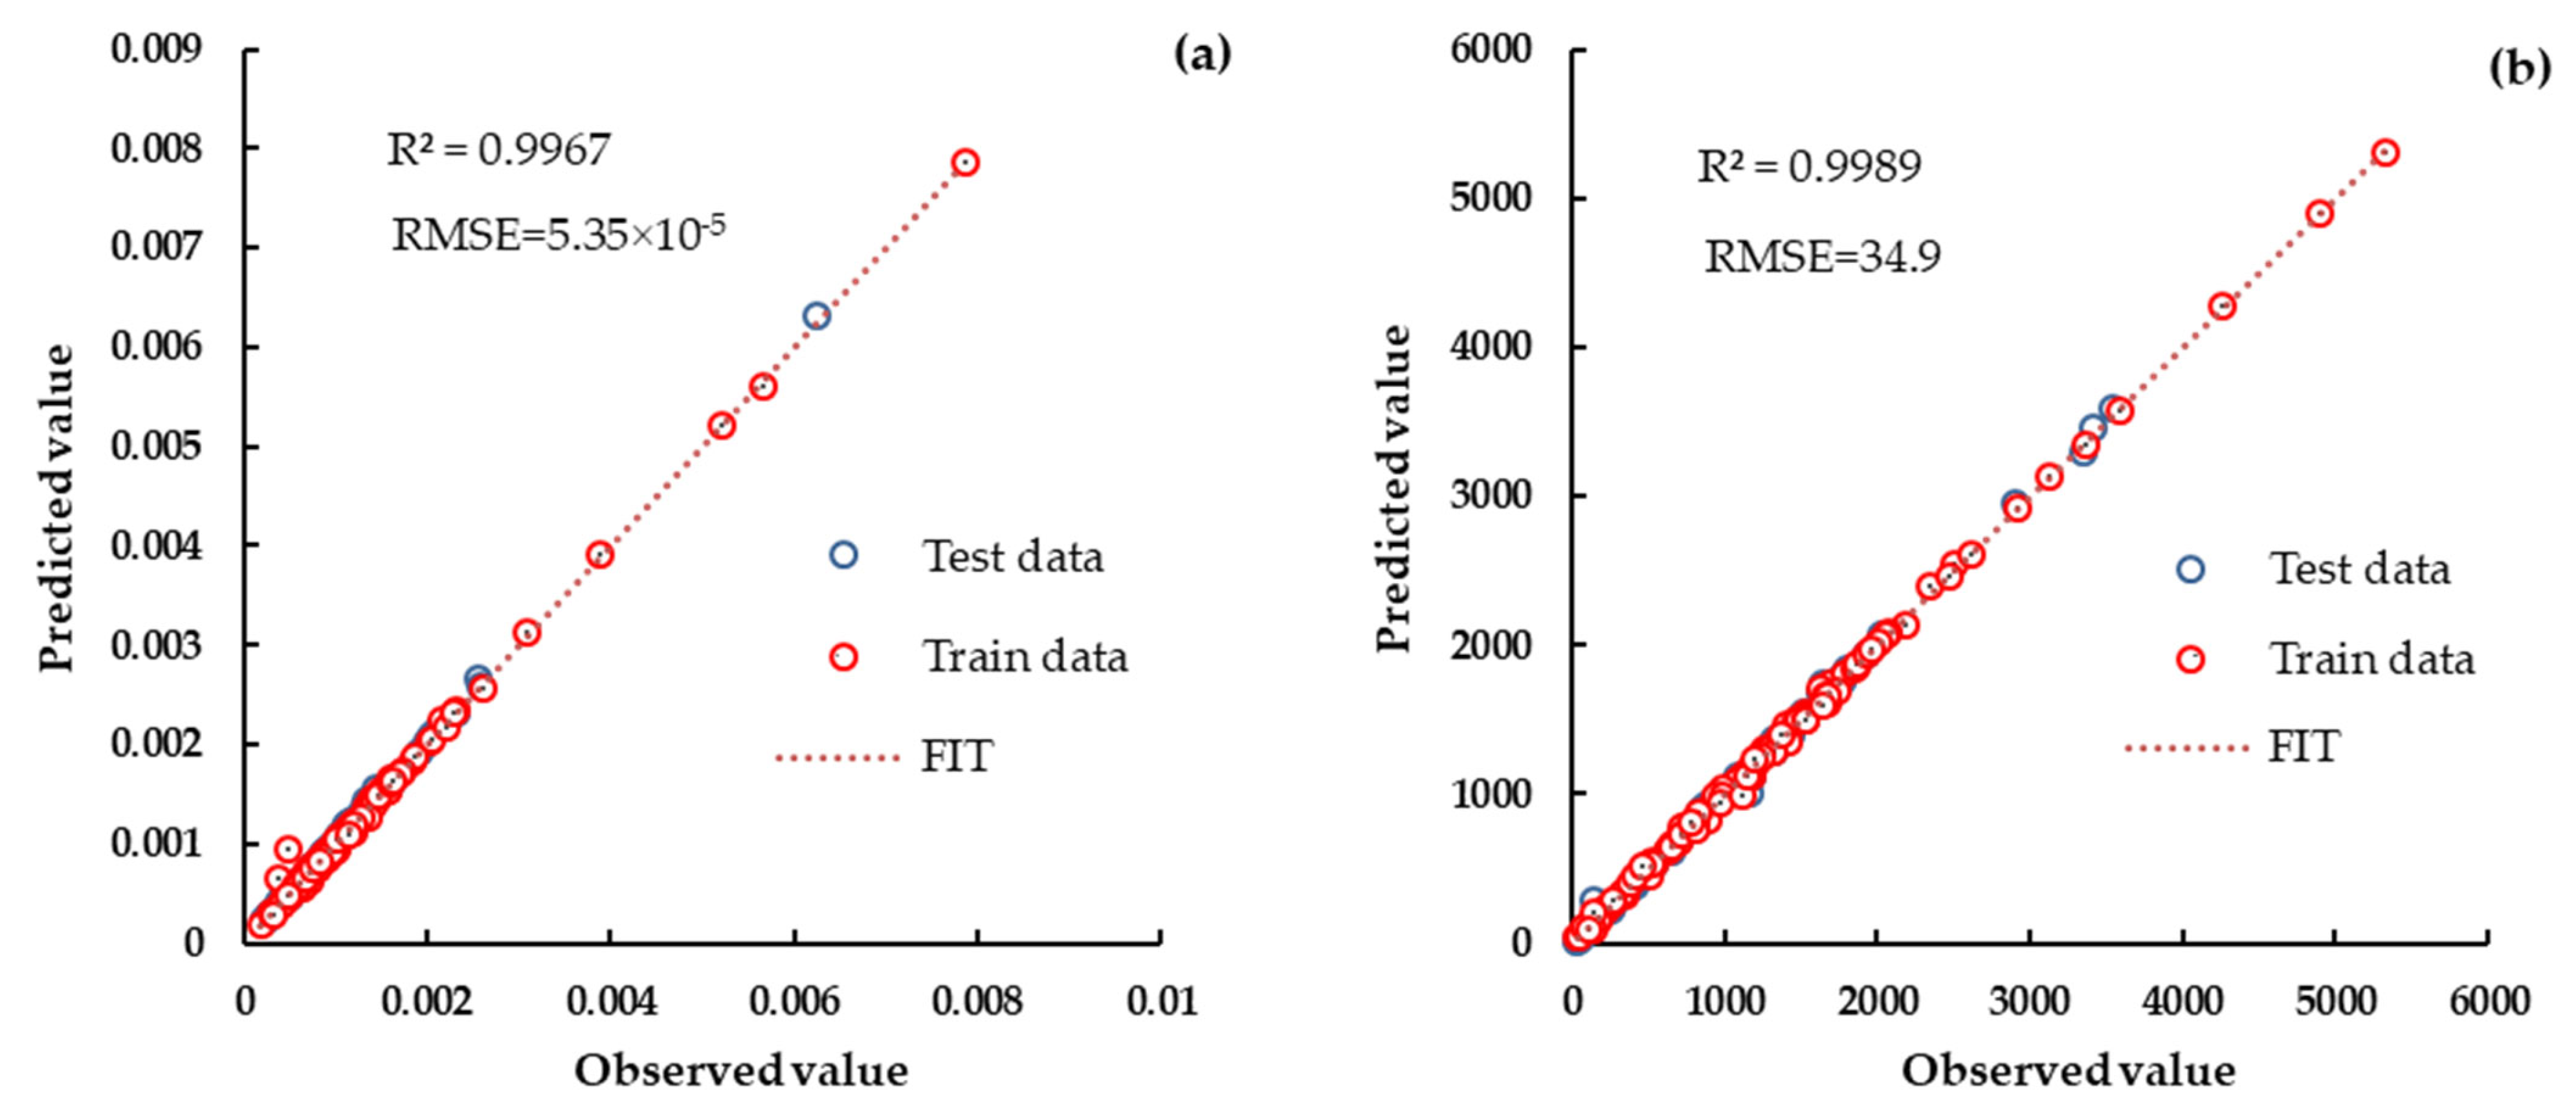
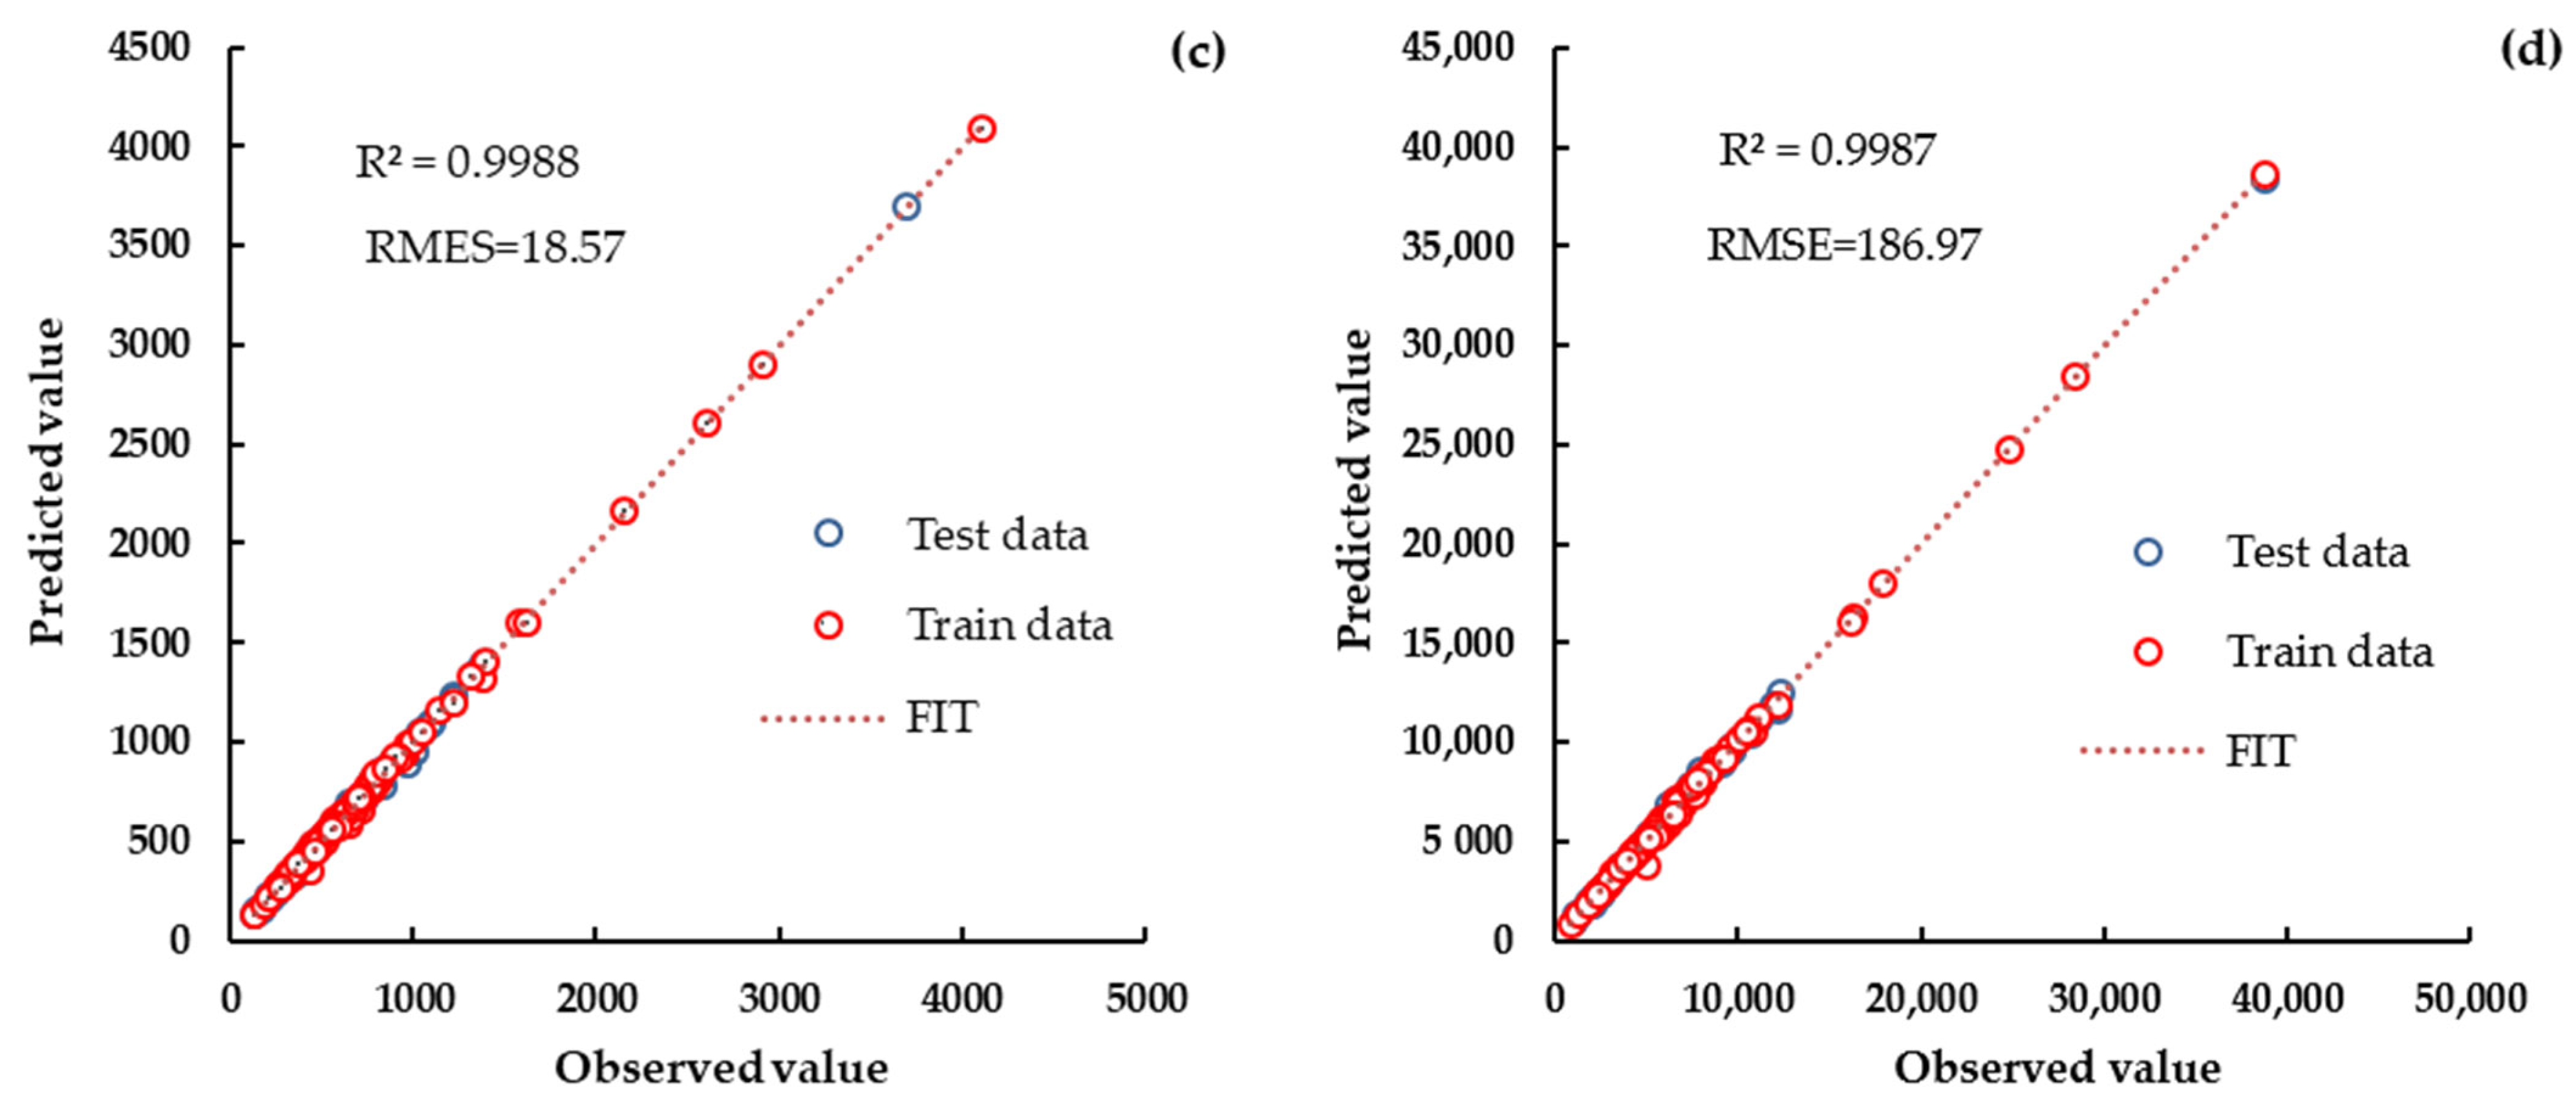
3.2. Evaluating of ANFIS-FCM and ANN Models
4. Discussion
5. Conclusions
Author Contributions
Funding
Institutional Review Board Statement
Informed Consent Statement
Data Availability Statement
Acknowledgments
Conflicts of Interest
Nomenclature
| ANNs | Artificial neural networks | m3 | Cubic meter |
| ANFIS | Adaptive neuro-fuzzy inference system | m2 | Square meter |
| AI | Artificial intelligence | mg | Milligram |
| C | Carbon | mPt | Milli point |
| CV | Cross-validation | MJ | Mega joule |
| CCI | Climate change indicator | MT | Metric ton |
| Cu | Copper | ML | Machine learning |
| Cr | Chromium | MAPE | Mean absolute percentage error |
| Cd | Cadmium | MFs | Membership functions |
| C6H6 | Benzene | NC | Number of clusters |
| CO2 | Carbon dioxide | NO−3 | Nitrate |
| CO | Carbon monoxide | NH3 | Ammonia |
| CH4 | Methane | N2O | Dinitrogen monoxide |
| CF | Carbon footprint | NOX | Nitrogen oxides |
| DALY | Disability-adjusted life years | Ni | Nickel |
| EIA | Environmental impact assessment | NMVOC | Non-methane volatile organic compound |
| eq | Equivalents | PAH | Polycyclic hydrocarbons |
| FCM | Fuzzy C-means clustering algorithm | Pb | Lead |
| FIS | Fuzzy inference systems | P | Phosphorus |
| FU | Functional unit | PO4−3 | Phosphate |
| F-S | Fallow–Soybean | Potentially Disappeared Fraction | |
| GHG | Greenhouse gases | PGPR | Plant-growth-promoting rhizobacteria |
| GW | Global warming | PGPF | Plant-growth-promoting fungi |
| GWP | Global warming potential | R2 | Determination coefficient |
| g | Gram | R-S | Rapeseed–Soybean |
| ha | Hectare | RMSE | Root means square error |
| HC | Hydrocarbons | SO2 | Sulfur dioxide |
| Hg | Mercury | Se | Selenium |
| IPCC | Intergovernmental Panel on Climate Change | TCP | Technical Cooperation Project |
| ISO | International Organization for Standardization | TJ | Terajoule |
| kWh | Kilowatt-hour | W-S | Wheat–Soybean |
| kg | Kilogram | yr | Year |
| LCA | Life-cycle assessment | Zn | Zinc |
| LCI | Life-cycle inventory | μm | Micrometer |
| LCIA | Life-cycle impact assessment | Potentially Disappeared Fraction of Species |
References
- Samadi, S.H.; Ghobadian, B.; Nosrati, M. Prediction of Higher Heating Value of Biomass Materials Based on Proximate Analysis Using Gradient Boosted Regression Trees Method. Energy Sources Part A Recovery Util. Environ. Eff. 2021, 43, 672–681. [Google Scholar] [CrossRef]
- Nabavi-Pelesaraei, A.; Rafiee, S.; Mohtasebi, S.S.; Hosseinzadeh-Bandbafha, H.; Chau, K. Integration of Artificial Intelligence Methods and Life Cycle Assessment to Predict Energy Output and Environmental Impacts of Paddy Production. Sci. Total Environ. 2018, 631–632, 1279–1294. [Google Scholar] [CrossRef] [PubMed]
- Kaab, A.; Sharifi, M.; Mobli, H.; Nabavi-Pelesaraei, A.; Chau, K. Combined Life Cycle Assessment and Artificial Intelligence for Prediction of Output Energy and Environmental Impacts of Sugarcane Production. Sci. Total Environ. 2019, 664, 1005–1019. [Google Scholar] [CrossRef] [PubMed]
- Safa, M.; Samarasinghe, S. Determination and Modelling of Energy Consumption in Wheat Production Using Neural Networks: “A Case Study in Canterbury Province, New Zealand”. Energy 2011, 36, 5140–5147. [Google Scholar] [CrossRef]
- Muller, A.; Jawtusch, J.; Gattinger, A. Mitigating Greenhouse Gases in Agriculture; Diakonisches Werk der EKD e.V. for Brot für die Welt: Stuttgart, Germany, 2011; pp. 1–88. [Google Scholar]
- IPCC Summary for Policymakers. In Climate Change and Land: An IPCC Special Report on Climate Change, Desertification, Land Degradation, Sustainable Land Management, Food Security, and Greenhouse Gas Fluxes in Terrestrial Ecosystems; Intergovernmental Panel on Climate Change (IPCC): Geneva, Switzerland, 2019; Available online: https://www.ipcc.ch/srccl/chapter/summary-for-policymakers/ (accessed on 17 August 2020).
- Mansouri Daneshvar, M.R.; Ebrahimi, M.; Nejadsoleymani, H. An Overview of Climate Change in Iran: Facts and Statistics. Environ. Syst. Res. 2019, 8, 7. [Google Scholar] [CrossRef]
- Karimi, V.; Karami, E.; Keshavarz, M. Climate Change and Agriculture: Impacts and Adaptive Responses in Iran. J. Integr. Agric. 2018, 17, 1–15. [Google Scholar] [CrossRef]
- Hu, A.H.; Chen, C.-H.; Huang, L.H.; Chung, M.-H.; Lan, Y.-C.; Chen, Z. Environmental Impact and Carbon Footprint Assessment of Taiwanese Agricultural Products: A Case Study on Taiwanese Dongshan Tea. Energies 2019, 12, 138. [Google Scholar] [CrossRef]
- Čuček, L.; Klemeš, J.J.; Kravanja, Z. A Review of Footprint Analysis Tools for Monitoring Impacts on Sustainability. J. Clean. Prod. 2012, 34, 9–20. [Google Scholar] [CrossRef]
- Chomkhamsri, K.; Wolf, M.A.; Pant, R. International Reference Life Cycle Data System (ILCD) Handbook: Review Schemes for Life Cycle Assessment. In Towards Life Cycle Sustainability Management; Finkbeiner, M., Ed.; Springer: Dordrecht, The Netherlands, 2011; pp. 107–117. [Google Scholar]
- Nemecek, T.; Dubois, D.; Huguenin-Elie, O.; Gaillard, G. Life Cycle Assessment of Swiss Farming Systems: I. Integrated and Organic Farming. Agric. Syst. 2011, 104, 217–232. [Google Scholar] [CrossRef]
- ISO 14040I; Environmental Management-Life Cycle Assessment-Principles and Framework. International Organisation for Standardisation (ISO): Geneva, Switzerland, 2006.
- Brentrup, F.; Küsters, J.; Kuhlmann, H.; Lammel, J. Environmental Impact Assessment of Agricultural Production Systems Using the Life Cycle Assessment Methodology: I. Theoretical Concept of a LCA Method Tailored to Crop Production. Eur. J. Agron. 2004, 20, 247–264. [Google Scholar] [CrossRef]
- Bjørn, A.; Owsianiak, M.; Molin, C.; Laurent, A. Main Characteristics of LCA. In Life Cycle Assessment; Hauschild, M.Z., Rosenbaum, R.K., Olsen, S.I., Eds.; Springer: Cham, Switzerland, 2018; pp. 9–16. [Google Scholar]
- Elhami, B.; Khanali, M.; Akram, A. Combined Application of Artificial Neural Networks and Life Cycle Assessment in Lentil Farming in Iran. Inf. Process. Agric. 2017, 4, 18–32. [Google Scholar] [CrossRef]
- Mousavi-Avval, S.H.; Rafiee, S.; Sharifi, M.; Hosseinpour, S.; Shah, A. Combined Application of Life Cycle Assessment and Adaptive Neuro-Fuzzy Inference System for Modeling Energy and Environmental Emissions of Oilseed Production. Renew. Sustain. Energy Rev. 2017, 78, 807–820. [Google Scholar] [CrossRef]
- Romeiko, X.X.; Guo, Z.; Pang, Y.; Lee, E.K.; Zhang, X. Comparing Machine Learning Approaches for Predicting Spatially Explicit Life Cycle Global Warming and Eutrophication Impacts from Corn Production. Sustainability 2020, 12, 1481. [Google Scholar] [CrossRef]
- Satari Yuzbashkandi, S.; Khalilian, S. On Projecting Climate Change Impacts on Soybean Yield in Iran: An Econometric Approach. Environ. Process. 2020, 7, 73–87. [Google Scholar] [CrossRef]
- Iran Ministry of Agriculture. Annual Agricultural Statistics; Ministry of Agriculture Planning and Economic Deputy: Tehran, Iran, 2019; Volume 1, Available online: https://dpe.maj.ir/ (accessed on 10 March 2020).
- Financial Tribune Iran. FAO to Kick-Start Joint Soybean Program. 2017. Available online: https://financialtribune.com/articles/economy-domestic-economy/66734/iran-fao-to-kick-start-joint-soybean-program (accessed on 18 June 2020).
- FAO. FAO Assists Iran to Boost Oils Seed Production and Reach Self-Sufficiency. 2017. Available online: http://www.fao.org/neareast/news/view/en/c/896554/ (accessed on 14 June 2020).
- Yousefi, H.; Noorollahi, Y.; Peirow, S. Status of Environmental Impact Assessment. Environ. Policy Law 2015, 45, 320–325. [Google Scholar] [CrossRef]
- Khosravi, F.; Jha-Thakur, U.; Fischer, T.B. Evaluation of the Environmental Impact Assessment System in Iran. Environ. Impact Assess. Rev. 2019, 74, 63–72. [Google Scholar] [CrossRef]
- ISO 14044; Environmental Management-Life Cycle Assessment-Requirements and Guidelines. International Organisation for Standardisation (ISO): Geneva, Switzerland, 2006.
- Ntiamoah, A.; Afrane, G. Environmental Impacts of Cocoa Production and Processing in Ghana: Life Cycle Assessment Approach. J. Clean. Prod. 2008, 16, 1735–1740. [Google Scholar] [CrossRef]
- Durlinger, B.; Koukouna, E.; Broekema, R.; van Paassen, M.; Scholten, J. Agri-Footprint 3.0; Blonk Consultants: Gouda, The Netherlands, 2017. [Google Scholar]
- IPCC. 2006 IPCC Guidelines for National Greenhouse Gas Inventories; Eggleston, H.S., Buendia, L., Miwa, K., Ngara, T., Tanabe, K., Eds.; Institute for Global Environmental Strategies (IGES): Hayama, Japan, 2006; Available online: http://www.ipcc-nggip.iges.or.jp/public/2006gl/index.htm (accessed on 20 March 2020).
- Nemecek, T.; Kagi, T. Life Cycle Inventories of Agricultural Production Systems. Final Report Ecoinvent V2.0 No. 15a; Agroscope Reckenholz-Taenikon Research Station ART, Swiss Centre for Life Cycle Inventories: Zurich, Switzerland, 2007; Volume 15. [Google Scholar]
- Khoshnevisan, B.; Rajaeifar, M.A.; Clark, S.; Shamahirband, S.; Anuar, N.B.; Mohd Shuib, N.L.; Gani, A. Evaluation of Traditional and Consolidated Rice Farms in Guilan Province, Iran, Using Life Cycle Assessment and Fuzzy Modeling. Sci. Total Environ. 2014, 481, 242–251. [Google Scholar] [CrossRef]
- Engineering ToolBox Combustion of Fuels and Nitrogen Oxides (NOx) Emission. 2009. Available online: https://www.engineeringtoolbox.com/nox-emission-combustion-fuels-d_1086.html (accessed on 17 November 2020).
- Majumdar, D.; Gajghate, D.G. Sectoral CO2, CH4, N2O and SO2 Emissions from Fossil Fuel Consumption in Nagpur City of Central India. Atmos. Environ. 2011, 45, 4170–4179. [Google Scholar] [CrossRef]
- Ramachandra, T.V. Shwetmala Decentralised Carbon Footprint Analysis for Opting Climate Change Mitigation Strategies in India. Renew. Sustain. Energy Rev. 2012, 16, 5820–5833. [Google Scholar] [CrossRef]
- Cochran, W.G. Sampling Techniques, 3rd ed.; John Wiley and Sons: New York, NY, USA, 1977; ISBN 0-471-16240-X. [Google Scholar]
- Humbert, S. Geographically Differentiated Life-Cycle Impact Assessment of Human Health. Ph.D. Thesis, University of California, Berkeley, CA, USA, 2009. [Google Scholar]
- Jungbluth, N. Description of Life Cycle Impact Assessment Methods; ESU-Services Ltd.: Schaffhausen, Switzerland, 2020; Available online: http://esu-services.ch/address/tender/ (accessed on 15 June 2020).
- Hauschild, M.Z.; Huijbregts, M.A.J. Life Cycle Impact Assessment; LCA Compendium—The Complete World of Life Cycle Assessment, Illustrate; Hauschild, M.Z., Huijbregts, M.A.J., Eds.; Springer: Dordrecht, The Netherlands, 2015; ISBN 978-94-017-9743-6. [Google Scholar]
- Humbert, S.; De Schryver, A.; Bengoa, X.; Margni, M.; Jolliet, O. IMPACT 2002+: User Guide, Draft for Version Q2.21; Quantis—Bibliothèque Cantonale et Universitaire: Lausanne, Switzerland, 2014; Volume 21. [Google Scholar] [CrossRef]
- Jang, J.-S.R. ANFIS: Adaptive-Network-Based Fuzzy Inference System. IEEE Trans. Syst. Man Cybern. 1993, 23, 665–685. [Google Scholar] [CrossRef]
- Agatonovic-Kustrin, S.; Beresford, R. Basic Concepts of Artificial Neural Network (ANN) Modeling and Its Application in Pharmaceutical Research. J. Pharm. Biomed. Anal. 2000, 22, 717–727. [Google Scholar] [CrossRef] [PubMed]
- Sajid, Z.; Khan, F.; Zhang, Y. Process Simulation and Life Cycle Analysis of Biodiesel Production. Renew. Energy 2016, 85, 945–952. [Google Scholar] [CrossRef]
- Brentrup, F.; Küsters, J.; Lammel, J.; Barraclough, P.; Kuhlmann, H. Environmental Impact Assessment of Agricultural Production Systems Using the Life Cycle Assessment (LCA) Methodology II: The Application to N Fertilizer Use in Winter Wheat Production Systems. Eur. J. Agron. 2004, 20, 265–279. [Google Scholar] [CrossRef]
- Jaiswal, B.; Agrawal, M. Carbon Footprints of Agriculture Sector. In Carbon Footprints; Springer: Singapore, 2020; pp. 81–99. ISBN 978-981-13-7915-4. [Google Scholar]
- Signor, D.; Cerri, C.E.P. Nitrous Oxide Emissions in Agricultural Soils: A Review. Pesqui. Agropecuária Trop. 2013, 43, 322–338. [Google Scholar] [CrossRef]
- Dekamin, M.; Barmaki, M.; Kanooni, A.; Mosavi Meshkini, S.R. Cradle to Farm Gate Life Cycle Assessment of Oilseed Crops Production in Iran. Eng. Agric. Environ. Food 2018, 11, 178–185. [Google Scholar] [CrossRef]
- Lee, K.S.; Choe, Y.C. Environmental Performance of Organic Farming: Evidence from Korean Small-Holder Soybean Production. J. Clean. Prod. 2019, 211, 742–748. [Google Scholar] [CrossRef]
- Moeller, D.; Sieverding, H.L.; Stone, J.J. Comparative Farm-Gate Life Cycle Assessment of Oilseed Feedstocks in the Northern Great Plains. BioPhys. Econ. Resour. Qual. 2017, 2, 13. [Google Scholar] [CrossRef]
- Romeiko, X.X.; Lee, E.K.; Sorunmu, Y.; Zhang, X. Spatially and Temporally Explicit Life Cycle Environmental Impacts of Soybean Production in the U.S. Midwest. Environ. Sci. Technol. 2020, 54, 4758–4768. [Google Scholar] [CrossRef]
- Zortea, R.B.; Maciel, V.G.; Passuello, A. Sustainability Assessment of Soybean Production in Southern Brazil: A Life Cycle Approach. Sustain. Prod. Consum. 2018, 13, 102–112. [Google Scholar] [CrossRef]
- Raucci, G.S.; Moreira, C.S.; Alves, P.A.; Mello, F.F.C.; Frazão, L.D.A.; Cerri, C.E.P.; Cerri, C.C. Greenhouse Gas Assessment of Brazilian Soybean Production: A Case Study of Mato Grosso State. J. Clean. Prod. 2015, 96, 418–425. [Google Scholar] [CrossRef]
- Knudsen, M.T.; Yu-Hui, Q.; Yan, L.; Halberg, N. Environmental Assessment of Organic Soybean (Glycine Max.) Imported from China to Denmark: A Case Study. J. Clean. Prod. 2010, 18, 1431–1439. [Google Scholar] [CrossRef]
- Nikkhah, A.; Khojastehpour, M.; Emadi, B.; Taheri-Rad, A.; Khorramdel, S. Environmental Impacts of Peanut Production System Using Life Cycle Assessment Methodology. J. Clean. Prod. 2015, 92, 84–90. [Google Scholar] [CrossRef]
- Khanali, M.; Mousavi, S.A.; Sharifi, M.; Keyhani Nasab, F.; Chau, K. Life Cycle Assessment of Canola Edible Oil Production in Iran: A Case Study in Isfahan Province. J. Clean. Prod. 2018, 196, 714–725. [Google Scholar] [CrossRef]
- Matsuura, M.I.S.F.; Dias, F.R.T.; Picoli, J.F.; Lucas, K.R.G.; de Castro, C.; Hirakuri, M.H. Life-Cycle Assessment of the Soybean-Sunflower Production System in the Brazilian Cerrado. Int. J. Life Cycle Assess. 2017, 22, 492–501. [Google Scholar] [CrossRef]
- Ali, H.; Khan, E.; Ilahi, I. Environmental Chemistry and Ecotoxicology of Hazardous Heavy Metals: Environmental Persistence, Toxicity, and Bioaccumulation. J. Chem. 2019, 2019, 6730305. [Google Scholar] [CrossRef]
- Gupta, D.K.; Chatterjee, S.; Datta, S.; Veer, V.; Walther, C. Role of Phosphate Fertilizers in Heavy Metal Uptake and Detoxification of Toxic Metals. Chemosphere 2014, 108, 134–144. [Google Scholar] [CrossRef]
- Ohtake, H.; Tsuneda, S. Phosphorus Recovery and Recycling; Springer: Singapore, 2019; ISBN 978-981-10-8030-2. [Google Scholar]
- Verma, J.P.; Yadav, J.; Tiwari, K.N.; Kumar, A. Effect of Indigenous Mesorhizobium spp. and Plant Growth Promoting Rhizobacteria on Yields and Nutrients Uptake of Chickpea (Cicer arietinum L.) under Sustainable Agriculture. Ecol. Eng. 2013, 51, 282–286. [Google Scholar] [CrossRef]
- Mahdi, S.S.; Hassan, G.I.; Samoon, S.A.; Rather, H.A.; Dar, S.A.; Zehra, B. Bio-Fertilizers in Organic Agriculture. J. Phytol. 2010, 2, 42–54. [Google Scholar]
- Meza-Palacios, R.; Aguilar-Lasserre, A.A.; Morales-Mendoza, L.F.; Pérez-Gallardo, J.R.; Rico-Contreras, J.O.; Avarado-Lassman, A. Life Cycle Assessment of Cane Sugar Production: The Environmental Contribution to Human Health, Climate Change, Ecosystem Quality and Resources in México. J. Environ. Sci. Health Part A 2019, 54, 668–678. [Google Scholar] [CrossRef]
- Mousavi-Avval, S.H.; Rafiee, S.; Sharifi, M.; Hosseinpour, S.; Notarnicola, B.; Tassielli, G.; Renzulli, P.A.; Khanali, M. Use of LCA Indicators to Assess Iranian Rapeseed Production Systems with Different Residue Management Practices. Ecol. Indic. 2017, 80, 31–39. [Google Scholar] [CrossRef]
- Rawat, A.K.; Tripathi, U.K. Advances in Agronomy; Rawat, D.A.K., Ed.; AkiNik Publications: Delhi, India, 2019; Volume 7, ISBN 9789353357207. [Google Scholar]
- Zulfiqar, U.; Ahmad, M.; Valipour, M.; Ishfaq, M.; Maqsood, M.F.; Iqbal, R.; Ali, M.F.; Roy, R.; El Sabagh, A. Evaluating Optimum Limited Irrigation and Integrated Nutrient Management Strategies for Wheat Growth, Yield and Quality. Hydrology 2023, 10, 56. [Google Scholar] [CrossRef]


| Characteristic | Coefficient | Emission Result |
|---|---|---|
| A. Emissions of fertilizers | ||
| 0.01 | To air | |
| 0.2 | To air | |
| 0.1 | To air | |
| 0.3 | To water | |
| 0.05 | To water | |
| Indirect N2O from atmospheric deposition: | ||
| 0.001 | To air | |
| Direct NOX emissions from fertilizers and soil: | ||
| 0.21 | To air | |
| Conversion of emissions: | ||
| Conversion from kg CO2-C to kg CO2 | ||
| Conversion from kg N2O-N to kg N2O | ||
| Conversion from kg NH3-N to kg NH3 | ||
| Conversion from kg NO−3-N to kg NO−3 | ||
| Conversion from kg P2O5 to kg P | ||
| B. Emissions from biocides | ||
| 0.09 | To air | |
| 0.01 | To water | |
| 0.90 | To soil |
| Characteristic | Heavy Metal (mg) | ||||||
|---|---|---|---|---|---|---|---|
| Cd | Cu | Zn | Pb | Ni | Cr | Hg | |
| 6.0 | 26.0 | 203.0 | 54.9 | 20.9 | 77.9 | 0.1 | |
| 39.5 | 90.5 | 839.0 | 67.0 | 88.3 | 543.0 | 0.3 | |
| 0.1 | 4.8 | 6.2 | 0.8 | 2.5 | 5.8 | 0.0 | |
| Emission | g MJ−1 Diesel | Kerosene |
|---|---|---|
| CO2 | 74.5 | 71.50 t TJ−1 |
| SO2 | 2.41 × 10⁻² | 0.005 MT MT−1 |
| Pb | - | - |
| CH4 | 3.08 × 10⁻³ | 10 kg TJ−1 |
| C6H6 | 1.74 × 10⁻⁴ | - |
| Cd | 2.39 × 10⁻⁷ | - |
| Cr | 1.19 × 10⁻⁶ | - |
| Cu | 4.06 × 10⁻⁵ | - |
| N2O | 2.86 × 10⁻³ | 0.6 kg TJ−1 |
| Ni | 1.67 × 10⁻⁶ | - |
| Zn | 2.39 × 10⁻⁵ | - |
| Benzo(a)pyrene | 7.16 × 10⁻⁷ | - |
| NH3 | 4.77 × 10⁻⁴ | - |
| Se | 2.39 × 10⁻⁷ | - |
| PAH | 7.85 × 10⁻⁵ | - |
| HC, as NMVOC | 6.80 × 10⁻² | - |
| NOX | 1.06 | 3.00 g kg−1 |
| CO | 1.50 × 10⁻¹ | 62.00 g kg−1 |
| Particulates, <2.5 μm | 1.07 × 10⁻¹ | - |
| Inventory | Fallow–Soybean | Rapeseed–Soybean | Wheat–Soybean | |
|---|---|---|---|---|
| A. Inputs (Off-Farm) | Unit | |||
| 1. Seed | kg | 25.68 | 31.51 | 32.37 |
| 2. Agricultural machinery | kg | 4.61 | 3.18 | 4.31 |
| 3. Fossil fuels | kg | |||
| (a) Diesel | 71.66 | 39.04 | 79.67 | |
| (b) Lubricant | 1.35 | 1.09 | 1.87 | |
| (c) Kerosene | - | 10.53 | 10.50 | |
| 4. Electricity | kWh | 27.5 | 25.84 | 11.44 |
| 5. Biocides: | kg | |||
| (a) Insecticide | ||||
| Indoxacarb | 0.04 | 0.03 | 0.02 | |
| Diazinon | 0.38 | 0.34 | - | |
| Chlorpyrifos | - | 0.08 | 0.09 | |
| Cypermethrin | 0.24 | 0.19 | 0.13 | |
| Thiodicarb | - | 0.38 | 0.05 | |
| Profenofos | - | - | 0.31 | |
| Fenitrothion | - | 0.19 | - | |
| (b) Herbicide | ||||
| Imazethapyr | - | 0.04 | - | |
| Haloxyfop-ethoxyethyl | - | 0.19 | - | |
| Trifluralin | - | - | 0.14 | |
| Bentazone sodium | 0.12 | - | - | |
| Paraquat | - | - | 0.07 | |
| 6. Polyethylene | kg | 0.84 | 0.36 | 0.07 |
| 7. Chemical fertilizers | kg | |||
| (a) Nitrogen fertilizer | ||||
| Urea (N: 46-P2O5: 0-K2O: 0-S: 0) | 50.25 | 25.03 | 39.37 | |
| Ammonium sulfate (21-0-0-24) | - | 3.75 | - | |
| (b) Phosphate fertilizer | ||||
| Diammonium phosphate (18-46-0) | 18.87 | 6.45 | 18.89 | |
| Single superphosphate (0-16-0-12) | 31.73 | - | - | |
| Superphosphate triple (0-46-0) | - | 16.66 | 29.47 | |
| (c) Potassium fertilizer | ||||
| Potassium sulfate (0-0-52-18) | - | 2.08 | 4.31 | |
| (d) Sulfur fertilizer | ||||
| Bentonite sulfur 70% (0-0-0-70-30) | - | 5.55 | 13.83 | |
| Granular sulfur 90% (0-0-0-90-0) | 5.86 | 4.84 | 3.12 | |
| B. Output | ||||
| Soybean yield | kg ha−1 | 2950.00 | 2853.33 | 2308.32 |
| C. On-Farm | ||||
| 1. Emissions in air: | ||||
| a. Emissions from chemical fertilizers | (kg) | |||
| 1. NH3 emitted from nitrogenous fertilizers | 3.22 | 1.63 | 2.61 | |
| 2. N2O | ||||
| N2O emitted from fertilizer | 4.17 × 10⁻¹ | 2.12 × 10⁻¹ | 3.38 × 10⁻¹ | |
| N2O released from atmospheric deposition of fertilizers | 4.17 × 10⁻² | 2.12 × 10⁻² | 3.38 × 10⁻² | |
| 3. NOX emitted from N2O of fertilizers and soil | 9.62 × 10⁻² | 4.89 × 10⁻² | 7.81 × 10⁻² | |
| 4. CO2 released from urea | 3.69 × 10+1 | 1.84 × 10+1 | 2.89 × 10+1 | |
| b. Emissions from biocides | (kg) | |||
| 1. Emissions from insecticide | ||||
| Indoxacarb | 5.00 × 10⁻⁴ | 4.00 × 10⁻⁴ | 3.00 × 10⁻⁴ | |
| Diazinon | 2.03 × 10⁻² | 1.83 × 10⁻² | - | |
| Chlorpyrifos | - | 3.10 × 10⁻³ | 3.40 × 10⁻³ | |
| Cypermethrin | 8.50 × 10⁻³ | 7.00 × 10⁻³ | 4.50 × 10⁻³ | |
| Thiodicarb | - | 2.71 × 10⁻² | 3.50 × 10⁻³ | |
| Profenofos | - | - | 1.27 × 10⁻² | |
| Fenitrothion | - | 8.50 × 10⁻³ | - | |
| 2. Emissions from herbicide | - | |||
| Imazethapyr | - | 4.00 × 10⁻⁴ | - | |
| Haloxyfop-ethoxyethyl | - | 1.80 × 10⁻³ | - | |
| Trifluralin | - | - | 5.90 × 10⁻³ | |
| Bentazone | 5.00 × 10⁻³ | - | - | |
| Paraquat | - | - | 1.30 × 10⁻³ | |
| c. Emissions from fossil fuels | (kg) | |||
| 1. Diesel | ||||
| CO2 | 3.58 × 10+2 | 1.95 × 10+2 | 3.98 × 10+2 | |
| SO2 | 1.16 × 10⁻¹ | 6.31 × 10⁻² | 1.29 × 10⁻¹ | |
| CH4 | 1.48 × 10⁻² | 8.06 × 10⁻³ | 1.64 × 10⁻² | |
| C6H6 | 8.36 × 10⁻⁴ | 4.55 × 10⁻⁴ | 9.29 × 10⁻⁴ | |
| Cd | 1.15 × 10⁻⁶ | 6.26 × 10⁻⁷ | 1.28 × 10⁻⁶ | |
| Cr | 5.72 × 10⁻⁶ | 3.11 × 10⁻⁶ | 6.36 × 10⁻⁶ | |
| Cu | 1.95 × 10⁻⁴ | 1.06 × 10⁻⁴ | 2.17 × 10⁻⁴ | |
| N2O | 1.37 × 10⁻² | 7.49 × 10⁻³ | 1.53 × 10⁻² | |
| Ni | 8.02 × 10⁻⁶ | 4.37 × 10⁻⁶ | 8.92 × 10⁻⁶ | |
| Zn | 1.15 × 10⁻⁴ | 6.26 × 10⁻⁵ | 1.28 × 10⁻⁴ | |
| Benzo(a)pyrene | 3.44 × 10⁻⁶ | 1.87 × 10⁻⁶ | 3.82 × 10⁻⁶ | |
| NH3 | 2.29 × 10⁻³ | 1.25 × 10⁻³ | 2.55 × 10⁻³ | |
| Se | 1.15 × 10⁻⁶ | 6.26 × 10⁻⁷ | 1.28 × 10⁻⁶ | |
| PAH | 3.77 × 10⁻⁴ | 2.05 × 10⁻⁴ | 4.19 × 10⁻⁴ | |
| HC, as NMVOC | 3.27 × 10⁻¹ | 1.78 × 10⁻¹ | 3.63 × 10⁻¹ | |
| NOX | 5.09 | 2.77 | 5.66 | |
| CO | 7.21 × 10⁻¹ | 3.93 × 10⁻¹ | 8.01 × 10⁻¹ | |
| Particulates, <2.5 μm | 5.14 × 10⁻¹ | 2.80 × 10⁻¹ | 5.71 × 10⁻¹ | |
| 2. Kerosene | (kg) | |||
| CO2 | - | 3.39 × 10+1 | 3.38 × 10+1 | |
| CO | - | 6.53 × 10⁻¹ | 6.51 × 10⁻¹ | |
| SO2 | - | 5.27 × 10⁻² | 5.25 × 10⁻² | |
| CH4 | - | 4.74 × 10⁻³ | 4.73 × 10⁻³ | |
| N2O | - | 2.84 × 10⁻⁴ | 2.84 × 10⁻⁴ | |
| NOX | - | 3.16 × 10⁻² | 3.15 × 10⁻² | |
| 2. Emissions in water: | ||||
| a. Emissions from chemical fertilizers | (kg) | |||
| NO−3 | 3.52 × 10+1 | 1.79 × 10+1 | 2.86 × 10+1 | |
| P | 3.00 × 10⁻¹ | 2.32 × 10⁻¹ | 4.86 × 10⁻¹ | |
| b. Emissions from biocides | (kg) | |||
| 1. Emissions from insecticide | ||||
| Indoxacarb | 1.00 × 10⁻⁴ | 5.00 × 10⁻⁵ | 3.00 × 10⁻⁵ | |
| Diazinon | 2.30 × 10⁻³ | 2.03 × 10⁻³ | - | |
| Chlorpyrifos | - | 3.40 × 10⁻⁴ | 3.70 × 10⁻⁴ | |
| Cypermethrin | 9.00 × 10⁻⁴ | 7.80 × 10⁻⁴ | 5.00 × 10⁻⁴ | |
| Thiodicarb | - | 3.01 × 10⁻³ | 3.90 × 10⁻⁴ | |
| Profenofos | - | - | 1.41 × 10⁻³ | |
| Fenitrothion | - | 9.40 × 10⁻⁴ | - | |
| 2. Emissions from herbicide | ||||
| Imazethapyr | - | 4.00 × 10⁻⁵ | - | |
| Haloxyfop-ethoxyethyl | - | 2.00 × 10⁻⁴ | - | |
| Trifluralin | - | - | 6.60 × 10⁻⁴ | |
| Bentazone | 6.00 × 10⁻⁴ | - | - | |
| Paraquat | - | - | 1.50 × 10⁻⁴ | |
| 3. Emissions in soil: | ||||
| a. Emissions from chemical fertilizers | (mg) | |||
| 1. From N-fertilizer: | ||||
| Cd | 1.59 × 10+2 | 8.08 × 10+1 | 1.29 × 10+2 | |
| Cu | 6.89 × 10+2 | 3.50 × 10+2 | 5.59 × 10+2 | |
| Zn | 5.38 × 10+3 | 2.73 × 10+3 | 4.37 × 10+3 | |
| Pb | 1.46 × 10+3 | 7.39 × 10+2 | 1.18 × 10+3 | |
| Ni | 5.54 × 10+2 | 2.81 × 10+2 | 4.50 × 10+2 | |
| Cr | 2.07 × 10+3 | 1.05 × 10+3 | 1.68 × 10+3 | |
| Hg | 2.65 | 1.35 | 2.15 | |
| 2. From P-fertilizer: | ||||
| Cd | 5.44 × 10+2 | 4.20 × 10+2 | 8.78 × 10+2 | |
| Cu | 1.25 × 10+3 | 9.62 × 10+2 | 2.01 × 10+3 | |
| Zn | 1.15 × 10+4 | 8.92 × 10+3 | 1.87 × 10+4 | |
| Pb | 9.22 × 10+2 | 7.12 × 10+2 | 1.49 × 10+3 | |
| Ni | 1.22 × 10+3 | 9.39 × 10+2 | 1.96 × 10+3 | |
| Cr | 7.47 × 10+3 | 5.77 × 10+3 | 1.21 × 10+4 | |
| Hg | 4.13 | 3.19 | 6.67 | |
| 3. From K-fertilizer: | ||||
| Cd | - | 1.08 × 10⁻¹ | 2.24 × 10⁻¹ | |
| Cu | - | 5.18 | 1.08 × 10+1 | |
| Zn | - | 6.70 | 1.39 × 10+1 | |
| Pb | - | 8.64 × 10⁻¹ | 1.79 | |
| Ni | - | 2.70 | 5.60 | |
| Cr | - | 6.26 | 1.30 × 10+1 | |
| b. Emissions from biocides | (kg) | |||
| 1. Emissions from insecticide | ||||
| Indoxacarb | 5.40 × 10⁻³ | 4.30 × 10⁻³ | 2.90 × 10⁻³ | |
| Diazinon | 2.03 × 10⁻¹ | 1.83 × 10⁻¹ | - | |
| Chlorpyrifos | - | 3.08 × 10⁻² | 3.35 × 10⁻² | |
| Cypermethrin | 8.46 × 10⁻² | 6.98 × 10⁻² | 4.50 × 10⁻² | |
| Thiodicarb | - | 2.71 × 10⁻¹ | 3.51 × 10⁻² | |
| Profenofos | - | - | 1.27 × 10⁻¹ | |
| Fenitrothion | - | 8.46 × 10⁻² | - | |
| 2. Emissions from herbicide | ||||
| Imazethapyr | - | 3.80 × 10⁻³ | - | |
| Haloxyfop-ethoxyethyl | - | 1.83 × 10⁻² | - | |
| Trifluralin | - | - | 5.94 × 10⁻² | |
| Bentazone | 4.97 × 10⁻² | - | - | |
| Paraquat | - | - | 1.33 × 10⁻² | |
| Scenarios | Human Health (DALY) | Ecosystem Quality (PDF × m2 × yr) | Climate Change (kg CO2-eq) | Resources (MJ Primary) |
|---|---|---|---|---|
| Fallow–Soybean (F-S) | 0.0015 | 1410.73 | 794.50 | 7669.47 |
| Rapeseed–Soybean (R-S) | 0.0009 | 1033.68 | 563.55 | 5476.18 |
| Wheat–Soybean (W-S) | 0.0016 | 1840.70 | 880.61 | 8799.80 |
| Environmental Impacts | Model Name | Number of Clusters | Number of Input MF | Number of Output MF | Number of Rule | Epochs | RMSE | R | ||||
|---|---|---|---|---|---|---|---|---|---|---|---|---|
| Training | Testing | All Data | Training | Testing | All Data | |||||||
| Human health (DALY) | FCM2 | 2 | [222] | [2] | 2 | 5 | 4.43 × 10⁻⁵ | 5.35 × 10⁻⁵ | 5.70 × 10⁻⁵ | 0.9983 | 0.9996 | 0.9985 |
| FCM3 | 3 | [333] | [3] | 3 | 2 | 5.17 × 10⁻⁵ | 6.26 × 10⁻⁴ | 3.47 × 10⁻⁴ | 0.9986 | 0.7765 | 0.9369 | |
| FCM4 | 4 | [444] | [4] | 4 | 2 | 4.20 × 10⁻⁵ | 6.34 × 10⁻⁴ | 3.51 × 10⁻⁴ | 0.9991 | 0.7680 | 0.9353 | |
| FCM5 | 5 | [555] | [5] | 5 | 15 | 4.77 × 10⁻⁵ | 6.26 × 10⁻⁴ | 3.47 × 10⁻⁴ | 0.9988 | 0.7706 | 0.9365 | |
| FCM6 | 6 | [666] | [6] | 6 | 15 | 4.96 × 10⁻⁵ | 2.23 × 10⁻³ | 1.27 × 10⁻³ | 0.9987 | 0.6035 | 0.6807 | |
| FCM7 | 7 | [777] | [7] | 7 | 2 | 2.86 × 10⁻⁵ | 4.51 × 10⁻³ | 2.49 × 10⁻⁴ | 0.9996 | 0.8750 | 0.9668 | |
| Ecosystem quality (PDF × m2 × yr) | FCM2 | 2 | [222] | [2] | 2 | 15 | 35.47 | 45.70 | 38.86 | 0.9993 | 0.9997 | 0.9996 |
| FCM3 | 3 | [333] | [3] | 3 | 5 | 31.20 | 42.02 | 34.83 | 0.9994 | 0.9998 | 0.9997 | |
| FCM4 | 4 | [444] | [4] | 4 | 5 | 32.23 | 61.97 | 43.44 | 0.9994 | 0.9996 | 0.9995 | |
| FCM5 | 5 | [555] | [5] | 5 | 5 | 27.68 | 1741.04 | 958.42 | 0.9995 | 0.6118 | 0.7369 | |
| FCM6 | 6 | [666] | [6] | 6 | 2 | 20.22 | 1741.50 | 958.54 | 0.9997 | 0.6110 | 0.7367 | |
| FCM7 | 7 | [777] | [7] | 7 | 2 | 20.98 | 1776.55 | 977.83 | 0.9997 | 0.5731 | 0.7215 | |
| Climate change (kg CO2-eq) | FCM2 | 2 | [222] | [2] | 2 | 15 | 17.85 | 20.12 | 18.57 | 0.9994 | 0.9993 | 0.9994 |
| FCM3 | 3 | [333] | [3] | 3 | 2 | 15.11 | 38.43 | 24.63 | 0.9995 | 0.9987 | 0.9990 | |
| FCM4 | 4 | [444] | [4] | 4 | 20 | 12.51 | 110.58 | 61.74 | 0.9997 | 0.9861 | 0.9938 | |
| FCM5 | 5 | [555] | [5] | 5 | 2 | 10.06 | 2230.00 | 123.01 | 0.9998 | 0.9356 | 0.9731 | |
| FCM6 | 6 | [666] | [6] | 6 | 1100 | 5.88 | 523.28 | 288.01 | 0.99999 | 0.6359 | 0.8614 | |
| FCM7 | 7 | [777] | [7] | 7 | 1100 | 6.27 | 291.03 | 160.24 | 0.9999 | 0.8395 | 0.9513 | |
| Resources (MJ primary) | FCM2 | 2 | [222] | [2] | 2 | 100 | 178.50 | 205.17 | 186.98 | 0.9993 | 0.9993 | 0.9993 |
| FCM3 | 3 | [333] | [3] | 3 | 2 | 162.87 | 302.96 | 222.92 | 0.9994 | 0.9984 | 0.9990 | |
| FCM4 | 4 | [444] | [4] | 4 | 1100 | 72.67 | 902.58 | 500.40 | 0.9999 | 0.9885 | 0.9954 | |
| FCM5 | 5 | [555] | [5] | 5 | 1100 | 59.20 | 477.53 | 267.41 | 0.9999 | 0.9972 | 0.9987 | |
| FCM6 | 6 | [666] | [6] | 6 | 2 | 128.06 | 23,009.21 | 12,662.90 | 0.9996 | 0.3624 | 0.4370 | |
| FCM7 | 7 | [777] | [7] | 7 | 15 | 118.98 | 616.83 | 353.69 | 0.9997 | 0.9954 | 0.9978 | |
| Environmental Impacts | Best Topology of ANN | Epochs | R | RSME | ||||||
|---|---|---|---|---|---|---|---|---|---|---|
| Training | Validation | Testing | All Data | Training | Validation | Testing | All Data | |||
| Human health | 14-10-7-1 | 11 | 0.9984 | 0.9859 | 0.9866 | 0.9938 | 5.69 × 10⁻⁵ | 2.17 × 10⁻⁴ | 1.33 × 10⁻⁴ | 1.09 × 10⁻⁴ |
| Ecosystem quality | 14-11-6-1 | 9 | 0.9994 | 0.9854 | 0.9666 | 0.9863 | 31.97 | 504.00 | 325.66 | 234.12 |
| Climate change | 14-10-10-1 | 13 | 0.9945 | 0.9929 | 0.9879 | 0.9929 | 57.21 | 93.24 | 57.05 | 63.84 |
| Resources | 14-12-8-1 | 17 | 0.9996 | 0.9688 | 0.9977 | 0.9866 | 141.13 | 2146.36 | 500.88 | 858.51 |
Disclaimer/Publisher’s Note: The statements, opinions and data contained in all publications are solely those of the individual author(s) and contributor(s) and not of MDPI and/or the editor(s). MDPI and/or the editor(s) disclaim responsibility for any injury to people or property resulting from any ideas, methods, instructions or products referred to in the content. |
© 2023 by the authors. Licensee MDPI, Basel, Switzerland. This article is an open access article distributed under the terms and conditions of the Creative Commons Attribution (CC BY) license (https://creativecommons.org/licenses/by/4.0/).
Share and Cite
Mohammadi Kashka, F.; Tahmasebi Sarvestani, Z.; Pirdashti, H.; Motevali, A.; Nadi, M.; Valipour, M. Sustainable Systems Engineering Using Life Cycle Assessment: Application of Artificial Intelligence for Predicting Agro-Environmental Footprint. Sustainability 2023, 15, 6326. https://doi.org/10.3390/su15076326
Mohammadi Kashka F, Tahmasebi Sarvestani Z, Pirdashti H, Motevali A, Nadi M, Valipour M. Sustainable Systems Engineering Using Life Cycle Assessment: Application of Artificial Intelligence for Predicting Agro-Environmental Footprint. Sustainability. 2023; 15(7):6326. https://doi.org/10.3390/su15076326
Chicago/Turabian StyleMohammadi Kashka, Faezeh, Zeinolabedin Tahmasebi Sarvestani, Hemmatollah Pirdashti, Ali Motevali, Mehdi Nadi, and Mohammad Valipour. 2023. "Sustainable Systems Engineering Using Life Cycle Assessment: Application of Artificial Intelligence for Predicting Agro-Environmental Footprint" Sustainability 15, no. 7: 6326. https://doi.org/10.3390/su15076326
APA StyleMohammadi Kashka, F., Tahmasebi Sarvestani, Z., Pirdashti, H., Motevali, A., Nadi, M., & Valipour, M. (2023). Sustainable Systems Engineering Using Life Cycle Assessment: Application of Artificial Intelligence for Predicting Agro-Environmental Footprint. Sustainability, 15(7), 6326. https://doi.org/10.3390/su15076326