Article

Urban Green System Planning Insights for a Spatialized Balance between PM10 Dust Retention Capacity of Trees and Urban Vehicular PM10 Emissions

Department of Agricultural, Food and Environmental Sciences, University of Perugia, 06100 Perugia, Italy
*
Author to whom correspondence should be addressed.
Sustainability 2023, 15(7), 5888; https://doi.org/10.3390/su15075888
Submission received: 28 February 2023 / Revised: 17 March 2023 / Accepted: 27 March 2023 / Published: 28 March 2023
(This article belongs to the Special Issue Benefits of Green Infrastructures on Air Quality in Urban Spaces)

Abstract

:
Reducing air pollution is a crucial challenge in urban areas. In this regard, urban green infrastructures could play a pivotal role. In the literature, scholars analyzed both the ability of species-specific and layout-specific green infrastructures to reduce air pollution and the best location sites of new green infrastructures to increase the provision of overall ecosystem services. There is a lack of studies helping green urban planners and designers choose where and which green infrastructure to implement based on vegetation species-specific performance and differentiated demand for the ecosystem services of city areas. This paper uses tree cadastre data from a medium-sized city in central Italy (Perugia) and the traffic open-layers of Gmaps to develop a spatial analysis of the urban trees’ performance in PM10 dust retention, and the PM10 produced by vehicular emissions, respectively. The method generates a spatialized balance between demand (air-polluted sites by traffic) and supply (PM10 dust retention by trees) to support local decisions about the best locations for new green infrastructures and the choice between species. The paper analyzed 6710 urban trees in an area of 42.62 km2 with a linear road density of 15 km/km2. Platanus hybrida Mill. ex Münchh, Celtis australis L., Ulmus carpinifolia L., Pinus pinaster Aiton, Quercus ilex L., Quercus robur L., and Tilia cordata Mill. are the resulting optimal species to reduce PM10, with median values of 219.62, 181.47, 166.67, 154.66, 143.90, 118.61, and 118.04 g tree−1 yr−1, respectively. The paper is a first contribution in developing GIS-based tools that vary the recommended location sites and species for new green infrastructures based on the demanded ecosystem service. Urban planners are called to dynamically use and integrate numerous tools, such as the one developed here, to seek complex solutions capable of increasing the sustainability of urban systems.

Graphical Abstract

1. Introduction

Sustainability is a critical issue for modern societies, and urban areas are particularly relevant because they are home to a large portion of the global population and are responsible for significant air pollutants emissions and other environmental impacts. Sustainability is a complex concept in which many elements coexist. In cities, assets that are proving to play a crucial role in this regard are Green Infrastructures (GIs). Indeed, when planned and designed according to their performance, GIs represent significant resources in modern urban areas. As defined by the European Commission, they are “a strategically planned network of high quality natural and semi-natural areas with other environmental features, which is designed and managed to deliver a wide range of ecosystem services and protect biodiversity in both natural and urban settings” [1] (p. 7). GIs can be parks, forests, community gardens, representative green spaces, street trees, green roofs and walls, and service and marginal green areas [2]. GIs contribute to the sustainable, inclusive, and smart growth of urban areas, allowing the conservation of values and functions of a natural system [3]. In a climate context characterized by frequent peaks and emergencies, they increase the efficiency of the stressed grey infrastructures. Schaffler and Swilling [4] provide evidence that a strategic location of GIs gives flexibility to grey infrastructures, which remain inactive unless their specific service is required. There is a need for dedicated tools to integrate them into multi-scale urban planning, from local areas to regional and interregional spaces [5].

1.1. GIs and Ecosystem Services in Urban Planning

The “Millennium Ecosystem Assessment,” led by the United Nations Environmental Program (MEA) highlighted that human beings strongly depend on the flow of ecosystem services that include “provisioning services such as food, water, timber, and fiber; regulating services that affect climate, floods, disease, wastes, and water quality; cultural services that provide recreational, aesthetic, and spiritual benefits; and supporting services such as soil formation, photosynthesis, and nutrient cycling” [6] (p. 5).
At the European level, the previous classification of ecosystem services [6] has been replaced by the Common International Classification of Ecosystem Services (CICES) valuable for all European countries [7]. CICES defines three main groups: Provisioning, Regulation and Maintenance, and Cultural Services. Provisioning services are “all nutritional and non-nutritional material and energetic outputs from living systems” [8] (p. 10). Regulation and Maintenance are represented by “all the ways in which living organisms can mediate or moderate the ambient environment that affects human health, safety or comfort” [8] (p. 10). Cultural ones are “all the non-material and normally non-rival and non-consumptive outputs of ecosystems, both biotic and abiotic, that affect physical and mental states of people” [8] (p. 10).
There is broad research regarding the ecosystem services provided by green infrastructures, mainly for mapping and evaluating regulating services. Scholars showed that green infrastructures contribute to lowering extreme temperatures [9,10], air pollutants [9], emissions of volatile organic compounds [9], and energy use (as a consequence of mitigating temperatures and shading buildings during the hottest seasons and the block of winds in winter) [9]. GIs increase rainfall in arid cities [11] and decrease stormwater runoff speed during massive precipitation [4,12]. Furthermore, GIs improve the quality of water stocked in the soil [13] and its fertility [14]. In built-up areas, green infrastructures guarantee bird and small animal biodiversity [15], contribute to pest control [16], and act as an essential resource for pollinators [17]. Regarding the provisioning services offered by GIs in urban contexts, they are mainly studied and linked with urban agriculture [12,18,19]. For the provision of cultural services, traditionally, urban green designers have focalized their attention on urban parks. Their approaches have become systemic only in the last decades, involving the whole GI network [20].
Having recognized the importance of GIs in providing ecosystem services in urban areas, the question remains about how, where, and which species to plant. Ferrini et al. [21] report that a correct choice of species needs evaluations of their ecosystem services provision during their life cycles. Ghafari et al. [22], through a multi-criteria analysis, developed a process for selecting the species based on regional adaptation, urban environment, aesthetics, maintenance, growth characteristics, and specific advantages (among which are shading, control of soil erosion, attraction for birds, and pleasant fragrance). Using tree data from the literature, Radhakrishnan et al. [23] developed a list of species evaluated by various criteria, including aesthetical attractiveness, social function, increasing environmental quality, and supporting biodiversity. Using data from a local tree cadastre and i-Tree software, Rossi et al. [24] offered a list of species valuable for Mediterranean areas with good performance in reducing runoff and increasing pollution removal, carbon storage, and sequestration.
Scholars from different fields followed different goals to respond to how and where to plan GIs, such as decreasing the disparity between rich and poor neighborhoods [25] or increasing the economic benefit for local administrators [26]. Scholars generally develop methods to offer solutions with good performance in providing more ecosystem services rather than solutions with optimal performance for a specific ecosystem service. Dobbs et al. [27] provided insights into how the landscape structure can be modified to plan sustainable cities. Lourdes et al. [28] developed a multi-criteria analysis to identify suitable areas for implementing GI strategies to optimize heat mitigation, runoff retention, sediment retention, scenic quality, urban recreation, and agricultural production in a rapidly expanding catchment area. Many authors focalize their research on the continuity of the urban green network. Zhang et al. [29] developed a landscape connectivity analysis to support decisions for expanding cities and avoiding fragmentation of GIs. Whange et al. [30] assessed GIs based on bio-energy landscape connectivity. Ji et al. [31] and Soga et al. [32] conducted a network analysis to investigate spatial distance and the relation between the GIs’ layout and the city’s shape. Menconi et al. [20], in a review regarding the complex system approaches to urban green system design, highlighted that scholars and urban green planners frequently considered the urban green system as homogeneous without evaluating the heterogeneity of its variables.
Indeed, there is a current knowledge gap in performance-based planning methods to integrate the urban green planners’ approaches with species-specific ecosystem services analysis to support decisions about which species to plant to solve a defined urban problem in a defined urban area.

1.2. GIs and Air Pollutants

This paper studies a specific ecosystem service, i.e., PM10 dust retention. PM10 is a mixture of solid and liquid suspended in the air, with dimensions less than ten µm. Particulate matter has increased since the preindustrial period, both in urban and rural areas. It is associated with cardiovascular and respiratory mortality [33], reduction of birth weight [34], sleep disorders [35], and, more in general, with human health [36]. Reducing air pollutants is a target of the 2030 Agenda for Sustainable Development [37]. Indeed Goal 11 is “Make cities and human settlements inclusive, safe, resilient, and sustainable,” Target 11.6 is “reduce cities’ adverse per capita environmental impact by paying particular attention to air quality and municipal and other waste management.” This Agenda also proposed indices to evaluate progress, and index 11.6.2 is the yearly values of PM2.5 and PM10 in cities. The European Union has initially fixed a 24 h limit value for PM10 to 50 µg/m3 (maximum 35 days of exceeding in a year) and the annual limit value to 40 µg/m3 to be met by 2005. After 2005, the European Union maintained the 24 h limit value for PM10 to 50 µg/m3, reducing to 7 the maximum days of exceeding in a year and the annual limit value to 20 µg/m3 [38].
Scholars demonstrated that GIs contribute to achieving Sustainable development goals [39], among which is reducing PM10 [40,41,42]. Barwise and Kumar [43] studied the urban vegetation’s shape and structure for optimizing the PM10 dust retention to site-specific needs and constraints. Yao et al. [44] built scenarios of GI implementation in a Chinese city, and their findings show that street trees perform better than city park trees in terms of total air pollutant removal.
Regarding species-specific performance evaluation, using the i-Tree Eco tool in central Italy cities, previous findings show that Liriodendron tulipifera L., Celtis australis L., Acer campestre L., Acer platanoides L., and Ulmus minor Mill. are the species with the best performance in capturing PM10 in Bologna [45], and Cedrus spp., Celtis australis L., and Larix decidua Mill in Ponte San Giovanni (Perugia) [24]. The yearly value of remotion per tree ranges from 94 to 140 g in Bologna [45], while it is around 300 g in Ponte San Giovanni [24]. The findings of Mo et al. [46] confirm that coniferous trees such as Cedrus spp. and Larix decidua Mill. perform well thanks to the annual persistence of leaves on the plant.

1.3. Looking for a Balance between GI Performance and Cities’ Needs
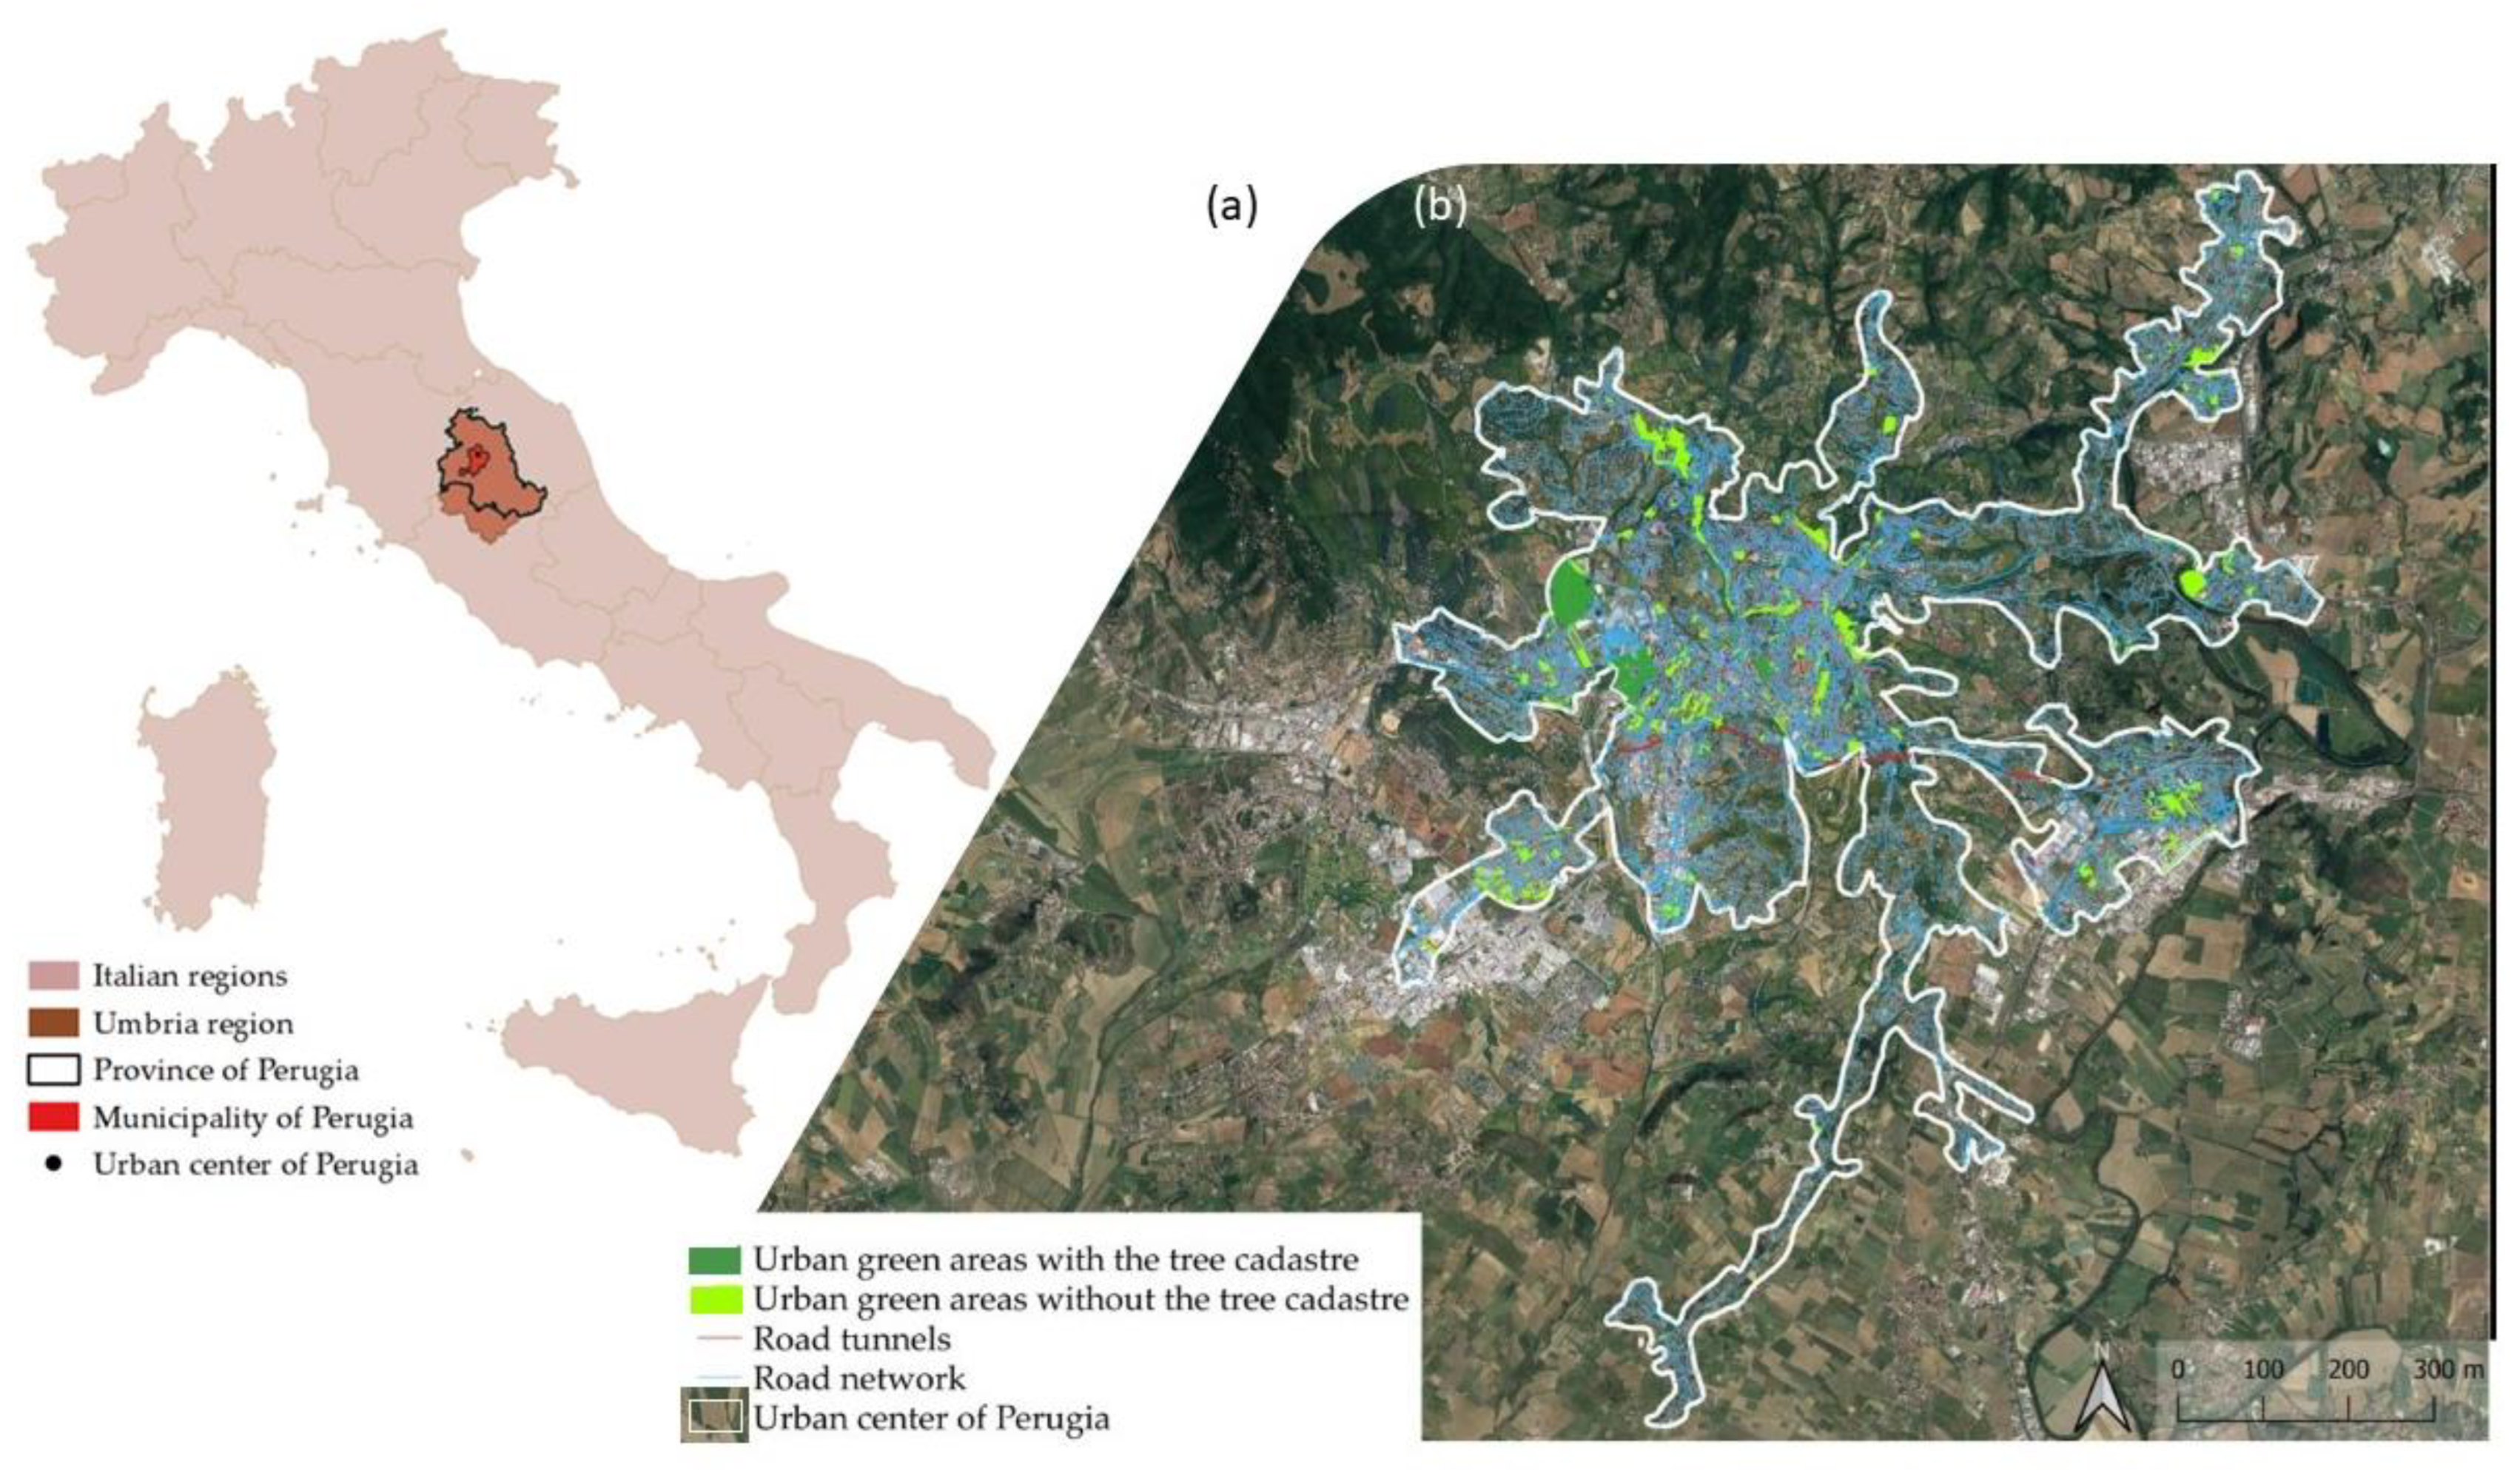
In its Emission inventory report, 1990–2020, the European Environment Agency [47] showed that the main categories for PM10 emissions in European countries are “commercial, institutional, and households” (42%), “industrial processes and product use” (19%), “agriculture” (16%), and “road transport” (9%). Regarding road transport, the literature shows a strong relationship between air pollution and vehicular exhausts. Indeed, vehicular traffic increases pollutants released into the air [48] and contributes to total greenhouse gasses [49]. Many open spatial data [50,51] report road networks that can quickly be evaluated in a GIS environment using rules based on the physical characteristics of roads and traffic layers to define potential spatialized values of PM10 emission.
While numerous studies map ecosystem services by GIs, spatial integration of their outputs with their spatialized demand remains challenging. Local administrators and urban city and green planners could benefit from models to define spatialized compensation points between the supply and demand of ecosystem services. In spatial studies, the compensation point is the equilibrium point between the amount of x-resource asked by a community living in an area and the x-resource provided by the same place. In this regard, widespread indices are ecological footprint and biocapacity [52,53]. For example, Menconi et al. [54] and Stella et al. [55] developed a spatialized method to define a GIS-based compensation point between food supply and demand using these indices.
Concerning studies to balance the amount of air pollution and solutions for its absorption, Yao et al. [44] compare PM10 values from a spatial interpolation of monitoring stations and the estimate of PM10 dust retention by a tree cadastre for a Chinese city. This kind of spatialized balancing approach is scarce. Generally, scholars design specific GI solutions tailored to a case study [56] or develop methods to simulate the mitigation of air pollutants varying the chosen GI [45].
There is a need for more research on the supply/demand balancing of ecosystem services, able to suggest which species to choose and where to plant them for finding compensation points tailored for every area.
The paper contributes to this field by developing a spatialized balance between air-polluted sites by traffic in an Italian city and PM10 dust retention by trees. The paper offers a method to support local decisions regarding the best locations and species’ composition for new green infrastructures to reduce urban air pollutants.

1.4. Study Area

The study area is the urban center of Perugia (Italy). Perugia, the main Municipality of the Umbria Region, has a surface area of 449.51 km2 and an altitude between 300 and 500 m. The climate is Mediterranean, with relatively cold winters and hot, sunny summers. The average temperature of the coldest month (January) is 5.3 °C, and the warmest month (August) is 24.3 °C. Precipitation amounts to 820 mm annually, ranging from 35 mm in the driest month (July) to 95 mm in the wettest (November). On average, there are around 2115 sunshine hours per year, ranging from 86 h in December and 300 in July.
Its urban center has a surface area of 42.62 km2, a 639 km road network, and an urban green availability per capita of 34.7 m2 per inhabitant [57] (Figure 1). The study area has a sprawling shape because the settlement was historically developed on the top of hills interspersed with valleys. The European Union emission inventory report, 1990–2020 [47], shows for Perugia an average 24 h concentration of PM10 of 34.0 µg/m3. In 2015, the municipal administration started its urban tree cadastre. To date (February 2023), Perugia has inventoried 6710 trees belonging to different types of GIs (Figure 2), covering 14.2% of the urban green areas (Figure 1).

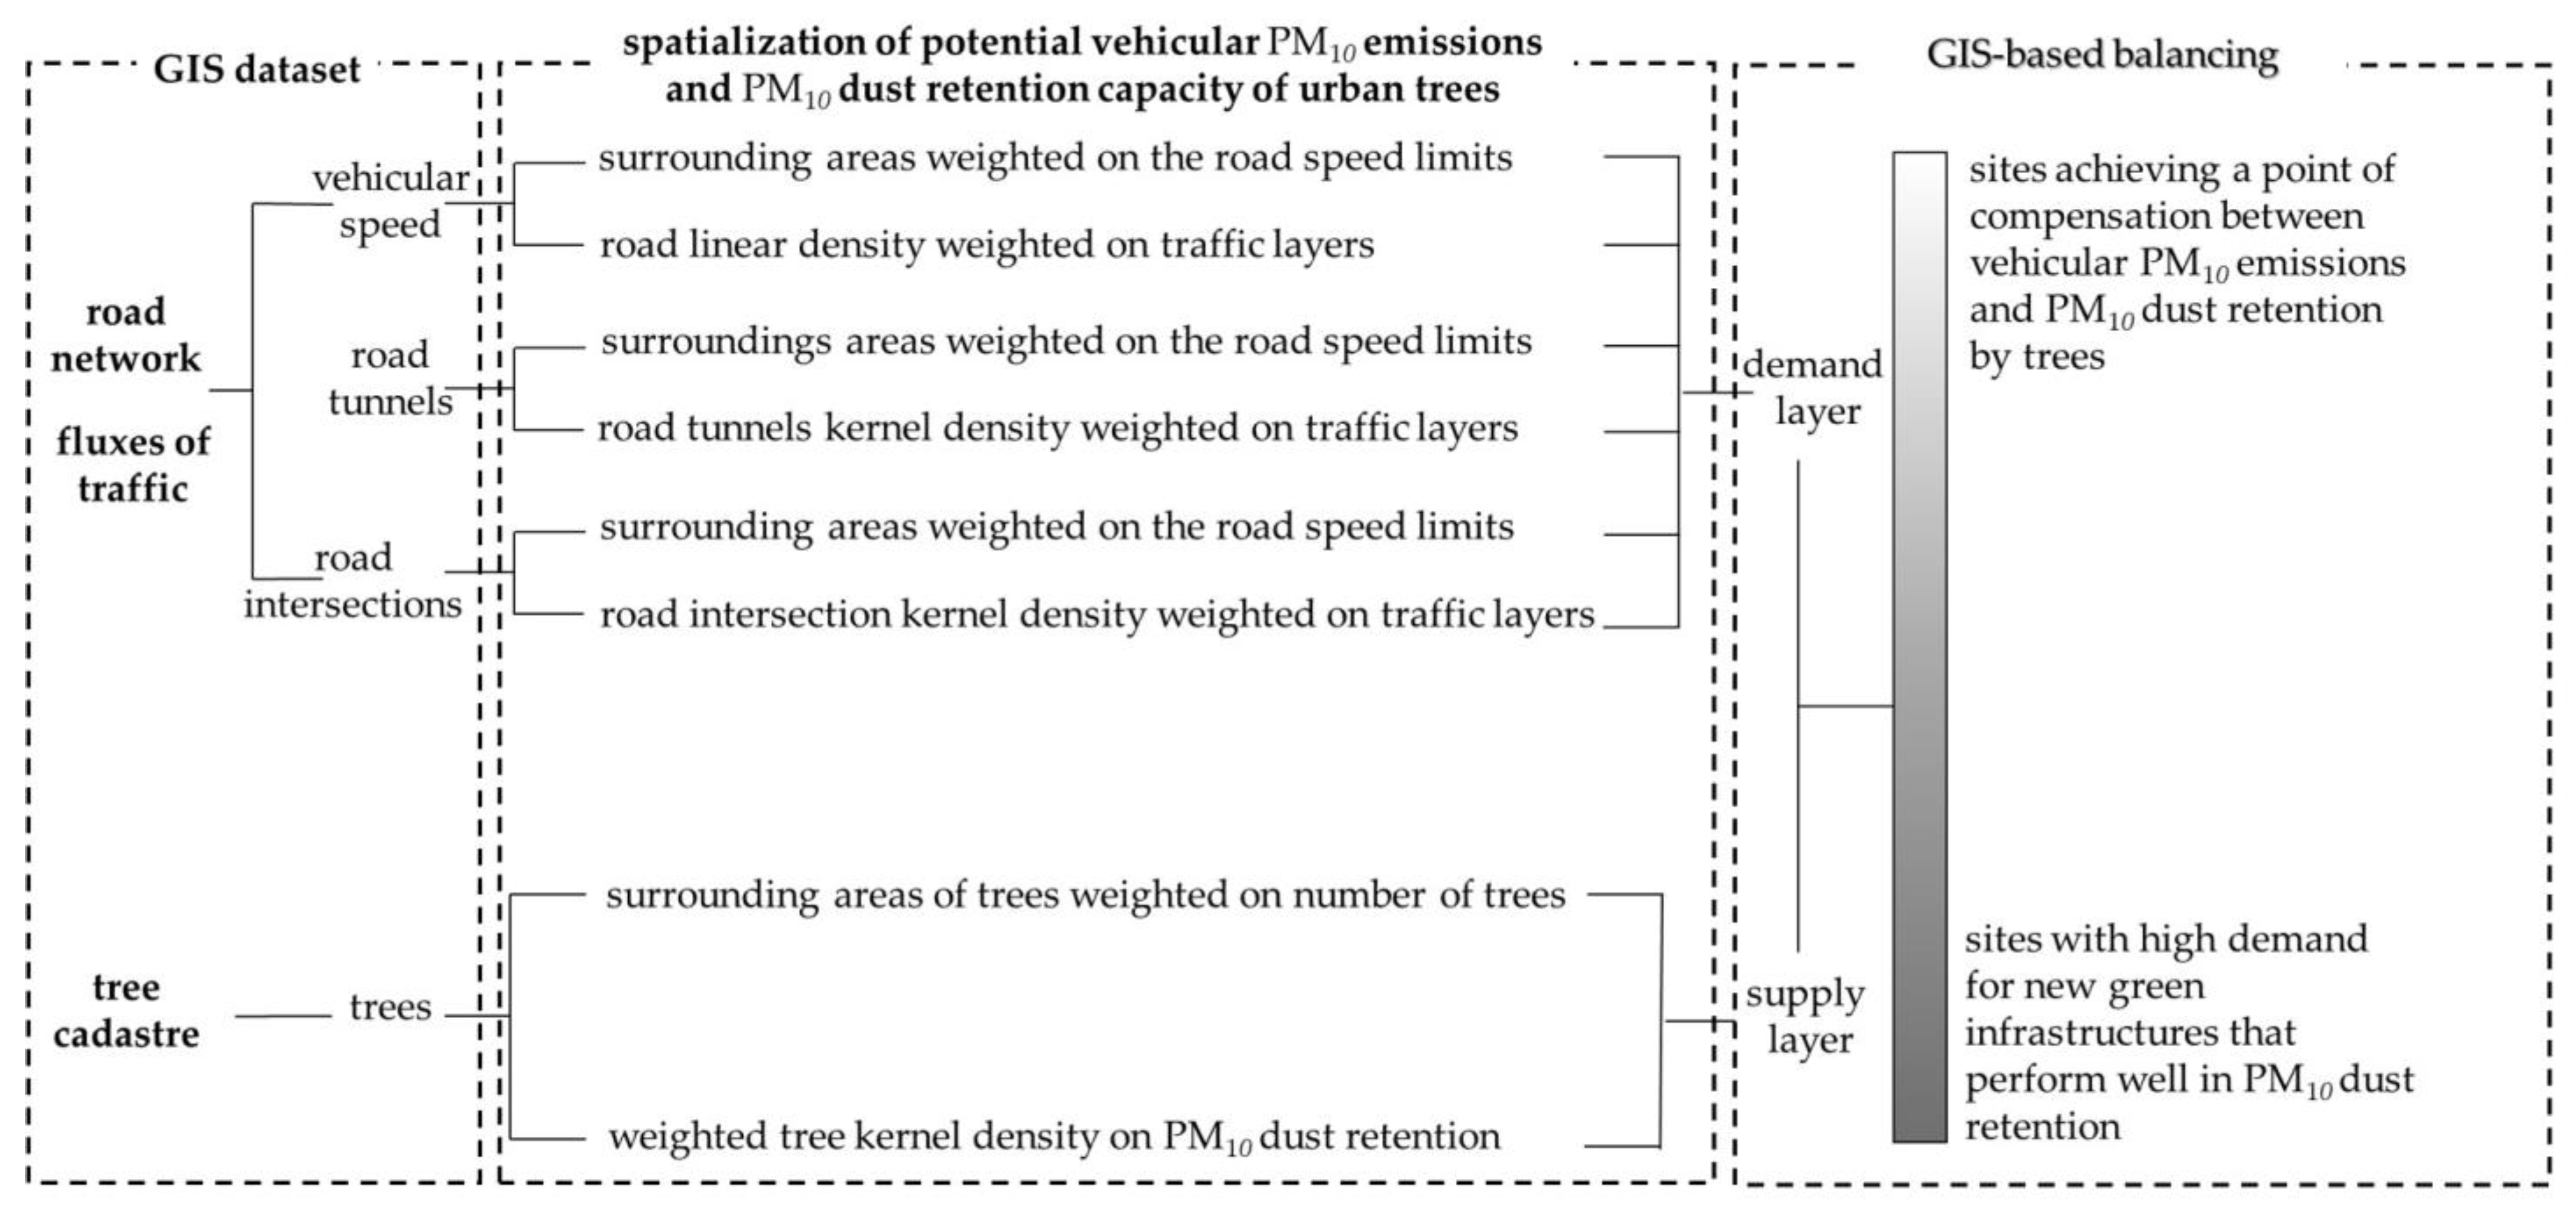
2. Materials and Methods
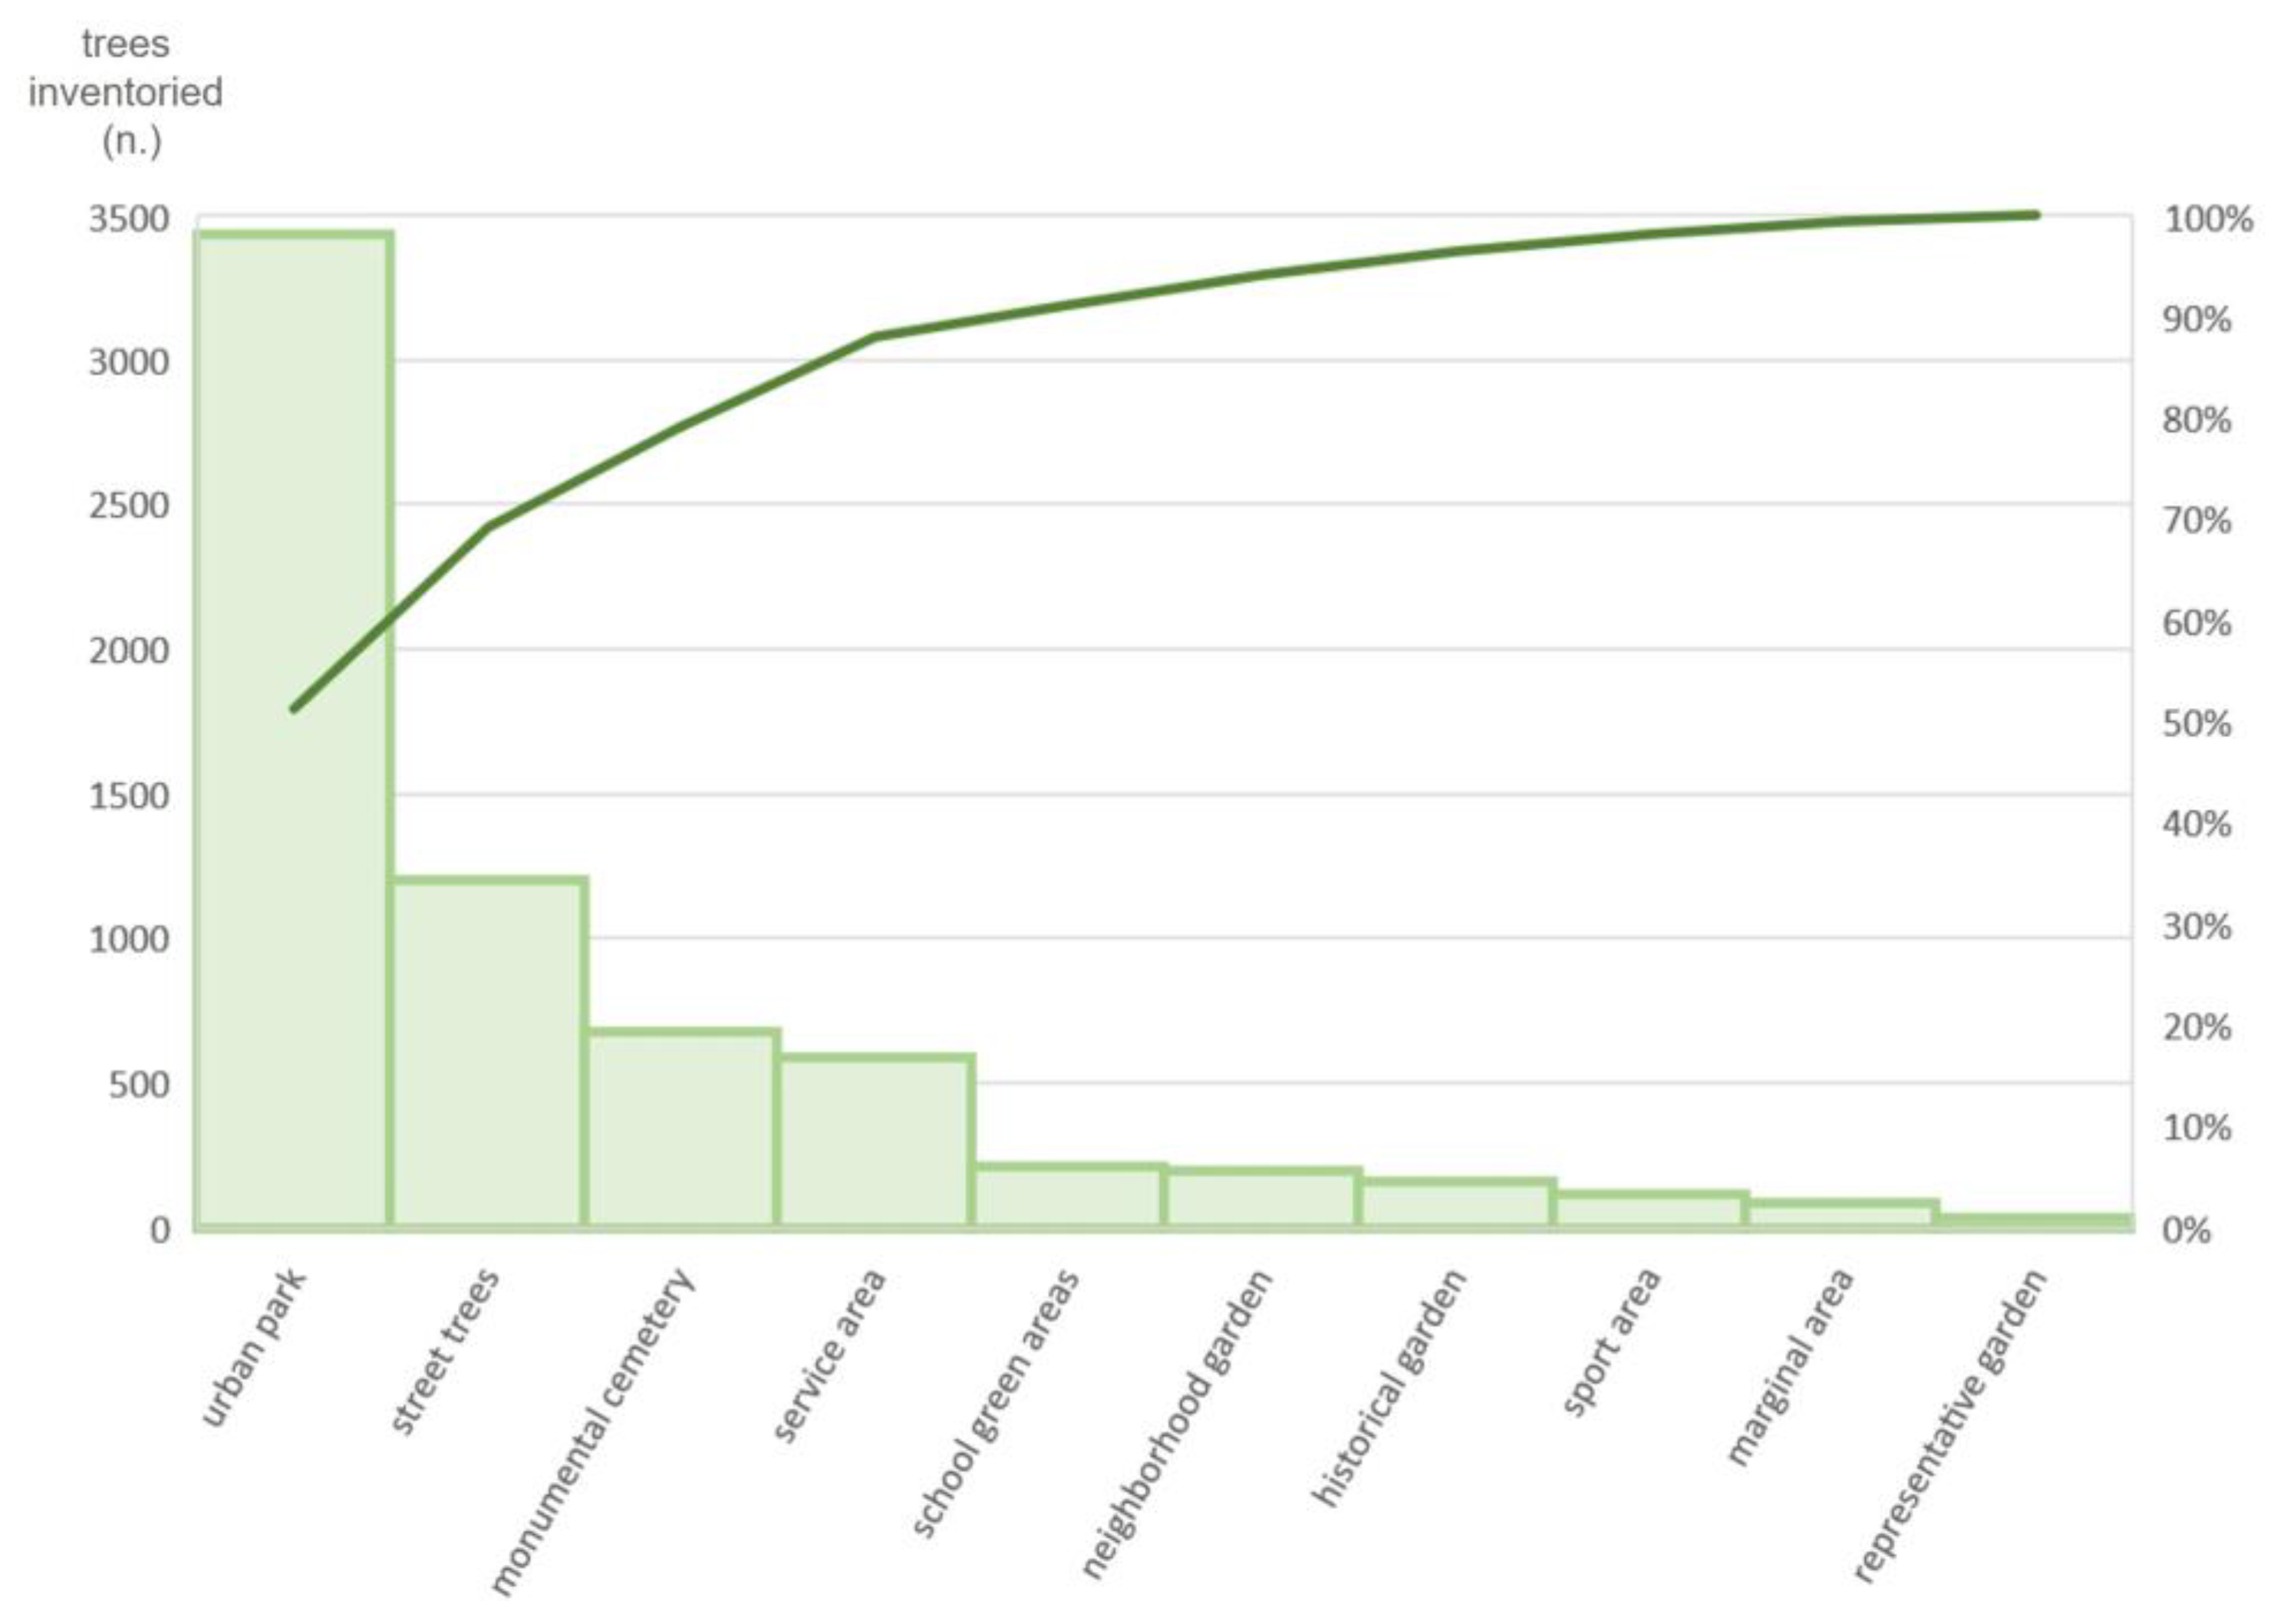
Figure 3 sketches the steps of the method: building the dataset in a GIS environment, spatializing the data, and performing a GIS-based balancing. We used QGIS (version 3.22.5), a free, open-source, and continuously updated GIS software [58].
The first step is building the GIS dataset with the physical characteristics of the road network and traffic layer. The method defines differentiated layers based on the speed limits, intersections, and road tunnels. Indeed, Hao et al. [59], in a study of the PM10 distribution along roads, showed that it increases near crossings due to variations in the speed or stops. In the same paper, the scholars highlighted high concentrations of PM10 near road tunnels. Regarding traveling speed, Wang et al. [60] observed that high speeds cause dust re-entrainment as a secondary pollutant, increasing the roadside PM10 level. In contrast, Amato et al. [61] showed that motorways produce less PM10 due to constant speed and the absence of crossings and traffic lights. The road network was downloaded from the OpenStreetMap platform [50] and clipped with the boundaries of the study area. The table of attributes of this layer reports the type of roads, speed limits, and road tunnels. For the urban vehicular fluxes, the method uses the typical hourly fluctuations available in the Google Maps platform [51]. After acquiring the previous GIS dataset, the method uses a network analysis tool of QGIS called “Branches and nodes” to extract intersections between the road network and the entrances of the tunnels. From these starting elements, we calculated their surrounding areas, weighing them using the speed limit of roads.
The source of information for tree cadastre is the Municipality of Perugia [62], which is building a geo-referred inventory of urban trees with the following attributes: age of the tree, diameter at breast height, height of the tree, height of the first branch, crown’s width and transparency. To estimate the PM10 dust retention by the tree, the Municipality of Perugia uses the UFORE Model developed by Nowak and used in i-Tree Eco tools [63]. Specifically, the UFORE-D model calculates the yearly grams of dry deposition of PM10 for every studied tree using Equation (1) [64].
P M 10 = n = 1 8760 V d n × C n × 3600 × L A I × C C  
where Vdn is the hourly velocity of deposition of PM10 on leaves (m/s); Cn is the hourly concentration of PM10 in the air (g/m3·h) in the area; 3600 are the seconds (s) in one hour; and 8760 are the hours in one year. The multiplication of these first three values provides the hourly dry sedimentation flux of PM10 per unit area (g/m2). This flow is then multiplied by the value of the Leaf Area Index (LAI) and the value CC, representing the tree-canopy coverage (m2). For deciduous trees, the calculation of Equation (1) is limited to the in-leaf period.
To spatialize the built GIS dataset, having polylines (road network) and points (road intersections, entrance of tunnels, and urban trees), the method calculates a heatmap of every layer using a kernel density estimation with variable radius weighted on traffic fluxes, and PM10 dust retention capacity of trees, respectively, for demand and supply layers. Kernel density is a statistical technique used to estimate the probability density function of variables (potential PM10 emission by vehicular traffic and potential PM10 retained by urban forest) based on a set of observations or data points (characteristic of the road network, traffic fluxes, performance of urban trees). It is a non-parametric method that places a kernel function at each data point and then sums the contributions of all the kernels to obtain probability values of the presence of the studied variable. Kernel density estimation is commonly used in data analysis, signal processing, and machine learning to model data distribution (heatmaps in Qgis) and perform density-based clustering. The resulting heatmaps’ values are first normalized to a standard range of 0–1; then, the three demand layers are summed and normalized again based on the same range.
Finally, the method develops a GIS-based balancing map through the difference between the demand and supply layers. High values of this map represent sites achieving a point of compensation between PM10 emission by vehicles and PM10 dust retention by GIs. In contrast, low values represent sites with high demand for new green infrastructures performing well in PM10 dust retention. The method also suggests which species could be used with Equation (1).

3. Results

To date, the tree cadastre of Perugia has 6071 trees. The cleaning of the dataset has highlighted a large amount of corrupted, incorrectly formatted, duplicate, or incomplete rows, so we performed the analysis with 51% of them (3097 trees). These trees belong to 108 species, but only 5 species represent 50% of the cadaster (Figure 4): Cupressus sempervirens L. (537 trees), Quercus ilex L. (337), Robinia pseudoacacia L. (315). Populus nigra L. (202), Aesculus hippocastanum L. (200).
Table 1 reports statistics regarding the biometric parameters of the inventoried trees (tree cadastre of the study area, to date). This table shows that the urban trees of the case study have high variability in their biometric parameters. Table 2 shows the resulting species with the best performance in PM10 dust retention, using Equation (1). Due to the high dispersion between values (high values of standard deviation), the table reports a ranking based on the median value of the species. The remaining species have a median value lower than 100 g tree−1 yr−1 of PM10 dust retention or less than 10 individuals. Data from Table 1 helps in understanding as studied trees have a wide variety of performances (high standard deviations, Table 2) also due to the different dimensions among trees belonging to the same species.
The road network has a density of 15 km/km2, with a speed limit between 30 and 110 km/h. Following the method described in the previous section, the heatmaps differentiated for the input layers (vehicular speed, road tunnels, road intersections, and trees) were realized. Then, the GIS-based balancing map was calculated. Figure 5 shows an example of the first findings for the road intersections layer, and Figure 6 shows the demand, supply, and balancing maps.
Following the steps sketched in Figure 3, the paper spatialized the supply and demand layer using the kernel density function of Qgis. The resulting supply map (Figure 6, green infrastructure performance) shows a low level of urban trees with high performance in PM10 dust retention. The demand layer (Figure 6, potential vehicular PM10 emission) shows that, in urban centers, those areas with complex road intersections have a remarkably high value of PM10 emissions. The balancing map (Figure 6, map on the right) shows a variable composition of the balance. The dark blue areas in Figure 6 represent high demand for GIs having high performance in reducing PM10, which could be supplied by developing a new green design or requalifying the existing one by replacing those trees with low performances. Table 2 supports choices between species based on their performance in PM10 dust retention. Very light blue areas in Figure 6 correspond to places with reasonable compensation, and they are those near urban parks and away from the main roads.

4. Discussion

Urban GI planning involves developing and managing natural and semi-natural spaces in urban areas, such as parks, green roofs, urban forests, and greenways. The societal impacts of GI planning can be significant, particularly in improving cities’ sustainability [3,20].
This paper contributes to achieving this goal by developing a method for the spatial distribution of ecosystem services provided by GIs. Indeed, even if some of the ecosystem services GIs provide, such as carbon storage, are characterized by widespread demand across the territory, most of them are defined by differentiated needs in different city areas [4]. This paper develops a performance-based approach evaluating species-specific ecosystem services provision and giving tailored neighborhood solutions. This approach contributes to developing methods for giving flexible solutions resulting from constant monitoring of the city system [20]. Following an ecosystem services approach, generally, urban green planners identify synergies and tradeoffs between services and assess the cooccurrence and overlap of hotspots between multiple services in green areas’ design [28]. Scholars developed methods to balance ecosystem services’ provision, such as multicriteria analysis [28] evaluation of the landscape structure [27], building connectivity between GIs [29,30,31,32], and function combination between types of urban green area [65]. Instead, using a performance-based approach, the choices regarding tree species and locations for GIs are based on the specific ecosystem service that the decision-maker needs to emphasize in each urban area, giving custom-fit solutions.
The novelty of our paper consists of responding to a specific question with the best solutions tailored to a neighborhood rather than finding solutions of compromise between ecosystem services applicable to the whole city system. The method contributes to developing smart urban green system planning based on technical management tools and tailored innovative applications [65].
In this paper, the method spatializes only one ecosystem service (PM10 dust retention) provided by urban trees (supply) and only one source of demand (vehicular traffic). Its findings are a piece of a complex puzzle. For a systemic urban green planning process, local administrators should integrate this method with further balancing tools based on different sources of supply and demand of ecosystem services. For this reason, there is a need for more research regarding tools to spatialize the ecosystem services provided by GIs (such as PM2.5 retention [66]), spatialize the corresponding city demands, and then offer custom-fit solutions for their provision. Few scholars have developed methods of spatialization dedicated to stormwater management [67], daily recreation [57], sediment retention [28], and temperature control [68], which could be the first tools integrable with our findings.
In addition to having spatialized only a specific ecosystem service (PM10 dust retention), the paper spatializes only a source of PM10 emissions (vehicular traffic), so before integrating results with other ecosystem services, the method must take into account other sources of PM10. As reported by the European Environment Agency, historically [47] and in recent years [69], the leading sources of PM10 emissions are household, institutional, and commercial buildings. In urban contexts, vehicular traffic produces a quantity of PM10 smaller only than the particulate produced by the air conditioning systems of buildings [47,69]. Traffic flow trend monitoring is possible thanks to Google Maps traffic layers [51], while open access data sources for monitoring air conditioning systems in buildings throughout the year are lacking. A future contribution will include the spatial estimation of PM10 emissions linked to urban structures’ heating and air conditioning, using the kernel density function weighted with the volumes and uses of the buildings. These layers of demand (potential vehicular emissions of air pollutants, developed in this paper, and air conditioning evaluation, following works) could also be used to estimate the distribution of PM2.5 emission because the leading urban sources are the same [47].
The European Union emission inventory report, 1990–2020 [47], shows for the case study an average 24 h PM10 concentration of 34.0 µg/m3. The municipality of Perugia has four monitoring stations, but only two are in the study area (Cortonese and Fontivegge stations). The Environmental Regional Agency of Umbria region [70] reports a daily average of PM10 concentration during the last year (2022) of 46 µg/m3 for the Cortonese station and 59 µg/m3 for the Fontivegge station. At the urban scale, to obtain continuous pollutant concentration data, scholars have developed spatial interpolation methods to estimate data for unmonitored areas by using the data from existing monitoring stations [44]. At the design scale, computational fluid dynamics models have been applied to simulate the turbulent flow dynamics and the dispersion of atmospheric pollutants within GIs [71,72]. The method proposed in this paper has used previous findings regarding the relationship between the physical characteristic of the road network and PM10 emission [48,49,59,60,61,73] to define the potential vehicular PM10 emissions along roads and a non-parametric method for estimating the probability density function of PM10 distribution based on kernel density. The resulting spatialization provides probability classes instead of quantitative estimations of air pollutants’ distribution. To achieve values of PM10 concentration, an emission model should be implemented using local data regarding numerous climatic and physical variables, as carried out by Wang [60] and Jiang [71] in China. A strength of the method of this paper is to offer an easy tool to support public administration and urban green planners in greening choices, using only data regarding road and GI networks.
The literature has shown that the removal values of air pollutants, such as particulate matter, vary between cities depending on the importance of tree cover, their transpiration and deposition rate, and health status and size [9]. This paper uses local tree cadastre data and the UFORE-D equation to include all these aspects. Indeed, according to the Italian law requirement [74,75], Perugia, like other Italian municipalities, is building its municipal tree cadastre. The used tree cadastre’s characteristics strongly influence the findings because they currently cover only 14% of the area, and the data cleaning has deleted 49% of inventoried trees. This result outlines that local governments struggle to find skilled personnel capable of implementing a rigorous cadastre, even though it could be an important source of information to organize methods for developing urban green system planning to improve cities’ resilience.
Table 2 shows that the species with a high performance in PM10 dust retention are Celtis australis L, Platanus hybrida Mill. ex Münchh, Pinus pinaster Aiton, Quercus ilex L., Quercus robur L., Tilia cordata Mill., and Ulmus carpinifolia L., all of them absorbing more than 100 g tree−1 yr−1. These values have high internal variability, depending on different urban locations (e.g., monumental cemeteries and streets) and tree conditions (dimensions, age, and state of health). Baraldi et al. [45] compare medium size trees in an exact location to estimate tree performance. Tree cadastres could provide information regarding the characteristic dimensions of different species depending on the geographic contexts to help define medium size trees. Results show that local administrators need arborists and specialized personnel during data collection and interpretation to use tree cadastre data to build a ranking between species based on ecosystem service provision, as did Rossi et al. [24]. Indeed, local administrators need experts with knowledge about the implementation of datasets and tree behavior. Beside evaluations regarding their PM10 dust retention, experts need to evaluate how plants react to PM10 produced by vehicular emissions, which can cause morphologic variation in the tree [76]. For example, Quercus robur L. has good foliar wettability, which allows it to retain more airborne particles [77], and good resistance to foliar contamination due to pollutants [78], which does not imply, in this specie, an early foliar fall as happens in other even better performing species. Moreover, if subjected to stress from contamination given by pollutants, it can produce waxes [78], increasing resistance and retaining further airborne particulate. Overall, these characteristics last listed would give it more functionality than some more performing species reported in other studies [79,80,81,82].
Generally, the planting of a tree in areas with high levels of PM10, as well as following an integrated assessment of ecosystem services provided [20,28] and its reaction to PM10 emissions [76], as previously discussed, needs to evaluate its necessities, such as light requirement, its good qualities, such as the resistance to breakage [83], and its undesirable qualities (e.g., high mortality rates and allergenicity, VOC emissions.) Indeed, trees are a significant source of VOCs [84,85,86] such as isoprene and monoterpene, which are organic compounds that can react with other atmospheric pollutants, forming secondary pollutants such as ozone [85,87], which can also have significant health impacts. Apart from Quercus ilex L. [88,89], our resulting species are not usually considered significant VOC emitters [84,85]. It is essential to recognize that air quality is a complex issue, and reducing pollution requires a comprehensive approach that considers all relevant pollutants and their sources. While focusing on one specific pollutant is a good start, it is essential to also address other pollutants to ensure that air quality standards are met, and public health is protected. In this regard, i-Tree Eco tool could also be used to estimate the retention of other air pollutants (PM2.5, CO, NO2, O3, SO2) by trees using the same biometric parameters with hourly values for every pollutant [64].
Arborists should also evaluate the benefits of associations between more species [90], the continuity of the GI networks [27,29,30], and collaborate with urban green designers to design optimal layouts for GIs [91]. Furthermore, the existing layout of urban green areas must be evaluated before adding new trees to guarantee enough space for their growth. Trees ranking on their performance could be used to suggest eventual replacements. Still, it must be considered that large and mature trees, with full crowns and significant leaf surface areas, provide more ecosystem services than smaller ones [92]. For this reason, to evaluate whether a tree should be replaced with more performant species, it is necessary to assess its level of growth and state of health.
In general, methods that consider the specific characteristics of urban environments, as well as the social and economic factors that influence urban sustainability, can help guide decision-making and policy development in these areas. This paper has the potential to provide a valuable framework for sustainable urban development, both in terms of addressing specific environmental and social challenges and in guiding broader policy discussions around urban sustainability. Overall, this paper offers a valuable contribution to urban planners for co-planning GIs with roads, according to Schäffler and Swilling’s [4] recommendations, which highlight the importance of co-planning green areas with other urban infrastructures for efficient urban green system planning.
Furthermore, the continuous recalibration of the developed method in response to changing circumstances and evolving knowledge guarantees that it remains relevant and effective over time. Overall, urban green system planning is a complex process [20], and this method contributes to the current lack of dedicated tools to integrate urban with GI planning [5].

5. Conclusions

GI planning can have significant societal impacts that can help improve cities’ sustainability, health, and well-being. This paper contributes to developing performance-based GI planning to ensure community-tailored solutions based on the main weaknesses of their neighborhoods. Indeed, the paper develops a performance-based method for planning GIs in urban contexts, balancing the supply and demand of ecosystem services and contributing to building a nexus between urban planning and green planning. Starting from a defined ecosystem service, the method suggests the best location and tree species composition of GIs based on its spatialized demand and trees’ performance in its provision. In particular, this paper analyses air pollutant removal (PM10). The paper uses only vehicles as a source of PM10 emission and spatializes the demand using its relation with the characteristic of the road network (speed limits, road intersections, tunnels, traffic fluxes). To build the supply layer, the method uses the municipal tree cadastre of the study area, evaluating the species-specific performance of trees in PM10 dust retention. In a GIS environment, the method balances supply and demand to highlight which urban areas achieve a point of compensation between vehicular PM10 emissions and PM10 dust retention by trees and which of those have high demand for GIs performing well in PM10 dust retention. The resulting GIS dataset needs continuous updates based on the newly implemented design solutions and the climatic and morphology changes in the urban context. This paper contributes to methods for improving the ecosystem services’ provision, giving tailored solutions as the areas studied and the problems to be solved vary. These methods support local administrators and urban green planners in understanding the complexity of the urban green system and in defining differentiated green solutions. Furthermore, results help sensibilize local administrators to the significance of a consistent urban tree cadastre to support design (best location and specie) and management (pruning, replacement of unhealthy trees) decisions. In conclusion, the paper contributes to developing methods to study GIs as solutions integrable with other technological infrastructures to design resilient cities.

Author Contributions

Conceptualization and methodology, M.M. and D.G.; software and validation, R.A.; investigation and data curation, L.S. and R.A.; writing—original draft preparation, M.M.; visualization, R.A.; supervision, D.G. All authors have read and agreed to the published version of the manuscript.

Funding

This research received no external funding.

Institutional Review Board Statement

Not applicable.

Informed Consent Statement

Not applicable.

Data Availability Statement

Data are available upon request.

Conflicts of Interest

The authors declare no conflict of interest.

Abbreviations

GI: Green Infrastructure.

References

  1. European Commission. Building a Green Infrastructure for Europe; European Commission: Bruxelles, Belgium, 2013; Available online: https://ec.europa.eu/environment/nature/ecosystems/docs/green_infrastructure_broc.pdf (accessed on 13 January 2023).
  2. Kronenberg, J.; Haase, A.; Łaszkiewicz, E.; Antal, A.; Baravikova, A.; Biernacka, M.; Dushkova, D.; Filčak, R.; Haase, D.; Ignatieva, M.; et al. Environmental justice in the context of urban green space availability, accessibility, and attractiveness in postsocialist cities. Cities 2020, 106, 102862. [Google Scholar] [CrossRef]
  3. John, H.; Marrs, C.; Neubert, M.; Alberico, S.; Bovo, G.; Ciadamidaro, S.; Danzinger, F.; Erlebach, M.; Freudl, D.; Grasso, S.; et al. Manuale Sulle Infrastrutture Verdi. Available online: https://www.interreg-central.eu/Content.Node/MaGICLandscapes-Manuale-sulle-Infrastrutture-Verdi.pdf (accessed on 13 January 2023). (In Italian).
  4. Schäffler, A.; Swilling, M. Valuing green infrastructure in an urban environment under pressure—The Johannesburg case. Ecol. Econ. 2013, 86, 246–257. [Google Scholar] [CrossRef]
  5. Benedict, M.A.; McMahon, E.T. Green Infrastructure: Smart Conservation for the 21st Century. Renew. Resour. J. 2002, 20, 12–17. [Google Scholar]
  6. Millennium Ecosystem Assessment. Ecosystems and Human Well-Being: Synthesis; MEA, Island Press: Washington, DC, USA, 2005; Available online: https://www.millenniumassessment.org/documents/document.356.aspx.pdf (accessed on 14 January 2023).
  7. European Environment Agency. CICES Towards a Common Classification of Ecosystem Services. Available online: https://cices.eu/ (accessed on 6 February 2023).
  8. Haines-Young, R.; Potschin, M. Revision of the Common International Classification of Ecosystem Services (CICES)V5.1: A Policy Brief. One Ecosyst. 2018, 3, e27108. [Google Scholar] [CrossRef]
  9. Nowak, D.J. The Effects of Urban Trees on Air Quality; USDA Forest Service, Northeastern Research Station 5 Moon Library, SUNY-CESF: Syracuse, NY, USA, 2002. [Google Scholar]
  10. Marando, F.; Heris, M.P.; Zulian, G.; Udìas, A.; Mentaschi, L.; Chrysoulakis, N.; Parastatidis, D.; Maes, J. Urban heat island mitigation by green infrastructure in European Functional Urban Areas. Sustain. Cities Soc. 2022, 77, 103564. [Google Scholar] [CrossRef]
  11. Jauregi, E. Influence of a Large Urban Park on Temperature and Convective Precipitation in a Tropical City. Energy Build. 1990, 15, 457–463. [Google Scholar] [CrossRef]
  12. Petrovic, N.; Simpson, T.; Orlove, B. Dowd-Uribe Environmental and social dimensions of community gardens in East Harlem. Landsc. Urban Plan. 2019, 183, 36–49. [Google Scholar] [CrossRef]
  13. Yang, W.; Wang, Z.; Hua, P.; Zhang, J.; Krebs, P. Impact of green infrastructure on the mitigation of road-deposited sediment introduced stormwater pollution. Sci. Total Environ. 2021, 770, 145294. [Google Scholar] [CrossRef]
  14. Langemeyer, J.; Camps-Calvet, M.; Calvet-Mir, L.; Barthel, S.; Gómez-Baggethun, E. Stewardship of urban ecosystem services: Understanding the value(s) of urban gardens in Barcelona. Landsc. Urban Plan. 2018, 170, 79–89. [Google Scholar] [CrossRef] [Green Version]
  15. Liu, Z.; Zhou, Y.; Yang, H.; Liu, Z. Urban green infrastructure affects bird biodiversity in the coastal megalopolis region of Shenzen city. Appl. Geogr. 2023, 151, 102860. [Google Scholar] [CrossRef]
  16. Egerer, M.H.; Ossola, A.; Lin, B.B. Creating socio-ecological novelty in urban agroecosystems from the ground up. Bioscience 2018, 68, 25–34. [Google Scholar] [CrossRef]
  17. Salisbury, A.; Armitage, J.; Bostock, H.; Perry, J.; Tatchell, M.; Thompson, K. Editor’s choice: Enhancing gardens as habitats for flower-visiting aerial insects (pollinators): Should we plant native or exotic species? J. Appl. Ecol. 2015, 52, 1156–1164. [Google Scholar] [CrossRef]
  18. Menconi, M.E.; Heland, L.; Grohmann, D. Learning from the gardeners of the oldest community garden in Seattle: Resilience explained through ecosystem services analysis. Urban For. Urban Green. 2020, 56, 126878. [Google Scholar] [CrossRef]
  19. Azunre, G.A.; Amponsaha, O.; Pepraha, C.; Takyia, S.A.; Braimahe, I. A review of the role of urban agriculture in the sustainable city discourse. Cities 2019, 93, 104–119. [Google Scholar] [CrossRef]
  20. Menconi, M.E.; Palazzoni, L.; Grohmann, D. Core themes for an urban green systems thinker: A review of complexity management in provisioning cultural ecosystem services. Urban For. Urban Green. 2021, 65, 127355. [Google Scholar] [CrossRef]
  21. Ferrini, F.; Fini, A.; Mori, J.; Gori, A. Role of Vegetation as a Mitigating Factor in the Urban Context. Sustainability 2020, 12, 4247. [Google Scholar] [CrossRef]
  22. Ghafari, S.; Kaviani, B.; Sedaghathoor, S.; Sadegh Allahyari, M. Ecological potentials of trees, shrubs and hedge species for urban green spaces by multi criteria decision making. Urban For. Urban Green. 2020, 55, 126824. [Google Scholar] [CrossRef]
  23. Radhakrishnan, M.; Kenzhegulova, I.; Eloffy, M.G.; Ibrahim, W.A.; Zevenbergen, C.; Pathirana, A. Development of context specific sustainability criteria for selection of plant species for green urban infrastructure: The case of Singapore. Sustain. Prod. Consum. 2019, 20, 316–325. [Google Scholar] [CrossRef]
  24. Rossi, L.; Menconi, M.E.; Grohmann, D.; Brunori, A.; Nowak, D.J. Urban Planning Insights from Tree Inventories and Their Regulating Ecosystem Services Assessment. Sustainability 2022, 14, 1684. [Google Scholar] [CrossRef]
  25. Onishi, A.; Cao, X.; Ito, T.; Shi, F.; Imura, H. Evaluating the potential for urban heat-island mitigation by greening lots. Urban For. Urban Green. 2010, 9, 323–332. [Google Scholar] [CrossRef]
  26. Alpaidze, L.; Salukvadze, J. Green in the City: Estimating the Ecosystem Services Provided by Urban and Peri-Urban Forests of Tbilisi Municipality, Georgia. Forests 2023, 14, 121. [Google Scholar] [CrossRef]
  27. Dobbs, C.; Kendal, D.; Nitschke, C.R. Multiple ecosystem services and disservices of the urban forest establishing their connections with landscape structure and socio demographics. Ecol. Indic. 2014, 43, 44–55. [Google Scholar] [CrossRef]
  28. Lourdes, K.T.; Hamel, P.; Gibbins, C.N.; Sanusi, R.; Azhar, B.; Lechner, A.M. Planning for green infrastructure using multiple urban ecosystem service models and multicriteria analysis. Landsc. Urban Plan. 2022, 226, 104500. [Google Scholar] [CrossRef]
  29. Zhang, X.; Ren, Y.; Zhang, D.; Li, K. Construction of the green infrastructure network for adaptation to the sustainable future sprawl: A case study of Lanzhou City, Gansu Province, China. Ecol. Indic. 2022, 145, 109715. [Google Scholar] [CrossRef]
  30. Wanghe, K.; Guo, X.; Luan, X.; Li, K. Assessment of Urban Green Space Based on Bio-Energy Landscape Connectivity: A Case Study on Tongzhou District in Beijing, China. Sustainability 2019, 11, 4943. [Google Scholar] [CrossRef] [Green Version]
  31. Ji, Y.W.; Zhang, L.; Liu, J.; Zhong, Q.; Zhang, X. Optimizing spatial distribution of urban green spaces by balancing supply and demand for ecosystem services. J. Chem. 2020, 2020, 8474636. [Google Scholar] [CrossRef] [Green Version]
  32. Soga, M.; Yamaura, Y.; Aikoh, T.; Shoji, Y.; Kubo, T.; Gaston, J.K. Reducing the extinction of experience: Association between urban form and recreational use of public greenspace. Landsc. Urban Plan. 2015, 143, 69–75. [Google Scholar] [CrossRef]
  33. Vaduganathan, M.; De Palma, G.; Manerba, A.; Goldoni, M.; Triggiani, M.; Apostoli, P.; Dei Cas, L.; Nodari, S. Risk of Cardiovascular Hospitalizations from Exposure to Coarse Particulate Matter (PM10) Below the European Union Safety Threshold. Am. J. Cardiol. 2016, 117, 1231–1235. [Google Scholar] [CrossRef]
  34. Akaraci, S.; Feng, X.; Suesse, T.; Jalaludin, B.; Astell-Burt, T. Associations between green space, air pollution and birthweight in Sydney Metropolitan area, Australia. Urban For. Urban Green. 2022, 76, 127726. [Google Scholar] [CrossRef]
  35. Liu, F.; Zhou, F.; Zhang, K.; Wu, T.; Pan, M.; Wang, X.; Tong, J.; Chen, Z.; Xiang, H. Effects of air pollution and residential greenness on sleep disorder: A 8-year nationwide cohort study. Environ. Res. 2023, 220, 115177. [Google Scholar] [CrossRef]
  36. Kumar, P.; Druckman, A.; Gallagher, J.; Gatersleben, B.; Allison, S.; Eisenman, T.S.; Hoang, U.; Hama, S.; Tiwari, A.; Sharma, A.; et al. The nexus between air pollution, green infrastructure and human health. Environ. Int. 2019, 133 Pt A, 105181. [Google Scholar] [CrossRef]
  37. United Nations. The 2030 Agenda for Sustainable Development. Available online: https://sdgs.un.org/2030agenda (accessed on 1 February 2023).
  38. European Commission. Official Journal of the European Communities. Council Directive 1999/30/EC. Available online: https://eur-lex.europa.eu/legal-content/EN/TXT/PDF/?uri=CELEX:31999L0030&from=IT (accessed on 1 February 2023).
  39. Lorenzo-Sàez, E.; Lerma-Arce, V.; Coll-Aliaga, E.; Oliver-Villanueva, J. Contribution of green urban areas to the achievement of SDGs. Case study in Valencia (Spain). Ecol. Indic. 2021, 131, 108246. [Google Scholar] [CrossRef]
  40. Zhai, H.; Yao, J.; Wang, G.; Tang, X. Study of Effect of Vegetation on Reducing Atmospheric Pollution Particles. Remote Sens. 2022, 14, 1255. [Google Scholar] [CrossRef]
  41. Rafael, S.; Vincente, B.; Rodrigues, V.; Miranda, A.I.; Borrego, C.; Lopes, M. Impact of green infrastructures on aerodynamic flow and air quality in Porto’s urban area. Atmos. Environ. 2018, 190, 317–330. [Google Scholar] [CrossRef]
  42. Tomson, M.; Kumar, P.; Barwise, Y.; Perez, P.; Forehead, H.; French, K.; Morawska, L.; Watts, J.F. Green infrastructure for air quality improvement in street canyons. Environ. Int. 2021, 146, 106288. [Google Scholar] [CrossRef] [PubMed]
  43. Barwise, Y.; Kumar, P. Designing vegetation barriers for urban air pollution abatement: A practical review for appropriate plant species selection. Clim. Atmos. Sci. 2020, 3, 12. [Google Scholar] [CrossRef] [Green Version]
  44. Yao, Y.; Wang, Y.; Ni, Z.; Chen, S.; Xia, B. Improving air quality in Guangzhou with urban green infrastructure planning: An i-Tree Eco model study. J. Clean. Prod. 2022, 369, 133372. [Google Scholar] [CrossRef]
  45. Baraldi, R.; Chieco, C.; Neri, L.; Facini, O.; Rapparini, F.; Morrone, L.; Rotondi, A.; Carriero, G. An integrated study on air mitigation potential of urban vegetation: From a multi-trait approach to modeling. Urban For. Urban Green. 2019, 41, 127–138. [Google Scholar] [CrossRef]
  46. Mo, L.; Ma, Z.; Xu, Y.; Sun, F.; Lun, X.; Liu, X.; Chen, J.; Yu, X. Assessing the capacity of plant species to accumulate particulate matter in Beijing, China. PLoS ONE 2015, 10, 0140664. [Google Scholar] [CrossRef]
  47. European Environment Agency. European Union Emission Inventory Report 1990–2020 under the UNECE Air Convention; Publications Office of the European Union: Luxembourg, 2022. [Google Scholar]
  48. Anenberg, S.; Miller, J.; Henze, D.; Minjares, R. A Global Snapshot of the Air Pollution-Related Health Impacts of Transportation Sector Emissions in 2010 and 2015; International Council on Clean Transportation (ICCT): Washington, DC, USA, 2019. [Google Scholar]
  49. Maher, B.; Ahmed, I.; Davison, B.; Karloukovski, V.; Clarke, R. Impact of Roadside Tree Lines on Indoor Concentrations of Traffic-Derived Particulate Matter. Environ. Sci. Technol. 2013, 47, 13737–13744. [Google Scholar] [CrossRef]
  50. Open Street Maps. Available online: https://www.geofabrik.de/ (accessed on 1 February 2023).
  51. Google Maps Platform. Traffic Layer. Available online: https://developers.google.com/maps/documentation/javascript/examples/layer-traffic (accessed on 1 February 2023).
  52. Wackernagel, M.; Rees, W.E. Our Ecological Footprint: Reducing Human Impact on the Earth New Society; New Society Publisher: Philadelphia, PA, USA, 1996. [Google Scholar]
  53. Wackernagel, M.; Onisto, L.; Linares, A.C.; Falfán, I.S.L.; García, J.M.; Guerrero, A.I.S.; Guerrero, M.G.S. Ecological Footprints of Nations: How Much Nature Do They Use? How Much Nature Do They Have? Commissioned by the Earth Council for the Rio+5 Forum; International Council for Local Environmental Initiatives: Toronto, ON, Canada, 1997. [Google Scholar]
  54. Menconi, M.E.; Stella, G.; Grohmann, D. Revisiting global food production and consumption patterns by developing resilient food systems for local communities. Land Use Policy 2022, 119, 106210. [Google Scholar] [CrossRef]
  55. Stella, G.; Coli, R.; Maurizi, A.; Famiani, F.; Castellini, C.; Pauselli, M.; Tosti, G.; Menconi, M.E. Towards a National Food Sovereignty Plan: Application of a new Decision Support System for food planning and governance. Land Use Policy 2019, 89, 104216. [Google Scholar] [CrossRef]
  56. Bermùdez, M.d.C.R.; Chakraborty, R.; Cameron, R.W.; Inkson, B.J.; Val Martin, M. A Practical Green Infrastructure Intervention to Mitigate Air Pollution in UK School Playground. Sustainability 2022, 15, 1075. [Google Scholar] [CrossRef]
  57. Menconi, M.E.; Sipone, A.; Grohmann, D. Complex Systems Thinking Approach to Urban Greenery to Provide Community-Tailored Solutions and Enhance the Provision of Cultural Ecosystem Services. Sustainability 2021, 13, 11787. [Google Scholar] [CrossRef]
  58. QGIS. A Free and Open Source Geographic Information System. Available online: https://www.qgis.org/en/site/ (accessed on 1 February 2023).
  59. Hao, Y.; Deng, S.; Yang, Y.; Song, W.; Tong, H.; Qiu, Z. Chemical composition of Particulate Matter from Traffic Emissions in a Road Tunnel in Xi’an, China. Aerosol Air Qual. Res. 2019, 19, 234–246. [Google Scholar] [CrossRef]
  60. Wang, Y.; Li, J.; Cheng, X.; Lun, X.; Sun, D.; Wang, X. Estimation of PM10 in the traffic-related atmosphere for three road types in Beijing and Guangzhou, China. J. Environ. Sci. 2014, 26, 197–204. [Google Scholar] [CrossRef]
  61. Amato, F.; Karanasiou, A.; Moreno, T.; Alastuey, A.; Orza, J.A.G.; Lumbreras, J.; Borge, R.; Boldo, E.; Linares, C.; Querol, X. Emission factors from road dust resuspension in a Mediterranean freeway. Atmos. Environ. 2012, 61, 580–587. [Google Scholar] [CrossRef] [Green Version]
  62. Municipality of Perugia. Municipal Census of Urban Green Areas (Portale Ambiente). Available online: http://ambiente.comune.perugia.it/Home/Dettaglio/ee2e388f-eefb-4a6d-b63a-115889c0dd19 (accessed on 1 February 2023).
  63. Nowak, J.; Crane, D.E. The Urban Forest Effects (UFORE) Model: Quantifying Urban Forest Structure and Functions. In Integrated Tools for Natural Resources Inventories in the 21st Century: Proceedings of the IUFRO Conference; Hansen, M., Burk, T., Eds.; U.S. Department of Agriculture, Forest Service, North Central Forest Experiment Station: St. Paul, MN, USA, 2000; pp. 714–720. [Google Scholar]
  64. Nowak, D.J. Understanding i-Tree: Summary of Programs and Methods; General Technical Reports NRS-200; Department of Agriculture, Forest Service, Northern Research Station: Madison, WI, USA, 2020; 100p. [Google Scholar]
  65. Shan, J.; Huang, Z.; Chen, S.; Li, Y.; Ji, W. Green Space Planning and Landscape Sustainable Design in Smart Cities Considering Public Green Space Demands of Different Formats. Complexity 2021, 2021, e5086636. [Google Scholar] [CrossRef]
  66. Bhardwaj, P.; Pandey, A.K.; Kumar, K.; Jain, V.K. Seasonal variability of aerosols and their characteristics in urban and rural locations Delhi-NCR. SPIE Remote Sens. Technol. Appl. Urban Environ. 2017, 2, 1043109. [Google Scholar]
  67. Leone, A.; Grassini, L.; Balena, P. Urban Planning and Sustainable Storm Water Management: Gaps and Potential for Integration for Climate Adaptation Strategies. Sustainability 2022, 14, 16870. [Google Scholar] [CrossRef]
  68. Acosta, M.; Vahdatikhaki, F.; Santos, J.; Hammad, A.; Dorée, A.G. How to bring UHI to the urban planning table? A data-driven modeling approach. Sustain. Cities Soc. 2021, 71, 102948. [Google Scholar] [CrossRef]
  69. European Environment Agency. Italy—Air Pollution Country Fact Sheet. Available online: https://www.eea.europa.eu/themes/air/country-fact-sheets/2022-country-fact-sheets/italy-air-pollution-country (accessed on 1 February 2023).
  70. Environmental Regional Agency of Umbria Region. Available online: https://www.arpa.umbria.it/monitoraggi/aria/pm10.aspx (accessed on 1 February 2023).
  71. Jiang, W.; Gao, W.; Gao, X.; Ma, M.; Zhou, M.; Du, K.; Ma, X. Spatio-temporal heterogeneity of air pollution and its key influencing factors in the Yellow River Economic Belt of China from 2014 to 2019. J. Environ. Manag. 2021, 296, 12. [Google Scholar] [CrossRef] [PubMed]
  72. Hofman, J.; Bartholomeus, H.; Janssen, S.; Calders, K.; Wuyts, K.; Van Wittenberghe, S.; Samson, R. Influence of tree crown characteristics on the local PM10 distribution inside an urban street canyon in Antwerp (Belgium): A model and experimental approach. Urban For. Urban Green. 2016, 20, 265–276. [Google Scholar] [CrossRef]
  73. Xue, F.; Li, X. The impact of roadside trees on traffic released PM10 in urban street canyon: Aerodynamic and deposition effects. Sustain. Cities Soc. 2017, 30, 195–204. [Google Scholar] [CrossRef]
  74. Italian Ministry of Ecological Transition. L. 10/2013. Available online: https://www.mite.gov.it/sites/default/files/archivio/normativa/legge_14_01_2013_10.pdf (accessed on 1 February 2023).
  75. Italian Official Gazette. D.M. 63/2020. Available online: https://www.mite.gov.it/sites/default/files/archivio/allegati/GPP/2020/guri_dm_63_del_2020_verde_002.pdf (accessed on 1 February 2023).
  76. Paull, N.J.; Krix, D.; Irga, P.J.; Torpy, F.R. Green wall plant tolerance to ambient urban air pollution. Urban For. Urban Green. 2021, 63, 127201. [Google Scholar] [CrossRef]
  77. Neinhuis, C.; Barthlott, W. Seasonal Changes of Leaf Surface Contamination in Beech, Oak, and Ginkgo in Relation to Leaf Micromorphology and Wettability. New Phytol. 1998, 138, 91–98. [Google Scholar] [CrossRef]
  78. Łukowski, A.; Popek, R.; Karolewski, P. Particulate Matter on Foliage of Betula Pendula, Quercus Robur, and Tilia Cordata: Deposition and Ecophysiology. Environ. Sci. Pollut. Res. 2020, 27, 10296–10307. [Google Scholar] [CrossRef] [Green Version]
  79. Paoletti, E.; Bardelli, T.; Giovannini, G.; Pecchioli, L. Air Quality Impact of an Urban Park over Time. Procedia Environ. Sci. 2011, 4, 10–16. [Google Scholar] [CrossRef] [Green Version]
  80. Steinparzer, M.; Haluza, D.; Godbold, D.L. Integrating Tree Species Identity and Diversity in Particulate Matter Adsorption. Forests 2022, 13, 48. [Google Scholar] [CrossRef]
  81. Vigevani, I.; Corsini, D.; Mori, J.; Pasquinelli, A.; Gibin, M.; Comin, S.; Szwałko, P.; Cagnolati, E.; Ferrini, F.; Fini, A. Particulate Pollution Capture by Seventeen Woody Species Growing in Parks or along Roads in Two European Cities. Sustainability 2022, 14, 1113. [Google Scholar] [CrossRef]
  82. He, C.; Qiu, K.; Pott, R. Reduction of Urban Traffic-Related Particulate Matter-Leaf Trait Matters. Environ. Sci. Pollut. Res. Int. 2020, 27, 5825–5844. [Google Scholar] [CrossRef] [PubMed]
  83. Werbin, Z.R.; Heidari, L.; Buckley, S.; Brochu, P.; Butler, L.J.; Connolly, C.; Houttuijn Bloemendaal, L.; McCabe, T.D.; Miller, T.K.; Hutyra, L.R. A tree-planting decision support tool for urban heat mitigation. PLoS ONE 2020, 15, e0224959. [Google Scholar] [CrossRef] [PubMed]
  84. Ahn, J.-W.; Dinh, T.-V.; Park, S.-Y.; Choi, I.-Y.; Park, C.-R.; Son, Y.-S. Characteristics of biogenic volatile organic compounds emitted from major species of street trees and urban forests. Atmos. Pollut. Res. 2022, 13, 101470. [Google Scholar] [CrossRef]
  85. Padhy, P.K.; Varshney, C.K. Emission of volatile organic compounds (VOC) from tropical plant species in India. Chemosphere 2005, 59, 1643–1653. [Google Scholar] [CrossRef] [PubMed]
  86. Kashyap, P.; Kumar, A.; Kumar, P.R.; Kumar, K. Biogenic and anthropogenic isoprene emissions in the subtropical urban atmosphere of Delhi. Atmos. Pollut. Res. 2019, 10, 1691–1698. [Google Scholar] [CrossRef]
  87. Dominguez-Taylor, P.; Ruiz-Suarez, L.G.; Rosas-Perez, I.; Hernández-Solis, J.M.; Steinbrecher, R. Monoterpene and isoprene emissions from typical tree species in forests around Mexico City. Atmos. Environ. 2007, 41, 2780–2790. [Google Scholar] [CrossRef]
  88. Ciccioli, P.; Silibello, C.; Finardi, S.; Pepe, N.; Ciccioli, P.; Rapparini, F.; Neri, L.; Fares, S.; Brilli, F.; Mircea, M.; et al. The potential impact of biogenic volatile organic compounds (BVOCs) from terrestrial vegetation on a Mediterranean area using two different emission models. Agric. For. Meteorol. 2023, 328, 109255. [Google Scholar] [CrossRef]
  89. Geron, C.; Harley, P.; Guenther, A. Isoprene emission capacity for US tree species. Atmos. Environ. 2001, 35, 3341–3352. [Google Scholar] [CrossRef] [Green Version]
  90. Pandey, A.K.; Rawal, R.S.; Gairola, S.; Bhatt, I.D.; Kumar, R.P.; Priyadarshini, N.; Kumar, A. Protection from anthropogenic disturbances contributed to the recovery of vegetation in the Kumaon Himalaya: A casa Study. Int. J. Geol. Earth Environ. Sci. 2017, 7, 39–50. [Google Scholar]
  91. Hashad, K.; Gu, J.; Yang, B.; Rong, M.; Chen, E.; Ma, X.; Zhang, K.M. Designing roadside green infrastructure to mitigate traffic-related air pollution using machine learning. Sci. Total Environ. 2021, 773, 144760. [Google Scholar] [CrossRef]
  92. Nowak, D.J.; Crane, D.E.; Stevens, J.C. Air pollution removal by urban trees and shrubs in the United States. Urban For. Urban Green. 2006, 4, 115–123. [Google Scholar] [CrossRef]
Figure 1. Localization of the Municipality of Perugia, Italy (a), and its urban center (study area) (b).
Sustainability 15 05888 g001
Figure 2. The number of trees inventoried by type of urban green area, to date, in the study area. The dark green line represents the cumulative frequency in percentage.
Sustainability 15 05888 g002
Figure 3. Steps of the method for a GIS-based compensation between potential vehicular PM10 emissions and PM10 dust retention capacity of urban trees.
Sustainability 15 05888 g003
Figure 4. Main species of the tree cadastre of Perugia, covering in total 73% of the evaluated species.
Sustainability 15 05888 g004
Figure 5. Levels of potential vehicular PM10 emission due to road intersections.
Sustainability 15 05888 g005
Figure 6. Geo-Spatial Balancing for PM10 dust retention in the Urban Center of Perugia.
Sustainability 15 05888 g006
Table 1. Statistics of the biometric parameters for the inventoried trees: Diameter at Breast Height (DBH), height of the tree, height of the first branch, minimum and maximum crown width.
DBH (cm)Tree Height (m)Branch Height (m)Max Crown Width (m)Min Crown Width (m)
Mean30.311.73.06.45.4
Standard deviation20.26.42.84.03.4
mode10.012.02.06.02.0
minimum0.81.00.54.00.5
first quartile15.56.51.63.02.6
median26.011.62.36.05.0
third quartile40.215.53.69.08.0
maximum80.040.520.032.524.0
Table 2. Species having high performance in yearly PM10 retention (g tree−1 yr−1) and over 10 individuals.
MeanStandard DeviationMinimumFirst QuartileMedianThird QuartileMaximumN of Trees
Platanus hybrida Mill. ex Münchh197.69122.504.31105.44219.62289.19399.4842
Celtis australis L.175.50135.951.6342.40181.47300.77187.9546
Ulmus carpinifolia L. 176.3299.7510.12134.47166.67227.32390.0713
Pinus pinaster Aiton178.42105.6859.63107.67154.6622.89384.9327
Quercus ilex L.162.59117.174.5159.04143.90239.72407.51337
Quercus robur L.115.18108.600.7432.28118.61171.08380.6014
Tilia cordata Mill.141.1697.870.5168.10118.04238.17329.0931
Disclaimer/Publisher’s Note: The statements, opinions and data contained in all publications are solely those of the individual author(s) and contributor(s) and not of MDPI and/or the editor(s). MDPI and/or the editor(s) disclaim responsibility for any injury to people or property resulting from any ideas, methods, instructions or products referred to in the content.

