Article

Vegetation Management Cost and Maintenance Implications of Different Ground Covers at Utility-Scale Solar Sites

1
National Renewable Energy Laboratory, 15013 Denver West Parkway, Golden, CO 80401, USA
2
Centre for Land Policy and Valuations (CPSV), Universitat Politècnica de Catalunya, Campus Diagonal Sud, Edifici A, Av. Diagonal 649, 08028 Barcelona, Spain
*
Authors to whom correspondence should be addressed.
Sustainability 2023, 15(7), 5895; https://doi.org/10.3390/su15075895
Submission received: 15 February 2023 / Revised: 24 March 2023 / Accepted: 26 March 2023 / Published: 28 March 2023

Abstract

:
Utility-scale solar photovoltaics (PV) is the largest and fastest-growing sector of the solar energy market, and plays an important role in ensuring that state and local jurisdictions can meet renewable energy targets. Potential adverse environmental impacts of utility-scale solar PV are well-documented, and the effects of diverse mitigation and dual land use strategies under the banner of ’low-impact solar’ are justly receiving more attention; this article seeks to contribute to improving understanding of this topic. Capital costs for different PV configurations are well-documented; however, operation and maintenance (O&M) costs for vegetation management at low-impact utility-scale solar PV sites are not as well-understood, particularly as they compare to costs for sites that use more conventional ground cover practices, such as turfgrass or gravel. After a literature review of different vegetation strategies and O&M cost considerations, we collected data from utility-scale solar PV O&M stakeholders, including site owners/operators, O&M service providers, vegetation maintenance companies, and solar graziers, on costs and activities associated with vegetation management at low-impact, agrivoltaic, and conventional PV sites. In this paper, we perform data analysis to detail the per-activity and total O&M costs for vegetation management at PV sites with different ground covers and management practices, providing the most comprehensive and detailed assessment of PV vegetation O&M costs to date. For the 54 sites included in our analysis, we found that while the per-acre and per-kilowattdc (kWdc) costs for individual activities, such as mowing, trimming, and herbicide application at native or pollinator friendly ground covers, were lower than at turfgrass sites, the total combined vegetation O&M costs were slightly higher; this is presumably because more individual activities are required for the first 3–5 years of vegetation establishment. Qualitative results include recommendations from data providers for site and system design, and ongoing vegetation management operations.

1. Introduction

Utility-scale solar photovoltaics (PV) is the largest and fastest-growing segment of the United States and global energy markets [1]. Although the term ‘utility-scale’ is not officially associated with a precise minimum site size or electrical capacity, convention followed in the United States by industry groups and the US Department of Energy (DOE) commonly uses 1 megawattdc (MWdc) as the threshold for distinguishing smaller and commercial-scale solar from utility-scale solar [2,3]. Though some very large rooftop systems (if connected to the utility side of the customer’s meter) could technically be considered ‘utility-scale PV,’ common industry parlance associates ‘utility-scale’ with ‘ground-mounted systems’—systems that are installed directly into or on top of soil at ground level. Ground-mounted utility-scale systems are the focus of this article.
Industry trends and projections raise questions about utility-scale PV land use and availability in the coming years and decades. Several studies have been carried out on the land requirements of utility-scale PV. Ong et al. (2013) quantify land use ranges of 7.5–8.3 acres/MWdc [4]. Bolinger and Bolinger’s recent work proposes benchmarks of 2.86 acres/MWdc for fixed systems and 4.17 acres/MWdc for tracked systems, but those figures account for only the area on which the panels are located and not the overall project footprint, so inherently the figures are underestimated [5]. Cropland-integrated agrivoltaics projects have larger ranges of PV land densities, from 3.5–16.4 acres/MWdc [6,7]. The US Department of Energy’s Solar Futures Study (2021), using a multiplier of 6.6 acres per MWdc, calculated that in 2050, roughly 10.3 million acres (0.5% of the land in the contiguous United States) would be needed to accommodate solar development in the highest PV deployment scenario of 1.57 terawatt (TWdc) [1]. If a significant portion of new utility-scale PV projects were built as crop agrivoltaics in the coming decades, this number could edge closer to 1.0%, albeit with lower impacts on cropland displacement.
Although this scenario represents a small fraction of total US lands, concerns about land use changes from widespread solar deployment impacting the environment and competing with other land uses (e.g., agriculture) should be addressed. Despite the myriad economic, environmental, and public health benefits of solar generation [8], if utility-scale PV is not developed carefully, utility-scale PV installations could also have some adverse impacts on the environment and on local communities [9]. Such impacts include decreased biodiversity on previously undisturbed land through habitat damage; loss and fragmentation from vegetation removal, land grading, soil compaction, and installation of infrastructure such as fencing; soil erosion by high winds or water as a result of extensive landscape modification; and effects of other land use and land cover changes [9].

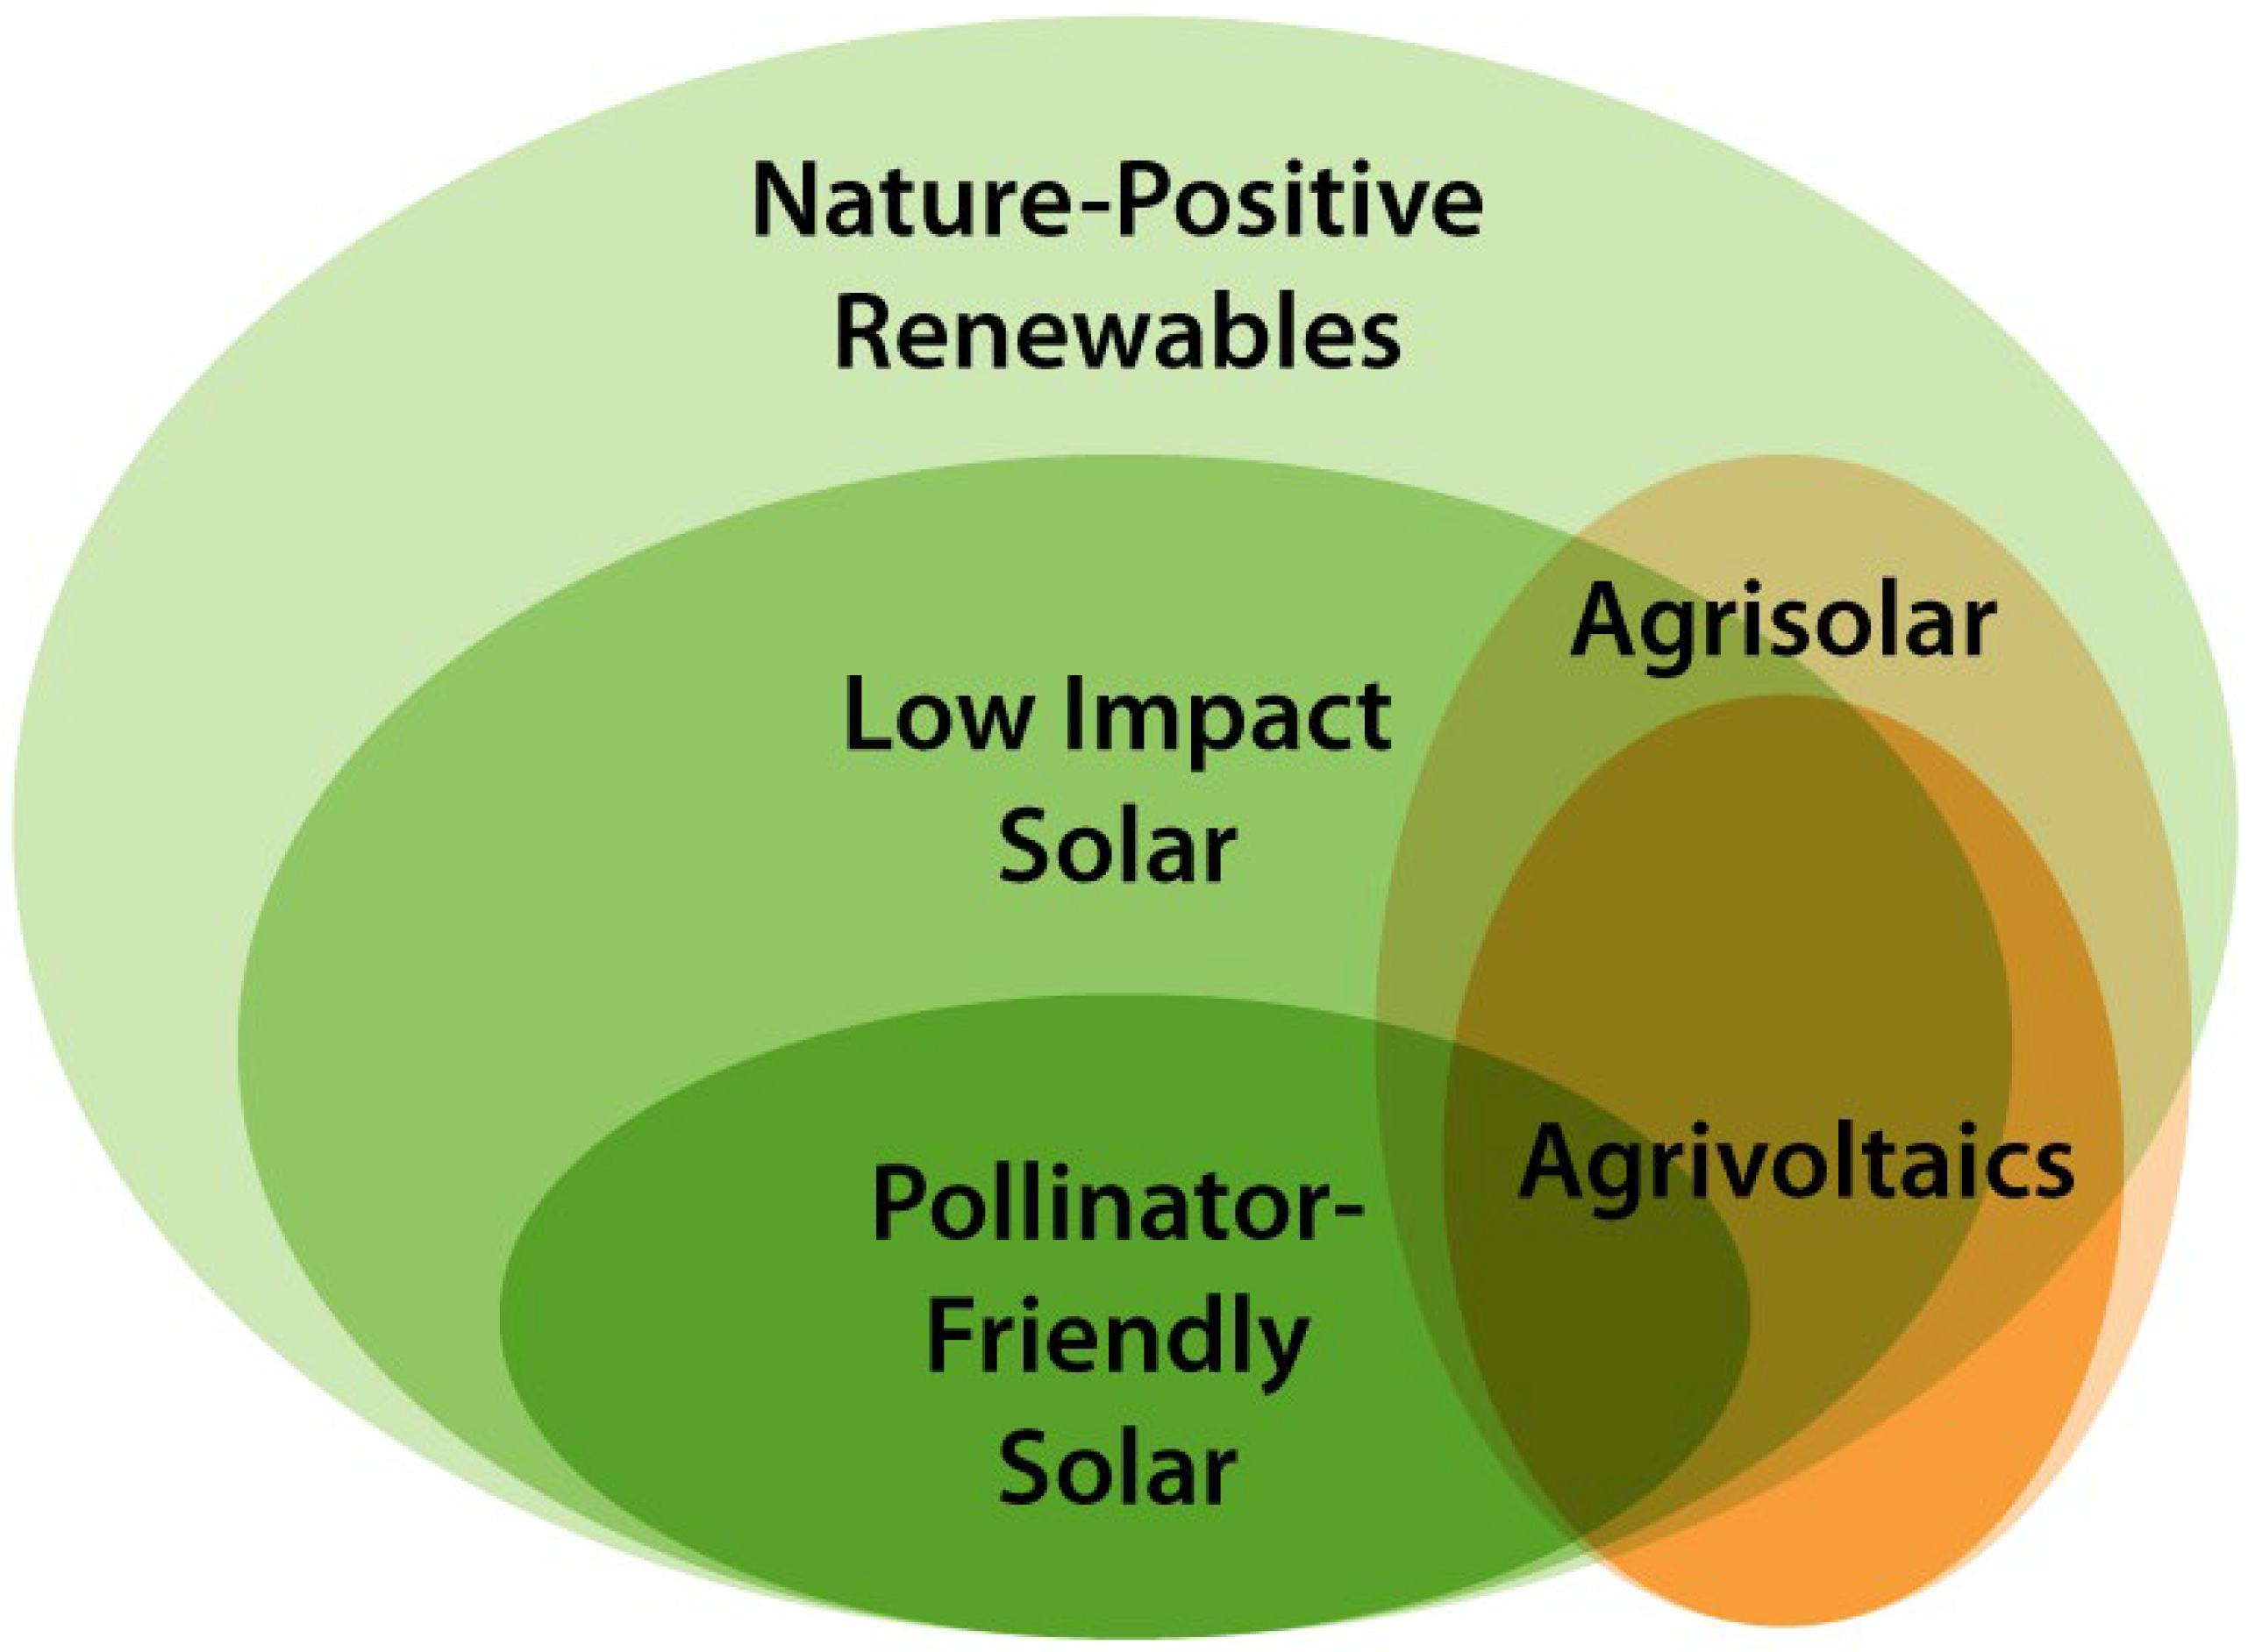
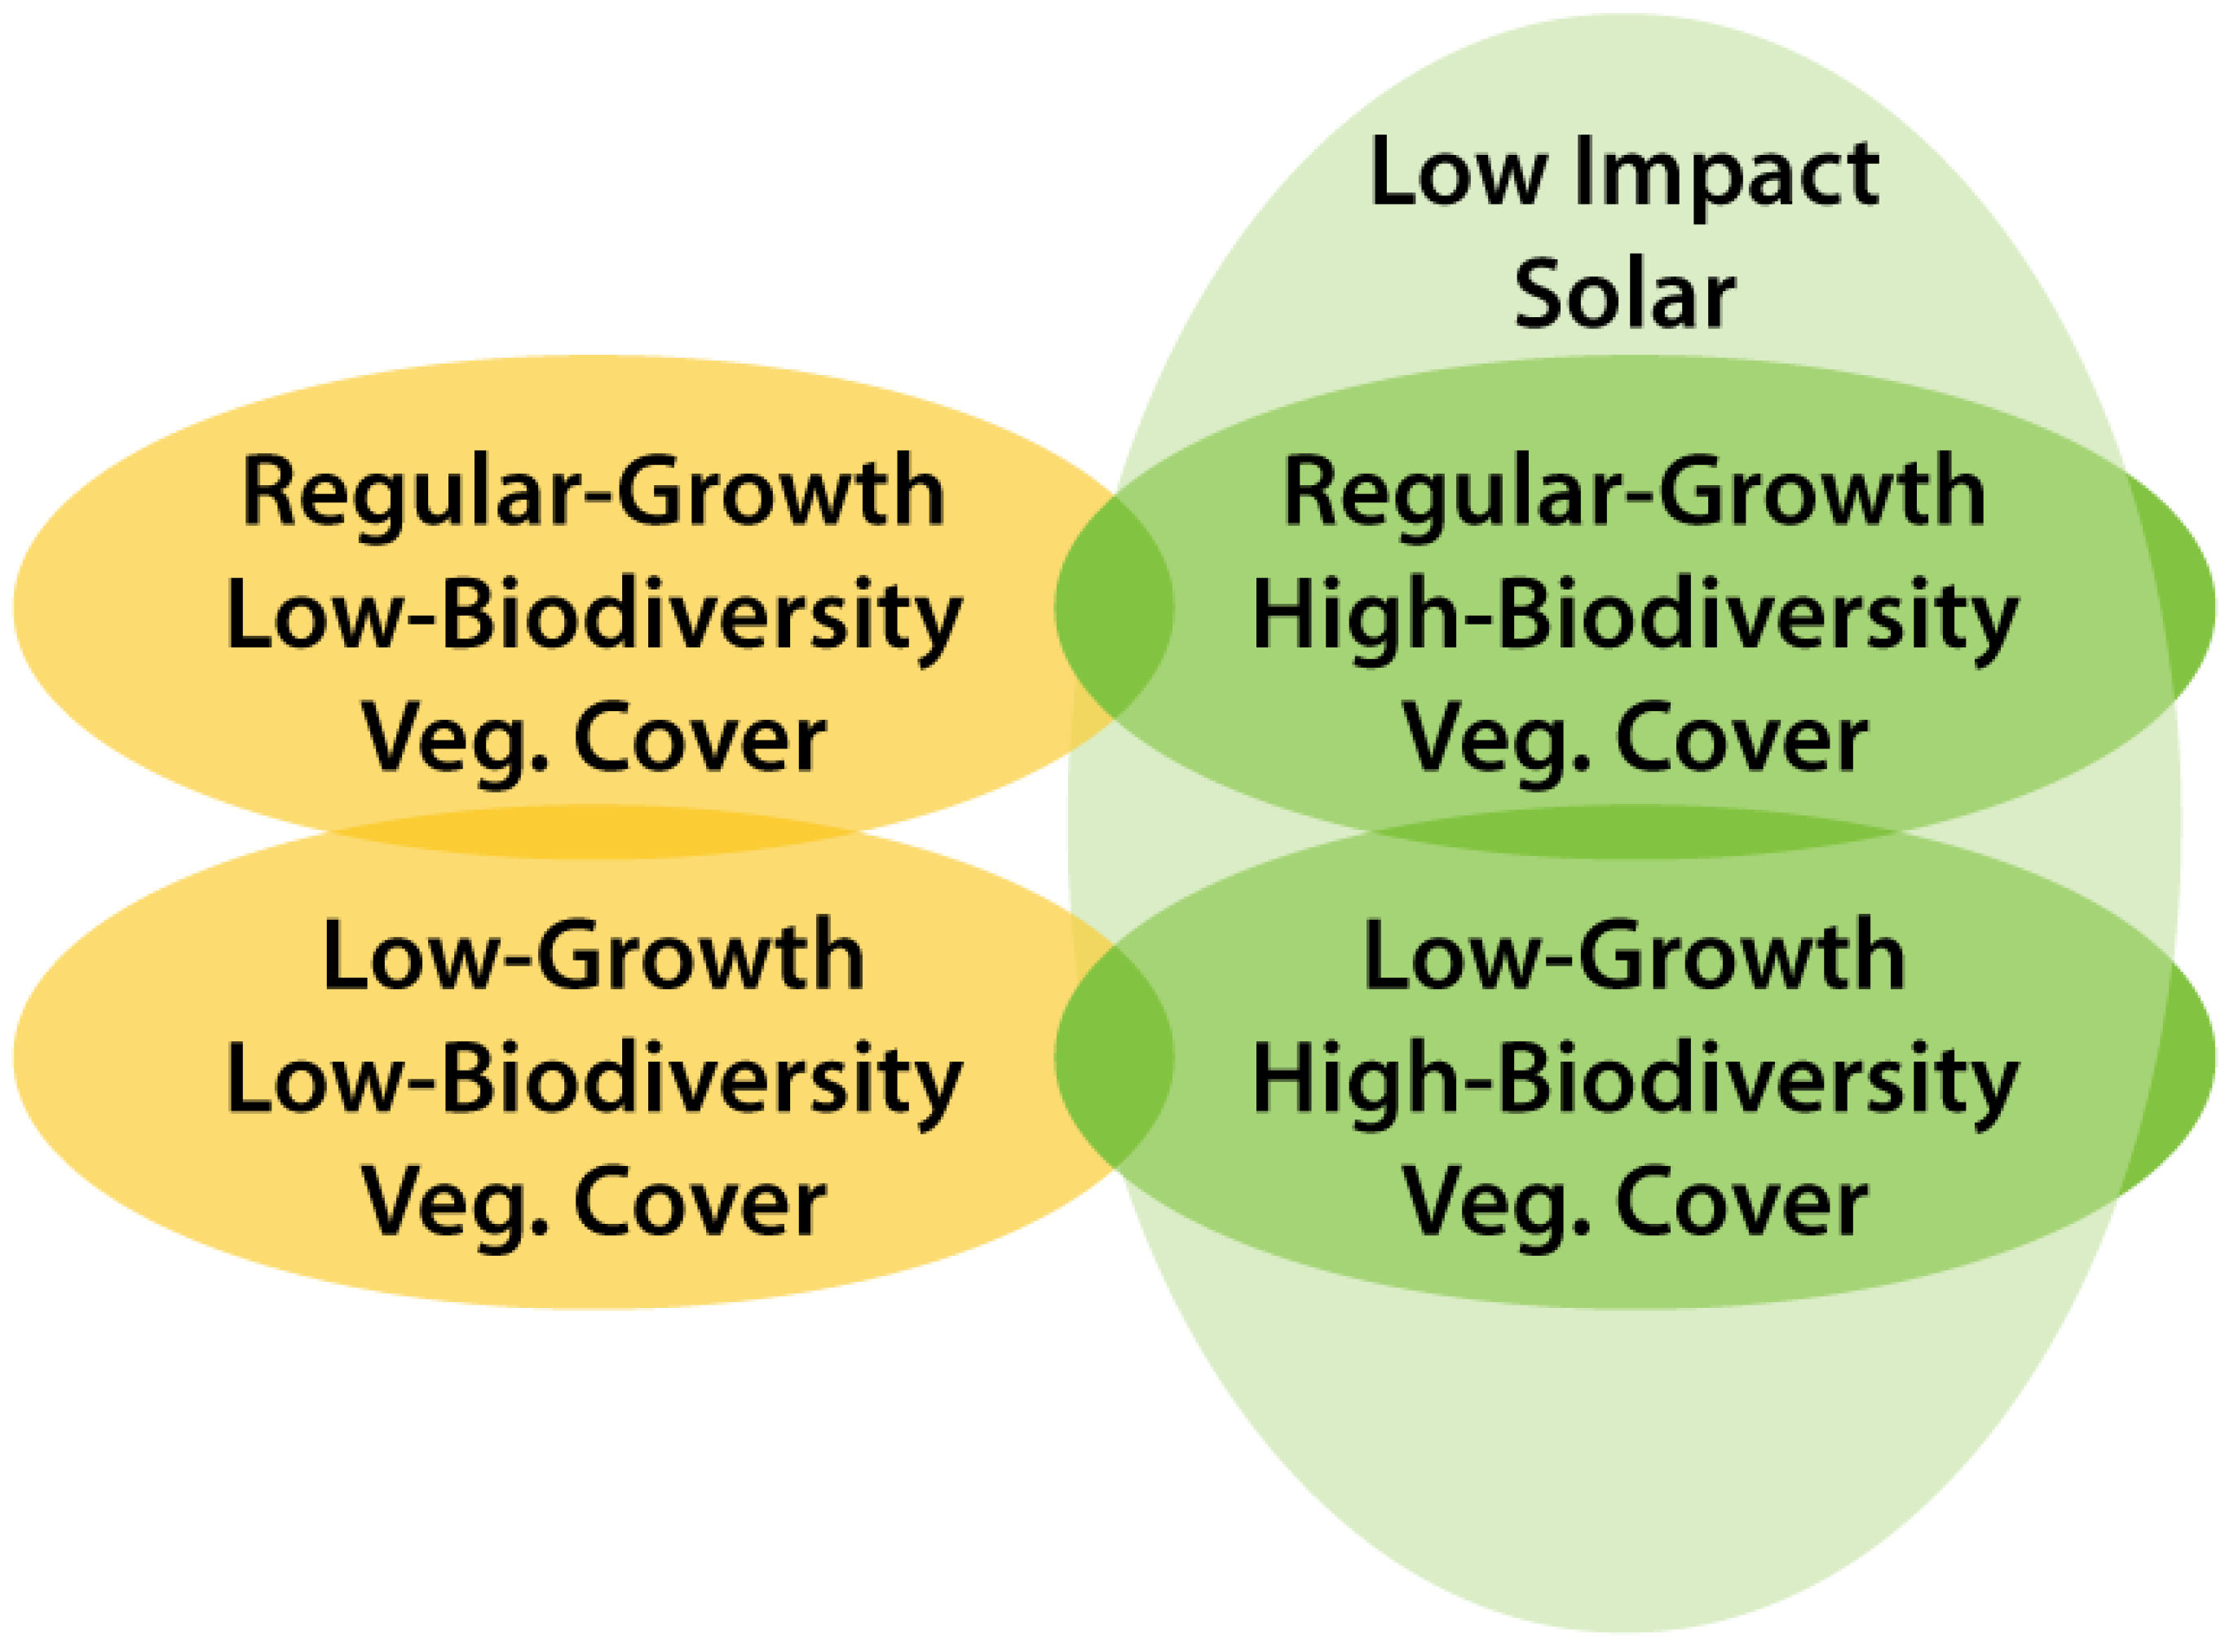
Low—Impact Solar and Related Terms

The recent proliferation of alternative land design and management practices in utility-scale solar merits a short overview. ’Low-impact solar’ represents a suite of best practices during the development, construction, and operation phases of a PV project to mitigate ecological impacts. Both NREL (2021) and the Nature Conservancy in North Carolina (2019) provide definitions of such best practices to support local fauna, flora, and water resources on utility-scale PV sites [10,11]. The US Environmental Protection Agency’s (EPA) definition of low-impact development is hydrology-focused (“systems and practices that use or mimic natural processes that result in the infiltration, evapotranspiration, or use of stormwater in order to protect water quality and associated aquatic habitat [12]).” However, publications show that low-impact practices, when applied specifically to PV projects, go beyond water resources—they emphasize the biodiversity of the soil and air, and focus on aiding pollinator populations as well as minimizing grading and soil disturbance and compaction on sites. Apart from these publications, there does not yet seem to be any legally binding quantitative set of regulations based on the term ‘low-impact solar’ by any public jurisdiction in the United States. Moreover, the term ‘ecovoltaics’ is used in a similar fashion as ‘low-impact solar’ and also merits a precise definition [13,14]. In the absence of a well-established opposite label, we use here the term ‘conventional utility-scale solar’.
The term ‘pollinator-friendly solar’ is another label popular in the United States. It is applied to PV projects that host vegetation conducive to recovering and/or maintaining robust local pollinator populations. Unlike low-impact criteria, several cases of official criteria have already been published by public entities in the United States to verify a PV site’s pollinator-friendly status, often via ‘pollinator scorecards’ [15]. Most if not all tenets of pollinator-friendly PV can be considered to fall under the umbrella of ‘low-impact solar.’ Moreover, a site may feature non-flowering native vegetation and grassland species and, therefore, be considered ‘native’ but not necessarily pollinator-friendly.
The European Environmental Bureau recently opted to officialize the term ‘nature-positive renewables,’ to encompass an even larger set of best practices than low-impact practices; these best practices extend to grid management, permitting, industrial ecology (manufacturing and recycling), and community engagement, across all renewable energy sources [16].
‘Agrivoltaics’ (also known as ‘agri-PV’) typically refers to the practice of integrating PV into farming areas that harness photosynthesis, be it for plant crops (crop agrivoltaics) or grasses for livestock to graze (grazing agrivoltaics). In Europe, agrivoltaics is closely associated with PV sites from which a saleable agricultural revenue stream exists. In contrast, in the United States and China, many formats of pollinator-friendly, low-impact, and ecovoltaic PV projects (in which no direct agricultural revenue streams exist) are also often included within agrivoltaics. Furthermore, in the United States, the term ‘dual-use solar’ is often used as a synonym for agrivoltaics [17]. ‘Agrisolar’ is a broader umbrella above agrivoltaics that includes PV installations on rooftops and other nonfarmable surfaces on agricultural properties. Combining environmentally unfriendly agricultural practices with conventional solar on a site could lead to an agrivoltaics or agrisolar project that is neither nature-positive nor low-impact; such practices are represented by the orange-striped area in the Figure 1 Venn diagram.
Although low-impact solar practices have been documented [11,18], the cost trade-offs of these practices are not well understood. One hypothesis is that low-impact solar will have higher upfront capital expenditures (CAPEX), but that these will potentially be offset by a reduction in operation and maintenance (O&M) costs over the life of the project; these long-term cost reductions originate from reduced O&M events over time, with vegetation establishment or potential increased energy yields from microclimate changes underneath the panels [19].
Our study provides an overview of the differences in O&M practices and costs associated with different ground cover types at PV sites, and seeks to add to literature by assessing individual and total vegetation O&M costs by practices at sites with different ground covers. Our cost analysis compares low-impact native vegetation management, low-impact grazing practices, and O&M costs at utility-scale solar PV facilities to conventional sites, which feature turfgrass or gravel ground cover. Along with ground cover, our analysis looks at geography, site configuration, panel height, and size of facilities to see if those are a determinant of total O&M costs. We collected data from solar industry partners and other stakeholders, and analyzed them to evaluate the economic trade-offs of various approaches to vegetation management. Our analysis is then contextualized by a review of previously reported costs for utility-scale solar PV vegetation management and gaps therein. We then discuss the utility-scale PV landscape that addresses state and local perspectives.

2. Solar PV Vegetation Management Background

Once a utility-scale solar PV facility is commissioned, ongoing activities are required to optimize financial and technical performance over its lifetime. These activities fit into the broad categories of operation (remote monitoring and control of the power plant) and maintenance (groundskeeping; equipment cleaning; and diagnosis, troubleshooting, and repair and/or replacement, as required, of equipment), collectively known as operation and maintenance (O&M). Keeping O&M costs low, while minimizing system downtime and ensuring optimal system performance, is one of the primary objectives of solar plant asset managers. Besides the core O&M activities of ensuring electromechanical functionality, vegetation management—which is often lumped into the general category of site maintenance, along with module cleaning and snow removal—is critical to prevent shading of PV arrays and interference with equipment that can reduce PV generation and impact the reliability of PV modules. Common vegetation and ground cover management strategies are introduced in this section.

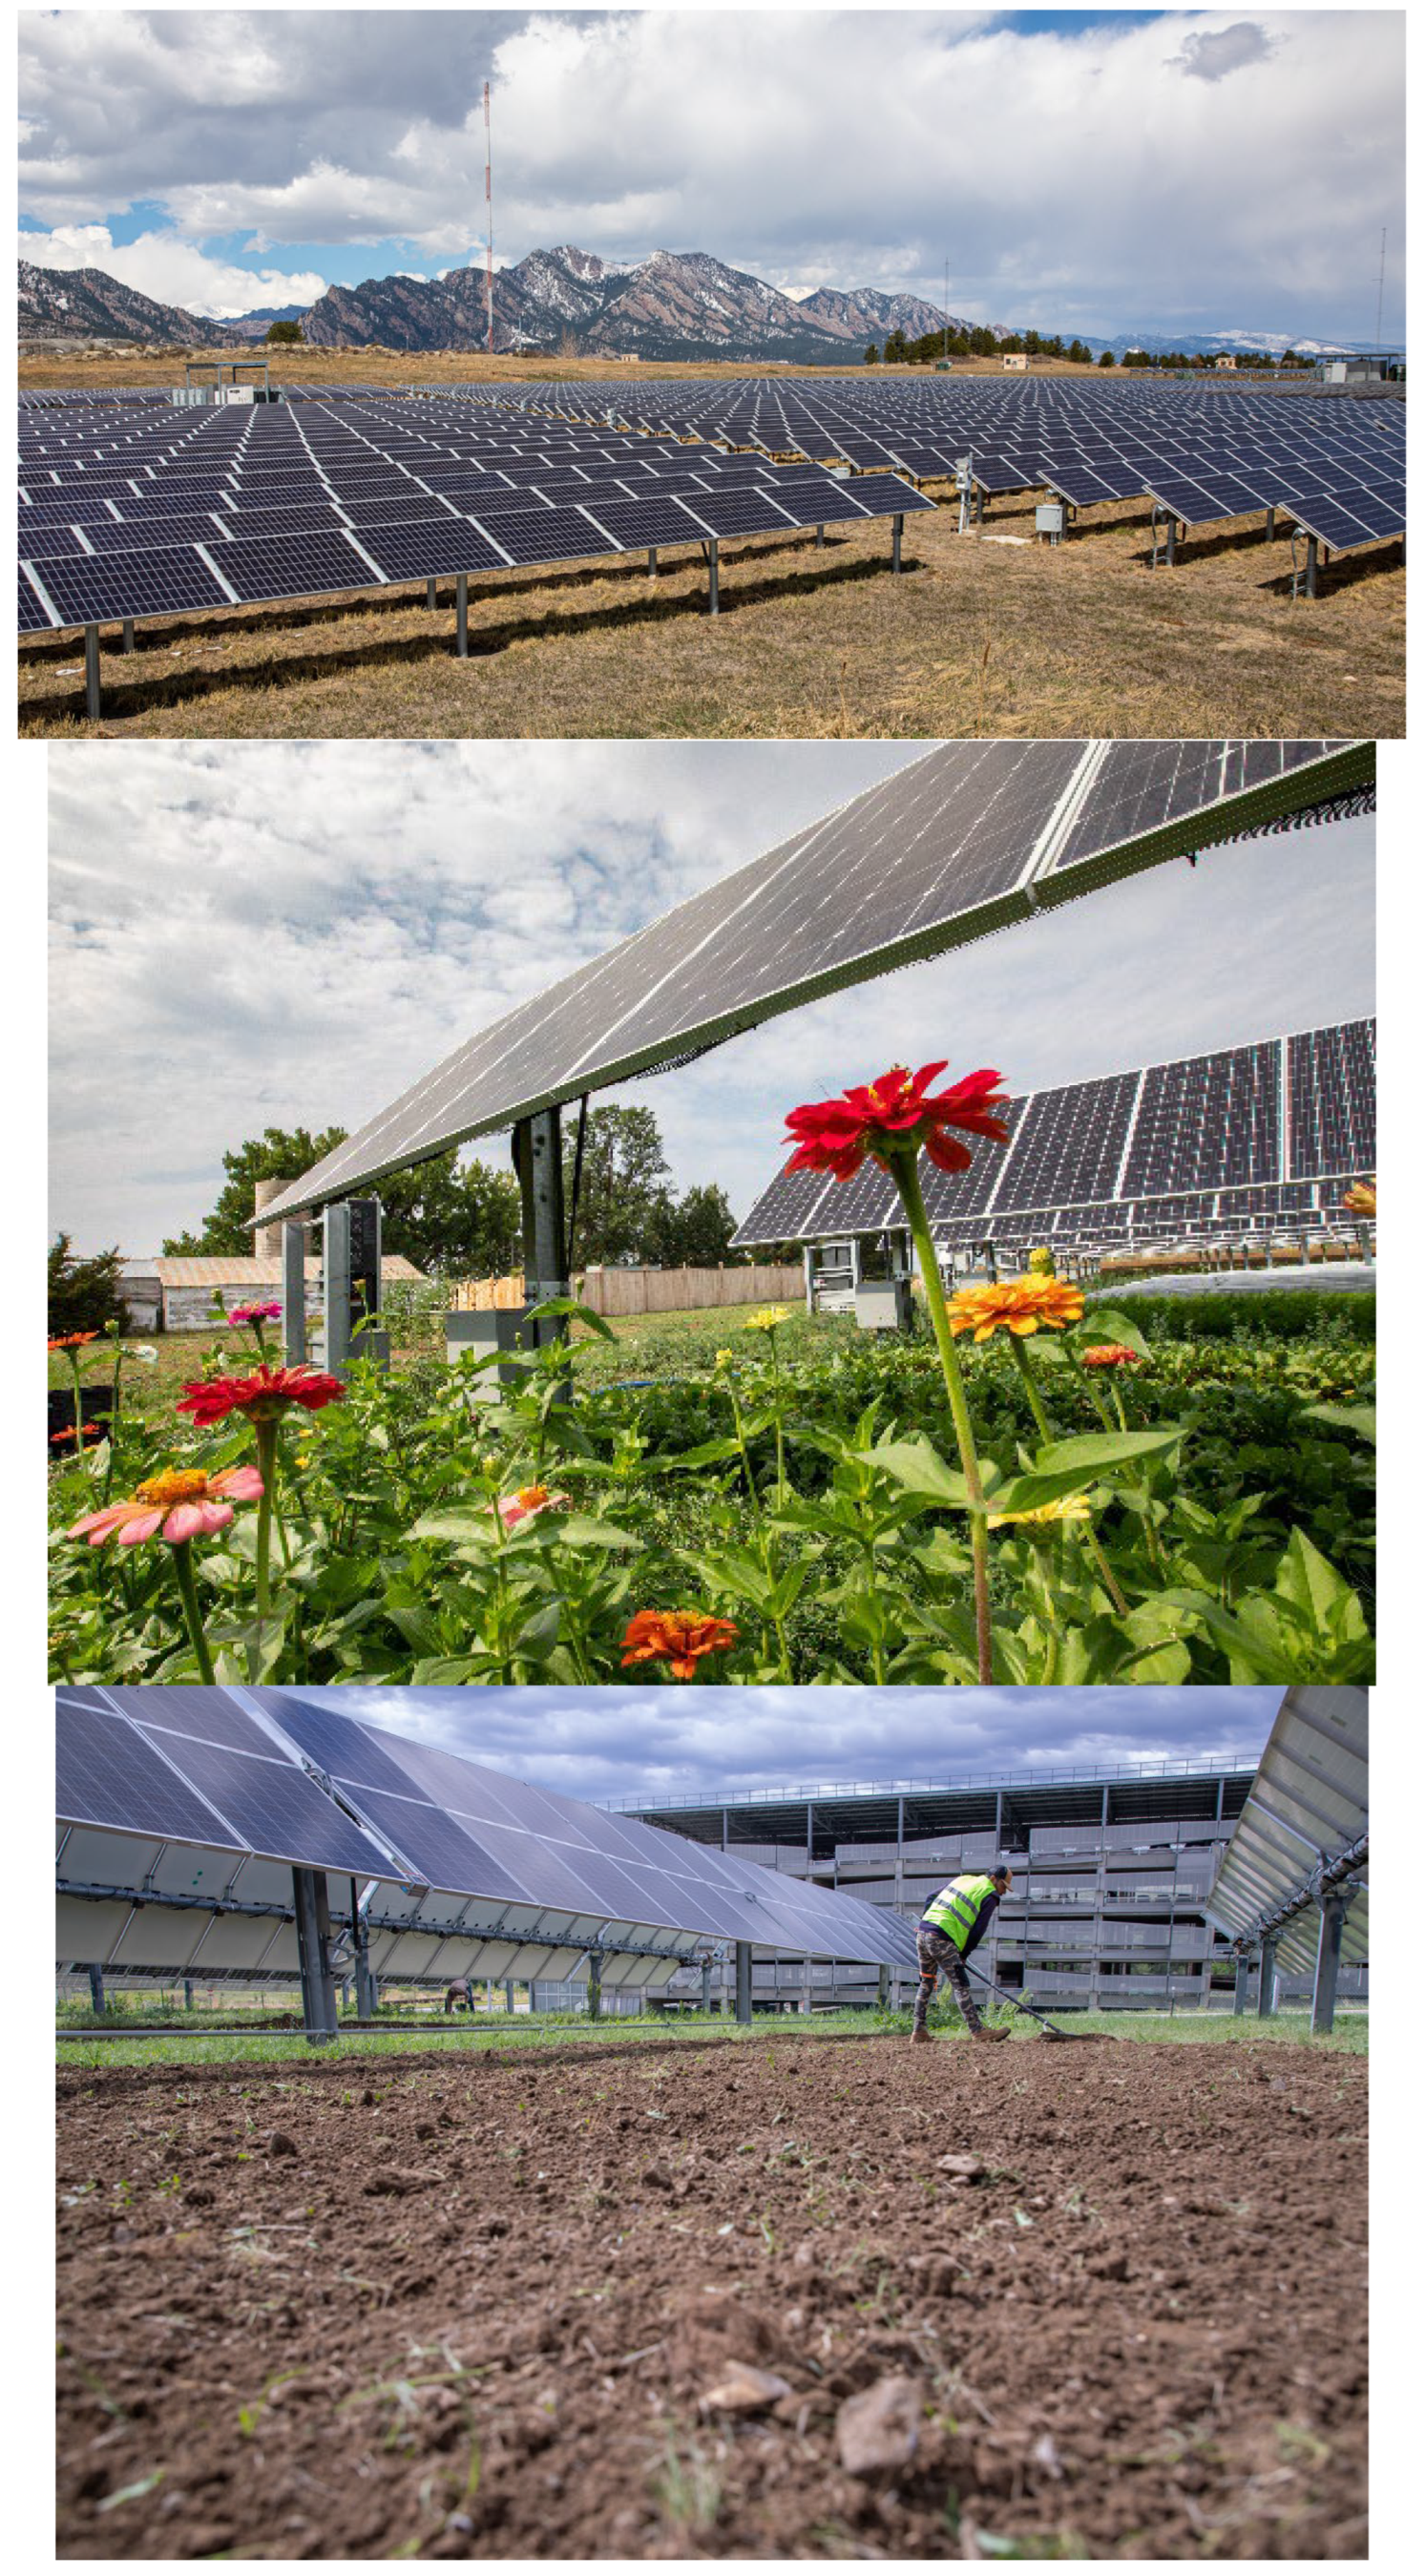
2.1. Vegetative Cover and Gravel

The most common approach to vegetation management at utility-scale PV sites in the United States is planting turfgrass. Turfgrass is planted to prevent erosion, comply with stormwater permits, and limit invasive species growth. The turfgrass is generally mowed (or grazed) at least one to three times annually, depending on solar exposure, shading, and annual rainfall. Lower-cost grass species, such as perennial turfgrass, perennial or annual ryegrass, cereal rye, winter rye, barley, oats, and millet, are used on PV sites for quick stabilization of soil disturbed during construction. For simplicity’s sake, such steady-growth, low-biodiversity vegetative cover strategies are collectively referred to as ‘turfgrass’ in this article (Figure 2).
In this paper, we contrast turfgrass with low-growth, high-biodiversity vegetative cover, which ideally involves a diverse mix of native, naturalized, and functional plants that reach low mature heights within a few years of planting, crowd out weeds, and, thus, eventually require reduced regular trimming. We refer to this vegetative cover as ‘native vegetation’ in this paper, and we categorize this ground cover in low-impact solar. Native vegetation can often incorporate low-growth forb species to establish habitat for pollinators and other beneficial insects.
Gravel—of varying particle diameters—has also been used to a lesser extent as ground cover on utility-scale PV projects, mainly in the dry, arid Western United States where vegetation establishment may present cost and establishment concerns. However, the use of gravel is becoming less common, especially on large sites. In contrast to the often-cited challenges in re-establishing vegetation following construction, gravel has been described as “quick and easy to install, though expensive” [20]. Increasingly thick gravel layers may proportionally minimize weeds and erosion, but they add to cost [21,22]. In the ground cover section of a guide to PV O&M best practices, in response to a survey of industry practices, respondents described gravel as “expensive and problematic” because “it creates uneven work surfaces, changes runoff coefficients, and does not provide a long-term weed abatement solution” [20].
Figure 2. Turf grass (top), pollinator habitat (middle), and bare ground (bottom) under solar PV systems. (top) Photo by Werner Slocum, NREL 65337, (middle) photo by Werner Slocum, NREL 65625, and (bottom) photo by Joe DelNero, NREL 68429 [23].
Sustainability 15 05895 g002

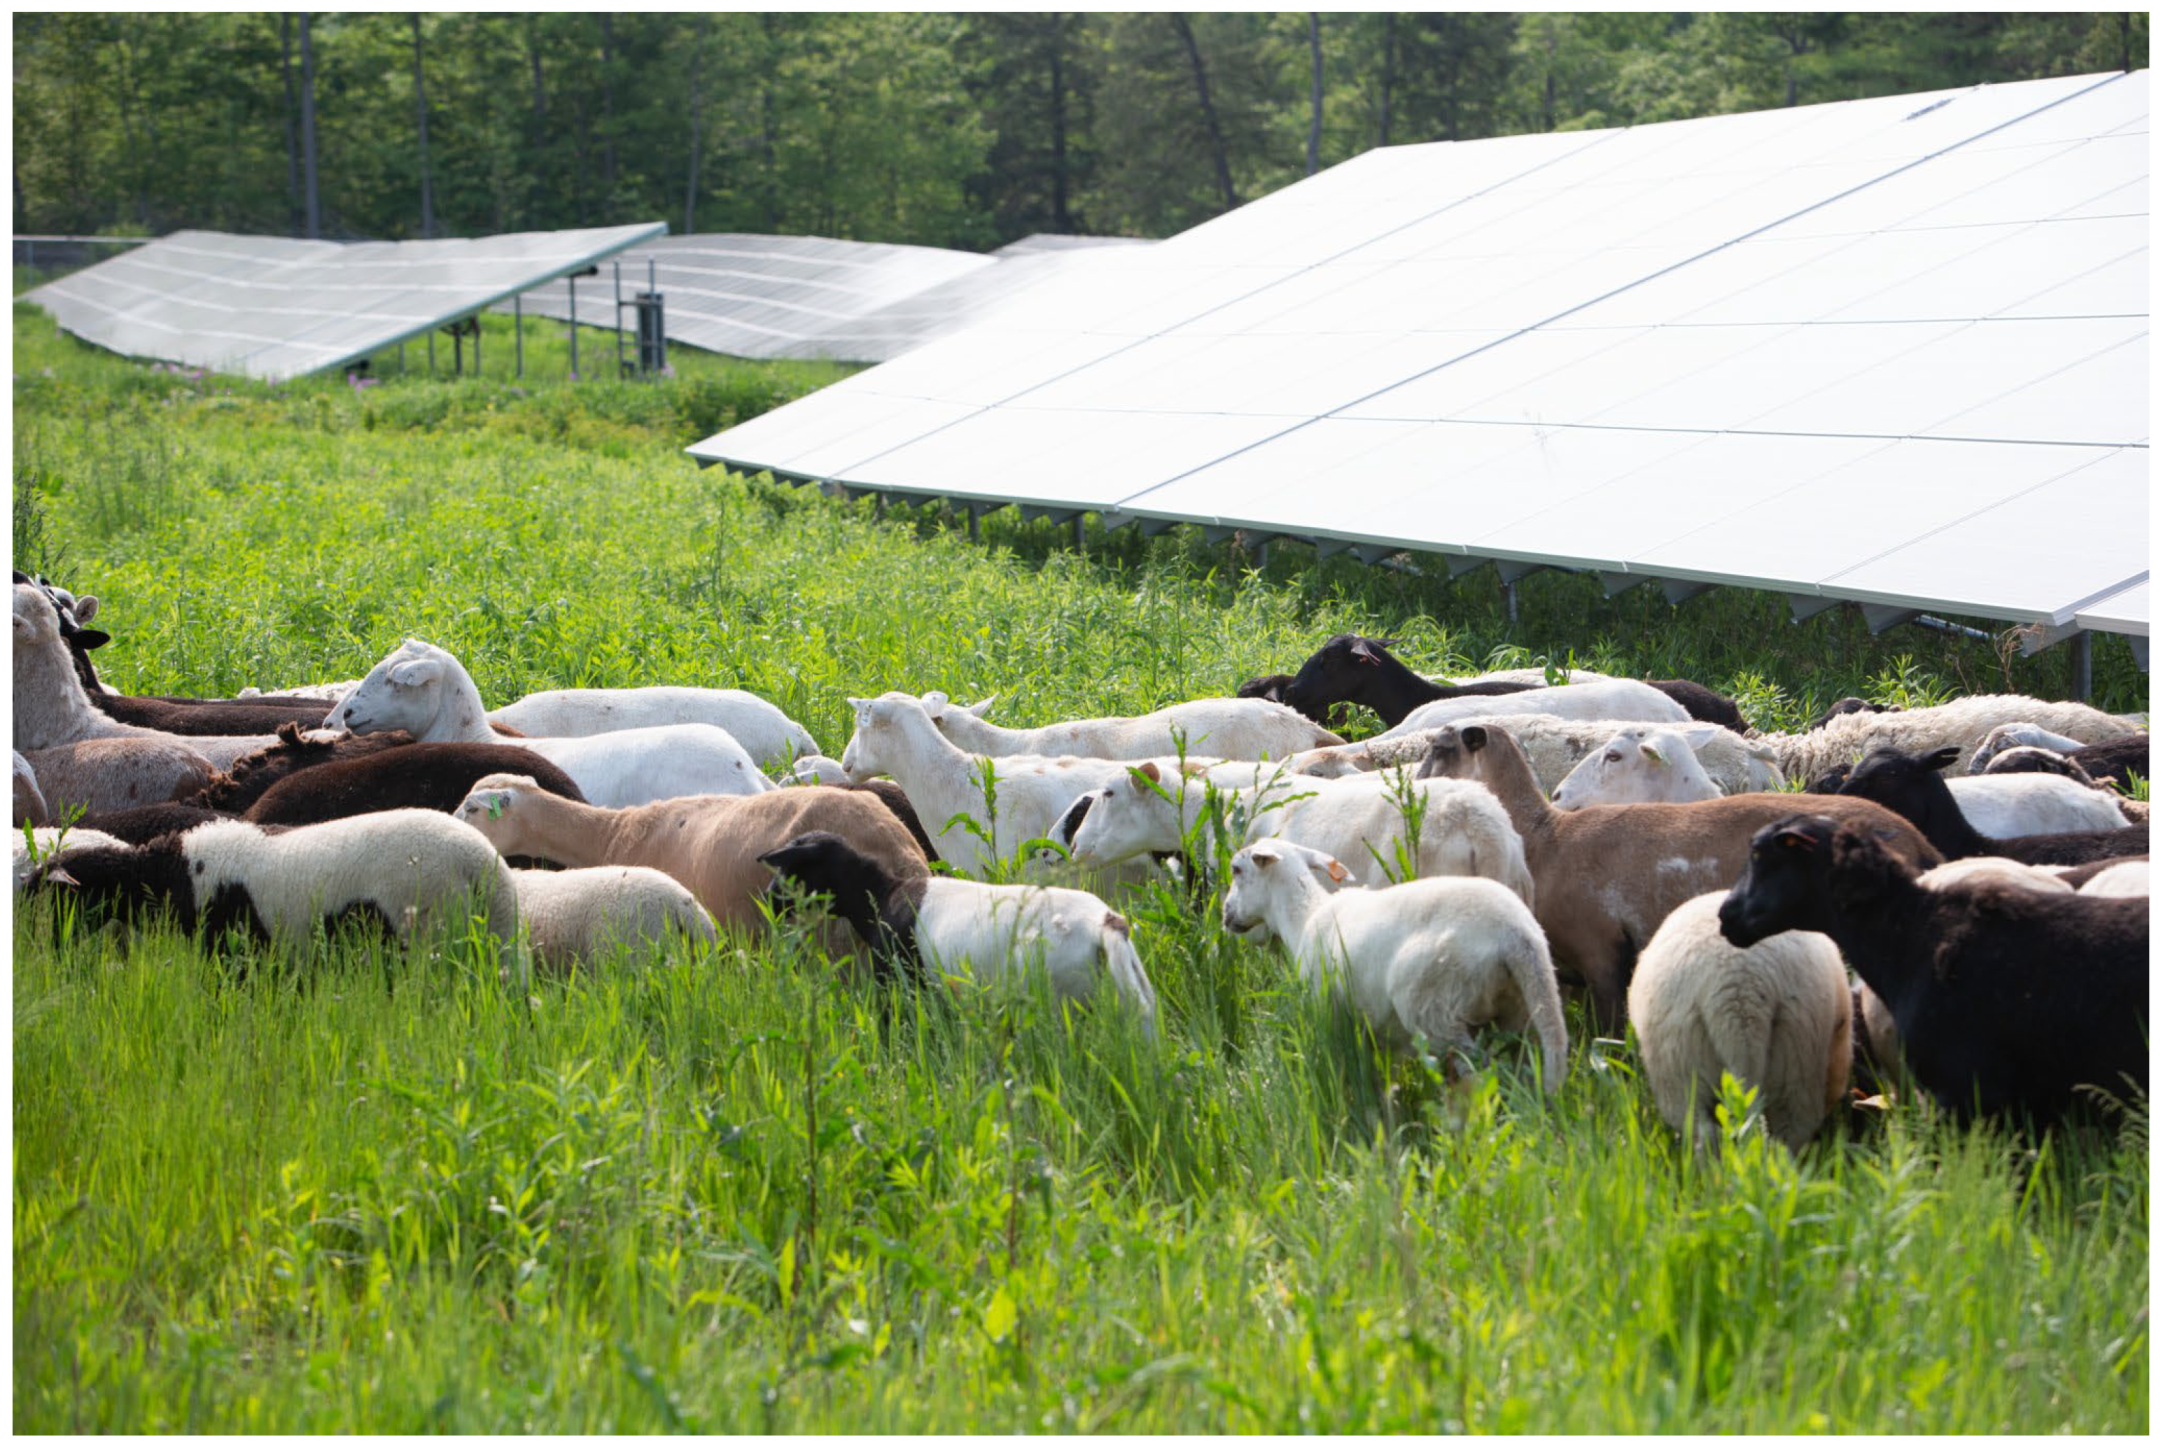
2.2. Grazing Agrivoltaics

Due to their size, demeanor, and grazing habits, sheep are a common solution for vegetation management on standard low-cost utility-scale solar PV sites. Sheep grazing for vegetation management on solar sites has gained popularity due to public interest and its minimal impact on traditional PV operations and design (Figure 3). Up from an estimated 5000 acres in 2018, sheep grazing is now carried out on “tens of thousands of acres” of PV sites in the United States [24]. Various species of grazing animals can be found on PV sites with varying vegetation types. Cattle are less commonly used, as they can require elevated panels and additional protective measures, which can be costly.
Solar grazing is typically (though not exclusively) carried out as a form of ‘target grazing,’ defined by Launchbauch and Walker as “the application of a specific kind of livestock at a determined season, duration, and intensity to accomplish defined vegetation or landscape goals” [25].
Macknick et al. [17] emphasizes that “every solar facility under consideration for grazing should develop a Prescribed Grazing Plan (PGP, or strategic grazing plan). Each PGP will create a framework for the grazing partners to follow during a solar facility’s operation, and to aid in planning. Graziers should use the PGPs to gauge their stocking rates, their timing of the graze and rest periods, the class of animals used, vegetation standards, soil conditions, and other details of the livestock management. Following the PGP, including regular forage testing, can provide a grazing partner with feedback during and in between each season. This planning and feedback steers graziers toward practices that will result in healthier plant communities and healthier soils: reducing the risk of erosion and overgrazing. PGPs should guide grazing partners to determine how much grazing versus mechanical treatment is needed at a facility, which leads to more predictable vegetation management” [17]. Prescribed grazing plans can be found on the American Solar Grazing Association’s website as well as with the USDA National Resource Conservation Service’s Pasture Condition Scoresheet. Several past studies cited in this study also provide information on prescribed grazing plans [17,22,26].

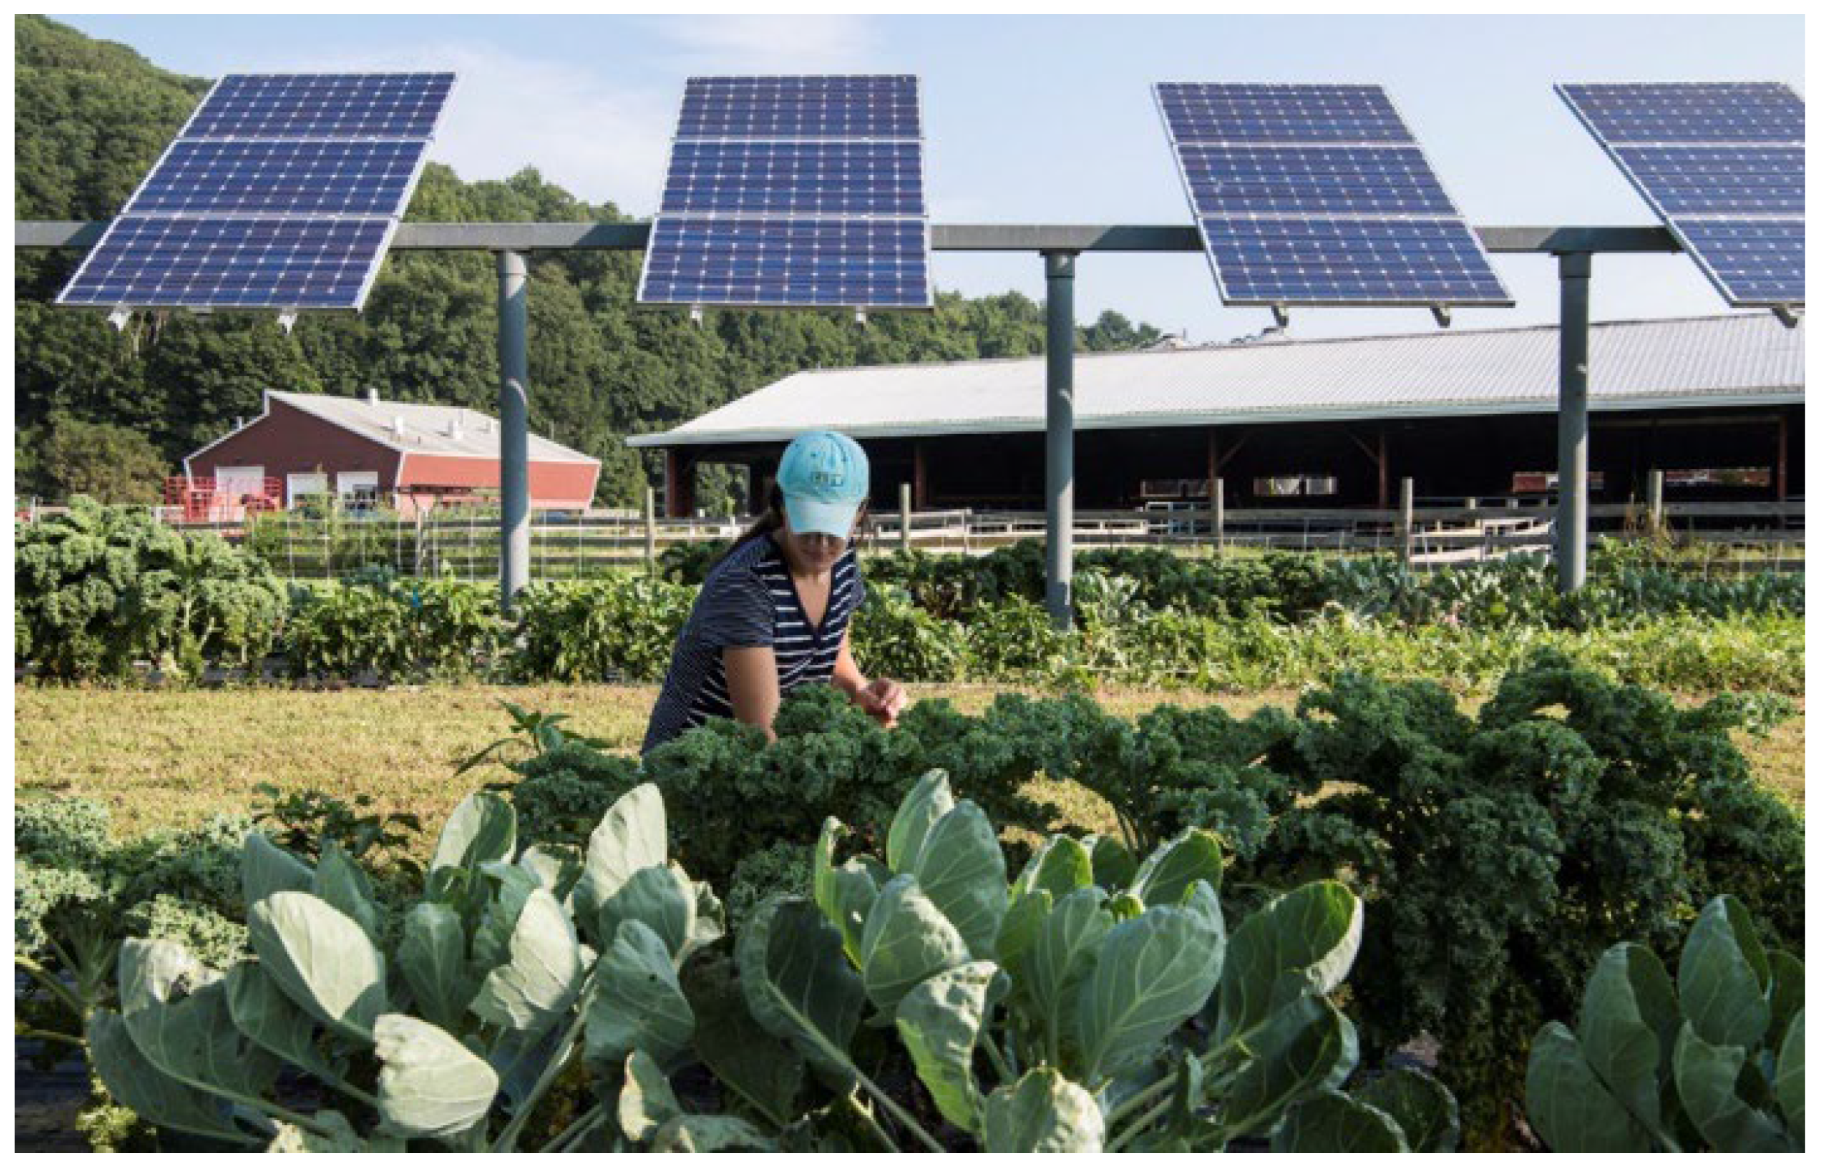
2.3. Crop Agrivoltaics

‘Crop agrivoltaics,’ in which plant crops are cultivated beneath or between PV arrays, is quickly gaining popularity around the world, with France, Italy, Germany, China, and Japan playing pioneering roles during the last decade [27]. A growing number of universities and small farms have been hosting crop agrivoltaics test sites for over a decade. Since 2018, Massachusetts’ subsidies [28] have enabled the construction of the first commercial crop agrivoltaics projects in the United States. As of the end of 2022, there are a minimum of 13 operational crop agrivoltaic sites in the U.S., with a combined capacity of roughly 10 MWdc [29]. Agrivoltaics (whether crop or grazing) can alternatively be classified by the PV mounting systems used, which are generally divided into two broad categories: elevated and inter-row. Elevated systems (typically 7 to 15 ft hub heights) require higher CAPEX investment because additional structural support is required (Figure 4); this extra cost can affect the economic viability of PV projects.
Due to a small sample size in the United States, elevated agrivoltaics and crop agrivoltaics projects were not included in the data gathered for this article; however, qualitative observations are offered later in the article. Crop compatibility with different PV mounting structures and climates, and the resulting effects on O&M budgets and overall project revenue streams, thus remain outside the scope of this report.

2.4. Literature Review—Vegetative O&M Costs

Although some past publications have reported overall O&M costs, specific quantification of the vegetation management component has been rare. Some costs reported are for mowing, vegetation management, or vegetation abatement and module cleaning only; others are for turnkey comprehensive ‘overall’ PV O&M, with various inclusions and exclusions.
Enbar et al. 2016 noted that “unearthing accurate PV O&M cost data is fraught with challenges” [30]. From interview and survey results, “[overall O&M] typically accounts for between 1 and 5% of a MW-class plant’s total lifetime expenditure,” and annual expenditures for <1-MWdc projects varied from $10/kWdc/yr to over $45/kWdc/yr. For >1-MWdc projects, the reported O&M budget range (without cost-plus items) was between $10/kWdc/yr and $25/kWdc/yr. The wide range of responses, the authors noted, was the result of various plant characteristics, business interests, more and less vigorous approaches to O&M, and contractual variation [30].
Enbar et al. 2016 also stated that the budget range for vegetation management is $0.50–$–1.80/kWdc/yr, depending on site characteristics and size (in acres) [29]. Moreover, climate was also shown to play a role, with the issue of fast-growing vegetation being more common in warm and humid locations. Regarding frequency of maintenance, pollinator sites were expected to require two visits per year in the first year—in the spring and fall—to carry out mowing and vegetation management, one visit during year two, two visits during year three, and one visit per year thereafter [31]. These frequencies, as well as initial vegetation establishment costs, varied widely based on site-specific factors, such as local climate, site characteristics, and seed mixes; however, on average, the CAPEX to establish vegetation (e.g., seeds and labor) for a 5-acre project was about $2500/acre, with the cost per acre decreasing as project size increased [31].
In response to a question about the frequency of vegetation abatement and grass or weed cutting included in maintenance services contracts, 45% of respondents across sectors in Brehaut (2015) reported that such activity is contractually required zero times per year, 18% reported one time per year, 18% reported twice each year, and 18% reported three or more times per year; these responses highlight the lack of consensus and inherent variability for these activities [32]. Though Brehaut (2015) included O&M costs reported for sites 1–50 MWdc in size, the ‘basic plan’ survey group excluded module cleaning and vegetation abatement (except those reporting the highest prices). Brehaut includes one anecdotal account of a 35-MWdc plant in Texas where weeds can grow a foot every three weeks and reach a height of several feet, and which can cost $1500/MWdc or more per mow. Another case cited is that of a 25-MWdc plant in Florida, where quarterly grass cutting is required at $1000/MWdc per mow, for an annual cost of $4000/MWdc [32]. A large range of costs for different O&M cost categories was noted. This wide range of costs was one driving factor for our research; no studies that broke out individual practices for vegetation management on solar sites existed. To address this gap, we conducted a survey of practitioners to provide a better understanding of the cost ranges and drivers for vegetation management for different ground cover types and management practices.

3. Materials and Methods

3.1. Data Collection and Analysis

From June 2019 through April 2020, data on solar PV vegetation management practices, activities, and costs were collected from solar PV owners/operators, O&M service providers, vegetation maintenance companies, and solar graziers. Participants were invited to provide data over the phone, by completing a Google form, or by entering data into a Microsoft Excel spreadsheet form and returning it by email. During initial phone calls with data providers in May and June 2019, it was determined that most providers would collect data on activities and costs from April through October of that year—the month of the year during which most participants actively manage vegetation on their sites—and provided it to the National Renewable Energy Laboratory (NREL) in November 2019. Two data providers also provided cost data from 2018.
For nine sites, both the site operator and the vegetation maintenance company reported data. For one data provider who provided both qualitative and quantitative responses, we were unable to verify the quantitative activity cost data and included only qualitative responses.
A second round of outreach. which expanded the data sets to include additional low-impact and traditional sites, was conducted in February 2020. At NREL’s request, the American Solar Grazing Association and the Solar Energy Industry Association notified their respective members by email about the opportunity to participate in the project, and those interested in participating contacted NREL by email. In total, nine organizations provided activity and cost data for 54 sites and of 78 observations (for 24 sites, data were provided for both 2018 and 2019); for one organization, only qualitative responses to questions about low-impact vegetation management practices were included in the analysis.
Data providers were asked to report which ground cover was deployed (native vegetation/pollinators, solar grazing, turfgrass, gravel, and other), the year the vegetation management practice began, the year activities were completed, and the costs incurred (See Appendix A). Three data fields specific to grazing were added: type of grazing (continuous or rotational), number of adult sheep per acre, and type of fencing inside the perimeter (permanent or temporary). For sites where one maintenance activity was ‘grazing’, the practice for that site was categorized as ‘sheep grazing’ regardless of ground cover (native vegetation or turfgrass).
For each practice, data providers were asked to report up to four associated activities and costs. For example, if the vegetation management practice listed for a given site was ‘native vegetation/pollinators,’ activities listed might include ‘mowing,’ ‘weeding,’ ‘herbicide application,’ and ‘site monitoring/vegetation assessment.’ For the practice of ‘sheep grazing,’ activities might include ‘sheep tending’ and ‘fencing.’ Although most respondents provided cost data per activity, one provided combined costs for all activities per site. Thus, for four observations regarding the practice of using ‘turfgrass,’, only the ‘total combined maintenance cost’ was provided.
For each activity, respondents indicated how often it was completed and the cost per event or year. As a basis for comparison, activity costs were converted into $/acre/year and $/kWdc/year for each activity, and the total combined cost per site. The total combined cost per site included costs for the activities provided at each site. As not all activities were completed at every site, the sum of the aggregated costs for each activity did not equal the total combined cost per site.
For the data collected, we performed initial statistical analysis of the different vegetation O&M costs by activity to discover if ground cover or management type was a determinate of total O&M costs. We then examined if different site characteristics (region, site size, hydrology, panel type, panel height, and panel spacing) had an impact on O&M costs on site. These data were then summarized to present a per activity and total O&M cost by vegetation ground cover, to inform solar site and vegetation ground cover designs.

3.2. Site Characteristics

Solar PV sites in the data set represented a diversity of regions, site sizes (acres), and hydrologic/fluviometric/climatic conditions. States where sites are located were categorized by region according to the US Department of Agriculture’s (USDA) Agricultural Research Service regions [33]. Most sites are located in the Midwest (36 sites, or 67%), followed by the Northeast (11 sites, 20%), the Southeast (four sites, 7%), and the Pacific West (three sites, 6%); none of the sites are located in the Plains region. Approximately one-third of sites in the data set are 20 acres or smaller, the middle third are 21–50 acres, and the top third of sites by size are greater than 50 acres. Twelve sites (22%) were reported to be dry, 24 (44%) were mesic, 10 (19%) were wet, and hydrology was not reported for eight (15%).
For array type, slightly more sites have fixed arrays (54%) than trackers (44%). Minimum PV array height is evenly distributed across four categories, from 18 inches or fewer up to 36 inches. Among row distance categories, the greatest number of sites (22 sites, or 41%) had a row distance of 25–28 feet, followed by 20 feet or fewer (15 sites, or 28%), and, finally, 32 feet apart (10 sites, or 13%) (Table 1, part f).
For most sites in the data set (52%), the ground cover established was native vegetation and/or pollinator mixes, followed by sheep grazing management practices (28%). Turfgrass and gravel was established at 17% and 4% of sites, respectively (Table 1, part g). Most vegetation management practices reported began in 2016 or later; the earliest one began in 2012, one began in 2013, and two began in 2015. Previous land use for most sites was agricultural, with some sites being partially wooded and/or including wetlands. A few reported miscellaneous previous land use, such as abandoned agricultural, hay, or open/wooded. One site was previously used as a landfill.
Site and system size data are presented in Table 2. The median site size was approximately 30 acres, and the median system size was 6.4 MWdc. The median DC/AC ratio for sites in the data set was 1.3, which is consistent with the study by Feldman and Margolis [34], and the median land use ratio was 5.35 acres per MWdc, which is consistent with land use estimates from Ong et al.’s study [4].

4. Results

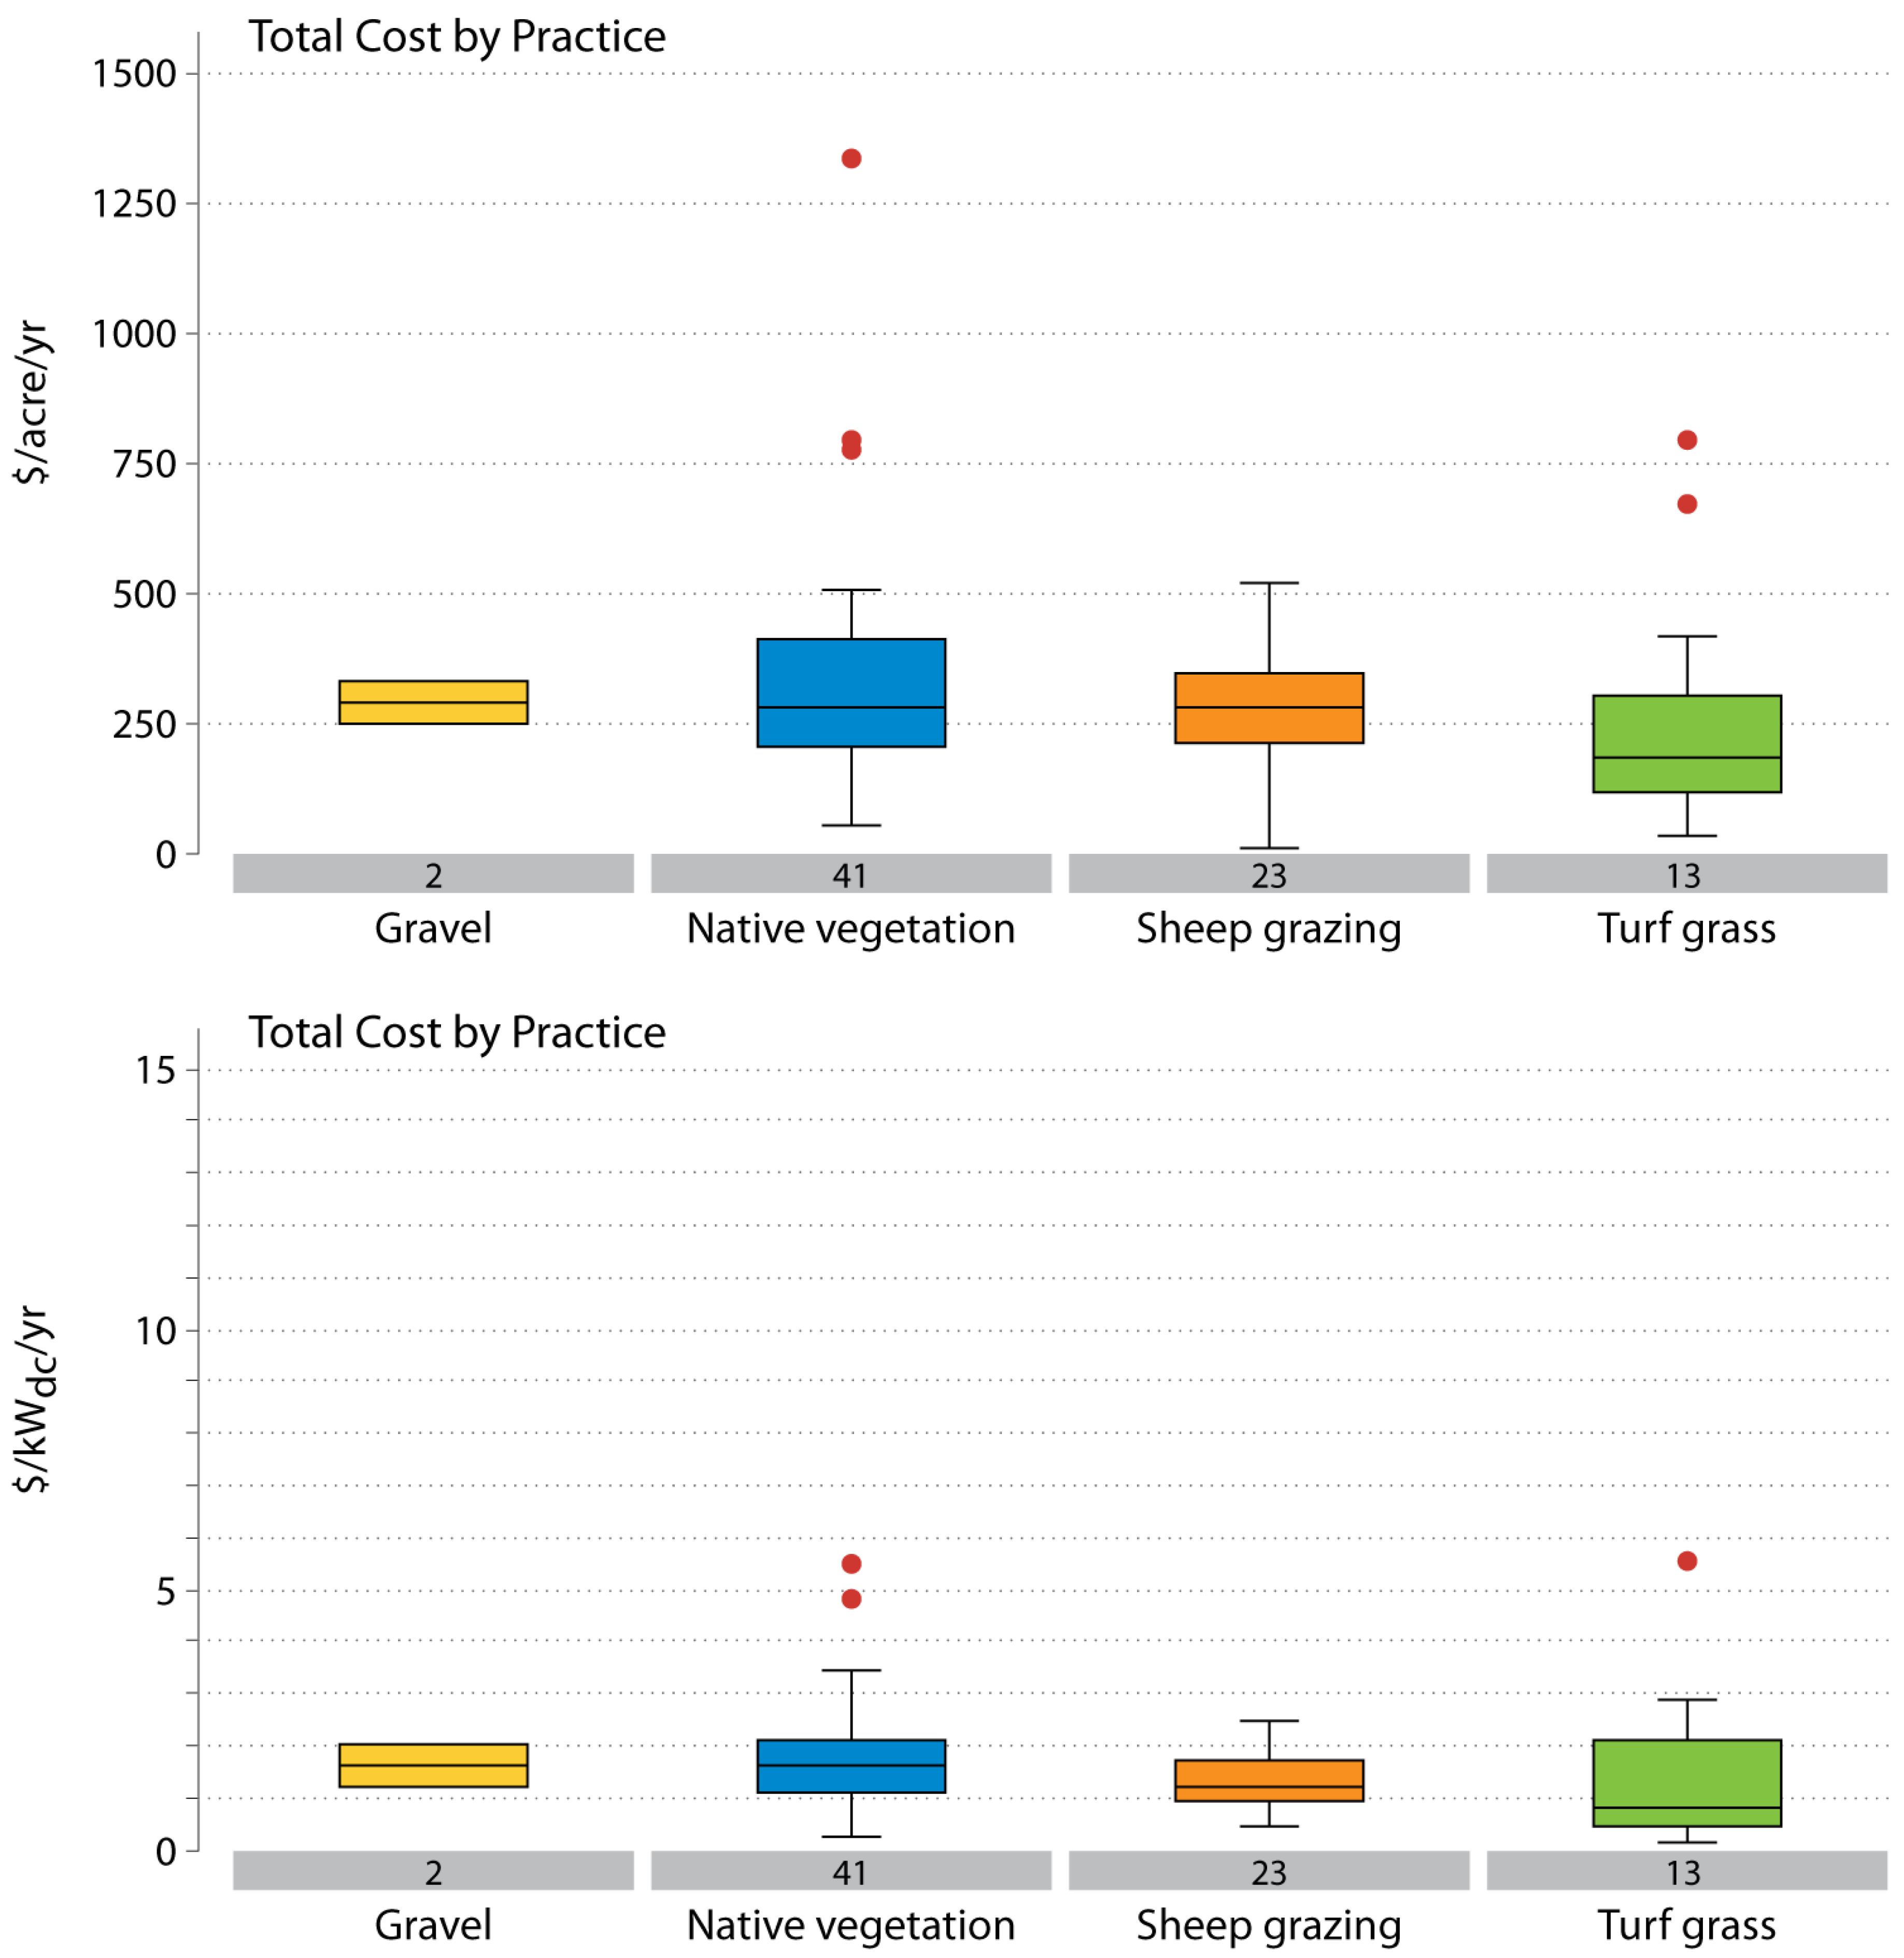
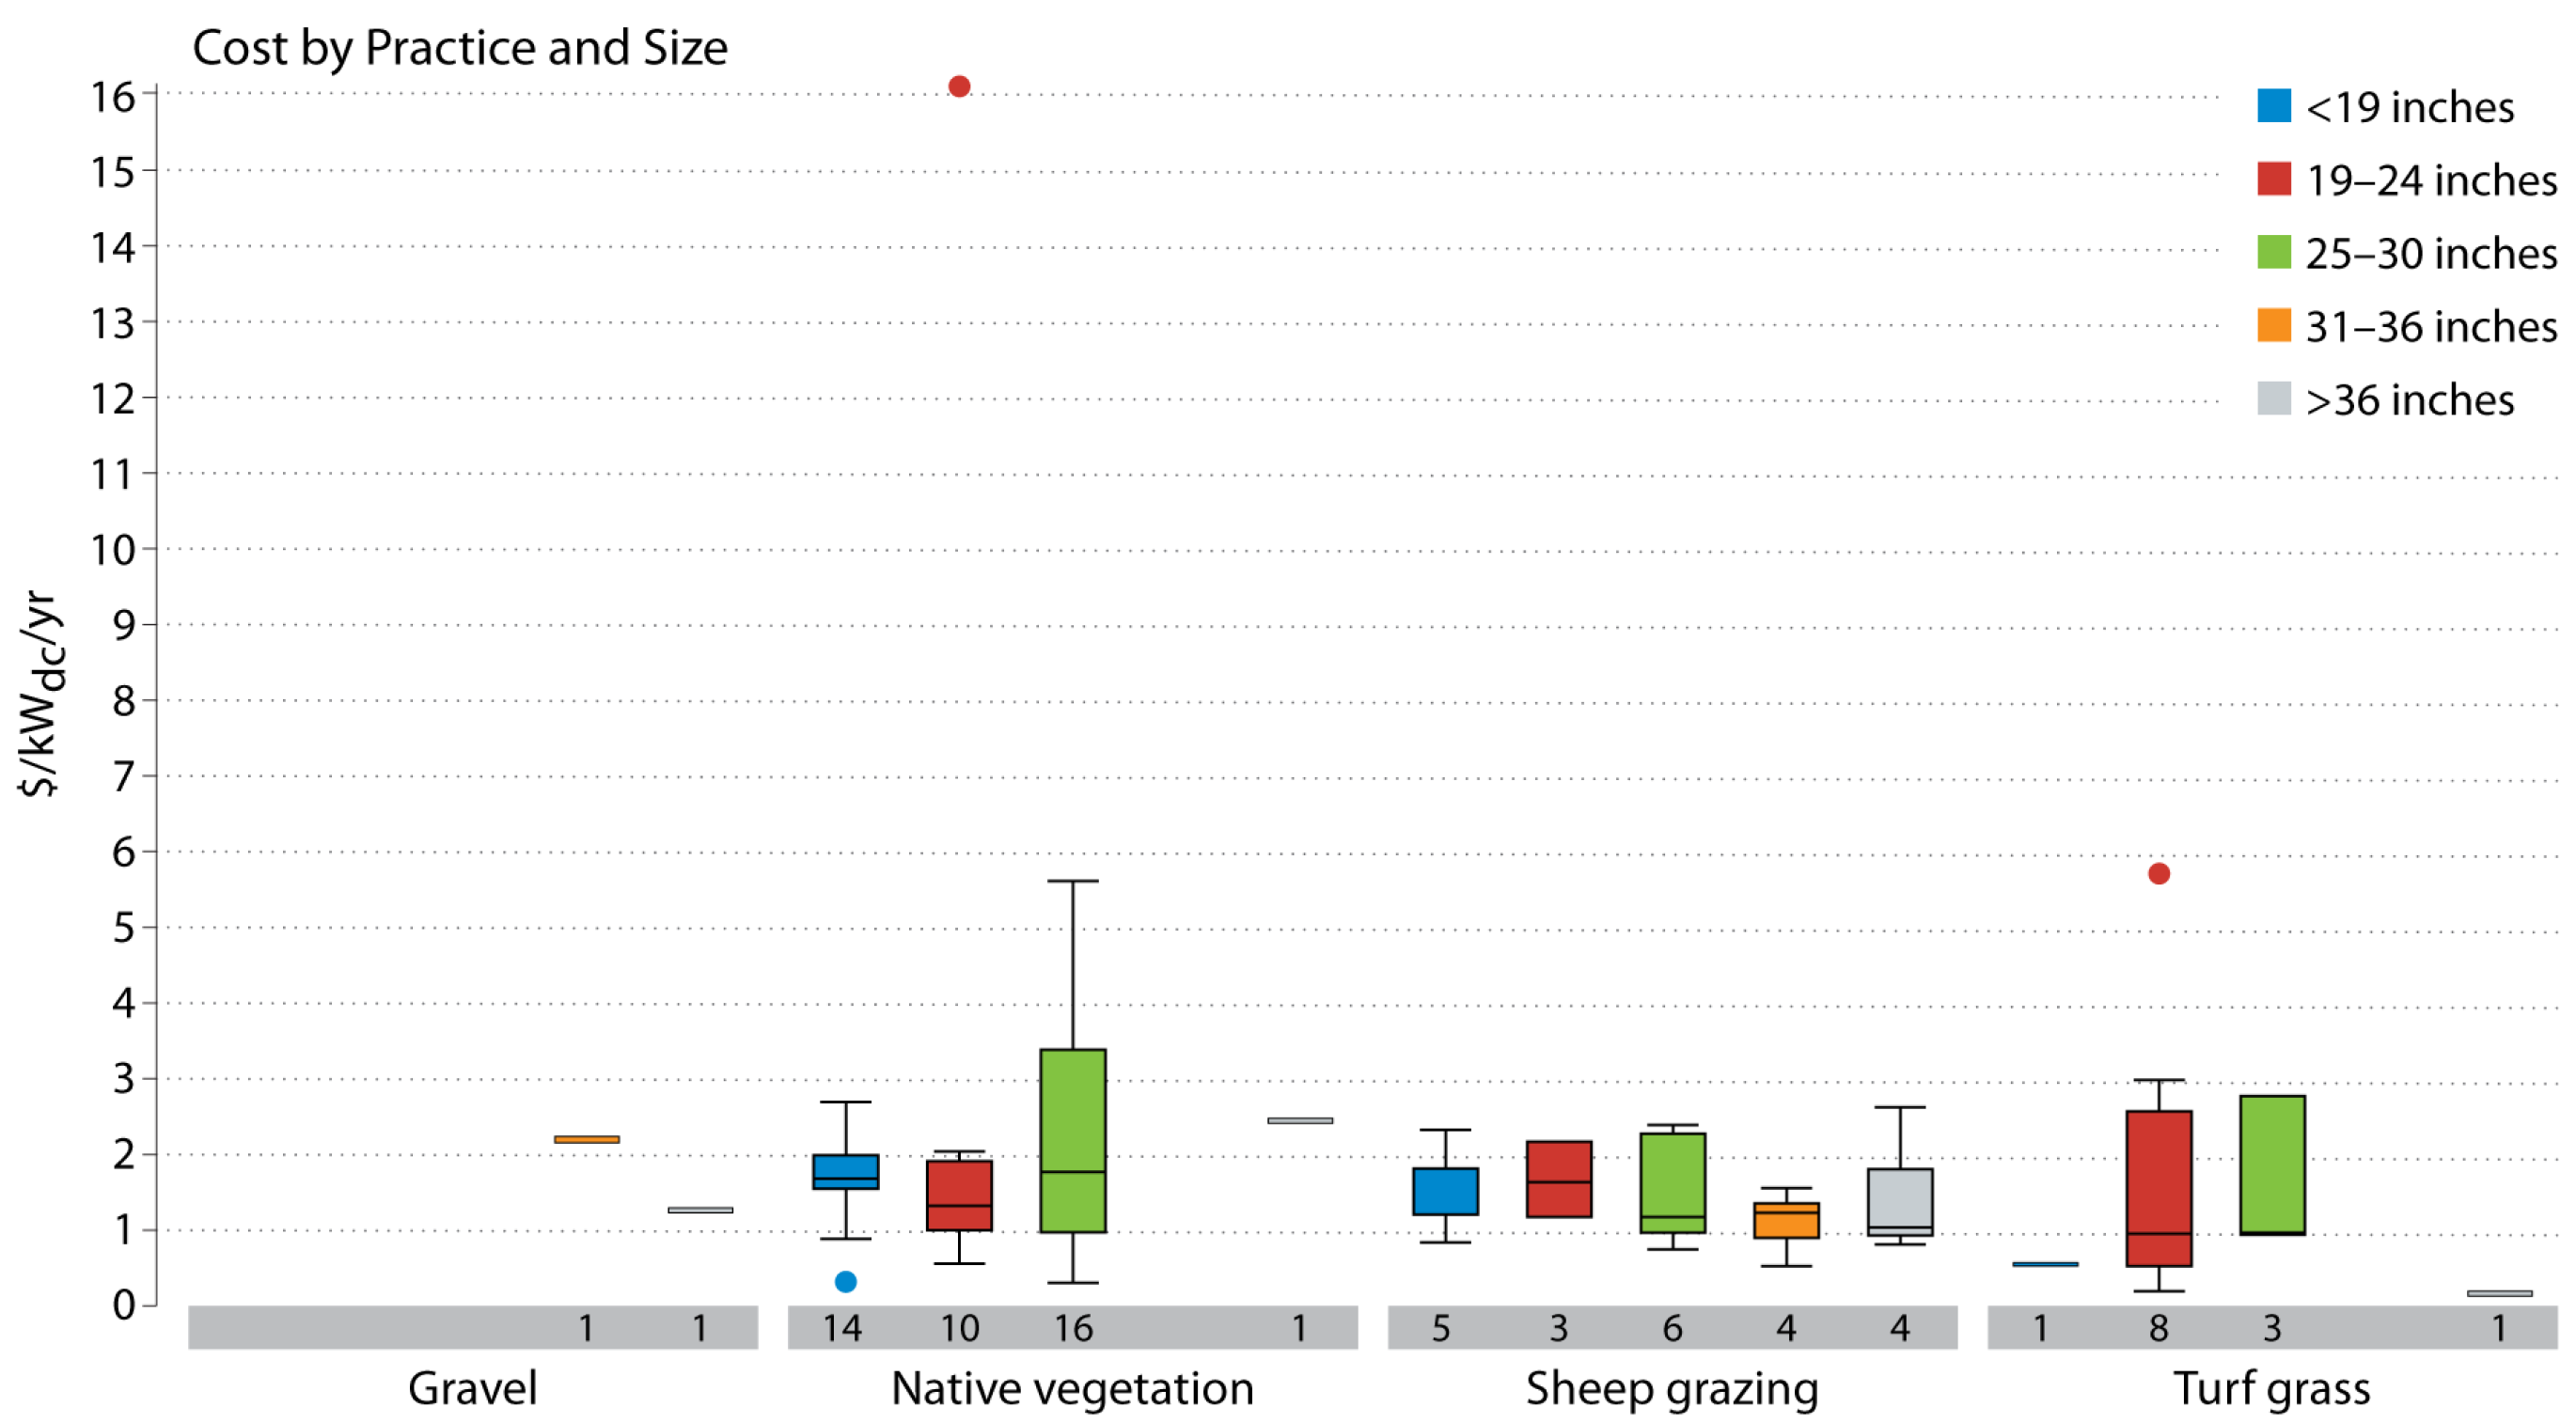
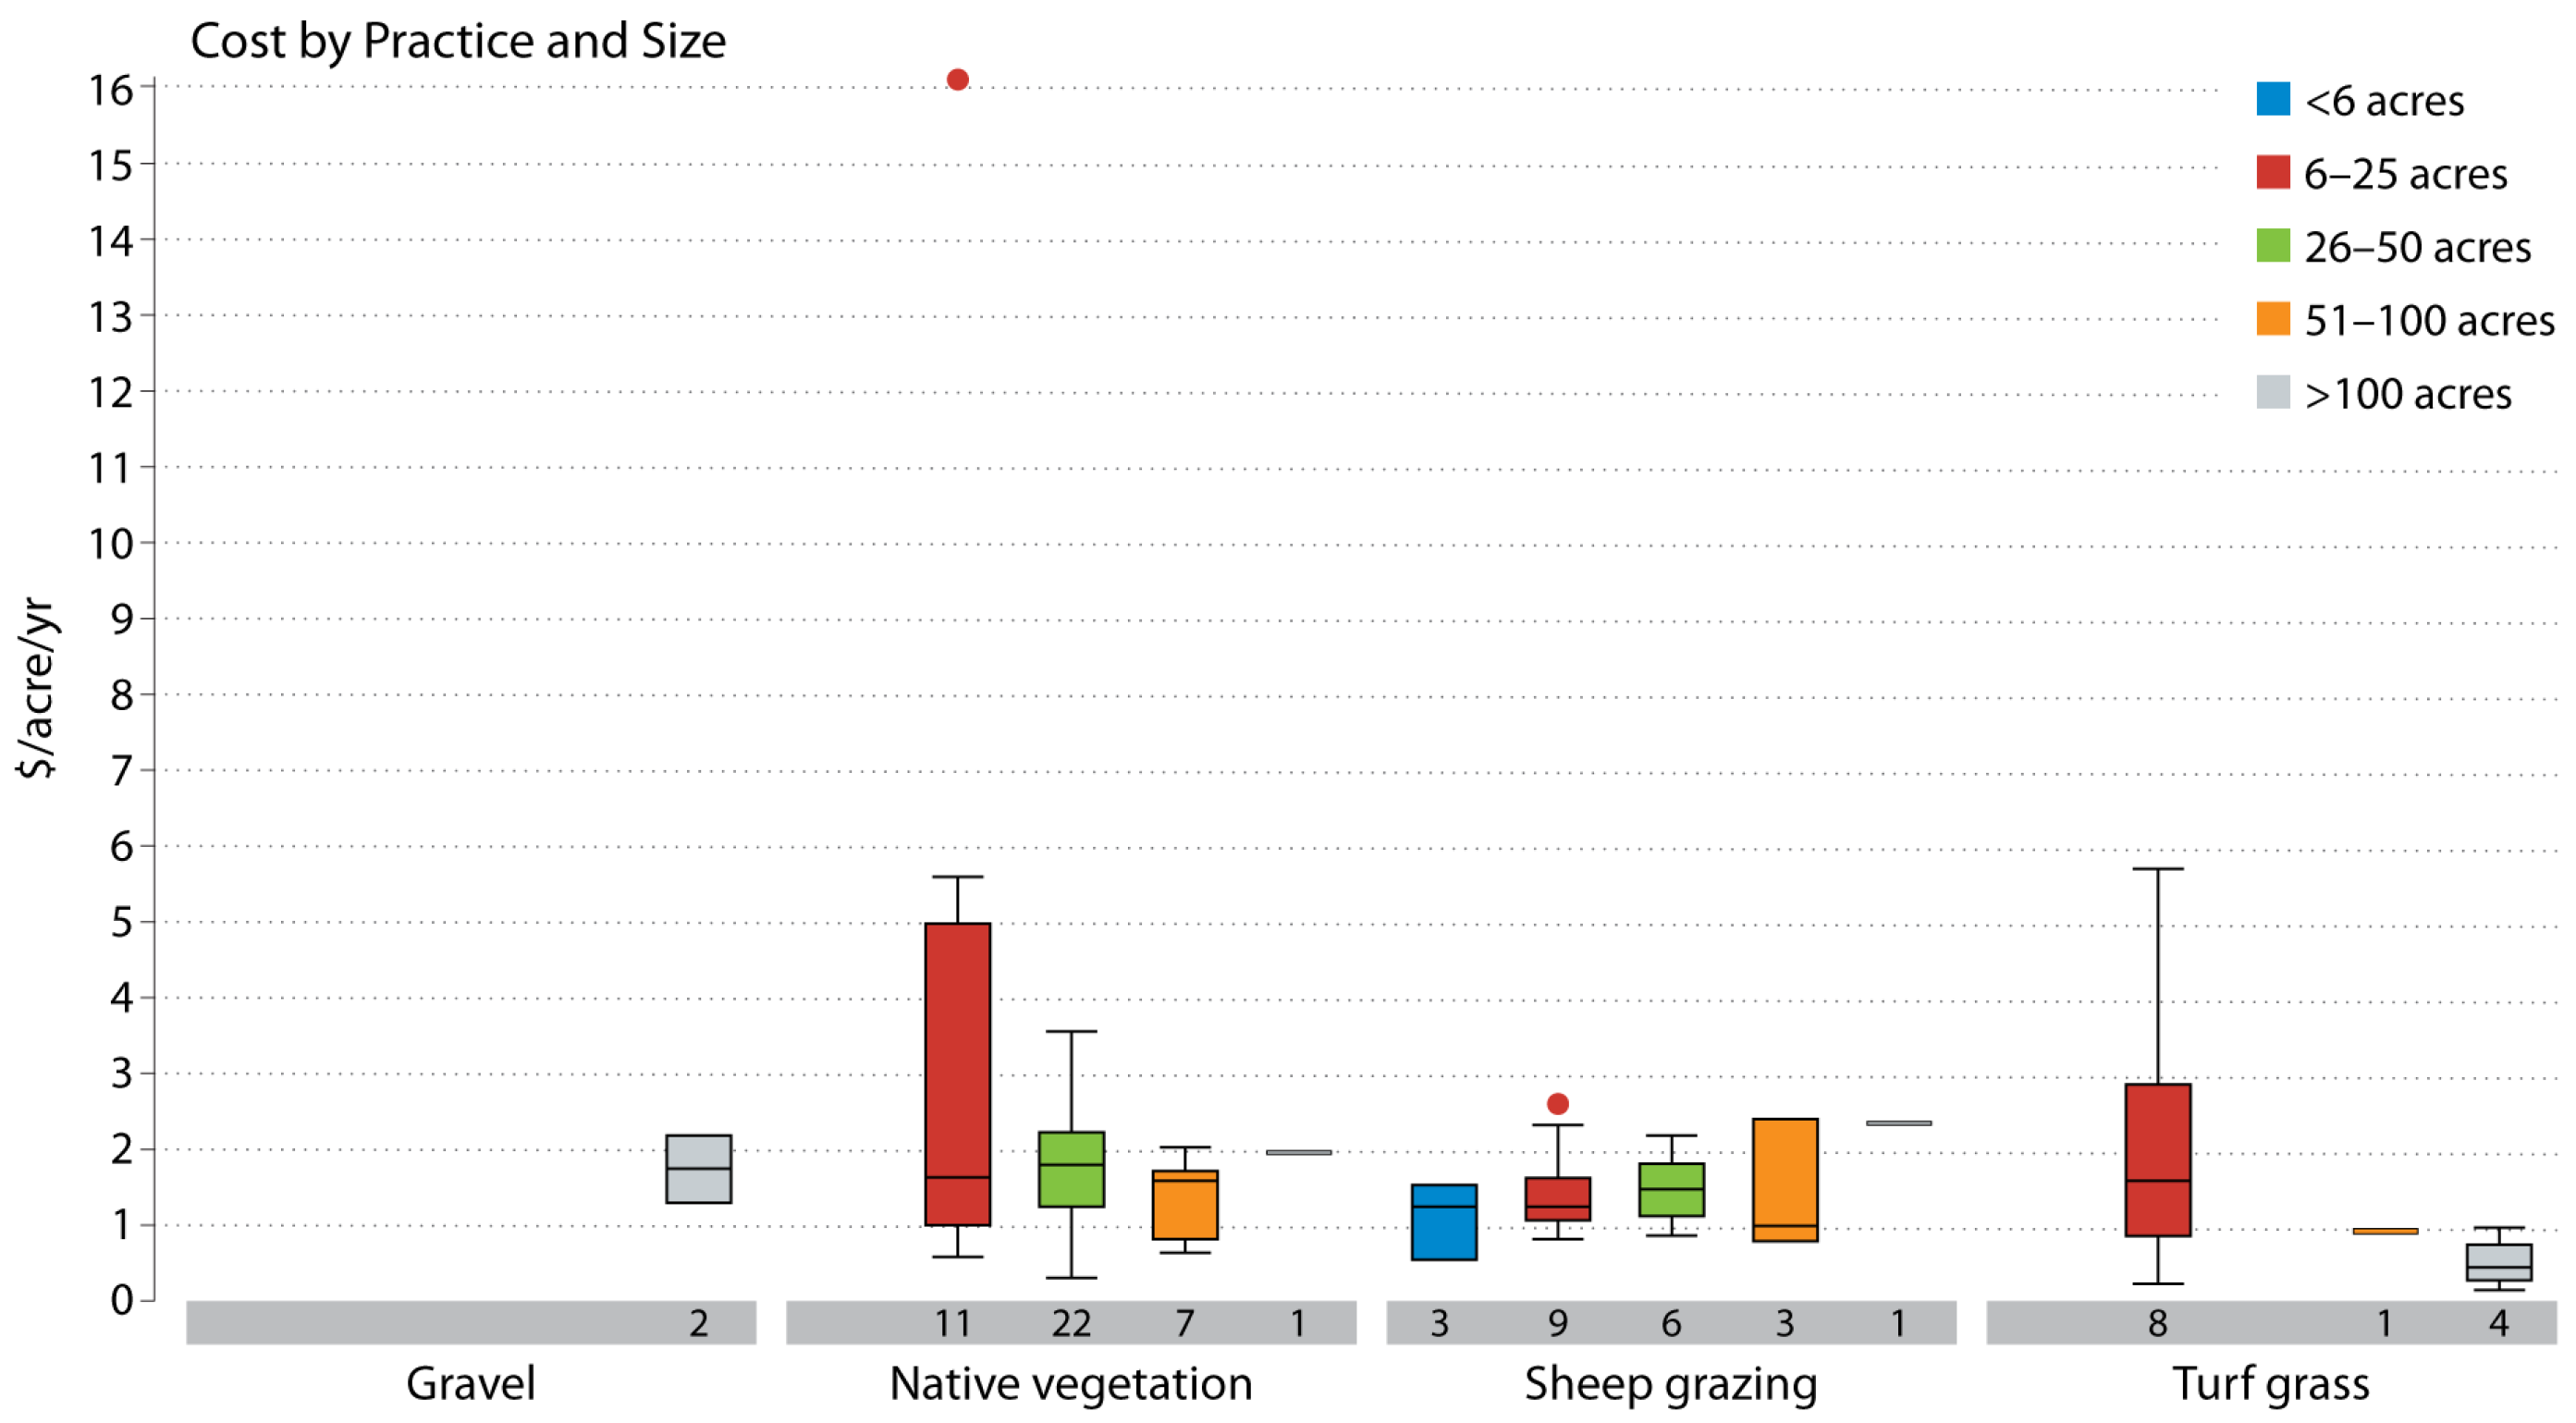
4.1. Cost Differences in O&M by Ground Cover

Based on the data collected, the lowest vegetation O&M cost was turfgrass, with a mean cost of $265/acre/yr ($1.51/kWdc/yr) and a median cost of $184/acre/yr ($0.94/kWdc/yr) (Table 3, Figure 5). Gravel and sheep grazing mean costs were lower than native vegetation mean costs, but median values were similar among the three when evaluated per land area. Mean values for sheep grazing per unit of PV capacity ($1.55/kWdc/yr) were nearly identical to turfgrass. Across most metrics, native vegetation cover was among the most expensive ground cover; it also showed the largest range and standard deviation of management costs. This result may be skewed by the limited data available for turfgrass sites, but it is consistent with anecdotal evidence that native vegetation sites are more expensive to establish in the first 3–4 years, with expectations that the cost of maintenance eventually declines. Most of our data were collected within the first 4 years of ground cover establishment, so we were unable to assess long-term cost impacts. Based on the small sample size, we were unable to assign any statistical significance to these cost results, but these overall costs by practices can be utilized by developers and planners as a range for vegetation O&M costs.
As for the site characteristics’ impact on total vegetation O&M costs, project size and height did not have a large impact on these costs (see Appendix B).

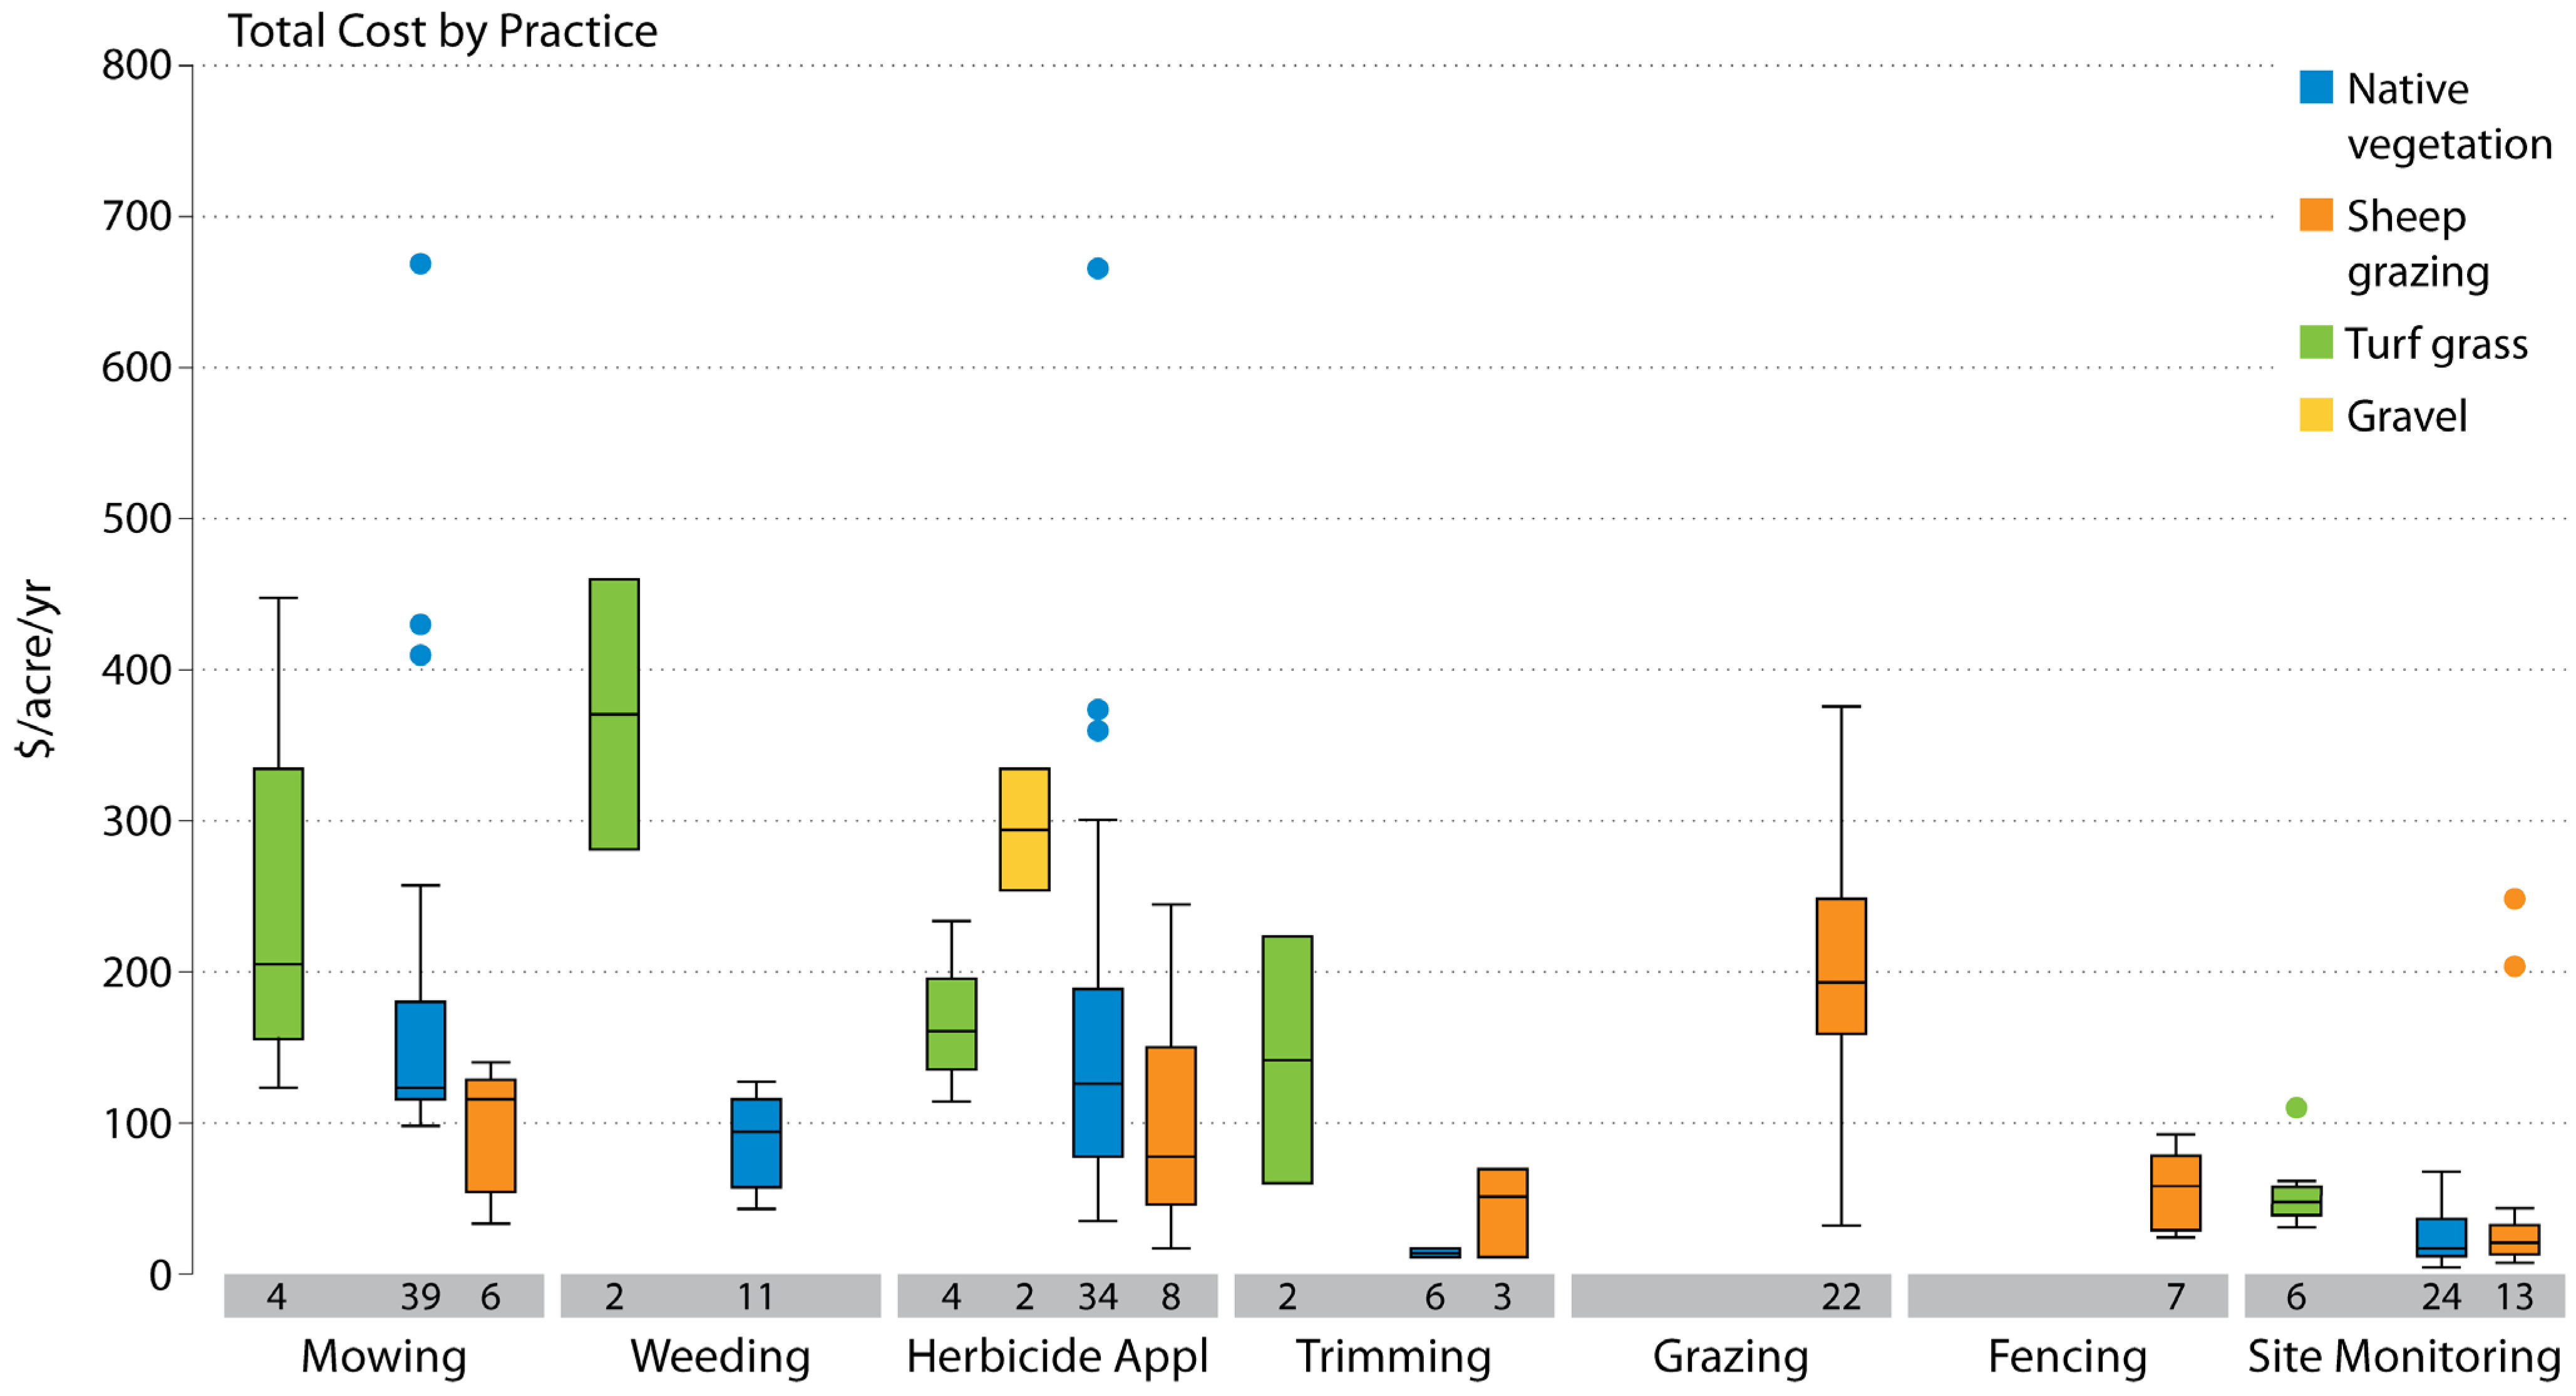
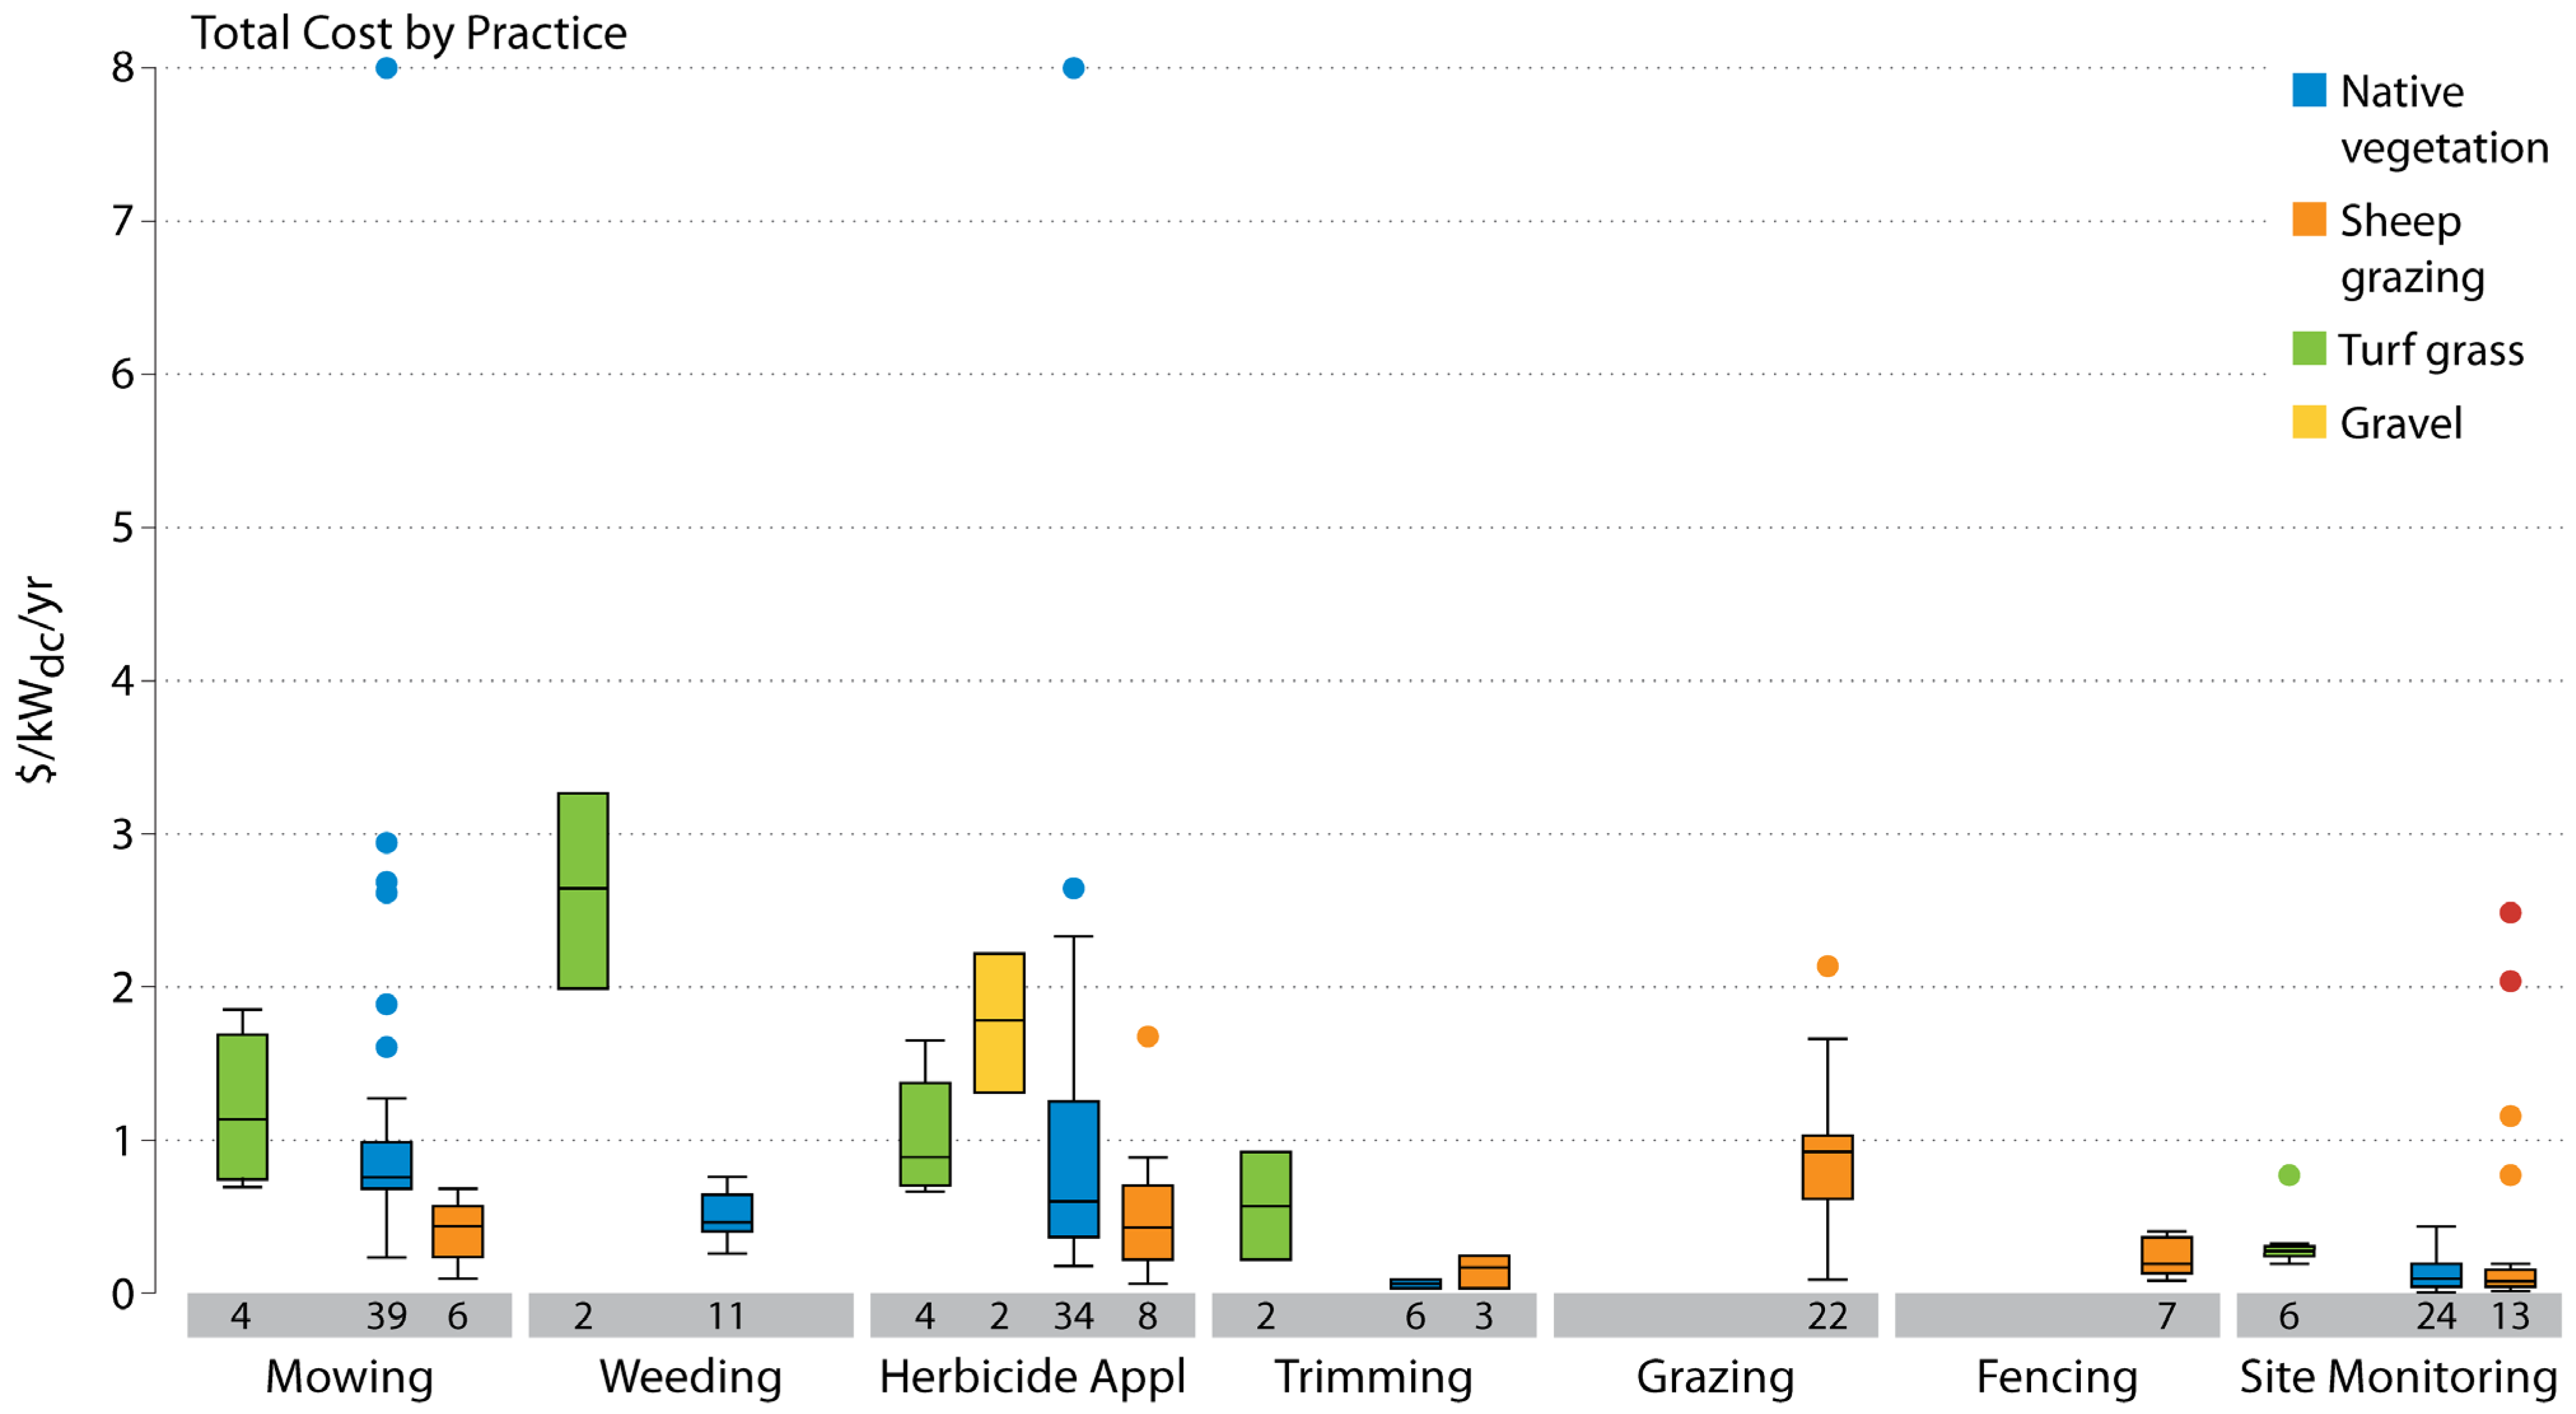
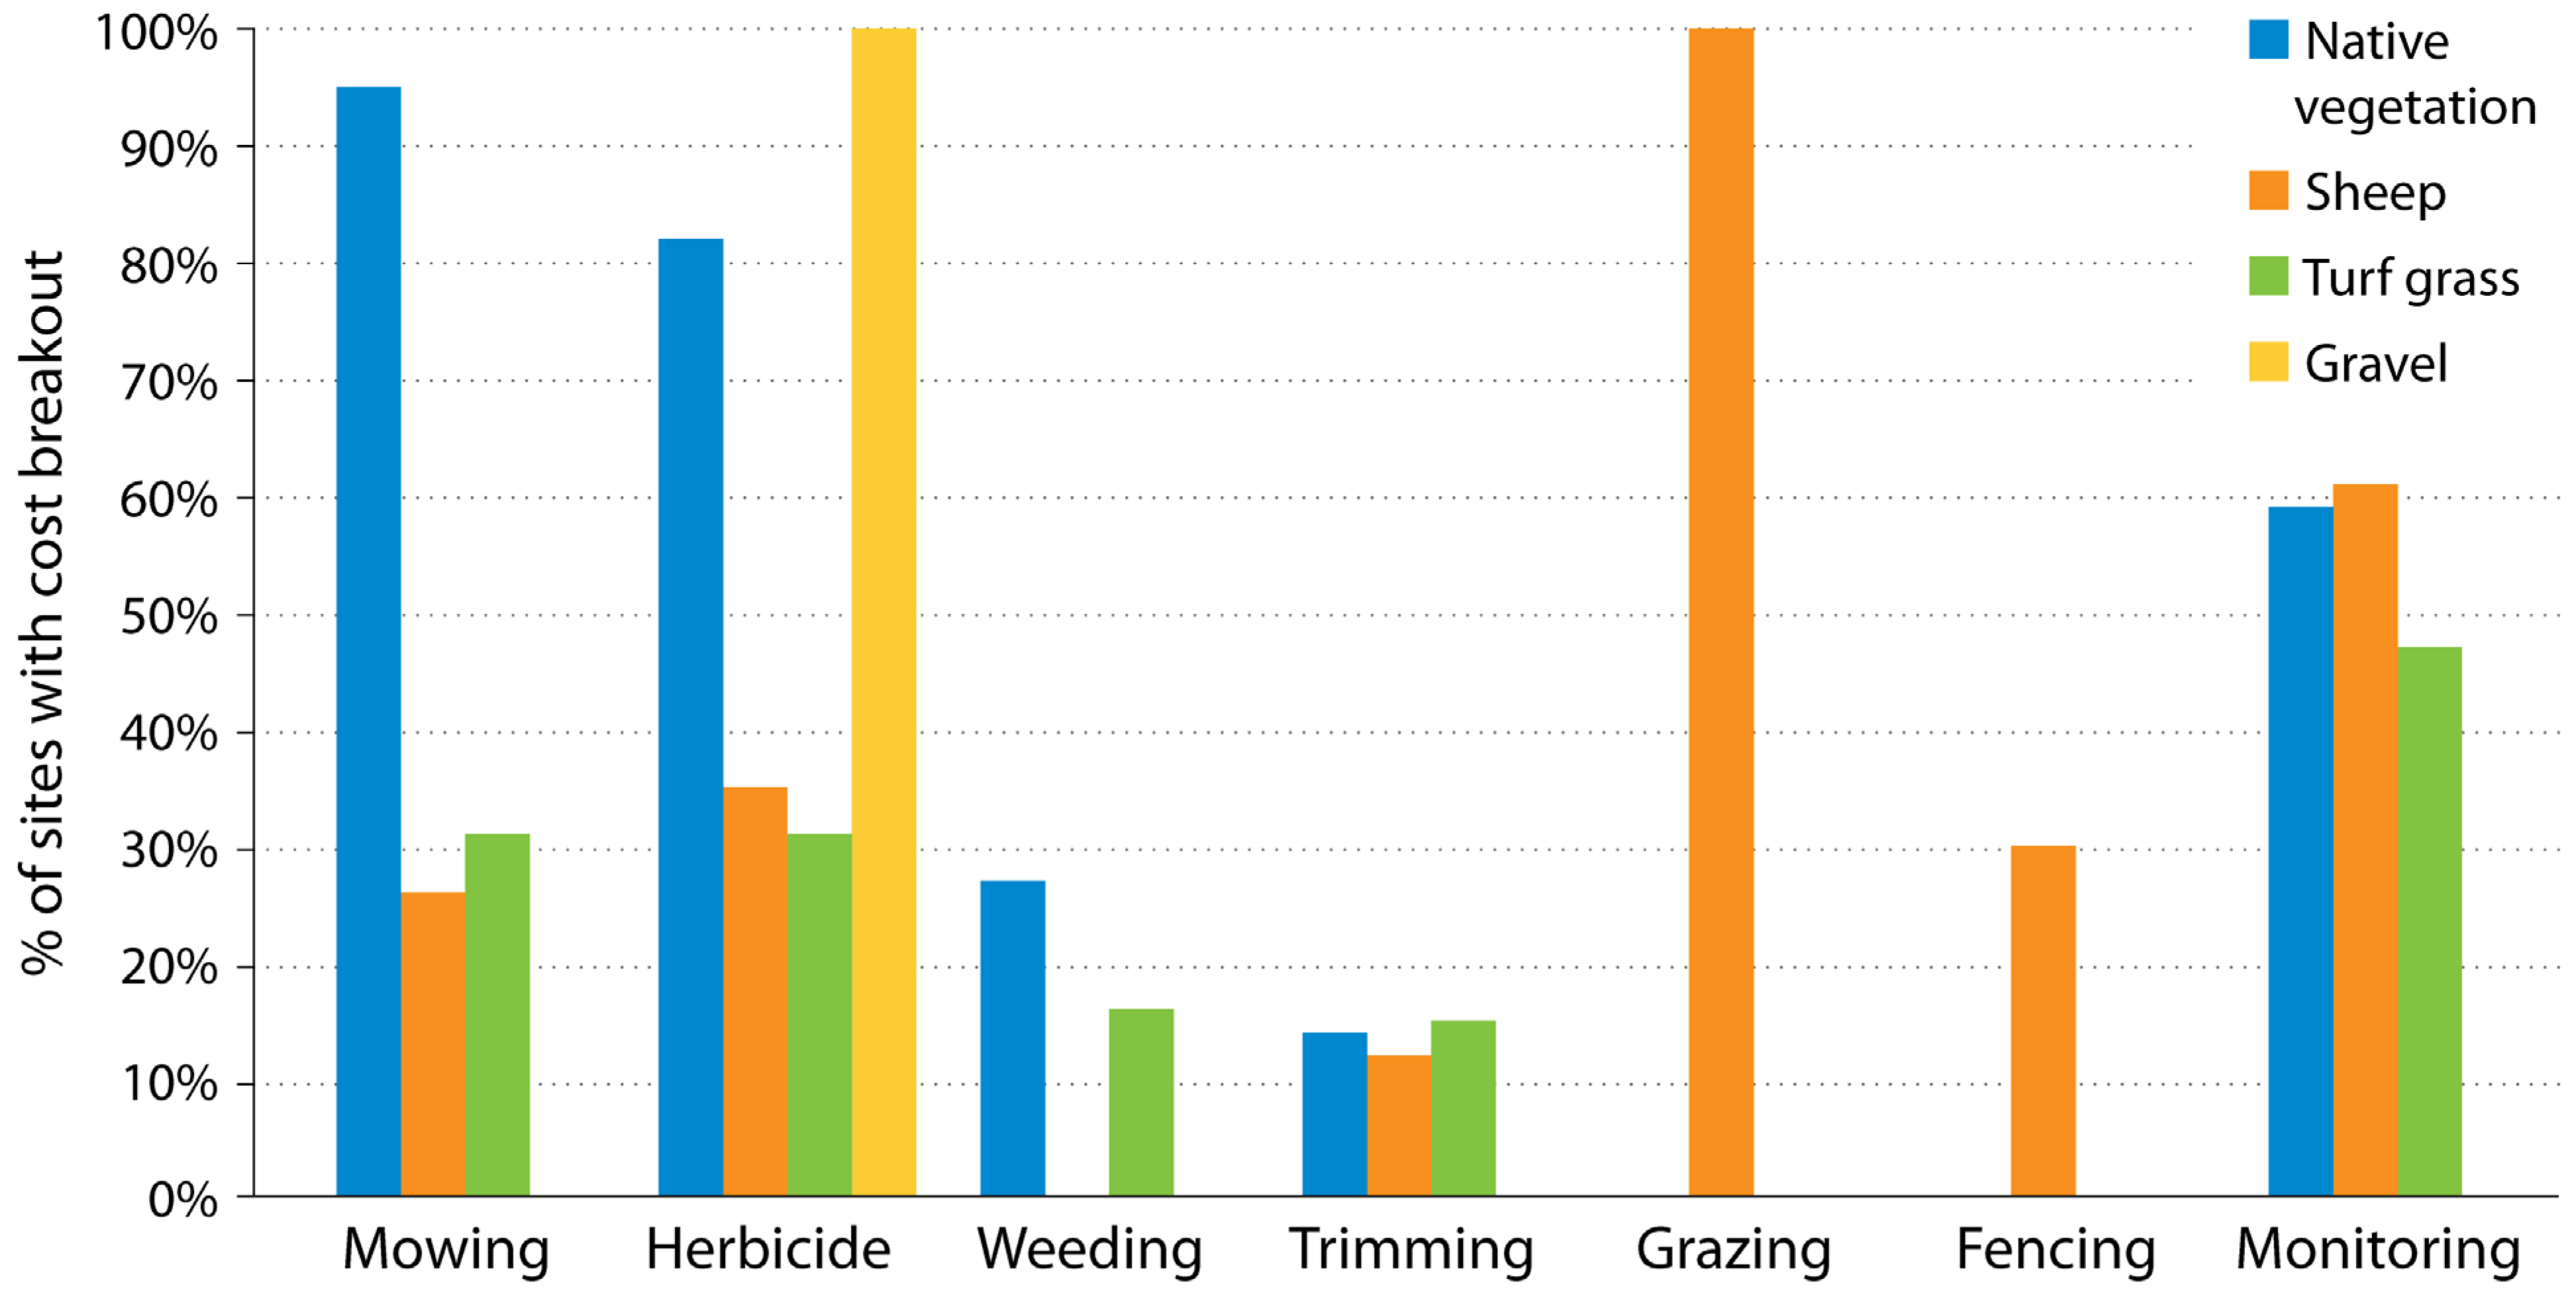
4.2. Individual Activity Costs by Ground Cover

Total sitewide costs represent the sum of the costs of individual activities on each site. The total number and types of activities varied greatly across sites. Individual activity costs by practice in $/acre/year and $/kWdc/year are presented in Table 4 and Table 5; cost per activity is shown in Figure 6 and Figure 7.
For mowing, the median cost for sites where native vegetation was the management practice used was $121/acre ($0.74/kWdc), $113 ($0.74/kWdc) for sheep grazing, and $203 ($1.16/kWdc) for turfgrass. For weeding, trimming, and site maintenance, the costs of these individual activities were lower for the low-impact practices than for turfgrass. For herbicide application, gravel had the highest median cost at $293/acre ($1.75/kWdc), followed by turfgrass at $157 ($0.91/kWdc), native vegetation at $122 ($0.61/kWdc), and sheep grazing at $75 ($0.44/kWdc). Grazing and fencing are activities usually only associated with the practice of sheep grazing. As the data indicate, both mowing and grazing are employed at some sheep grazing sites. While the median total cost per acre was highest for gravel, at $293/acre (where herbicide application was the only activity), the total cost per acre was the same for native vegetation and sheep grazing, at $281/acre ($1.66/kWdc and $1.28/kWdc respectively); this figure is not much lower than gravel, but 52% higher than turfgrass, at $184/acre. In general, the cost of individual activities is lower for native vegetation and sheep grazing; however, as more individual activities are employed for these practices, the total cost for low-impact sites in this data set is higher than for turfgrass.
For our data, we quantified the average vegetation management events per year by different ground cover types (Table 6). The percentage of individual cost data points collected by ground cover/management type is shown in Figure 8.
Along with overall O&M costs at these sites, we also presented qualitative questions to our survey respondents; we then used their answers to determine the drivers of vegetation management costs.

4.3. Qualitative Drivers of O&M Costs

The qualitative impacts, or drivers, of O&M costs and vegetation management events drawn from interviews and data analysis are summarized in Table 7. These reflect the differences of O&M practices across different ground cover types, and help inform the underlying cost variations across and within practices.
Whether mowing, string-trimming, grazing, or cultivating crops, precautions must be taken to prevent damage to the PV equipment. Grazing animals can interact with the array and cause damage to PV modules and electrical systems, mowing can propel rocks into modules or hit above ground infrastructure, and crop cultivation can have farm equipment or workers impact the array. Raising the height of arrays and increasing the inter-row spacing are currently the most common design-level tactics to reduce these risks; however, these practices can add to overall costs and reduce energy density, leading to reduced energy generation per unit of land area. Proper training of O&M staff can further reduce the risk of incidents.

5. Discussion

The results of this analysis are intended to inform decision making and analyses about low-impact solar and vegetation management practices at utility-scale solar PV facilities for solar owners/operators, O&M service providers, and vegetation maintenance companies. Major strides toward standardizing and mainstreaming low-impact practices (particularly on sensitive sites), along with a broad nationwide ramp-up in related research, education offerings, cross-sector collaboration, and public outreach, will be needed to fill the gaps presented in this analysis.
One current challenge with vegetation management strategies is the disconnect between upfront capital (CAPEX) costs and potential impacts on operating costs. Developers commonly sell projects with low-CAPEX design elements that can lead to costly impacts on O&M over the lifetime of the PV system, which can be 25–40 years. Subtleties such as low array heights may pass undetected through the design and construction phases. However, once solar plants are built, such plant features can be prohibitively expensive to correct, and can end up commanding additional O&M funds that were never considered in the original levelized cost of electricity (LCOE) calculations; this hurts the overall profitability of the asset. As these assets are often sold to other asset managers before, during, and after construction, continuity of the vegetation management plan throughout the development process can be difficult.
Considering the data presented in this article, it may seem straightforward to conclude turfgrass is the preferred ground cover, with its lower CAPEX and O&M. The higher cost figures cited on native vegetation could affect choices of PV asset decision makers. However, the native metrics we obtained are skewed toward the more expensive first 4 years of operation, which represent only 10–16% of the overall service life of a project. Moreover, many of these sites carry the burden of first-mover trial and error, as represented by the large range of values for native vegetation cost values. Practices are rapidly evolving as firms learn from mistakes and implement innovative solutions that harness the inherent stability of highly evolved ecosystems. Vegetation management costs across all ground cover types remain a minor contributor to overall PV system costs. Other driving factors related to permitting, social license to operate, ground cover resilience, visual impacts, and individual company standards often outweigh potential cost differences. Moreover, the variability within each ground cover type and individual activity highlights that site-specific conditions for any solar project in any region are the primary drivers of extremely low or high costs for O&M, not the ground cover type itself.

5.1. Toward New Approaches to Low-Impact Construction

Most of the conversations and research about low-impact solar (including this article) have focused on ongoing vegetation management and reestablishing ecosystems, rather than successfully leaving sites largely intact during construction. Although the argument has been made that plowing compacted cropland soil on a PV site may be a legitimate approach to de-compact soils over which heavy-duty construction vehicles have passed [18], this approach may be less viable on more sensitive ecosystems. Alternative machinery and techniques can be explored to minimize soil compaction and damage to existing vegetation. To aid the push toward greatly reducing or even eliminating grading altogether, many PV mounting system manufacturers are developing solutions that are more terrain-flexible, allowing installation on uneven ground and steeper site slopes. Such practices could lead to savings on capital investments, which could spur innovation and adoption of such eco-friendly practices. Further research and demonstration of the efficacy and cost impacts of low-impact construction practices is needed.

5.2. Clarifying the Resource Value of Different Ground Covers across Geographies

Although much of the work on native vegetation and solar O&M has focused on the attractiveness of eventual low-to-zero maintenance, the correlation of high precipitation and increased vegetative growth may make the establishment of low-growth vegetation more challenging, and perhaps impractical, in wet regions; these regions are under-represented in this report. Indeed, in high-precipitation ecosystems, regular, sensible management of abundant regular- or high-growth, high-biodiversity vegetative cover (via grazing by wild or farm animals, integration within a low-impact farming system, or other yet unexplored possible formats) could theoretically merit a low-impact solar label.
Continued research on the individual species encountered and planted on PV sites across the broad vegetative cover spectrum, and across the various biomes of the United States and the world, is also encouraged. Further work toward tightening the definition of ‘low-impact solar’, with particular emphasis on the light green areas noted in Figure 9, is crucial as well.
Consistently growing vegetative cover (whether turfgrass or native) has traditionally been a liability (i.e., an outlay of capital to pay for mowing or grazing services) to PV O&M managers. Furthermore, PV operators have expressed concerns about obtaining insurance at PV sites with perceived higher fire risks from buildup of vegetation leading to grassland fires. However, vegetation can also be viewed as an asset, as it provides hay, silage, fodder, pasture, and/or other products—perhaps to the point where vegetation off-takers could pay site owners for access to the greens, as opposed to the current mainstream practice of site owners paying for vegetation management. If animals providing fur, hide, dairy products, or meat are ingesting the vegetation as their primary form of nutrition as part of an agricultural operation, it could be argued the grass could be considered a crop; thus, the system could be considered ‘agrivoltaic.’ The nomenclature around agrivoltaics is highly nuanced and much discussed, as has already been shown [35]. Regardless of whether the animals eat the fresh biomass directly from the ground, or it is mechanically harvested, baled, and then served to them later as hay, grasses on PV sites can serve as a valuable raw material to contribute to food security and local economies.
Moreover, ground cover planted with pollinator habitat, native vegetation, and other plant life that provides habitat to beneficial insects, can serve to benefit local food economies. These pollination and predation benefits are augmented by other ecosystem services provided by solar sites, which can benefit the surrounding agricultural land [36,37,38].
As robots and automated equipment have recently made strides in reducing the person-hours required to clean PV modules, utility-scale autonomous self-charging lawnmowing robots could be another alternative (or complement) to manual mowing or grazing. Closer comparisons of these various vegetation trimming solutions, including total costs, life cycle analysis, energy conversion efficiency, and social considerations, are encouraged. Discussions on the use of grass as a valued feedstock may also naturally veer into the ongoing debates about energy, food production, and land use in general.
For ultra-arid extreme desert regions with very sparse vegetative cover and low water availability, it may not be possible to establish vegetative cover, requiring either gravel or leaving the ground bare. Further research is needed on the compatibility of specific xeriscape plant species, to what extent the presence of the PV modules may increase their probability of survival, and any cooling benefits the vegetation might provide to the PV. This should complement existing agrivoltaics drylands studies, such as those of Barron–Gafford [19]. For soils with very low fertility (regardless of the local precipitation profile,) amendments to boost nutrient content may be considered, but will increase upfront ground cover costs.

5.3. Agrivoltaics and the Public Sector

Whether harvesting hay or other vegetation—from fruits and vegetables to large-scale agronomic crops—agrivoltaics presents a long list of challenges and opportunities to valorize the land beneath and between PV arrays for food production, increasing land-use efficiency. Agrivoltaics also ideally benefit ecosystems that can reduce competition with other land uses. Although careful arrangements of PV modules can replace or complement overhead crop protection systems for high-value crops (and thus incentivize dual use), the temptation to forego farming of extensive lower-value crops for PV installations has become a social challenge in some regions. Because the per-acre revenue of PV generation usually exceeds that of low-value crops, many farmers—whether as PV asset owners themselves or as recipients of land lease payments by PV asset owners—have traditionally seen incomes suddenly jump and land management responsibilities disappear upon commissioning a PV project. If this phenomenon only plays out on a small percentage of all farms, local food security setbacks may be negligible; however, if the practice expands to the point that it affects a region’s ability to make a significant contribution toward feeding itself, backlash could be seen from local communities. This has already become the case in countries such as Italy, Germany, and France, where the clash between ambitious PV targets and national agricultural autonomy have required legal action to keep farming active on PV sites [39]. Designing PV arrays to be compatible with farming and agricultural activities is not overly complex in principle, but there can be substantial capital cost differences between agrivoltaic configurations and the lowest-cost conventional ground-mounted PV projects, where O&M cost differences are muted. Further research is needed to determine the O&M trade-offs of different configurations and land uses as these practices continue to evolve.

5.4. Conclusions

In this article, we performed data collection and analysis to quantify O&M costs for vegetation management at low-impact utility-scale solar PV sites. We detailed the vegetation O&M costs by individual activity for different ground cover types, and performed summary statistical analyses for different site characteristics. For the 54 sites included in our analysis, we found that while the per-acre and per-kWdc costs for individual activities, such as mowing, trimming, and herbicide application, at native vegetation and sheep grazing sites were lower than at turfgrass sites, the total combined costs were slightly higher, presumably because more individual activities are required. We also found that project size and panel height did not have a large impact on the overall vegetation O&M costs at these sites. This analysis was the first to breakout the individual O&M costs by ground cover type though, based on the small sample size, we were not able to make any statistically significant findings. The authors hope that this analysis will be used as an initial estimate of vegetation O&M costs at utility-scale solar sites, but longer and more detailed studies are needed to advance this analysis.
Mainstreaming low-impact principles in utility-scale PV will be crucial to ensuring the extensive solar deployment expected in the coming years on rangeland and farmland is carried out with a sound ecological foundation, and has buy-in from local stakeholders. There will be cost trade-offs in the capital and operating costs required to implement low-impact principles into which our analysis sought to provide insight. Reasonable continual tracking of relevant cost data, and subsequent careful analysis and diffusion of findings, can greatly support the capacity-building needed to make this a reality.

Author Contributions

Conceptualization, J.M. (Jordan Macknick), J.M. (James McCall) and R.B.; methodology, J.M. (Jordan Macknick) and R.B.; software, J.M. (James McCall) and R.B.; validation, J.M. (Jordan Macknick), R.B., J.M. (James McCall) and J.M. (James Macdonald); formal analysis, R.B. and J.M. (James McCall); investigation, R.B. and J.M. (Jordan Macknick); resources, J.M. (Jordan Macknick); data curation, R.B., J.M. (James McCall) and J.M. (Jordan Macknick); writing—original draft preparation, R.B.; writing—review and editing, J.M. (James Macdonald), J.M. (Jordan Macknick) and J.M. (James McCall); visualization, J.M. (James McCall); supervision, J.M. (Jordan Macknick); project administration, J.M. (Jordan Macknick); funding acquisition, J.M. (Jordan Macknick). All authors have read and agreed to the published version of the manuscript.

Funding

This work was authored in part by the National Renewable Energy Laboratory, operated by Alliance for Sustainable Energy, LLC, for the US Department of Energy (DOE) under Contract No. DE-AC36-08GO28308. Funding was provided by the InSPIRE project through the US DOE Office of Energy Efficiency and Renewable Energy (EERE) Solar Energy Technologies Office under award DE-EE00034165. The views expressed in the article do not necessarily represent the views of the DOE or the US Government. The US Government retains and the publisher, by accepting the article for publication, acknowledges that the US Government retains a nonexclusive, paid-up, irrevocable, worldwide license to publish or reproduce the published form of this work, or allow others to do so, for US Government purposes. This article is part of the development of Mr. Macdonald’s doctoral thesis, “Sensible Integration of 100+ Terawatts of Solar PV Into the Landscapes of Earth,”," carried out in the doctoral program “Gestión y Valoración Urbana y Arquitectónica” at the Universitat Politècnica de Catalunya; the article has had the support of the “FI AGAUR” scholarship, financed by the Generalitat de Catalunya Agència de Gestió d’Ajuts Universitaris i de Recerca.

Institutional Review Board Statement

Not applicable.

Informed Consent Statement

Not applicable.

Data Availability Statement

The data presented in this study are available on request from the corresponding author. The data are not publicly available due to privacy concerns.

Conflicts of Interest

The authors declare no conflict of interest.

Appendix A. Data Collection Fields

Data providers also shared observations about solar PV vegetation management practices and activities during phone conversations, email correspondence, and in response to the following open-ended questions on the data form and follow-up email:
-
Have you incurred any unexpected costs related to this practice? What were they, and what was the total amount?
-
If mowing is listed, have you noticed a change in mowing frequency over time?
-
What hazards have you encountered (e.g., mower kicked up rocks and broke panels)?
-
What benefits have you experienced as a result of using this practice?
-
What challenges have you encountered related to the use of this practice?
-
Were any modifications made to system design or permitting to accommodate low-impact O&M? If so, what specific costs were associated with those modifications (CAPEX), and what has been the impact on O&M cost (OPEX)?
Site details
-
Data provider
-
Site name or designation
-
Site state
-
Site county
-
Geo location latitude
-
Geo location longitude
-
Site size (acres)
-
System size (MWac)
-
System size (MWdc)
-
DC/AC ratio (used 1.3 where MWdc not provided)
-
Land use ratio (acre/MWac)
-
Land use ratio (acre/MWdc)
-
Site terrain and slope (flat, hilly, rocky)
-
Site hydrology (wet, mesic, dry)
-
Average precipitation (inches)precipitation (inches)
-
Growing zone
-
Previous land use (e.g., agriculture)
-
Month site was constructed (indicates topsoil preservation)
-
Seeding (pollinator or turf)
-
Type of array (fixed or tracking)
-
Height of panels (lower edge, in inches)
-
Distance between rows (pole to pole, in feet).
O&M Practice
-
What ground cover O&M practice(s) are employed at the site?
-
Year practice began (e.g., year seeded or first year of grazing)
-
Year activities were completed, and costs incurred.
Sheep Grazing Only
-
Type of grazing (continuous or rotational)
-
Number of adult sheep per acre (count lambs at 1/2 an adult)
-
Type of fencing within the perimeter (permanent or temporary).
Activities
-
What O&M activities does this practice require (up to four per site)? If “other”, please write in.
-
Please provide additional details about this activity.
-
How often is this activity completed (or list dates)?
-
What is the cost associated with this activity?
-
What is the cost unit ($/acre)?
-
How often is this cost incurred (or list dates)?
-
Frequency per year
-
Cost per year ($/yr)
-
Activity cost ($/acre/yr)
-
Activity cost ($/MWdc/yr)
-
Total combined cost ($/acre/yr)
-
Total combined cost ($/MWdc/yr)
-
Have you incurred any unexpected costs related to this practice? What were they, and what was the total amount?
-
If mowing is listed, have you noticed a change to mowing frequency over time?
-
What hazards have you encountered (e.g., mower kicked up rocks and broke panels)?
-
What benefits have you experienced as a result of using this practice?
-
What challenges have you encountered related to use of this practice?

Appendix B. Costs by Site Characteristics

Panel height does not have a large impact on O&M costs by practice.
Figure A1. O&M costs ($/kWdc/yr) by panel height. Dots indicate values outside of the 5th and 95th percentiles.
Sustainability 15 05895 g0a1
Though costs are more variable for smaller projects, they are not significantly affected by project size.
Figure A2. O&M costs ($/kWdc/yr) by site size (acres). Dots indicate values outside of the 5th and 95th percentiles.
Sustainability 15 05895 g0a2

References

  1. U.S. Department of Energy, “Solar Futures Study”. 2021. Available online: https://www.energy.gov/sites/default/files/2021-09/Solar%20Futures%20Study.pdf (accessed on 10 February 2023).
  2. Solar Energy Industries Association. “Major Solar Projects List”, SEIA. 2023. Available online: https://www.seia.org/research-resources/major-solar-projects-list (accessed on 10 February 2023).
  3. U.S. Energy Information Agency. Form EIA-860 Detailed Data with Previous form Data (EIA-860A/860B). 2022. Available online: https://www.eia.gov/electricity/data/eia860/ (accessed on 10 February 2023).
  4. Ong, S.; Campbell, C.; Denholm, P.; Margolis, R.; Heath, G. Land-Use Requirements for Solar Power Plants in the United States; National Renewable Energy Laboratory: Golden, CO, USA, 2013. [Google Scholar]
  5. Bolinger, M.; Bolinger, G. Land requirements for utility-scale PV: An empirical update on power and energy density. IEEE J. Photovolt. 2022, 12, 589–594. [Google Scholar] [CrossRef]
  6. Niazi, K.A.K.; Victoria, M. Comparative analysis of PV configurations for agrivoltaic systems in Europe. arXiv 2022, arXiv:2211.00331. [Google Scholar]
  7. Horowitz, K.; Ramasamy, V.; Macknick, J.; Margolis, R. Capital Costs for Dual-Use Photovoltaic Installations: 2020 Benchmark for Ground-Mounted PV Systems with Pollinator-Friendly Vegetation, Grazing, and Crops. 2020. Available online: https://www.nrel.gov/docs/fy21osti/77811.pdf (accessed on 10 February 2023).
  8. Wiser, R.; Millstein, D.; Mai, T.; Macknick, J.; Carpenter, A.; Cohen, S.; Cole, W.; Frew, B.; Heath, G. The environmental and public health benefits of achieving high penetrations of solar energy in the United States. Energy 2016, 113, 472–486. [Google Scholar] [CrossRef] [Green Version]
  9. Hernandez, R.R.; Armstrong, A.; Burney, J.; Ryan, G.; Moore-O’Leary, K.; Diédhiou, I.; Grodsky, S.M.; Saul-Gershenz, L.; Davis, R.; Macknick, J.; et al. Techno–ecological synergies of solar energy for global sustainability. Nat. Sustain. 2019, 2, 560–568. [Google Scholar] [CrossRef] [Green Version]
  10. Davis, R.; Macknick, J. ASTRO: Facilitating Advancements in Low-Impact Solar Research, Deployment, and Dissemination; National Renewable Energy Lab. (NREL): Golden, CO, USA, 2022. [Google Scholar]
  11. The Nature Conservancy in North Carolina. Principles of Low Impact Solar Siting and Design. 2019. Available online: https://www.nature.org/content/dam/tnc/nature/en/documents/ED_TNCNCPrinciplesofSolarSitingandDesignJan2019.pdf (accessed on 10 February 2023).
  12. US EPA. Urban Runoff: Low Impact Development. 2022. Available online: https://www.epa.gov/nps/urban-runoff-low-impact-development (accessed on 10 February 2023).
  13. Grison, C.; Cases, L.; Hossaert-McKey, M.; Le Moigne, M. Photovoltaism, Agriculture and Ecology: From Agrivoltaism to Ecovoltaism; John Wiley & Sons: Hoboken, NJ, USA, 2022. [Google Scholar]
  14. Pettersson, I.; Morell, K.; Råberg, T.; van Noord, M.; Zinko, U.; Ghaem Sigarchian, S.; Sandström, A.; Unger, M. Ecovoltaics och Agrivoltaics: En Handbok om Solcellsparker som Gynnar Biologisk Mångfald och Ekosystemtjänster; RISE Research Institutes of Sweden: Gothenburg, Sweden, 2022. [Google Scholar]
  15. Clean Energy States Alliance. State Pollinator-Friendly Solar Initiatives; CESA: Montpelier, VT, USA, 2020; p. 12. [Google Scholar]
  16. European Environmental Bureau. Policy Brief: Nature-Positive Renewables. 2022. Available online: https://eeb.org/library/summary-for-policymakers-nature-positive-renewables/ (accessed on 10 February 2023).
  17. Macknick, J.; Hartmann, H.; Barron-Gafford, G.; Beatty, B.; Burton, R.; Seok-Choi, C.; Davis, M.; Davis, R.; Figueroa, J.; Garrett, A.; et al. The 5 Cs of Agrivoltaic Success Factors in the United States: Lessons from the InSPIRE Research Study; National Renewable Energy Lab. (NREL): Golden, CO, USA, 2022. [Google Scholar]
  18. National Renewable Energy Laboratory. Low-Impact Solar Development Strategies Primer. 2022. Available online: https://openei.org/wiki/InSPIRE/Primer#What_Is (accessed on 10 February 2023).
  19. Barron-Gafford, G.A.; Pavao-Zuckerman, M.A.; Minor, R.L.; Sutter, L.F.; Barnett-Moreno, I.; Blackett, D.T.; Thompson, M.; Dimond, K.; Gerlak, A.K.; Nabhan, G.P.; et al. Agrivoltaics provide mutual benefits across the food–energy–water nexus in drylands. Nat. Sustain. 2019, 2, 848–855. [Google Scholar] [CrossRef]
  20. National Renewable Energy Laboratory; Sandia National Laboratory; SunSpec Alliance; SunShot National Laboratory Multiyear Partnership; (SuNLaMP) PV O&M Best Practices Working Group. Best Practices for Operation and Maintenance of Photovoltaic and Energy Storage Systems, 3rd ed.; National Renewable Energy Lab. (NREL): Golden, CO, USA, 2018. Available online: https://www.nrel.gov/docs/fy19osti/73822.pdf (accessed on 10 February 2023).
  21. National Rural Electric Cooperative Association. Cooperative Utility PV Field Manual. 2017. Available online: https://www.cooperative.com/programs-services/bts/documents/sunda/nreca-cooperative-utility-pv-field-manual-vol-ii-final.pdf (accessed on 10 February 2023).
  22. NREL. Low-Impact Solar Development Strategies Primer. 2023. Available online: https://openei.org/wiki/InSPIRE/Primer (accessed on 10 February 2023).
  23. NREL. NREL Image Gallery. 2023. Available online: https://images.nrel.gov/mx/Profiles/en/landing/ (accessed on 10 February 2023).
  24. Ramkumar, A. Sheep Are the Solar Industry’s Lawn Mowers of Choice. Wall Street Journal. 2022. Available online: https://www.wsj.com/articles/sheep-solar-industry-panel-fields-11662390795 (accessed on 10 February 2023).
  25. Launchbaugh, K.; Walker, J. Targeted grazing—A new paradigm for livestock management. Targeted Grazing: A Natural Approach to Vegetation Management and Landscape Enhancement; American Sheep Industry Association: Centennial, CO, USA, 2006; pp. 2–8. [Google Scholar]
  26. USDA. Pasture Condition Scoresheet. 2020. Available online: https://www.nrcs.usda.gov/wps/cmis_proxy/https/ecm.nrcs.usda.gov%3A443/fncmis/resources/WEBP/ContentStream/idd_20464E73-0000-C733-8D55-ED55704D7A57/0/National+-+Pasture+Condition+Scoresheet+%28PCS%29+-+1-2020.pdf (accessed on 10 February 2023).
  27. Chalgynbayeva, A.; Gabnai, Z.; Lengyel, P.; Pestisha, A.; Bai, A. Worldwide Research Trends in Agrivoltaic Systems—A Bibliometric Review. Energies 2023, 16, 611. [Google Scholar] [CrossRef]
  28. Baker, C.D.; Polito, K.E.; Beaton, M.A.; Judson, J.F. Solar Massachusetts Renewable Target (SMART) Program Summary; Commonwealth of Massachusetts: Boston, MA, USA, 2018. [Google Scholar]
  29. National Renewable Energy Laboratory. InSPIRE/Agrivoltaics Map | Open Energy Information. 2023. Available online: https://openei.org/wiki/InSPIRE/Agrivoltaics_Map (accessed on 10 February 2023).
  30. Enbar, N.; Weng, D.; Klise, G.T. Budgeting for Solar PV Plant Operations & Maintenance: Practices and Pricing; Sandia National Lab. (SNL-NM): Albuquerque, NM, USA, 2016. [Google Scholar]
  31. Weaver, J.F. Solar-Powered Pollinators for Less Than a Penny a Watt. pv Magazine USA. 2019. Available online: https://pv-magazine-usa.com/2019/04/05/solar-powered-pollinators-for-less-than-a-penny-a-watt/ (accessed on 10 February 2023).
  32. Brehaut, C. Megawatt-Scale PV O&M and Asset Management 2015–2020; Greentech Media Inc.: Boston, MA, USA, 2015. [Google Scholar]
  33. USDA. Find a Location: USDA ARS. 2023. Available online: https://www.ars.usda.gov/people-locations/find-a-location/ (accessed on 10 February 2023).
  34. Fu, R.; Feldman, D.J.; Margolis, R.M. US Solar Photovoltaic System Cost Benchmark: Q1 2018; National Renewable Energy Lab. (NREL): Golden, CO, USA, 2018. [Google Scholar]
  35. Willockx, B.; Herteleer, B.; Ronsijn, B.; Uytterhaegen, B.; Cappelle, J. A standardized classification and performance indicators of agrivoltaic systems. In Proceedings of the EU PVSEC Proceedings, Online, 7–11 September 2020. [Google Scholar]
  36. Walston, L.; Mishra, S.K.; Hartmann, H.M.; Hlohowskyj, I.; McCall, J.; Macknick, J. Examining the Potential for Agricultural Benefits from Pollinator Habitat at Solar Facilities in the United States. Environ. Sci. Technol. 2018, 52, 7566–7576. [Google Scholar] [CrossRef] [PubMed]
  37. Walston, L.J.; Barley, T.; Bhandari, I.; Campbell, B.; McCall, J.; Hartmann, H.M.; Dolezal, A.G. Opportunities for agrivoltaic systems to achieve synergistic food-energy-environmental needs and address sustainability goals. Front. Sustain. Food Syst. 2022, 6, 374. [Google Scholar] [CrossRef]
  38. Walston, L.J.; Li, Y.; Hartmann, H.M.; Macknick, J.; Hanson, A.; Nootenboom, C.; Lonsdorf, E.; Hellmann, J. Modeling the ecosystem services of native vegetation management practices at solar energy facilities in the Midwestern United States. Ecosyst. Serv. 2020, 47, 101227. [Google Scholar] [CrossRef]
  39. Hannen, P. German Organizations Outline New Standards for Agrivoltaics. pv Magazine International. 2021. Available online: https://www.pv-magazine.com/2021/04/27/german-organizations-outline-new-standards-for-agrivoltaics/ (accessed on 10 February 2023).
Figure 1. Venn diagram of low-impact solar and related terms. Image (by authors, NREL).
Sustainability 15 05895 g001
Figure 3. Sheep grazing on a solar array. Photo from source: American Solar Grazing Association.
Sustainability 15 05895 g003
Figure 4. Crop Agrivoltaics in Massachusetts. Photo by Dennis Schroeder, NREL 53069 [23].
Sustainability 15 05895 g004
Figure 5. Total O&M costs by practice in $/acre/year (top) and $/kWdc/year (bottom). Dots indicate values outside of the 5th and 95th percentiles.
Sustainability 15 05895 g005
Figure 6. Activity cost by practice ($/acre/year), 2018 and 2019. Dots indicate values outside of the 5th and 95th percentiles.
Sustainability 15 05895 g006
Figure 7. Activity costs by practice ($/kWdc/year), 2018 and 2019. Dots indicate values outside of the 5th and 95th percentiles.
Sustainability 15 05895 g007
Figure 8. Percentage of individual cost data points collected by ground cover type.
Sustainability 15 05895 g008
Figure 9. Variations of vegetated ground cover.
Sustainability 15 05895 g009
Table 1. Site and system characteristics.
a.Region#%b.Site Size#%c.Hydrology#%
Pacific West36 ≤5 acres47 Dry1222
Plains00 6–10 acres917 Mesic2444
Midwest3667 11–20 acres611 Wet1019
Northeast1120 21–50 acres1935 Not reported815
Southeast47 >50 acres1630 Total54100
Total54100 Total54100
d.Panel type#%e.Panel height#%f.Row distance#%
Fixed2954 ≤18″1426 ≤20′1528
Tracking2444 19–24″1222 21–24′36
Not reported12 25–30″1630 25–28′2241
Total54100 31–36″1019 29–32′59
Not reported24 >32′12
Total54100 Not reported815
Total54100
g.Ground cover#%h.Year started#%i.Previous land use#%
Native vegetation/ 201212 Agriculture2546
pollinators2852 201312 Ag, partially wooded,
Sheep grazing1528 201512 and/or wetland1731
Turf grass917 2016815 Misc. (abandoned ag,
Gravel24 20172343 hay, open/wooded)47
Total54100 20181222 Landfill12
2019713 Not reported713
Not reported12 Total54100
Total54100
Table 2. Site and system size summary.
Site Size
(acres)
System Size (MWac) System Size (MWdc) DC/AC Ratio Land Use Ratio (acre/MWac)Land Use Ratio (acre/MWdc)
Mean55.308.4210.961.347.165.39
Median29.814.386.401.307.005.35
Min4.000.750.980.962.531.95
Max425.0058.0078.001.5612.0012.00
Table 3. Vegetation O&M costs by ground cover type for data collected.
Ground Cover Total Combined Maintenance Cost
Native vegetation (28 sites)$/acre/yr$/kWdc/yr
Mean353 2.23
Median281 1.68
Min55 0.334
Max1333 16
STD4395.87
Sheep grazing (15 sites)$/acre/yr$/kWdc/yr
Mean307 1.55
Median281 1.28
Min10 0.55
Max853 3.28
STD2580.87
Turfgrass (9 sites)$/acre/yr$/kWdc/yr
Mean265 1.51
Median184 0.94
Min35 0.18
Max796 5.71
STD2571.97
Gravel (2 sites)$/acre/yr$/kWdc/yr
Mean293 1.75
Median293 1.75
Min253 1.29
Max333 2.22
STD230.27
Table 4. PV vegetation management activities and costs for low-impact and traditional practices ($/acre/yr).
MowingHerbicide ApplicationWeedingTrimmingGrazingFencingSite
Monitoring
Total
Native vegetation$/acre/yr$/acre/yr$/acre/yr$/acre/yr$/acre/yr$/acre/yr$/acre/yr$/acre/yr
Mean1751608913..22353
Median1211229311..14281
Min9434419..255
Max66766712222..651333
25th%114745410..9203
75th%17918811416..35414
STD130145274 17285
Count3934116--2441
Sheep grazing$/acre/yr$/acre/yr$/acre/yr$/acre/yr$/acre/yr$/acre/yr$/acre/yr$/acre/yr
Mean9599.422245559307
Median11375.501945616281
Min3014.73025510
Max139243.7066791250853
25th%5044.7156289211
75th%127149.702757742354
STD 3663 251412257180
Count68-32371423
Turf grass$/acre/yr$/acre/yr$/acre/yr$/acre/yr$/acre/yr$/acre/yr$/acre/yr$/acre/yr
Mean243164368140..53265
Median203157368140..43184
Min12011027955..2935
Max445231457225..107796
25th%15213227955..36120
75th%333196457225..60307
STD 97357167 20180
Count4422--613
Gravel$/acre/yr$/acre/yr$/acre/yr$/acre/yr$/acre/yr$/acre/yr$/acre/yr$/acre/yr
Mean.293.....293
Median.293.....293
Min.253.....253
Max.333.....333
25th%.253.....253
75th%.333.....333
STD 32 32
Count-2-----2
Table 5. PV vegetation management activities and costs for low-impact and traditional practices ($/MWdc/yr).
MowingHerbicide
Application
WeedingTrimmingGrazingFencingSite
Monitoring/
Total
Native vegetation$/MWdc/yr$/MWdc/yr$/MWdc/yr$/MWdc/yr$/MWdc/yr$/MWdc/yr$/MWdc/yr$/MWdc/yr
Mean1132105852877..1292233
Median74361245070..931658
Min24618725255..12334
Max80008000759103..43816,000
25th%65435040461..451123
75th%10101267686102..2132252
STD1665177914917 1143392
Count3934116--2441
Sheep grazing$/MWdc/yr$/MWdc/yr$/MWdc/yr$/MWdc/yr$/MWdc/yr$/MWdc/yr$/MWdc/yr$/MWdc/yr
Mean429567.16810092322561550
Median466445.200962194781278
Min11581.4411510626547
Max7061680.259256440511543282
25th%231214.44607108471013
75th%589730.25912463941762204
STD180400 86565116257742
Count68-32371423
Turf grass$/MWdc/yr$/MWdc/yr$/MWdc/yr$/MWdc/yr$/MWdc/yr$/MWdc/yr$/MWdc/yr$/MWdc/yr
Mean122510392641576..3461513
Median11639102641576..269944
Min7206752000215..205178
Max185416623282938..7695713
25th%7286962000215..256574
75th%172213823282938..3082205
STD416326507285 1221392
Count4422--613
Gravel$/MWdc/yr$/MWdc/yr$/MWdc/yr$/MWdc/yr$/MWdc/yr$/MWdc/yr$/MWdc/yr$/MWdc/yr
Mean.1754.....1754
Median.1754.....1754
Min.1285.....1285
Max.2222.....2222
25th%.1285.....1285
75th%.2222.....2222
STD 370 370
Count-2-----2
Table 6. Average vegetation management events by year by ground cover type.
Veg. Management EventNative VegetationSheep GrazingTurfgrassGravel
Mowing211.50
Herbicide1112
Weeding1110
Trimming1120
Grazing1100
Fencing0100
Monitoring2.53.520
Table 7. Drivers of O&M costs.
DriverFindings from Responders
Prior land use and soil type
-
Prior land use is one of the largest drivers of cost differences for vegetation O&M.
-
Past land use can impact the establishment and survival rate for post-PV construction vegetation establishment.
-
Invasive species that are dormant in the soil may resurface after ground disturbance during construction; they present ongoing problems to manage.
-
On pastures with prevalent invasive species, plowing was noted to exacerbate their presence; broadcast or drill seeding was advised as an alternative to prevent disturbance.
-
On former agricultural production sites, fewer invasives were encountered after plowing and seeding natives, likely due to pesticide residuals.
-
Soil conditions (e.g., sandy, clay-heavy, and rocky soils) can impact seed establishment and should be incorporated into plant designs.
Vegetation type and establishment
-
Whereas turfgrass was typically noted as ‘fast-establishing,’ native species showed an establishment range of 3–10 years.
-
Client and public expectations must be managed before and during the potentially long establishment period of natives.
-
Close observation and care, particularly during the first 3–5 years, is critical for the long-term establishment of native vegetation sites.
-
Several vegetation management contractors noted that, once properly established, native species outcompeted invasives, leading to a major reduction or disappearance of weeds.
-
Spot spraying of invasives and reseeding events may be needed for natives’ success during establishment.
-
Native species may be more expensive and harder to source than turfgrass.
Mowing
-
Mowing is the most common vegetation management practice and takes up the most time on-site.
-
Several observations of reduced mowing events over time for native vegetation were made: 1–3 times/year for the first 3–5 years, followed by strip-mowing to prevent panel shading and leaving center areas untouched.
-
Low array heights and uneven terrain can lead to increased O&M costs and can necessitate equipment purchases.
-
Array heights of 18 inches may reduce CAPEX, but can lead to concerns about mower access.
-
Aboveground cable systems can reduce electrical O&M, but add time for mower access and maneuvering.
-
PV module damage from rocks or other objects flung by mowers is more pronounced at sites with lower array heights.
-
Increased labor costs were noted when string trimmers were needed to abate vegetation underneath an array that was unreachable by mowers.
Herbicide
-
Herbicide application, in varying degrees of intensity, is often carried out to abate invasive species when establishing vegetative ground cover, whether native or turfgrass.
-
When herbicide is not allowed, weeds may be hand pulled, resulting in higher costs.
-
Overapplication of herbicide can lead to erosion concerns at some sites.
Grazing
-
Grazing requires time, resource planning, and management each year.
-
Graziers are typically not present throughout grazing events; grazier assistants (i.e., farm sitters) may also assist as needed.
-
Solar graziers tend to aim to keep their sheep at one site most of the time to minimize the costs associated with moving flocks.
-
Pasture resource availability, human resources, flock size, and other factors influence decisions to move flocks.
-
For rotational formats, fewer sheep (usually one dry ewe per acre) are typically deployed in the first year of operation during vegetation establishment, and 3–4 ewes per acre are deployed in the second and later years; fewer ewes are deployed in drier climates, where vegetation is less lush.
-
For intensive grazing plans, 100 sheep may be able to graze one acre per day for 10–15 days at a time; flock size and duration of grazing may be adjusted based on site size.
-
Water hauling is one of the main costs of sheep grazing.
-
Graziers incur costs to purchase, haul, set up, and take down supplies and equipment, including water tanks, pumps, mineral feeders, and temporary fencing.
-
Drilling wells for on-site water was noted as a primary cost-saving measure to reduce site trips.
-
Temporary fencing must be installed at the beginning of the season; it might need to be moved several times during the season (depending on the site characteristics and grazing strategy), and then removed and dispatched to other sites in the case of more intense grazing strategies.
Disclaimer/Publisher’s Note: The statements, opinions and data contained in all publications are solely those of the individual author(s) and contributor(s) and not of MDPI and/or the editor(s). MDPI and/or the editor(s) disclaim responsibility for any injury to people or property resulting from any ideas, methods, instructions or products referred to in the content.

