1. Introduction
The ability to connect by air may be crucial in promoting regional economic growth and advancing the long-term goals of national economies. Air connectivity facilitates a country’s integration into the global economy by facilitating the movement of people, ideas, products, and services, as well as financial investments. Airports are essential for transport hubs operating in multiple local, state, national, and international transport networks because they are not silos. Because of this, improving airport accessibility is crucial for the entire value chain. Whether on a trip for business or pleasure, it never ends at the airport.
Therefore, air connectivity provides immediate benefits to those who utilise aviation services and larger benefits to the economy as a whole due to its positive effects on productivity and economic performance. As a result of these advantages, governments should research the influence of their policies on air connectivity and the factors that contribute to better air connectivity outcomes [
1]. As we respond to the difficulties of deteriorating road congestion and its influence on travel time and travel time reliability, the availability of mass transportation to connect airports throughout the world will become increasingly vital [
2].
For a long time, the air transport industry has doubled in size every fifteen years, rising faster than the majority of other industries. As per a report [
3], since 1960, the demand for passenger and freight services has increased in tandem with technological advancement and investment. This increase in air travel contrasts favourably with the global GDP, the broadest measure of worldwide output, which increased in real terms by more than five times over the same time span. “Asia/Pacific continued to be the most active region, making up 35% of all revenue-based traffic followed by Europe and North America, each with 26% and 22%” [
3]. In their report, the International Air Transport Association (IATA) predicts that by 2030, “India would surpass both China and the United States as the third-largest air passenger market in the world” [
4]. In an effort to accommodate the increased aviation traffic, the Indian government has been attempting to construct more airports. As of the year 2020, India had 153 airports that were open. By the year 2040, India expects to have between 190 and 200 operational airports [
5]. Therefore, feeder landside connectivity to airports must be investigated with regard to air traffic data and the need for airport connectivity in order to maximise airport benefits.
The Ministry of Civil Aviation (MoCA), Government of India, announced the National Civil Aviation Policy 2016 with the aim to increase regional connectivity through financial support and infrastructure development (NCAP 2016). The Regional Airport Development Scheme for India (UDAN), a regional airport development programme, is part of the Regional Connectivity Scheme (RCS) for enhancing underserved aviation links. The objective is to make air travel more accessible and affordable in order to foster inclusive national economic development, job creation, and the development of air transport infrastructure in all areas and states of India. The potential RCS airports were chosen based on the following criteria. First and foremost, a distance of at least 150 km from the nearest operational airport (with a few exceptions), as well as demographic profiles, industrial profiles, passenger demand, and market potential were the factors that were considered for selected airport sites. With the present runway and terminal quality at the airports, there is a need to plan for future land acquisition, financial investments, and access to alternative modes of transportation, such as highways and trains, as well as other alternative modes [
6]. The reason for keeping the distance between operational airports at 150 km is that there are very few airports in India that are closer to each other than 150 km apart, and for a distance of 150 km, travelling by road is much more advantageous in terms of time, cost, and convenience than flying, with the exception of areas with geographical challenges, such as hilly regions [
7].
In order to better serve airport infrastructure, other connectivity infrastructures which serve as the major support systems for airports must be improved. These changes in road network connectivity have resulted in the growth of metro areas near airports. Airport-linked productivity, aviation-oriented agglomeration economies, and changes in connectivity indices have been highlighted by authors such as Kasarda [
8]. Following the UDAN initiative, which has been proposed and is presently being implemented in India, it is critical to assess changes in several parameters linked to connectivity and accessibility in expanding airport-oriented regions in India [
9]. As air travel serves markets that are time-sensitive, the ground access to airports needs to be efficient, and the criteria associated with airports need to be modified on a consistent basis. As a consequence of this, there is an immediate requirement to prioritise the incorporation of specialized transportation services in a large number of additional Indian cities in order to develop a solution that will be effective in the long run [
10].
2. Literature Review
A network is defined as a “structure made up of links joined by nodes” [
11]. Since 1960, a number of indicators based on networks have been created to analyse the transport network. These indicators can be divided into three categories: “connectivity, cyclic property, and efficiency assessments”. To quantify the geographical structure of the road network and confirm its association with regional economic characteristics, [
12] developed graph theory metrics. The understanding of network structure has always stimulated the interest of geographers, who consider the spatial characteristics of road networks as critical inputs to regional development. Topics that involve understanding the topology of the transportation networks that connect geographic areas have recently received a great deal of interest [
11].
Researchers have studied the use of heterogeneity, link patterns, and continuity in measuring road network structures. Following this, the proposed network assessments have been used to track network changes. Various geographical metrics quantify urban transport network studies [
11]. In addition to this, it was interesting to explore the concept of airport regional influences that go beyond the cities they belong to. Author [
13] has explored the dimensions of influence areas that make an impact on different radiuses around the airport. The area considered for the demarcation of the hinterland in the study was up to 80 km from the airport [
13].
Transportation influences urban form. According to researchers [
14], the city of the twenty-first century is shaped by its “multi-modal, multipurpose enterprise”—the airport—and hence deserves the designation aerotropolis. Airports respond to demands for transportation and communication with rapid and flexible service in a new speed-driven, internationally networked economy. “Connectivity is the degree to which nodes in a network are linked to one another” [
15]. Despite the fact that these are the most widely used and discussed connectivity measures in contemporary air transport research, the list is not exhaustive. Furthermore, changes to these measurements are feasible, such as weighting connection by node features such as airport seat capacity or the airport region’s GDP [
16,
17].
Through research based on Christeller’s theory of settlements, researchers have subdivided the significance of urban centres into two basic types: absolute importance, or “nodality”, also known as centrality. The nodality of a centre can be evaluated by the population and the range of services it can provide inside its confines, whereas its centrality is determined by the number of services it provides to neighbouring centres [
18].
In other words, nodality refers to the significance of a centre to all users, whereas centrality refers to the significance of a centre to external users from other centres. As described by the author of [
19], in 1975, Preston introduced this concept in a mathematical form, stating that the centrality of a centre in a closed urban system is the difference between its nodality and its local importance, as measured by the size of local marketplaces. Urban flows are the main notions that define and differentiate the significance of these types of centres in this model. Centrality is characterized here as “a non-local significance quantified by incoming external flows, a subset of nodality” [
19].
In contrast to centrality, several scholars suggest that connectivity can be further defined in two ways: (1) the accessibility or (in)direct connectivity perspective, and (2) the centrality or hub connectivity perspective. The first factor takes into account the quantity and quality of both direct and indirect air travel connections that are accessible to the customer at a particular airport. The second metric determines the total number of possible connections that can be made through a particular airport [
16,
20].
Such analysis is vital because it provides the knowledge necessary to devise actions to boost airport competitiveness. These measures can reveal, for instance, how successfully an airport operates as a connecting hub in a particular origin–destination market relative to competing hubs. In addition, connectivity characteristics enable governments, terminals, and aircraft to measure network performance over time and assess the impact of various policies on maintaining or enhancing network performance. As a result, connectivity assessments are routinely used as inputs in airport and airline strategic planning. Regional economic connectivity indicators can assist policymakers by analysing travel times to a given percentage of global GDP or population from a predefined location [
21].
In fact, academic studies have proposed a wide range of connectivity indicators that account for both direct and indirect connection in airline networks. Some are based on network topology and complex network theory, while others are based on the operational characteristics of airline hub-and-spoke networks or on findings from social science studies [
16,
20].
2.1. Defining Airport Regions
In the literature, there have been various terms as well as models that are mentioned relating to airport-centric urbanscapes and development. These models are linked to the economic activities located and spread out around the airports. They are, namely, “airport city, aerotropolis, airport region, airfront, global transpark, airport corridor, airea, decoplex, aircity, aeropolis, aeropark, aviopolis, avioport, flight forum, sky city, airpark, aero city and aeroscape”, as cited in [
22]. Governments, airport authorities, and developers advocate these approaches as economically and physically integrated airport and urban development ventures. Among the above stated terms, airport city and aerotropolis are the most prevalent in the literature. Airport city is a term used globally to describe the expansion of aviation and nonaviation activity in and around airports because of cities relying heavily on airports. According to Kasarda, an American urban economist and sociologist, as more industries are drawn to airport cities and along the transportation infrastructure connecting such expansions, a new urban form emerges. This urban structure is known as “an aerotropolis, and it consists of developments that can reach up to 30 km from airports” [
23]. Aerotropolis is also defined by Kasarda as a metropolitan subregion centred on an airport. He claims that a typical metropolis has a central business centre and commuter-linked suburbs [
24].
An airport area is a growing aerotropolis where the airport is connected by road and rail networks to the host city and other commercial and industrial hubs. The construction of an airport corridor between the airport and the host city has been suggested by several authors. An airport corridor is defined as a rail, expressway, and highway connection between the airport and the host city with more public involvement in infrastructure planning. An aerotropolis is a re-creation of an airport city, complete with themed and logistical zones, businesses, and residential neighbourhoods [
25].
2.2. Connectivity Measures
Connectivity indicators are used to assess the performance of airline networks, airports, and regions. They allow policymakers and industry professionals to compare network performance with that of other airports, airline networks, and regions, and to construct regions accordingly [
20].
In transportation network development, accessibility is a crucial requirement for analysing a network’s spatial interconnectivity and evaluating travel prospects. Network metrics such as connectivity and node accessibility are included in accessibility. There are several ways to demonstrate the connectivity and accessibility of a transportation network. In 1959, Hansen defined accessibility as “the potential for interaction and provided a potential-based approach to evaluate accessibility in cities” [
26]. In 1960, Garrison presented “graph theoretic principles to study the topological accessibility of a transportation network utilising accessibility indices (‘beta index, association number, alpha index, gamma index’) and node accessibility indices (i.e., Shimbel index and nodal degree)” [
26]. In various studies, graph-theory-based network accessibility measures have been applied in conducting transportation research. The goal of graph-based evaluations is to statistically assess the spatial distribution of travel options based on travel time, distance, theoretical accessibility models, or structural approaches such as spatial syntax research [
27].
Some locations are more accessible than others, indicating that there are inequalities between the locations. Consequently, accessibility reflects geographical disparity. Consequently, the notion and concept of accessibility is based upon two pillars: The first is the location, which involves evaluating the proximity of areas/zones with respect to the transport infrastructures that promote movement. Each region or zone has a unique set of features, such as its population or economic activity level. The second factor is distance, which is established by the physical or geographical separation between different regions/zones [
28].
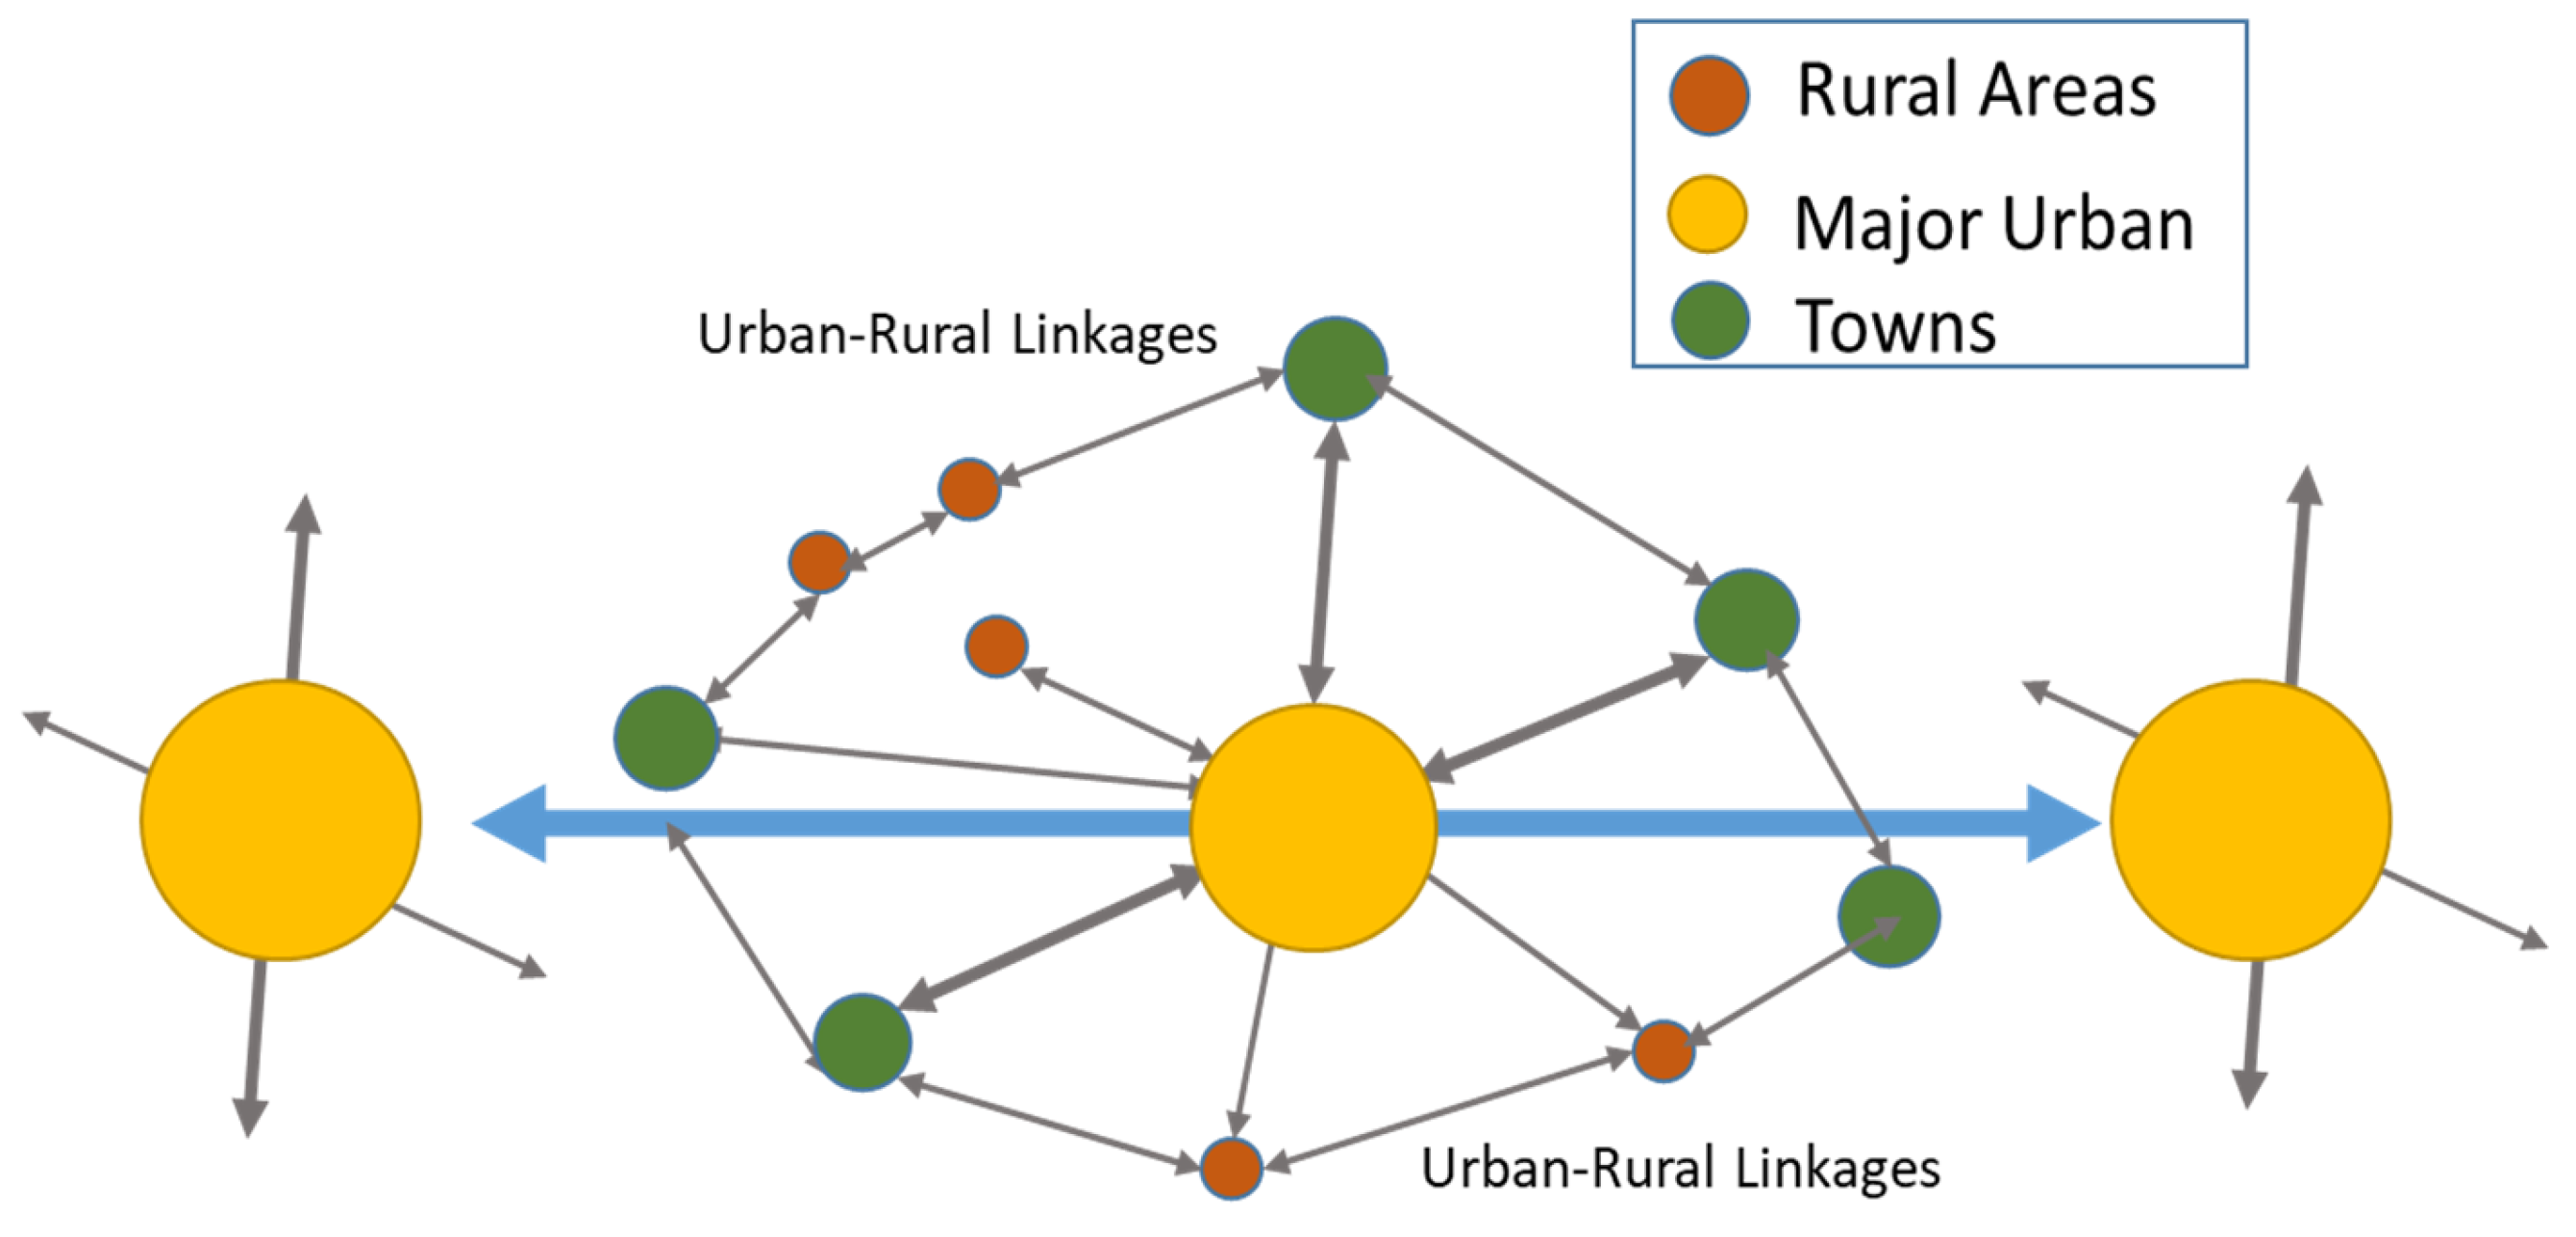
In order to study the structure of interconnected links in a network, several network-based indicators have been developed. These indicators can be categorised as “connectivity, cyclic property, and efficiency metrics”. Understanding network structure has typically only been of interest to geographers, who view the spatial shape of a given road network as a critical determinant in regional development. In recent years, there has been a great amount of interest in analysing the spatial characteristics of transport networks that connect places in geographic space and contribute to the development of new areas as a result of improved connectivity (
Figure 1) [
11].
The suggested indices for computing landside connectivity in the airport region are distance-based and topology-based on a system of nodes and links, given these parameters. Multiple studies have linked the airport to changes in connectivity indicators in the region served by the airport. Numerous studies on discovering airside connectivity indices using the hub-and-spoke paradigm have been carried out [
29].
Accessibility is a quantitative attribute only applicable to certain transportation system components. Topological accessibility quantifies network accessibility using nodes and links in a transportation network. Accessibility, or isochrone accessibility, measures how well-connected sites are across a given distance, assuming geography is continuous [
30].
Figure 1.
Connectivity and regional setting [
31].
Figure 1.
Connectivity and regional setting [
31].
3. Materials and Methods
This study aims to evaluate the change in road network connectivity in the influence region of an airport. According to the literature, it is evident that there is a direct as well as an indirect impact of airport infrastructure on landside connectivity, in which roads act as feeding links to the airport in the region. In order to determine the impact, a methodology was formulated to compute the landside connectivity through the lens of geographical influence and links to the airport. In addition, as the extent of influence radius for different airports is different, it was found to be essential to delineate the influence area. In the literature review, it was found that hinterland radius was considered different for different contexts around the airport based on utility functions such as tourism market capture, and commodity hinterland could extend up to 80 km [
13]. In this study, the radiuses of influence of airports on connectivity for different tiers of airports were determined from an unpublished thesis report as being 150 km, 70 km, and 46 km for catchment areas for respective hierarchies of airports in India (Tier I, Tier II, and Tier III, respectively) [
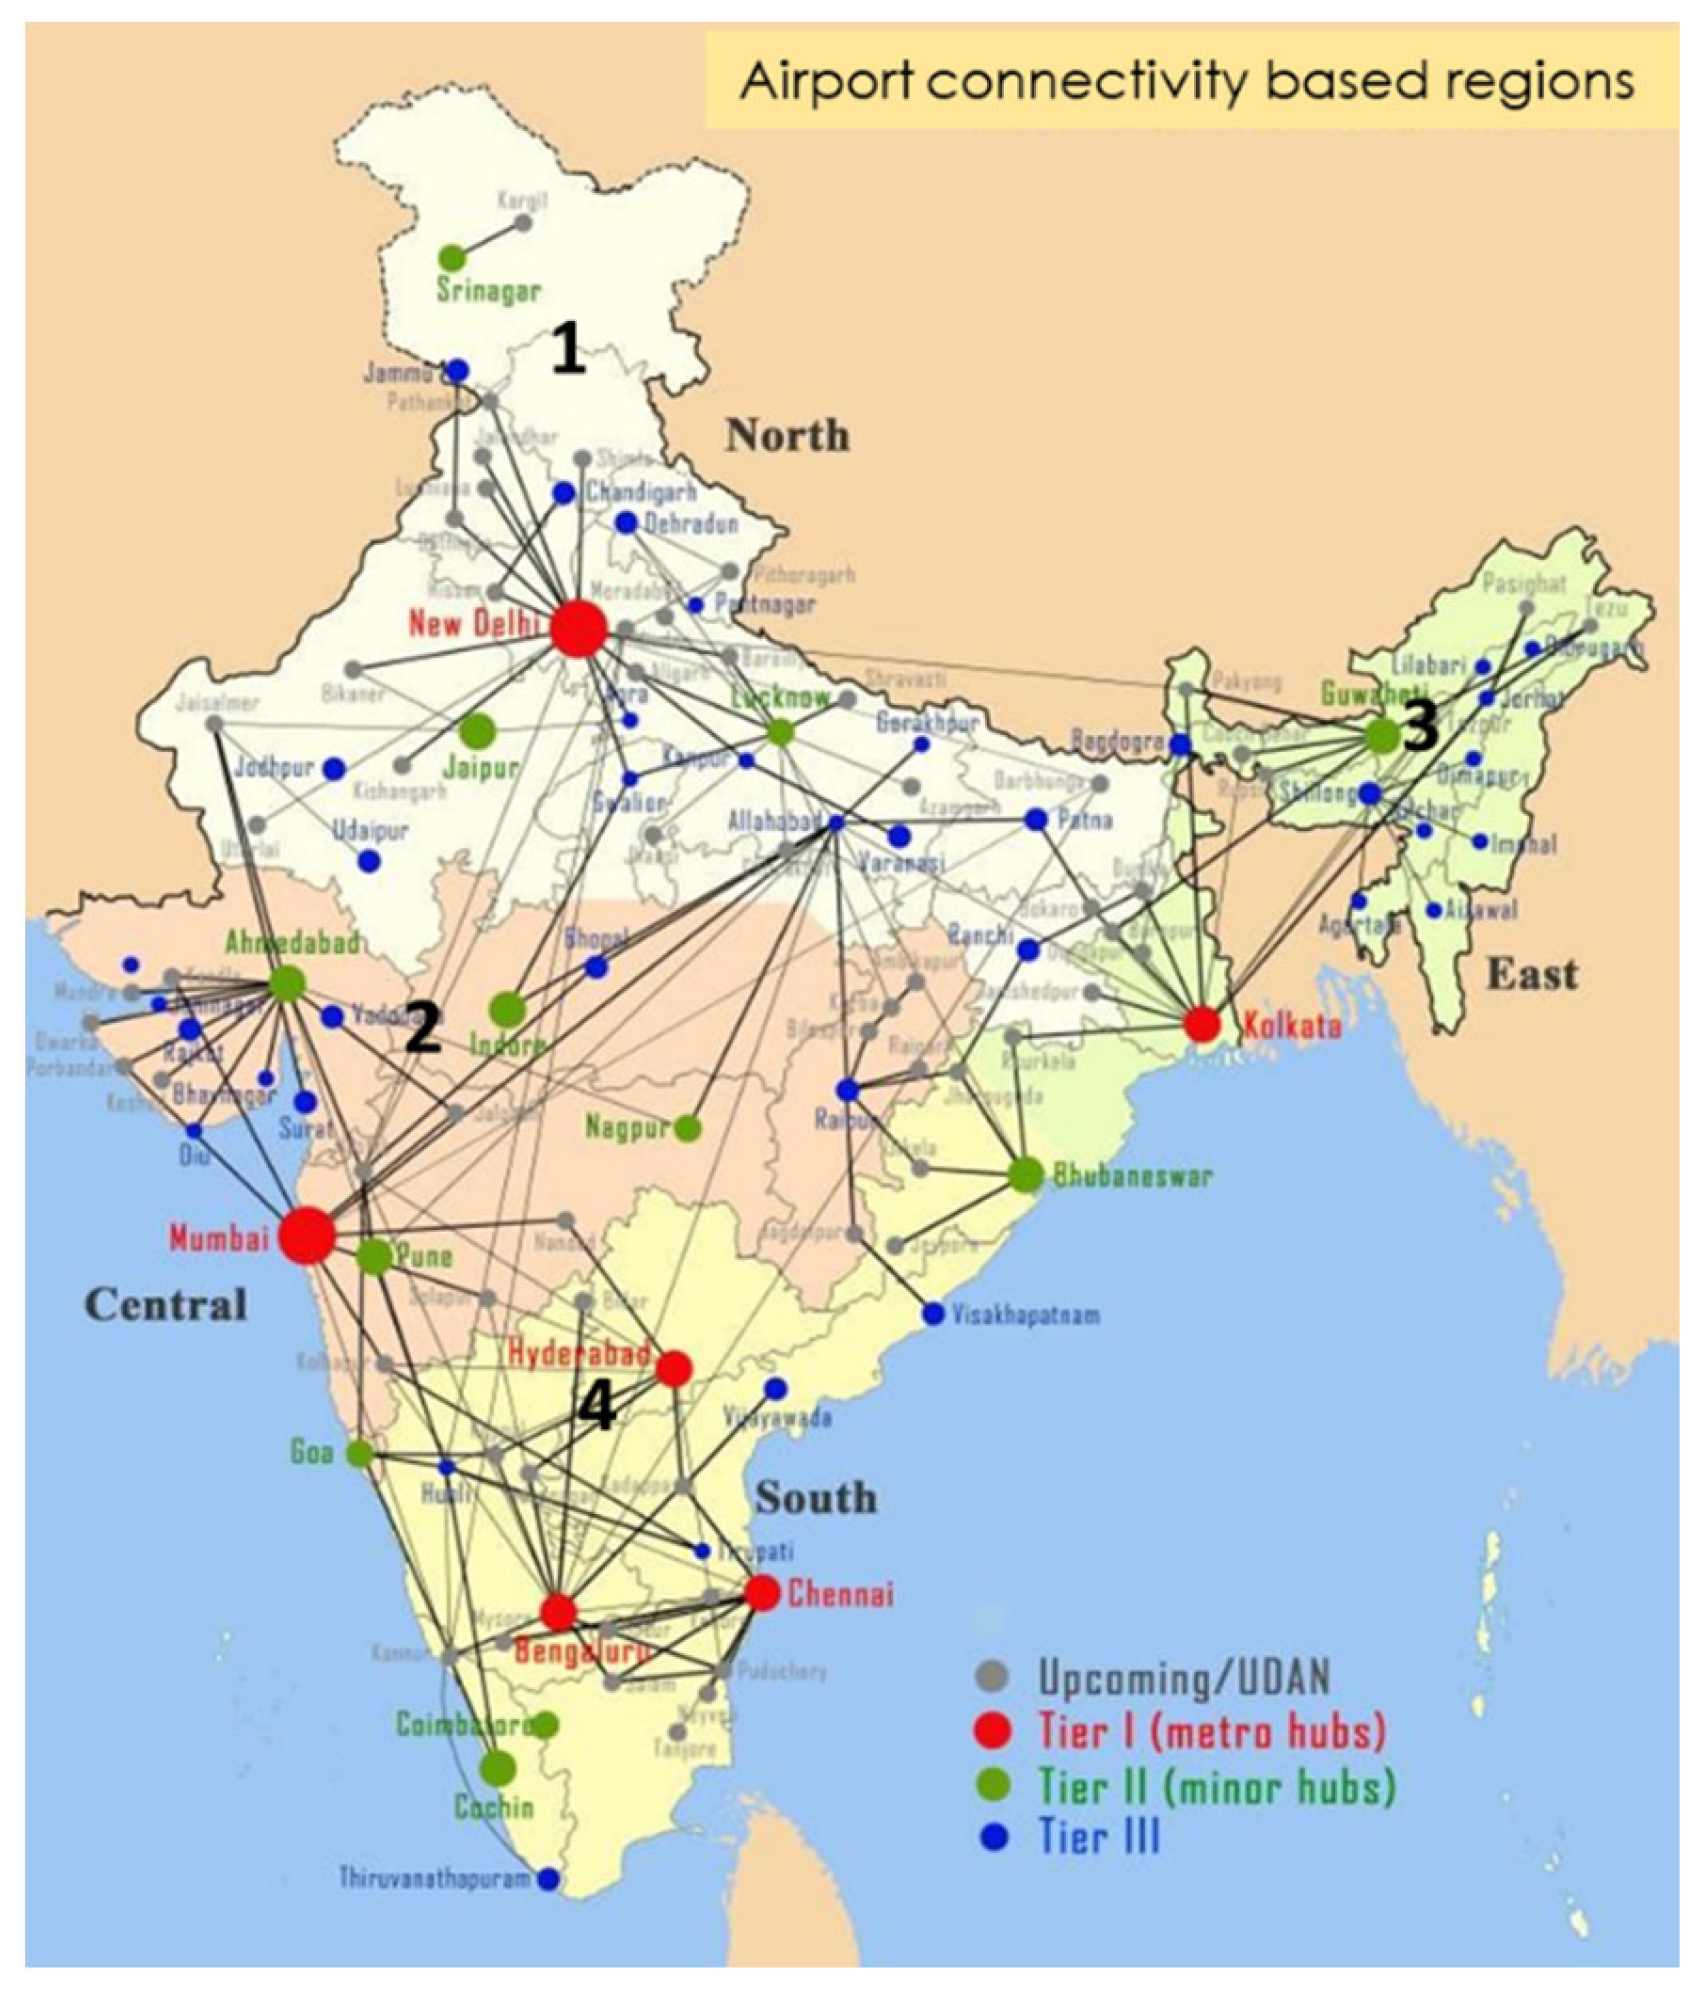
32]. As per the previous study conducted on airside connectivity based on the hub-and-spoke concept, Indian airports were divided into four regions. In this study, various indices such as participation coefficient, Z-score, hubbing potential index, intercommunity index, and intercommunity coefficient were applied on the airline network to delineate airport regions, as given in
Figure 2 The author of [
29] ranked 36 airports based on the applied indices for each region. In continuation to that, further delineated airport regions were used for computing landside connectivity.
In order to compute landside connectivity, the road network was taken as a network of feeder links to the airport and nearby cities, and towns were taken as important nodes. The concept of nodes and links was used to empirically measure the landside connectivity in the influence regions of the airports.
Around the airport in the respective influence area, all the national highways, state highways, major district roads, and other roads were defined as links in the analysis. All the towns and cities in the influence radius of the airport were defined as nodes. The data for cities, towns, and highways were retrieved from the Census of India website for the years 2001 and 2011, as the data for the year 2021 are yet to be published [
33].
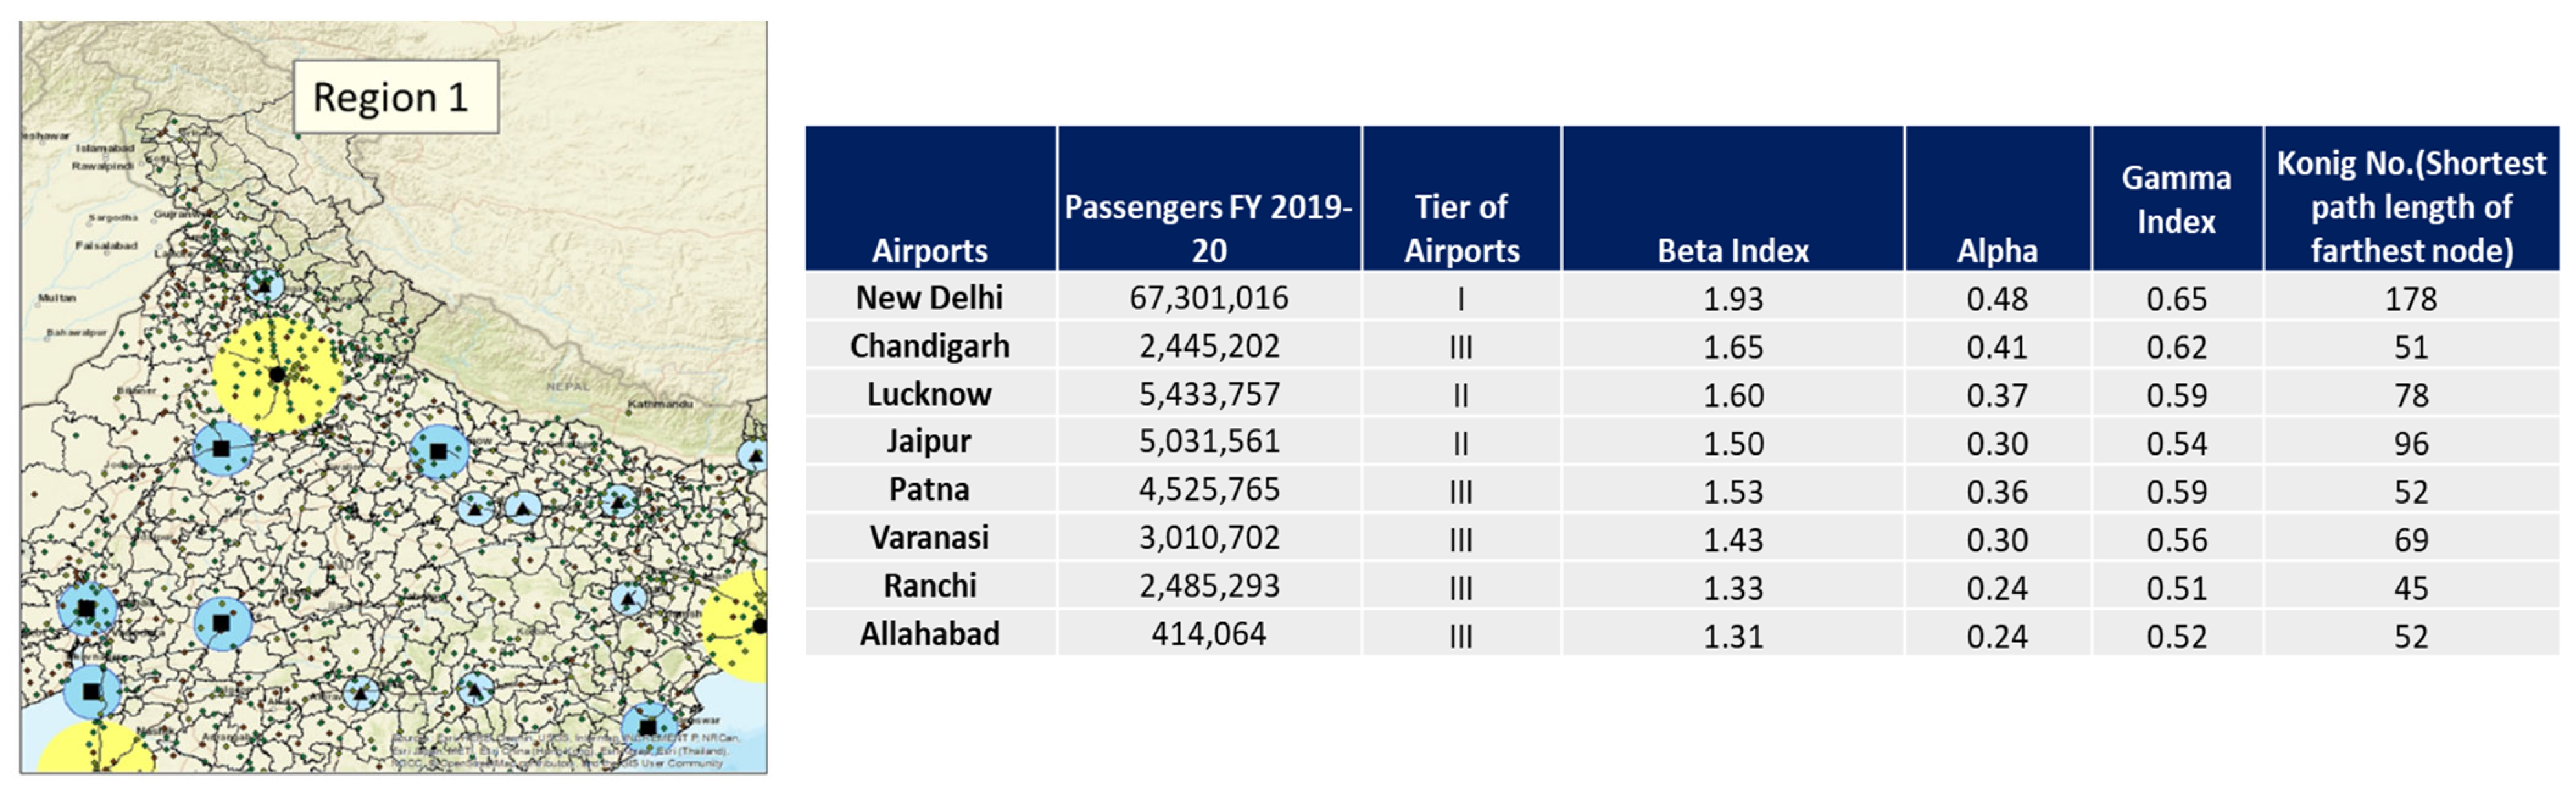
In order to further compute landside connectivity, following the node–link concept, graph theory was applied and indices, namely alpha, beta, and gamma indices, were calculated. In addition to this, König number and passenger footfall [
34] in numbers were also included for the ranking of airports for further analysis (
Figure 3).
3.1. Airport Regions Based on Landside Connectivity
In order to identify airport regions on the basis of connectivity, the study area was selected on the basis of airside connectivity as well as landside connectivity. In order to compute landside connectivity, 36 airports of different airport tiers and 4 different regions were identified using rankings based on different tiers of airports, participation coefficient, Z-score, hubbing potential, potential index, and intercommunity coefficient.
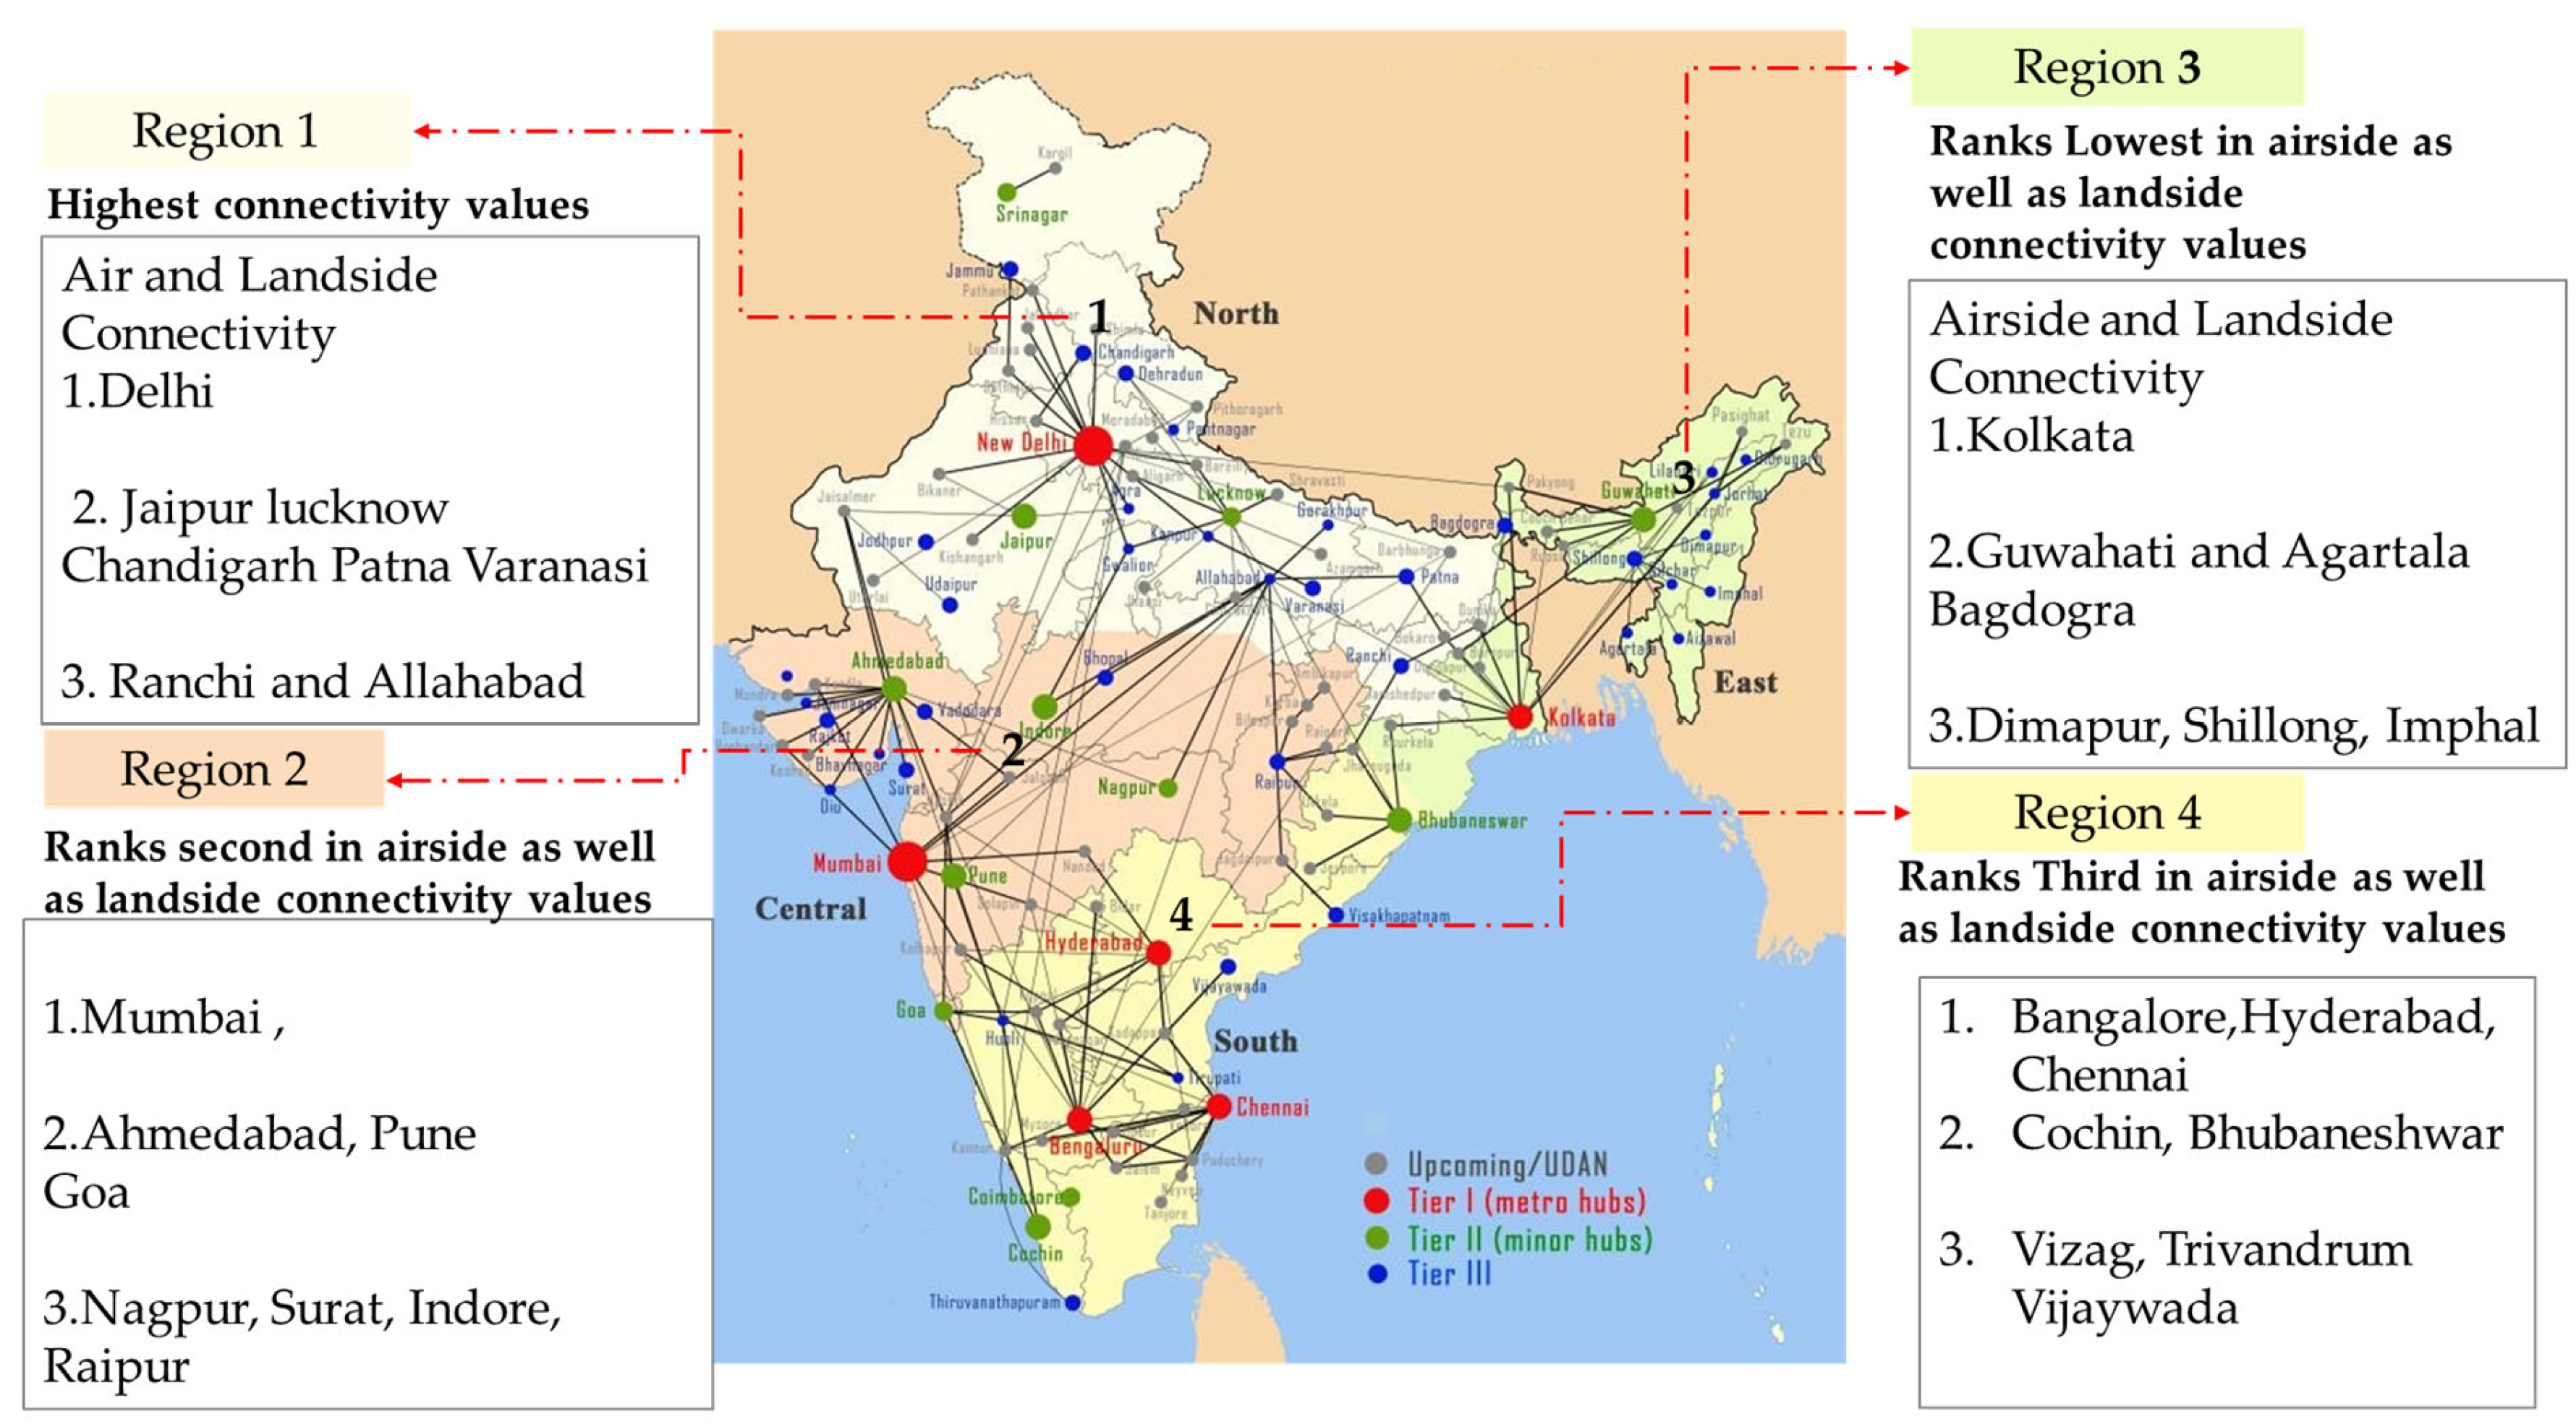
Based on airside connectivity using hub-and-spoke concepts, the authors of this study concluded that in the 4 delineated regions, the northern region of India has the highest connectivity and Region 3 has the lowest [
29].
Amongst airports of Region 1, New Delhi, Jaipur, and Lucknow lie topmost in the ranking. In Region 3, which is the Northeast region, Kolkata, Guwahati, and Bagdogra rank topmost in the region [
29].
For computation of landside connectivity, graph theory was applied using GIS techniques. The road network was converted into a planar graph and then into a matrix. For graph theory analysis, road links are defined as edges and cities and towns as nodes.
The connectivity measures that were applied are “Alpha Index, Beta Index, Gamma Index and Koenig No”. These measures were computed using QGIS network analysis tool to convert the road network into planar graph. These indices are defined as:
- a.
“Beta Index. Measures the level of connectivity in a graph and is expressed by the relationship between the number of links (e) over the number of nodes (v). Trees and simple networks have Beta value of less than one” [
35].
- b.
“Alpha Index. A measure of connectivity which evaluates the number of cycles in a graph in comparison with the maximum number of cycles. The higher the alpha index, the more a network is connected” [
35].
- c.
“Gamma Index. A measure of connectivity that considers the relationship between the number of observed links and the number of possible links. The value of gamma is between 0 and 1 where a value of 1 indicates a completely connected network and would be extremely unlikely. Gamma is an efficient value to measure the progression of a network in time” [
35].
- d.
“Koenig number (or associated number, eccentricity). A measure of farness based on the number of links needed to reach the most distant node in the graph” [
35].
3.2. Results
In order to further explore accessibility in the airport region, the case study selection criteria were formulated. For the four selected regions, the rankings after applying graph theory to each airport can be seen in (
Figure 4,
Figure 5,
Figure 6 and
Figure 7)
Region 1: As a metro hub, New Delhi ranks first in landside connectivity, followed by Lucknow in Tier II and Chandigarh in Tier III.
Figure 4.
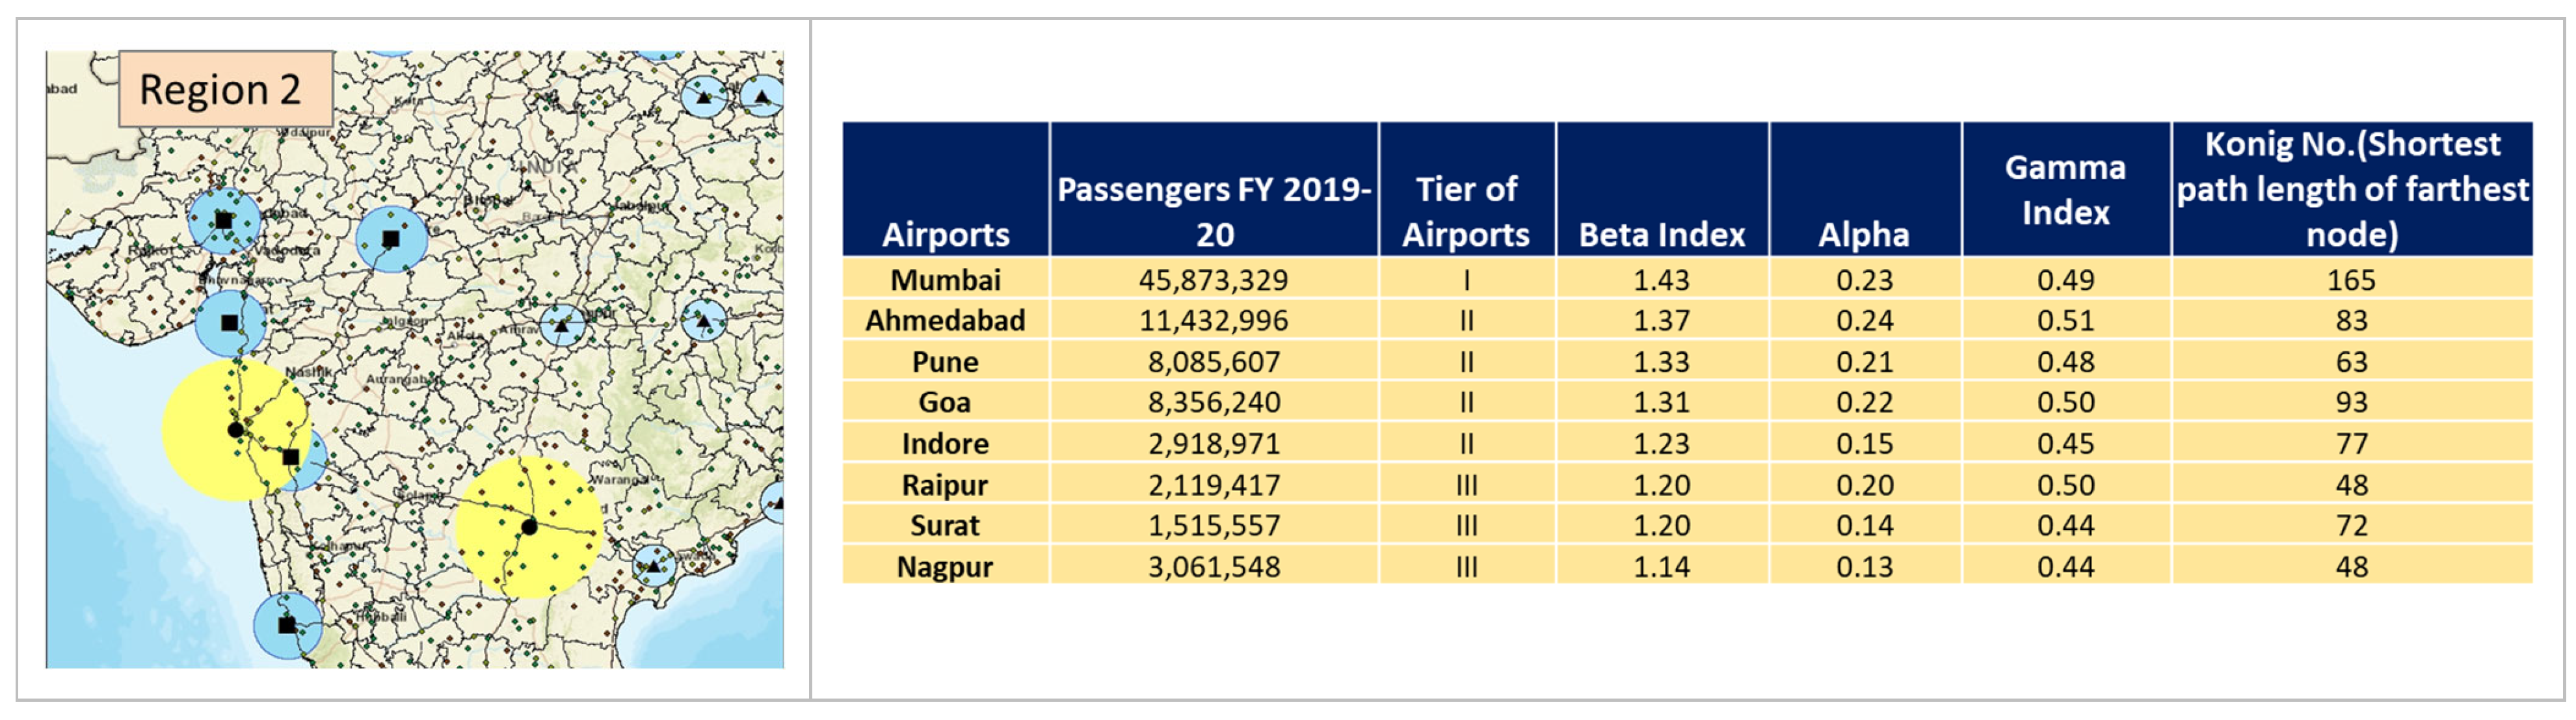
Region 2: As a metro hub, Mumbai ranks first in landside connectivity, followed by Ahmedabad in Tier II and Surat and Raipur in Tier III.
Figure 5.
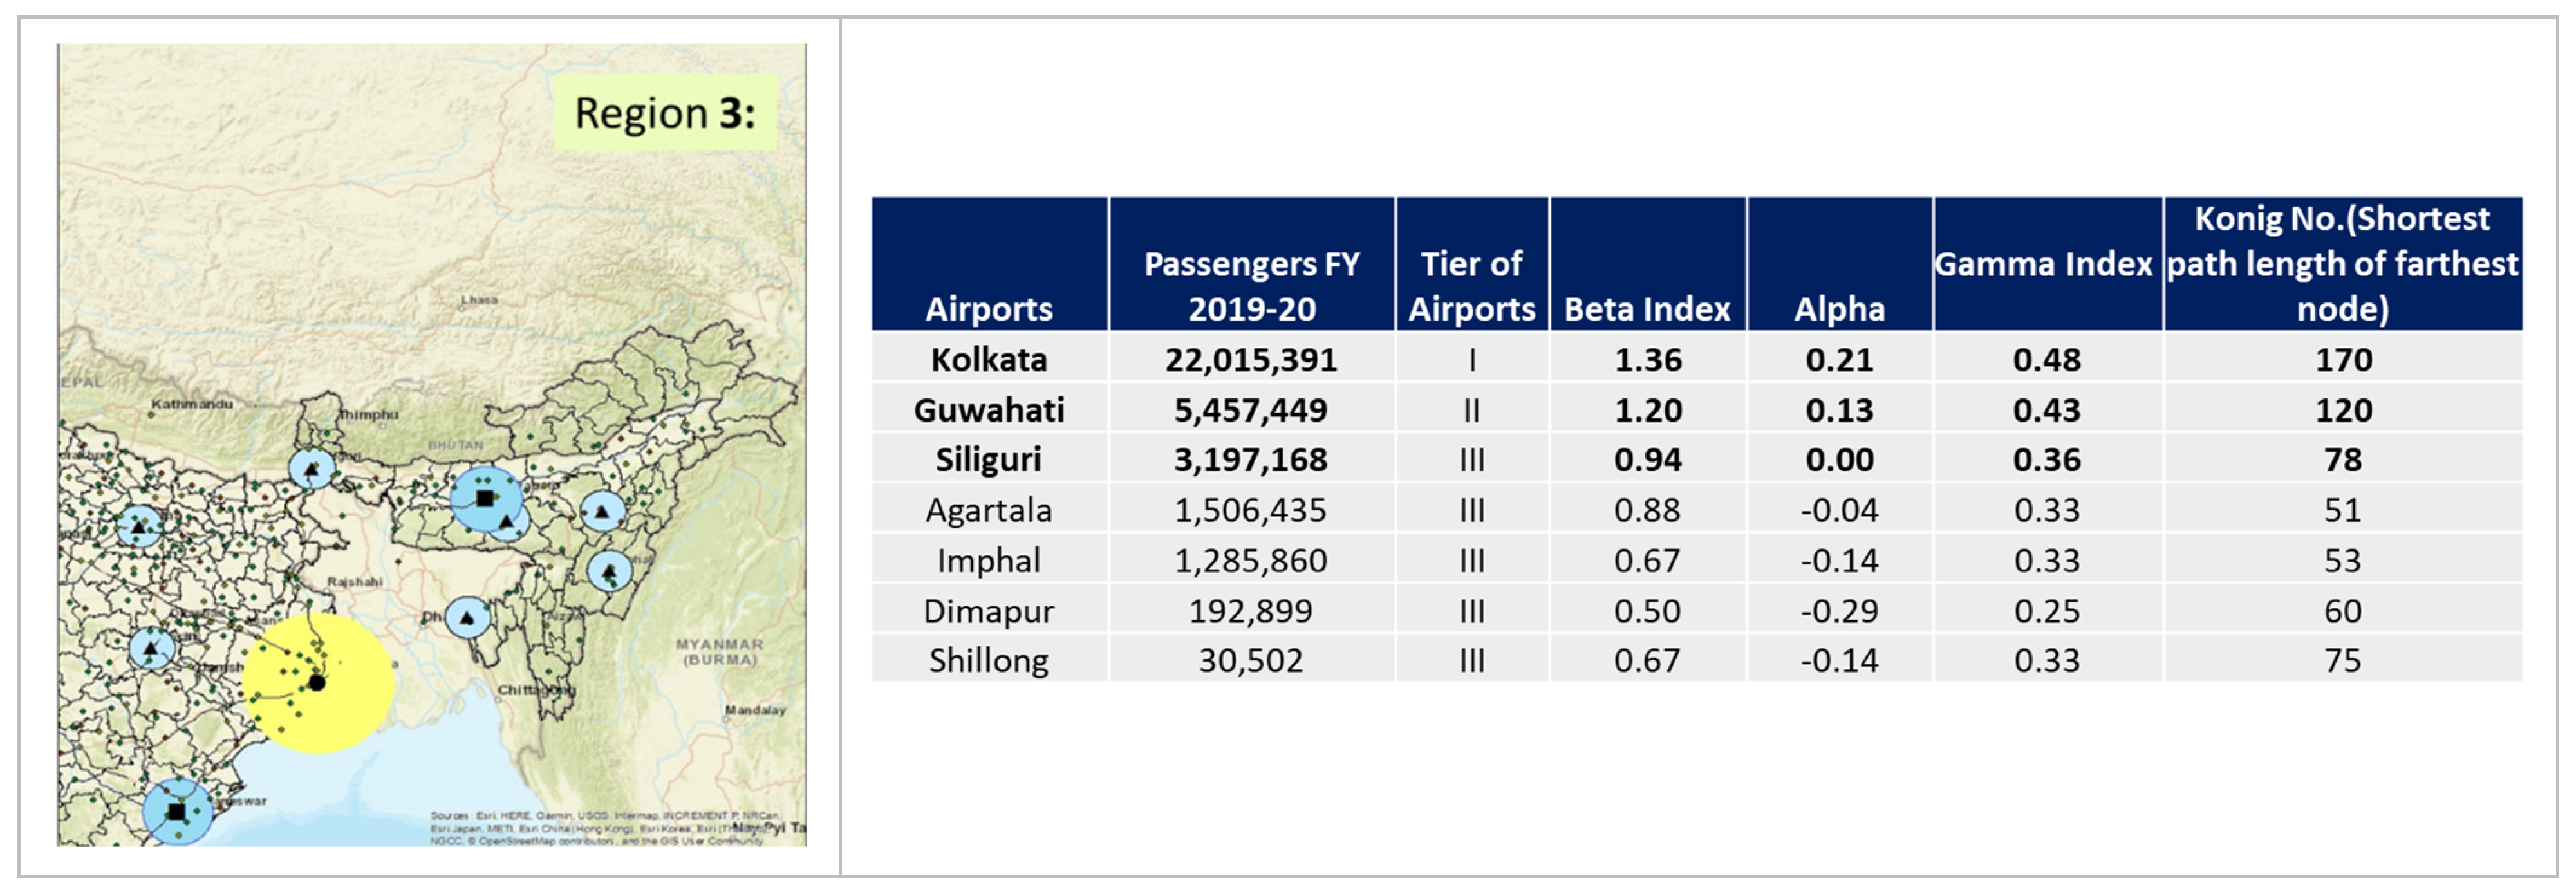
Region 3: As a metro hub, Kolkata ranks first in landside connectivity, followed by Guwahati in Tier II and Siliguri in Tier III.
Figure 6.
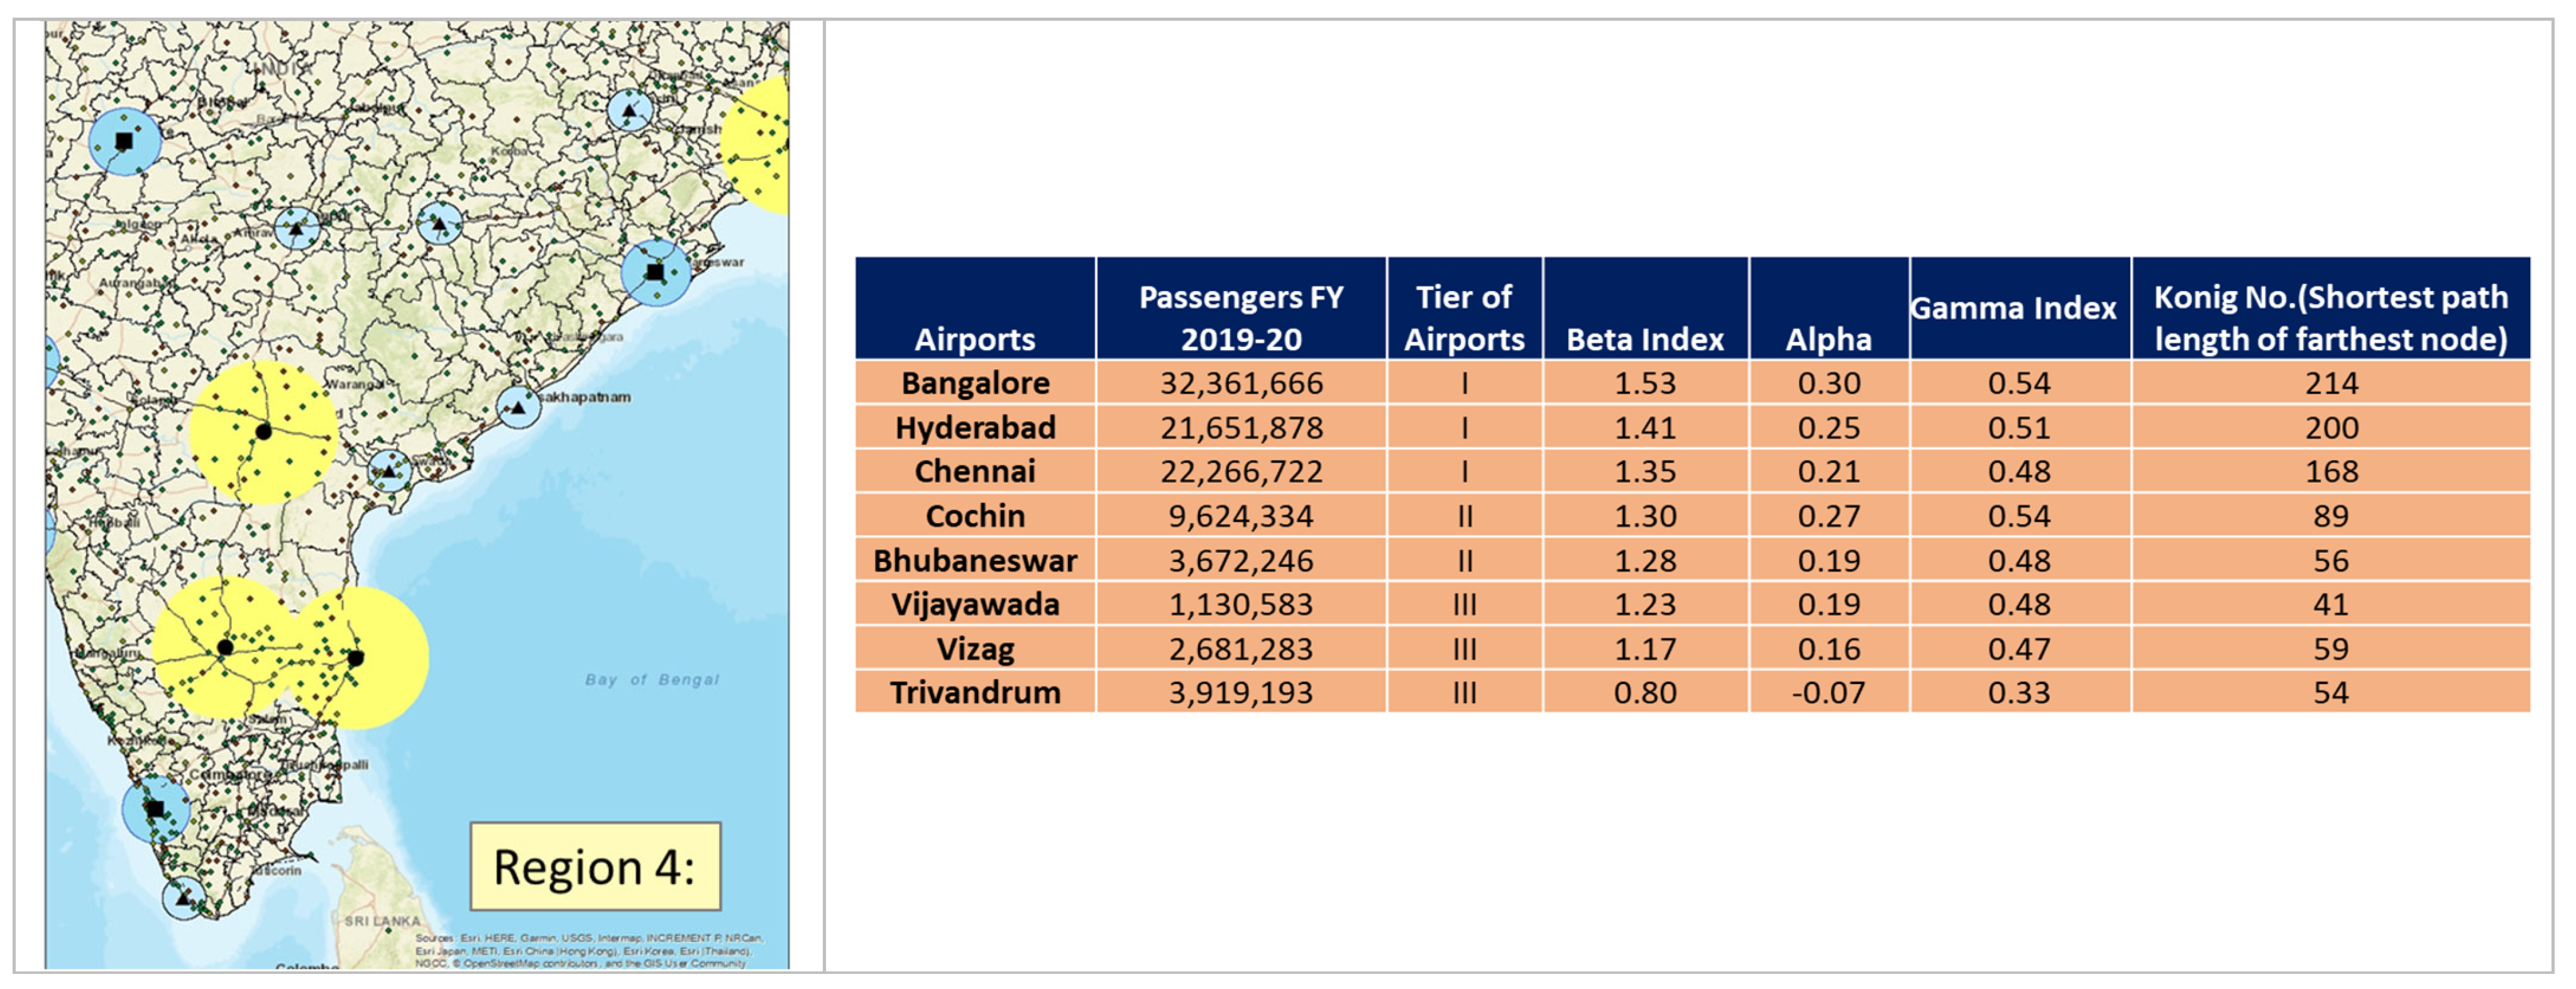
Region 4: As a metro hub, Bengaluru ranks first in landside connectivity, followed by Kochi in Tier II and Vijaywada in Tier III.
Figure 7.
For the four identified regions, it can be inferred from the analysis that Region 1 has the highest landside and airside connectivity values, followed by Region 2, Region 4, and Region 3, in descending order.
Figure 8.
Combining the impacts of airport landside and airside connectivity, ranking of airports was conducted. Furthermore, to investigate the role of airports in the evolution of road networks in a given region, Region 3 was selected. Given its rank at the bottom of the rankings, one might conclude that the connectivity was, overall, considered to be insufficient. Therefore, conducting further research into the configuration of the airport in the context of the provision of connectivity in Region 3 was evidently more reliable. Compared with other regions, connectivity in Region 3 was significantly inferior. Additionally, Region 3 comprises geographically challenging places, making airport connectivity a viable mode of transit. In Region 3, Bagdogra Airport was selected for further analysis of accessibility in the influence area.
3.3. Case Study: Bagdogra Airport, Siliguri
Bagdogra Airport is an international airport serving the city of Siliguri in West Bengal. It was declared an international airport in 2002 by the Government of India. In addition, it acts as a gateway airport for other hill stations in the North Bengal region, such as Darjeeling, Gangtok, Kurseong, Kalimpong, and Mirik. The airport served 3.2 million passengers in 2019–2020, a rise of 11.2% from the prior year, ranking it as India’s 17th busiest airport before the pandemic [
34].
Siliguri is strategically located with easy access to Nepal, Bangladesh, and China. In addition, the critical Siliguri Corridor marks the 60 km long and 22 km wide “Chicken Neck” that connects the rest of India with the north-eastern states. Each year, thousands of visitors use this airport, as it is surrounded by a large number of tourist sites and important national and international trade hubs.
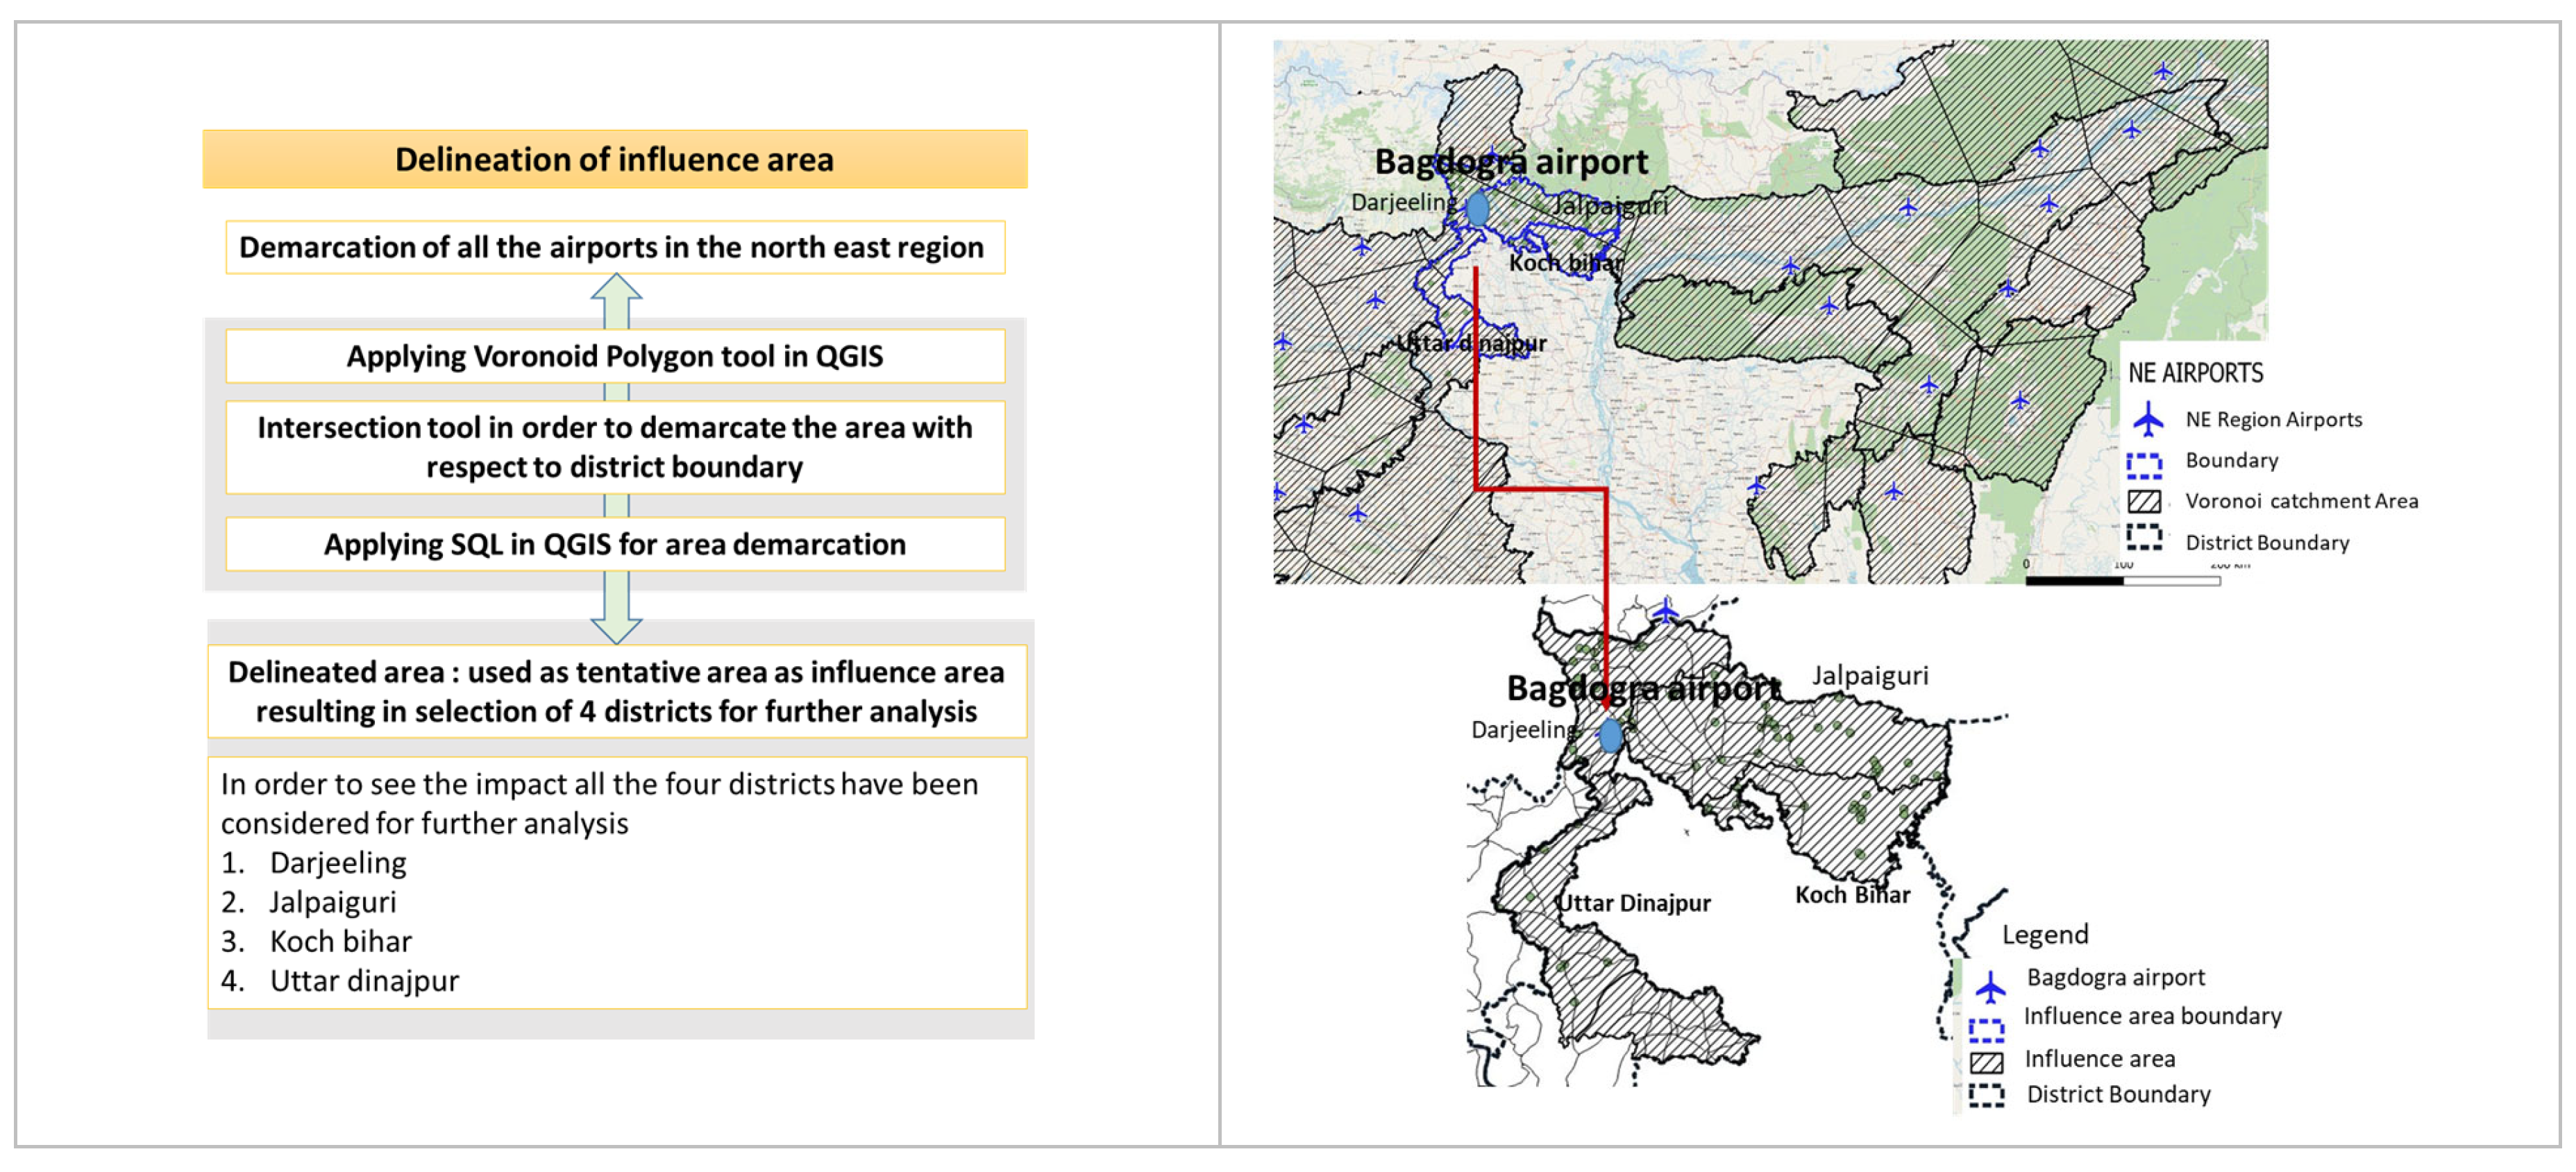
Being one of the most important airports serving the region, the airport region was further delineated for analysis on accessibility. Firstly, in the whole Northeast region, the Voronoi polygon tool in QGIS was applied to demarcate the geographical influence area of airports and their hinterlands
Figure 9. Furthermore, intersection tools and SQL tools were applied for demarcation of the influence area. Four administrative units as districts were selected for the accessibility analysis. The resultant region consists of the districts of Uttar Dinajpur, Jalpaiguri, Koch Bihar, and Darjeeling
Table 1.
3.4. Accessibility in the Region
The region surrounding an airport has a tendency to develop a diverse range of links to the towns that it serves. These links tend to evolve over a period of time in terms of their capacity, undergo upgrades, and occasionally establish new links in order to connect an increasing number of towns around the region. Similarly, in the case of the Bagdogra Airport region, an attempt was made through this study to determine the pattern of change in accessibility in the area with respect to the airport. This was done in order to better understand the impact, and this shift was recognised in terms of both time and distance from the airport. The concern discussed in this article is whether or not there was any shift in the accessibility indices in the airport region, and whether or not the airport has any contribution to make in the changing scenarios.
The Census of India database was used for the years 2001 and 2011 for maps as well as demographic data. All the census towns and statutory towns were considered for the analysis as important nodes in the delineated region. For the analysis of links, all the national and state highways and major district roads were taken into consideration. Topological maps were also extracted for analysis using QGIS.
Furthermore, for the analysis of accessibility in the region, measures of centrality and the Shimbel index were applied with respect to the nodes and links as defined above. QGIS tools were applied to compute the measure of centrality. In QGIS, the spatial design network analyst tool was applied, planarizing the road network graph into various segments to obtain results in terms of heat maps for the years 2001 and 2011.
3.5. Calculation of Centrality
Centrality Measures
Centrality measures are applied to identify the most central and important nodes or links in a network. In this study, the centrality measures used were the Shimbel index, betweenness centrality, and closeness centrality. The network map did not include the capacities of road and size; it only included the presence of links. These measures can be defined as follows:
Shimbel Index (or Shimbel distance, nodal accessibility, nodality). “A measure of accessibility representing the sum of the length of all shortest paths connecting all other nodes in the graph. The inverse measure is also called closeness centrality or distance centrality”.
“
Betweenness centrality measures the extent to which a particular node lies between other nodes in a network. A node tends to be more powerful if it is on the shortest paths connecting many node-pairs, as it may be in a position to broker or mediate connections between these pairs. The betweenness of a node
i is defined as the ratio of all shortest paths passing through it and reflects its transitivity”. Thus,
where
σkj is the sum of all shortest paths between nodes
vk and
vj, and
σkj(
i) is the number of shortest paths that pass through
vi. Nodes that occur on many shortest paths between other nodes have higher betweenness than those that do not.
Closeness Centrality
“Closeness centrality measures the extent to which a node is close to all other nodes along the shortest path and reflects its accessibility in a given network”. The closeness of node
i is written as
“In other words, a node’s closeness is the inverse of the average shortest distance from that node
i to all other nodes in a given network. The larger
i value, the more convenient it is to reach other nodes” [
15].
3.6. Results
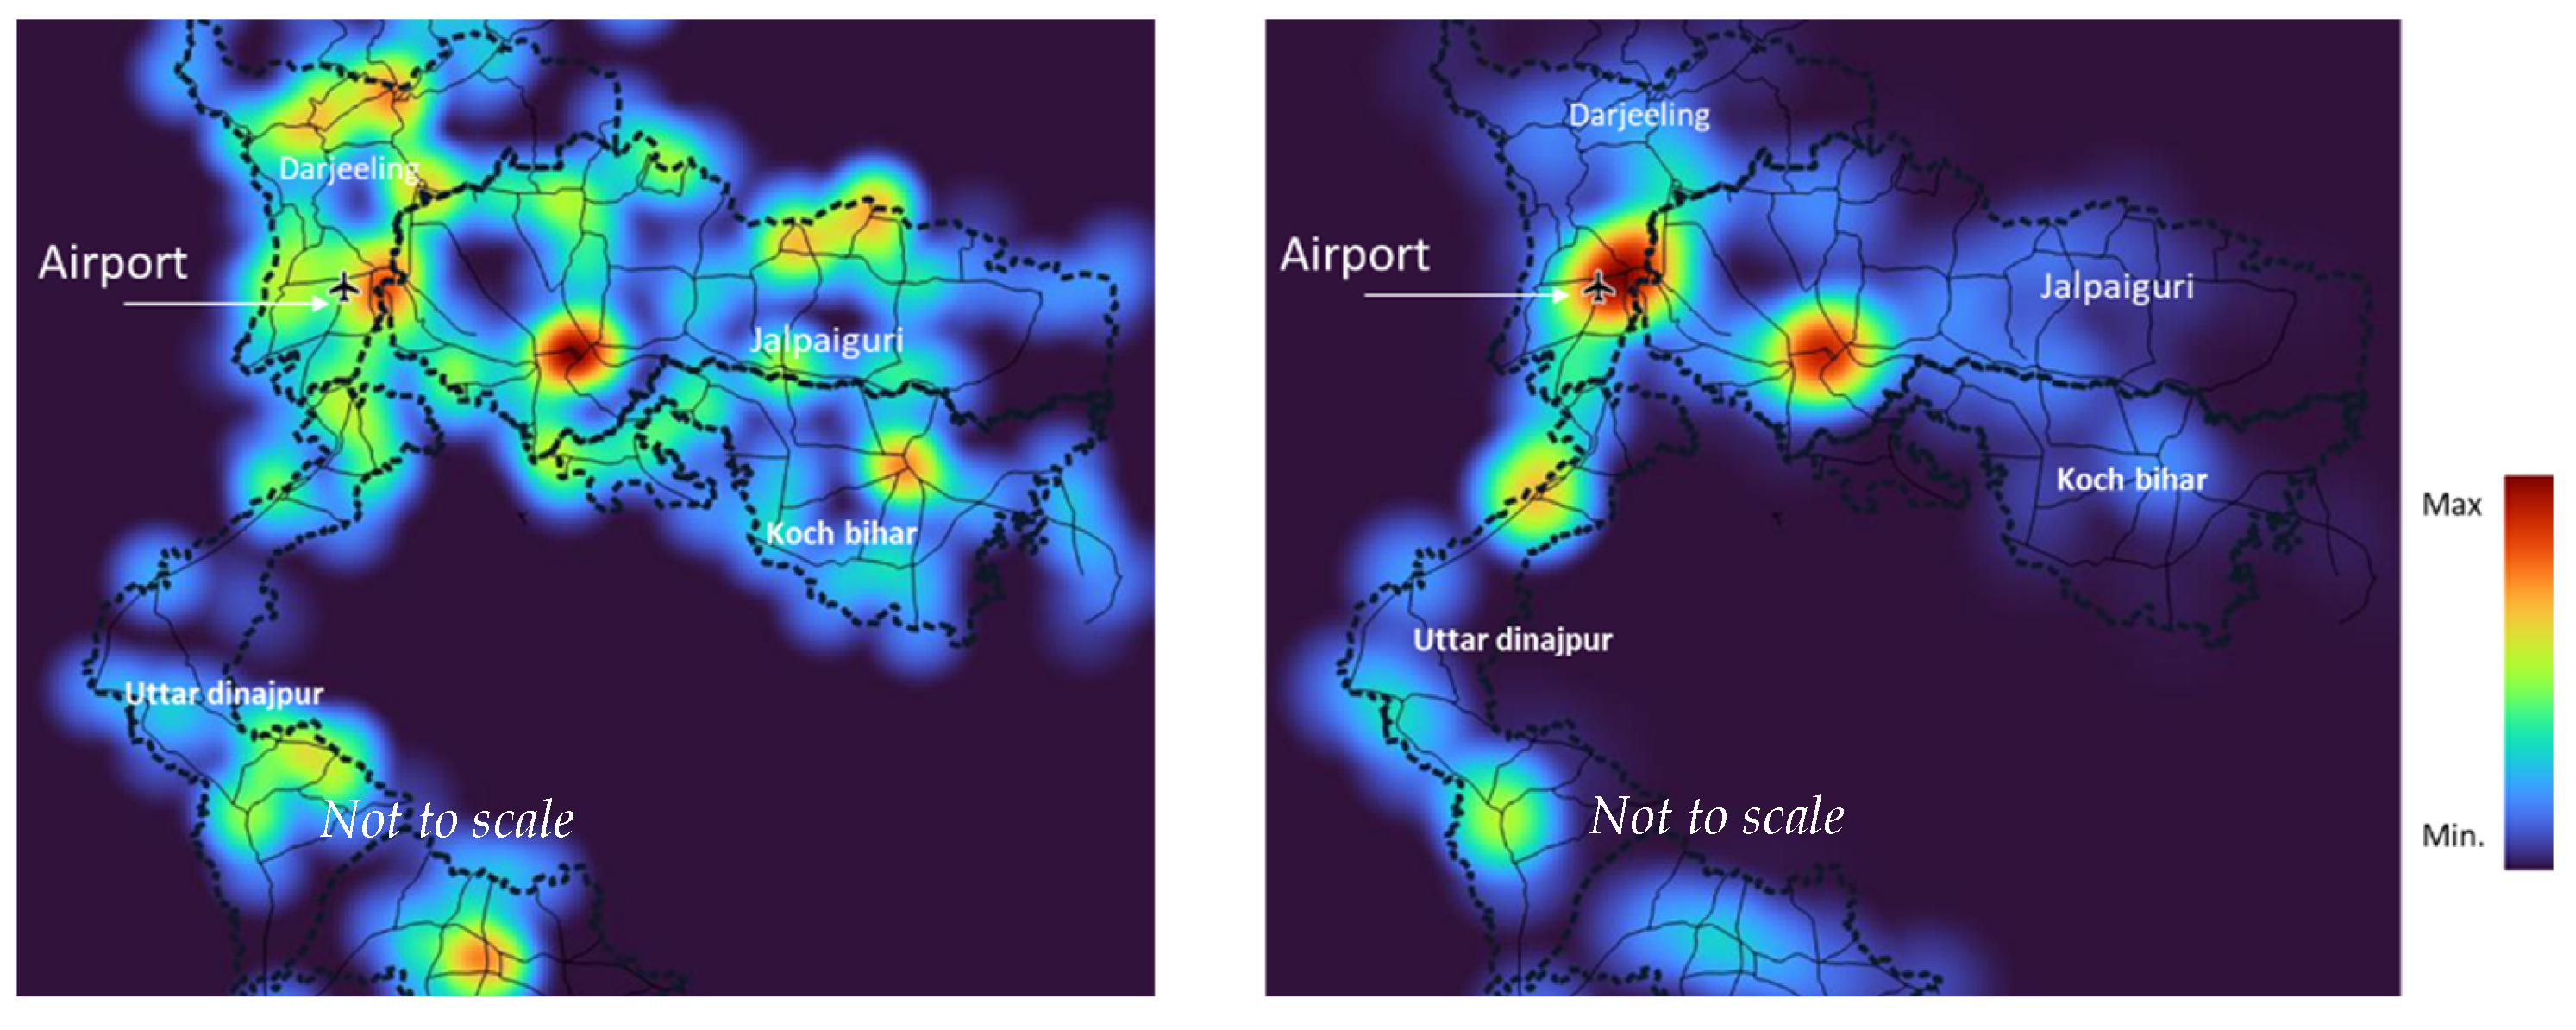
The measure of betweenness centrality in
Figure 10 illustrates a node’s importance by displaying the percentage of pathways that connect it to other nodes. The idea is that a node that connects a higher number of other nodes is more significant than one that connects few other nodes. As can be observed in
Figure 5, the betweenness centrality was overtly emerging at the airport and around the city of Jalpaiguri, which is directly linked to Siliguri by Highway 27, from 2001 to 2011.
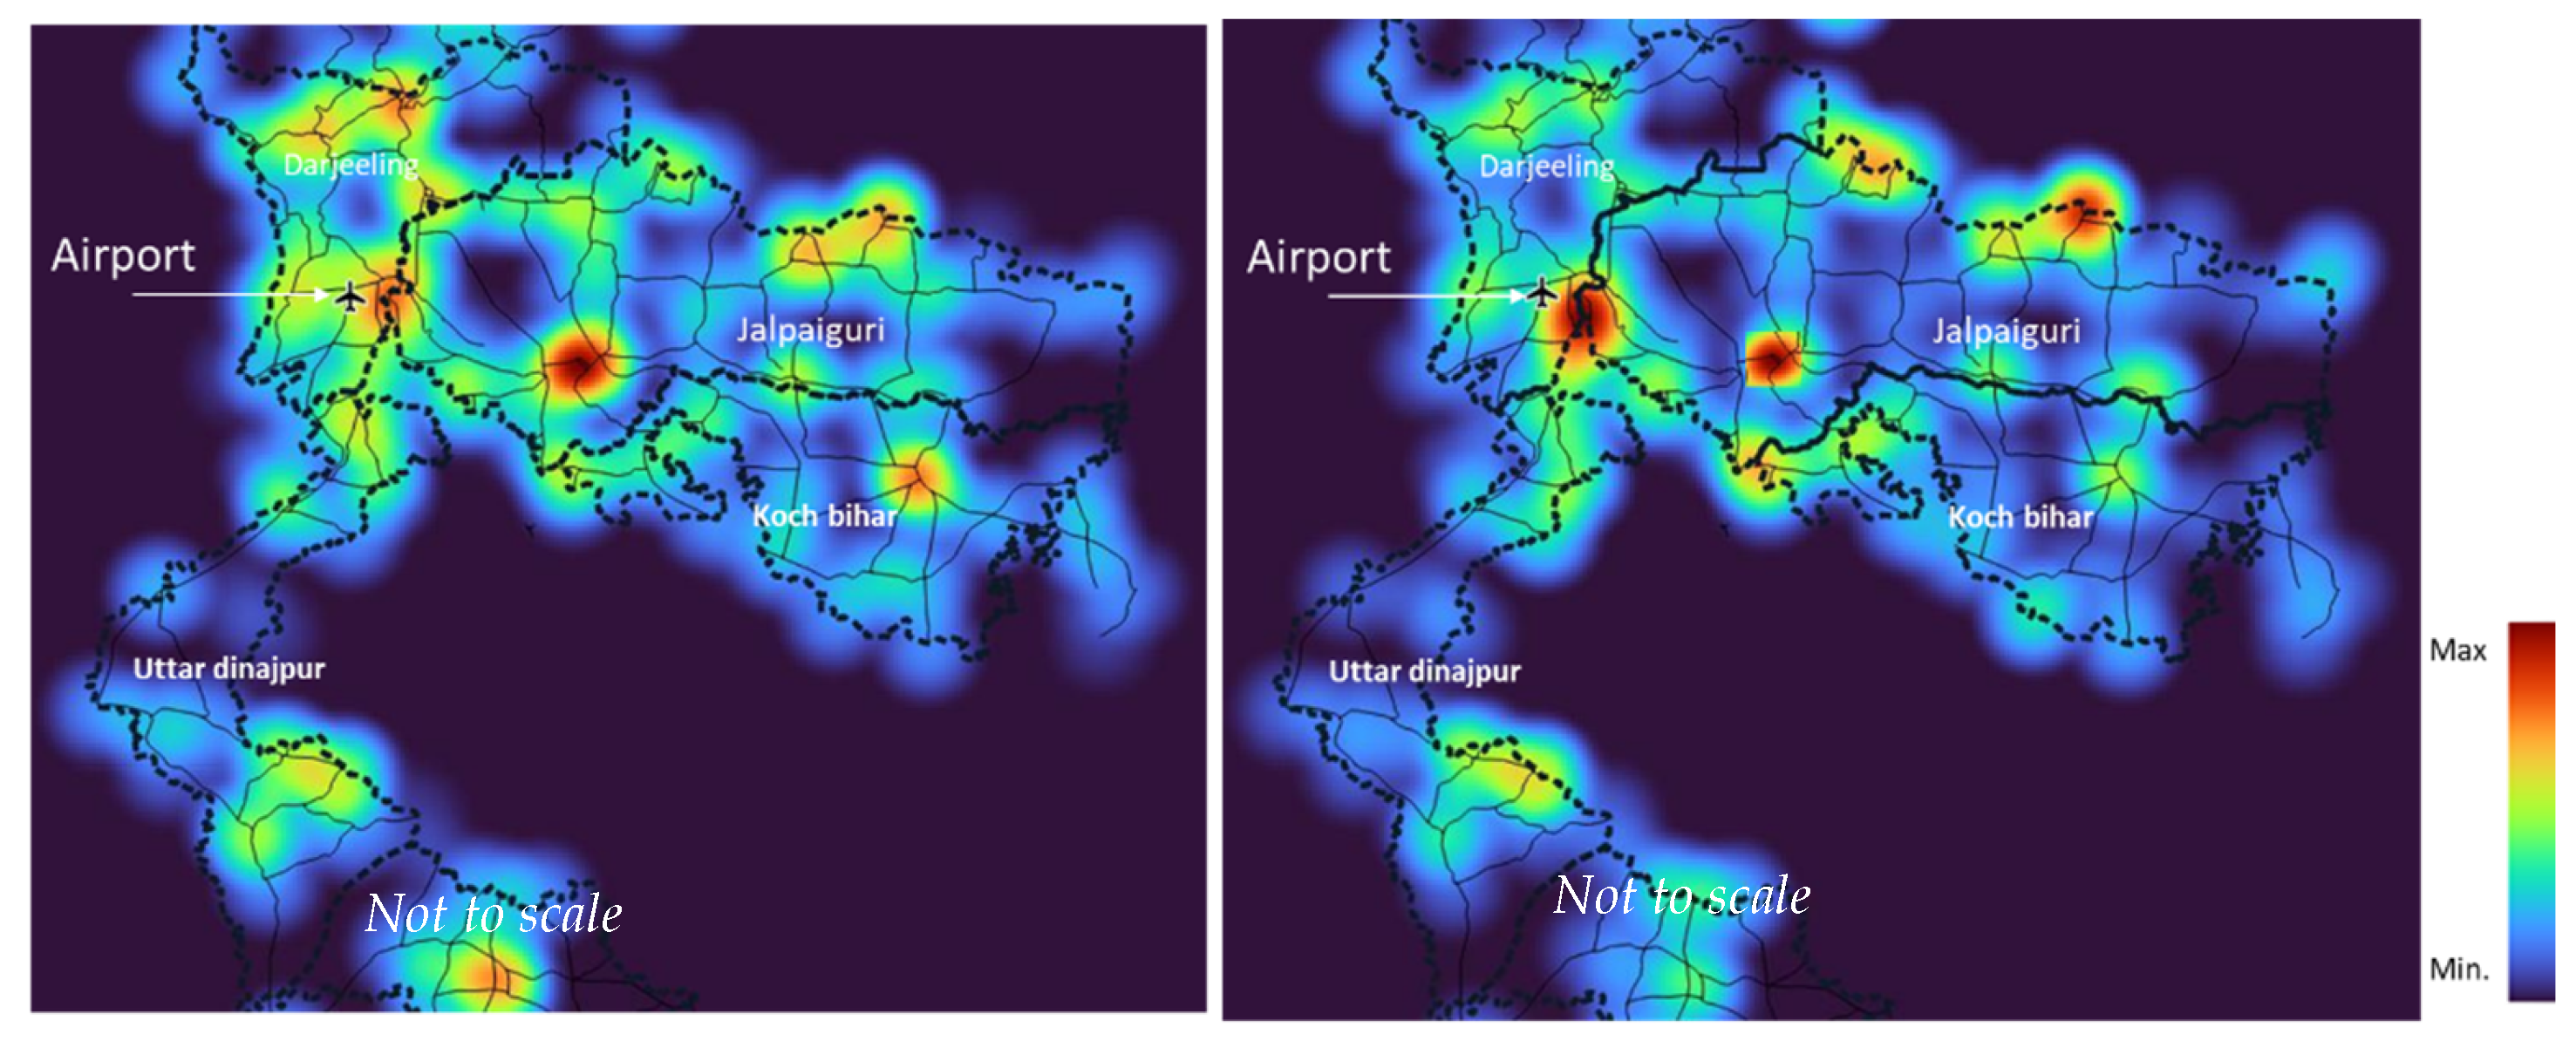
In order to see which developing nodes have the most edges, the measure of degree centrality in the region was computed. Degree centrality calculates a node’s relevance based on the number of edges (degree) it has
Figure 11. The region had a large number of significant nodes spread out around the region, but as seen in
Figure 11, the emerging nodes were concentrated in the vicinity of the airport.
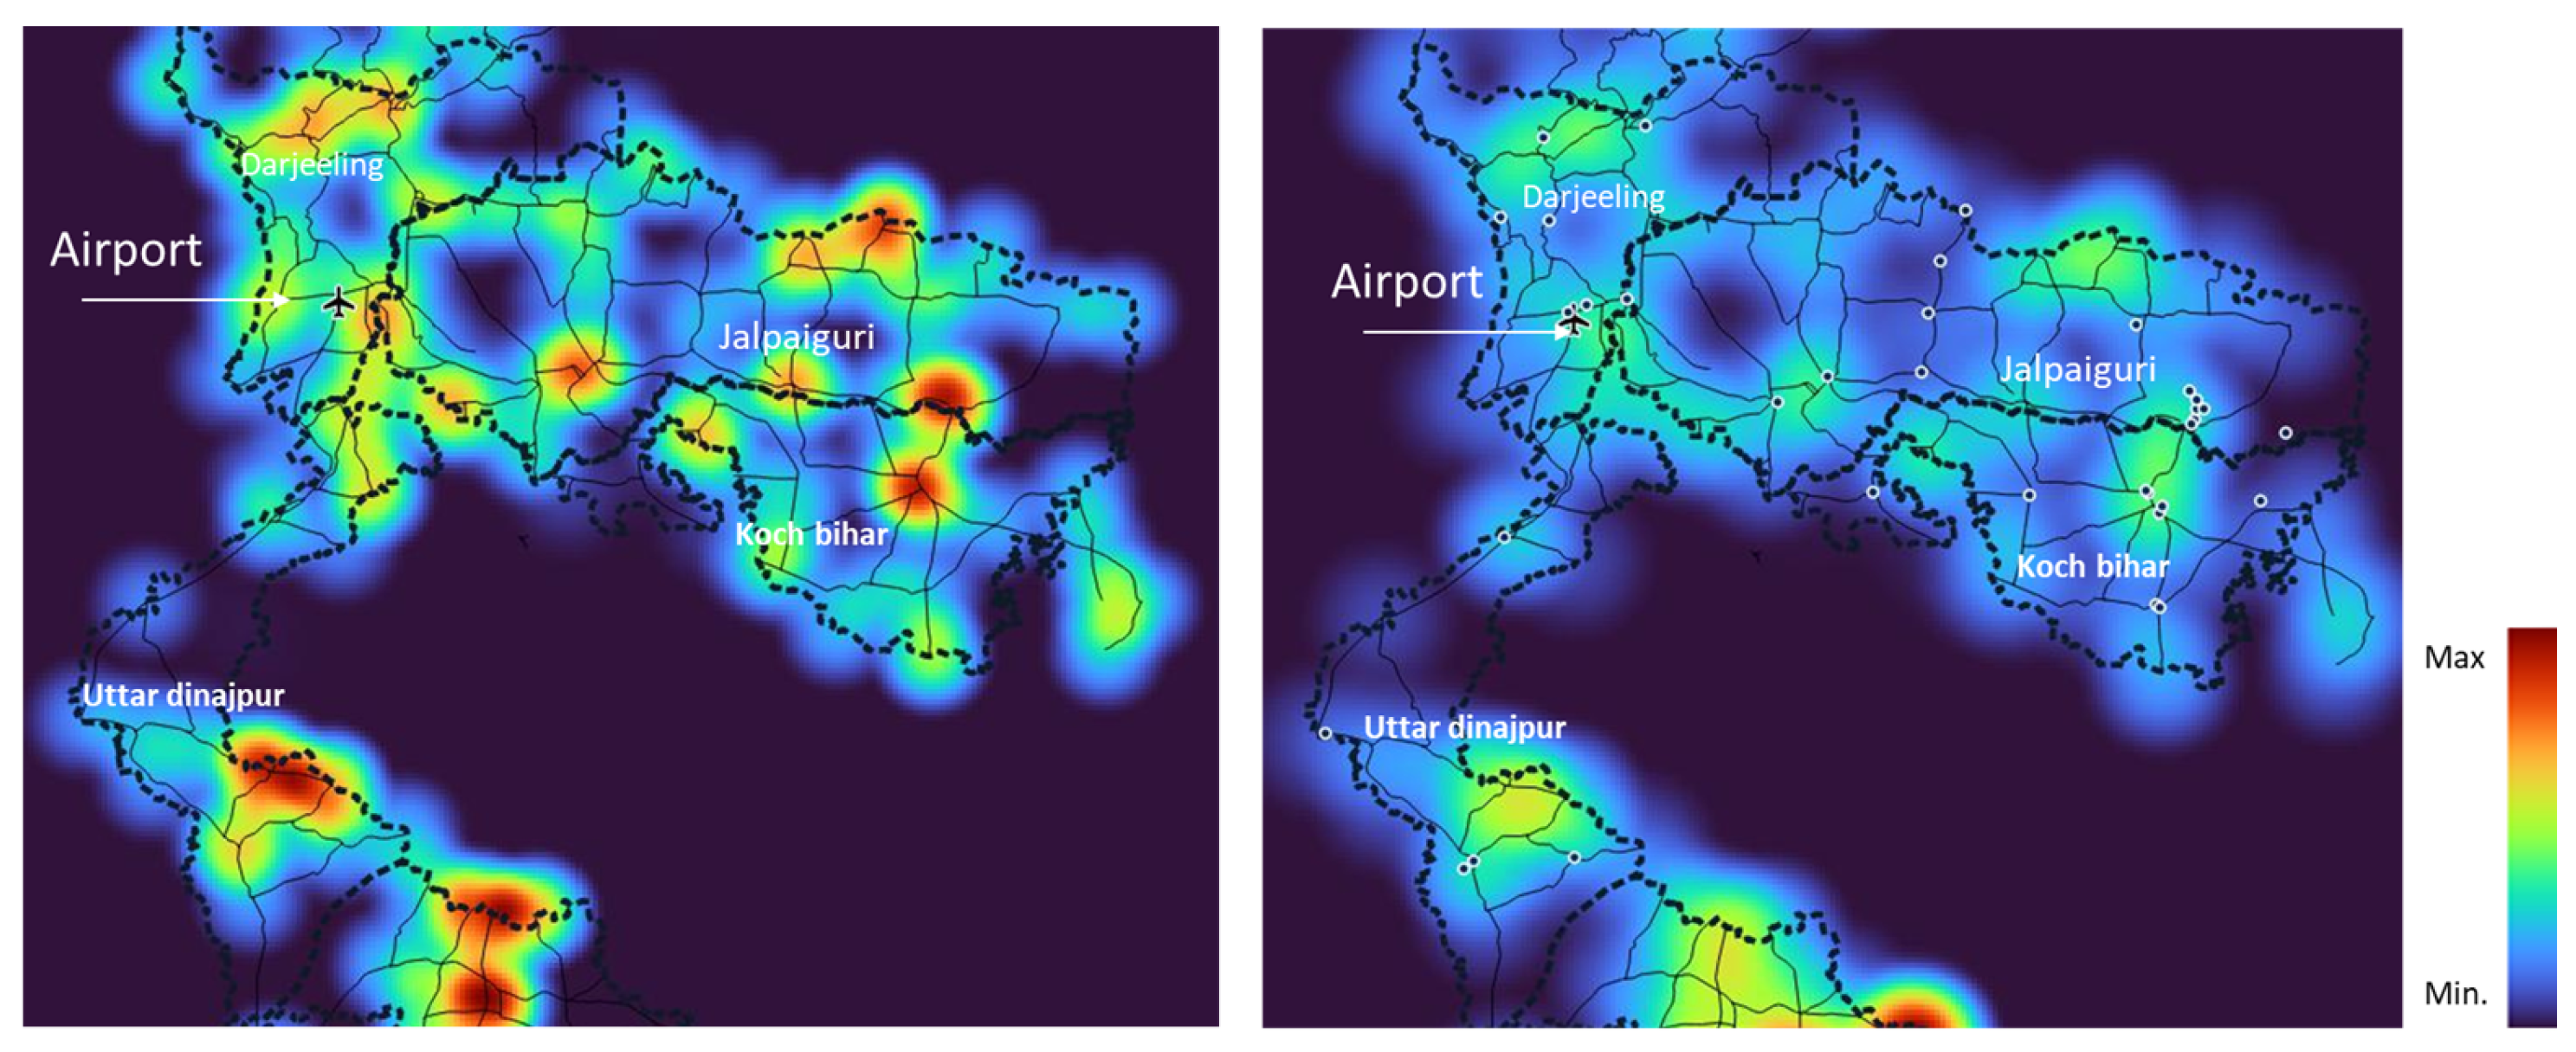
Furthermore, the Shimbel index was generated in order to quantify accessibility based on the shortest routes. The Shimbel index is a measure of accessibility that is the total of the lengths of all the shortest paths connecting every other node in the network. The inverse measure of the Shimbel index is also known as closeness centrality or distance centrality. It is determined as the reciprocal of the sum of geodesic distances to all other nodes
Figure 12. The principle behind computing this metric is that the closer a node is to other nodes, the more important the node is. The measure is based on the topological distance between the nodes, with a high value indicating less accessibility. As seen in
Figure 12, the light green patches reflect a decrease in values across the region, particularly in the areas around the airport, indicating an improvement in accessibility in the region.
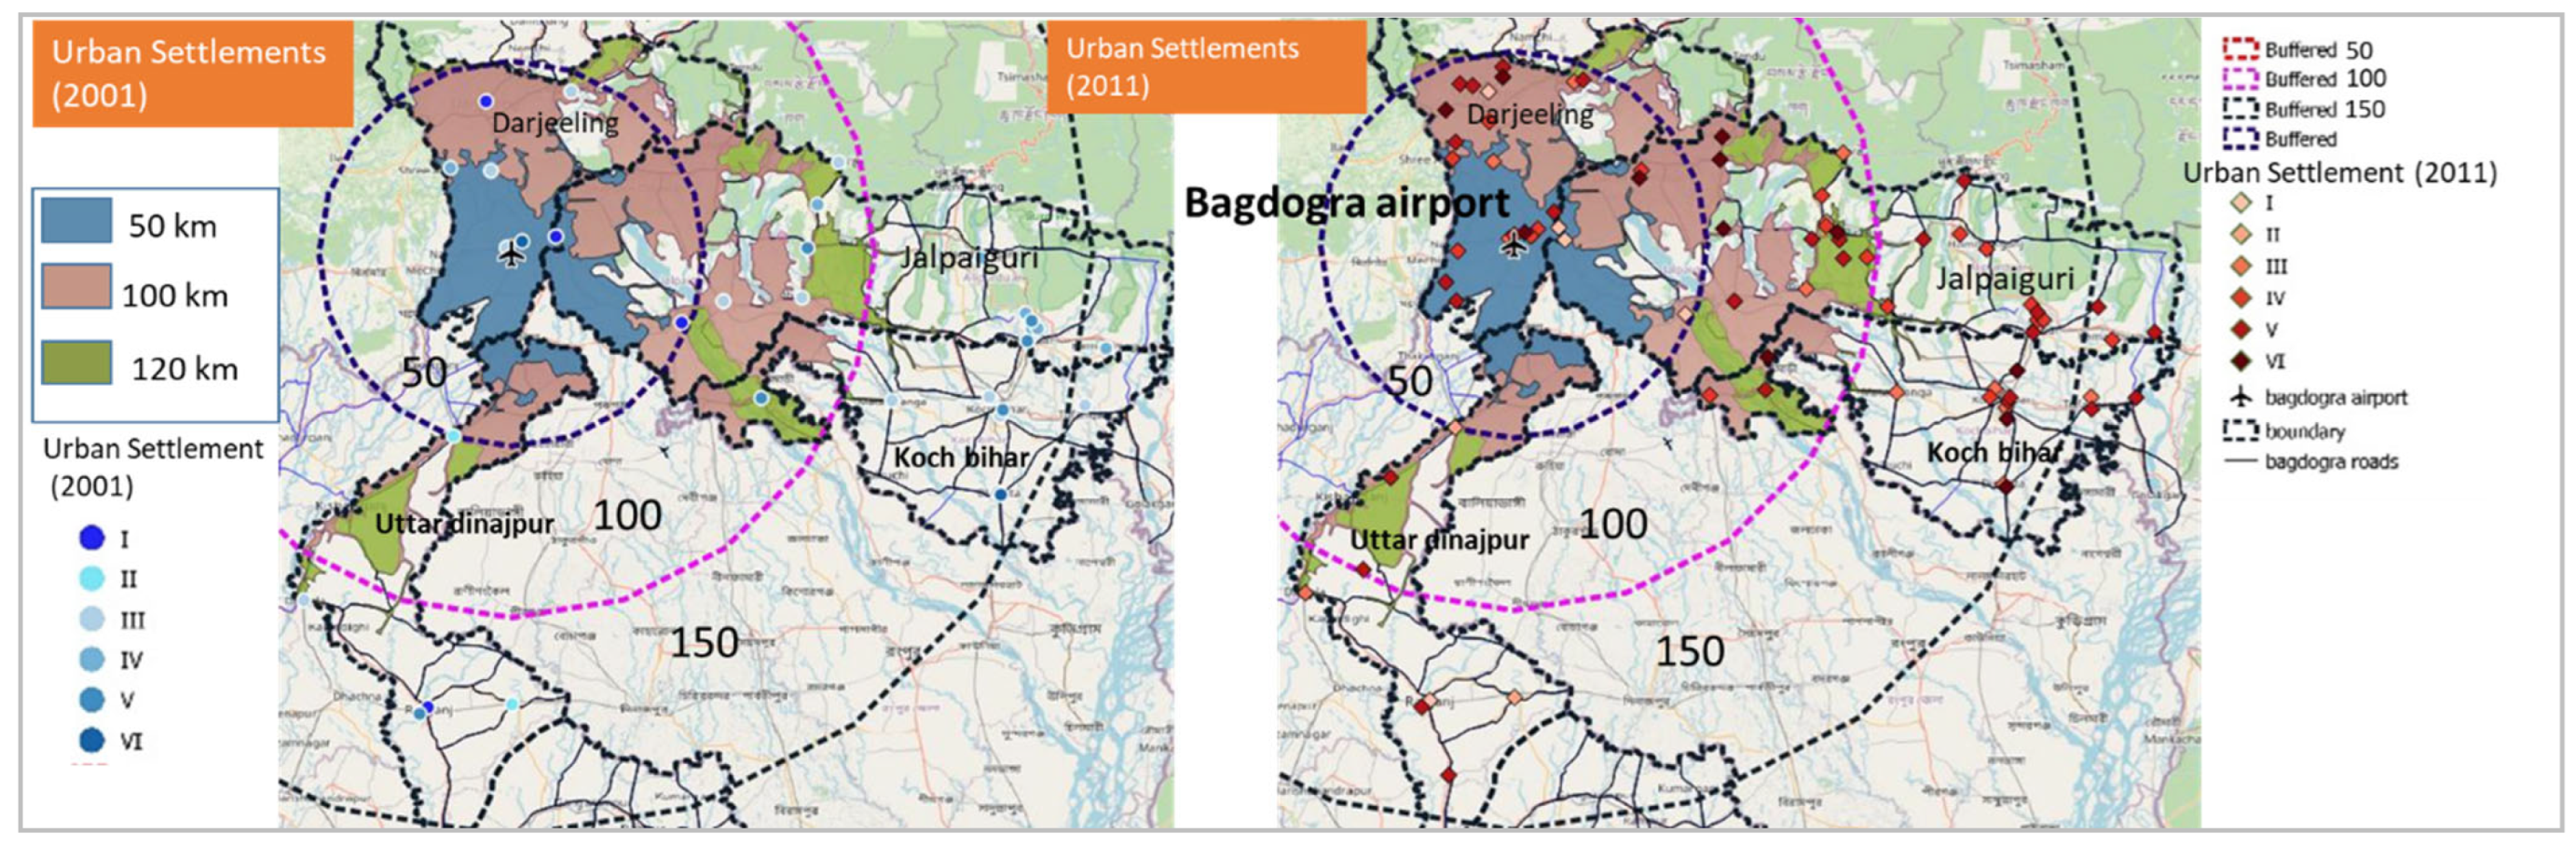
The airport region centrality measures computed reflect the change in accessibility in the region from 2001 to 2011. It is crucial to look into the change in settlement pattern in the region to see the emerging nodes based on demographic changes. All census and statutory towns in the demarcated region were mapped using QGIS software to identify the change, within radiuses of 50 km, 100 km, and 150 km. The buffer zones were mapped using QGIS’s buffer tool. Isochrones were also mapped over the same distances, utilising network simulation tools to determine the actual geographical distance that can be traversed by roadways. As shown in
Figure 13, the development of urban settlements in the airport zone is concentrated more in the proximity of the airport within a distance of 50 to 100 km. There was also a noticeable change in class size in the region. Settlements that are clustered near the airport were upgraded, as may be seen.
When these two distinct aspects are visualised, it is conceivable to conclude that, in accordance with the shift in the hierarchy of settlements in terms of urbanisation with respect to the links that are distributed throughout the region, the impact is concentrated mostly in the radius of 50 to 120 km from the airport
Table 2 [
36].
4. Conclusions
Airport accessibility and connectivity help to improve intraregional links as well as connectivity to other regions. Airports in an area are intended to improve connectivity on both a domestic and an international level. In addition, they are linked to the development of new nodes, edges, and links in the immediate vicinity of the airport.
The entire landside structure of a regional road network surrounding an airport and its centrality were examined in this study using graph theory. The landside network of 36 airport regions was analysed in this research, and the results demonstrate that the Tier I airports dominate the ranking in terms of better landside as well as airside connectivity in the surrounding areas. In order to more thoroughly examine the effect of airports on regional connectivity, the Northeast region, which has the lowest ranking in landside connectivity, was taken into consideration so as to sieve out landside connectivity impacts.
This study also examined accessibility measures while delineating the airport region. The study’s major findings include the finding that, over time, accessibility increased more in the proximity of the airport than in other portions of the demarcated zone. The airport plays a significant role in the development of the road network and the creation of numerous nodes in the region. These findings support prior findings that there are linkages between the airport landside network and underlying geographical settlement patterns. As a result, with new airports, comprehensive planning for airport regions is required in order to provide a more predefined network for improved accessibility and to induce development in the surrounding area. The regional linkages of airports become even more important in expanding Tier II and Tier III settlements since they are directly linked to emerging cities and towns. Further studies should be conducted to analyse impacts on regional development, as it has been concluded from this study that in the airport region, there is an emergence of various urban settlements, and many towns and cities tend to upgrade due to better connectivity and accessibility as a result of airports.


