Article

Dynamic Evaluation of Energy Carbon Efficiency in the Logistics Industry Based on Catastrophe Progression

School of Economics and Management, Liaoning University of Technology, Jinzhou 121000, China
*
Author to whom correspondence should be addressed.
Sustainability 2023, 15(6), 5574; https://doi.org/10.3390/su15065574
Submission received: 16 February 2023 / Revised: 13 March 2023 / Accepted: 20 March 2023 / Published: 22 March 2023
(This article belongs to the Special Issue Circular Economy and Logistics)

Abstract

:
The logistics industry has an irreplaceable role in promoting Chinese economic development, and its carbon emissions have become a hot topic of academic research. However, more research needs to be conducted on this. This study is based on establishing an evaluation index system for the efficiency of energy carbon emissions in the Chinese logistics industry. The catastrophe progression method was used to evaluate this statically. A dynamic evaluation model was also established based on the characteristics of fuzzy rewards and punishments. The results showed that the static values in the southeastern provinces of China were always between 0.9 and 1, and there was a significant increase in the dynamic values under the fuzzy reward and punishment scenario. Provinces in the southwest fluctuated between 0.8 and 0.95, while the dynamic values did not increase much. In the northern provinces, the static assessment values were consistently between 0.7 and 0.9, while the dynamic values were decreasing. It is therefore important to reward provinces with high static assessment values and penalize those with low static assessment values. The perspective of the characteristics of fuzzy rewards and punishments is also essential for fair and equitable management, reward and punishment in the different provinces in the study.

1. Introduction

The advent of the Industrial Revolution brought human society into a phase of rapid development, but it also brought a series of negative consequences with it. After the Industrial Revolution, more and more factories were opened, emitting many greenhouse gases such as carbon dioxide. The Earth is experiencing the greenhouse effect caused by the increase in carbon dioxide. This is because carbon dioxide will readily absorb long-wave radiation from the ground while transmitting longer long-wave radiation into the ground, making the ground more insulated. This will eventually lead to global warming, melting glaciers and rising sea levels, which will flood many low-lying areas and countries. Nowadays, the greenhouse effect of the atmosphere is increasing, causing more serious problems such as global warming [1,2]. This has caused concern in countries around the world.
Global climate governance is a multidimensional international economic and environmental issue. The role of the Paris Agreement in global climate governance must be considered [3,4,5]. China is the world’s largest emitter of carbon dioxide. Using 2020 data as an example, the world’s CO2 emissions in 2020 will be 31.98 billion NDUs, a reduction of 2056 billion NDUs or 6.04% year-on-year compared with 2019. In 2020, China’s CO2 emissions reached 9894 billion NDUs, accounting for 30.93% of the world’s total CO2 emissions and ranking first globally. Furthermore, in response to the long-term goal of improving the climate, China has already made many efforts in reducing carbon emissions [6,7,8]. The Chinese logistics industry is the second-largest carbon emitter after manufacturing. Reducing the carbon emissions of logistics is not only a prerequisite for promoting the development of the industry itself but also an essential part of the task of achieving China’s energy saving and emission reduction goals.
Moreover, the problem of the efficiency of energy carbon emissions generated by the Chinese logistics industry has created an enormous conflict with low-carbon environmental protection [9,10,11,12]. Nowadays, how to curb the disorderly growth of energy carbon emission levels in the logistics industry has become an inevitable trend of current research. Therefore, the scientific formulation of carbon emission reduction policies for the logistics industry in various provinces and regions of China is of great practical significance for optimizing the energy structure and improving energy efficiency.

2. Literature Review

Carbon efficiency was first proposed by Kaya and Yokobori [13], who used the ratio of GDP to carbon emissions as a carbon efficiency value to reflect the gross domestic product that could be created per unit of carbon emissions. Subsequently, a carbon index was proposed to measure the intensity of energy consumption using the ratio of carbon emissions to energy consumption [14,15,16]. Both methods can reflect the efficiency of carbon emissions, but due to the single research perspective and measurement index, the measurement results were controversial, and many scholars have started to measure the efficiency of carbon emissions from a multidimensional perspective.
The efficiency of energy carbon emissions from the logistics sector has always been a hot topic of research in energy-related economics. A large body of literature has examined the impact of numerous influencing variables on the logistics industry’s carbon efficiency. Static analyses have been conducted based on panel data and other aspects such as the industrial environment of the logistics industry [17,18], resource inputs [19,20], energy consumption and measurements [21,22,23]. Static analysis is a comprehensive and comparative analysis of the results of the economic activities that have taken place. Tiwari et al. [17] used a new quantile autoregressive distributed lag method to analyze environmental degradation. They showed that economic growth positively affected the industrial environment in both countries. Kumar et al. [18] used static analysis to explore the efficiency of logistics and their regional differences to optimize the input–output ratio of the regional logistics industry. Scholars such as Wanke [19], Morgan and others [20] included resource inputs and technological inputs in their static analysis to consider their effects on the carbon emission efficiency of logistics. Scholars such as Sufyanullah [21] and Modise et al. [22] used static analysis to study the impact of different regions’ energy consumption on the efficiency of carbon emissions by the logistics industry and found that the impact of energy on carbon emissions in the logistics industry changed over time and across different environments. Many scholars are also aware of this problem, so research on measuring the efficiency of energy and carbon emissions in the logistics industry has gradually switched from static data analyses to dynamic analyses [23,24,25]. Mustafa et al. [23] used a dynamic data analysis to study the development trend of logistics in a low-carbon economy. Talmon et al. [24] used dynamic analysis to examine the relationships of total-factor energy efficiency in the logistics industry. They concluded that total-factor energy efficiency in the logistics industry showed a benign growth trend. They used dynamic analysis to study the overall level and spatial characteristics of the efficiency of the logistics industry and proposed different countermeasures for improving low-carbon logistics for different regions.
The research results above provide a reasonable basis for this study, but there are still areas for improvement in the existing research. Developing the efficiency of the Chinese logistics industry’s energy carbon emissions should also be a continuous and uninterrupted process of evaluation. The development of the logistics industry in China has differed from province to province. There are specific differences in the logistics industry’s energy and carbon emission efficiency, so it is imperative to reduce the differences. The perspective of fuzzy rewards and punishments is a concept that blurs the boundaries of rewards and punishments, as well as the corresponding demarcation points of incentives and punishments, to achieve reasonable and flexible management according to the different levels of development of the logistics industry in each province.
Among the existing methods of measuring the efficiency of energy carbon emissions, scholars have used the SBM-DEA model [18,19], the DEA-Malmquist index model [26,27], the AHP-DEA model [23,28], the PAC-DEA model [25,26], the super-PEBM model [27] and the DEA-BCC model [29] to study and measure the efficiency of the energy carbon emissions of the logistics industry. However, we lack a method based on a combination of static and dynamic analysis to effectively analyze the efficiency of the energy carbon emissions of the Chinese logistics industry from a continuous perspective: the catastrophe progression method.
Therefore, the research had the following innovations based on previous scholars’ research. First, this study studies the efficiency of the logistics industry’s carbon emissions from the energy perspective, focusing on analyzing the impact of energy consumption and transformation, actively responding to national policies and helping the logistics industry save energy and reduce emissions. Second, this study used the catastrophe progression method to analyze the time series of the Chinese logistics industry’s efficiency of energy carbon emissions from 2014 to 2019. The dynamic evaluation of the efficiency of the energy carbon emissions of the Chinese logistics industry was obtained through the results of the time series information aggregation model. From the static and dynamic point of view, a comprehensive evaluation of the efficiency of the energy carbon emissions of the logistics industry can be achieved. Third, this study introduced a new concept of fuzzy rewards and punishments. According to the results of the static evaluation of the logistics industry’s efficiency of energy carbon emissions in each province, the corresponding non-reward and punishment points, the membership degree of fuzzy rewards and punishments degree and the control line of fuzzy rewards and punishments were determined. Finally, the features of fuzzy rewards and punishments were used to gather information in the time dimension, which laid the foundation for the subsequent dynamic analysis model.
The criteria for rewards and punishments have been controversial in general research when rewarding the best and punishing the worst. The theoretical contribution of this study lies in the adoption of the perspective of the characteristics of fuzzy rewards and punishments. This allowed for the fuzzification of the criteria’s boundaries and accounted for the actual state of the energy carbon efficiency of the logistics industry in each province in a comprehensive manner, thus allowing for flexible management. This study has filled a gap in the literature in this area and provides high-quality assurance that reductions in the carbon emissions of logistics in each province are moving in the right direction.

3. Comprehensive Evaluation Model

3.1. Names of the Variables in the Formulas

Here, λ   is a static assessment value, t indicates the time, i denotes the number of evaluation indicators and j   is the number of objects evaluated, resulting in an information aggregation matrix. Moreover, h it t is a functional expression for the static assessment value;   ε i   is the point of no incentives and punishments, also known as the control line of fuzzy incentives and punishments;   η 1 , η 2 ,   and   η 3 are the corresponding affiliations of the variable at the time of incentives, punishments and no incentives or punishments, respectively;   δ it + ,   δ it , and   δ it 0 are the rating values of incentives, punishments and no incentives or punishments, respectively; μ 1 is the factor of incentives, and μ 2 is the factor of punishments. Finally, δ i is the composite dynamic assessment value.

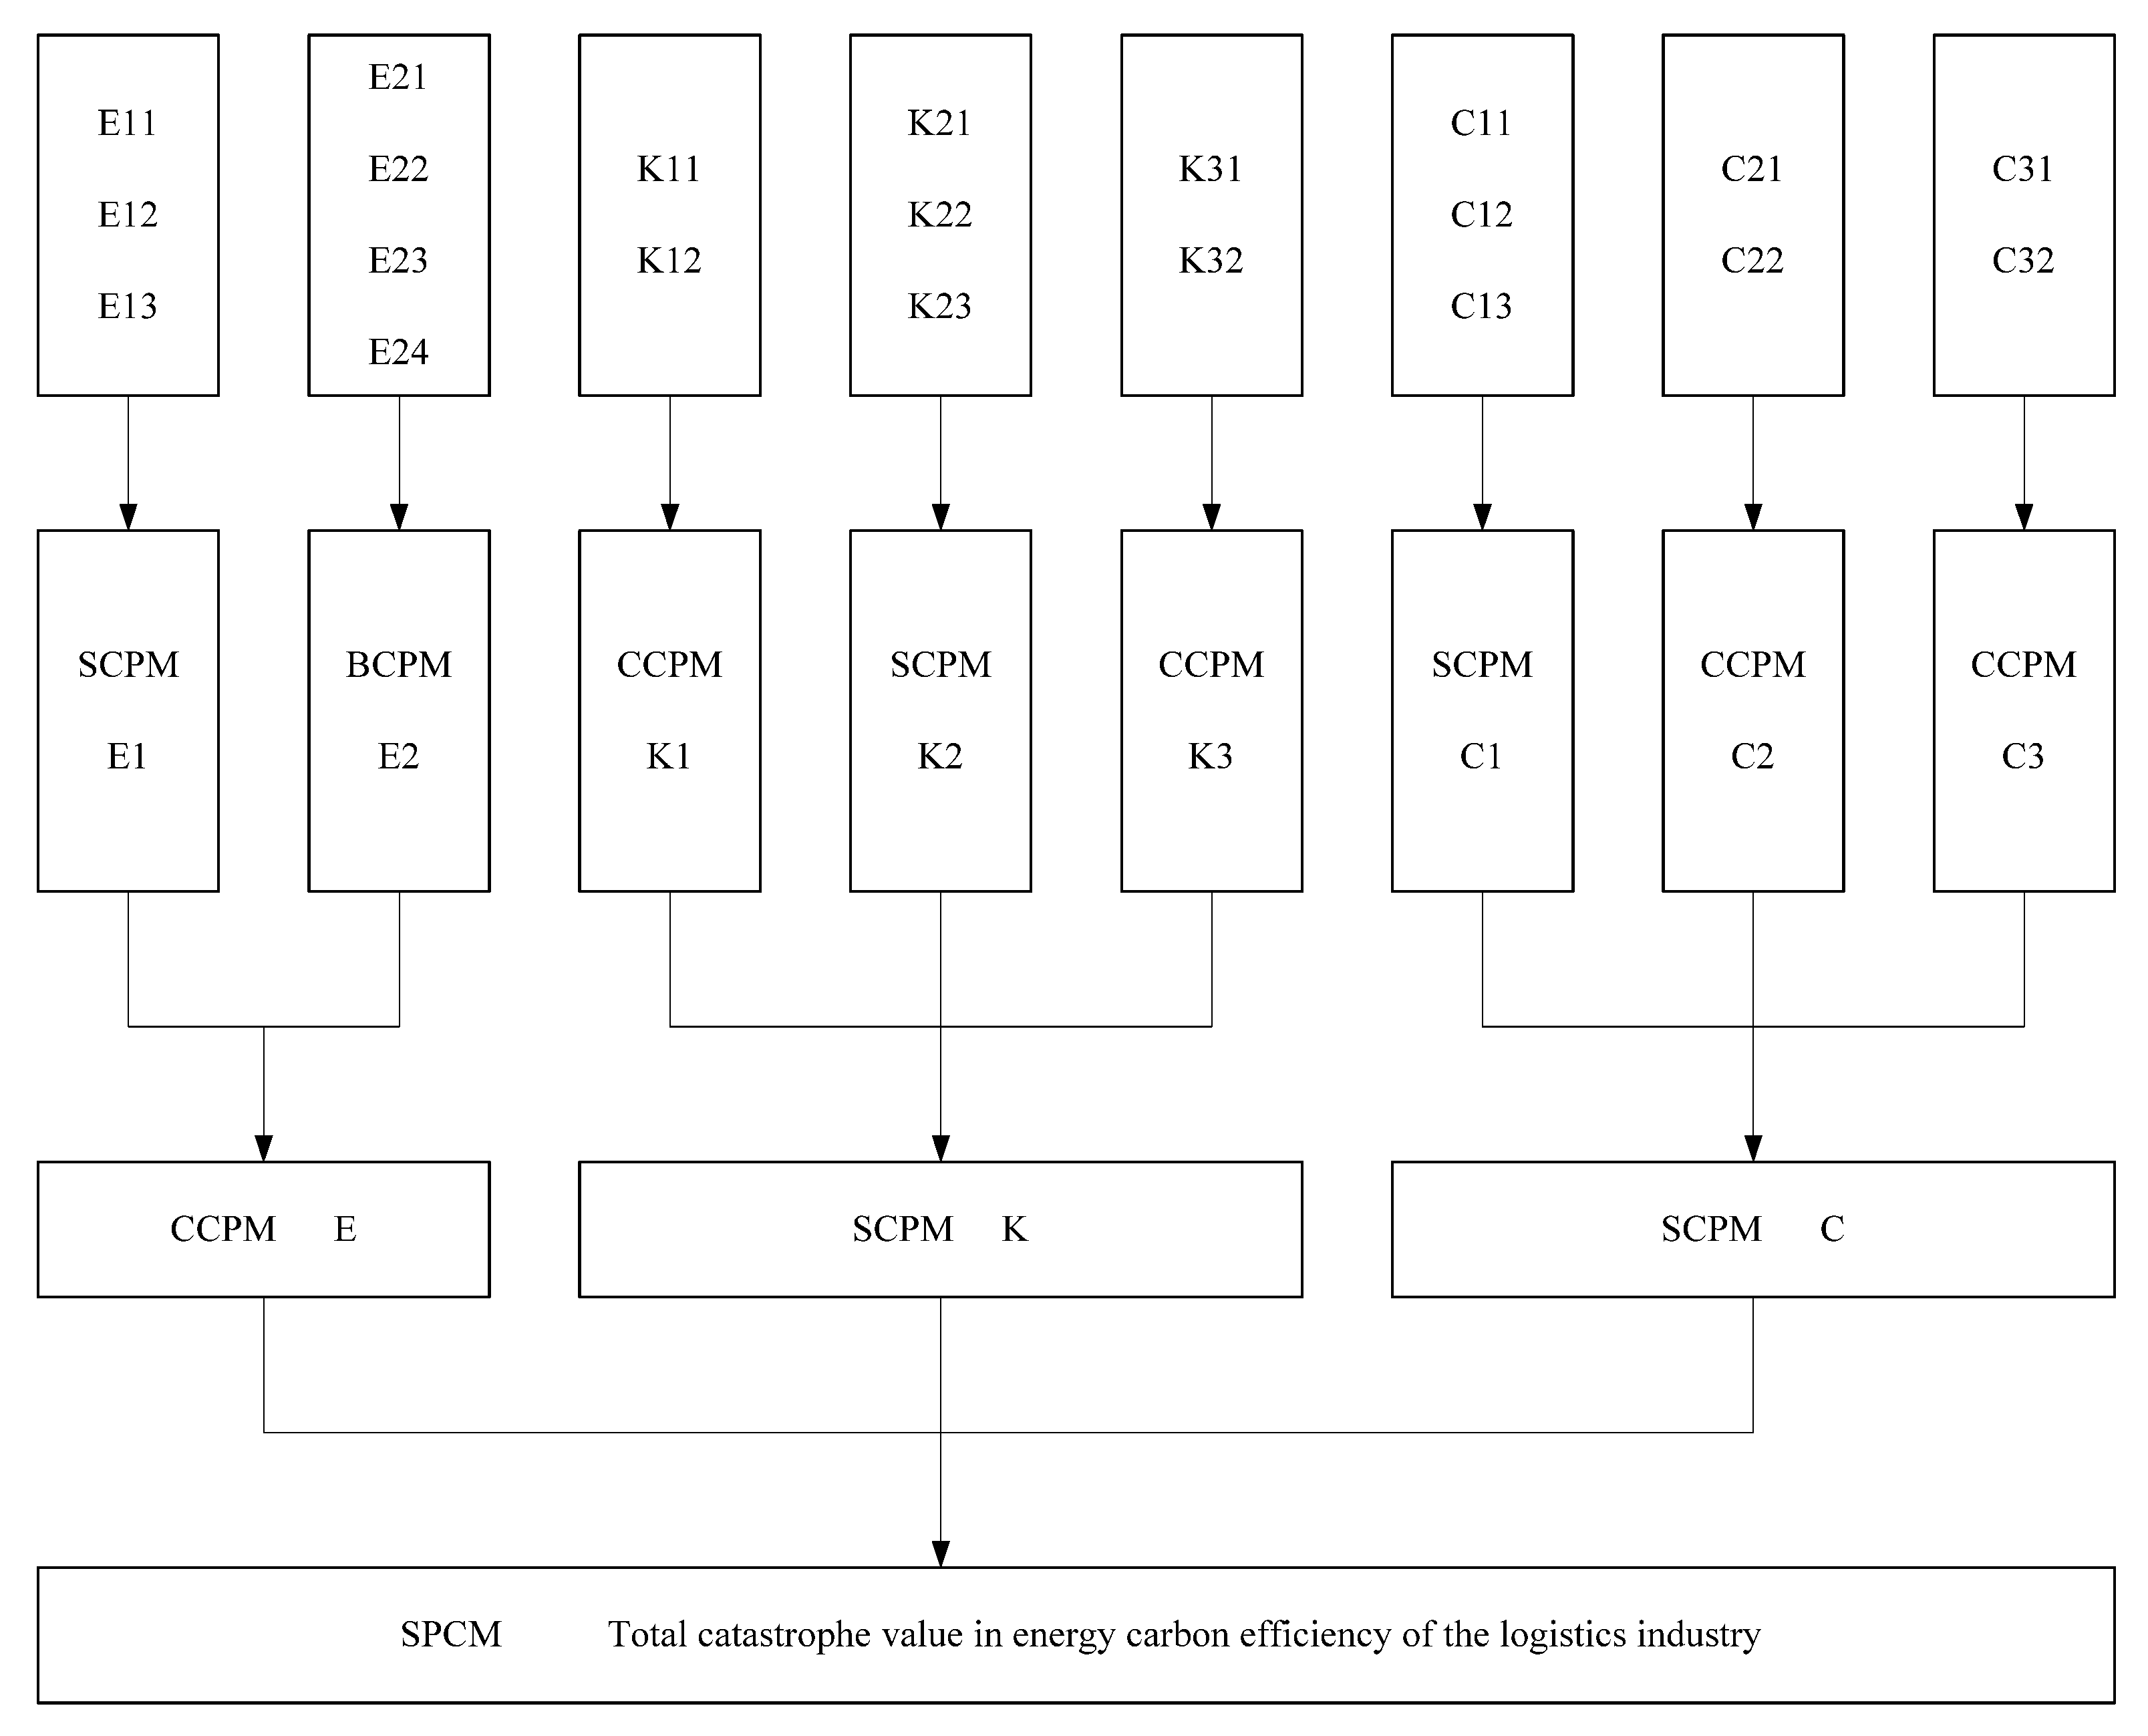
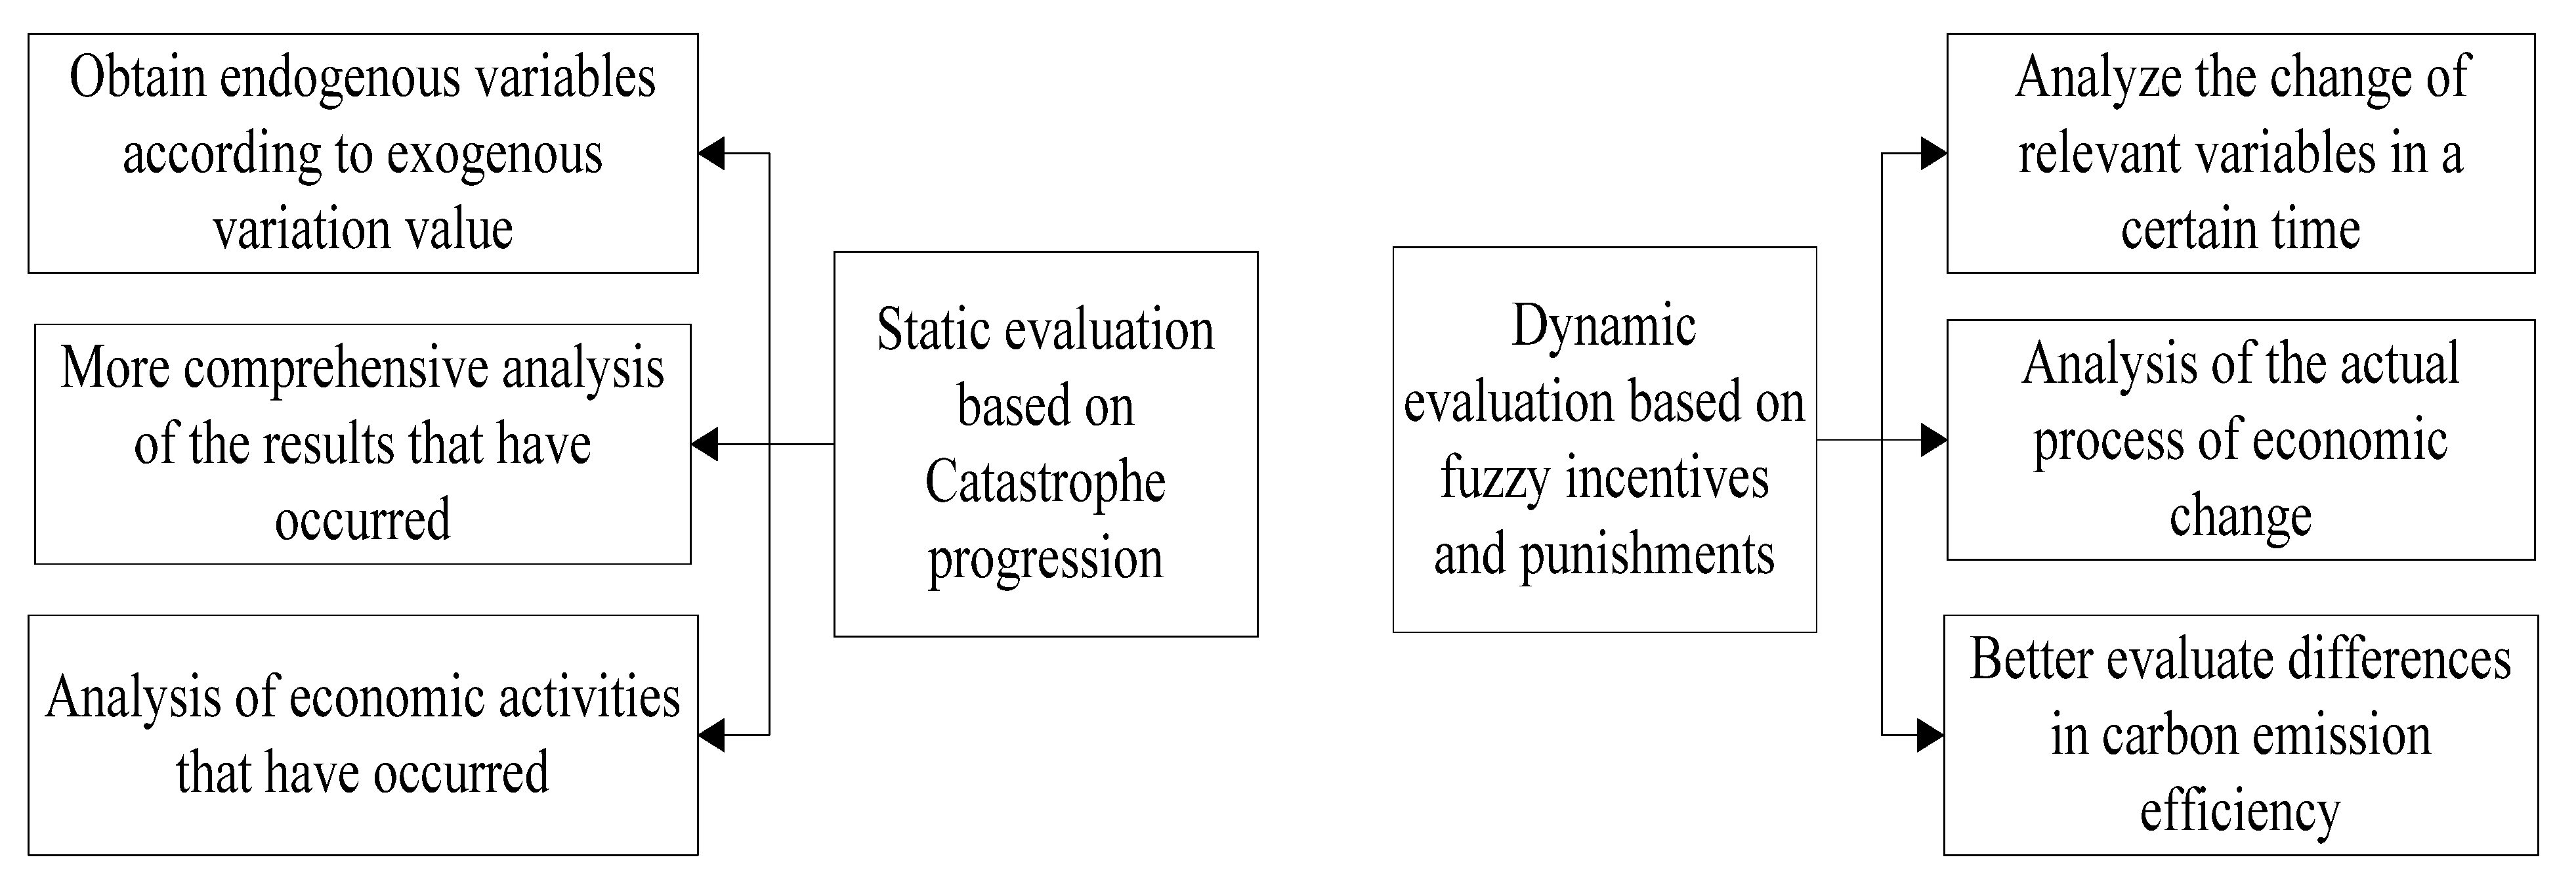
3.2. Static Evaluation Model Based on Catastrophe Progression

The catastrophe progression method is a comprehensive evaluation method that decomposes the multilevel contradictions of the evaluation target, then uses catastrophe theory and fuzzy mathematics to carry out a comprehensive quantitative operation. Unlike AHP combined with TOPSIS and other methods, the catastrophe progression method is a method for decomposing the multilevel contradictions of the objects of evaluation, while AHP analyzes complex decision-making problems, and the TOPSIS rule is used to sort the objects of the evaluation through the results of the decisions. Therefore, the introduction of the mutation level method into the evaluation model in this study enabled a more comprehensive ranking and analysis of the objects of the evaluation, and the current state of the model in this study is similar to that of Karman and Salmanidou et al. [30,31]. Among the different models, catastrophe theory is based on constructing catastrophe progression models consisting of control and state variables. There are generally no more than four control variables in a mutation model. There are seven standard primary catastrophe progression models. Four commonly used catastrophe progression models are the folded catastrophe progression model, the sharp point catastrophe progression model, the dovetail catastrophe progression model and the butterfly catastrophe progression model [30,31]. These are shown in Table 1.
The specific steps of the evaluation were as follows.
Step 1. The required variable indicators were collated to form an indicator evaluation system. The indicator evaluation system of this study was an organic whole with an inherent structure based on three aspects of the characteristics of the efficiency of the logistics industry’s energy carbon emissions and its interlinked multiple indicators. The catastrophe progression model decomposed the evaluation indicators into multiple levels and arranged them into an inverted tree target hierarchy according to the purpose of the evaluation. Table 2 presents all the indicators used in this study to measure the carbon efficiency of the logistics industry based on the literature review. The indicators in the table are divided into three main categories, namely, the industrial environment (E), the industry’s resources (K) and the industry’s output (C). The industrial environment includes the infrastructure (E1) and the labor (E2) components. The industry’s resources include capital stocks (K1), energy consumption (K2) and the development level (K3). Industry output (C) includes three components: energy conversion (C1), transportation of goods (C2) and desired output (C3). The tertiary indicators in the table are a detailed explanation and quantification of the secondary indicators. The data involved in the tertiary headings are available in the National Bureau of Statistics of China.
Step 2. The catastrophe progression models were classified on the basis of the number of variables of the evaluation indicators to determine the type of catastrophe progression model corresponding to the indicators. The results of the level-by-level analysis of the indicators’ models are shown in Figure 1. In Figure 1, E1 corresponded to a three-level indicator, so it corresponded to the swallowtail model (SCPM). The number of tertiary indicators for K3 was 2, which corresponded to the cusp model (CCPM). The number of tertiary indicators for C1 was 3, which corresponded to the swallowtail model (SCPM), while the number of tertiary indicators for C2 and C3 was 2, which corresponded to the cusp model (CCPM). The number of secondary indicators for both K and C was 3, which corresponded to the swallowtail model (SCPM). The efficiency the energy carbon emissions of China’s logistics industry corresponded to E, K and C (three indicators), so the swallowtail model (SCPM) was used to calculate the total value.
Step 3. The correlation between the evaluation indicators from each level of the evaluation matrix, the complementary criteria and the non-complementary criteria were selected on the basis of the multi-objective decision theory. The complementary criteria were used to evaluate the static rating value of the target index when the correlation was strong. If the indicators were less relevant, non-complementary criteria were used. We could then rank the indicators from smallest to largest to derive the indicators’ static assessment value.
Step 4. Based on the perspective of information aggregation, this study analyzed the efficiency of the Chinese logistics industry’s energy carbon emissions. The static evaluation value within t i i = 1 , 2 , 3 , , n + 1 was λ ij = λ i t i i = 1 , 2 , 3 , , m ;   j = 1 , 2 , 3 , , n , where i denotes the number of evaluation indicators and j is the number of objects evaluated, resulting in an information aggregation matrix.
λ ij m * n + 1 = λ 11 λ 12 λ 1 n + 1 λ 21 λ 22 λ 2 n + 1 λ m 1 λ m 2 λ m n + 1

3.3. Dynamic Evaluation Model Based on Fuzzy Incentives and Punishments

3.3.1. Degree of Fuzzy Affiliation

The matrix of the set of rating index information (1) can reveal the energy carbon efficiency in the logistics industry in t i i = 1 , 2 , 3 , , n + 1 of λ ij = λ ij min , λ ij max , that is, the maximum value and minimum value. For any   λ ij , its fuzzy set needs to be clarified, and the corresponding cases of incentives, no incentives and penalties need to be distinguished to determine the degree of affiliation according to the theory of fuzzy mathematics. Furthermore, a uniformly distributed function of the degree of affiliation was chosen on the basis of the efficiency of the energy carbon emissions of the logistics industry. Let   ε i   be the point of no incentives or punishments, and let η 1 , η 2 ,   and   η 3 be the corresponding affiliations of the variable at the time of incentives, punishments and no incentives or punishments, respectively. The subordinate functions of the incentives, disincentives and penalties for energy carbon efficiency in the logistics industry are described below.
{ η 1 = { 0 λ i j ε i λ i j ε i λ i j max ε i λ i j > ε i η 2 = { 1 λ i j ε i λ i j max ε i λ i j > ε i 1 λ i j = ε i 1 λ i j ε i ε i λ i j min λ i j < ε i η 3 = { 0 λ i j ε i ε i λ i j ε i λ i j max λ i j < ε i

3.3.2. The Control Line of Fuzzy Incentives and Punishments

After specifying the affiliation function (2) and the degree of affiliation of the efficiency of the logistics industry’s energy carbon emissions, we set   ε i   as the control line of fuzzy incentives and punishments regarding efficiency of the energy carbon emissions in the logistics industry. The corresponding degree of affiliation of the evaluation indicators and the control line of fuzzy incentives and punishments will change over time. The status (incentive, no incentive or punishment, punishment) of the efficiency of the energy carbon emissions in the logistics industry will also change. At the same time, the fluctuations in the static assessment value of the indicators will also impact the control line of fuzzy incentives and punishments.
ε i = ρ λ max + λ min
The value of ρ is based on the overall development of energy carbon efficiency in the logistics industry.

3.3.3. Dynamic Evaluation of the Efficiency of the Energy Carbon Emissions of the Logistics Industry from the Perspective of Fuzzy Incentives and Punishments
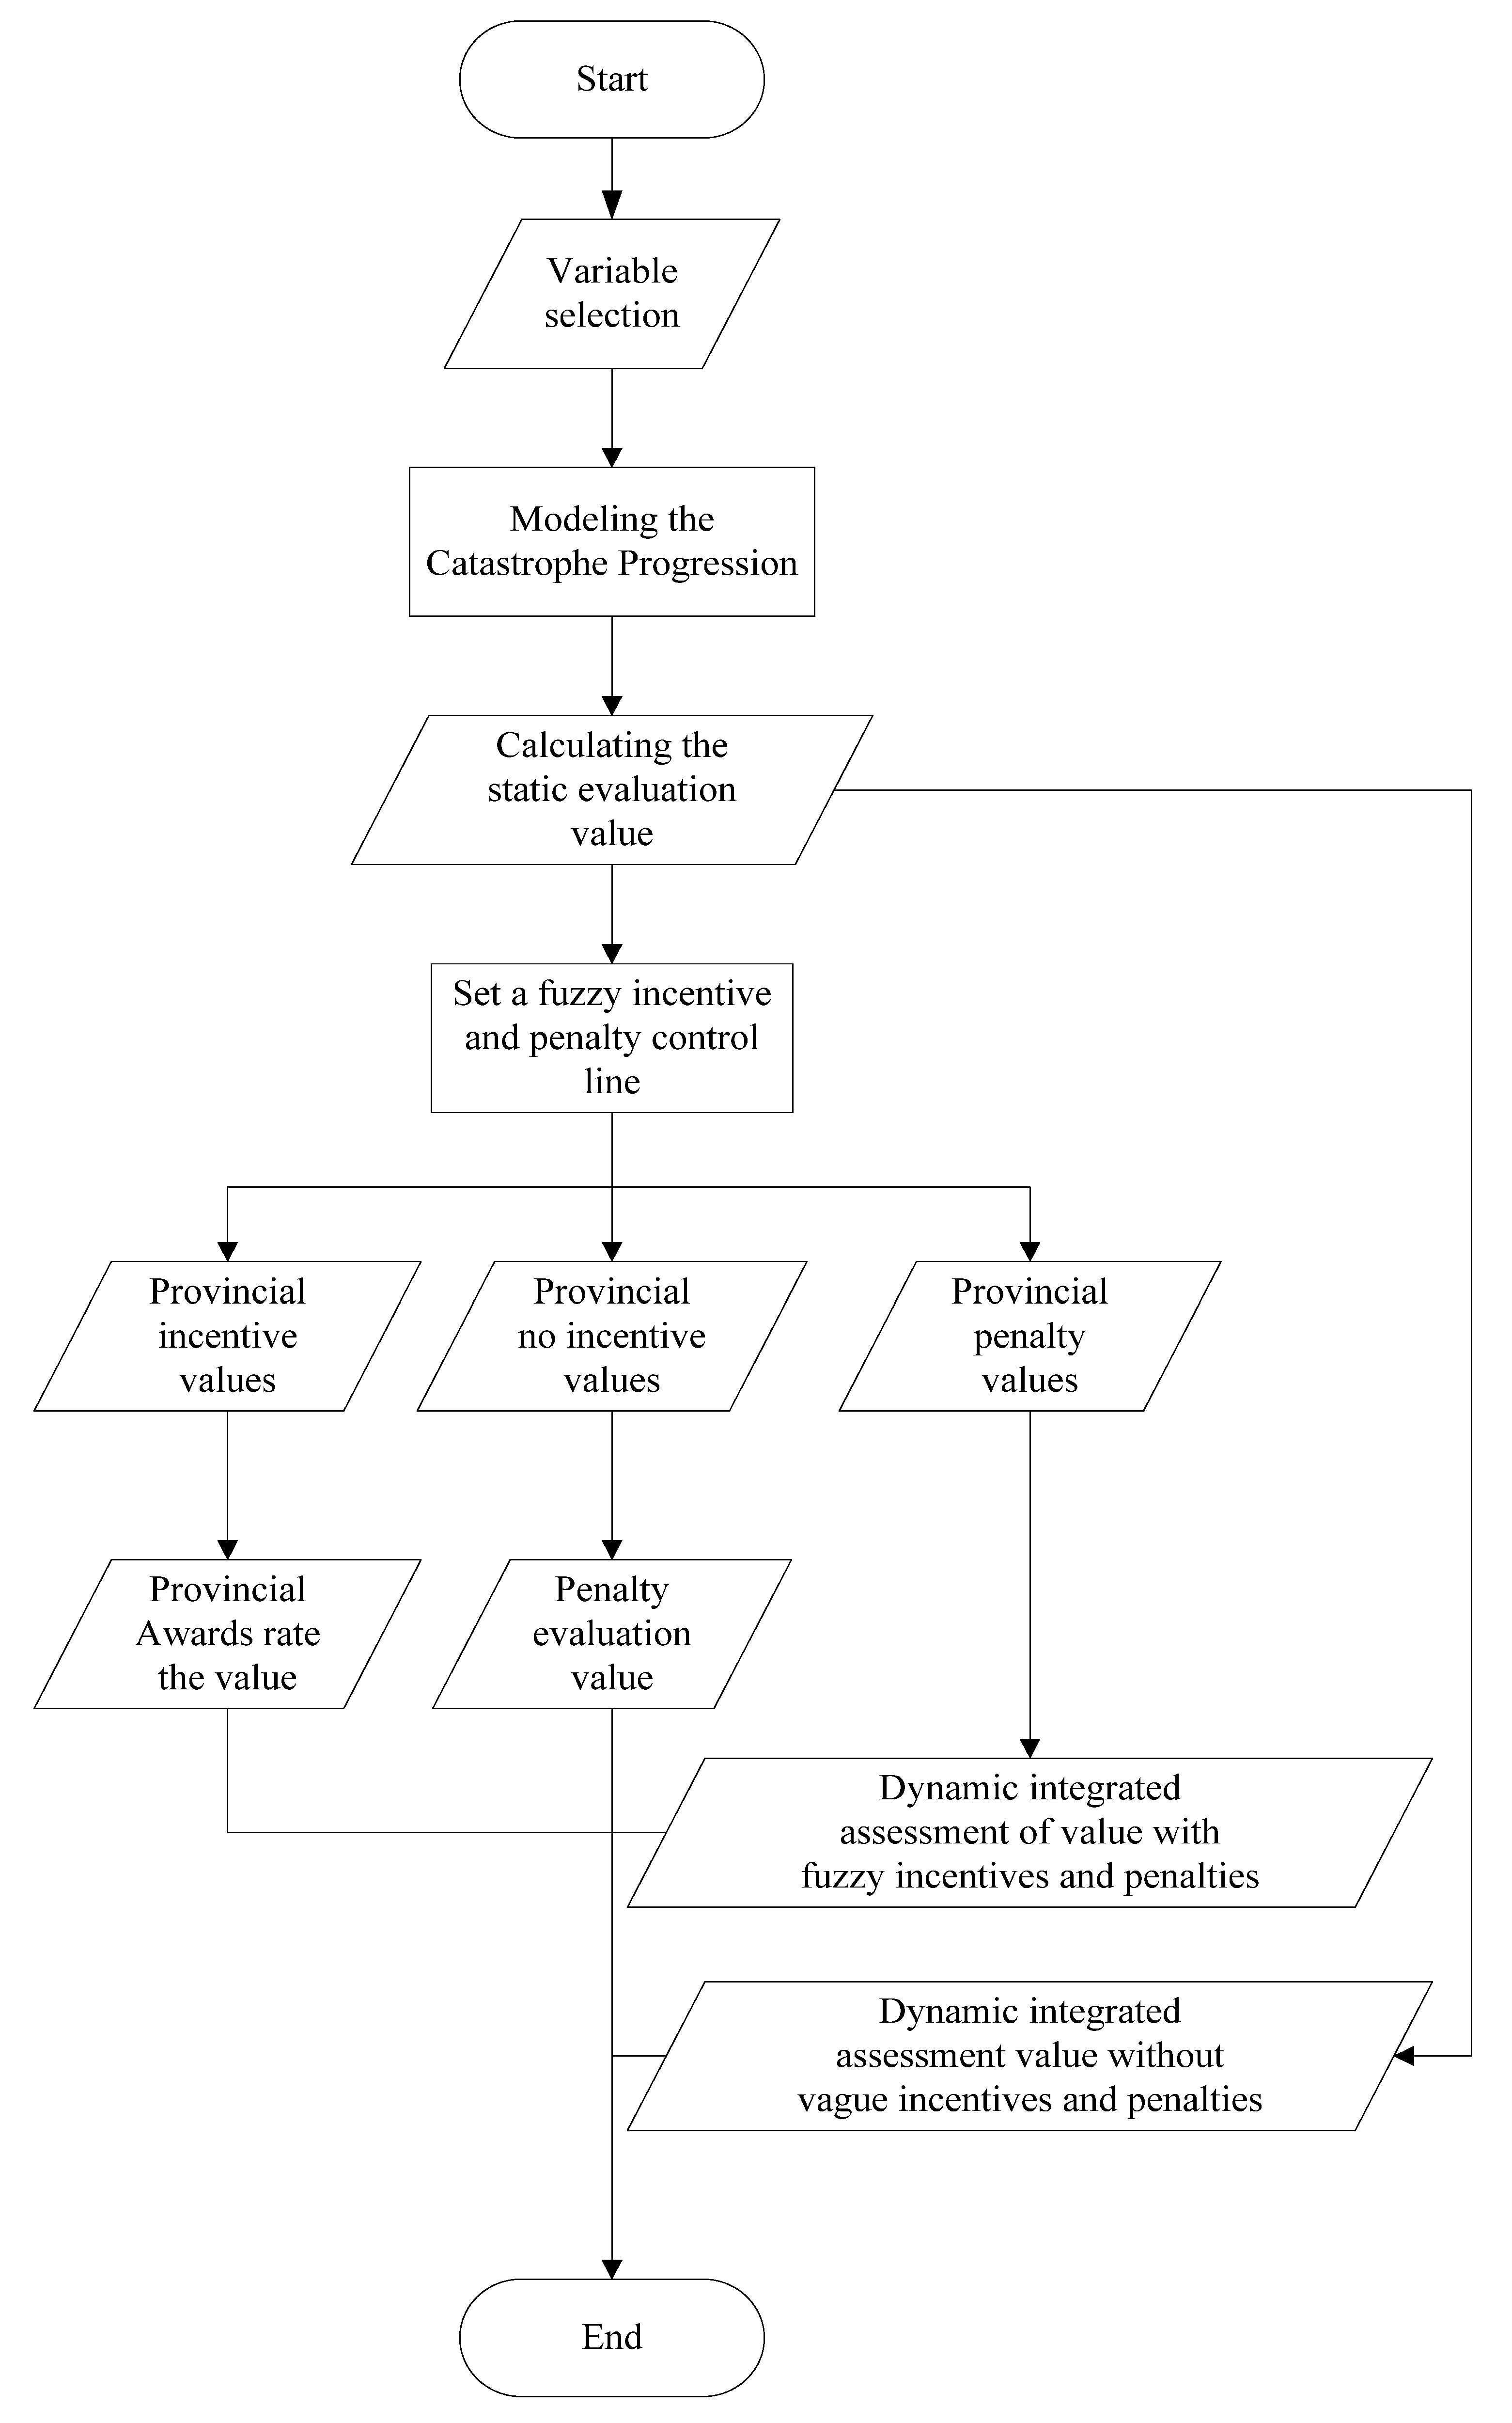
Through the catastrophe progression model and its potential function, it can be seen that, based on the characteristics of the information set, the static assessment value of the efficiency of the energy carbon emissions of the logistics industry and the analysis of the corresponding fuzzy affiliation can obtain, for each period of t j ,   t j + 1 , the value of the incentives, penalties, and no incentives and penalties. Borrowing from the mathematical integral equations   δ it + ,   δ it , and   δ it 0 , the equations are as follows.
  δ it = t k t p η 3   λ ij h it t dt + t p t k + 1 η 3   λ ij h it t dt δ it 0 = t k t k + 1 h it t dt   δ it +   δ it   δ it + = t k t p η 1   λ ij h it t dt + t p t k + 1 η 1   λ ij h it t dt
where h it t is the expression of the static assessment value of the efficiency of the logistics industry’s energy carbon emissions as a function of t j , t j + 1 . Meanwhile, the efficiency of the logistics industry’s energy carbon emissions follows the principle of conservation of the incentives and punishments. The coefficient of the total incentives and punishments is 1, μ 1 is the coefficient of incentives and μ 2 is the coefficient of punishment; it can be expressed as follows.
μ 1 i = 1 M t = 1 N 1   δ it + = μ 2 i = 1 M t = 1 N 1   δ it μ 1 + μ 2 = 1  
Equation (4) can be derived from the incentives and punishments in t j , t j + 1 , and the results of the incentives and punishments can accelerate rapid development in the efficiency of the logistics industry’s energy carbon emissions. The assessment value of the efficiency of the logistics industry’s energy carbon emissions with fuzzy incentives and punishments in a certain period is as follows.
  δ it ± = 1 + μ 1   δ it + + 1 μ 2   δ it + δ it 0  
From Equations (5) and (6), we can obtain the corresponding assessed values of the energy carbon efficiency of the logistics industry for fuzzy incentives and penalties. On the basis of the information of the time dimension, we can derive a dynamic and comprehensive assessment value.
δ i = t = 1 N 1   δ it ±

3.4. Study Plan

  • Step 1: The variables needed for the study were classified, and then the relevant data were found and collated.
  • Step 2: Model the catastrophe progression based on the theory.
  • Step 3: Calculate the static assessment value of the efficiency of the logistics industry’s energy carbon emissions in each province.
  • Step 4: Set the control line of the fuzzy incentives and punishments according to the actual development of the efficiency of the logistics industry’s energy and carbon emissions in China’s provinces.
  • Step 5: Calculate the incentives, no incentives and penalty values for the efficiency of the logistics industry’s energy carbon emissions in each province.
  • Step 6: Calculate the dynamic assessment value of efficiency of the Chinese logistics industry’s energy carbon emissions from the perspective of fuzzy incentives and penalties.
A flow chart of the research plan is shown in Figure 2.

4. Empirical Analysis

4.1. Establishment of the Evaluation Index System and Data Acquisition

To make a comprehensive evaluation of the efficiency of the logistics industry’s energy carbon emissions, this study established an indicator evaluation system with three levels: the industrial environment, the industry’s resources and the industry’s output (Table 2). The six fossil energy sources with the most significant share of energy consumption in the Chinese transportation, storage and postal industries were divided into three categories, namely petroleum (gasoline, diesel and fuel oil), natural gas (liquefied petroleum gas and natural gas) and coal (raw coal), for this calculation. In terms of energy conversion, this study estimated the carbon emissions on the basis of the IPCC’s corresponding energy carbon emission factors, referring to the methodology of the National Greenhouse Gas Emissions Inventory Guidelines, calculated as follows:
C r j = j m E r j μ j
where C r j expresses the energy carbon emissions of the rth province in year j and μ j denotes the carbon emission factor of energy source j (Table 3).
Concerning CO2 emissions, this study referred to the study by Oh [32] to calculate the CO2 emissions based on the energy consumption of the various components involved in logistics operations, such as transportation and storage, with the following formula.
C = i = 1 C i = i = 1 δ i θ i E i
where i   is the carbon emission of the ith energy source, C is the carbon emission factor of the ith energy source consumed in each production process of the logistics industry, Ci is the standard coal conversion factor of the ith energy source, Δi is the carbon emission factor for the energy consumed in each production process in the logistics industry, θ i is the standard coal conversion factor for the energy source and   E i is the consumption of the ith energy source. The data were obtained from the study of Bao et al. [33] and others (Table 4).
This study selected data for measuring the efficiency of the energy carbon emissions from 29 provinces in China. Due to Tibet and Hainan missing more of the relevant energy data, these two provinces were removed from the analysis. The research data for this study were obtained from China’s statistical yearbooks (2014–2019) and China’s energy statistical yearbooks (2014–2019) to guarantee the actual and scientific data of this study.

4.2. Comprehensive Evaluation

In this study, the efficiency of the logistics industry’s energy carbon emissions was evaluated based on the static progression of mutation and a dynamic evaluation based on fuzzy rewards and punishments. Among these, the static evaluation based on the progression of mutation is an analytical method used to obtain endogenous variables according to the variation in the established exogenous value, which is mainly used for comprehensive comparative analyses of the results of economic activities that have taken place. The dynamic evaluation based on fuzzy rewards and punishments is an analysis of the actual process of economic change, which is mainly used to analyze the changes in the related variables in a certain time, and the mutual influence and mutual restrictions of these economic variables in the process of change. Compared with the static evaluation based on the progression of mutation, the dynamic evaluation based on fuzzy rewards and punishments can better evaluate the differences in the efficiency of the energy carbon emissions of the logistics industry in different provinces. However, the static evaluation based on progression of mutation can be used to analyze the results that have occurred more comprehensively. The results are shown in Figure 3. Therefore, this study used the method of combining the two to analyze the development of the energy carbon emissions of the logistics industry in each province in detail.

4.2.1. Static Evaluation Based on Catastrophe Progression

The results show that the efficiency of the logistics industry’s energy carbon emissions in different regions had a hierarchy with different levels. As shown in Table 5, the static assessment value of each year only reflected the current development status of the efficiency of the logistics industry’s energy carbon emissions in the province. It did not objectively and precisely reflect the comprehensive status. The results for 2014 to 2019 showed that the status of the efficiency of the logistics industry’s energy carbon emissions in each province was always in a state of change and varied within a particular regional value.
The southeastern provinces of China, such as Guangdong, Hubei, Hunan and Shandong, which had static ratings consistently in the range of 0.9 to 1, are relatively objective in terms of their carbon efficiency in the logistics sector and need to be rewarded for their leadership role. These provinces are leading the way in terms of the infrastructure of logistics, labor inputs, industry resource allocation and practical logistics output. The static assessment values for the southwestern provinces of China, such as Guangxi, Chongqing, Sichuan and Guizhou, as well as the provinces of Shanxi, Gansu and Heilongjiang, fluctuated between 0.8 and 0.95. These regions need to make up for their environmental shortcomings and make further improvements to the limited resources and suboptimal output. The static assessment values of Beijing, Tianjin, Hebei and Xinjiang were always between 0.7 and 0.9. They are getting lower and lower, with Liaoning Province experiencing a severe decline in the assessment value between 2016 and 2018, gradually recovering to only 0.9 in 2019. These provinces need to pay more attention to the aspects of saving energy and reducing emissions in the logistics industry and to adopt effective programs to improve these. Two provinces, Qinghai and Ningxia, had static assessment values between 0.4 and 0.8 and need to be penalized, which would facilitate their ability to continually catch up with and surpass other provinces. These provinces are lagging in many aspects of carbon emissions in the logistics sector and lack the environmental, technological and economic strength to do so.

4.2.2. Dynamic Evaluation from the Perspective of Fuzzy Incentives and Punishments

Through Equation (3), a control line of fuzzy incentives and penalties of ρ = 0.5 was derived, based on the actual development of the energy carbon efficiency of the logistics industry, with each interval having ε 1 = 0.7142 , ε 2 = 0.7142 , ε 3 = 0.7178 , ε 4 = 0.747 4 and ε 5 = 0.7489 . According to Equations (2) and (4), the intervals can be calculated to be the values of incentive, no incentives or penalties, and penalties, as shown in Table 6.
According to Table 6, the southeastern provinces of China, such as Guangdong, Hubei, Hunan and Shandong, have been in the stages of reward, and no incentives or punishments during 2014–2019, and these provinces and regions with high static assessment values have been rewarded to a greater extent and given no reward to a lesser extent, corresponding to the efficiency of the logistics industry’s energy carbon emissions. As can be seen from the static assessment values, the southeastern regions of Guangdong, Hubei, Hunan and Shandong are leading the way in terms of the energy carbon efficiency of the logistics industry, and one can see that these provinces are developing in a more desirable direction in terms of the industrial environment, the industry’s resources and industrial output. These three levels form a stable structure that promotes the sustainable development of efficiency of the logistics industry’s energy carbon emissions. We should therefore incentivize these provinces in terms of the energy and carbon efficiency of the logistics sector so that they can develop rapidly under conditions of reward. It is also essential to avoid a decline in efficiency in these provinces to keep them moving toward the desired stage of development and maintaining their good development and leadership. The efficiency of the logistics industry’s energy carbon emissions in Qinghai was always in the penalty stage from 2014 to 2019. Beijing, Tianjin and Ningxia experienced intermittent penalty phases in the logistics industry’s energy carbon efficiency over the six years. A comparison of the static assessment values of these provinces revealed that they were also lower. However, Table 5 and Table 6 also show that after these penalties have been imposed, these provinces moved forward in terms of the energy carbon efficiency of the logistics sector to varying degrees, striving to avoid always being behind. This phenomenon also indicates that these provinces have different shortcomings in the energy carbon efficiency of the logistics industry and should prescribe the right remedy to further improve the environment, resources and output of the industry. It can be seen that developing the energy carbon efficiency of the logistics industry can be ensured by the adoption of different incentives and penalties. The development of the logistics industry’s energy carbon efficiency is continuous. It can be made more flexible through continuous incentives and penalties, blurring the boundaries of incentives and penalties on the premise of fairness.
The corresponding coefficients of incentives and punishments can be obtained from Equations (5) and (6), and the dynamic, comprehensive assessment value of the efficiency of the logistics industry’s energy carbon emissions under fuzzy incentives and punishments was calculated by integrating Equation (7), as shown in Table 7.
As seen from Table 7, the dynamically integrated assessment of the energy carbon efficiency of the logistics sector was mostly smaller than the dynamically integrated assessment of the energy carbon efficiency of the logistics sector without this condition in the presence of vague incentives and penalties. The southeastern provinces of China, such as Guangdong, Hubei, Hunan and Shandong, were among the top provinces in terms of development, with different increases in their dynamic rating values, with Guangdong and Shandong showing the most significant increases. In the southwestern region, the dynamic values of Guangxi, Chongqing, Sichuan, Guizhou, Shanxi, Gansu and Heilongjiang have increased to different degrees, and their rankings have changed slightly. The provinces and cities in Tianjin, Beijing, Ningxia and Qinghai showed a downward trend in their dynamic assessment values. All these phenomena reflect the effect of the fuzzy incentives and punishments on the efficiency of the logistics industry’s energy carbon emissions.
The provinces of Guangdong and Shandong in China ranked highly in terms of the dynamic composite value of the energy carbon efficiency of the logistics industry. They are also in the high range of static values. The provinces of Ningxia and Qinghai, on the other hand, ranked low in terms of the dynamic composite value of the energy carbon efficiency of the logistics industry, and their static values were also in the low range. According to the static evaluation value of the provinces of Guangdong, Hubei, Hunan and Shandong, the southeastern provinces have a good industrial environment, a well-developed infrastructure, high labor inputs, abundant industry resources and a high level of expected industry output and cargo transport volumes, corresponding to the high efficiency of the energy carbon emissions of the logistics industry. According to the control line set for fuzzy incentives and penalties, the southeastern provinces of Guangdong, Hubei, Hunan and Shandong had static assessments of the energy carbon efficiency of the logistics sector above the control line. These provinces have a stronger sense of ownership of the incentives and, thus, can receive more. The southeastern provinces of Guangdong, Hubei, Hunan and Shandong received more incentives in terms of their assessed value, which coincided with their static assessed value.

5. Conclusions

This study aimed to make up for the shortcomings in the flexible management of the energy carbon emissions of China’s logistics industry by conducting a static evaluation and a dynamic evaluation of the efficiency of the energy carbon emissions of China’s logistics industry based on the mutation level method and the fuzzy reward and punishment method, thus rationalizing the rewards and punishments for China’s logistics industry’s carbon emissions and implementing the rewards or punishments for each province in a more just manner.
A comprehensive analysis of the evaluation shows that Guangdong, Hubei, Hunan, Shandong and other southeastern provinces with a high static assessment value for the energy efficiency of the logistics industry had no penalty stage and received a large number of rewards, while poorer regions such as Qinghai, with a low static assessment value for the energy efficiency of the logistics industry, had no rewards and received a large number of penalties. Ningxia, Tianjin, Beijing and other provinces had a medium static assessment value for the energy efficiency of the logistics industry. The comparison between the static and dynamic assessment values showed that the dynamic evaluation was a more realistic and detailed representation of the development of the energy and carbon efficiency of the logistics sector in each province by combining the characteristics of fuzzy rewards and punishments. This differed somewhat from the findings of Islam [25], who focused more on the dynamic efficiency of provincial carbon emissions in the logistics sector over time, rather than considering the static results and the relationship between the two, a shortcoming that was remedied in this study. This study is more in line with the findings of Portengen et al. [34], which focused more on the combination of dynamic and static analyses and compared the two, and this study further researched the basis of fuzzy rewards and penalties. This study implemented the conditions of fuzzy rewards and punishments on the basis of the results above to reward the good and punish the bad in a fair and reasonable way, which makes up for the limitations of clear reward and punishment boundaries in the actual development of the logistics industry, and also reflects the flexibility in the efficiency of the energy carbon emissions of the Chinese logistics industry.
This study adopted a dynamic and comprehensive evaluation method using the perspective of the characteristics of fuzzy rewards and punishments. The study reflected the varying degrees of internal competition among the provinces in terms of the energy efficiency of the logistics sector and also highlighted the interactions among Chinese provinces and their influence. By rewarding and penalizing different provinces, it may be possible to further promote the development of energy carbon emissions in the logistics sector and enable provinces to be aware of their own development status. The findings are closer to the ideas of Wehner et al. [35], but this study is more comprehensive. Although the logistics industry has made great progress in terms of both national and local government policy support and the provinces’ own development, there are still weaknesses in the development of the logistics industry’s energy carbon efficiency, and further targeted countermeasures and recommendations are needed to improve the logistics industry’s energy carbon efficiency.
Based on the comprehensive evaluation results above, the following three recommendations can be made. First, we should improve the industrial environment, increase the input of the industry’s resources and further promote the efficient transformation of the expected output of the industry to improve the efficiency of the logistics industry’s energy and carbon emissions. A high-quality industrial environment can serve as a solid cornerstone for the development of the efficiency of the logistics industry’s energy and carbon emissions, and increasing the precise inputs of industrial resources can provide an effective resource guarantee for improving the efficiency of the logistics industry’s energy and carbon emissions. Improving the desired output of the industry will add to the development of the efficiency of the logistics industry’s energy and carbon emissions. Second, based on the characteristics of fuzzy rewards and punishments, boundaries can be reasonably set according to the differences in the development of the logistics industry’s energy and carbon emissions in each province. Provinces with well-developed efficiency in the logistics industry’s energy and carbon emissions can continue to increase the incentives, while provinces with poorly developed efficiency should continue to increase the penalties. This can ensure the beneficial development of the efficiency of the energy carbon emissions from China’s logistics industry. Finally, a reasonably inclusive and effective management program should be implemented according to the different development statuses of the logistics industry in each province. Rewards and penalties are not an end in themselves but are a means to an end. The provinces must use this tool to make efforts to develop and move forward. The leading provinces will continue to maintain their status quo, and the lagging provinces will be punished to promote their reform and continuous improvement. The relevant departments of the local governments should also give corresponding policy guidance and precise support to promote the efficiency of energy and carbon emissions in China’s logistics industry to keep developing in the right direction.

Author Contributions

Conceptualization, X.Y.; methodology, Q.L.; validation, Q.L. and Y.W.; writing—review and editing, X.Y., Q.L. and Y.W. All authors have read and agreed to the published version of the manuscript.

Funding

This study was supported by the Liaoning Provincial 2022 Social Science Planning Fund Key Project (Influence Mechanism of Technological Innovation of Liaoning Manufacturing Industry on Carbon Emission Efficiency—GVC embedding perspective L22AGL014).

Institutional Review Board Statement

Not applicable.

Informed Consent Statement

Not applicable.

Data Availability Statement

Not applicable.

Conflicts of Interest

The authors declare no conflict of interest.

References

  1. Weihs, G.; Ho, M.; Kambanis, J. Scoping study of the economics of CO2 transport and storage options for steel manufacturing emissions in eastern Australia. Int. J. Greenh. Gas Control. 2022, 114, 103592. [Google Scholar] [CrossRef]
  2. Roy, T.; Sallee, J.B.; Bopp, L. Diagnosing CO2-Emission-Induced Feedbacks between the Southern Ocean Carbon Cycle and the Climate System: A Multiple Earth System Model Analysis Using a Water Mass Tracking Approach. J. Clim. 2021, 34, 9071–9092. [Google Scholar] [CrossRef]
  3. Sun, R.S.; Gao, X.; Deng, L.C. Is the Paris rulebook sufficient for effective implementation of Paris Agreement? Adv. Clim. Change Res. 2022, 13, 600–611. [Google Scholar] [CrossRef]
  4. Schwarte, C. EU Climate Policy under the Paris Agreement. Clim. Law 2021, 11, 157–175. [Google Scholar] [CrossRef]
  5. Winkler, H. Putting equity into practice in the global stocktake under the Paris Agreement. Clim. Policy 2020, 20, 124–132. [Google Scholar] [CrossRef]
  6. Xuan, D.; Ma, X.W.; Shang, Y.P. Can China’s policy of carbon emission trading promote carbon emission reduction? J. Clean. Prod. 2020, 270, 122383. [Google Scholar] [CrossRef]
  7. Wang, Z.J.; Suo, J. Optimization of Flexible Production Logistics Under Low Carbon Constraint. Int. J. Simul. Model. 2022, 21, 184–195. [Google Scholar] [CrossRef]
  8. Huang, G.Y.; Cho, S.H.; Zhang, P. Evaluation and Analysis Of Regional Ecological Logistics Performance Based On Low Carbon Development -Taking Guangxi As An Example. Fresenius Environ. Bull. 2021, 30, 8944–8949. [Google Scholar]
  9. Jabbour, A.B.; Jabbour, C.J.; Sarkis, J. Fostering low-carbon production and logistics systems: Framework and empirical evidence. Int. J. Prod. Res. 2021, 59, 7106–7125. [Google Scholar] [CrossRef]
  10. Zivkovic, I.; Humphreys, M.P.; Achterberg, E.P. Enhanced mercury reduction in the South Atlantic Ocean during carbon remineralization. Mar. Pollut. Bull. 2022, 178, 113644. [Google Scholar] [CrossRef]
  11. Khan, S.; Godil, D.I.; Abbas, F. Adoption of renewable energy sources, low-carbon initiatives, and advanced logistical infrastructure—An step toward integrated global progress. Sustain. Dev. 2022, 30, 275–288. [Google Scholar] [CrossRef]
  12. García, X.; Morris, J.; Paltsev, S. Toward a just energy transition: A distributional analysis of low-carbon policies in the USA. Energy Econ. 2022, 105, 105769. [Google Scholar] [CrossRef]
  13. Kaya, Y.; Yokobor, K. Environment, Energy, and Economy: Strategies for Sustainability; United Nations University Press: Tokyo, Japan, 1997; Volume 4. [Google Scholar]
  14. Mielnik, J.; Goldember, G. Communication the evolution of the ‘Carbonization Index’ indeveloping countries. Energy Policy 1999, 27, 307–308. [Google Scholar] [CrossRef]
  15. García, A.; Monsalve, S.J.; Villalta, D. Impact of low carbon fuels (LCF) on the fuel efficiency and NOx emissions of a light-duty series hybrid commercial delivery vehicle. Fuel 2022, 321, 124035. [Google Scholar] [CrossRef]
  16. Sai, R.; Lund, H.; Kaiser, M.J. Towards low carbon economy: Performance of electricity generation and emission reduction potential in Africa. Energy 2022, 251, 123952. [Google Scholar]
  17. Aviral, K.T.; Mustafa, K.; Umer, J.B. Hydropower, human capital, urbanization and ecological footprints nexus in China and Brazil: Evidence from quantile ARDL. Environ. Sci. Pollut. Res. 2022, 29, 68923–68940. [Google Scholar]
  18. Kumar, S.; Sarkar, B.; Kumar, A. Fuzzy reverse logistics inventory model of smart items with two warehouses of a retailer considering carbon emissions. RAIRO Oper. Res. 2021, 55, 2285–2307. [Google Scholar] [CrossRef]
  19. Wanke, P.F.; Jabbour, C.; Antunes, J. An Original Information Entropy-Based Quantitative Evaluation Model for Low-carbon Operations in an Emerging Market. Int. J. Prod. Econ. 2021, 234, 108061. [Google Scholar] [CrossRef]
  20. Morgan, D.R.; Styles, D.; Lane, E.T. Packaging choice and coordinated distribution logistics to reduce the environmental footprint of small-scale beer value chains. J. Environ. Manag. 2022, 307, 114591. [Google Scholar] [CrossRef]
  21. Sufyanullah, K.; Ahmad, K.A.; Ali, M. Does emission of carbon dioxide is impacted by urbanization? An empirical study of urbanization, energy consumption, economic growth and carbon emissions—Using ARDL bound testing approach. Energy Policy 2022, 164, 112908. [Google Scholar] [CrossRef]
  22. Modise, R.K.; Mpofu, K.; Adenuga, O.T. Energy and Carbon Emission Efficiency Prediction: Applications in Future Transport Manufacturing. Energies 2021, 14, 8466. [Google Scholar] [CrossRef]
  23. Mustafa, K.; Tooba, P.B.; Mohammad, H.T. Revisiting global energy efficiency and CO2 emission nexus: Fresh evidence from the panel quantile regression model. Environ. Sci. Pollut. Res. 2022, 29, 47502–47515. [Google Scholar]
  24. Talmon, D.; Mendoza, A.; Carriquiry, M. Holstein strain affects energy and feed efficiency in a grazing dairy system. Anim. Prod. Sci. 2022, 62, 20587. [Google Scholar] [CrossRef]
  25. Islam, M.A.; Gajpal, Y. Optimization of Conventional and Green Vehicles Composition under Carbon Emission Cap. Sustainability 2021, 13, 6940. [Google Scholar] [CrossRef]
  26. Chowdhury, S.A.; Aziz, S.; Hossan, M.B. Cost Efficiency Evaluation of Thermal Power Plants in Bangladesh Using a Two-Stage DEA Model. Econ. Energy Environ. Policy 2022, 11, 145. [Google Scholar] [CrossRef]
  27. Lei, X.Q.; Yang, J.J.; Zou, J.B. Research on the Impact of Logistics Technology Progress on Employment Structure Based on DEA-Malmquist Method. Math. Probl. Eng. 2020, 2020, 7064897. [Google Scholar] [CrossRef]
  28. Wang, J.L.; Li, H.W.; Guo, H.F. Coordinated Development of Logistics Development and Low-Carbon Environmental Economy Base on AHP-DEA Model. Sci. Program. 2022, 2022, 5891909. [Google Scholar] [CrossRef]
  29. Liu, Z.K.; Jiang, Y.F.; Bolayog, D. Does "replacing business tax with value-added tax" promote the energy efficiency of the logistics industry in China? Environ. Sci. Pollut. Res. 2019, 26, 33169–33180. [Google Scholar] [CrossRef]
  30. Karman, A.; Pawowski, M. Circular economy competitiveness evaluation model based on the catastrophe progression method. J. Environ. Manag. 2022, 303, 114223. [Google Scholar] [CrossRef]
  31. Salmanidou, D.M.; Ehara, A.; Himaz, R. Impact of future tsunamis from the Java trench on household welfare: Merging geophysics and economics through catastrophe modelling. Int. J. Disaster Risk Reduct. 2021, 61, 102291. [Google Scholar] [CrossRef]
  32. Oh, D. A global Malmquist-Luenberger productivity index. J. Product. Anal. 2010, 34, 183–197. [Google Scholar] [CrossRef]
  33. Bao, Y.D.; Li, Y.S.; Zhang, S.Z. Study on the Scale of Carbon Emission of Logistics Industry and Its Influencing Factors in the Yangtze River Delta. Ecol. Econ. 2020, 36, 25–31+53. [Google Scholar]
  34. Portengen, C.M.; Sprooten, E.; Zwiers, M.P. Reward and Punishment Sensitivity are Associated with Cross-disorder Traits. Psychiatry Res. 2021, 298, 113795. [Google Scholar] [CrossRef]
  35. Wehner, J.; Deilami, N.; Vural, C.A. Logistics service providers’ energy efficiency initiatives for environmental sustainability. Int. J. Logist. Manag. 2021, 33, 1–26. [Google Scholar] [CrossRef]
Figure 1. Diagram of indicator calculation research process.
Sustainability 15 05574 g001
Figure 2. Research flow chart.
Sustainability 15 05574 g002
Figure 3. Comparison chart of methods.
Sustainability 15 05574 g003
Table 1. Catastrophe progression models and related equations.
Catastrophe Progression ModelControl VariablePotential FunctionNormalized EquationWeighting
Order
Folded (FCPM)A f x = x 3 + ax x a a W a
Cusp (CCPM)a,b f x = 1 4 x 4 + 1 2 ax 2 + bx x a = a
x b = b 3
W a > W b
Swallowtail (SCPM)a,b,c f x = 1 5 x 5 + 1 3 ax 3 + 1 2 bx 2 + cx x a = a
x b = b 3
x c = c 4
W a > W b > W c
Butterfly (BCPM)a,b,c,d f x = 1 6 x 6 + 1 4 ax 4 + 1 3 bx 3 + 1 2 cx 2 + dx x a = a
x b = b 3
x c = c 4
x d = d 5
W a > W b > W c > W d
Table 2. Indicator system for energy carbon efficiency in the logistics industry target indicators.
Target IndicatorTier 1
Indicator
Secondary IndicatorTertiary IndicatorIndicator Number
Energy carbon emission efficiency of the logistics industryIndustry
environment
(E)
Infrastructure (E1)Railway mileageE11
Road mileageE12
Inland waterway mileageE13
Labor force (E2)Number of persons employed in railway transportE21
Number of persons employed in road transportE22
Number of persons employed in water transportE23
Number of persons employed in air transportE24
Industry
resources
(K)
Capital stock (K1)Total wages of employed persons in urban units of the transport, storage and postal industryK11
Number of legal persons in theK12
transport, storage and postal industry
Energy
consumption (K2)
PetroleumK21
Natural gasK22
CoalK23
Level of
development (K3)
Provincial GDPK31
Total provincial populationK32
Industry output
(C)
Energy
conversion (C1)
CO2 emissionsC11
Carbon emissionsC12
Carbon intensityC13
Transport of goods (C2)Provincial freight volumeC21
Provincial freight turnoverC22
Desired output (C3)Value added of regional output of logistics industryC31
Tertiary industry value added indexC32
Table 3. Energy carbon emission factors.
EnergyCoefficient per Ton of Fuel
Raw coal0.7599
Gasoline0.5538
Paraffin0.5714
Diesel0.5921
Combustion oil0.6185
Liquefied petroleum gas0.5042
Natural gas0.4483
Electricity2.2132
Table 4. Energy discount reference factors for standard coal.
Type of Energy Coefficient   ( θ i )
Raw coal0.7143
Gasoline1.4714
Paraffin1.4714
Diesel1.4571
Combustion oil1.4286
Crude oil1.4286
Natural gas1.3300
Electricity0.1229
Table 5. Static evaluation values.
Time Area201920182017201620152014
Province
Beijing0.71950.71010.74310.78990.85210.8586
Tianjin0.79780.75900.72430.82620.79460.8548
Hebei0.72890.80040.80490.92900.94300.9388
Shanxi0.88390.89920.89410.90380.91790.9186
Inner
mongolia
0.79020.89880.88780.90630.93330.9337
Liaoning0.92410.77620.76730.77440.94380.9420
Jilin0.79920.83260.83950.85830.89490.8367
Heilongjiang0.89840.85740.87150.87290.91470.9191
Shanghai0.78710.82830.82850.82800.88460.8793
Jiangsu0.95600.95520.95350.96270.97610.9744
Zhejiang0.76400.89820.93390.84250.94510.9394
Anhui0.91150.91770.92580.92840.94800.9499
Fujian0.92550.90700.90640.91350.92900.9230
Jiangxi0.90050.89740.89750.89760.91830.9183
Shandong0.95880.96090.96100.96440.97280.9725
Henan0.91970.93880.94000.95200.96070.9570
Hubei0.95550.94030.93830.94680.95950.9559
Hunan0.94590.92510.92580.92920.94980.9516
Guangdong1.00000.99430.99690.98880.99650.9950
Guangxi0.89380.88880.88610.88410.91250.9140
Chongqing0.91080.88480.89160.89690.91910.9159
Sichuan0.93180.90310.89400.90360.94010.9422
Guizhou0.88000.85930.86240.86710.89550.9029
Yunnan0.90300.88590.87950.88400.91210.9117
Shaanxi0.88670.88560.88210.89730.92210.9245
Gansu0.85320.83580.81510.84440.87700.8847
Qinghai0.52640.49790.55360.43870.43190.4424
Ningxia0.52560.54180.60560.74940.72930.7377
Xinjiang0.70850.77680.77710.87440.89760.9003
Table 6. Incentive, no incentive, penalty values.
Time Area(2014, 2015)(2015, 2016)(2016, 2017)(2017, 2018)(2018, 2019)
Province δ + δ 0 δ δ + δ 0 δ δ + δ 0 δ δ + δ 0 δ δ + δ 0 δ
Beijing0.380.480.000.330.490.000.160.600.000.000.720.010.000.640.08
Tianjin0.340.480.000.190.620.000.250.530.000.000.680.070.030.750.00
Hebei0.710.230.000.710.230.000.590.280.000.200.600.000.130.640.00
Shanxi0.610.310.000.600.310.000.560.340.000.510.390.000.490.400.00
Inner
mongolia
0.680.250.000.660.260.000.560.330.000.490.410.000.440.410.00
Liaoning0.720.220.000.600.260.000.130.640.000.110.670.000.090.770.00
Jilin0.330.540.000.490.390.000.380.470.000.310.530.000.230.590.00
Heilongjiang0.610.300.000.570.330.000.440.430.000.410.450.000.340.530.00
Shanghai0.460.430.000.440.410.000.280.540.000.270.560.000.210.590.00
Jiangsu0.880.090.000.870.100.000.830.130.000.770.190.000.770.190.00
Zhejiang0.710.230.000.660.240.000.370.520.000.650.270.000.420.410.00
Anhui0.760.190.000.730.210.000.670.260.000.630.290.000.580.340.00
Fujian0.640.290.000.650.280.000.600.310.000.560.350.000.540.370.00
Jiangxi0.610.310.000.600.310.000.540.360.000.520.380.000.490.410.00
Shandong0.870.100.000.860.110.000.840.120.000.810.160.000.800.160.00
Henan0.800.160.000.800.160.000.780.170.000.700.240.000.670.260.00
Hubei0.790.170.000.790.160.000.750.190.000.700.240.000.700.250.00
Hunan0.760.190.000.740.200.000.670.250.000.640.290.000.630.310.00
Guangdong0.990.000.000.990.010.000.990.010.000.990.000.000.990.000.00
Guangxi0.590.320.000.570.330.000.490.400.000.480.410.000.460.440.00
Chongqing0.610.310.000.600.310.000.530.360.000.490.400.000.450.450.00
Sichuan0.720.220.000.680.240.000.560.340.000.510.390.000.530.390.00
Guizhou0.540.360.000.500.380.000.420.450.000.380.480.000.340.530.00
Yunnan0.590.330.000.570.330.000.480.400.000.450.430.000.450.450.00
Shaanxi0.640.290.000.610.300.000.530.360.000.460.420.000.440.450.00
Gansu0.470.410.000.430.430.000.330.500.000.240.590.000.260.590.00
Qinghai0.000.250.190.000.250.190.000.250.250.000.250.280.000.250.26
Ningxia0.050.690.000.030.710.000.060.620.000.000.330.240.000.300.24
Table 7. Dynamic evaluation value from fuzzy incentives and punishments.
Value AreaAwards Rate the ValuePenalty Evaluation ValueDynamic Integrated Assessment of Value with Fuzzy Incentives and PenaltiesDynamic Integrated Assessment Value without Vague Incentives and Penalties
Province
Beijing0.86791.50823.81693.8843
Tianjin0.80211.56423.88603.9304
Hebei2.33450.98844.36804.3113
Shanxi2.76680.87474.58354.5162
Inner mongolia2.82470.83174.55684.4881
Liaoning1.64501.27494.23484.1948
Jilin1.73181.25574.28544.2432
Heilongjiang2.37581.02474.48314.4253
Shanghai1.67021.26624.24324.2026
Jiangsu4.12130.34574.91294.8127
Zhejiang2.80890.83134.53984.4715
Anhui3.36480.64294.73234.6505
Fujian2.98270.79884.65274.5802
Jiangxi2.75660.88184.58734.5202
Shandong4.17530.32474.92634.8248
Henan3.74040.49474.82084.7298
Hubei3.73000.50524.83124.7405
Hunan3.44250.61814.76244.6787
Guangdong4.94830.01295.09444.9740
Guangxi2.57450.95044.53794.4753
Chongqing2.67490.91544.57084.5057
Sichuan2.99670.79054.65064.5777
Guizhou2.18521.09534.42894.3757
Yunnan2.53150.96874.53054.4689
Shaanxi2.67490.90894.55774.4926
Gansu1.71781.26174.28304.2412
Qinghai0.00001.20321.26732.4064
Ningxia0.13361.56212.79643.2578
Xinjiang1.63781.24624.17014.1302
Disclaimer/Publisher’s Note: The statements, opinions and data contained in all publications are solely those of the individual author(s) and contributor(s) and not of MDPI and/or the editor(s). MDPI and/or the editor(s) disclaim responsibility for any injury to people or property resulting from any ideas, methods, instructions or products referred to in the content.

