Article

Cultivating the Mediterranean Wild Edible Species Cichorium spinosum L. in Aquaponics: Functional and Growth Responses to Minimal Nutrient Supplementation

1
Department of Agriculture Crop Production and Rural Environment, School of Agricultural Sciences, University of Thessaly, GR-38446 Volos, Greece
2
Department of Veterinary Medicine, Aristotle University of Thessaloniki, GR-54006 Thessaloniki, Greece
3
Department of Animal Production, Fisheries and Aquaculture, School of Agricultural Sciences, University of Patras, GR-30200 Patras, Greece
*
Author to whom correspondence should be addressed.
Sustainability 2023, 15(6), 5572; https://doi.org/10.3390/su15065572
Submission received: 17 February 2023 / Revised: 10 March 2023 / Accepted: 19 March 2023 / Published: 22 March 2023

Abstract

:
Aquaponics is a plant and fish co-cultivation system with high sustainability, yet sub-optimal concentrations of Fe and K often compromise crop yields. We cultivated the Mediterranean wild edible Cichorium spinosum L. (Greek name: stamnagathi) in an aquaponics setup following a minimal supplementation approach that focused on Fe and K. Stamnagathi and tilapia fish were co-cultivated under (i) solely Fe, (ii) Fe+K input and (iii) no-input Control treatments. We aimed to evaluate the feasibility of aquaponics for stamnagathi cultivation, identify the system’s bottlenecks, and propose optimization measures. Several plant’s growth and functional parameters were monitored throughout the 35-day experimental period, notably instantaneous gas exchange and photosynthetic capacity via light response curves, state and efficiency of the photosynthetic machinery, pigment content, and yield and morphometric assessments. Fish growth characteristics and survival rates remained unaffected. Fe deficiency was crucial in shaping the responses of Control stamnagathi, which showed inferior performance in terms of photochemistry, chlorophylls content, light use efficiency and, subsequently, photosynthetic activity. Fe and Fe+K-treated plants exhibited similarly high performance in all studied parameters and achieved 4.5- and 4-fold increased yields, respectively, compared to Control. The results demonstrate that aquaponics is an advantageous cropping system for stamnagathi and solely Fe supplementation is adequate to promote excellent performance and yield of this oligotrophic species.

1. Introduction

Aquaponics is a sustainable food production system that combines aquaculture and hydroponics [1]. Its basic principle is the use of the water recirculating between three sub-systems where fish, crops and bacteria grow. Fish waste enriches the water with nutrients and ammonia, where the latter is transformed to nitrate through the nitrification performed by bacteria; all these nutrients are used for the fertilization of plants, which by absorbing them, purify the water that is directed back to aquaculture. The main advantage of the system is resource-saving (i.e., water and nutrients), while converting waste into resources under a circular economy framework ensures its low environmental impact, as well as its sustainability [1,2]. Another advantage lies in the versatile nature of aquaponics in terms of (i) variable fish and crop coupling, resulting in a profitable product diversity, and (ii) the system’s size [3,4]. Concerning the latter, aquaponics farming ranges from large-scale commercial facilities to small-scale domestic installations, the common features of which are indoor cultivation and limited space, which both facilitate urban use [5]. This is increasingly significant since, nowadays, almost 54% of the world’s population lives in urban areas, necessitating progress in urban agriculture and local food production systems [6,7].
In the early years of aquaponics research, the expectation of a self-sustained operation prevailed. It was considered possible to produce efficient crop and fish yields without external inputs apart from fish feed. This would be achieved by engineering the system through an optimal coupling of fish stocking and hydroponic size. However, these expectations were shown to be unrealistic. Certain essential nutrients for crop growth, mainly Fe and K, are at sub-optimal concentrations in virtually all tested aquaponics systems [8,9,10]. This issue was usually addressed by adding several micro- and macro-nutrients to the levels proposed for hydroponics [11]. This approach, though efficient in enhancing plant productivity, raises concerns regarding aquaponics sustainability and its ecological footprint. In our previous work with lettuce and spinach, we introduced a new concept for tackling nutrient deficiencies while simultaneously retaining the system’s advantages, i.e., the minimal supplementation approach [9,12]. We focused on Fe and K enrichment of the aquaponic water and examined the crop’s response in terms of both function and growth. The results were species-specific concerning crop performance and the particular nutrient deficiency that constituted the bottleneck, posing limitations to crop productivity. Therefore, cultivated species should be tested in this framework to study how they function under minimal supplementation conditions and how we can optimize their performance.
The aquaponics setting has been routinely studied in regard to its potential for the production of high-commercial-value crops, such as lettuce, spinach, and tomato [8,9,12]. To the best of our knowledge, aquaponics has never been tested for the cultivation of wild edible species. Nevertheless, there is a growing interest in cultivating these species, mainly by targeting the valorization of their health-promoting characteristics [13]. To this direction, it is important to develop standardized and sustainable cultivation protocols [14]. Aquaponics could be an efficient alternative to the current agricultural practice of adopting the fertilizer regimes applied to intensive crop farming. This latter approach except of being unsuitable for wild oligotrophic species, also has adverse impacts on product quality, as well as the commonly described negative effects of soil and groundwater quality [15].
Cichorium spinosum L., known as spiny chicory and stamnagathi, is a wild edible species thriving in the coastal and mountainous habitats of the Mediterranean basin. Its exceptional taste and high abundance promoted its traditional culinary use, making it a major constituent of the Mediterranean diet, and more specifically, the famous Cretan diet [16]. The analysis of its phytochemical content confirmed the traditionally assumed health-promoting properties since it was found to be rich in antioxidant compounds, as well as vitamins (C and K1) and minerals [17]. Collectively, all the above benefits classified stamnagathi within the group of “healthy” food crops and created a market niche for its commercial cultivation. As a result, stamnagathi was recently introduced as an alternative vegetable crop. Subsequently, research efforts were developed to create a cultivating protocol, the target of which, however, was the maximization of productivity without concerns about the sustainability of its production in terms of chemical fertilizers and water use [18,19]. Nevertheless, wild plants, especially those originating from Mediterranean ecosystems, are oligotrophic and their whole performance is based on this feature. Additionally, low-input crop management is a pivotal feature in the context of sustainable agriculture.
In the present study, we cultivated stamnagathi in a highly sustainable system, i.e., aquaponics. We applied the minimal supplementation approach in cultivating this oligotrophic species and we aimed at (a) thoroughly monitoring its growth and functional performance, focusing on photosynthesis-related processes and compounds, and the antioxidant activity as a surrogate of health-promoting features, and (b) identifying the aquaponic system weak points in order to evaluate its suitability and efficiency for this species cultivation and suggest optimization measures.

2. Materials and Methods

2.1. Experimental Design, Growth Conditions and Aquaponic Systems

The experiment was performed at the Aquaculture Laboratory, Section Aquaponics, School of Agricultural Sciences, University of Thessaly, Greece. Nine indoor laboratory-scale aquaponic systems were used for the co-cultivation of stamnagathi and red tilapia (Oreochromis sp.), which were assigned to three treatments (three replicates per treatment): (a) aquaponic solution with no inputs (Control), (b) aquaponic solution with iron supplementation (Fe), and (c) aquaponic solution with iron and potassium supplementation (Fe+K).
The addition of Fe and K was performed at nutrient target concentrations of 40 μmol L−1 for Fe and 7.50 mmol L−1 for K, according to the concentrations found to be effective in previous cultivations in the same aquaponic setup [9,12]. The selected chemical forms for nutrient supplementation were Fe-DTPA (GEOLIX EPE, Chelated Iron DTPA 11%) and potassium sulphate (K2SO4, HONEYWELL FLUKA). The first addition of Fe and K was performed in the sump on the fifth day after transplantation to hydroponic beds. The concentration of Fe and K in the recirculating water was assessed once a week at the inlet point of each raft hydroponic unit. Water sampling was performed before the first meal of the fish. After filtration by glass fiber syringe filters (0.7 μm), the samples were measured immediately with a photometer (DR3900, Hach Lange, Düsseldorf, Germany) using pre-weighted reagents (Iron TPTZ Method 8112, Hach Lange, Düsseldorf, Germany) for Fe determination. A flame photometer (JENWAY, PFP7 Flame Photometer, Jenway, UK) was used for the measurement of potassium, and the concentrations were estimated via standard curves. The amount of fertilizers missing relative to the target concentration were calculated and added to the sump filters after their dilution in two liters of non-chlorine water.
Coupled aquaponics were used, the full description of which can be found in Tsoumalakou et al. [12]. Briefly, each aquaponic system of 135 L total water capacity consisted of three glass-made sub-units that were arranged vertically: a raft hydroponic unit (54 L and 0.18 m2 area) in the upper position, a fish rearing tank (54 L) in the middle and a sump filter (27 L) in the bottom. The latter hosted both the mechanical and the biological filter in separate compartments. The mechanical filter was made from sponges and fiberglass for solids retention and the biological one consisted of 4 L ceramic rings (siporax, 15 mm, Sera GmbH, Heinsberg, Germany), 2 L bioballs (36 mm) and 1 L cylindrical substrate K1 Kaldness media (11 mm). The filter was colonized by nitrifying bacteria (Biodigest, PRODIBIO, Marseille, France). The room temperature was constantly kept at 21.84 ± 0.10 °C and the relative humidity at 55.71 ± 0.40% (Opticlimate, models 15,000 PRO3 and PRO4, AirSupplies Nederland BV, Hoofddorp, The Netherlands).

2.2. Monitoring of the Water Physicochemical Parameters

pH was measured daily, while oxygen (O2, mg L−1) and electrical conductivity (EC, μS cm−1) were measured three times a week in the middle of the fish tanks with portable instruments (HQ40d, Hach Lange, Düsseldorf, Germany for pH and O2 and CRISON CM35, Crison Instruments, s.a., Balcelona, Spain for the EC).
Once a week, the water nutrient concentrations were determined photometrically (DR3900, Hach Lange, Düsseldorf, Germany) using the same filtered water as described above (Section 2.1). The nutrients were measured with pre-weighted powder reagents according to their protocols (Hach Lange, Düsseldorf, Germany): ammonia (NH3, salicylate method, 8155), nitrite (NO2, USEPA diazotization method, 8507), nitrate (NO3, cadmium reduction method, 8039), phosphate (PO43−, USEPA PhosVer 3, ascorbic acid method, 8048), and sulfate (SO42−, USEPA, SulfaVer 4 method, 8051). For the determination of calcium (Ca2+) and sodium (Na), a flame photometer (JENWAY, PFP7 Flame Photometer, Jenway, UK) was used, and the concentrations were calculated via the corresponding standard curves.

2.3. Tilapia Rearing Conditions and Growth Performance

The red tilapias (Oreochromis spp.) were reared for six months before the commencement of the experiment on the premises of the Aquaponics laboratory. All experimental procedures were conducted according to the guidelines of the EU Directive 2010/63/EU regarding the protection of animals used for scientific purposes and were applied by FELASA accredited scientists (functions A–D). Ninety tilapias were acclimatized for 15 days in the aquaponic tanks before the commencement of the experiment. The juveniles were equally distributed based on their weight in the nine aquaponic systems. The exact number of fish for each system was estimated using the equation for the carrying capacity of an aquarium proposed by Hirayama [20]. The equation estimates the carrying capacity derived from the rates of pollution and possible purification in a closed culture system or aquarium. For the calculations, the oxidizing capacity of the filter and the pollution load were measured. Ten red tilapias with initial body weight of 5.70 ± 0.16 g and length of 7.00 ± 0.07 cm (fish stocking density 4.6 kg m−3) were placed in each aquaponic system. During the experiment, the fish were fed ad libitum six days a week and two times a day (10:00 and 16:00) up to satiation. We observed the fish’s behavior while feeding to ensure there was no unconsumed feed left and no feed waste. The above-mentioned feeding schedule with one day without feeding was applied since the adoption of short dietary restrictions and temporally fasting (i.e., compensatory growth) was shown to generate growth acceleration upon return to feeding while maintaining fish welfare [21]. A commercial fish feed that contained 47.5% crude protein, 6.5% crude fat, 2.0% crude fiber and 6.0% moisture (Tetra Discus Granules, 2 mm, Tetra, Spectrum Brands Inc., Blacksburg, UK) was used. The daily feed consumption was measured by weighing the amount of fish feed before and after daily meals (g day−1). Fish feces removal from the tanks by siphoning and cleaning the mechanical filter with tap water were performed daily. At the end of the experiment, the fish were anesthetized with tricaine methansulfonate (MS 222, 5 mg L−1) to record their weight and length and to estimate the following growth parameters:
  • Survival rate, S (%) = (Final number of fish/Initial number of fish) × 100
  • Weight gain, WG (g) = Final weight − Initial weight
  • Specific growth rate, SGR (% day−1) = ((ln Final weight − ln Initial weight)/∆t) × 100
  • Feed conversion ratio, FCR = Food offered (g)/weight gain (g)

2.4. Stamnagathi Cultivation

Young plants of stamnagathi were bought from a local nursery. In total, 45 plants with an initial weight of 5.62 ± 0.47 g and rosette diameter of 15.68 ± 0.54 cm were randomly distributed in nine aquaponic systems (15 plants/treatment) at a density of 28 plants m−2 and were cultivated for 35 days until they reached the marketable size. Each hydroponic unit (raft) consisted of a floating polystyrene sheet (2.5 cm thick) in which five black round net pots (Hydrofarm, 8.3 × 6.6 × 5.6 cm, Hydrofarm Europe, Zaragoza, Spain) were placed and filled with lava grains (0.7 cm). HPS lamps (400 W, Feilo Sylvania Europe Limited, London, UK) were placed above the plants providing a mean photosynthetic photon flux density (PPFD) of 362.18 ± 4.51 μmol m−2 s−1 (PPFD meter, Skye Instruments Ltd., Llandrindod Wells, UK). The photoperiod was set to 12 light:12 dark and was controlled with a timer. Small fans were hanged close to the raft units to avoid overheating by the lamps and to maintain the optimal temperature for the plants, which was monitored once a week via a thermocouple (CONSORT, T651, Consort bvba, Turnhout, Belgium).

2.5. Plant Growth, Physiology and Biochemical Analysis

2.5.1. Growth Performance

At the final harvest, the leaf area (cm2) and the diameter of the rosette were estimated using image analysis performed on photographs of plants taken from a standard height (ImageJ, Open-source software, ImageJ.net/version. ImageJ 1.51j, USA). After that, the plants were separated into leaves and roots. The number of leaves and their fresh weight were measured immediately. The dry weight of leaves and roots was determined after drying at 80 °C for 48 h, and the root-to-shoot ratio was calculated from the biomass data.

2.5.2. Total Chlorophyll Content

The total chlorophyll content was determined weekly using a portable chlorophyll meter SPAD 502 (Konica Minolta, Tokyo, Japan) on three leaves of different growth stages per plant (15 plants/treatment). SPAD values were converted to actual chlorophylls a + b concentrations via a standard curve. For this, after recording the SPAD values, the measured leaf part was cut and extracted with acetone (80%). The samples were centrifuged (4000 rpm for 10 min) and, finally, the absorbance was recorded at four wavelengths (720, 663, 646 and 470 nm) using a dual-beam spectrophotometer (SHIMADZU UV 1900 UV-VIS Spectrophotometer, Duisburg, Germany). The concentrations of chlorophylls a and b per unit area were calculated from the equations of Lichtenthaler and Wellburn (1983) [22].

2.5.3. Photochemical Reflectance Index (PRI)

PRI is an index based on leaf reflectance measurements, specifically in two wavelengths at 531 and 570 nm and is calculated through the following equation: PRI = (R531nm − R570nm)/(R531nm + R570nm), where R is the reflectance [23]. In the current study, a portable instrument PlantPen PRI 210 (Photon Systems Instruments, Drásov, Czech Republic), which directly recorded the PRI values, was used. The measurements were performed once a week on mature leaves (15 replicates/treatment) before the lights were turned on. The data were extracted with the FluorPen Software (Photon Systems Instruments, Drásov, Czech Republic).

2.5.4. Photosynthesis and Light Response Curves

The net photosynthetic rate was monitored during the experiment with a portable photosynthesis system (LI-6400 XT, LI-COR, Lincoln, NE, USA). Mature leaves were measured (6 replicates/treatment) on the experimental days 8, 15, 25 and 35. Instantaneous gas exchange measurements were performed under the following conditions: 450 ppm CO2 (6400-01 CO2 Injector, LI-COR, Lincoln, NE, USA), 340 µmol m−2 s−1 PPFD (6400-02B LED Light Source, LI-COR, Lincoln, NE, USA) and 22 °C. On the same experimental days, photosynthetic light response curves were also performed on a mature leaf per plant (4 replicates/treatment). A standard protocol for the transition from high to zero light intensity was followed including 10steps, notably 1000, 800, 600, 400, 200, 100, 80, 50, 20 and 0 μmol m−2 s−1, with a duration of 3 min each. The data were analyzed by a modified non-rectangular hyperbola proposed by Markos and Kyparissis [24], through which the maximum photosynthetic rate (Amax), quantum yield of photosynthesis (a, mole CO2 per mole PAR incident on the surface of the leaf) and dark respiration (Rd) were estimated.

2.5.5. In Vivo Fluorescence of Chlorophyll a

The chlorophyll a (chl a) fluorescence was assessed weekly on one mature leaf from every plant (15 replicates/treatment) with Handy PEA+ fluorimeter (Hansatech Instruments Ltd., King’s Lynn, UK). The measurements took place before turning the lights on in the morning to assess the full dark-adapted state of PSII. The transients of chl a fluorescence were recorded after illumination of the leaves with 3000 µmol photons m−2 s−1 of a red LED array at 650 nm for two seconds. The instrument recorded the signal of fluorescence at T1—50 µsecs, T2—100 µsecs, T3—300 µsecs, T4—2 msecs and T5—30 msecs. Finally, the transients were analyzed with PeaPlus Software v.1-13 (Hansatech Instruments Ltd., King’s Lynn, UK) and various fluorescence parameters were estimated as described in detail in our previous work [9].

2.5.6. Antioxidant Activity

The antioxidant activity was estimated with the DPPH assay (2,2-diphenyl-1-picryhydrazyl), which is considered an indicator of leaf radical scavenging activity. The protocol described by Goupy et al. [25] and Hayes et al. [26] was used with a few modifications, which are described in [9]. The sampling of mature leaves (15 replicates/treatment) took place on day 15 (D15), D25 and D35, just before the final harvest, after which the collected leaves were flash-frozen in liquid nitrogen until measurement.

2.5.7. Elemental Tissue Analysis

The concentrations of nutrients in leaves of stamnagathi were determined using ICP-OES spectroscopy (SPECTRO Analytical Instruments GmbH, Kleve, Germany), following the protocol published by Avdouli et al. [27]. Three samples/treatment produced from pooling mature leaves of three plants were measured.

2.6. Statistical Analysis

Data were analyzed with one-way ANOVA, followed by Tukey’s post hoc tests. In cases where the ANOVA prerequisites were not valid, the non-parametric Kruskal–Wallis test was used, along with the post-hoc Dunn’s test. The level of significance was set at p ≤ 0.05. All statistical analyses were performed with JASP v.0.16 software (JASP Team 2021 Computer Software v.0.16).

3. Results

The physicochemical and quality parameters of the water are presented in Table 1. The pH was almost constant in each treatment throughout the experimental period, appearing a slight but statistically significant reduction in the control treatment. In contrast, the EC was almost doubled in the Fe+K treatment due to the K fertilizer input since the Fe input did not change the EC, as shown in the Fe treatment characteristics. Concerning the ions contents, the supplementation of K and Fe was well reflected in their concentration in the water with significantly increased values compared with the no-input control. The remarkably enhanced value of SO42− in the Fe+K treatment was ascribed to the sulfuric form of K fertilizer; however, the similar picture of Na cannot be explained. The various N forms showed differential profiles; while NH3 and NO2 were stable and invariable among treatments, NO3 was found to have an enhanced concentration in the control compared with the others. The latter was the result of significant increases after D21 (data not shown), which was a time point that coincided with reduced control plant performance (see below); thus, this was related to decreased plant absorption. The PO43− and SO42− concentrations were similar and almost constant during the experiment.
The red tilapia growth performance did not show any statistically significant differences among the treatments. High SGR and low FCR values (Table 2) in all treatments confirmed that the tilapia demonstrated significant growth. In addition, the fish reared in all tested conditions exhibited high survival rates.
Control plants showed significantly inferior performance in all growth parameters determined at the final harvest in comparison with the other two treatments, which responded similarly (Table 3). The differences were a 50% increased rosette diameter and root biomass and 4.3- and 3.7-fold increases in leaves fresh weight in the Fe and Fe+K groups, respectively, over the control. Analogous remarkable differences were also recorded for the leaf area and dry weight. Collectively, nutrient supplementation significantly promoted the yield of stamnagathi cultivation, which exhibited 4.5- and 4-fold enhanced values in the Fe and Fe+K treatments compared with the control. The latter invested comparatively more biomass in the roots than shoots, resulting in a higher root-to-shoot ratio.
Pigments content, PRI and net photosynthetic rates were measured throughout the experimental period (Figure 1). The total chlorophylls content was almost stable and at high levels in the Fe and Fe+K groups. However, Control plants experienced a significant decline in their chlorophyll concentrations already from D15, which deteriorated over the course of the experiment, reaching values 70% lower than the other treatments at the end. These changes in chlorophylls were reflected in the PRI, where the control plants showed statistically significant reductions from D22, reaching negative values in the subsequent measurements, in contrast with the constantly high values found in Fe and Fe+K groups. The downward trends in chlorophylls and PRI profile had negative consequences for An, which appeared with a slight time lag. A non-significant decrease in An of Control was evident on D15, which became significant in statistical terms in the following measurements until the end of the experiment.
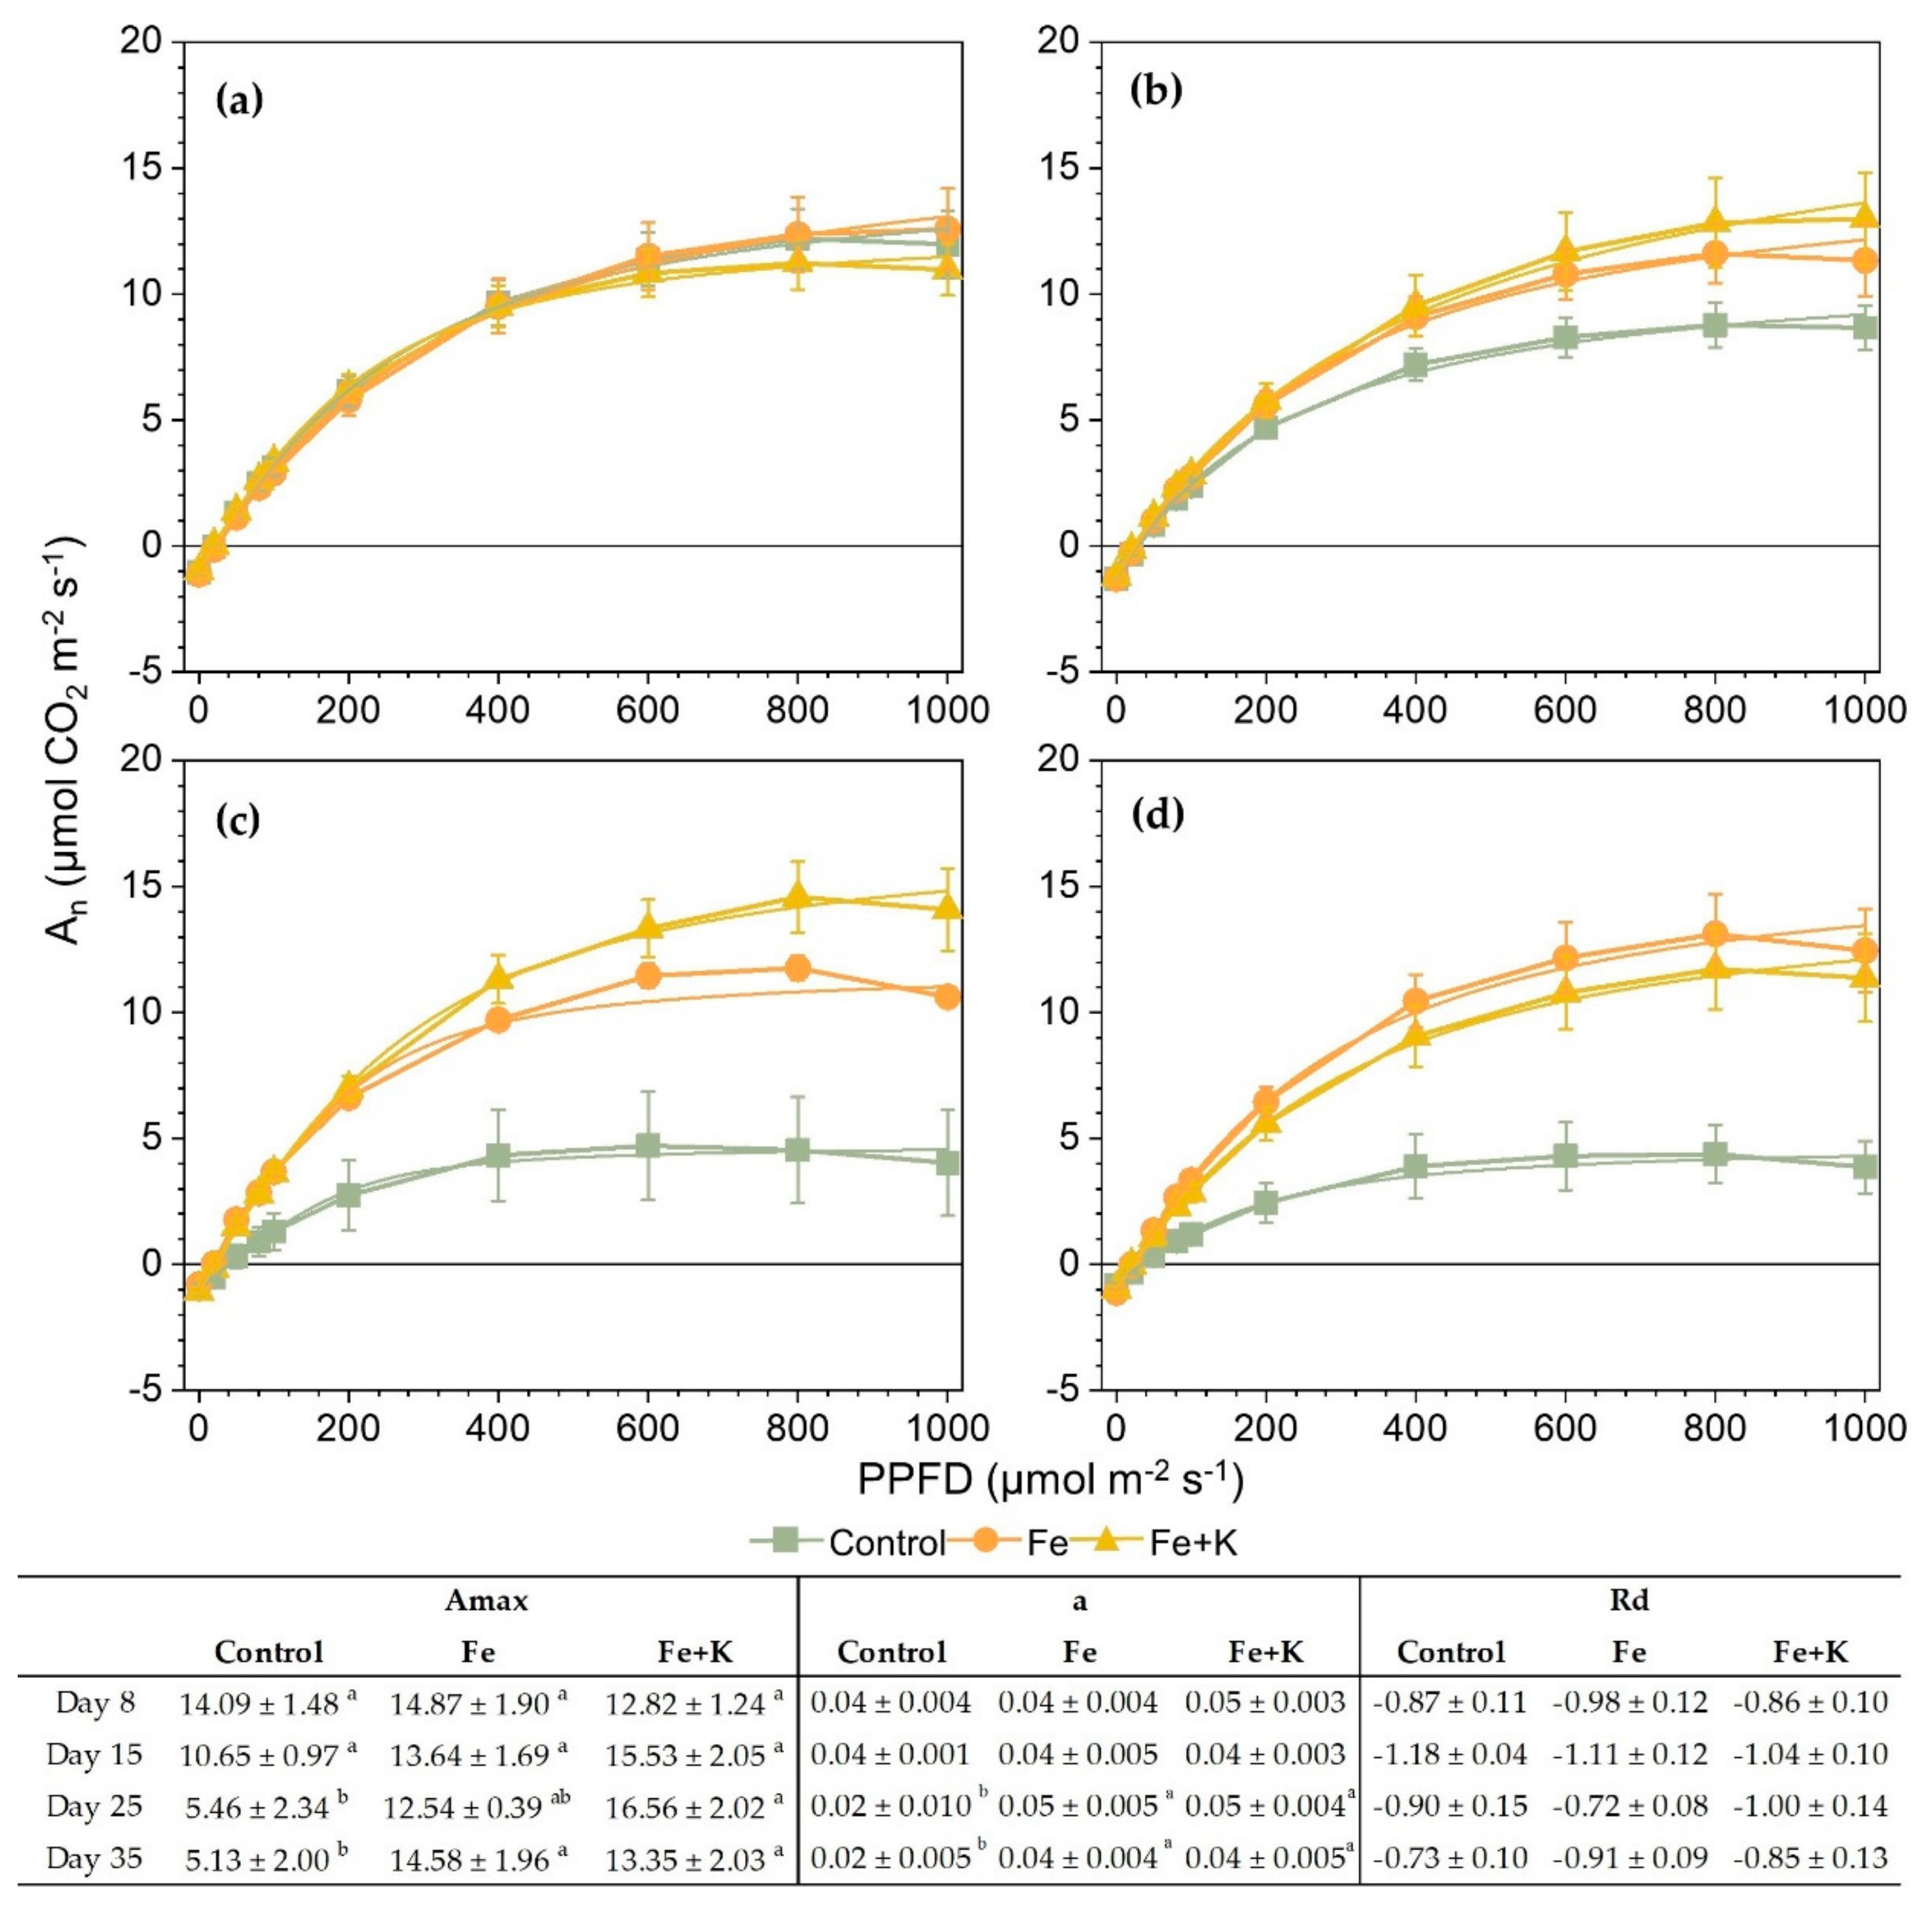
The picture of photosynthetic performance was completed by the light-response curves presented in Figure 2. The profile of instantaneous measurements (An) was confirmed by the photosynthetic response along the light gradient and Amax. The first signs of impaired photosynthesis in the control plants appeared on D15, already from the low intensity of 200 μmol m−2 s−1 until the highest one, resulting in lower Amax; still, the quantum yield of photosynthesis (a) was not impacted. The latter happened from D25 onward, where a dropped by half, reduced photosynthesis was found from even lower than 100 μmol m−2 s−1 PPFD, and Amax of the control plants reached a 64% decrease compared with the Fe and Fe + K groups in the final measurement (D35). No significant differences were recorded in Rd throughout the experiment.
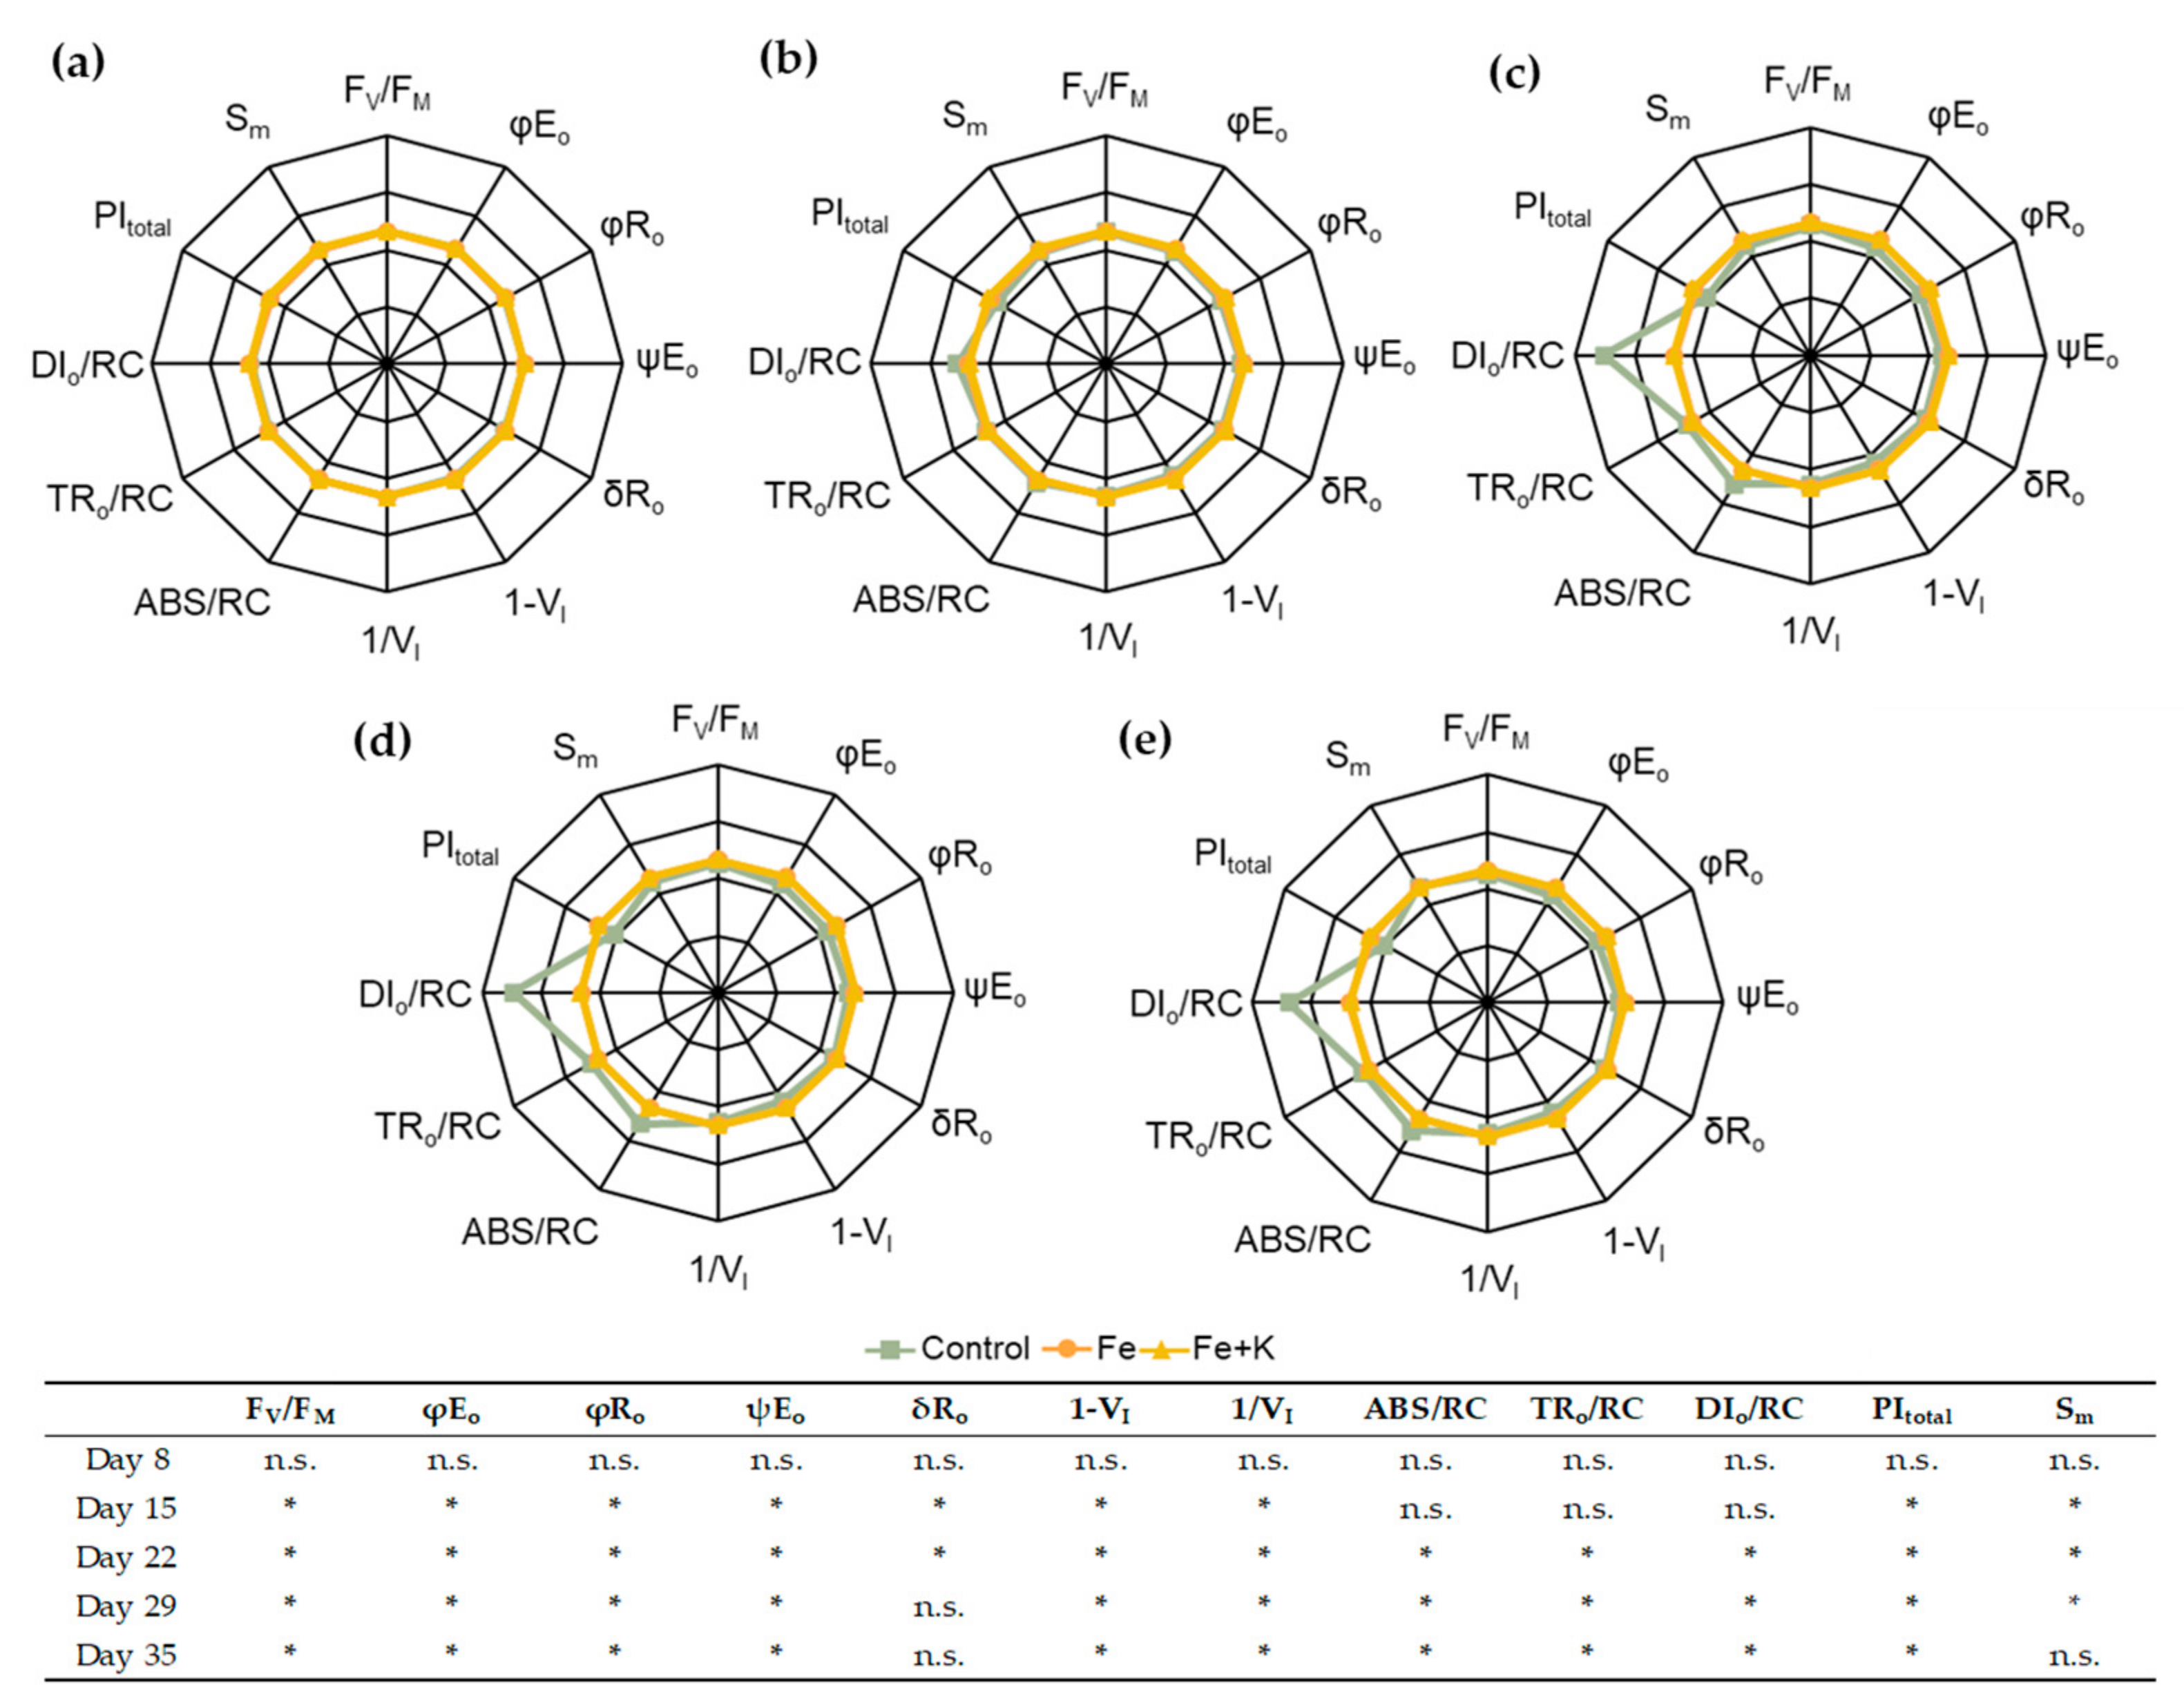
The course of chlorophyll fluorescence parameters provided early detection of the stress in the control plants already from D15 (Figure 3). At this time point, a significant decline in all the components of photosynthetic efficiency was recorded, denoting an impacted photosynthetic apparatus; quantum yields and efficiency of electron transport to intermediate and final acceptors (φΕο, φRo, ψEo and δRo respectively), as well as PSI-related yields (1-VI, 1/VI) and the relative pool size of electron carriers, showed a pronounced downtrend. Consequently, both determined performance indices, i.e., PIabs (indicating the conservation of energy absorbed by the antenna of PSII) and PItotal (indicating total photosynthetic efficiency), were significantly reduced. However, on D15, the energy fluxes per reaction center were sustained at the same level as the Fe and Fe+K groups. This changed in the next measurement, where considerable increases in dissipated (DIo), trapped (TRo) and absorbed (ABS) energy per RC were recorded. A similar picture also appeared in the final measurement. The absence of any differentiation between the Fe and Fe+K treatments throughout the experiment is noteworthy.
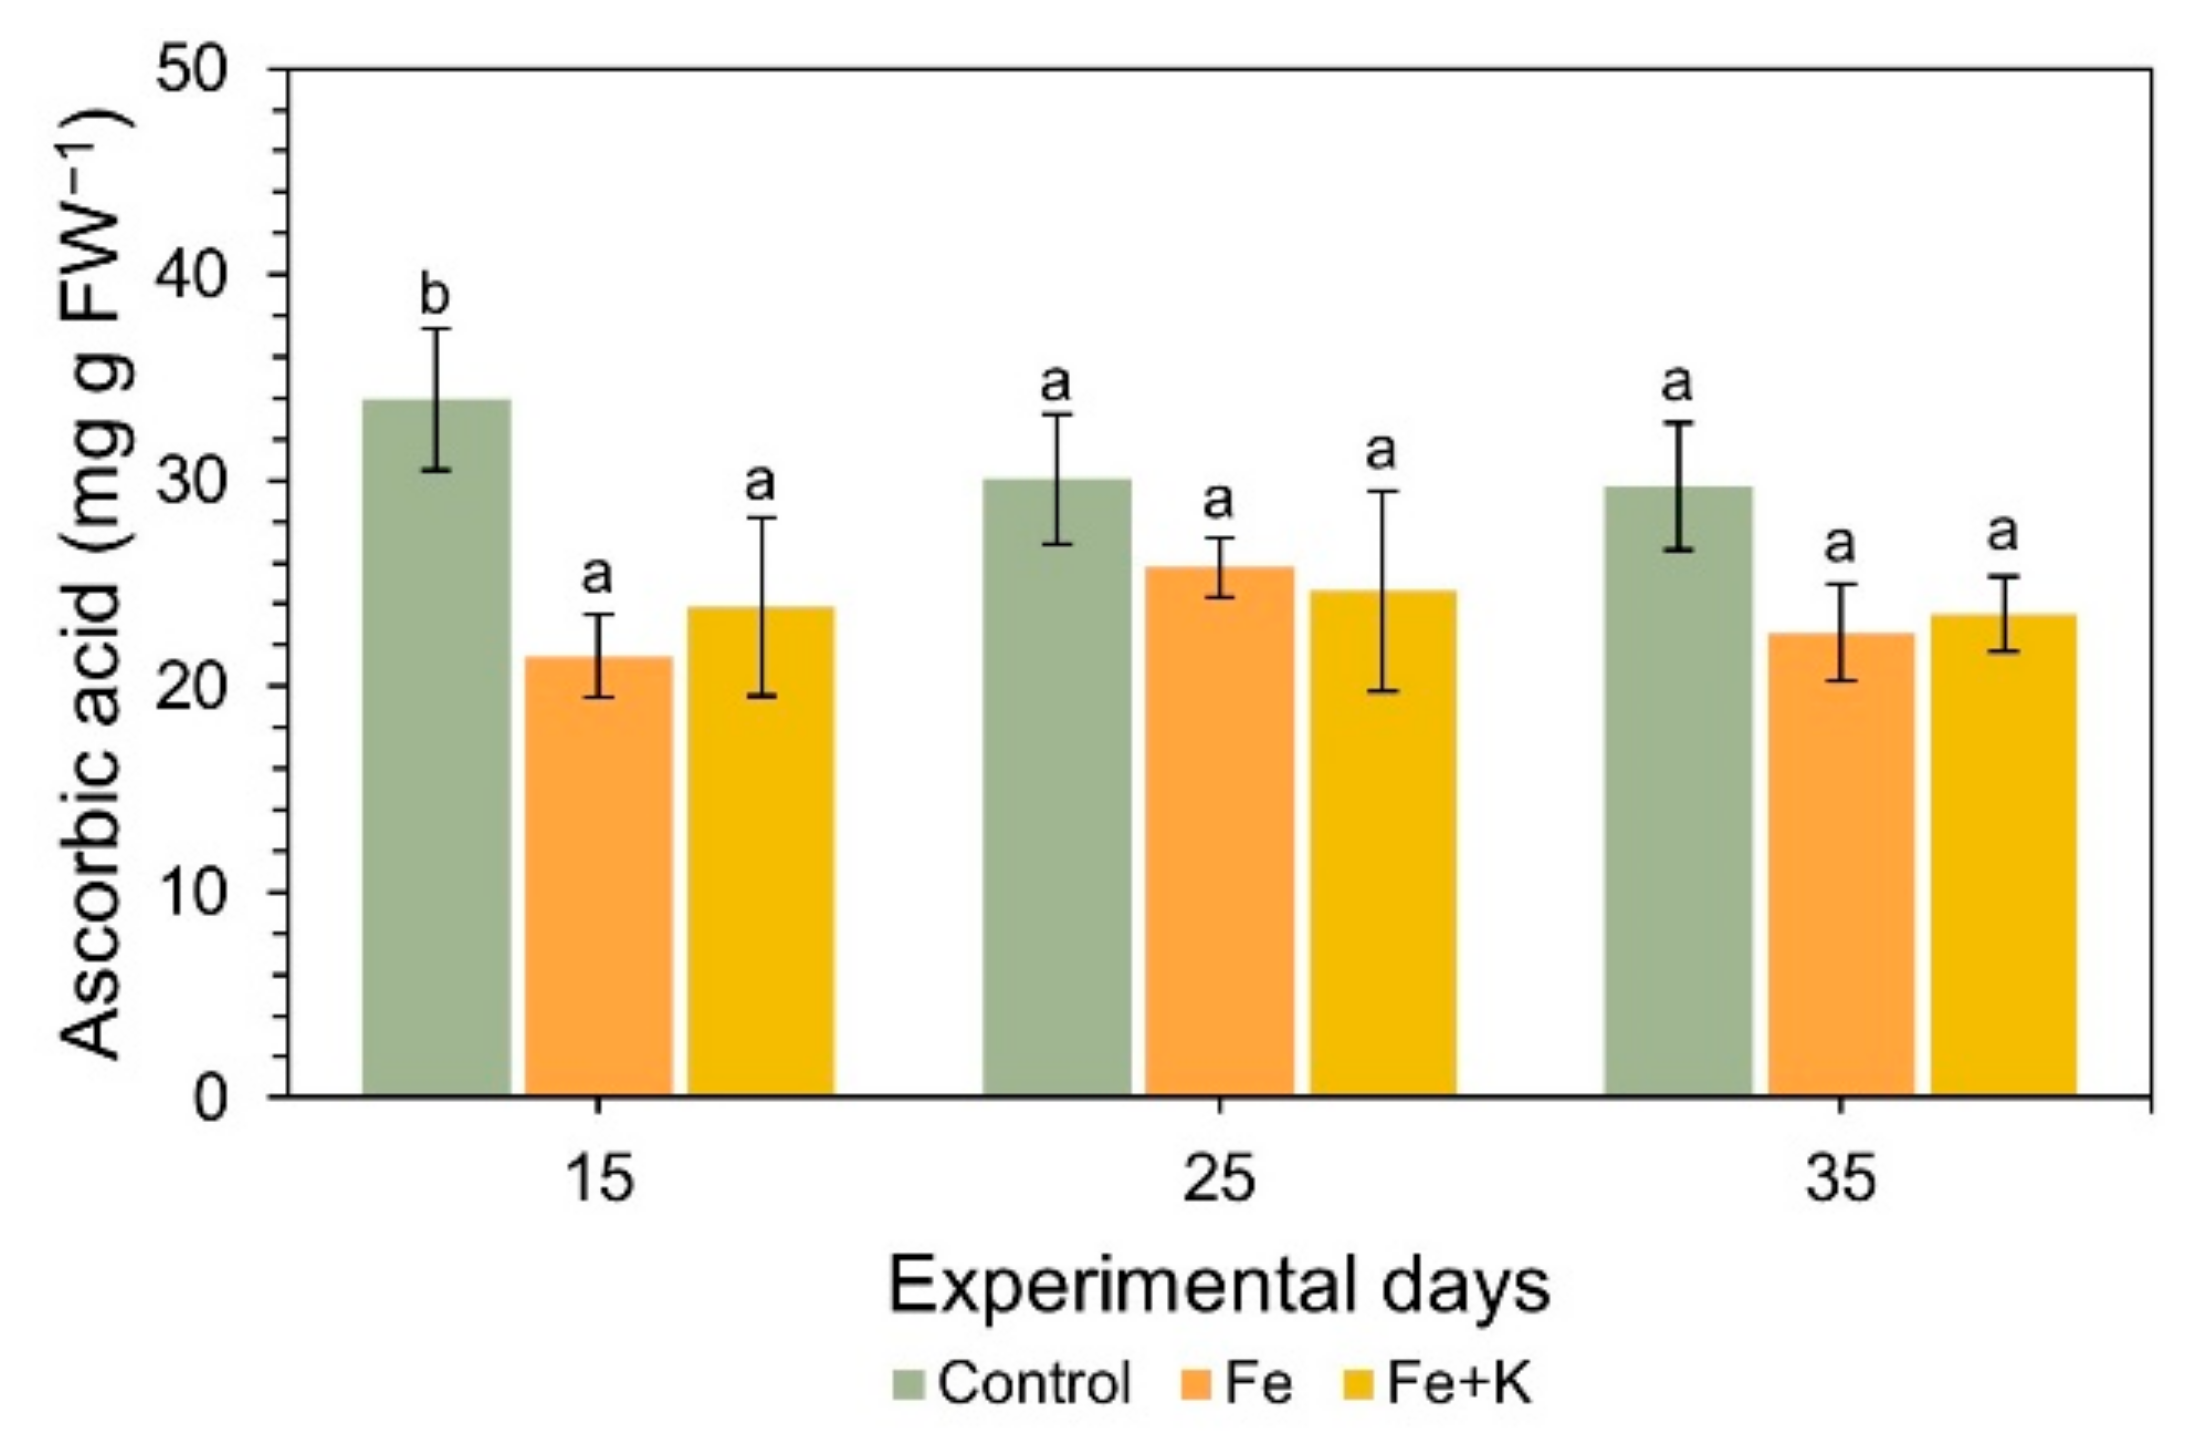
The profile of leaf antioxidant activity under the various treatments is presented in Figure 4. The control plants significantly outperformed the other two groups only in the first assessment on D15. On D25 and D35, the values of the control were slightly reduced, making the among-treatments differences insignificant.
Leaf nutrient content was analyzed at the final harvest (Table 4). The concentrations of Fe and K in leaf tissues well reflected the corresponding nutrients supplementation in the RAS water, outweighing Control. The latter also displayed a significantly lower N content compared with the Fe+K group. In contrast, the contrary, Control plants accumulated more Ca, Mg and Zn in their leaves than the Fe and Fe+K-treated plants. Finally, no differences were recorded in the P, Mn and Cu concentrations.

4. Discussion

The results of the present study demonstrate that aquaponics is an advantageous cropping system for stamnagathi if Fe is supplemented. The yields in the Fe and Fe+K treatments were considerably higher than the ones reported for stamnagathi experimental cultivation in soil [18] and hydroponics [19], although the concentrations of nutrients in the aquaponics recirculating water were far lower. The yield of Control plants, however, was considerably lower than the values reported in these studies. Interestingly, the higher yields in the Fe and Fe+K- supplemented aquaponics were achieved in a shorter cultivation period, i.e., a quarter of the time required for soil cultivation and half the time for hydroponics. This outcome may have resulted from processes not encountered in this study, such as an Fe-triggered microbial contribution on plant growth acceleration since the microbiota of fish water were identified to promote yield in aquaponics [28]. Nevertheless, as mentioned before, the outperformance of aquaponics over hydroponics and soil definitely cannot be ascribed to high nutrients in the recirculating water. Indicative of the nutrient levels differences among the cultivation settings was the total nitrogen concentration; it never exceeded 22.14 mg L−1 in aquaponic treatments, a value that is one order of magnitude lower than the 300 mg L−1 used by Petropoulos et al. [18] in their pot experiment. The latter heavy fertilization scheme resulted in a yield of 30–44 g per plant after 118 days of cultivation, while the Fe and Fe+K groups of the present study succeeded 59.4 and 50.6 g per plant, respectively, after 35 days. The superiority in yield was more pronounced if we compare the abovementioned findings with 28 g per plant, which was the maximum value reported by Chatzigianni et al. [19] in hydroponics after 60 days, irrespective of the treatment. They tested two levels of total nitrogen, i.e., 56 and 224 mg L−1, both being remarkably higher than ours, notably 2.5- and 10-fold higher, respectively. Interestingly, they did not find any significant difference in the growth response of stamnagathi.
Concerning the water quality of the present work, similar pH and O2 concentrations were evident in all three treatments, while the addition of K in the form of K2SO4 resulted in a significant increase in the EC of the corresponding group, reaching 1320 μS cm−1. Nevertheless, this EC level is not considered a stress factor for stamnagathi, which is a salt-tolerant species. Petropoulos et al. [29] tested various EC levels ranging from 1800 to 8000 μS cm−1 and reported that stamnagathi thrives under high EC, exhibiting its better growth performance under 6000 μS cm−1.
According to the results of the current study, the Fe input was critical for the maximization of stamnagathi growth and function. The Fe-treated plant group exhibited similar growth performance compared with the Fe+K group, indicating that the addition of K did not beneficially impact the growth parameters determined. The Fe concentration in the nutrient solution (1.22 mg L−1) slightly exceeded the one reported by Chatzigianni et al. [19], which reached 0.84 mg L−1. Collectively, all the above findings and the output of the comparison between aquaponics and other cultivation settings suggest that stamnagathi may thrive under high levels of Fe, but low levels of total N and K. This minimal supplementation approach, although effective and eco-friendly, is in direct opposition to the common agricultural practice of intensive fertilization regimes. Nevertheless, several wild-growing species exhibited optimal growth under low-input systems or showed a limited response to conventional fertilization, as in the case of rock samphire [30], marjoram (Origanum microphyllum) [14] and Verbascum arcturus [31], with the last two being local endemics of Crete, Greece. To enable sustainable exploitation strategies, a wild plant should be treated according to its oligotrophic nature, at least until breeding programs succeed in the delivery of germplasm that is capable of maximized productivity and the consequent increase in fertilization requirements.
Aquaponic system bottlenecks were reflected in the poor performance of Control plants grown without Fe and K supplementation. All growth parameters assessed in the final harvest confirmed the significant inferiority of Control plants, with the most pronounced being the 4.5- and 4-fold decreased fresh biomass yield compared with the Fe and Fe + K treatments, respectively. Certain nutrient deficiencies have probably impacted the growth of Control group, as the leaf elemental analysis implied. Considerably reduced N, Fe and K contents characterized the nutritional state of this plant group, along with increases in the leaf Ca and Mg, where the latter was possibly due to decreased N uptake and transport given the competition between these three elements [32]. Hereinafter, we discuss the control plant growth and functional responses in relation only to N and Fe deficiencies since similarly low K levels were also found in the Fe group without inducing any negative effects. Previous studies in a similar experimental setup revealed an analogous connection between N and Fe deficiencies and limited growth for spinach [12], yet lettuce faced only Fe and K deficiencies, while leaf N was comparable and sufficient in the no-input Control [9]. In both studies, Control plants suffered a severe reduction in yield, ranging from two-fold for lettuce to five-fold in spinach compared with the Fe and Fe+K treatments.
The nutritional state of Control plants was reflected in their function, with certain physiological parameters indicating early signs of stress-induced impairments. A significant decline in leaf chlorophyll content was obvious already from D15 and probably accounted for the significant reduction in the PRI index, which is a measure of light use efficiency (LUE) [23]. Chlorophyll loss and decreased LUE coordinately contributed to lower photosynthetic rates in comparison with Fe- and Fe+K-treated plants, as the instantaneous gas exchange measurements showed. The profile of light response curves of Control group revealed a lower photosynthetic capacity, along with reduced quantum yields of photosynthesis. Towards this direction were also the findings of the course of chlorophyll a fluorescence parameters, which were sensitive enough to reflect the rapidly declining vitality of the photosynthetic apparatus, with the first signs being obvious on D15. This first indication coincided with and was related to the initiation of chlorophyll loss, confirming the advantage of chlorophyll fluorescence measurement to explicitly capture the changes in a plant’s in vivo physiological status. The strong correlation between physiological state and fluorescence intensity is based on the dependency of the latter on the efficiency of other energy relaxation processes, such as photochemistry and heat dissipation [33,34]. Additionally, fluorescence parameters are useful in dissecting the performance of the photosynthetic machinery in certain steps and events, thereby giving valuable information on the PSII efficiency and an indication of the PSI functionality. In Control plants, significant declines in all determined fluorescence components denoted an impaired photosynthetic apparatus. The efficiency of electron transport throughout the acceptors chain, as well as the respective quantum yields, were significantly reduced. According to Kalaji et al. [35], nutrient deficiency induces decreases in both the efficiency of energy capture by open PSII reaction centers and the subsequent quantum yield of electron transport through the PSII. PSI-related parameters, such as 1/VI, which reflects the relative yield of final acceptors, and 1-VI, which was linked to the content of PSI reaction centers, also showed a pronounced decline in Control stamnagathi. The abovementioned findings demonstrate that there were increasing limitations in electron flow along PSII and PSI, which is a result that may also be related to the reduced relative pool size of electron carriers (Sm). The previous works of our group with lettuce and spinach in the same experimental setup showed that the nutrient deficiency in the control plants exert species-specific effects on PSI activity; it remained unaffected in lettuce but severely impacted in spinach, yet both species suffered a downregulation of PSII, likewise with stamnagathi. Several earlier studies demonstrated the suboptimal development of the photosynthetic apparatus under nutrient shortage and the resulting reductions of PSII photochemistry [35,36,37]. Recently, Samborska-Skutnik et al. [38] demonstrated that Fe deficiency negatively impacted PSII functioning by disrupting light absorption, as well as decreasing the activity of QA, which is the primary quinone acceptor. In the control plants of the present work, the conservation of energy absorbed by the antenna of PSII, as indicated by the PIabs index, as well as the total photosynthetic efficiency (PItotal index), were significantly reduced. In contrast, Fe and Fe+K supplementation favored the photochemical performance, leaf chlorophyll content and LUE of the corresponding plant groups, maintaining them at high and stable levels throughout the experimental period. The same held for gas exchange measurements and photosynthetic light response, none of which exhibited statistically significant differences between the two supplementation treatments.
The abovementioned negative impacts on chlorophyll content, LUE, photochemical efficiency and photosynthetic capacity of the Control plants could be collectively interpreted as a direct impairment of the photosynthetic machinery or downregulation of photosynthesis, both of which were caused by nutrient deficiency. Concerning the latter, the poor performance of the control plants should probably be attributed to Fe deficiency rather than N shortage. Indeed, leaf N levels in Control plants were only 18% reduced relative to the Fe group, which is a difference that is considered rather marginal in exerting considerable effects on physiological performance. On the other hand, it is well known that the chloroplast is the major sink for Fe; hence, Fe deficiency has implications for all aspects of photosynthetic function [39]. Downregulation of photosynthesis represents the opposite aspect of impairment. It refers to changes that plants typically employ in their photosynthetic apparatus to tune their functioning with the prevailing stress conditions and achieve the highest possible performance permitted in the particular environment [40]. The lower photosynthetic efficiency of the control group could be viewed in the context of a coordinated decline in light absorption, LUE and photochemistry in order to optimize the use of the remaining pigment concentrations, electron carriers and RC activity in response to Fe deficiency. In parallel, the reduced sink strength in Control plants due to the stunted growth under Fe deficiency may have established a negative feedback mechanism resulting in the downregulation of photosynthesis.
Tilapia growth and survival were not impacted by the Fe and K supplementation, corroborating the findings of previous studies of our team with lettuce and spinach in the same experimental setup [9,12]. Stathopoulou et al. [41] working in an aquaponics co-cultivation of tilapia and rocket confirmed that Fe and K input at the same rates as the present study neither impacted fish growth nor caused remarkable histological alterations in fish gills, liver and mid-gut.
Finally, the antioxidant activity of stamnagathi was found to be significantly enhanced in the control plants compared with the Fe and Fe+K groups during the first days of the experiment; however, the differences were evened out afterward. Similar levels of antioxidants between Control and nutrient-supplemented groups were reported for spinach, even though the deleterious impacts of nutrient deficiency on growth and function were already visible after the first 10 days [12]. Jin et al. [42] documented that mild Fe deficiency does not trigger the antioxidant response in spinach, although many studies connected nutrient stress to the accumulation of reactive oxygen species and the employment of antioxidant mechanisms [43]. Stamnagathi responds with a considerable increase in antioxidants to high soil salinity, for example, in electrical conductivities in the root zone between 6 and 8 dS m−1 [29], whereas it remains unaffected by differences in N supply [19].
Given the excellent performance of stamnagathi in aquaponics with minimal supplementation and its well-documented tolerance in saline conditions [29], future studies could be targeted to the application of salinity stress in brackish aquaponics. It would be interesting to study whether a precise management of nutrient solution in terms of mild-to-moderate stress application could trigger the biosynthesis of secondary metabolites, which are also considered health-promoting compounds, without compromising stamnagathi growth and the marketable yield.

5. Conclusions

The present study aimed at evaluating the feasibility of aquaponics for stamnagathi cultivation, identifying the system’s bottlenecks and proposing optimization measures. All of the above were based on a thorough investigation of the plant’s functional and growth responses to a minimal supplementation approach that focused on external Fe and Fe+K input. Aquaponics proved to be an advantageous cropping system for stamnagathi, resulting in considerably higher yields that were achieved in a shorter cultivation period in Fe and Fe+K treatments compared with its cultivation in hydroponics and soil. This finding confirmed the oligotrophic habit of the species since the concentrations of nutrients in aquaponics recirculating water were far lower than in the other cropping systems. Control plants showed an inferior performance compared with the Fe and Fe+K groups in terms of growth, photochemistry, pigment content, LUE, and, subsequently, photosynthetic efficiency and capacity, all of which were attributed to Fe deficiency. The latter constituted the major bottleneck of the system, with the first stress indications in the photosynthetic machinery function already being obvious from D15. This study demonstrated that minimal supplementation may favor excellent performance and yield of stamnagathi in high-sustainability and low-environmental-footprint systems, such as aquaponics.

Author Contributions

Conceptualization, E.L.; investigation and formal analysis, E.T.; methodology, E.T., E.M., N.V. and E.L.; funding acquisition, N.V. and E.L.; writing—original draft preparation, E.T.; writing—review and editing, E.M., N.V. and E.L. All authors have read and agreed to the published version of the manuscript.

Funding

The research work was supported by the Hellenic Foundation for Research and Innovation (HFRI) under the HFRI PhD Fellowship grant (Fellowship Number: 528) for E. Tsoumalakou. The implementation of the doctoral thesis was co-financed by Greece and the European Union (European Social Fund-ESF) through the Operational Programme “Human Resources Development, Education and Lifelong Learning” in the context of the Act “Enhancing Human Resources Research Potential by undertaking a Doctoral Research” Sub-action 2: IKY Scholarship Programme for PhD candidates in the Greek Universities.

Institutional Review Board Statement

All experimental procedures were conducted according to the guidelines of the EU Directive 2010/63/EU regarding the protection of animals used for scientific purposes and were applied by FELASA accredited scientists (functions A–D). The experimental protocol was approved by the Ethics Committee and conducted at the registered experimental facility (EL-43BIO/exp-01) of the Laboratory of Aquaculture, Department of Ichthyology and Aquatic Environment, University of Thessaly (n. 18399/2019).

Informed Consent Statement

Not applicable.

Data Availability Statement

Not applicable.

Conflicts of Interest

The authors declare no conflict of interest.

References

  1. Aquaponics Food Production Systems: Combined Aquaculture and Hydroponic Production Technologies for the Future; Goddek, S.; Joyce, A.; Kotzen, B.; Burnell, G.M. (Eds.) Springer International Publishing: Cham, Switzerland, 2019; ISBN 978-3-030-15942-9. [Google Scholar]
  2. Junge, R.; König, B.; Villarroel, M.; Komives, T.; Jijakli, M. Strategic Points in Aquaponics. Water 2017, 9, 182. [Google Scholar] [CrossRef] [Green Version]
  3. Baganz, G.F.M.; Junge, R.; Portella, M.C.; Goddek, S.; Keesman, K.J.; Baganz, D.; Staaks, G.; Shaw, C.; Lohrberg, F.; Kloas, W. The Aquaponic Principle—It Is All about Coupling. Rev. Aquacult. 2022, 14, 252–264. [Google Scholar] [CrossRef]
  4. Maucieri, C.; Nicoletto, C.; Schmautz, Z.; Sambo, P.; Komives, T.; Borin, M.; Junge, R. Vegetable Intercropping in a Small-Scale Aquaponic System. Agronomy 2017, 7, 63. [Google Scholar] [CrossRef] [Green Version]
  5. Palm, H.W.; Knaus, U.; Appelbaum, S.; Goddek, S.; Strauch, S.M.; Vermeulen, T.; Haïssam Jijakli, M.; Kotzen, B. Towards Commercial Aquaponics: A Review of Systems, Designs, Scales and Nomenclature. Aquacult. Int. 2018, 26, 813–842. [Google Scholar] [CrossRef]
  6. Van der Esch, S.; Brink, B.; Stehfest, E.; Bakkenes, M.; Sewell, A.; Bouwman, A.; Meijer, J.; Westhoek, H.; van den Berg, M.; Jan van den Born, G.; et al. Exploring Future Changes in Land Use and Land Condition and the Impacts on Food, Water, Climate Change and Biodiversity: Scenarios for the UNCCD Global Land Outlook; PBL; Netherlands Environmental Assessment Agency: The Hague, The Netherlands, 2017. [Google Scholar]
  7. Joyce, A.; Goddek, S.; Kotzen, B.; Wuertz, S. Aquaponics: Closing the Cycle on Limited Water, Land and Nutrient Resources. In Aquaponics Food Production Systems: Combined Aquaculture and Hydroponic Production Technologies for the Future; Goddek, S., Joyce, A., Kotzen, B., Burnell, G.M., Eds.; Springer International Publishing: Cham, Switzerland, 2019; pp. 19–34. ISBN 978-3-030-15943-6. [Google Scholar]
  8. Roosta, H.R.; Hamidpour, M. Effects of Foliar Application of Some Macro- and Micro-Nutrients on Tomato Plants in Aquaponic and Hydroponic Systems. Sci. Hortic. 2011, 129, 396–402. [Google Scholar] [CrossRef]
  9. Tsoumalakou, E.; Mente, E.; Kormas, K.A.; Katsoulas, N.; Vlahos, N.; Kapsis, P.; Levizou, E. Precise Monitoring of Lettuce Functional Responses to Minimal Nutrient Supplementation Identifies Aquaponic System’s Nutrient Limitations and Their Time-Course. Agriculture 2022, 12, 1278. [Google Scholar] [CrossRef]
  10. Bittsánszky, A.; Uzinger, N.; Gyulai, G.; Mathis, A.; Junge, R.; Villarroel, M.; Kotzen, B.; Kőmíves, T. Nutrient Supply of Plants in Aquaponic Systems. Ecocycles 2016, 2, 17–20. [Google Scholar] [CrossRef] [Green Version]
  11. Ru, D.; Liu, J.; Hu, Z.; Zou, Y.; Jiang, L.; Cheng, X.; Lv, Z. Improvement of Aquaponic Performance through Micro- and Macro-Nutrient Addition. Environ. Sci. Pollut. Res. 2017, 24, 16328–16335. [Google Scholar] [CrossRef]
  12. Tsoumalakou, E.; Mente, E.; Vlahos, N.; Levizou, E. Spinach Responds to Minimal Nutrient Supplementation in Aquaponics by Up-Regulating Light Use Efficiency, Photochemistry, and Carboxylation. Horticulturae 2023, 9, 291. [Google Scholar] [CrossRef]
  13. Krigas, N.; Tsoktouridis, G.; Anestis, I.; Khabbach, A.; Libiad, M.; Megdiche-Ksouri, W.; Ghrabi-Gammar, Z.; Lamchouri, F.; Tsiripidis, I.; Tsiafouli, M.A.; et al. Exploring the Potential of Neglected Local Endemic Plants of Three Mediterranean Regions in the Ornamental Sector: Value Chain Feasibility and Readiness Timescale for Their Sustainable Exploitation. Sustainability 2021, 13, 2539. [Google Scholar] [CrossRef]
  14. Fanourakis, D.; Paschalidis, K.; Tsaniklidis, G.; Tzanakakis, V.A.; Bilias, F.; Samara, E.; Liapaki, E.; Jouini, M.; Ipsilantis, I.; Maloupa, E.; et al. Pilot Cultivation of the Local Endemic Cretan Marjoram Origanum microphyllum (Benth.) Vogel (Lamiaceae): Effect of Fertilizers on Growth and Herbal Quality Features. Agronomy 2021, 12, 94. [Google Scholar] [CrossRef]
  15. Kopittke, P.M.; Menzies, N.W.; Wang, P.; McKenna, B.A.; Lombi, E. Soil and the Intensification of Agriculture for Global Food Security. Environ. Int. 2019, 132, 105078. [Google Scholar] [CrossRef]
  16. Psaroudaki, A.; Dimitropoulakis, P.; Constantinidis, T.; Katsiotis, A.; Skaracis, G.N. Ten Indigenous Edible Plants: Contemporary Use in Eastern Crete, Greece. CAFÉ 2012, 34, 172–177. [Google Scholar] [CrossRef]
  17. Petropoulos, S.A.; Fernandes, Â.; Ntatsi, G.; Levizou, E.; Barros, L.; Ferreira, I.C.F.R. Nutritional Profile and Chemical Composition of Cichorium Spinosum Ecotypes. LWT 2016, 73, 95–101. [Google Scholar] [CrossRef]
  18. Petropoulos, S.; Fernandes, Â.; Karkanis, A.; Antoniadis, V.; Barros, L.; Ferreira, I.C.F.R. Nutrient Solution Composition and Growing Season Affect Yield and Chemical Composition of Cichorium Spinosum Plants. Sci. Hortic. 2018, 231, 97–107. [Google Scholar] [CrossRef] [Green Version]
  19. Chatzigianni, M.; Ntatsi, G.; Theodorou, M.; Stamatakis, A.; Livieratos, I.; Rouphael, Y.; Savvas, D. Functional Quality, Mineral Composition and Biomass Production in Hydroponic Spiny Chicory (Cichorium spinosum L.) Are Modulated Interactively by Ecotype, Salinity and Nitrogen Supply. Front. Plant Sci. 2019, 10, 1040. [Google Scholar] [CrossRef] [PubMed] [Green Version]
  20. Hirayama, K. Water Control by Filtration in Closed Culture Systems. Aquaculture 1974, 4, 369–385. [Google Scholar] [CrossRef]
  21. Da Silva, M.A.; de Alvarenga, É.R.; da Costa, F.F.B.; Turra, E.M.; de Oliveira Alves, G.F.; Manduca, L.G.; de Sales, S.C.M.; Leite, N.R.; Bezerra, V.M.; da Silva Moraes, S.G.; et al. Feeding Management Strategies to Optimize the Use of Suspended Feed for Nile Tilapia (Oreochromis niloticus) Cultivated in Bioflocs. Aquac. Res. 2020, 51, 605–615. [Google Scholar] [CrossRef]
  22. Lichtenthaler, H.K.; Wellburn, A.R. Determinations of Total Carotenoids and Chlorophylls a and b of Leaf Extracts in Different Solvents. Biochem. Soc. Trans. 1983, 11, 591–592. [Google Scholar] [CrossRef] [Green Version]
  23. Vanikiotis, T.; Stagakis, S.; Kyparissis, A. MODIS PRI Performance to Track Light Use Efficiency of a Mediterranean Coniferous Forest: Determinants, Restrictions and the Role of LUE Range. Agric. For. Meteorol. 2021, 307, 108518. [Google Scholar] [CrossRef]
  24. Markos, N.; Kyparissis, A. Ecophysiological Modelling of Leaf Level Photosynthetic Performance for Three Mediterranean Species with Different Growth Forms. Functional. Plant Biol. 2011, 38, 314. [Google Scholar] [CrossRef]
  25. Goupy, P.; Hugues, M.; Boivin, P.; Amiot, M.J. Antioxidant Composition and Activity of Barley (Hordeum Vulgare) and Malt Extracts and of Isolated Phenolic Compounds. J. Sci. Food Agric. 1999, 79, 1625–1634. [Google Scholar] [CrossRef]
  26. Hayes, J.E.; Allen, P.; Brunton, N.; O’Grady, M.N.; Kerry, J.P. Phenolic Composition and in Vitro Antioxidant Capacity of Four Commercial Phytochemical Products: Olive Leaf Extract (Olea europaea L.), Lutein, Sesamol and Ellagic Acid. Food Chem. 2011, 126, 948–955. [Google Scholar] [CrossRef]
  27. Avdouli, D.; Max, J.F.J.; Katsoulas, N.; Levizou, E. Basil as Secondary Crop in Cascade Hydroponics: Exploring Salinity Tolerance Limits in Terms of Growth, Amino Acid Profile, and Nutrient Composition. Horticulturae 2021, 7, 203. [Google Scholar] [CrossRef]
  28. Kasozi, N.; Abraham, B.; Kaiser, H.; Wilhelmi, B. The Complex Microbiome in Aquaponics: Significance of the Bacterial Ecosystem. Ann. Microbiol. 2021, 71, 1. [Google Scholar] [CrossRef]
  29. Petropoulos, S.A.; Levizou, E.; Ntatsi, G.; Fernandes, Â.; Petrotos, K.; Akoumianakis, K.; Barros, L.; Ferreira, I.C.F.R. Salinity Effect on Nutritional Value, Chemical Composition and Bioactive Compounds Content of Cichorium spinosum L. Food Chem. 2017, 214, 129–136. [Google Scholar] [CrossRef] [PubMed] [Green Version]
  30. Vlahos, N.; Levizou, E.; Stathopoulou, P.; Berillis, P.; Antonopoulou, E.; Bekiari, V.; Krigas, N.; Kormas, K.; Mente, E. An Experimental Brackish Aquaponic System Using Juvenile Gilthead Sea Bream (Sparus aurata) and Rock Samphire (Crithmum maritimum). Sustainability 2019, 11, 4820. [Google Scholar] [CrossRef] [Green Version]
  31. Paschalidis, K.; Fanourakis, D.; Tsaniklidis, G.; Tzanakakis, V.A.; Bilias, F.; Samara, E.; Kalogiannakis, K.; Debouba, F.J.; Ipsilantis, I.; Tsoktouridis, G.; et al. Pilot Cultivation of the Vulnerable Cretan Endemic Verbascum arcturus L. (Scrophulariaceae): Effect of Fertilization on Growth and Quality Features. Sustainability 2021, 13, 14030. [Google Scholar] [CrossRef]
  32. Sonneveld, C.; Voogt, W. Plant Nutrition of Greenhouse Crops; Springer: Dordrecht, The Netherlands; New York, NY, USA, 2009; ISBN 978-90-481-2531-9. [Google Scholar]
  33. Murchie, E.H.; Lawson, T. Chlorophyll Fluorescence Analysis: A Guide to Good Practice and Understanding Some New Applications. J. Exp. Bot. 2013, 64, 3983–3998. [Google Scholar] [CrossRef] [Green Version]
  34. Maxwell, K.; Johnson, G.N. Chlorophyll Fluorescence—A Practical Guide. J. Exp. Bot. 2000, 51, 659–668. [Google Scholar] [CrossRef] [PubMed]
  35. Kalaji, H.M.; Bąba, W.; Gediga, K.; Goltsev, V.; Samborska, I.A.; Cetner, M.D.; Dimitrova, S.; Piszcz, U.; Bielecki, K.; Karmowska, K.; et al. Chlorophyll Fluorescence as a Tool for Nutrient Status Identification in Rapeseed Plants. Photosynth. Res. 2018, 136, 329–343. [Google Scholar] [CrossRef] [Green Version]
  36. Roosta, H.R. Comparison of the Vegetative Growth, Eco-Physiological Characteristics and Mineral Nutrient Content of Basil Plants in Different Irrigation Ratios of Hydroponic:Aquaponic Solutions. J. Plant Nutr. 2014, 37, 1782–1803. [Google Scholar] [CrossRef]
  37. Roosta, H.R.; Estaji, A.; Niknam, F. Effect of Iron, Zinc and Manganese Shortage-Induced Change on Photosynthetic Pigments, Some Osmoregulators and Chlorophyll Fluorescence Parameters in Lettuce. Photosynthetica 2018, 56, 606–615. [Google Scholar] [CrossRef]
  38. Samborska-Skutnik, I.A.; Kalaji, H.M.; Sieczko, L.; Bąba, W. Special Issue in Honour of Prof. Reto J. Strasser—Structural and Functional Response of Photosynthetic Apparatus of Radish Plants to Iron Deficiency. Photosynthetica 2020, 58, 205–213. [Google Scholar] [CrossRef] [Green Version]
  39. Kroh, G.E.; Pilon, M. Regulation of Iron Homeostasis and Use in Chloroplasts. Int. J. Mol. Sci. 2020, 21, 3395. [Google Scholar] [CrossRef]
  40. Larbi, A.; Abadía, A.; Abadía, J.; Morales, F. Down Co-Regulation of Light Absorption, Photochemistry, and Carboxylation in Fe-Deficient Plants Growing in Different Environments. Photosynth. Res. 2006, 89, 113–126. [Google Scholar] [CrossRef] [PubMed] [Green Version]
  41. Stathopoulou, P.; Tsoumalakou, E.; Levizou, E.; Vanikiotis, T.; Zaoutsos, S.; Berillis, P. Iron and Potassium Fertilization Improve Rocket Growth without Affecting Tilapia Growth and Histomorphology Characteristics in Aquaponics. Appl. Sci. 2021, 11, 5681. [Google Scholar] [CrossRef]
  42. Jin, C.-W.; Liu, Y.; Mao, Q.-Q.; Wang, Q.; Du, S.-T. Mild Fe-Deficiency Improves Biomass Production and Quality of Hydroponic-Cultivated Spinach Plants (Spinacia oleracea L.). Food Chem. 2013, 138, 2188–2194. [Google Scholar] [CrossRef]
  43. Patel, M.; Fatnani, D.; Parida, A.K. Potassium Deficiency Stress Tolerance in Peanut (Arachis hypogaea) through Ion Homeostasis, Activation of Antioxidant Defense, and Metabolic Dynamics: Alleviatory Role of Silicon Supplementation. Plant Physiol. Biochem. 2022, 182, 55–75. [Google Scholar] [CrossRef] [PubMed]
Figure 1. (a) Total chlorophyll content a + b (Mean ± SEM, n = 15); (b) PRI (Mean ± SEM, n = 15); (c) net photosynthetic rate (Mean ± SEM, n = 6). Different letters indicate significant differences among treatments on each experimental day (p ≤ 0.05).
Sustainability 15 05572 g001
Figure 2. Photosynthetic light-response curves of stamnagathi on day 8 (a), day 15 (b), day 25 (c) and day 35 (d) (Mean ± SEM, n = 4) and their respective maximum photosynthetic rates (Amax), quantum yield of photosynthesis (a) and dark respiration (Rd) in the bottom table. Means in a row followed by different letters are significantly different among treatments (p ≤ 0.05) and the absence of such letters indicates no significant differences.
Sustainability 15 05572 g002
Figure 3. Spider plots of JIP parameters derived from chl a fluorescence OJIP transient curves in stamnagathi (Mean values, n = 15) from weekly measurements: (a) day 8, (b) day 15, (c) day 22, (d) day 29 and (e) day 35. Values are normalized to the values of the Fe+K treatment. The statistical results for each parameter and day are presented in the bottom table. Since there were no significant differences between the Fe and Fe+K groups, all the signs refer to differences between the control plants and the other two groups (n.s. means non-significant differences, the asterisk indicates differences at p ≤ 0.05).
Sustainability 15 05572 g003
Figure 4. Antioxidant activity of stamnagathi as the DPPH radical scavenging activity, which was expressed as ascorbic acid equivalents (Mean ± SEM, n = 15) per g fresh weight. Different letters denote statistically significant differences among treatments (p ≤ 0.05) at each date.
Sustainability 15 05572 g004
Table 1. Water physicochemical and quality parameters during the experimental period (Mean ± SEM; n = 93 for pH; n = 48 for O2 and EC; n = 18 for NH3, ΝO2 NO3, PO43−, SO42−, Fe, K, Ca2+ and Na). Different superscripts in a row denote statistically significant differences among treatments (p ≤ 0.05).
ControlFeFe+K
pH6.99 ± 0.05 b7.16 ± 0.04 a7.18 ± 0.04 a
O2 (mg L−1)8.35 ± 0.05 a8.32 ± 0.05 a8.33 ± 0.05 a
EC (μS cm−1)694.67 ± 4.02 b669.50 ± 3.26 c1319.94 ± 39.32 a
NH3 (mg L−1)0.13 ± 0.04 a0.10 ± 0.03 a0.13 ± 0.04 a
NO2 (mg L−1)0.12 ± 0.02 a0.11 ± 0.02 a0.16 ± 0.03 a
NO3 (mg L−1)99.43 ± 6.70 a77.69 ± 4.14 b77.02 ± 3.22 b
PO43− (mg L−1)32.36 ± 1.88 a27.98 ± 2.41 a34.88 ± 2.20 a
SO42− (mg L−1)22.83 ± 0.33 b20.72 ± 0.39 c226.39 ± 25.41 a
Fe (mg L−1)0.05 ± 0.01 b1.22 ± 0.16 a1.22 ± 0.16 a
K (mg L−1)5.32 ± 0.52 b3.62 ± 0.69 b224.75 ± 25.78 a
Ca2+ (mg L−1)29.60 ± 2.46 a28.63 ± 2.33 a34.45 ± 1.83 a
Na (mg L−1)47.05 ± 1.08 b47.42 ± 0.93 b52.18 ± 0.89 a
Table 2. Growth parameters of red tilapia (Mean ± SEM, n = 30). The absence of superscripts denotes no statistically significant differences among treatments (p ≤ 0.05).
ControlFeFe+K
Initial weight (g)5.64 ± 0.28 5.77 ± 0.28 5.68 ± 0.28
Final weight (g)27.55 ± 0.9927.36 ± 1.21 27.68 ± 1.15
Initial length (cm)6.98 ± 0.12 7.02 ± 0.11 6.98 ± 0.13
Final length (cm)11.30 ± 0.13 11.26 ± 0.1611.28 ± 0.15
SGR (% day−1)4.58 ± 0.06 4.49 ± 0.05 4.54 ± 0.07
Daily feed consumption (g day−1)5.36 ± 0.26 5.26 ± 1.16 5.55 ± 1.21
FCR0.78 ± 0.02 0.81 ± 0.03 0.79 ± 0.03
Survival (%)100 93.33 96.67
Table 3. Growth parameters of stamnagathi at the final harvest (Mean ± SEM, n = 15). Different superscripts in a row denote statistically significant differences among treatments (p ≤ 0.05).
ControlFeFe+K
Leaves fresh weight (g)13.83 ± 3.30 b59.42 ± 6.56 a50.61 ± 5.77 a
Leaves dry weight (g)1.33 ± 0.23 b4.89 ± 0.50 a4.25 ± 0.40 a
Root dry weight (g)1.82 ± 0.45 b2.77 ± 0.33 a2.77 ± 1.01 a
Root-to-shoot ratio1.41 ± 0.20 a0.59 ± 0.05 b0.68 ± 0.06 b
Yield (g m−2)376.90 ± 50.01 b1683.79 ± 168.28 a1515.22 ± 202.35 a
Number of leaves32.53 ± 7.25 b94.93 ± 12.83 a89.33 ± 12.05 a
Leaf area (cm2)127.60 ± 30.96 b528.74 ± 62.20 a491.07 ± 58.81 a
Diameter of rosette (cm)20.12 ± 2.70 b31.27 ± 1.69 a32.04 ± 1.52 a
Table 4. Nutrient composition of stamnagathi leaves at the final harvest (Mean ± SEM, n = 3). The macronutrients concentration isconcentrations are expressed as % leaf dry weight and the micronutrients as ppm of leaf dry weight. Different superscripts in a row denote statistically significant differences between treatments (p ≤ 0.05).
ControlFeFe+K
%N2.62 ± 0.10 b3.09 ± 0.16 ab3.22 ± 0.08 a
P0.43 ± 0.02 a0.76 ± 0.07 a0.76 ± 0.02 a
K3.39 ± 0.07 b3.51 ± 0.12 b5.73 ± 0.22 a
Ca2.43 ± 0.20 a1.67 ± 0.04 ab1.36 ± 0.01 b
Mg0.60 ± 0.03 a0.42 ± 0.03 b0.29 ± 0.01 c
ppmFe40.11 ± 6.83 b70.34 ± 6.97 a78.78 ± 1.77 a
Zn102.53 ± 13.74 a26.43 ± 0.66 b26.34 ± 0.76 b
Mn63.46 ± 18.89 a39.85 ± 11.37 a41.38 ± 4.88 a
Cu6.73 ± 0.21 a6.16 ± 0.61 a6.04 ± 0.46 a
Disclaimer/Publisher’s Note: The statements, opinions and data contained in all publications are solely those of the individual author(s) and contributor(s) and not of MDPI and/or the editor(s). MDPI and/or the editor(s) disclaim responsibility for any injury to people or property resulting from any ideas, methods, instructions or products referred to in the content.