Article

Imbibition and Germination of Seeds with Economic and Ecological Interest: Physical and Biochemical Factors Involved

by
Marcelo F. Pompelli
*,
Alfredo Jarma-Orozco
and
Luis Alfonso Rodriguez-Páez
Center of Agronomy, University of Córdoba, Carrera 6 No. 77-305, Montería 230002, Córdoba, Colombia
*
Author to whom correspondence should be addressed.
Sustainability 2023, 15(6), 5394; https://doi.org/10.3390/su15065394
Submission received: 22 January 2023 / Revised: 9 March 2023 / Accepted: 9 March 2023 / Published: 17 March 2023
(This article belongs to the Special Issue Global Climate Change: What Are We Doing to Mitigate Its Effects)

Abstract

:
In this study, we describe the seed imbibition of 14 different species, from crop, forest, and native species potentially able to recover landscapes and form sustainable green cities. Seed imbibition is a fundamental physical and physiological process for reactivating metabolism and hydrolytic enzymes that will provide seed germination. We verified that the water imbibition is more closely governed by differences between osmotic potential (Ψw) and surrounding media than seed weight or seed hardness. In turn, seeds of Spondias tuberosa and Euterpe oleracea that have a Ψw of −75 MPa and a tegument as hard as 200 N imbibed an insignificant volume of water. Consequently, their metabolism is not significantly affected comparing the non-imbibed seeds and 120-h-imbibed seeds. Malpighia glabra or Annona squamosa also show very negative Ψw where the seed coat hardness is less evident; however, in these species, the seed imbibition increased the respiration rate by eight- to ten-fold in 120 h-imbibed-seeds than non-imbibed-seeds. The high-water absorption in M. glabra (49%) seems to be due to its highly convoluted tissue in the dry state, while in J. curcas and A. squamosa the presence of a highly porous seed coat must have favored seed imbibition and prompt metabolic reactivation.

1. Introduction

A seed is an embryonic plant enclosed in a protective outer covering [1,2]. The formation of the seed is part of the process of reproduction in all seed plants. As a necessary prerequisite for germination, dry seeds must be rehydrated [3] to promote metabolism reactivation because dry mature seeds, in most cases, exhibit very low metabolic rates [4]. Seed imbibition is a physical process, basically related to the colloidal properties of its constituents and the differences in water potential between the seed and the external environment [5].
The recovery of degraded areas is closely linked to the science of ecological restoration praising restore an ecosystem that has been degraded, damaged, or destroyed. An ecosystem is considered recovered and restored when it contains sufficient biotic and abiotic resources to continue its development without additional assistance or subsidies [6]. There has been more evidence of another landscape recovery system, where the seeds are treated and germinated in a protected environment and after a few months, the already established seedlings are planted in the area to be recovered [7]. This is a more expensive method, as it requires structure for seed treatment and germination, but it has been shown to be more efficient than other landscape regeneration methods. Therefore, knowledge of seed characteristics is very important for species to be restored or cultivated efficiently from seed. The plant propagator must know the number of plants to expect from a given amount of seeds, and appropriate methods to make every viable seed germinate as quickly as possible [8]. Recently, drones have been used to support reforestation processes in areas of difficult access and the results have been very satisfactory [9]. All these techniques has been associated with seed procedure and preparation to germinate, the area that require advanced studies [10,11].
The restoration or rehabilitation of ecosystems has attracted great attention from many scholars [12,13,14,15]. In the past, great efforts were established with the objective of restoring degraded pastures. The Project “UN Decade on Ecosystem Restoration” worldwide led by UNDP [16] is focusing attention and resources on restoration globally. Even with great efforts, deforestation remains concentrated in the tropics. However, few forest reconstitution projects are still shy and often abandoned after some noise [17]. A great example of failure in forest regeneration was shown before the eyes of the whole world, when Brazil committed to planting 13,725 seedlings of 207 native trees of the Atlantic Rainforest species, some of them threatened with extinction, such as Caesalpinia echinata Lam. and Cedrela fissilis Vell., during the Opening Ceremony of the Olympic Games in Rio de Janeiro in 2016, which would be planted in Deodoro Park, RJ, Brazil. However, three years later, the few seeds that germinated were planted in “Parque dos Atletas” in a much leaner project than the one promised in 2016. This replanting only took place in 2019, under pressure from the Olympic Committee, as it was approached by the Olympic Games in Tokyo, Japan. However, this replanting required around USD 540 million.
The restoration of forests is an urgent matter, as we know that the planet is heating up with a large amount of carbon emitted into the atmosphere. In this light, there are countries where it is still possible to save forests, and Brazil is one of them. This reforestation could reach the Atlantic Forest that borders practically the entire east coast of Brazil [18], or even the Amazon Forest, which, even with constant deforestation, is still characterized as the largest tropical forest in the world [19], with a complexity that deserves further study. Countries like Brazil could become carbon reserves and sell these carbon credits [20] to countries that are no longer able to recover their forests. In this case, the sustainability of nature is very relevant.
To evaluate seed germination viability, some rapid tests can be used highlighting the accelerated aging [21,22], and the tetrazolium test [23,24,25]. Accelerated aging is induced by exposure to high temperature and humidity to test seed vigor. Electrical conductivity test that estimates the degree of cellular membrane damage resulting from seed deterioration. This is determined by the quantity of lixiviated ions in a solution with a fixed volume of deionized water [21]. In accelerated aging and electrical conductivity tests, low-quality seed displays more asynchronous germination [21], while in the tetrazolium tests, a red to sallow color in the resulting embryos are displayed, denoting embryo death [21]. Although successfully used, the tetrazolium test presents an inconvenience of difficulty in embryo extraction, which requires accurate technique and a well-trained seed analyst. In distinct form, electrical conductivity tests [26,27] are performed by immersing the seeds in water for a determined time and measuring the electrolyte leakage in the imbibition water using a conductivity meter. Its last test is as efficient than others; however, did not require any costly equipment of the reagent. Other features would highlight electrical conductivity tests as rapid to do, cheap and the presentation of reliable results [28].
Although some of the changes in metabolism that occur during the imbibition of dried seeds have been studied, little is known about the imbibition rate and other steps that occur during the imbibition and how imbibition speed could promote seed respiration and germination. Therefore, the main goal of this study was to describe the water imbibition speed and electrical leakage during imbibition to test the seed quality and describe the role of water imbibition to promote the respiration rate in fresh and imbibed seeds and evaluate the role of electrical leakage as a good test to evaluate seed viability which ends with seed germination. Then, fourteen commercial or ecologically important species were tested to analyze the time needed to reach maximum water absorption and the electrolyte leakage during this process. From these data, the imbibition rate, water potential, and seed respiration were measured.

2. Materials and Methods

2.1. Seed Species and Processing

The choice of species was carried out following some criteria: (i) be a species of economic or ecological interest; (ii) easily acquired in the market or in Brazilian nature; (iii) represent some of the native or foreign species introduced in Brazil; (iv) lack of studies with these species with this objectives. Then, Table 1 resumes all studied species, their botanical family, common name, and the number of seeds that compose one experimental unit (Appendix AFigure A1). Supplementary Figure S2 pictured all seed species described in this study. All commercial fruits (Annona squamosa, Arachis hypogaea, Cucurbita maxima, Gossypium hirsutum, Helianthus annuus, Malpighia glabra, and Spondias tuberosa) were freshly acquired in Pernambuco Center and Logistics, located at 8°04′15″ S; 34°56′34″ W; 7 m.asl.). The Brazilian native fruit species (Allamanda blanchetii, Euterpe oleracea, Jatropha curcas, and Licania rigida) were collected in Federal University of Pernambuco (A. blanchetii, J. curcas, and L. rigida) located at 8°03′01″ S, 34°56′33″ W; 15 m.asl.) or in Rocha Negra Waterfall, Santarém, PA, Brazil (E. oleracea), located at 2°29′49″ S, 54°45′13″ W; 87 m.asl.) and invasive fruit species (Calotropis procera, Moringa oleifera, and Prosopis juliflora) were collected in Serra Talhada city, in a natural Brazilian savanna-like ecosystem (7°58′51″ S, 38°19′02″ W; 418 m.asl.) between March to September 2022. Immediately after the collection, all fruits were pulped, and seeds were manually removed from the fruits. All seeds classified as unviable (dark-colored seeds with irregular development) were discarded. The proper seeds were spread in absorbent paper and left under the sun in a ventilated place for natural drying to a moisture content of 7.5% (fresh weight basis), measured by the loss of water measured in analytical balance (Sartorius Analytical Balance mod. ENTRIS224-1S, Bradford, MA, USA; accurate to 0.1 mg) after to know they’re dry weight measured after 72 h in 75 °C. After then, all seeds were stored in air-tight plastic containers, at 4 °C as described in Moncaleano-Escandon [21]. All plant scientific names were checked by WFO [29].

2.2. Seed Imbibition

Depending on the seed size, between 2 and 30 seeds comprised one repetition (Table 1). In E. oleracea, J. curcas, L. rigida, and S. tuberosa all seeds were placed in a 200 mL Erlenmeyer flask, which contained 150 mL of deionized water, while with other plant species, the seeds were placed in a 50 mL Erlenmeyer flask, containing 30 mL of deionized water. All seeds were weighed before input into Erlenmeyer flasks at time 0 (zero). At this time the electrical conductivity (EC) of the deionized water was measured. During the first 12 h, seed weight (SW) and EC were measured every 60 min. Then, all seeds were taken from Erlenmeyer flasks supported by a 2 mm sieve. Afterwards, the seeds were gently but superficially dried on a triple-layer absorbent paper, without forcing the seeds against the paper, and quickly weighed on an analytical balance. In this interval, the imbibition water was used to measure the EC in a conductivity meter (Conductivity Meter mod. CD-4306 Impac, São Paulo, SP, Brazil) calibrated before the measurements. Afterwards, all seeds were returned to the same Erlenmeyer flasks, where they remained until the next weighing. This process was completed after 120 h. In order to standardize the imbibition, it was carried out in an incubation chamber (Germination Chamber, mod. SP-225/364, SPlabor, Araçatuba, SP, Brazil) at 25 ± 0.5 °C with a 12 h photoperiod. To avoid water loss by circulating air in the incubation chamber, all Erlenmeyer flasks were sealed with parafilm® M (MilliporeSigma, part number P7543, Merck, MA, USA).

2.3. Integument Hardness

To measure integument hardness, all seeds were fixed in a hand-held penetrometer (Fruit Hardness Tester, mod. PTR-300, Instruterm, São Paulo, SP, Brazil) using a 1 mm pressure point. The lever was gently lowered over the trapped seed so that the pressure point hit the center of the caruncle when present. The pressure at which the penetrometer is used to break the seed strophiole was measured in Newtons (N). As this is a measurement performed for each dried seed, we used 50 repetitions of each species in order to have a more reliable average value. We believe that the use of 50 repetitions and the measure in aleatory points be sufficient to compensate for the absence of caruncle in some seed specie.

2.4. Water Potential

The 7.5% water seed content and 120 h seed imbibition were used to measure the water potential (Ψw). The Ψw was quantified using a dewpoint water potential meter (WP4C; Decagon Devices, Pullman, WA, USA) [30]. The values were obtained in MPa.

2.5. Seed Respiration Rate

The 7.5% water seed content and 120 h seed imbibition were used to measure the respiration rate. The seeds were inserted wholly in a CO2 flow chamber (6400-09; LiCOR, Lincoln, NE, USA). In both water content seeds, three cycles of 102-s were performed, with a 2-s interval between the readings. During this time, the increase in CO2 concentration inside the chamber was monitored. The reference CO2 was performed by a CO2 cartridge refill (8.4 g pure CO2, Soda charger, iSi, Wien, Austria) calibrated for each measurement. The net respiration rate was expressed in μmol CO2 h−1 g−1 fresh seed, and all repetition was composed of five seeds.

2.6. Germination Parameters

The germination of 7.5% water seed content and 120 h-imbibed seeds was evaluated. For these, in both water content, seeds were transferred to 110 mm × 110 mm × 35 mm germination boxes lined with a triple layer of germitest paper moistened with 5 mL of sterile deionized water plus a Mycostatin solution (100 mg L−1) (Bristol–Myers Squibb Pharmaceutics, New York, NY, USA) to prevent fungal growth. The germination boxes were transferred to a growth chamber where the temperature was maintained at 25 ± 0.5 °C with a 12 h photoperiod. The germination was daily evaluated and the seeds were considered germinated with the emergence of the radicle by ≥2 mm through the external integument, as proposed by the International Seed Testing Association [31]. To compute the germination and mean germination time (MGT) we used the GerminaR package [32], in accordance with Equations (1) and (2).
G N P = i k 1 n i N × 100
M G T = i k = 1 n i t i i k 1 n i
where GNP, germination percentage; ni, the number of seeds germinated in the ith time; N, the total number of seeds in each experimental unit; k, the last day of germination evaluation; ti, the time from the beginning of the experiment to the ith observation; and MGT, mean germination time.

2.7. Seed Coat Ultrastructure

To analyze the seed coat in detail, scanning electron microscopy (SEM) were used. Both intact and fragmented seed coats A. squamosa, J. curcas, and M. glabra seeds were sampled and immediately fixed in Karnovsky solution [33], prepared in 0.1 M cacodylate buffer (sodium cacodylate trihydrate, Sigma Aldrich, St. Louis, MO, USA), pH 7.4 and 2.5% glutaraldehyde (part number G5882, Sigma-Aldrich Chemical Co, Darmstadt, Germany) for 60 h at 4 °C. Thereupon, the samples were dehydrated in an ethanol series (10–100%), subjected to a critical point with carbon dioxide (CPD 030, Critical Point Dryer, Bal-tec, Balzers, Liechtenstein, Germany), mounted on metallic supports (stubs) and metallized with gold, for analysis in the scanning electron microscope (Zeiss Leo 1530, ETH Zurich, Zurich, Switzerland). For more details on this methodology, please consult Pompelli et al. [34].
For this analysis, we chose the three more representative species due to the laborious and high cost of this technique. Thus, the species was chose based on hard integument with low water absorption (A. squamosa), intermediary hard integument with low water imbibition, and with strongly re-activating of the metabolic process (J. curcas) and overlapping of integument with higher water absorption and rapid reactivation of metabolic process as seed respiration (M. glabra).

2.8. Dendrograms

All analyzed features were used to make the dendrogram analysis. The main features used were integument hardness, the respiration rate, and predicted biochemical seed composition. For dendrogram construction, the integument hardness, water potential, and respiration rate were measured as described above, while the seed composition was extracted from already published papers and dendrogram was made as previously described [35,36,37,38,39]. Thus, all components were imputed in the Minitab® 18.1 (Minitab LLC Inc., State College, PA, USA), where the similar or distal characteristics were analyzed using a dendrogram. To construct the principal component analysis, all mean features were updated and the direction and strength of each vector were used to explain the clustering.
The complete methodology was drowned and presented in Supplementary Figure S4.

2.9. Statistical Analysis

Except for the integument hardness (n = 50) and respiration rate (n = 10), for each time and seed species, twenty repetitions were used (n = 20). Either normality and equal variances were tested after the Shapiro–Wilk and Brown–Forsyth tests using the statistical software package SigmaPlot Version 14.0 (Systat Software Inc., Chicago, IL, USA). All data are presented as means plus standard errors (SE). All results were analyzed with a one-way ANOVA, and means were compared using a Student test Newman–Keuls (SNK) with the statistical software package SigmaPlot. The parametric correlations were made with the statistical software Statistica Version 8.0 (StatSoft, Tulsa, OK, USA). The results were considered to be significant when p ≤ 0.05.

3. Results

3.1. Seed Imbibition

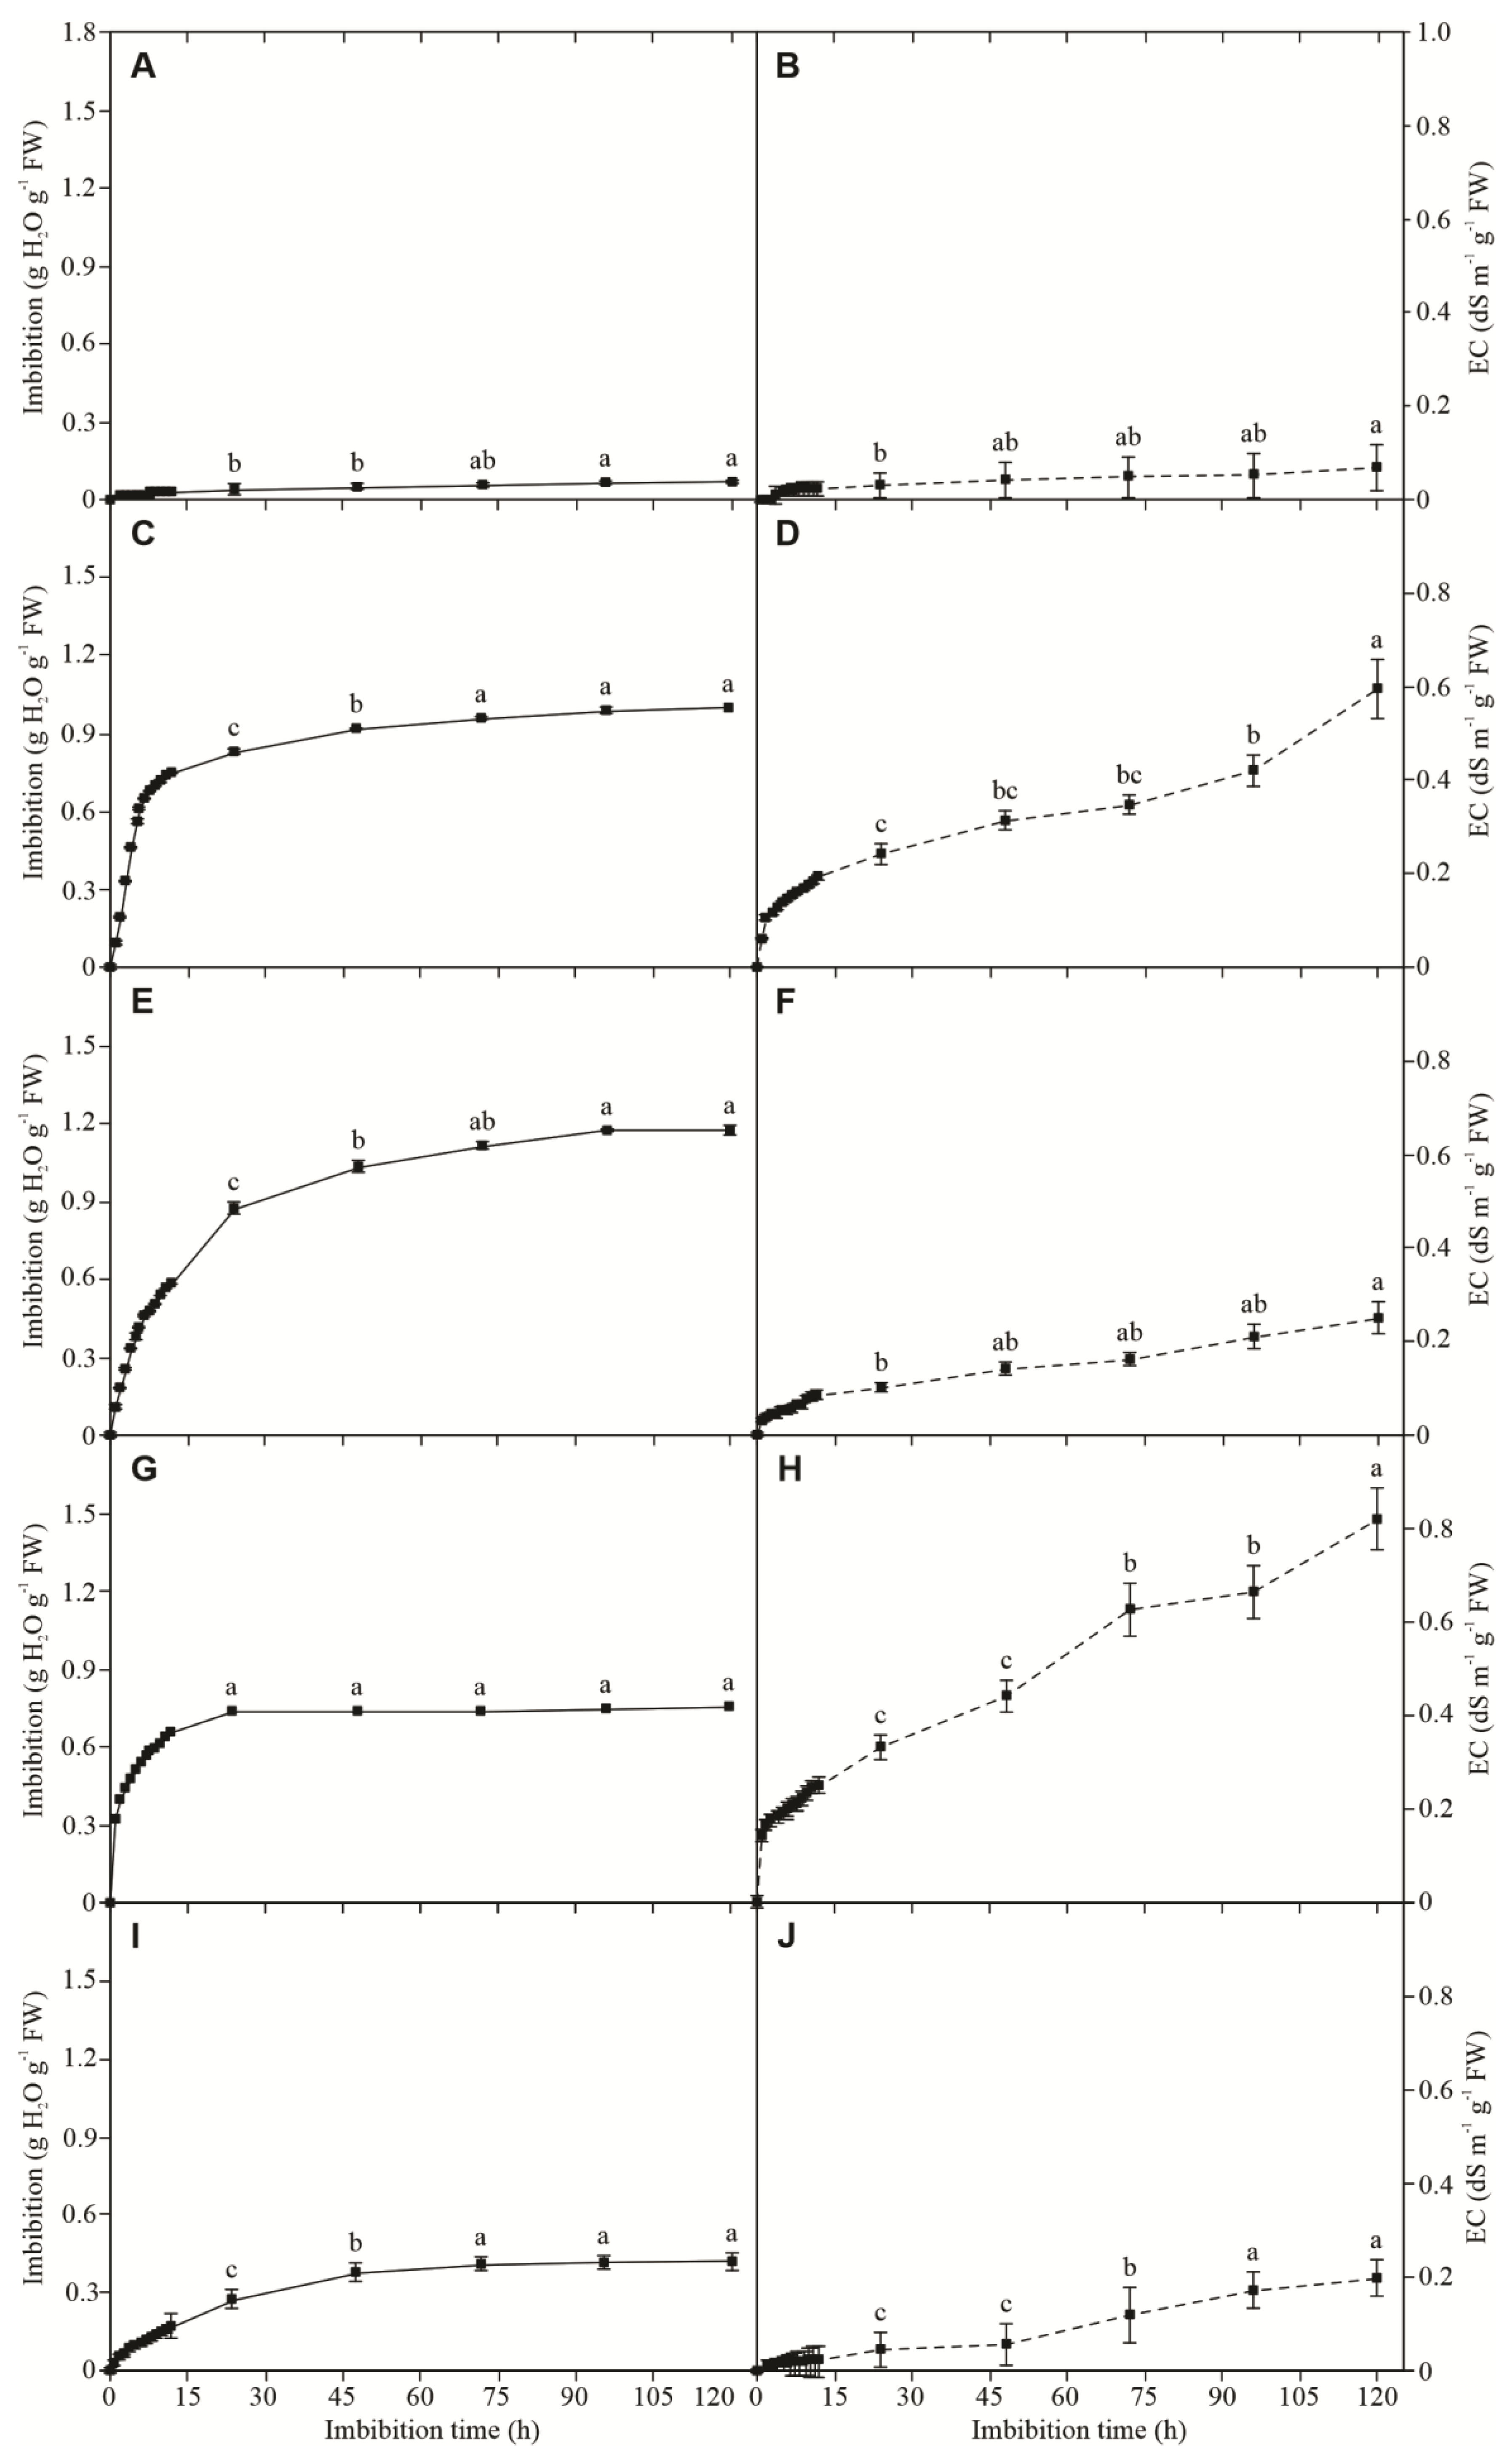
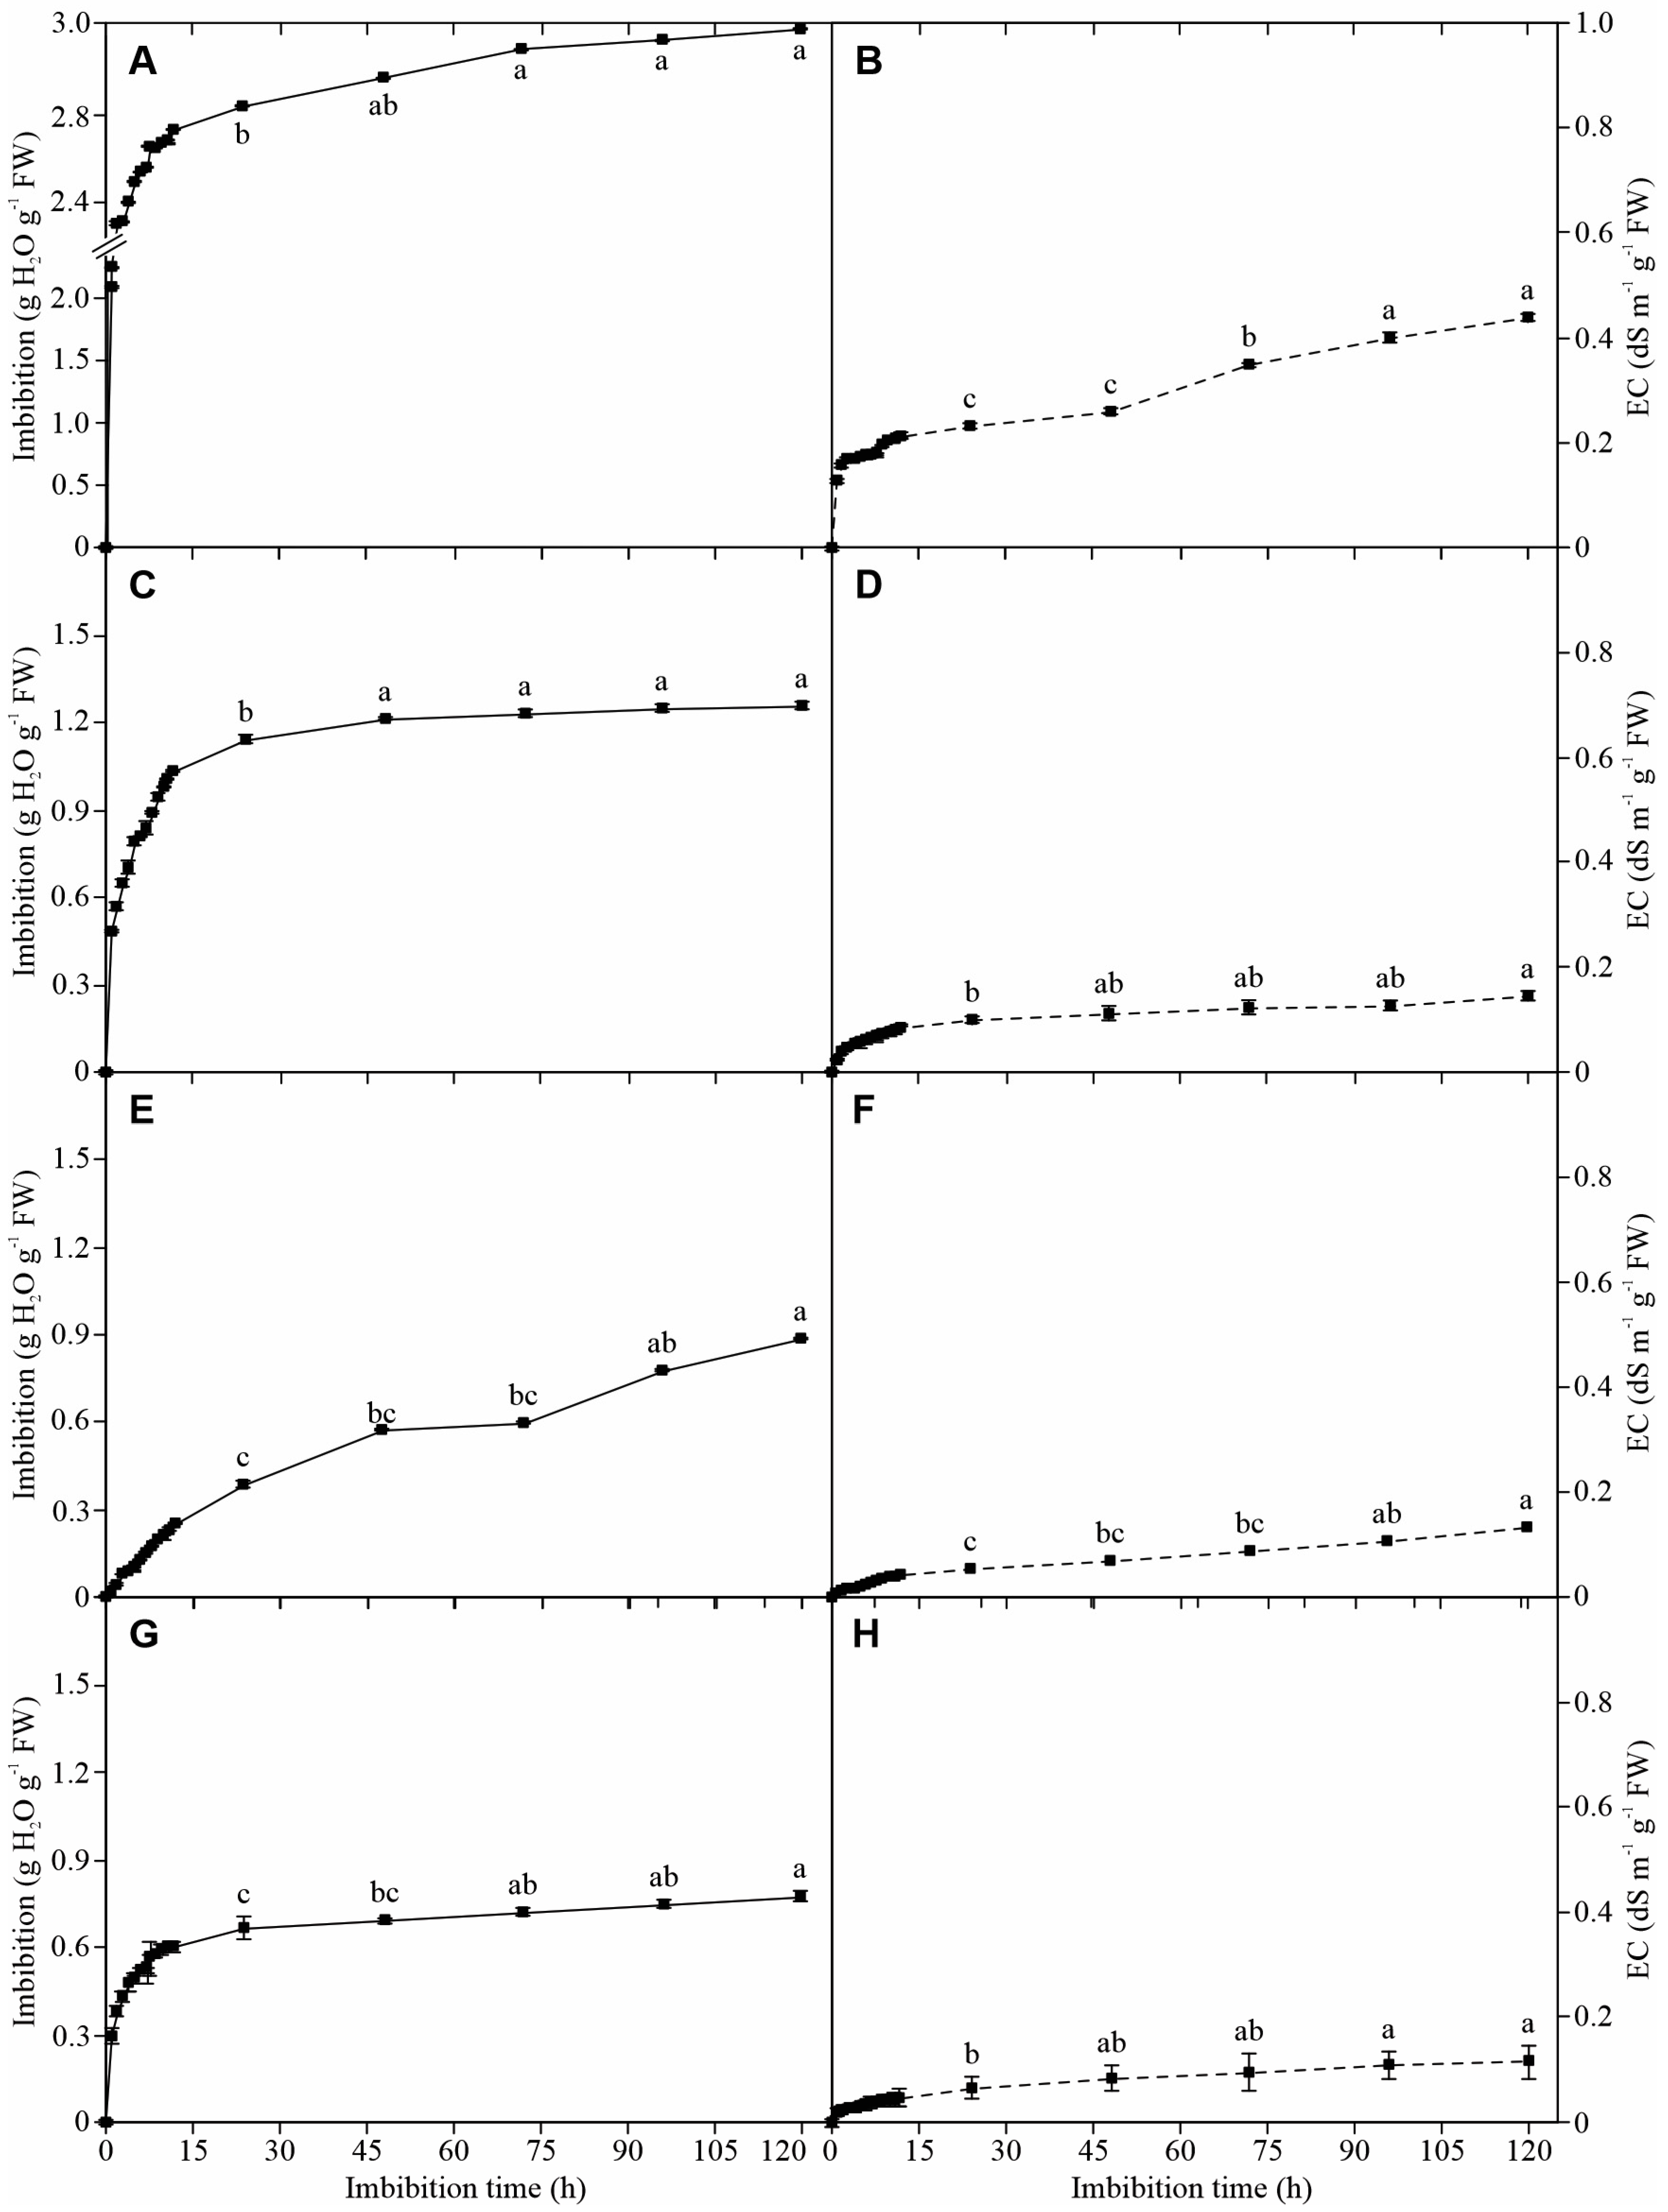
Even after 120 h, P. juliflora seeds did not complete their seed rehydration (Figure 3E), while all other species reached their complete rehydration after 120 h of imbibition (IH), an assessment that is confirmed by at least three constant seed weight (SW) non-significant values (p < 0.05). Then, the species A. hypogaea (Figure 1E), C. maxima (Figure 1I), J. curcas (Figure 2G), M. glabra (Figure 3A), and M. oleifera (Figure 3C) reached maximum water absorption from 48 IH, while the species A. blanchetti (Figure 1A), A. squamosa (Figure 1C), C. procera (Figure 1G), E. oleracea (Figure 2A), G. hirsutum (Figure 2C), H. annuus (Figure 2E), L. rigida (Figure 2I), and S. tuberosa (Figure 3G) reached their maximum water absorption after 72 IH. In a completely different way, P. juliflora began to show a tendency to stabilize its SW after 98 IH (Figure 3E); however, the SW measured after 120 IH is, on average, 13.3% greater than the SW measured after 98 IH; therefore, it cannot be said that this species is totally turgid nor that it will absorb more water from the system.
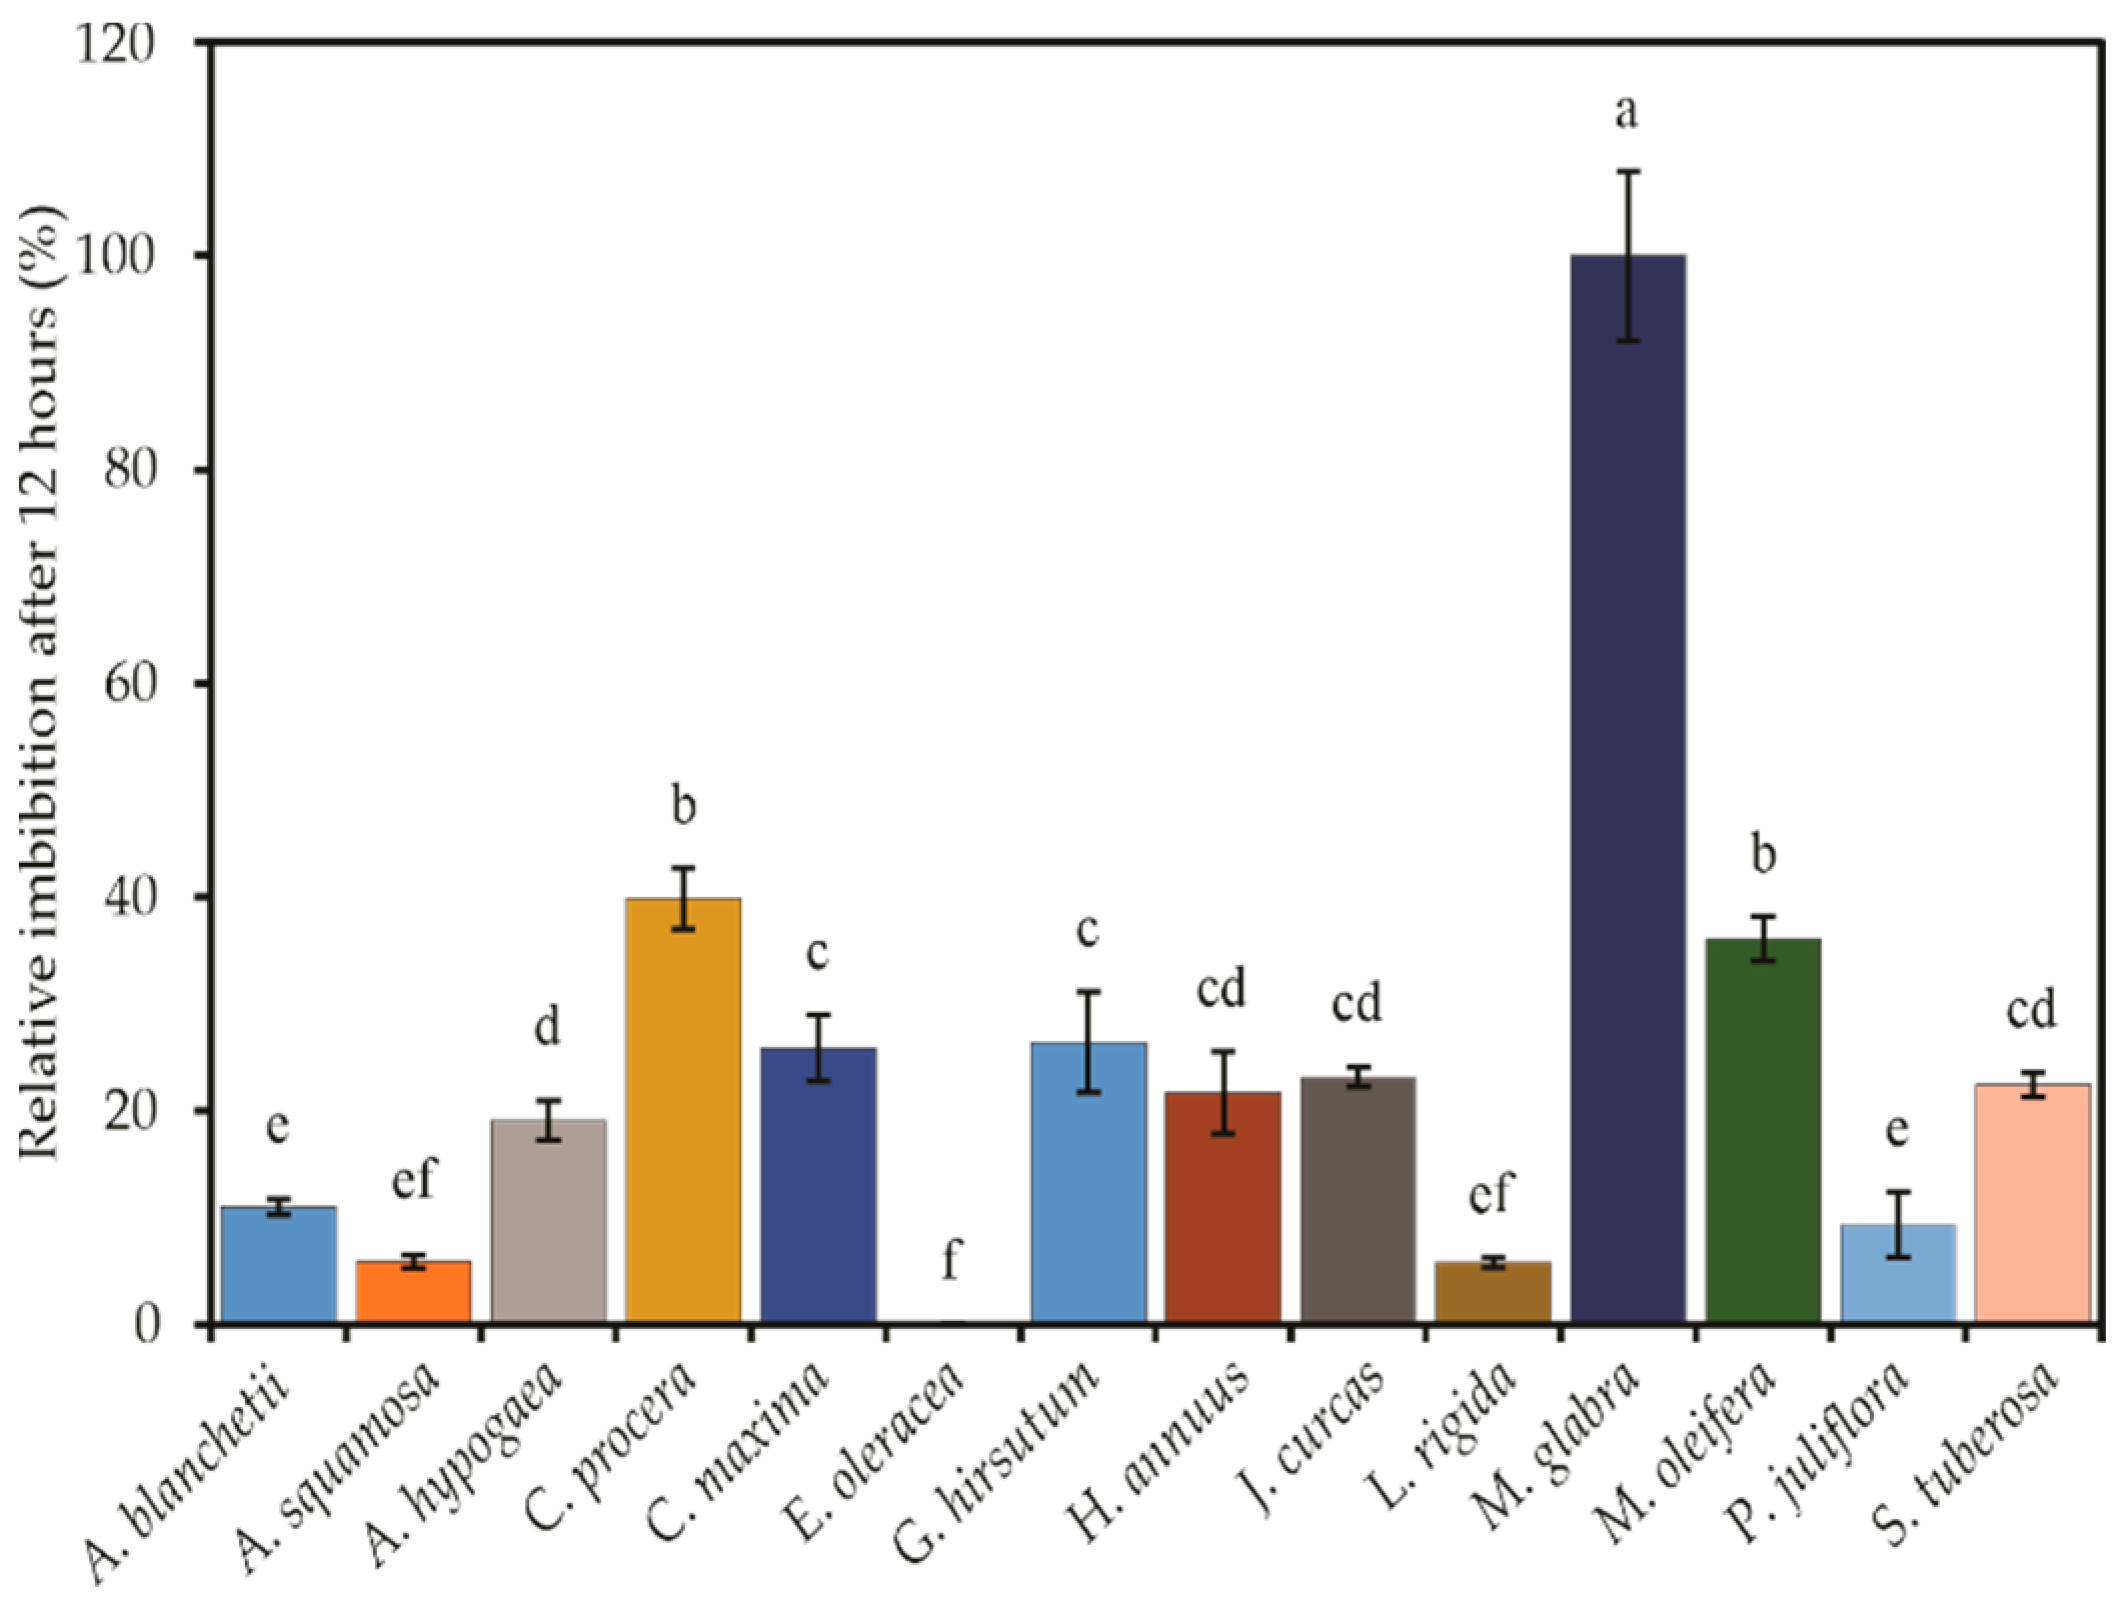
The seed imbibition measured in the first 12 h was smallest in E. olereaceae, smooth and continuous in A. blanchetti, A. squamosa, L. rigida, and P. juliflora, moderated (i.e., with higher imbibition water at 5th h, and smoothly from then on) in A. hipogaea, G. hirsutum, H. annuus, J. curcas, and S. tuberosa. Two other species (E. maxima and M. glabra) showed an abrupt water imbibition in the 1st h and then a smoother rise from the 2nd h or abrupt in the 1st h and then a significant increase but less than that observed in the first hour—C. procera and M. oleifera (Supplementary Figure S3). Noteworthy, the imbibition water after 12 h was relativized, where the maximum value showed by M. glabra (275.89 ± 6.89) was relativized to 100%, and other species relativized against with M. glabra (Figure 4). So, C. procera and M. oleifera imbibed, respectively, 48% and 64% of the M. glabra water imbibition. C. maxima, G. hirsutum, H. annuus, J. curcas, and S. tuberosa absorbed 26%, 25%, 22%, and 22% of the water than absorbed by M. glabra. The A. hypogaea absorbed 19%, while A. blanchetti (11%), J. julifora (9%), A. squamosa (6%), and L. rigida (6%) imbibed very low taxa, while in E. oleraceae imbibition rate was practically null (Figure 4).
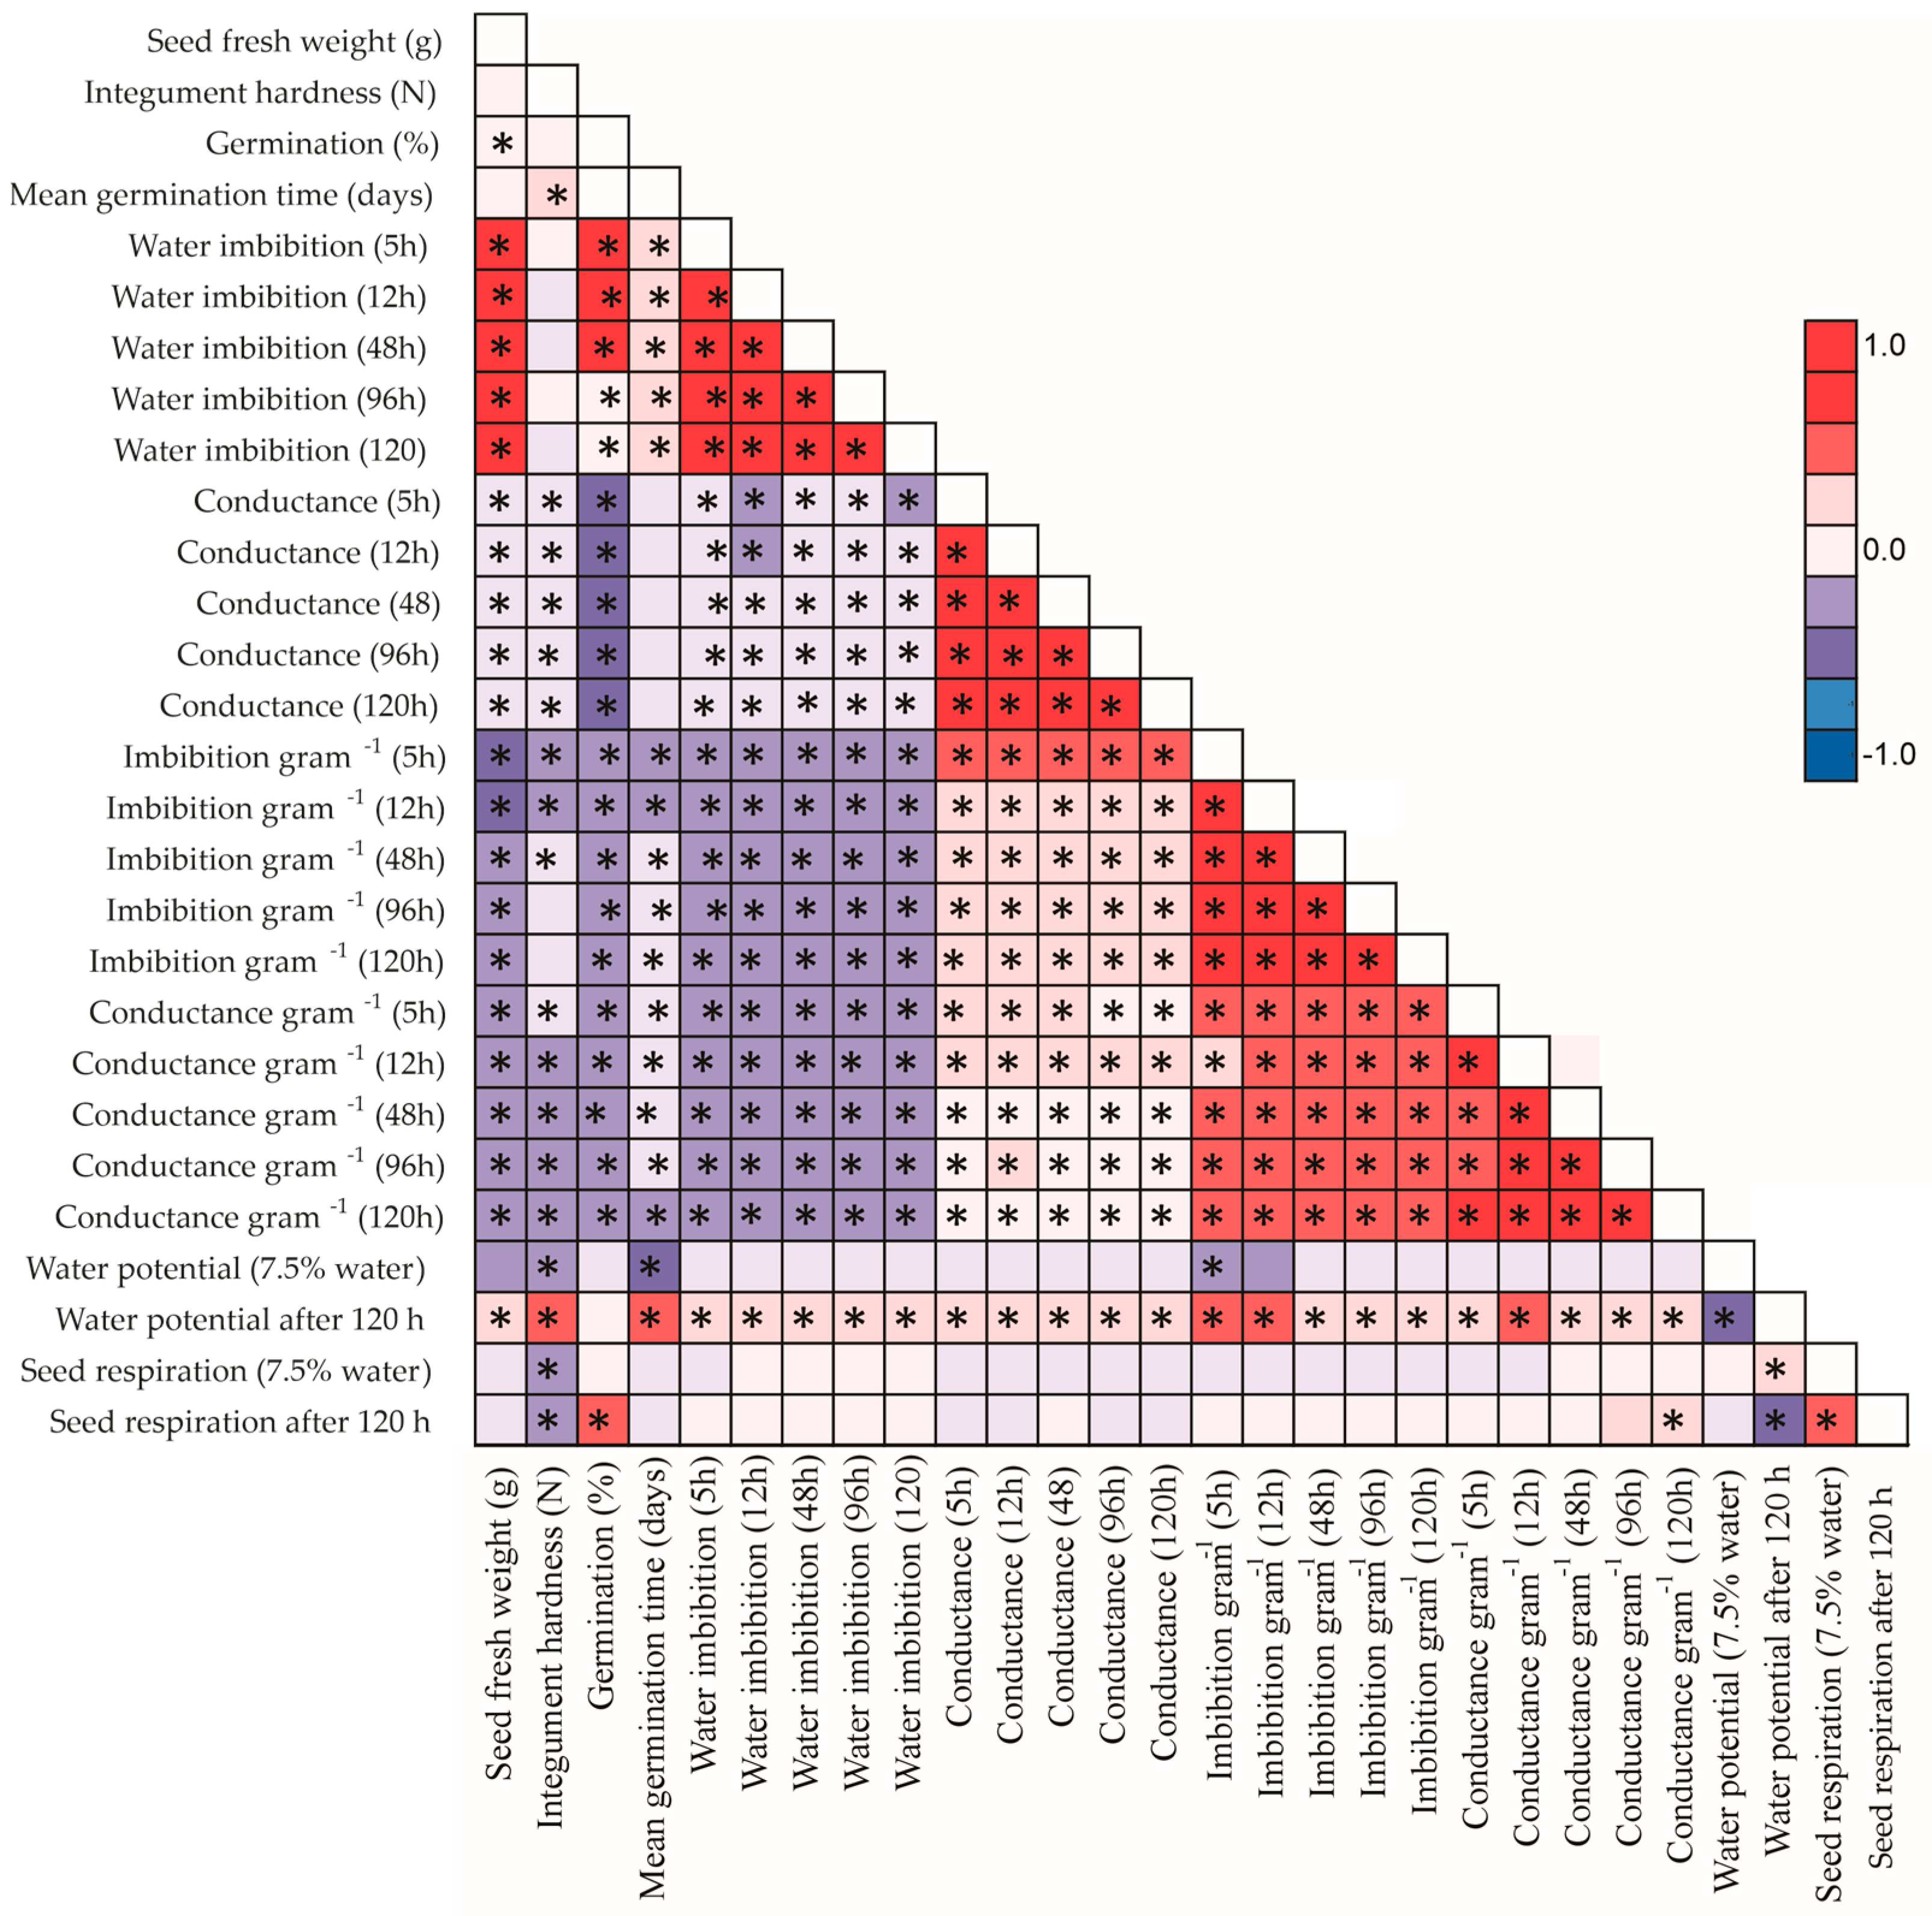
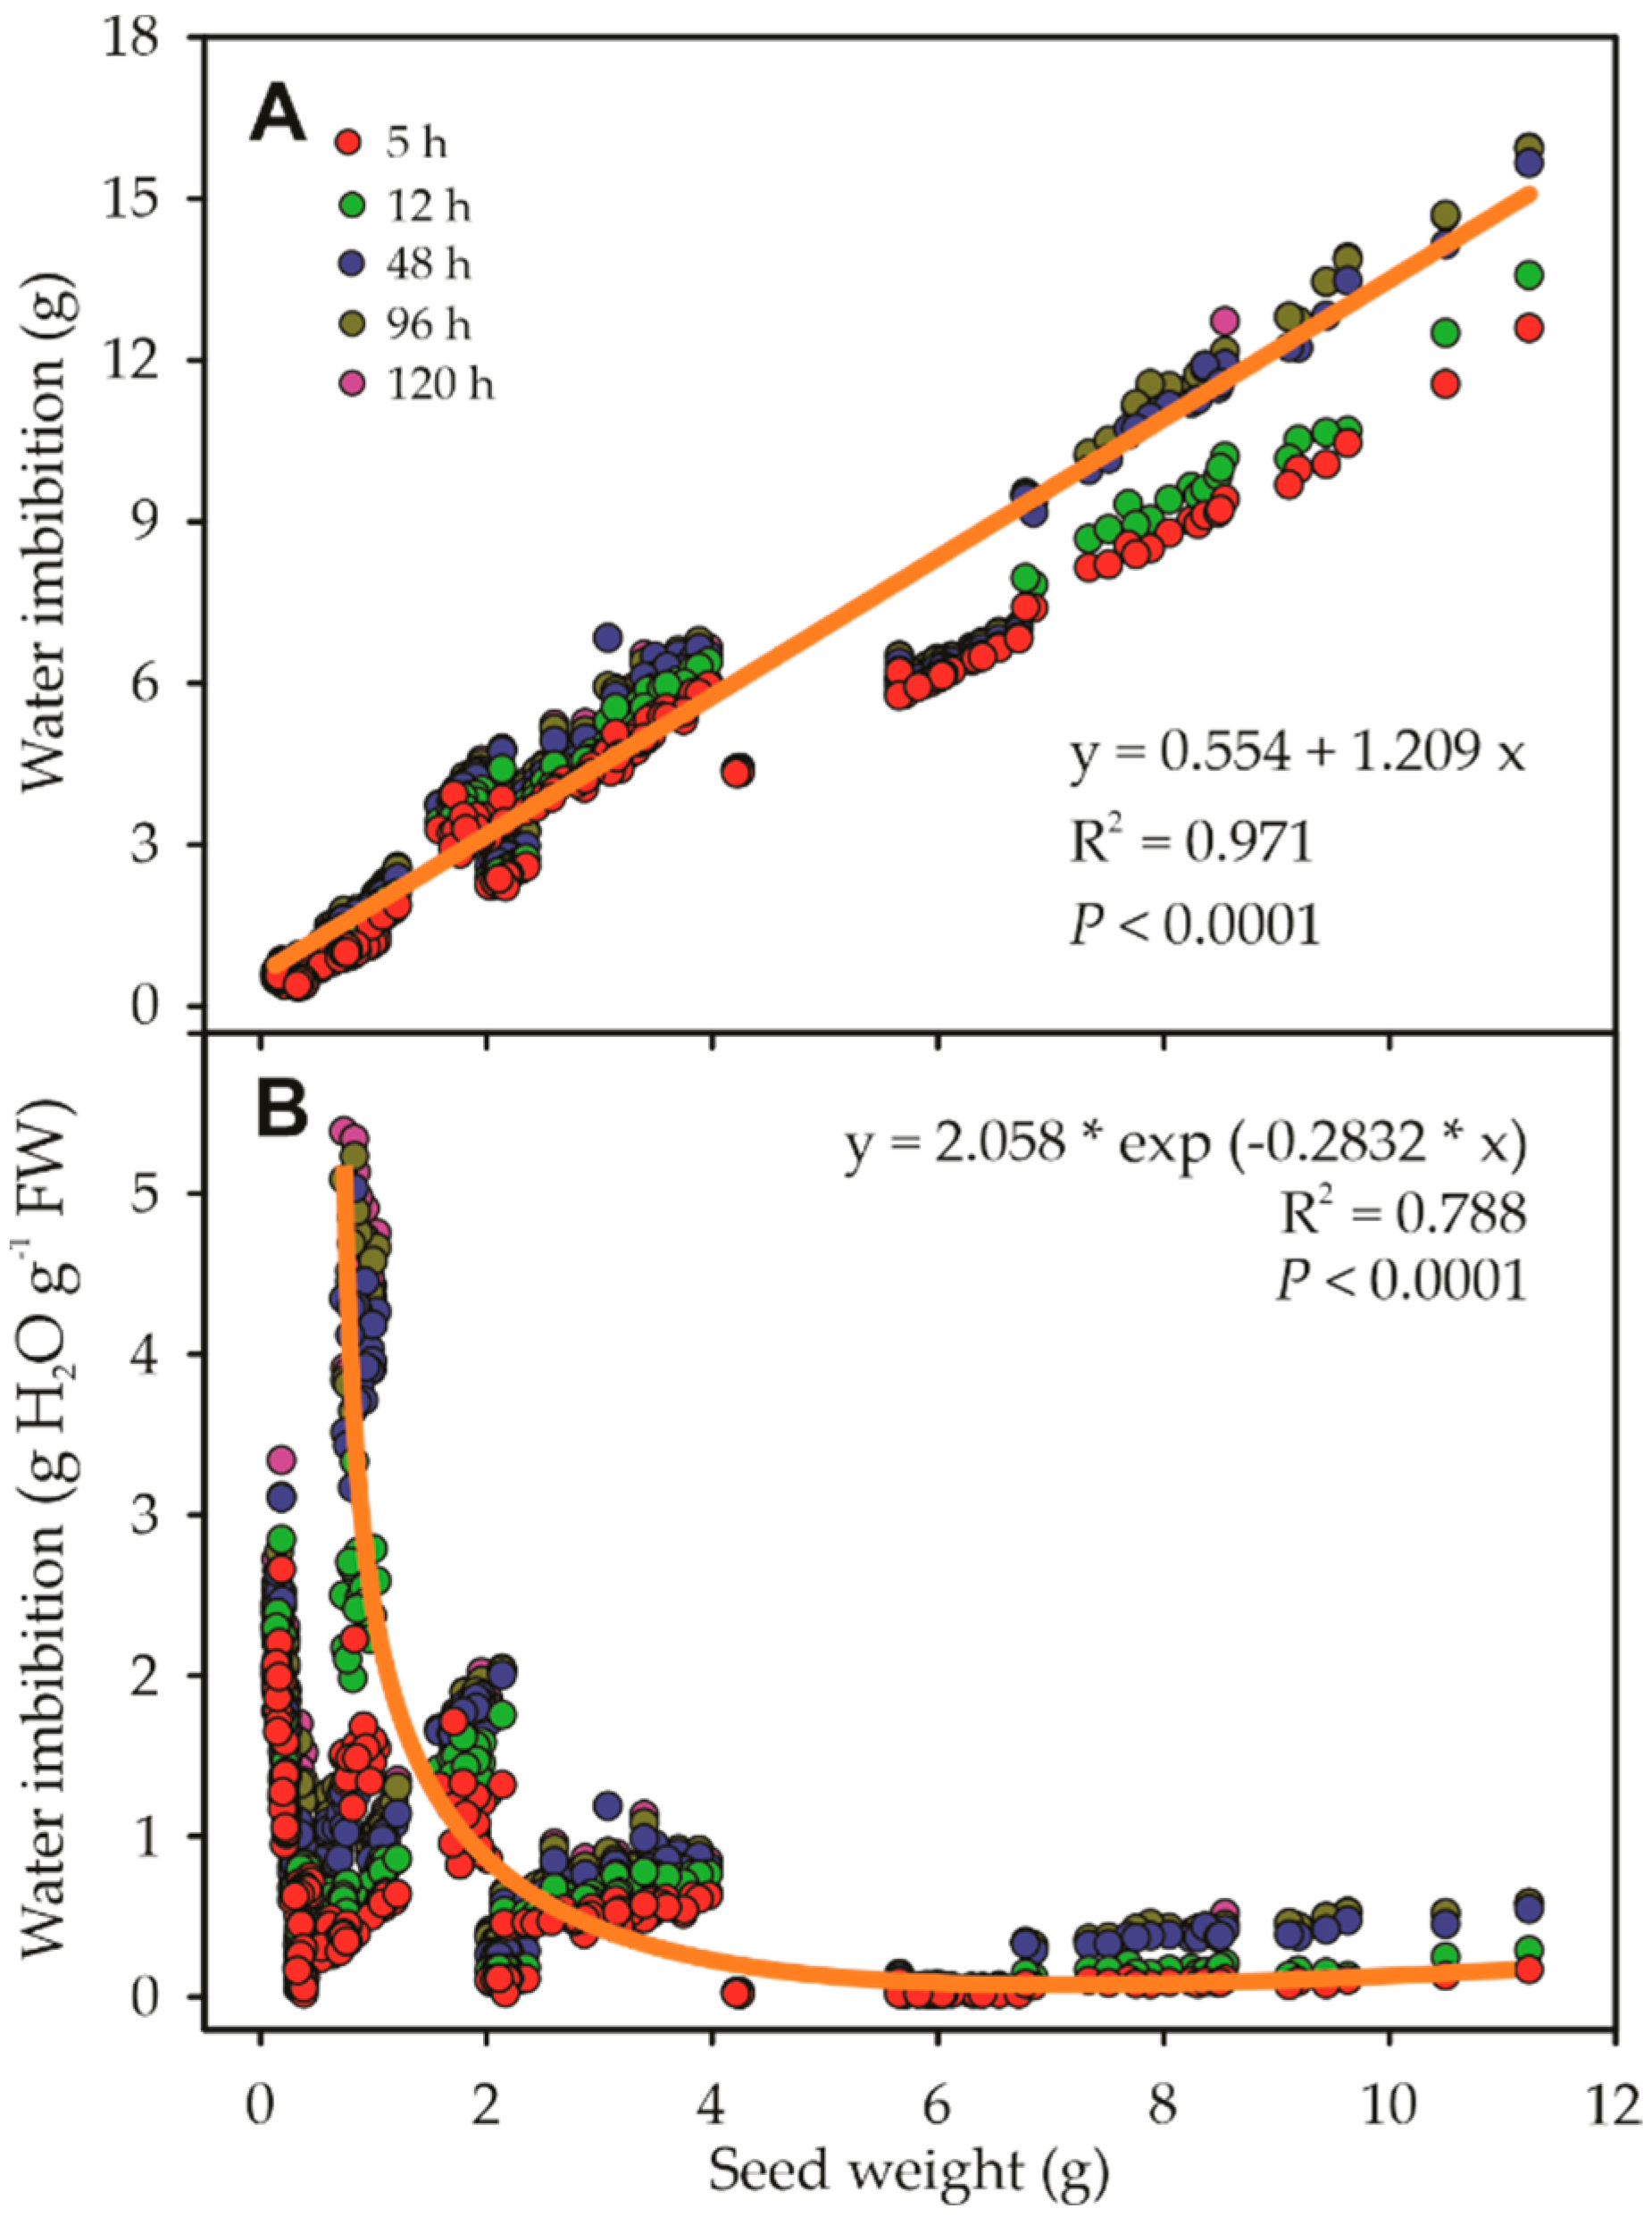
Figure 5A shows that, regardless of the imbibition time, there was a strong relationship with the seed size, since with the increase in size, the more water it imbibed, a factor that was evident in the linear regression (r = 0.971; p < 0.0001), where the weight of the seed was strongly correlated with all times of imbibition. However, when imbibition is expressed in grams of water per gram of seed (FW; fresh weight), the linear regression (Figure 5B), even if significant, returned very low values for the coefficient of determination (data not shown). Thus, the exponential regression curve has been demonstrated high coefficient of determination and high significance (r2 = 0.788; p < 0.0001). This issue clearly demonstrates that the expression on a mass basis of the seed is not able to show how the water was imbibed from different species and at different times of imbibition. This finding comes from a strong negative correlation between seed mass and imbibition expressed relative to the mass basis (Appendix ATable A1).
To compare the water absorption capacity between species, we grouped the species into five categories: (1) species with water imbibition between 0 to 500 mg H2O g−1 seed; (2) species with imbibition water between 501 to 1000 mg H2O g−1 seed; (3) species with water imbibition water between 1001 to 1500 mg H2O g−1 seed; (4) species with water imbibition between 1501 to 2000 mg H2O g−1 seed; and (5) species with water imbibition more than 2000 mg H2O g−1 seed (Table 2). Therefore, E. olareaceae (64.82 ± 5.03 mg H2O g−1 seed), A. squamosa (367.86 ± 29.27 mg H2O g−1 seed), and L. rigida (413.21 ± 8.03 mg H2O g−1 seed) were placed in Group 1, where water imbibition by E. olareaceae was significant to that observed in two other species of the same group. Seven other species: A. hypogaea (614.89 ± 45.55 mg H2O g−1 seed), A. blanchetti (567.76 ± 12.92 mg H2O g−1 seed), J. curcas (749.62 ± 11.86 mg H2O g−1 seed), S. tuberosa (770.29 ± 20.19 mg H2O g−1 seed), P. juliflora (880.50 ± 67.62 mg H2O g−1 seed), C. maxima (888.63 ± 25.42 mg H2O g−1 seed), and G. hirsutum (997.04 ± 15.80 mg H2O g−1 seed) were placed in Group 2. Therefore, A. hypogaea and A. blanchetti did not have a significant difference from the other species of this group. The same pattern was verified with J. curcas and S. tuberosa or P. juliflora and C. maxima, with G. hirsutum differing from other species of this group. H. annus (1155.10 ± 27.31 mg H2O g−1 seed) and M. oleifera 1251.96 ± 11.82 mg H2O g−1 seed) were placed in Group 3, but the water imbibition of these two species was statistically different between them. C. procera (1568.67 ± 63.97 mg H2O g−1 seed) and M. glabra (3173.31 ± 61.96 mg H2O g−1 seed) showed the highest water imbibition of the 12 other species. Thus, the range between species that less and more imbibed water was 3108.49 mg H2O g−1 seed, so M. glabra imbibed 49-fold more water than E. olereaceae.

3.2. Electrolyte Leakage

The electrolyte leakage, measured in decisiemens per meter (dS m−1) showed a completely different pattern as compared to the water imbibition. Thus, except for L. rigida (1.60 ± 0.26 dS m−1) and J. curcas (2.59 ± 0.33 dS m−1), all other species showed an ΔEC (EC120h–EC1h) lower than 1 dS m−1. Therefore, the range of EC was from 0.05 ± 0.01 dS m−1 (P. juliflora) to 2.59 ± 0.33 dS m−1 (J. curcas), with J. curcas electrolyte leakage 52-fold higher than P. juliflora. Then, the species A. hypogaea (Figure 1H, Table 3), E. oleraceae (Figure 2F, Table 3), H. annuus (Figure 2H, Table 3), M. oleifera (Figure 3F, Table 3), and S. tuberosa (Figure 3H, Table 3) reached maximum EC at 48 IH, while A. blanchetti (Figure 1F, Table 3) and C. maxima (Figure 1J, Table 3), reached the maximum EC at 72 IH. Species such as A. squamosa (Figure 1G, Table 3), L. rigida (Figure 2J, Table 3), M. glabra (Figure 3E, Table 3), P. juliflora (Figure 3G, Table 3), and C. procera (Figure 1I, Table 3) reached the maximum EC at 96 IH. Finally, G. hirsutum (Figure 2G) and J. curcas did not reach the maximum EC until 120 h, with an EC120h of 41.2% and 23.5% greater than EC96h. The EC were weakly and significative correlated to seed weight (Appendix ATable A1).
The EC analyzed in isolate form did not have any biological importance, because heavier seeds tend to decrease the EC compared to lighter seeds (Table 3). Then, the seed species were analyzed by groups, in the same form as used in seed imbibition (dS m−1 g−1 seed). Therefore, four groups were formed: (1) species with an EC between 0 and 0.25 dS m−1 g−1 seed; (2) species with an EC between 0.26 to 0.60 dS m−1 g−1 seed; (3) species with an EC between 0.61 and 0.90 dS m−1 g−1 seed; and (4) species with an EC higher than 0.91 dS m−1 g−1 seed. Then, the range of EC was analyzed to determine the base, E. oleracea (0.06 ± 0.02 dS m−1 g−1 seed) is the species that shows less electrolyte leakage. At the same time, A. blanchetti (0.97 ± 0.13 dS m−1 g−1 seed) loses 16.2-fold more electrolytes than E. oleracea. Unlike the isolated EC, when EC is expressed by seed weight, Pearson’s correlations were moderately more expressive with a correlation coefficient ranging from −0.383 to −0.466, significantly stronger than the values presented for conductivity expressed without considering the weight of the seed (Appendix ATable A1).

3.3. Water Potential

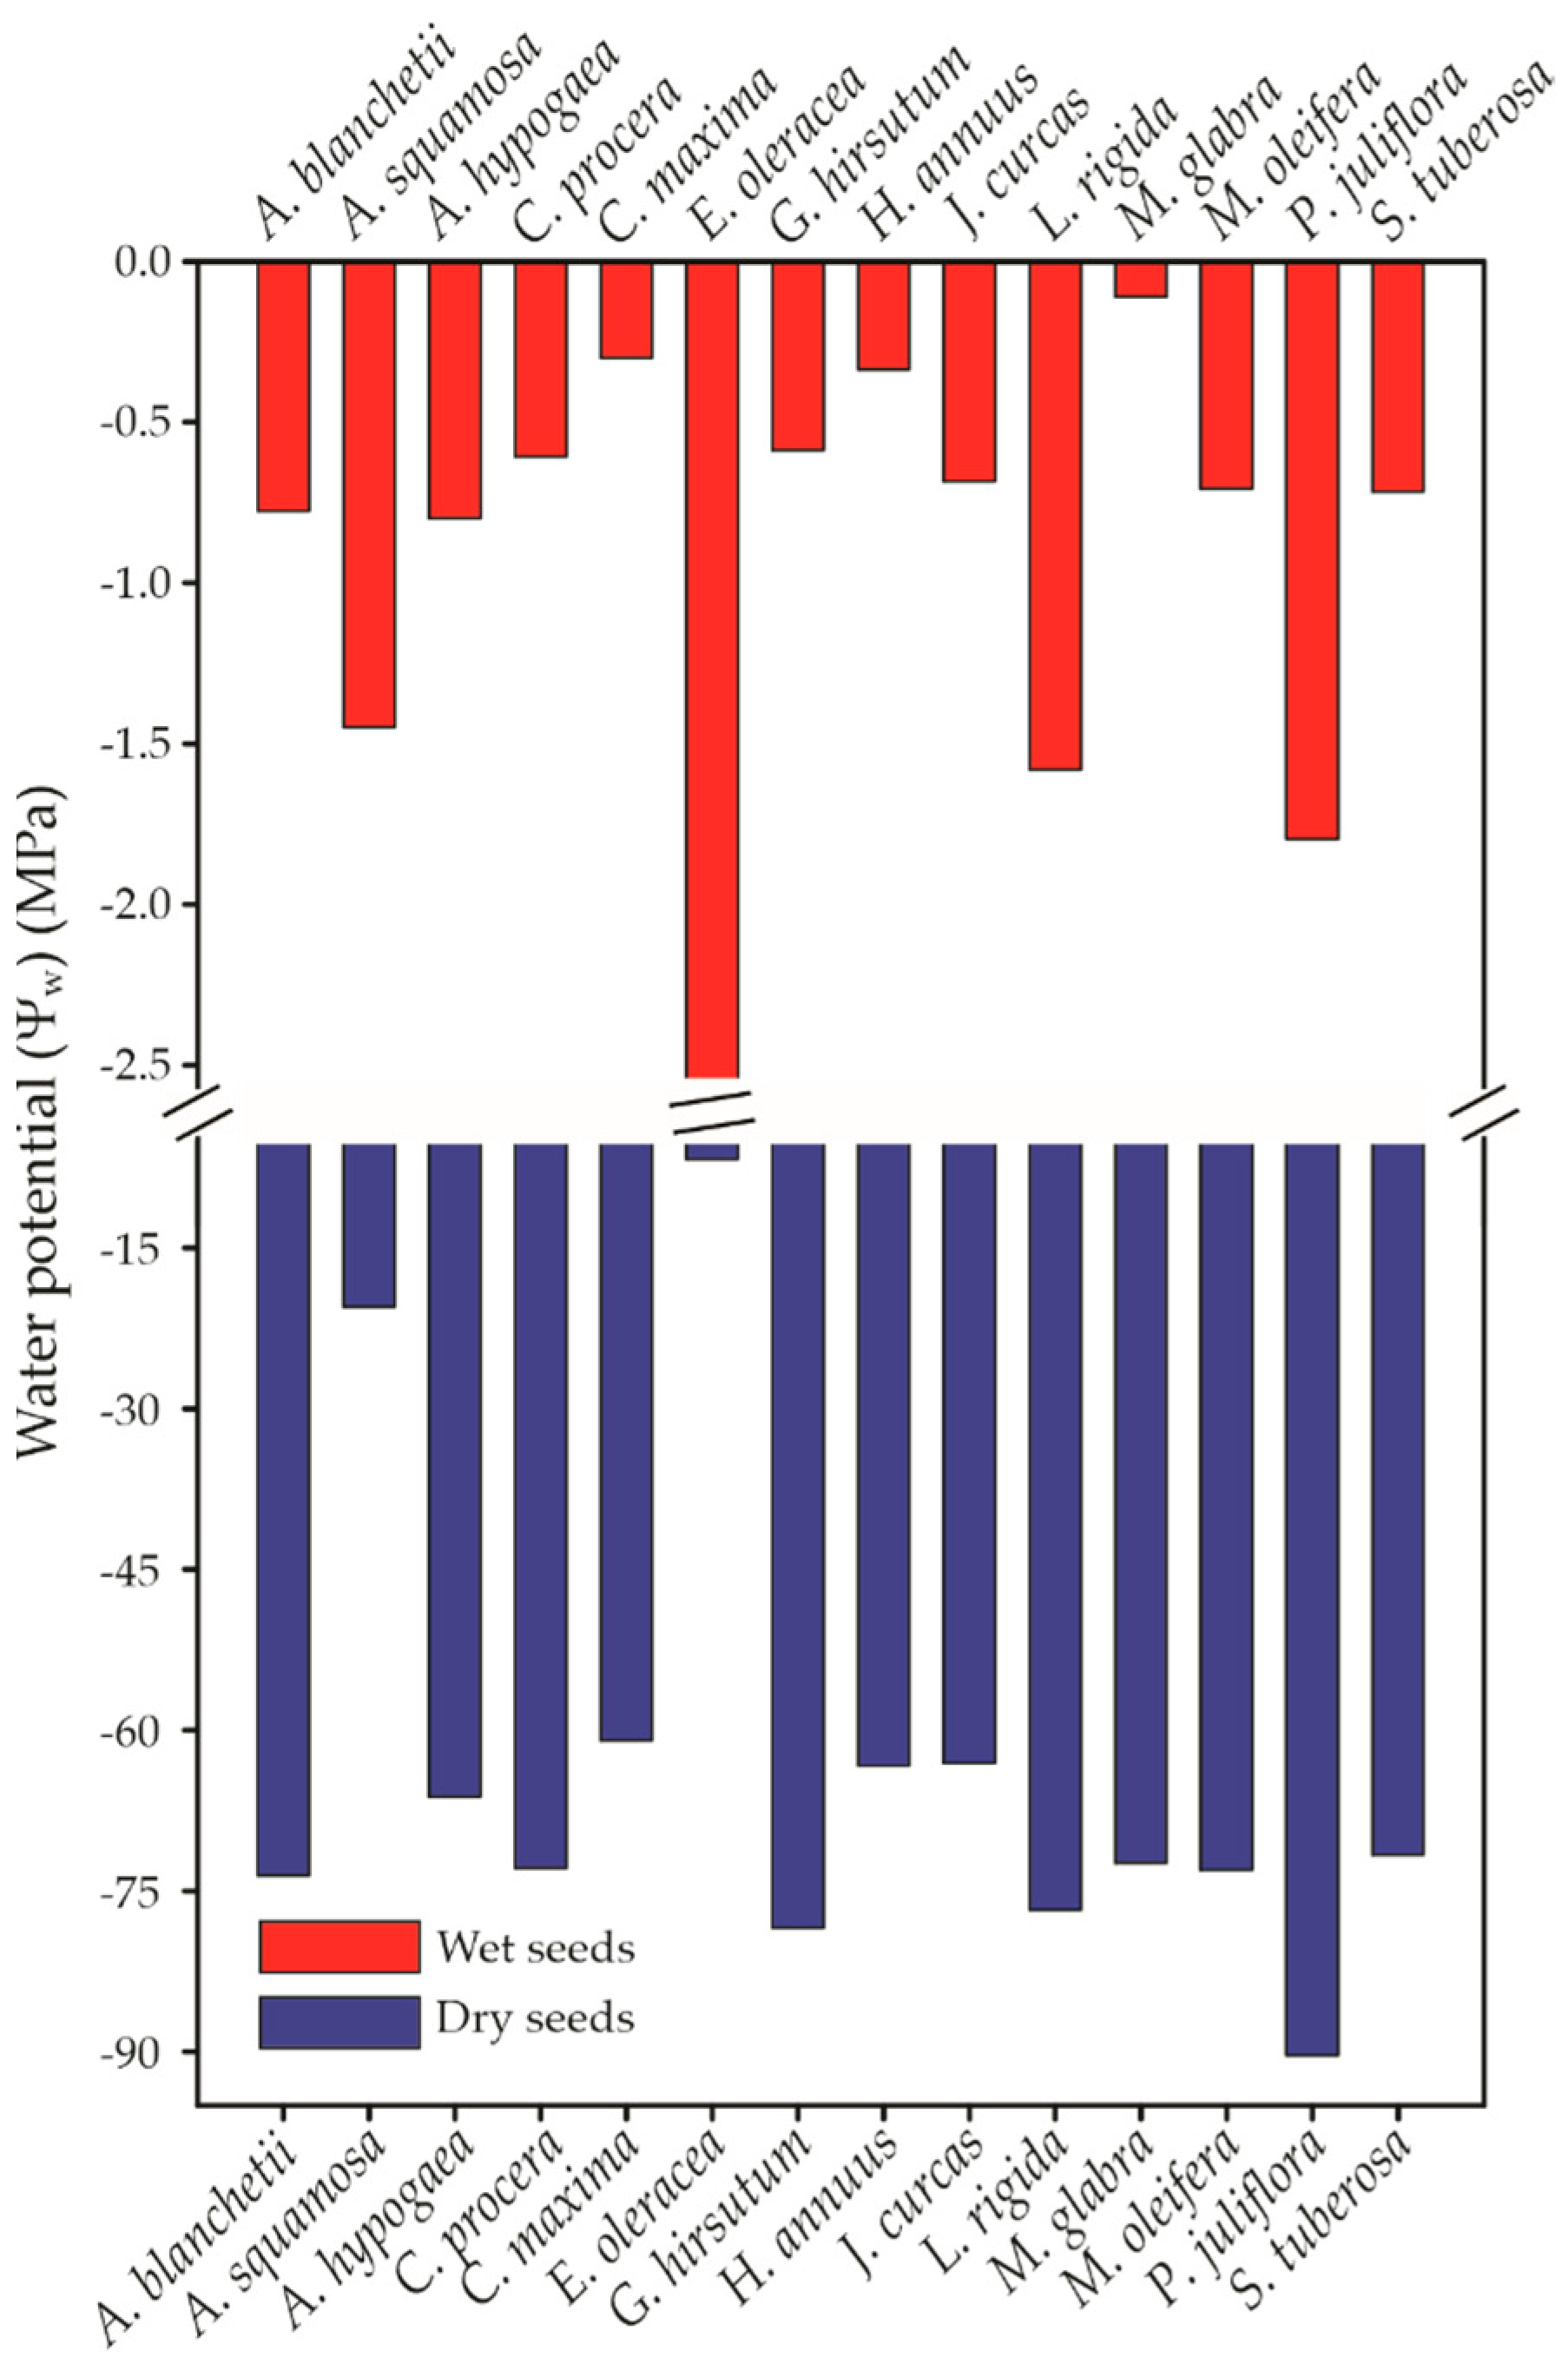
Even partially hydrated (7.5%), the water potential (Ψw) of non-imbibed seeds ranged from −6.6 MPa (E. oleracea) to −90 MPa (P. juliflora) (Figure 6). Differing from expected values, this Ψw was not the predominant force for seed water absorption. This finding can be confirmed by imbibition data measured at the first 10 h of elapsed time, where E. oleraceaw = −6.6 ± 1.0 MPa) imbibed 6.2% of its weight in water, while P. julifloraw = −90 ± 4.3 MPa) imbibed 9.4%. M. glabraw = −71.7 ± 5.0 MPa) showed the highest relative imbibition rate (100%), even though it was not the species with the lowest Ψw. The other species showed between 15% and 40% of relative imbibition, governed by their respective osmotic potentials −40 MPa to −80 MPa (Figure 6).

3.4. Integument Hardness

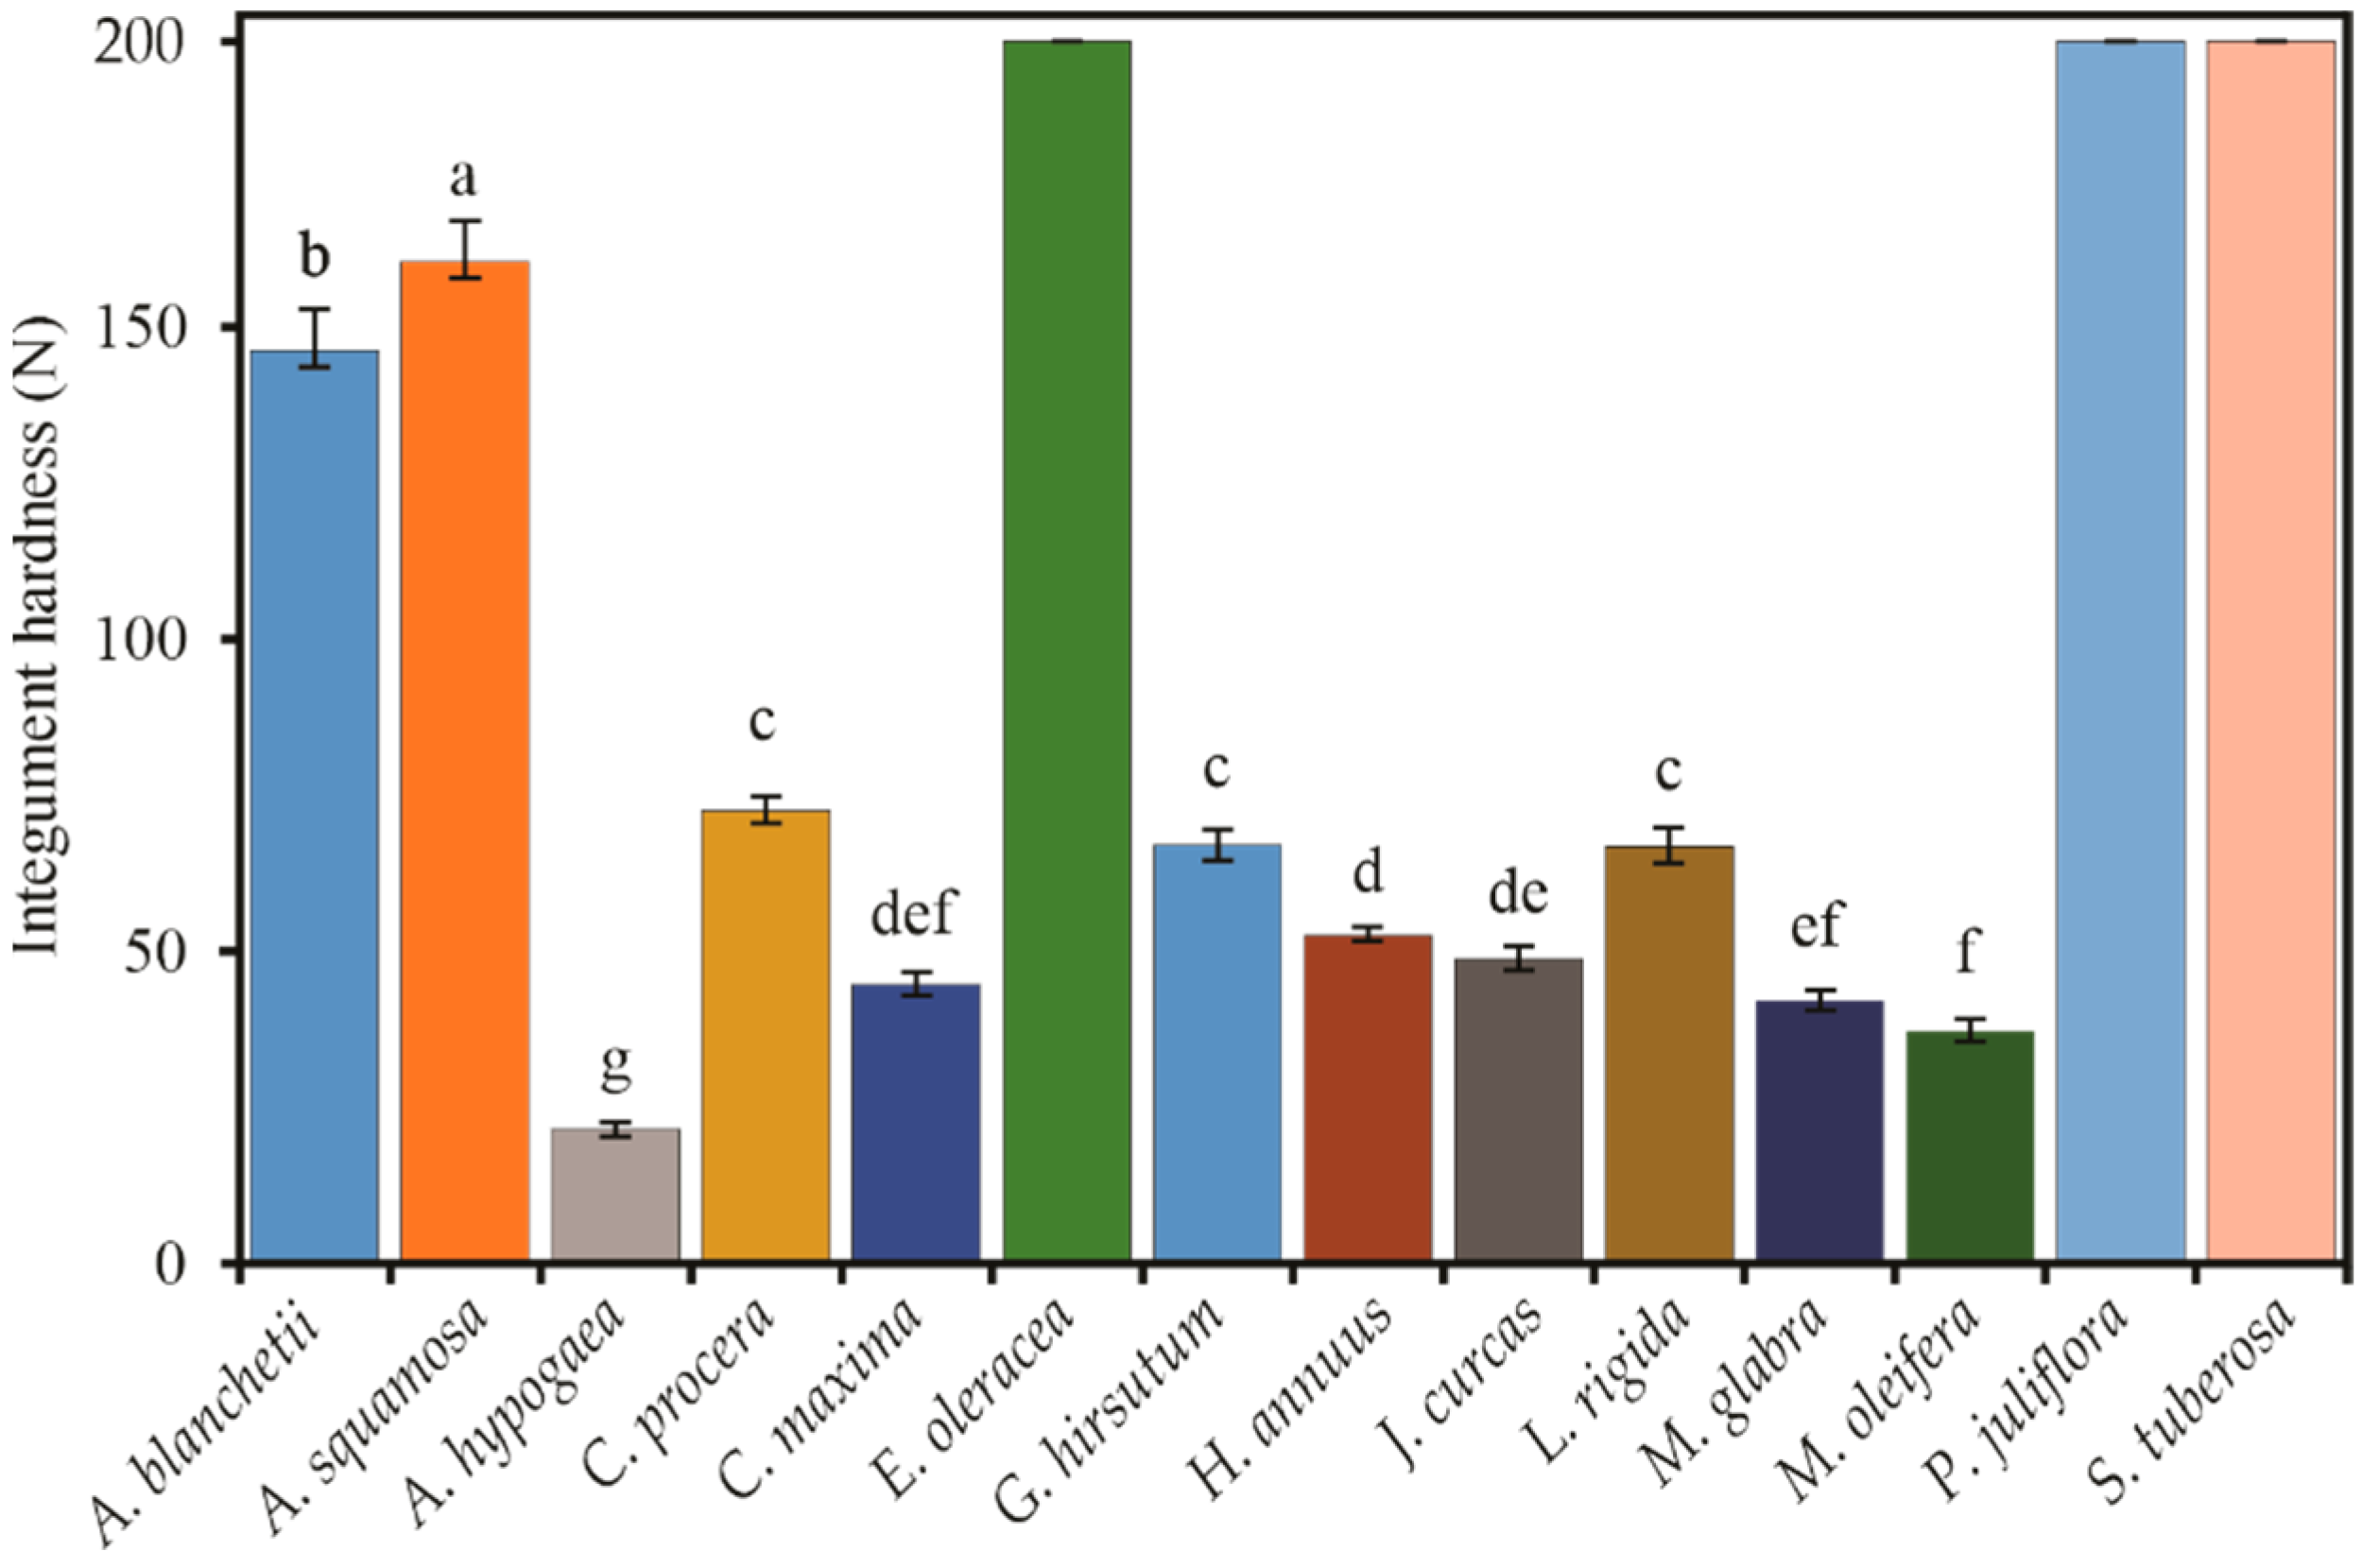
Integument hardness (Figure 7) varies widely among the study species; means ranging from 21.96 ± 1.17 N to over 200 N. The measurement equipment, at the maximum limit, can detect 200 N. The species E. oleraceae, P. juliflora, and S. tuberosa, were not possible to accurately measure the hardness of the integument, but it is known that it is greater than 200 N. Thus, to improve comprehension, the values were relativized with respect to the function of these three species, for which 100% was assigned. Then, the species A. hypogaea (10.98 ± 0.59 N), M. oleifera (19.06 ± 0.89 N), M. glabra (21.53 ± 0.82 N), C. maxima (22.81 ± 0.98 N), J. curcas (24.90 ± 0.62 N), and H. annuus (26.84 ± 0.62 N) end up within the range of up to 30% of the maximum limit of the equipment or of the hardness of the integument of the first three species. Three other species: L. rigida (34.10 ± 1.42 N), G. hirsutum (34.27 ± 1.26 N), and C. procera (37.08 ± 1.10 N) fall in a range of 30 to 60% from the right of the three species already mentioned. Two other species: A. blanchetii (74.69 ± 2.37 N) and A. squamosa (81.98 ± 2.33 N) would fall within the range of 60 to 90% of the maximum value (Figure 7).

3.5. Germination Parameters

Except for E. oleraceae, P. juliflora, and S. tuberosa, the seed imbibition promoted higher germination and lower MGT in the imbibed seeds when compared to the non-imbibed seeds.
Less negative osmotic potentials promote higher embryonic respiratory rates (r = −0.636; p = 5.6 × 10⁻⁶), which leads to a consequent increase in seed germination (r = 0.628; p = 1.25 × 10⁻⁵). However, this effect was only verified in non-imbibed-seeds and not in 120 h-imbibed-seeds (Appendix ATable A1).
The highest and lowest ΔG (the difference between the imbibed and non-imbibed seeds) was shown in H. annuus and C. maxima where the germination of imbibed and non-imbibed seeds were, respectively, 66.0 ± 0.3 and 98.0 ± 0.1 for H. annuus and 57.6 ± 1.1% and 66.0 ± 0.8% for C. maxima. Elsewhere, J. curcas seeds showed moderately higher germination in non-imbibed seeds (84.9 ± 0.5%) when compared to 120 h-imbibed-seeds (63.8 ± 0.6) (Table 4). Thus, we showed that the seed imbibition process could decrease or increase seed germination. The range of seed germination in 120 h-imbibed-seeds decreases the seed germination in 25% (J. curcas) or increases by 86% (M. glabra). Thus, when the extreme values were analyzed, we demonstrate that the seed germination is directly proportional to the final seed weight after 120h of imbibition (r = 0.977; p = 4.57 × 10⁻²⁷). However, the volume of imbibed water per gram of seed is inversely proportional to germination (r = −0.951; p = 4.9 × 10⁻²¹). Considering all species, the correlation between final seed weight and germination was moderately reduced (r = 0.222; p = 1.83 × 10⁻⁴), with the same correlation between imbibed water per gram of seed and germination (r = −0.292; p = 6.39 × 10⁻⁷).
Except for E. oleraceae, all other species showed a more significant decrease in MGT in 120 h-imbibedseeds than non-imbibed seeds. Imbibition leads to a decrease of 65% (M. oleifera) or an increase of 46% (E. oleraceae) in MGT, respectively in non-imbibed seeds compared to 120 h-imbibed seeds. Thus, when analyzing the extreme values, we demonstrate that the MGT is directly proportional to the final seed weight after 120 h of imbibition (r = 0.897; p = 4.99 × 10⁻¹⁵); however, when we consider the volume of imbibed water per gram of seed is inversely proportional to MGT (r = −0.929; p = 5.01 × 10⁻¹⁸). Considering all species, the correlation between final seed weight and germination was strongly reduced (r = 0.306; p = 1.78 × 10⁻⁷). The same tendency was verified in a correlation between imbibed water per gram of seed and germination (r = −0.235; p = 7.17 × 10⁻⁵).

3.6. Seed Respiration and Viability

Respiration rate is moderately and negatively influenced by greater integument hardness (r = −0.493; p = 1.14 10−4) and is positively modulated by Ψw (r = 0.350; p = 0.023); however, only in imbibed seeds (Appendix ATable A1). Seeds with harder integument (E. oleracea, P. juliflora, and S. tuberosa), protein and oilseeds (C. maxima, and H. annuus), and starchy and oilseeds (G. hirsutum) species did not show significative respiration rates when compared to imbibed and non-imbibed seeds (Figure 8). On the other hand, the species A. blanchetii, A. squamosa, A. hypogaea, C. procera, J. curcas, M. glabra, and M. oleifera presented a respiration rate, respectively, of 9.0-, 10.6-, 2.1-, 3.5-, 3.4-, 7.9-, and 2.7-fold higher in 120 h-imbibed seeds when compared to non-imbibed seeds (Figure 8).

3.7. Seed Coat Ultrastructure

The seed coat analyzed by SEM was done to understand the intrinsic nature of the outermost integument of A. squamosa and J. curcas seeds. A. squamosa has an integument 3.44-fold harder than those measure in J. curcas (Figure 7). This trait promoted greater water uptake (2.04-fold) in J. curcas when compared to A. squamosa (Table 2). Part of this uptake was due to a 2.95-fold lower Ψw in J. curcas than in A. squamosa (Figure 6). However, the analysis of the outermost integument of both species, it was verified that both have pore-like structures (Figure 9) where water absorption should be facilitated. The difference between the pores of A. squamosa (Figure 9A,B) and J. curcas (C-G) is due to the more defined and larger arrangement in J. curcas. Conversely, pores in A. squamosa more closely resemble grooves than pores per se. Unlike J. curcas, there were no prominent pores in A. squamosa to facilitate water uptake. Analyzing the ultrastructure of the integument of the A. squamosa seed, a large number of fibers can be seen, which may have hindered the water absorption. On the other hand, the pores of J. curcas are very well defined (Figure 9D–F) measuring between 48 μm to 125 μm in the largest diameter. In Figure 9G, the pore of J. curcas is visualized in more detail, showing that they permeate the entire outer integument, easily reaching the endosperm of the seed. Unlike the other two species, the integument of M. glabra (Figure 9H,I) was highly convoluted in the dry state. The highly convoluted integument is more visible at a higher magnitude (Figure 9I), although this convoluted one is easily visible macroscopy to the naked eye (Supplementary Figure S2).

3.8. Dendrogram

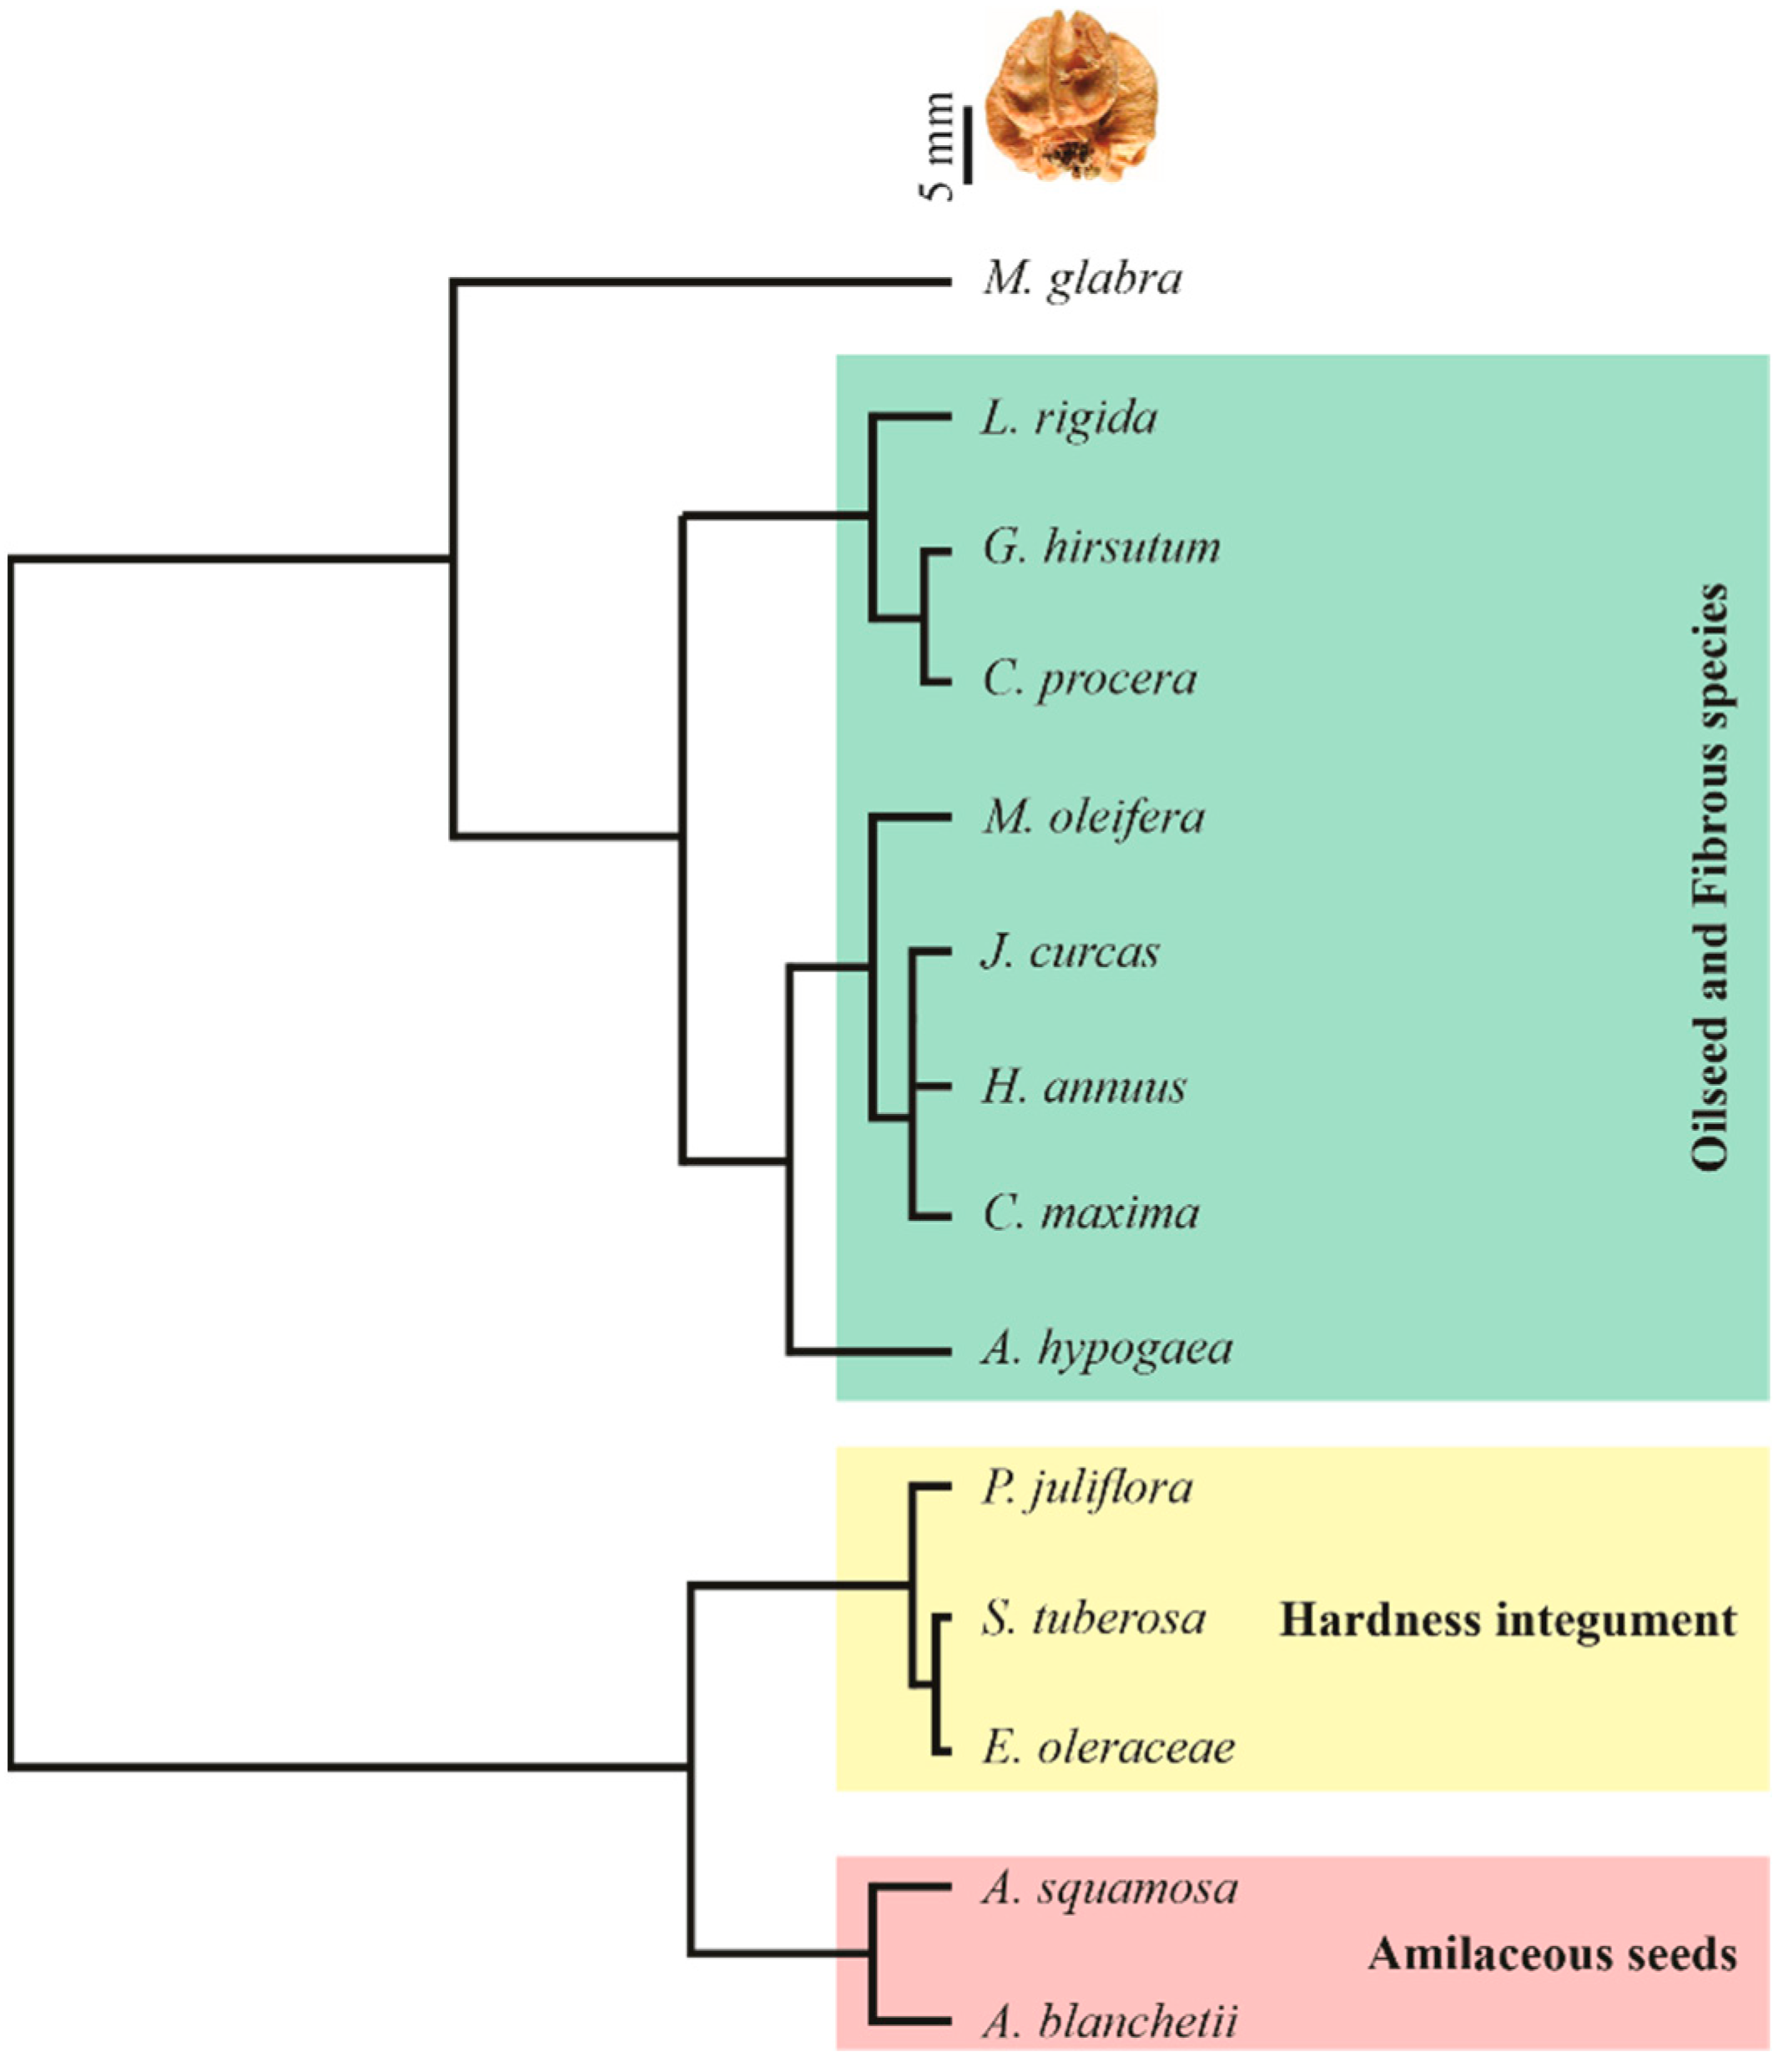
All evaluated characteristics were imputed against the dendrogram (Figure 10). Basing its similarities or distal features, the dendrogram is used to return at least four groups (Figure 10, Appendix ATable A1 and Supplementary Figure S5) where PC1 plus PC2 explain at least 78.7% of data variability (Supplementary Figure S5). Thus, A. blanchetii and A. squamosa, having high EC values at any of the evaluated times (ranking from 0.181 to 0.217 in PC1; Table A1 in Appendix A), low RWC in 7.5% water seed content (−0.002 in PC1; Table A1) and high RWC at 120 h seed imbibition (0.188 in PC1; Table A1), with starch as the main seed component (data not shown) were classified as amilaceous seeds. E. oleracea, P. juliflora, and S. tuberosa were grouped in a single branch of the tree, mainly because they showed high integument hardness (−0.157 in PC2; Table A1), high MGT in both 7.5% water seed content (−0.251 in PC2; Table A1) and at 120 h seed imbibition (−0.251 in PC2; Table A1), and high RWC at 120 h seed imbibition (−0.257 in PC2; Table A1). Therefore, these species whose seeds have a very hard integument (greater than 200 N). The other species (A. hypogaea, C. maxima, J. curcas, M. oleifera, C. procera, G. hirsutum, and L. rigida) were also classified by high respiration rate in both 7.5% water seed content (0.195 in PC2; Table A1) and at 120 h seed imbibition (0.152 in PC2; Table A1), high seed germination scores in both 7.5% water seed content (0.249 in PC2; Table A1) and at 120 h seed imbibition (0.251 in PC2; Table A1), water imbibition expressed by seed mass in all times with scores ranging from 0.201 to 0.243 (Table A1), and EC in all times with scores ~0.183 (Table A1), these components permit us to infer that the physical and biochemical constitution of the seeds were the main reason to group this species due to these species had classified into oilseed and fibrous seeds (more detail in discussion). The M. glabra is very distinct from the other species because this species shows high water imbibition in all evaluated times, with scores ranging from −0.175 to −0.197 in PC1 (Table A1) and high relative water imbibition after 12h (0.217 and −0.153, respectively in PC1 and PC2). This species did not cluster in any group (Figure 10).

4. Discussion

This study shows how the seed imbibition of different species takes place, from those that can be cultivated, as A. hypogaea, C. maxima, and H. annuus, to those that can be used for the restoration of forests and theme parks or for the urbanization of cities, such as A. blanchetti, A. squamosa, E. oleraceae, J. curcas, L. rigida, M. glabra, and S. tuberosa. This study shows how each of the 14 species absorbs water, the water volume absorbed by the seeds, the imbibition speed, and the minimum time needed to obtain maximum seed hydration with less electrolyte leakage and higher germination potential. We show a relationship between seed weight and water imbibition or water imbibition per gram of seed. Germination and MGT were evaluated in all species, as well as the water potential and seed respiration rate. Finally, this study proposed a classification of species based on dendrogram analysis.
In accordance with Baskin and Baskin [40] and Foschi et al. [41] water uptake by seeds is triphasic. Phase I presents a fast water uptake, followed by phase II, where water absorption by the seeds is more established, reaching a plateau. Phase III is known as the post-germination phase of water uptake, which is determined by primary root protrusion with a significant increase in seed moisture, and only viable seeds can reach this phase [42]. It is very common that the fast water uptake into phase I causes changes in membrane permeability due to the change from the gel state to the liquid–crystalline state [42], characteristic of normally hydrated membranes. The duration of phase II and the imbibed water volume depends on the water potential of the medium, the temperature and the presence or not of dormancy [43]. Although many scholars consider phase III [40,42] as a seed imbibition phase, in this study we did not consider phase III as the seed imbibition phase. As shown in Figure 1, Figure 2 and Figure 3 in the first hours, water absorption is very intense but usually decreases after the first 24 or 48 h. This pattern is true in general species, which diverges from the profile of M. glabra and P. juliflora, which despite showing a slight tendency to stabilize, this water imbibition did not completely occur within the first 120 h of imbibition.
At the beginning of imbibition, the matric component of the seeds is the main component responsible for the movement of water, tending to increase as free water availability and the seed metabolism, within the osmotic component increases its participation in the process [43]. The water potential values in a quiescent seed are very variable, lying between −50 MPa and −400 MPa, producing a relatively high water gradient between the seed and the imbibition water (~0 MPa).
In accordance with Moncaleano-Escandon [21], the deterioration process begins with the loss of selective permeability of the cellular membranes and ends with the loss of the germination capacity. Water is distributed in crevices, cracks, and flaws in the seed cover, and is absorbed by the seed tissues [44]. Water-uptake measurements, taken during this phase have shown these rates to be: (1) temperature-dependent; and (2) accompanied by increases in respiration rate and in light sensitivity in some seed species [21,25,45,46]. These observations suggest that water uptake during imbibition is not a ‘passive’ process, as it is usually taken to be, but becomes an active one at an early stage of this phase, maybe promoted by aquaporins [47]. This phase is marked by an asymptotic approach to a final water gain, or hydration level, which depends on ambient soil–water potential, the conductivity of the soil to water, the seed–soil contact, and seed composition. For imbibition, the tissues surrounding the seed must be permeable to water. This permeability difference is strongly demonstrated with the ultrastructural analyzes of A. squamosa and J. curcas. Macroscopically, the two seeds resemble each other in a reasonably ovoid shape; however, the J. curcas seed is rougher [48] than the A. squamosa seed, a fact that was easily evidenced through the SEM analysis (Figure 9). According to the ultrastructural analyzes of A. squamosa seeds, a large number of fibers was verified, which corroborates the data presented by Singh, et al. [49] who describe the A. squamosa seed as being a seed formed by transversal, longitudinal, and diagonal fibers and the inner integument or tegmen. Bayer and Appel [50] argue that A. squamosa seed is frequently consisted of oils and phenolic substances. This more oleaginous characteristic of the integument was also reported in ontogenetic studies of fruiting and seed formation in species of the Annonaceae family [51] while the abundance of fibers in the integument was described by Svoma [52]. The J. curcas seeds are bitegmented and show well-defined testa and tegmen [53]. However, some exotesta cells are not lignified throughout the seed [53]. The inner portion of the J. curcas seed coat houses numerous macrosclereids which are closely related to the seed rigidity and waterproofing [53,54]. Although macrosclereids can impose seed tegumentary dormancy in many species, Corte-Real et al. [53] describe that in J. curcas, the macrosclereids present in the exotesta do not impose this physical barrier to the passage of water and gases. This characteristic of the Jatropha seed is corroborated by other previous studies [48]. This large concentration of pores in the integument makes the seed more fragile and easily ruptured [48,55], as was verified in this study, where J. curcas seeds have one of the lowest values of integument hardness (Figure 7). Tavecchio et al. [48] describe the J. curcas seed tegument as very dark brown, smooth with porous texture and with small cracks that are more evident in the ventral zone. In M. glabra, the seed may be regarded as ruminate because in the desiccated state, the cotyledons are highly convoluted as previously reported to mopane [56,57]. Our study showed that the M. glabra seed coat corresponds to the convolutions of the cotyledons so that the seeds appear highly corrugated in surface view.
With the concept of permeability, [58] classifies the permeability of seeds as having impermeable envelopes (i.e., they prevent the entry of water inside the seed), partially permeable (reduces the imbibition speed), or totally permeable (does not affect the imbibition speed). Imbibition is one of the first steps in breaking dormancy and initiating the germination of a seed [59]. Corte-Real et al. [53] describe that the hard seed coat species presented a smooth and long phase I and shows an absence or a very short phase II, a fact that diverges with the data from the current study. Even in E. oleraceae and S. tuberosa, the full imbibition seems to be completed after 72h. However, the stabilization of water intake is complete after 24 h in C. maxima and J. curcas. In some Leguminosae species, the seed coat is highly permeable promoting fast water imbibition [56,57], a fact confirmed in A. hypogaea, where the seed imbibition is complete after the first 24 h. In another way, P. juliflora the presence of endocarp strongly attached seeds, leads to complete germination delay due to the impermeability of the seed coat [60]. Some protocols [60,61] were developed to promote seed germination in P. juliflora and some describe that the removal of the endocarp strongly favors the imbibition and germination of the seed. In this study, we showed that seed imbibition is directly proportional to seed germination, since M. glabra absorbed 3.7-fold water and 120 h-imbibed-seeds germinate 1.9-fold greater than non-imbibed seeds. On the other hand, it can be seen with the species E. oleraceae that absorbed 1.1-fold water promoted a 1.1-fold greater germination in 120 h-imbibed-seeds in comparison to non-imbibed seeds. M. glabra seeds are highly convoluted in the dry state. These ridges are possibly due to the overlapping of integuments, a condition that is caused by proliferous seed expansion inside the confined space of the fruit locule, as reported in mopane seeds [56]. This characteristic of the M. glabra would cause higher seed imbibition.
Imbibition of dry seed results in reconstituting the bilayer configuration of membranes, which are related to the composition of phospholipids [3]. Thus, an exudation of electrolytes from all seed species can be correlated with the leaching of soluble carbohydrates and amino acids, it probably reflected the loss of all soluble cell constituents as reported in peas [62] Alstonia boonei [63], fava beans [64], soybean [65], and others [64,66].
Diakaki et al. [66] observed that after a 12 h imbibition period, the low-quality seed lots generally generated exudates of a darker hue on moistened paper towels, which can be indicative of the physiological quality level of the seed lots. Changes in phospholipid composition accompanying environmental stress have been widely reported in the studies of membrane stabilization [67]. According to a model proposed to explain adaptive changes in cell membranes from environmental perturbations [68], the stability of the biomembranes depends on an appropriate balance of bilayer/non-bilayer-forming lipids. It is known that phosphatidyl-choline (PC) tends to form a bilayer configuration under physiological conditions, whereas phosphatidyl-ethanolamine (PE) orients into an inverted hexagonal configuration [69]. The increase in PC/PE ratio results in a more fluid lipid matrix, which tends to lower the phase transition temperature of a membrane fraction, and then a more stabilized membrane, with a decrease in the conductivity changes during imbibition [70]. From the point of view of evolution, the permeability of the seminal envelope and the germination rate are important characteristics that guarantee the perpetuation of species under unfavorable climatic conditions such as water stress [71].
In this study, we describe the strongest increase in water imbibition as seed weight increases. However, when the data is expressed in grams of water per gram of seeds, the pattern is very confusing, contrasting with the concept that heavier seeds imbibed more and faster than the smallest seeds or those with a smooth integument [72]. Moreover, other factors could be acting in the seed imbibition, such as the hardness of seed coat as demonstrated here by E. oleraceae, P. juliflora, and S. tuberosa, the composition of seed reserves, where reserves rich in carbohydrates and proteins tend to imbibe more water than oilseed species [43,73] and osmotic potential, where seeds with lesser osmotic potential show greater water imbibition than seeds with less negative osmotic potential. However, the osmotic potential does not act alone, but in synchrony with the surface in contact with water, the integument hardness, and the biochemical constitution of the reserves. Starchy seeds tend to absorb more water than protein seeds which, in turn, present a higher imbibition rate than oilseeds.
Many species have harder seed coats, which are impermeable to water. Water content in seeds with impermeable seed coats has important implications for germination because impermeable coats prevent germination until environmental conditions promote water absorption by seeds and germination follows [74,75]. In agreement with Corte-Real et al. [53], the inner portion of the J. curcas seed coat houses numerous macrosclereids which are closely related to the seed rigidity and waterproofing [54]. In this species the presence of sclerified cells as well as the macrosclereids present in the exotesta can prevent the water and gases flux to the embryo during development [76], resulting in seed dormancy. Corte-Real et al. [53] describe that dried J. curcas seeds present a water potential of −63.1 ± 0.5 MPa, which quickly increases to −0.7 ± 0.2 MPa in the first 12 h of water imbibition. In this lag phase, the seed water content is increased up to 600% compared to that of dried J. curcas seeds. This is possible due to the numerous micropores that this seed species has in its seed coat [53]. This strong presence of pores in the outermost integument may be one of the factors that culminate in a strong and continuous electrolyte leakage by this species during the imbibition process, which can be considered the cause of decreased germination of the imbibed J. curcas seeds as previously described by Lozano-Isla et al. [77] and confirmed in this study.
In general, intact seeds with a good germination capacity have a more organized membrane structure and reduced respiration rates in dehydrated seeds [78]. Therefore, both features can be used as a toll of the analyzed seed lot. However, the seed respiration rate measurement is not easy to process, requiring the analysis of germination-related enzyme activity, an expression of genes to α-glucosidases or the measurement of CO2 or O2 produced/consumed at intervals of time [79,80]. In this sense, we can argue that seed respiration analysis is a better technique but restricted to some costly laboratories. In comparison, the imbibition technique and measuring the electrical conductivity is easy to do, cheap and reliable, and can be substituted for the use of costly techniques. This technique is frequently used to test viability in seed laboratories around the world [26,81,82,83] and its use has shown good reliable results, and thus, can be recommended. The modest correlation (r = 0.301; p = 0.024) between EC and seed respiration and a high correlation (r = 0.628; p = 1.25 × 10⁻⁵) between seed respiration and seed germination lead us to argue that the EC technique is a very reliable method to determine seed viability and to test a seed lot.
Seedling production must be improved. For this, we must greatly improve and expand knowledge about seed physiology, which involves the imbibition processes, seed quality assessments, the seed germination potential after the imbibition process, and the production methods of seedlings, especially native and which have very hard integument. In this sense, we believe that efforts such as those presented in this article should be expanded and the current ones reinforced, as this is the only way we can meet the goals already established and agreed to.

5. Conclusions

In this study we verified that seed water imbibition is governed more by the difference between seed osmotic potential and the surrounding media; however, seed weight, seed hardness, and the contact surface have been demonstrable to have a significant role in seed imbibition. Seed hardness is one of the characteristics that negatively influences seed imbibition and seed germination, while seed electrolyte leakage would be one cause of the reduction of seed germination. Malpighia glabra seeds presented the highest relative water imbibition, perhaps governed by its highly convoluted tissue in the dry state. The mean germination time often falls in the same proportion that seed water status increases. Finally, through dendrogram distance, we can classify the seed into three groups such as amylaceous seeds, hardness integument seeds, and oil and fiber seed species were confirmed by dendrogram distance between the groups. However, M. glabra seeds do not seem to be another seed classification, because its seeds are able to be imbibed 4.2-fold in water in the base of dry seed weight.

Supplementary Materials

The following supporting information can be downloaded at: https://www.mdpi.com/article/10.3390/su15065394/s1, Figure S1. Experimental draw containing 20 true repetition. Figure S2. Original photos of all studied species. Figure S3. Imbibition curves of the first 12 h of Allamanda blanchetti (A), Annona squamosa (B), Arachis hypogaea (C), Calotropis procera (D), Cucurbita maxima (E), Euterpe olereaceae (F), Gossypium hirsutum (G), Helianthus annuus (H), Jatropha curcas (I), Licania rigida (J), Malpighia glabra (K), Moringa oleifera (L), Prosopis juliflora (M), and (N) seeds. The mean differences between the imbibition time are represented by the lowercase letters (SNK, p ≤ 0.05). Each point represent the mean (±SE) of 20 repetitions. Figure S4. Methodology drawned aiming to make the methodology more simplified. Figure S5. Principal component analysis showing the cluster formations.

Author Contributions

Conceptualization, M.F.P.; validation, M.F.P.; formal analysis, M.F.P.; investigation, M.F.P.; data curation, M.F.P.; writing—original draft, M.F.P.; writing—review and editing, M.F.P.; visualization, M.F.P., A.J.-O. and L.A.R.-P.; supervision, A.J.-O. and L.A.R.-P. All authors have read and agreed to the published version of the manuscript.

Funding

This research received no external funding.

Institutional Review Board Statement

Not applicable.

Informed Consent Statement

Not applicable.

Data Availability Statement

Not applicable.

Conflicts of Interest

The authors declare no conflict of interest.

Appendix A

Figure A1. Correlation matrix, showing all pairwise correlations between physiological, morphological, and nutritional features. The color code follows the scale. An asterisk (*) denote significant correlation (p < 0.05).
Sustainability 15 05394 g0a1
Table A1. Autovectors to Principal component analysis.
VariablePC1PC2PC3PC4PC5PC6PC7PC8PC9PC10
Seed fresh weight−0.206−0.130.251−0.1030.0110.0250.133−0.0020.014−0.127
Integument hardness−0.096−0.157−0.090.376−0.1210.1−0.2550.169−0.0180.115
Water embebition after 5 h−0.197−0.1060.278−0.144−0.0030.0080.025−0.0660.0130.09
Water embebition after 12 h−0.189−0.090.306−0.134−0.031−0.0010.004−0.0450.0330.098
Water embebition after 48 h−0.177−0.0730.336−0.115−0.0870.0050.0140.0030.0740.003
Water embebition after 96 h−0.175−0.0720.339−0.106−0.0990.0040.0150.0150.094−0.01
Water embebition after 120 h−0.175−0.0720.34−0.103−0.1020.0050.010.0180.096−0.005
Conductivity of water after 5 h0.184−0.274−0.005−0.1640.0390.060.0640.133−0.042−0.098
Conductivity of water after 12 h0.184−0.274−0.004−0.1650.0410.060.0630.134−0.044−0.093
Conductivity of water after 48 h0.184−0.274−0.002−0.1680.0430.0610.0620.135−0.049−0.089
Conductivity of water after 96 h0.183−0.2740−0.170.0410.0630.0640.137−0.048−0.092
Conductivity of water after 120 h0.183−0.2740−0.170.0410.0630.0650.137−0.05−0.089
Water embebition per seed gram after 5 h0.243−0.0450.106−0.017−0.148−0.2010.048−0.147−0.10.204
Water embebition per seed gram after 12 h0.2320.0050.1530.055−0.206−0.222−0.013−0.045−0.0440.11
Water embebition per seed gram after 48 h0.2050.0460.1860.125−0.254−0.219−0.0780.1050.019−0.1
Water embebition per seed gram after 96 h0.2020.050.170.142−0.27−0.221−0.0670.132−0.017−0.112
Water embebition per seed gram after 120 h0.2010.0490.1670.148−0.278−0.213−0.0740.148−0.028−0.108
Conductivity of water per seed gram after 5 h0.1980.0980.2260.1910.1180.1190.0580.0290.097−0.123
Conductivity of water per seed gram after 12 h0.2070.1130.1670.1110.2330.1960.122−0.0740.04−0.067
Conductivity of water per seed gram after 48 h0.1810.1490.2050.1560.2180.1990.069−0.0660.037−0.061
Conductivity of water per seed gram after 96 h0.1860.1440.2410.120.1890.1620.0670.035−0.049−0.018
Conductivity of water per seed gram after 120 h0.1830.1610.2230.1020.2020.1670.1120.011−0.140.065
Relative water imbibition after 12 h 0.217−0.153−0.052−0.2140.008−0.0410.066−0.202−0.1450.143
Water potential in non-imbibed seeds−0.091−0.1480.0180.2110.369−0.2960.1710.230.560.137
Water potential in 120 h-imbibed seeds0.1880.1550.007−0.2330.0350.026−0.138−0.3560.2880.07
Relative Water Content in non-imbibed seeds−0.002−0.257−0.0660.2590.235−0.3580.2480.062−0.110.052
Relative Water Content in 120 h-imbibed seeds0.190.003−0.03−0.1690.128−0.3720.05−0.4140.1850.111
Seed germination in non-imbibed seeds−0.1640.2490.038−0.0780.097−0.1220.3090.028−0.5480.097
Seed germination in 120 h-imbibed seeds−0.1350.251−0.064−0.095−0.06−0.2980.440.0250.004−0.32
Mean germination time in non-imbibed seeds−0.106−0.2510.090.2230.117−0.061−0.298−0.44−0.155−0.158
Mean germination time in 120 h-imbibed seeds−0.1−0.2510.1320.2360.229−0.157−0.101−0.222−0.308−0.157
Respiration rate in non-imbibed seeds−0.0170.195−0.003−0.2550.294−0.238−0.4260.141−0.009−0.584
Respiration rate in 120 h-imbibed seeds0.0250.1520.143−0.2210.32−0.218−0.3890.357−0.1820.482

References

  1. Rajjou, L.; Lovigny, Y.; Job, C.; Belghazi, M.; Groot, S.; Job, D. Seed quality and germination. In Seeds: Biology, Development and Ecology; Adkins, S., Ashmore, S., Navie, S.C., Eds.; CABI Pubishing: Wallingford, UK, 2007; pp. 324–332. [Google Scholar]
  2. Bewley, J.D.; Black, M. Seeds: Physiology of Development and Germination; Plenum Press: New York, NY, USA, 1994; p. 444. [Google Scholar]
  3. Bewley, J.D.; Black, M. Physiology and Biochemistry of Seeds Relation to Germination; Springer: Berlin/Heidelberg, Germany, 1985; p. 367. [Google Scholar]
  4. Gallardo, K.; Job, C.; Groot, S.P.C.; Puype, M.; Demol, H.; Vandekerckhove, J.; Job, D. Proteomic analysis of Arabidopsis seed germination and priming. Plant Physiol. 2001, 126, 835–848. [Google Scholar] [CrossRef] [PubMed] [Green Version]
  5. Cardoso, V.J.M. Germinação. In Fisiologia Vegetal, 2nd ed.; Kerbauy, G.B., Ed.; Guanabara Koogan: Rio de Janeiro, Brazil, 2008; pp. 384–408. [Google Scholar]
  6. MacCallum, K. Acesso Aberto: Uma Estrutura para Restauração Inteligente em Termos Climáticos. Available online: www.ser.org (accessed on 25 November 2022).
  7. Derero, A.; Coe, R.; Muthuri, C.; Hadgu, K.M.; Sinclair, F. Farmer-led approaches to increasing tree diversity in fields and farmed landscapes in Ethiopia. Agrofor. Syst. 2021, 95, 1309–1326. [Google Scholar] [CrossRef]
  8. Doran, J.C. Seed, nursery practice and establishment. In The Major Invertebrate Pests and Weeds of Agriculture and Plantation Forestry in the Southern and Western Pacific; Waterhouse, D.F., Ed.; The Australian Centre for International Agricultural Research: Canberra, ACT, Australia, 1997; pp. 1–29. [Google Scholar]
  9. Castro, J.A.; Morales-Rueda, F.; Alcaraz-Segura, D.; Tabik, S. Forest restoration is more than firing seeds from a drone. Restor. Ecol. 2023, 31, E13736. [Google Scholar] [CrossRef]
  10. Ngulube, M.R. Seed germination, seedling growth and biomass production of eight Central-American multipurpose trees under nursery conditions in Zomba, Malawi. For. Ecol. Manag. 1989, 27, 21–27. [Google Scholar] [CrossRef]
  11. Alouani, M.; Bani-Aameur, F. Argan (Argania spinosa (L.) Skeels) seed germination under nursery conditions: Effect of cold storage, gibberellic acid and mother-tree genotype. Ann. For. Sci. 2004, 61, 191–194. [Google Scholar] [CrossRef] [Green Version]
  12. Li, W.; Wang, J.; Zhang, X.; Shi, S.; Cao, W. Effect of degradation and rebuilding of artificial grasslands on soil respiration and carbon and nitrogen pools on an alpine meadow of the Qinghai-Tibetan Plateau. Ecol. Eng. 2018, 111, 134–142. [Google Scholar] [CrossRef]
  13. Prach, K.; Jongepierová, I.; Řehounková, K.; Fajmon, K. Restoration of grasslands on ex-arable land using regional and commercial seed mixtures and spontaneous succession: Successional trajectories and changes in species richness. Agric. Ecosyst. Environ. 2014, 182, 131–136. [Google Scholar] [CrossRef]
  14. Kuusipalo, J.; Ådjers, G.; Jafarsidik, Y.; Otsamo, A.; Tuomela, K.; Vuokko, R. Restoration of natural vegetation in degraded Imperata cylindrica grassland: Understorey development in forest plantations. J. Veg. Sci. 1995, 6, 205–210. [Google Scholar] [CrossRef]
  15. Zipperer, W.C.; Sisinni, M.S.; Pouyat, R.V. Urban tree cover: An ecological perspective. Urban Ecosyst. 1997, 1, 229–246. [Google Scholar] [CrossRef]
  16. UNDP. UN Decade on Ecosystem Restoration: Empowering Stakeholders to Prevent, Halt, and Reverse the Degradation of Global Ecosystems. Available online: https://mptf.undp.org/fund/der00?utm_source=EN&utm_medium=GSR&utm_content=US_UNDP_PaidSearch_Brand_English&utm_campaign=CENTRAL&c_src=CENTRAL&c_src2=GSR&gclid=Cj0KCQiA8aOeBhCWARIsANRFrQHDO-EkuYjOYeRC2W2wmcm5bim0K62t3Zth_80Lxjk2oTx7CLIrdDcaAhb6EALw_wcB (accessed on 19 January 2023).
  17. Piffer, P.R.; Calaboni, A.; Rosa, M.R.; Schwartz, N.B.; Tambosi, L.R.; Uriarte, M. Ephemeral forest regeneration limits carbon sequestration potential in the Brazilian Atlantic Forest. Glob. Chang. Biol. 2022, 28, 630–643. [Google Scholar] [CrossRef]
  18. Barreto, J.R.; Pardini, R.; Metzger, J.P.; Silva, F.A.B.; Nichols, E.S. When forest loss leads to biodiversity gain: Insights from the Brazilian Atlantic Forest. Biol. Conserv. 2023, 279, 109957. [Google Scholar] [CrossRef]
  19. Clement, C.R.; Higuchi, N. A Floresta Amazônica e o futuro do Brasil. Cienc. Cult. 2006, 58, 44–49. [Google Scholar]
  20. Caiado, N.; Guarnieri, P.; Xavier, L.H.; Chaves, G.L.D. A characterization of the Brazilian market of reverse logistic credits (RLC) and an analogy with the existing carbon credit markeT. Resour. Conserv. Recycl. 2017, 118, 47–59. [Google Scholar] [CrossRef]
  21. Moncaleano-Escandon, J.; Silva, B.C.F.; Silva, S.R.S.; Granja, J.A.; Alves, M.C.J.L.; Pompelli, M.F. Germination responses of Jatropha curcas L. seeds to storage and aging. Ind. Crop. Prod. 2013, 44, 684–690. [Google Scholar] [CrossRef]
  22. McDonald, M.B. Seed deterioration: Physiology, repair and assessment. Seed Sci. Technol. 1999, 27, 177–237. [Google Scholar]
  23. Brewer, H.E. Tetrazolium chloride as a test for damage in artificial cured peanuts. Science 1949, 110, 451–452. [Google Scholar] [CrossRef]
  24. Hailstones, M.D.; Smith, M.T. Soya bean seed invigoration by ferrous sulphate: Changes in lipid peroxidation, conductivity, tetrazolium reduction, DNA and protein synthesis. J. Plant. Physiol. 1991, 137, 307–311. [Google Scholar] [CrossRef]
  25. Lozano-Isla, F.; Campos, M.L.O.; Lauricio, E.; Pompelli, M.F. Effects of seed storage time and salt stress on the germination of Jatropha curcas L. Ind. Crop. Prod. 2018, 118, 214–224. [Google Scholar] [CrossRef]
  26. Fessel, S.A.; Vieira, R.D.; Cruz, M.C.P.; Paula, R.C.; Panobianco, M. Electrical conductivity testing of corn seeds as influenced by temperature and period of storage. Pesqui. Agropecu. Bras. 2006, 41, 1551–1559. [Google Scholar] [CrossRef] [Green Version]
  27. Hilst, P.C.; Dias, D.C.F.S.; Alvarenga, E.M.; Souza, B.L. Test of exudates color hues for evaluating the physiological potential of coffee (Coffea arabica L.) seeds. J. Seed Sci. 2012, 34, 212–217. [Google Scholar] [CrossRef]
  28. Demir, I.; Kenamoglu, B.B.; Özden, E. Seed vigour tests to estimate seedling emergence in cress (Lepidium sativum L.) seed lots. Not. Bot. Horti. Agrobot. 2019, 47, 881–886. [Google Scholar] [CrossRef] [Green Version]
  29. WFO. The Plant List Version 1.1. Snapshot of the Taxonomy. Available online: http://www.theplantlist.org/ (accessed on 1 January 2023).
  30. Campbell, E.C.; Campbell, G.S.; Barlow, W.K. A dewpoint hygrometer for water potential measurement. Agric. Meteorol. 1973, 12, 113–121. [Google Scholar] [CrossRef]
  31. Allen, E.; Alvarez, S. International Rules for Seed Testing 2020; The International Seed Testing Association: Bassersdorf, Switzerland, 2020. [Google Scholar]
  32. Lozano-Isla, F.; Alfaro, O.B.; Pompelli, M.F. GerminaR: An R package for germination analysis with the interactive web application ‘GerminaQuant for R’. Ecol. Res. 2019, 34, 339–346. [Google Scholar] [CrossRef]
  33. Karnovsky, M.J. A formaldehyde-glutaraldehyde fixative of high osmolality for use in electron microscopy. J. Cell Biol. 1965, 27, 137–138. [Google Scholar]
  34. Pompelli, M.F.; Jarma-Orozco, A.; Rodríguez-Paéz, L.A. Screening of morphophysiological, anatomical, and ultrastructural traits to improve the elite genotype selection in sugarcane (Saccharum officinarum L.). Horticulturae 2022, 8, 1069. [Google Scholar] [CrossRef]
  35. Bhatt, A.; Daibes, L.F.; Gallacher, D.; Jarma-Orozco, A.; Pompelli, M.F. Water stress inhibits germination while maintaining embryo viability of subtropical wetland seeds: A functional approach with phylogenetic contrasts. Front. Plant. Sci. 2022, 13, 906771. [Google Scholar] [CrossRef]
  36. Bhatt, A.; Gallacher, D.; Jarma-Orozco, A.; Pompelli, M.F. Seed mass, dormancy and germinability variation among maternal plants of four Arabian halophytes. Seed Sci. Res. 2022, 32, 53–61. [Google Scholar] [CrossRef]
  37. Iqbal, W.; Afridi, M.Z.; Jamal, A.; Mihoub, A.; Saeed, M.F.; Székely, Á.; Zia, A.; Khan, M.A.; Jarma-Orozco, A.; Pompelli, M.F. Canola seed priming and its effect on gas exchange, chlorophyll photobleaching, and enzymatic activities in response to salt stress. Sustainability 2022, 14, 9377. [Google Scholar] [CrossRef]
  38. Jolliffe, I.T.; Allen, O.B.; Christie, B.R. Comparison of variety means using cluster analysis and dendrograms. Exp. Agric. 1989, 25, 259–269. [Google Scholar] [CrossRef]
  39. Forina, M.; Armanino, C.; Raggio, V. Clustering with dendrograms on interpretation variables. Anal. Chim. Acta 2002, 454, 13–19. [Google Scholar] [CrossRef]
  40. Baskin, C.C.; Baskin, J.M. Seeds: Ecology, Biogeography and Evolution of Dormancy and Germination, 2nd ed.; Academic Press: London, UK, 2014. [Google Scholar]
  41. Foschi, M.L.; Juan, M.; Pascual, B.; Pascual-Seva, N. Water uptake and germination of caper (Capparis spinosa L.) seeds. Agronomy 2020, 10, 838. [Google Scholar] [CrossRef]
  42. Bewley, J.D.; Black, M. Physiology and Biochemistry of Seeds in Relation to Germination: Volume 2. Viability, Dormancy, and Environmental Control; Springer Science & Business Media: Berlin/Heidelberg, Germany, 2012. [Google Scholar]
  43. Bewley, J.D.; Bradford, K.J.; Hilhorst, H.W.M.; Nonogaki, H. Seeds: Physiology of Development, Germination and Dormancy, 3rd ed.; Springer: New York, NY, USA, 2013. [Google Scholar]
  44. Zhu, Z.H.; Sami, A.; Chen, Z.P.; Fatima, M.; Zheng, W.Y.; Xu, Q.Q.; LeI, Y.H.; Jin, X.Z.; Zhang, H.; Li, Y.; et al. Effects of microscopic testa color and morphologyon the water uptake ability and drought tolerance of germination-stage rapeseed (Brassica napus L.). Bioengineered 2021, 12, 9341–9355. [Google Scholar] [CrossRef] [PubMed]
  45. Vertucci, C.W.; Leopold, A.C. Bound water in soybean seed and its relation to respiration and imbibitional damage. Plant Physiol. 1984, 75, 114–117. [Google Scholar] [CrossRef]
  46. Booth, D.T.; Sowa, S. Respiration in dormant and non-dormant bitterbrush seeds. J. Arid. Environ. 2001, 48, 35–39. [Google Scholar] [CrossRef]
  47. Phan, T.T.; Tyerman, S.D.; Schnell, N.; Tucker, M.; McGaughey, S.A.; Qiu, J.; Groszmann, M.; Byrt, C.S. Deciphering aquaporin regulation and roles in seed biology. J. Exp. Bot. 2020, 71, 1763–1773. [Google Scholar] [CrossRef]
  48. Tavecchio, N.E.M.; Vigliocco, A.E.; Terenti, O.A.; Wassner, D.; Reinoso, H.E.; Pedranzani, H.E. Jatropha curcas L. and J. macrocarpa Griseb: Seed morphology, viability, dormancy, germination and growth of seedlings. Am. J. Plant. Sci. 2018, 9, 1835–1854. [Google Scholar] [CrossRef] [Green Version]
  49. Singh, P.; Singh, K.R.B.; Singh, J.; Das, S.N.; Singh, R.P. Tunable electrochemistry and efficient antibacterial activity of plant-mediated copper oxide nanoparticles synthesized by Annona squamosa seed extract for agricultural utility. RSC Adv. 2021, 11, 18050. [Google Scholar] [CrossRef] [PubMed]
  50. Bayer, C.; Appel, O. Ocurrence and taxonomic significance of ruminate endosperm. Bot. Rev. 1996, 62, 301–310. [Google Scholar] [CrossRef]
  51. Svoma, E. Studies on the embryology and gynoecium structures in Drimys winteri (Winteraceae) and some Annonaceae. Plant Syst. Evol. 1998, 209, 205–229. [Google Scholar] [CrossRef]
  52. Svoma, E. Seed development and function in Artabotrys hexapetalus (Annonaceae). Plant Syst. Evol. 1997, 207, 205–223. [Google Scholar] [CrossRef]
  53. Corte-Real, N.; Endres, L.; Santos, K.P.O.; Figueirêdo, R.C.B.; Arruda, E.C.P.; Ulisses, C.; Pompelli, M.F. Morphoanatomy and ontogeny of the fruit and seeds of Jatropha curcas L.: A promising biofuel plant. In The Promising Future of Jatropha curcas: Proprieties and Potential Applications; Segura-Campos, M.R., Betancur-Ancova, D., Eds.; Nova Science Publishers, Inc.: Hauppauge, NY, USA, 2016; pp. 141–158. [Google Scholar]
  54. Gopinathan, M.C.; Babu, C.R. Structural diversity and its adaptive significance in seeds of Vigna minima (Roxb.) Ohwi and Ohashi and its Allies (Leguminosae-Papilionoideae). Ann. Bot. 1985, 56, 723–732. [Google Scholar]
  55. Dong Ping, W.; Jian Feng, W.; Xuan Ke, W.; Xue Qin, H.; Jiang Ru, H.; Huan Yu, L. Study on seed morphology and seedling growth of different ranks of Jatropha curcas L. J. Henan Agric. Sci. 2015, 44, 131–135. [Google Scholar]
  56. Jordaan, A. Ultrastructure and histochemistry of seeds of Colophospermum mopane during imbibition. S. Afr. J. Bot. 2008, 74, 591–597. [Google Scholar] [CrossRef]
  57. Jordaan, A.; Wessels, D.C.J. The aril of Colophospermum mopane. Its role during seed germination and fruit opening. S. Afr. J. Bot. 1999, 65, 392–397. [Google Scholar] [CrossRef] [Green Version]
  58. McDonald, M.B., Jr.; Vertucci, C.W.; Roos, E.E. Soybean seed imbibition: Water absorption by seed parts. Crop. Sci. 1988, 28, 993–997. [Google Scholar] [CrossRef]
  59. Keim, P.; Diers, B.W.; Shoemaker, R.C. Genetic analysis of soybean hard seededness with molecular markers. Theor. Appl. Genet. 1990, 79, 465–469. [Google Scholar] [CrossRef]
  60. Miranda, R.Q.; Oliveira, M.T.P.; Correia, R.M.; Almeida-Cortez, J.S.; Pompelli, M.F. Germination of Prosopis juliflora (Sw) DC seeds after scarification treatments. Plant Species Biol. 2011, 26, 186–192. [Google Scholar] [CrossRef]
  61. Vilela, A.E.; Ravetta, D.A. The effect of radiation on seedling growth and physiology in four species of Prosopis L. (Mimosaceae). J. Arid. Environ. 2000, 44, 415–423. [Google Scholar] [CrossRef]
  62. Rahoui, S.; Chaoui, A.; El Ferjani, E. Membrane damage and solute leakage from germinating pea seed under cadmium stress. J. Hazard. Mater. 2010, 178, 1128–1131. [Google Scholar] [CrossRef]
  63. Olanlokun, J.O.; Oyebode, O.T.; Popoola, D.; Bodede, O.; Idowu, T.O.; Moodley, R.; Olorunsogo, O.O. In vitro effects of 2-methyl-3-propylbutane-1,4-diol purified from Alstonia boonei on erythrocyte membrane stabilization and mitochondrial membrane permeabilization. Chem. Biol. Drug Des. 2023, 101, 678–689. [Google Scholar] [CrossRef]
  64. Simões, L.A.; Fernandes, N.A.T.; dos Santos Junior, N.A.; Dias, D.R. Biosurfactants and their benefits for seeds. In Advancements in Biosurfactants Research; Aslam, R., Mobin, M., Aslam, J., Zehra, S., Eds.; Springer: London, UK, 2023. [Google Scholar]
  65. Thakur, P.S.; Tiwari, B.; Kumar, A.; Gedam, B.; Bhatia, V.; Krejcar, O.; Dobrovolny, M.; Nebhen, J.; Prakash, S. Deep transfer learning based photonics sensor for assessment of seed-quality. Comput. Electron. Agric. 2022, 196, 106891. [Google Scholar] [CrossRef]
  66. Diakaki, M.; Van der Heijden, L.; Lopez-Reyes, J.; Van Nieuwenhoven, A.; Notten, M.; Storcken, M.; Butterbach, P.; Köhl, J.; Boer, W.; Postma, J. Beetroot and spinach seed microbiomes can suppress Pythium ultimum infection: Results from a large-scale screening. Seed Sci. Res. 2022, 32, 274–282. [Google Scholar] [CrossRef]
  67. Thompson, G.A. Mechanisms of membrane response to environmental stress. In Frontiers of Membrane Research in Agriculture; John, J.B.S., Berlin, E., Jackson, P.C., Eds.; Rowman & Allanheld: Ottawa, ON, Canada, 1985; p. 512. [Google Scholar]
  68. Quinn, P.L. Models for adaptive changes in cell membranes. Biochem. Soc. Trans. 1983, 11, 329–331. [Google Scholar] [CrossRef] [Green Version]
  69. Gagné, J.; Stamatatos, L.; Diacovo, T.; Hui, S.W.; Yeagle, P.L.; Silvius, J.R. Physical properties and surface interactions of bilayer membrane containing N-methyl- ated phosphatidylethanolamine. Biochemistry 1985, 24, 4400–4408. [Google Scholar] [CrossRef]
  70. Chen, Y.; Burris, J.S. Effect of seed treatment emulsifiers on seed quality and membrane function in maize. Postharvest Biol. Technol. 1993, 2, 231–239. [Google Scholar] [CrossRef]
  71. Williams, W.A.; Elliot, J.R. Ecological significance of seed coat impermeability to moisture in crimson, subterranean and rose clovers in Mediterranean-type climate. Ecology 1960, 41, 733–742. [Google Scholar] [CrossRef]
  72. Souza, F.H.D.; Marcos-Filho, J. The seed coat as a modulator of seed-environment relationships in Fabaceae. Rev. Bras. Bot. 2001, 24, 365–375. [Google Scholar] [CrossRef] [Green Version]
  73. Aguirre, M.; Kiegle, E.; Leo, G.; Ezquer, I. Carbohydrate reserves and seed development: An overview. Plant Reprod. 2018, 31, 263–290. [Google Scholar] [CrossRef]
  74. Orozco-Almanza, M.S.; Lóon-García, L.P.; Grether, R.; García-Moya, E. Germination of four species of the genus Mimosa (leguminosae) in a semi-arid zone of Central Mexico. J. Arid. Environ. 2003, 55, 75–92. [Google Scholar] [CrossRef]
  75. Swanson, B.G.; Hughes, J.S.; Rasmussen, H.P. Seed microstructure: Review of water imbibition in legumes. Food Microstruct. 1985, 4, 115–124. [Google Scholar]
  76. Oguchi, R.; Hikosaka, K.; Hirose, T. Leaf anatomy as a constraint for photosynthetic acclimation: Differential responses in leaf anatomy to increasing growth irradiance among three deciduous trees. Plant Cell. Environ. 2005, 28, 916–927. [Google Scholar] [CrossRef]
  77. Lozano-Isla, F.; Miranda, P.V.; Pompelli, M.F. Germination behavior of Jatropha curcas L. after different imbibition times. Per. J. Agron. 2017, 1, 32–38. [Google Scholar] [CrossRef]
  78. Mendes, C.R.; De Moraes, D.M.; Lima, M.G.S.; Lopes, N.F. Respiratory activity for the differentiation of vigor on soybean seeds lot. Rev. Bras. Sementes 2009, 31, 171–176. [Google Scholar] [CrossRef]
  79. Muscolo, A.; Panuccio, M.R.; Sidari, M. The effect of phenols on respiratory enzymes in seed germination, respiratory enzyme activities during germination of Pinus laricio seeds treated with phenols extracted from different forest soils. Plant Growth Regul. 2001, 35, 31–35. [Google Scholar] [CrossRef]
  80. Yentur, S.; Leopold, A.C. Respiratory transition during seed germination. Plant Physiol. 1976, 57, 274–276. [Google Scholar] [CrossRef] [Green Version]
  81. Pompelli, M.F.; Ferreira, D.T.R.G.; Cavalcante, P.P.G.S.; Salvador, T.L.; Hsie, B.S.; Endres, L. Environmental influence on the physico-chemical and physiological properties of Jatropha curcas L. seeds. Aust. J. Bot. 2010, 58, 421–427. [Google Scholar] [CrossRef]
  82. Rao, R.G.S.; Singh, P.M.; Rai, M. Storability of onion seeds and effects of packaging and storage conditions on viability and vigour. Sci. Hortic. 2006, 110, 1–6. [Google Scholar] [CrossRef]
  83. Takayanagi, K.; Harrington, J.F. Enhancement of germination rate of aged seeds by ethylene. Plant Physiol. 1971, 47, 521–524. [Google Scholar] [CrossRef] [Green Version]
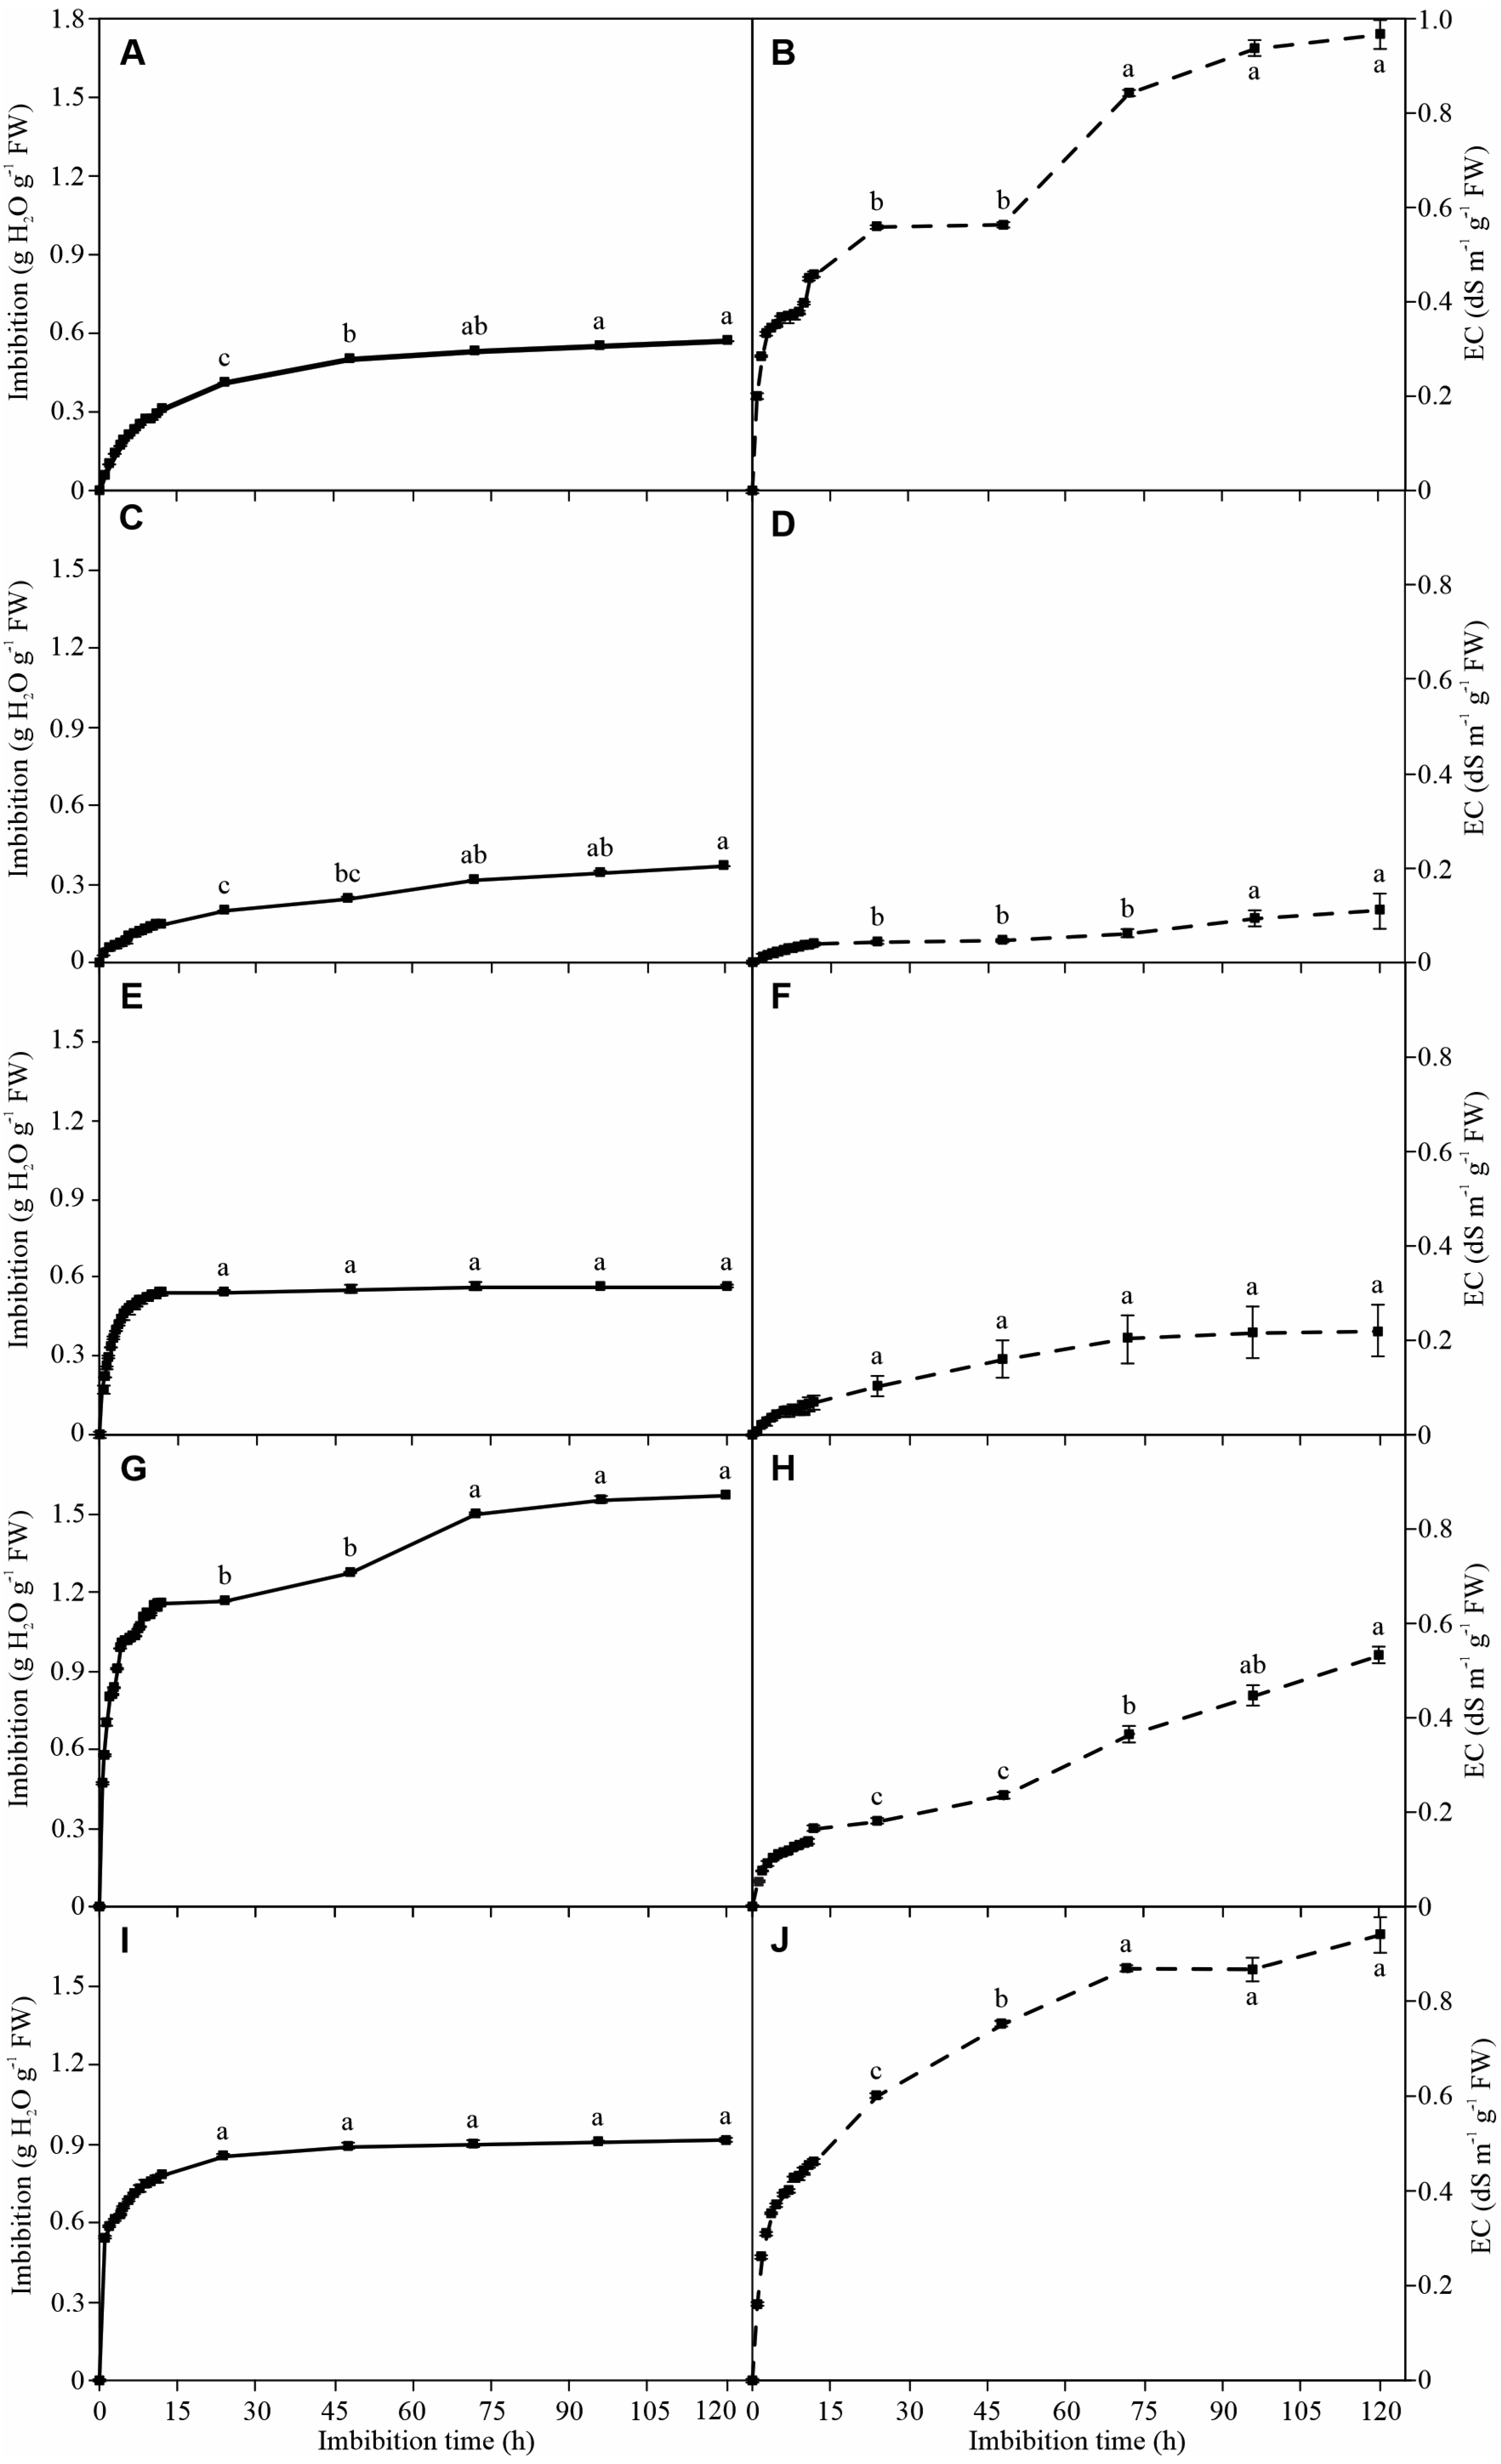
Figure 1. Imbibition curves (A,C,E,G,I) and electrolytes leakage (B,D,F,H,J) of Allamanda blanchetti (A,B), Annona squamosa (C,D), Arachis hypogaea (E,F), Calotropis procera (G,H), and Cucurbita maxima (I,J) seeds. The mean differences between the imbibition time are represented by the lowercase letters (SNK, p ≤ 0.05). Each point represents the mean (±SD), n = 20.
Sustainability 15 05394 g001
Figure 2. Imbibition curves (A,C,E,G,I) and electrolytes leakage (B,D,F,H,J) of Euterpe oleracea (A,B), Gossypium hirsutum (C,D), Helianthus annuus (E,F), Jatropha curcas (G,H), and Licania rigida (I,J) seeds. The mean differences between the imbibition time are represented by the lowercase letters (SNK, p ≤ 0.05). Each point represents the mean (±SD), n = 20.
Sustainability 15 05394 g002
Figure 3. Imbibition curves (A,C,E,G) and electrolytes leakage (B,D,F,H) of Malpighia glabra (A,B), Moringa oleifera (C,D), Prosopis juliflora (E,F), Spondias tuberosa (G,H) seeds. The mean differences between the imbibition time are represented by the lowercase letters (SNK, p ≤ 0.05). Each point represents the mean (±SD), n = 20.
Sustainability 15 05394 g003
Figure 4. Relative water imbibition after 12 h of different plant species. The differences between the means are represented by the lowercase letters (SNK, p ≤ 0.05). Each vertical bars represent the mean (±SE), n = 20.
Sustainability 15 05394 g004
Figure 5. Water imbibition (A) and water imbibition per gram of seed (B) measured at 5 h (red), 12 h (green), 48 h (blue), 96 h (brown), and 120 h (pink) of fourteen species listed in Table 1. The regression fit curve, determination coefficient, and Pvalue were shown. Each point denotes one repetition per treatment (n = 20).
Sustainability 15 05394 g005
Figure 6. Water potential in non-imbibed (dry seeds; blue) and imbibed (wet seeds; red) of different plant species. Each vertical bars repre-sent the mean (±SD), n = 20.
Sustainability 15 05394 g006
Figure 7. Integument hardness (B) of different plant species. The differences between the means are represented by the lowercase letters (SNK, p ≤ 0.05). Each vertical bars represent the mean (±SD), n = 50.
Sustainability 15 05394 g007
Figure 8. Respiration rate of different plant species. The differences between dry and wet seeds are represented by the lowercase letters (SNK, p ≤ 0.05). Each vertical bars represent the mean (±SD), n = 10.
Sustainability 15 05394 g008
Figure 9. Scanning electron microscopy of non-imbibed external integument and pores on the surface in A. squamosa (A,B), J. curcas (CG), and M. glabra (H,I). Scale = (A), 1 mm; (B,C), 250 μm; (DF), 50 μm; (G,H) 25 μm; (I) 3 μm.
Sustainability 15 05394 g009
Figure 10. Dendrogram based on seed features such as starch, oil, fiber, and integument hardness. In the top of figure are showed M. glabra specie, which has longest dendrogram distance between other analyzed species. More details in Appendix ATable A1.
Sustainability 15 05394 g010
Table 1. Scientific name, common name, family, seed number used in each repetition of 14 plant species studied.
Scientific NameCommon NameFamilyN *Sampled **
Allamanda blanchetii A.DC.Purple allamandaApocynaceae8September, 2022.
Annona squamosa L.Sugar-appleAnnonaceae8April, 2022.
Arachis hypogaea L.PeanutLeguminosae5April, 2022.
Calotropis procera (Aiton) Dryand.MilkweedAsclepiadaceae30July, 2022.
Cucurbita maxima subsp. MaximaWinter squashCucurbitaceae8April, 2022.
Euterpe oleracea Mart.Açaí palmArecaceae5September, 2022.
Gossypium hirsutum L.CottonMalvaceae10June, 2022.
Helianthus annuus L.SunflowerCompositae30April, 2022.
Jatropha curcas L.Purging nutEuphorbiaceae5June, 2022.
Licania rigida Benth.OiticicaChrysobalanaceae3August, 2022.
Malpighia glabra L.AcerolaMalpighiaceae5September, 2022.
Moringa oleifera Lam.Drumstick treeMoringaceae5July, 2022.
Prosopis juliflora (Sw.) DC.MesquiteLeguminosae10September, 2022.
Spondias tuberosa ArrudaUmbu plantAnacardiaceae2April, 2022.
* Number of seeds used in each true repetition. ** Sample date or purchase in local trade.
Table 2. Imbibition water of fourteen species ranged in five groups. Each value denotes mean (±SE), n = 20. The mean difference between species as compared to the species is represented by the lowercase letter (SNK, p = 2 × 10⁻¹⁶).
GroupSpeciesWater Imbibition * (mg H2O g−1 Seed)
Group 1E. olareaceae64.82 ± 5.03 j
A. squamosa367.86 ± 29.27 i
L. rigida413.21 ± 8.03 i
Group 2A. hypogaea614.89 ± 45.55 h
A. blanchetti567.76 ± 12.92 h
J. curcas749.62 ± 11.86 g
S. tuberosa770.29 ± 20.19 g
P. juliflora880.50 ± 67.62 f
C. maxima888.63 ± 25.42 f
G. hirsutum997.04 ± 15.80 e
Group 3H. annus1155.10 ± 27.31 d
M. oleifera1251.96 ± 11.82 c
Group 4C. procera1568.67 ± 63.97 b
Group 5M. glabra3173.31 ± 61.96 a
Table 3. Electrical conductivity measured after 1 h (ECi) and after 120 h (ECf) of imbibition, mean seed mass, and electrical conductivity expressed by dS m−1 g−1 seed. Each value denotes mean (±SE), n = 20. The mean difference between species is represented by the lowercase letter (SNK, p = 4 × 10⁻¹⁵).
GroupSpeciesECiECfSeed Mass (g FW)EC (dS m−1 g−1 Seed)
Group 1E. oleracea0.01 ± 0.01 c0.36 ± 0.12 d5.88 ± 0.11 b0.06 ± 0.02 e
M. oleifera0.02 ± 0.01 bc0.14 ± 0.02 d1.29 ± 0.15 g0.11 ± 0.01 de
S. tuberosa0.05 ± 0.01 bc0.31 ± 0.06 d2.76 ± 0.15 e0.11 ± 0.01 de
A. squamosa0.02 ± 0.01 bc0.25 ± 0.06 d2.20 ± 0.01 f0.11 ± 0.03 de
P. juliflora0.01 ± 0.01 c0.05 ± 0.01 d0.38 ± 0.01 j0.13 ± 0.02 de
L. rigida0.06 ± 0.01 b1.60 ± 0.26 b8.07 ± 0.01 a0.20 ± 0.03 de
A. hypogaea0.03 ± 0.01 bc0.74 ± 0.24 c3.02 ± 0.01 d0.25 ± 0.08 d
H. annuus0.02 ± 0.01 bc0.17 ± 0.07 d0.69 ± 0.01 i0.25 ± 0.10 d
Group 2M. glabra0.03 ± 0.01 bc0.09 ± 0.01 d0.20 ± 0.01 l0.46 ± 0.03 c
C. procera0.01 ± 0.01 bc0.10 ± 0.03 d0.19 ± 0.01 m0.56 ± 0.19 c
G. hirsutum0.06 ± 0.01 b0.61 ± 0.13 c1.02 ± 0.01 h0.59 ± 0.12 c
Group 3J. curcas0.46 ± 0.07 a2.59 ± 0.33 a3.16 ± 0.01 c0.82 ± 0.10 b
Group 4C. maxima0.06 ± 0.01 b0.35 ± 0.01 d0.37 ± 0.01 k0.94 ± 0.04 a
A. blanchetti0.02 ± 0.01 bc0.11 ± 0.01 d0.11 ± 0.01 n0.97 ± 0.13 a
The values were ranked to crescent order, where group 1, 2, 3, and 4, respectively enclosed species with electrical conductivity between 0 to 0.25 dS m−1 g−1 seed, 0.26 to 0.60 dS m−1 g−1 seed, 0.61 to 0.90 dS m−1 g−1 seed, and more than 0.90 dS m−1 g−1 seed.
Table 4. Seed germination and mean germination time measured in fourteen species. The differences between non-imbibed and 120 h-imbibed seeds are represented by the lowercase letters (SNK, p ≤ 0.05). Each value represents the mean (±SD), n = 20.
SpeciesGermination (%)Mean Germination Time (Days)
Non-Imbibed120 h-ImbibedNon-Imbibed120 h-Imbibed
A. blanchetii43.87 ± 1.82 b57.11 ± 0.19 a12.55 ± 0.28 a8.45 ± 0.11 b
A. squamosa53.14 ± 0.91 b80.67 ± 0.38 a3.38 ± 0.05 a2.82 ± 0.03 b
A. hypogaea69.05 ± 0.13 b85.02 ± 0.17 a8.52 ± 0.04 a5.06 ± 0.05 b
C. procera81.01 ± 0.16 b99.54 ± 0.09 a5.69 ± 0.23 a4.57 ± 0.11 b
C. maxima57.59 ± 1.10 b66.00 ± 0.80 a8.34 ± 0.16 a4.69 ± 0.21 b
E. oleracea17.87 ± 2.44 a22.85 ± 0.74 a24.09 ± 0.35 b44.60 ± 0.51 a
G. hirsutum75.34 ± 0.49 b89.95 ± 0.21 a1.97 ± 0.08 a1.44 ± 0.13 b
H. annuus66.02 ± 0.32 b97.98 ± 0.08 a4.11 ± 0.22 a1.79 ± 0.03 b
J. curcas84.85 ± 0.50 a63.75 ± 0.59 b8.65 ± 0.04 a7.77 ± 0.05 b
L. rigida80.92 ± 0.37 b96.17 ± 0.30 a10.86 ± 0.31 a6.15 ± 0.04 b
M. glabra10.25 ± 0.24 b19.10 ± 0.62 a8.47 ± 0.32 a 5.92 ± 0.25 b
M. oleifera59.73 ± 0.35 b88.02 ± 0.41 a6.04 ± 0.14 a2.10 ± 0.04 b
P. juliflora37.10 ± 1.23 a42.62 ± 0.42 a6.92 ± 0.12 a2.93 ± 0.19 b
S. tuberosa13.77 ± 0.95 a24.70 ± 0.62 a38.45 ± 0.62 a14.07 ± 0.33 b
Disclaimer/Publisher’s Note: The statements, opinions and data contained in all publications are solely those of the individual author(s) and contributor(s) and not of MDPI and/or the editor(s). MDPI and/or the editor(s) disclaim responsibility for any injury to people or property resulting from any ideas, methods, instructions or products referred to in the content.