1. Introduction
Stereotypes are part of our lives, permeating our everyday life and influencing our actions [
1]. They are most often linked to prejudices based on race, religion, gender, sexual orientation, nationality and almost any other social category [
2]. Stereotypes can be positive as well as negative. Prejudices with negative connotations still prevail in our society [
3]. We often judge others through stereotypes before we are aware of that person’s abilities and knowledge. Driving and navigation are activities that are not without prejudice either. Research on stereotypes concerning navigation has examined specific groups such as being over 65 years of age or of a certain nationality. Since safety is a cardinal issue in driving, this research mainly examined aspects of health and safety. Demographic and social class groups were not analyzed.
By accepting stereotypes, we can get to know ourselves (and our environment) better, and thus we can learn and improve certain forms of behavior (e.g., [
1,
4]). This research has the same goal: to examine the extent to which navigation-related prejudices are based on reality. Based on navigation habits, changes in car navigation can be personalized by both car manufacturers and navigation software companies. If there are significant differences, these recommendations may be even more important. For the elderly, these changes can make driving easier and safer. If there are no differences between drivers, there should be no basis for stereotypes and they should be avoided. The present research differs from the previous studies (see
Section 1.1) in that (1) it examines the use of the built-in GPS in the car; (2) the respondents did not go through any pre-screening; and (3) we did not examine a specific group (e.g., above 65 years or people with some injuries).
The study deals with navigation habits and stereotypes as an unconscious factor in our perception. For this, it was essential to ask some driving-related questions. No series of questions can provide a comprehensive picture of entire driving habits.
The following hypotheses were formulated before the research:
Hypothesis 1: Stereotypes about car navigation (and driving) have a basis.
Hypothesis 2: As we age, our driving habits get worse, and this can be detected. So, (1) we assume that due to the deterioration of health, the elderly drive less and demand more safety, and (2) they do not use electronic navigation aids as regularly as young people, because they do not know how to use them.
Hypothesis 3: There is a demonstrable difference in the driving habits of women (bad drivers) and men (good drivers). The general opinion is that women drive less (more in the city) and less confidently and use electronic devices less.
Hypothesis 4: People who grow up in different living environments have different driving/navigation habits. Differences due to different financial and cultural backgrounds can be detected.
This paper first examines previous research and the aspects of creating a useful questionnaire. Then, the completed questionnaire is introduced and the results are statistically analyzed.
1.1. Literature Background
1.1.1. Vehicle Driving and Navigation Habits
The driving habits of car drivers have been examined by several research studies, mainly from the point of view of health and the corresponding risk factors. It was shown that a shorter amount of sleep and younger age of the driver are associated with increased traffic exposure [
5]. Auriault et al. studied how the driving habits of pregnant women change as pregnancy progresses: while initially they drive themselves, in the last month they tend to travel as passengers. Regardless of pregnancy stage, almost all women used seat belts and did not make other seat adjustments [
6].
It has been shown that more people are driving who should not for health reasons (e.g., glaucoma patients). It was also found that these patients are consciously avoiding (self-regulating) their driving habits to avoid potentially dangerous driving situations [
7]. The same pattern was found in drivers wearing a cast (Irish)—15% of orthopaedic trauma patients wore a forearm or below knee cast while driving [
8]. According to Shakerinia and Mohammadpoor, drivers should undergo regular psychological check-ups, because certain psychological characteristics (mental health, aggression) are significantly linked to driving behavior [
9].
Since driving is so complex (with the combination of physical and mental tasks), most of these are about the driving habits and possible health problems of the elderly, or alcohol influence [
10,
11]. Some research aims to identify clinical signs that may predict driving difficulties in older people [
12] so healthcare providers can personalize messages to support safe driving and patient safety [
13]. Bishu et al. examined the needs of the elderly—e.g., increasing the size of traffic signs and parking spaces, lowering speed limits [
14]. It has been shown that in older age, drivers pay a lot of attention to driving more carefully—they reduce their daily driving load, and avoid driving at night and during rush hour [
15]. They have also been the subject of studies to test drivers with certain diseases. The most common ‘handicap’ is eye damage. It has been shown that people with vision loss are particularly careful when driving because they are aware of their own limitations [
16,
17].
A few studies can be found in which gender comparisons were made. It was found that although women drive less on a daily basis (they give up driving more easily than men in adverse circumstances), there is no difference in driving rates overall [
18]. Women tend to be more prone to self-regulation and adaptation [
19,
20]. On the other hand, general comparative studies have not yet been carried out either according to the criteria listed above, or by place of residence.
Several research studies have examined in-car navigation. Similar to our survey, a questionnaire was developed in 2011 by a Hungarian-founded navigation software company, the NNG (developer of iGO Navigation Engine) [
21]. According to this, users require an online, constantly updated database, and more complex interaction with the interface. Finally, in this research, the need for a more complex, broader study is also expressed. Based on an investigation on TomTom systems, young GPS users had a more positive experience and association with GPS systems as compared to the elderly [
22]. With the development of technology, and as mobile phones became more and more commonplace, applications optimized for mobile phones appeared [
23,
24,
25].
1.1.2. Stereotypes in Driving and Navigation
There are several ways to define a stereotype [
26,
27]: the standard point of view is that stereotypes are beliefs about the characteristics, qualities and behavior of members of certain groups [
28]. The Oxford English Dictionary defines it as a “widely held but fixed and oversimplified image or idea of a particular type of person or thing”. They appear as a way of simplifying the demands made on the perceiver: they facilitate information processing by allowing the perceiver to rely on previously stored knowledge instead of incoming information [
3,
28,
29].
Age and gender stereotypes are the most common areas of research. It has been stated that stereotypes related to elders are multidimensional [
30]: both negative and positive driving behaviors are part of the behavioral repertoire. According to Joanisse et al. (2012), the interviewees tended to define someone as elderly even if they did not behave in a safe manner, but also if they showed appropriate and safe types of behavior [
31]. It was further shown that the very existence of stereotypes can influence driving habits [
32]—positive (considered) and negative (inflexible) age stereotypes can be automatically activated and influence behavior at an unconscious level [
33].
The same was shown in relation to gender stereotypes: sex stereotypes associated with driving (SSAD) may influence driving behaviors [
34,
35]. Some of the relevant research examines the issue from the point of view of safe driving, with fewer accidents being more feminine qualities [
36,
37]. Since men drive more often, it is still seen as a privilege of men [
38]. Women are often considered incompetent at driving, even by women themselves [
39]. Overall, it can be said that in all cases, a statistical difference between men’s and women’s driving habits was shown in the cases where risk avoidance/security was examined.
3. Results
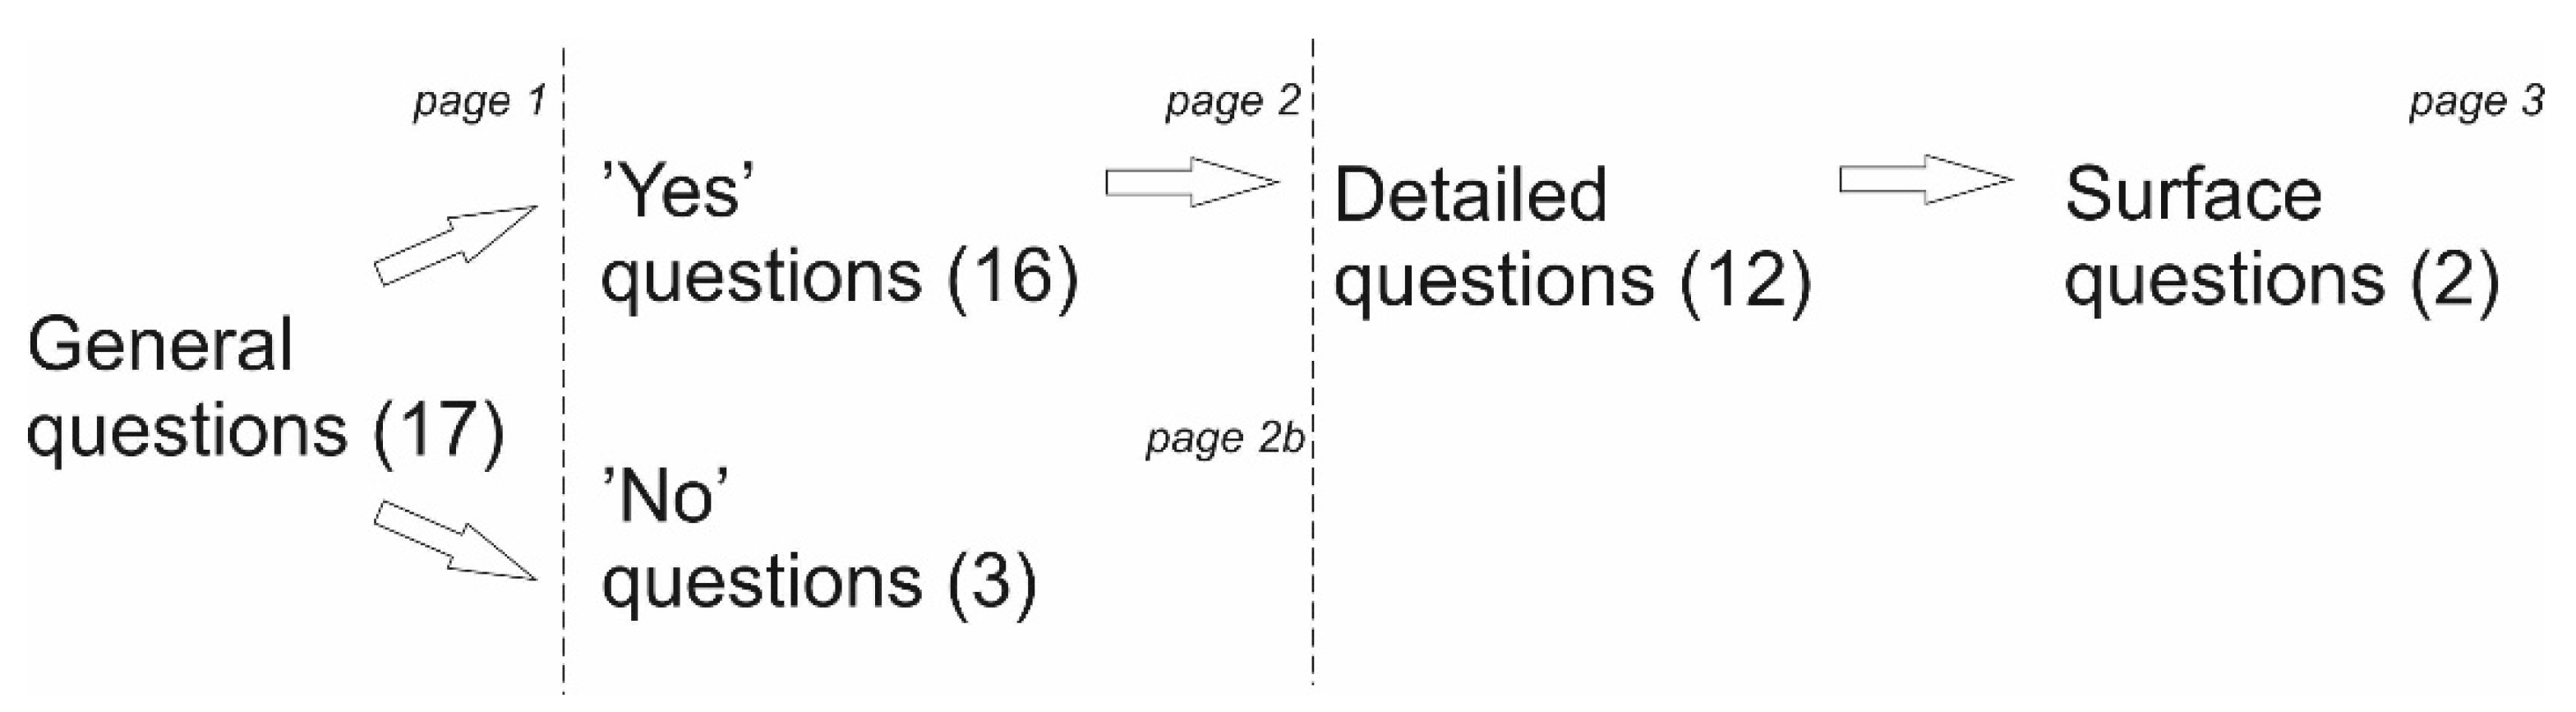
The 21 questions asked (
Table 1) were examined according to the 4 criteria presented above (
Table 2). Since we examined different stereotypes, it is advisable to group the results according to them.
3.1. Results Based on Age Groups
Hypothesis 2: As we age, our driving habits get worse, and this can be detected. So, (1) we assume that due to the deterioration of health, the elderly drive less and demand more safety, and (2) they do not use electronic navigation aids as regularly as young people, because they do not know how to use them.
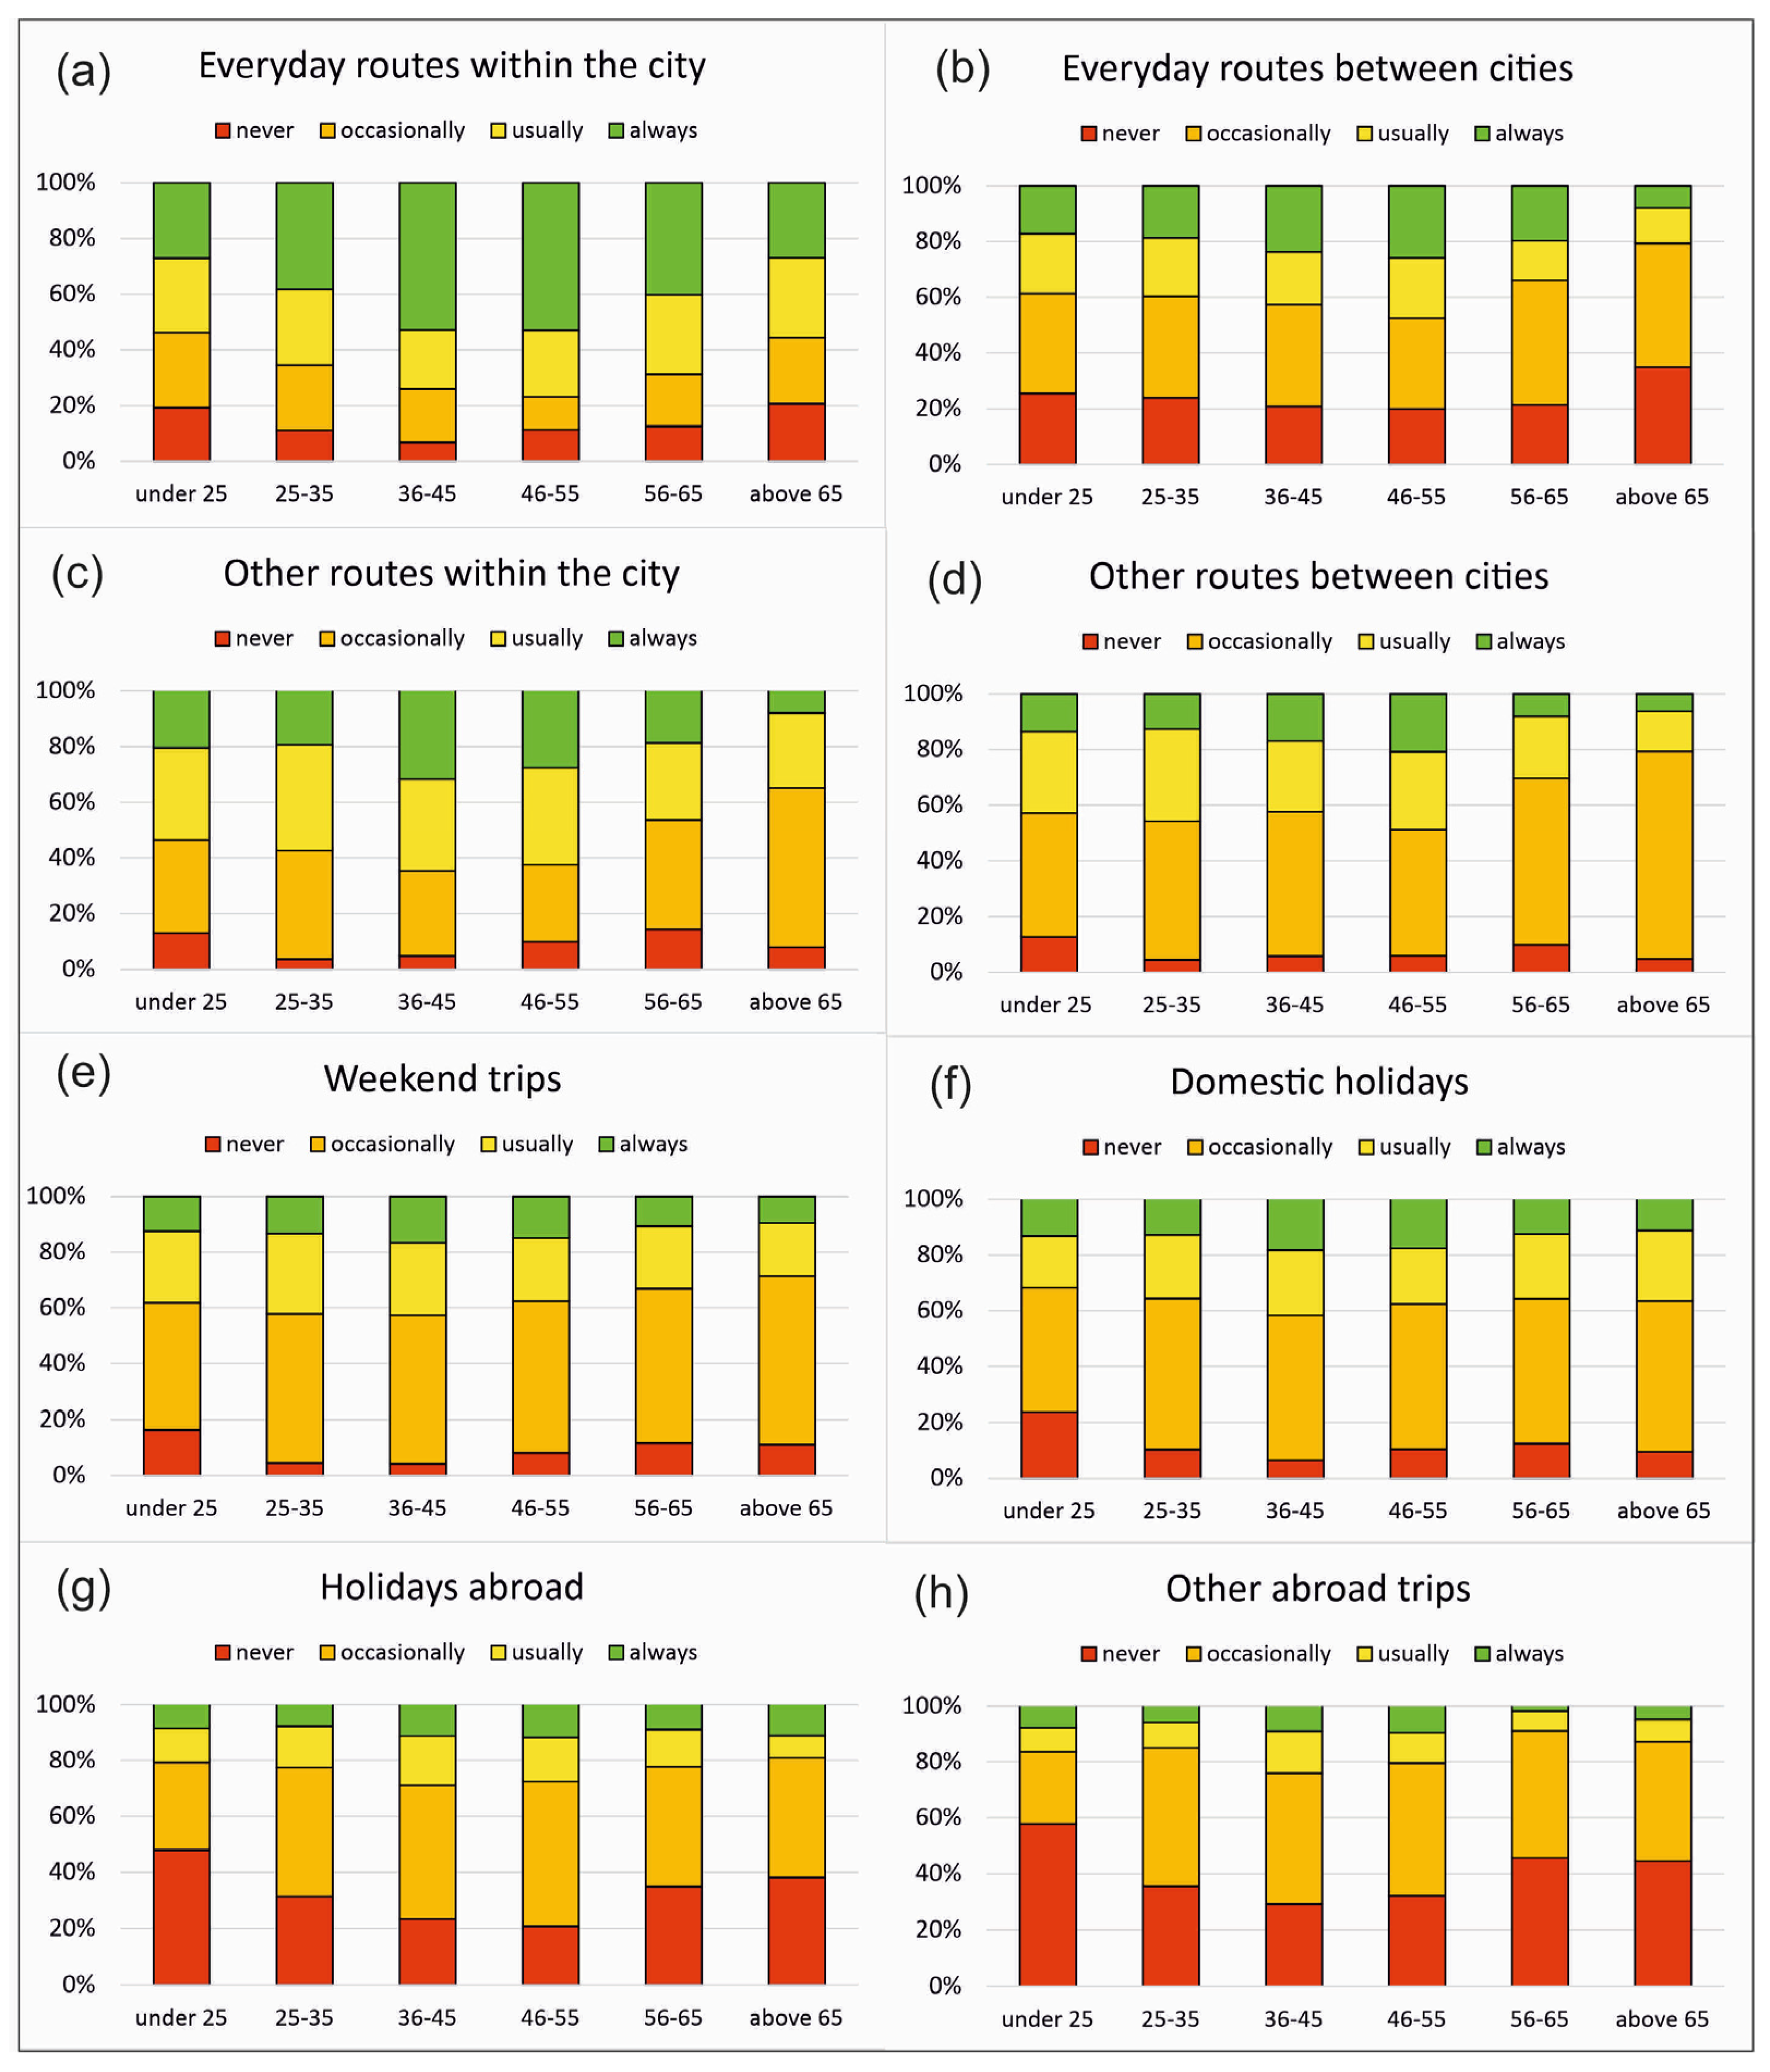
As it was mentioned above, six age ranges were defined: under 25 years, 25–35 years, 36–45 years, 46–55 years, 56–65 years and above 65 years. The age of the cars varies as follows depending on the age of users: 17.3 -> 15.6 -> 14 -> 13 -> 14.3 -> 14.5. Based on this, the youngest age group sits in the oldest cars, while the 46–55 age group sits in the youngest cars. In
Figure 2, an overview of eight different driving situations can be seen: from everyday trips to foreign trips. The pre-defined different driving situations can be seen in
Table 3.
The following can be observed: (1) Most often they drive in “other routes within and between the cities”, “weekend trips” and “domestic holidays”; (2) In the other four cases, the “never” answer occurs much more often. For everyday travels, they likely use public transport (although there are also the most “always” answers on routes within the city), while long-distance travel is less frequent; (3) In cases (a–d), the oldest age group drives the least often; and (4) Although no major differences can be observed beyond these, in general, the 36–45 age group drives the most.
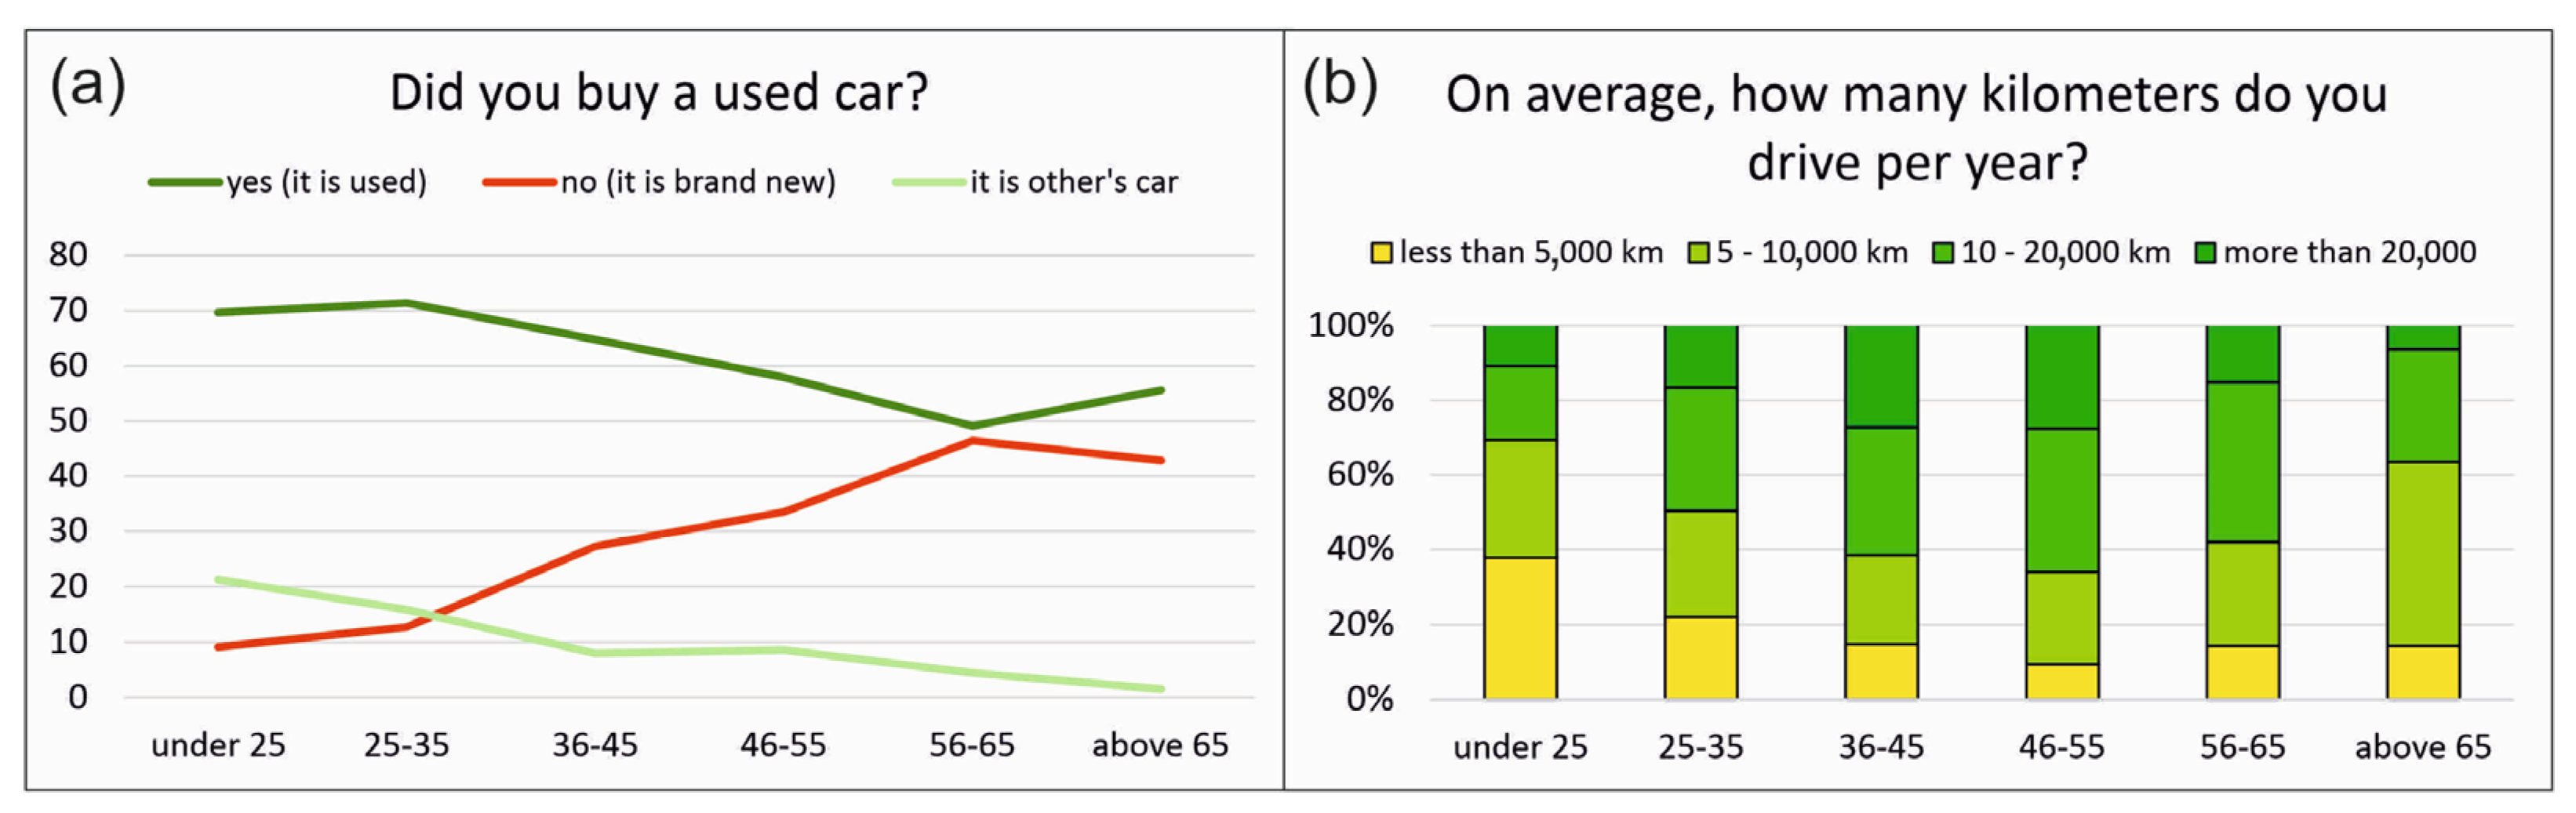
Figure 3 depicts ownership and average driven kilometers/year. There is a clear trend towards the former: the older someone is, the more likely they are to drive their own car. There is only a slight decline in the oldest age group: the proportion of used cars is increasing. On the other hand, they practically do not use anybody else’s car—these two can mean they buy their children’s/grandchildren’s car. As expected after
Figure 2, the 36–55 age group leads the most in each year. More than 80% of the oldest age group drive more than 5000 km a year. Young people drive the least, presumably using public transport more often. As we can see in
Figure 2, they also travel abroad the least.
We asked if drivers would use an autonomous car if there were no financial constraints. Except for the 65+ age group (where it has just reached 20% support) in 60–40 ratio, “no” won. Interestingly, the older someone is, the more likely they are to have and use built-in navigation. However, even in this age group, built-in navigation remains at only 20%.
The last two questions in the common part were whether the driver has a built-in GPS and uses it. As noted, there is a correlation between the age of drivers and the presence and use of built-in GPS: the older someone is, the more likely they are to use the device (
Table 4). The third column shows what percentage of those with GPS use the device.
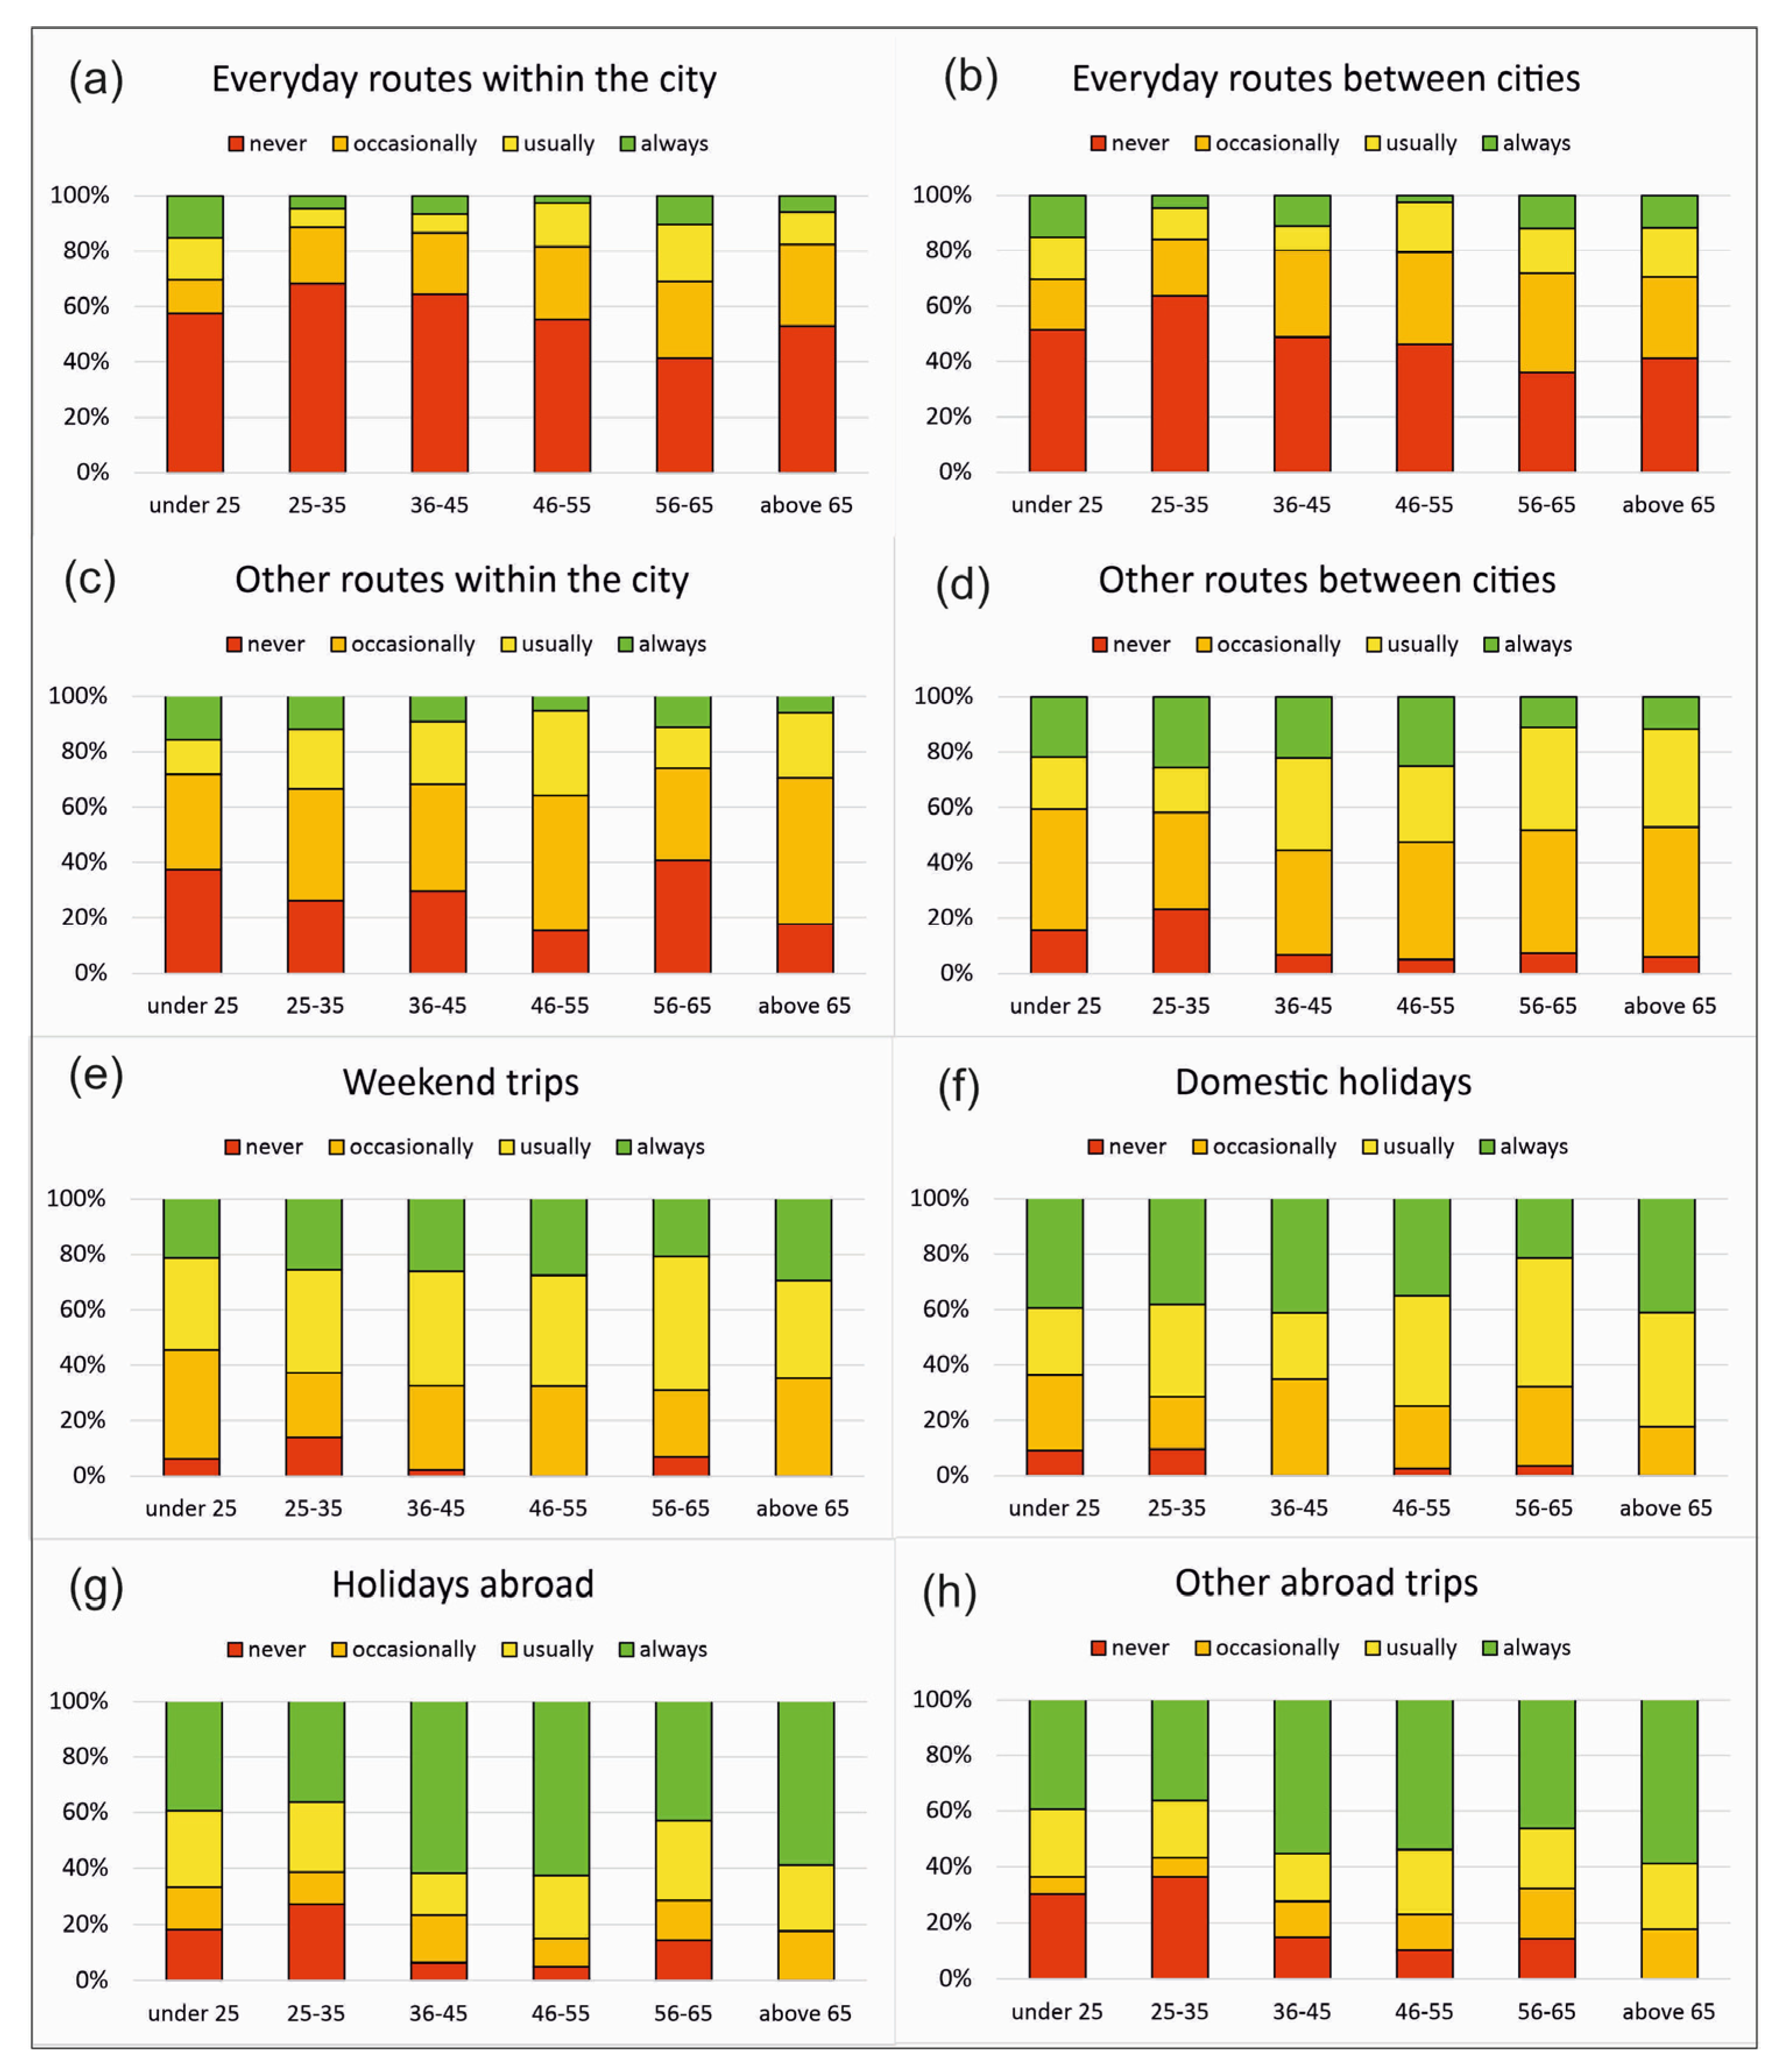
The other questions were answered by fewer people (213) as they are connected to the built-in navigation system in some way. In
Figure 4, built-in usage frequency can be seen in different driving situations. It can be seen that GPS is used least often on everyday routes, presumably because these are daily roads, and most people know the route by heart. It is also used less on foreign roads. Examining this figure together with
Figure 2, it can be seen that the youngest go the least on holiday/abroad (so that they drive), so it is understandable that they use GPS less.
Depending on the above-mentioned driving situations, we asked where and when respondents are planning their journey. The options were “I don’t plan it”, “before departure” and “in the car just before leaving”. As expected, in options (a,b) (everyday routes) non-planning dominated. In (c,d) mainly the “in the car” possibility has been selected—the extent of non-planning is declining. From (e–g) practically every age group plans their journey even earlier, before they leave and not in the car. Groups 36–55 were more likely to plan just before departure. In the context of the results presented so far (
Figure 2 and
Figure 4), in the case of “other abroad trips”, in many instances they do not plan their journeys—as they do not have those. There are some correlations between planning and ages: in an everyday, “near” environment, both young and old are more likely to plan ahead. It is also the middle-aged classes [
36,
37,
38,
39,
40,
41,
42,
43,
44,
45,
46,
47,
48,
49,
50,
51,
52,
53,
54,
55] that plan their trips just before departure. The youngest are more likely to plan well in advance.
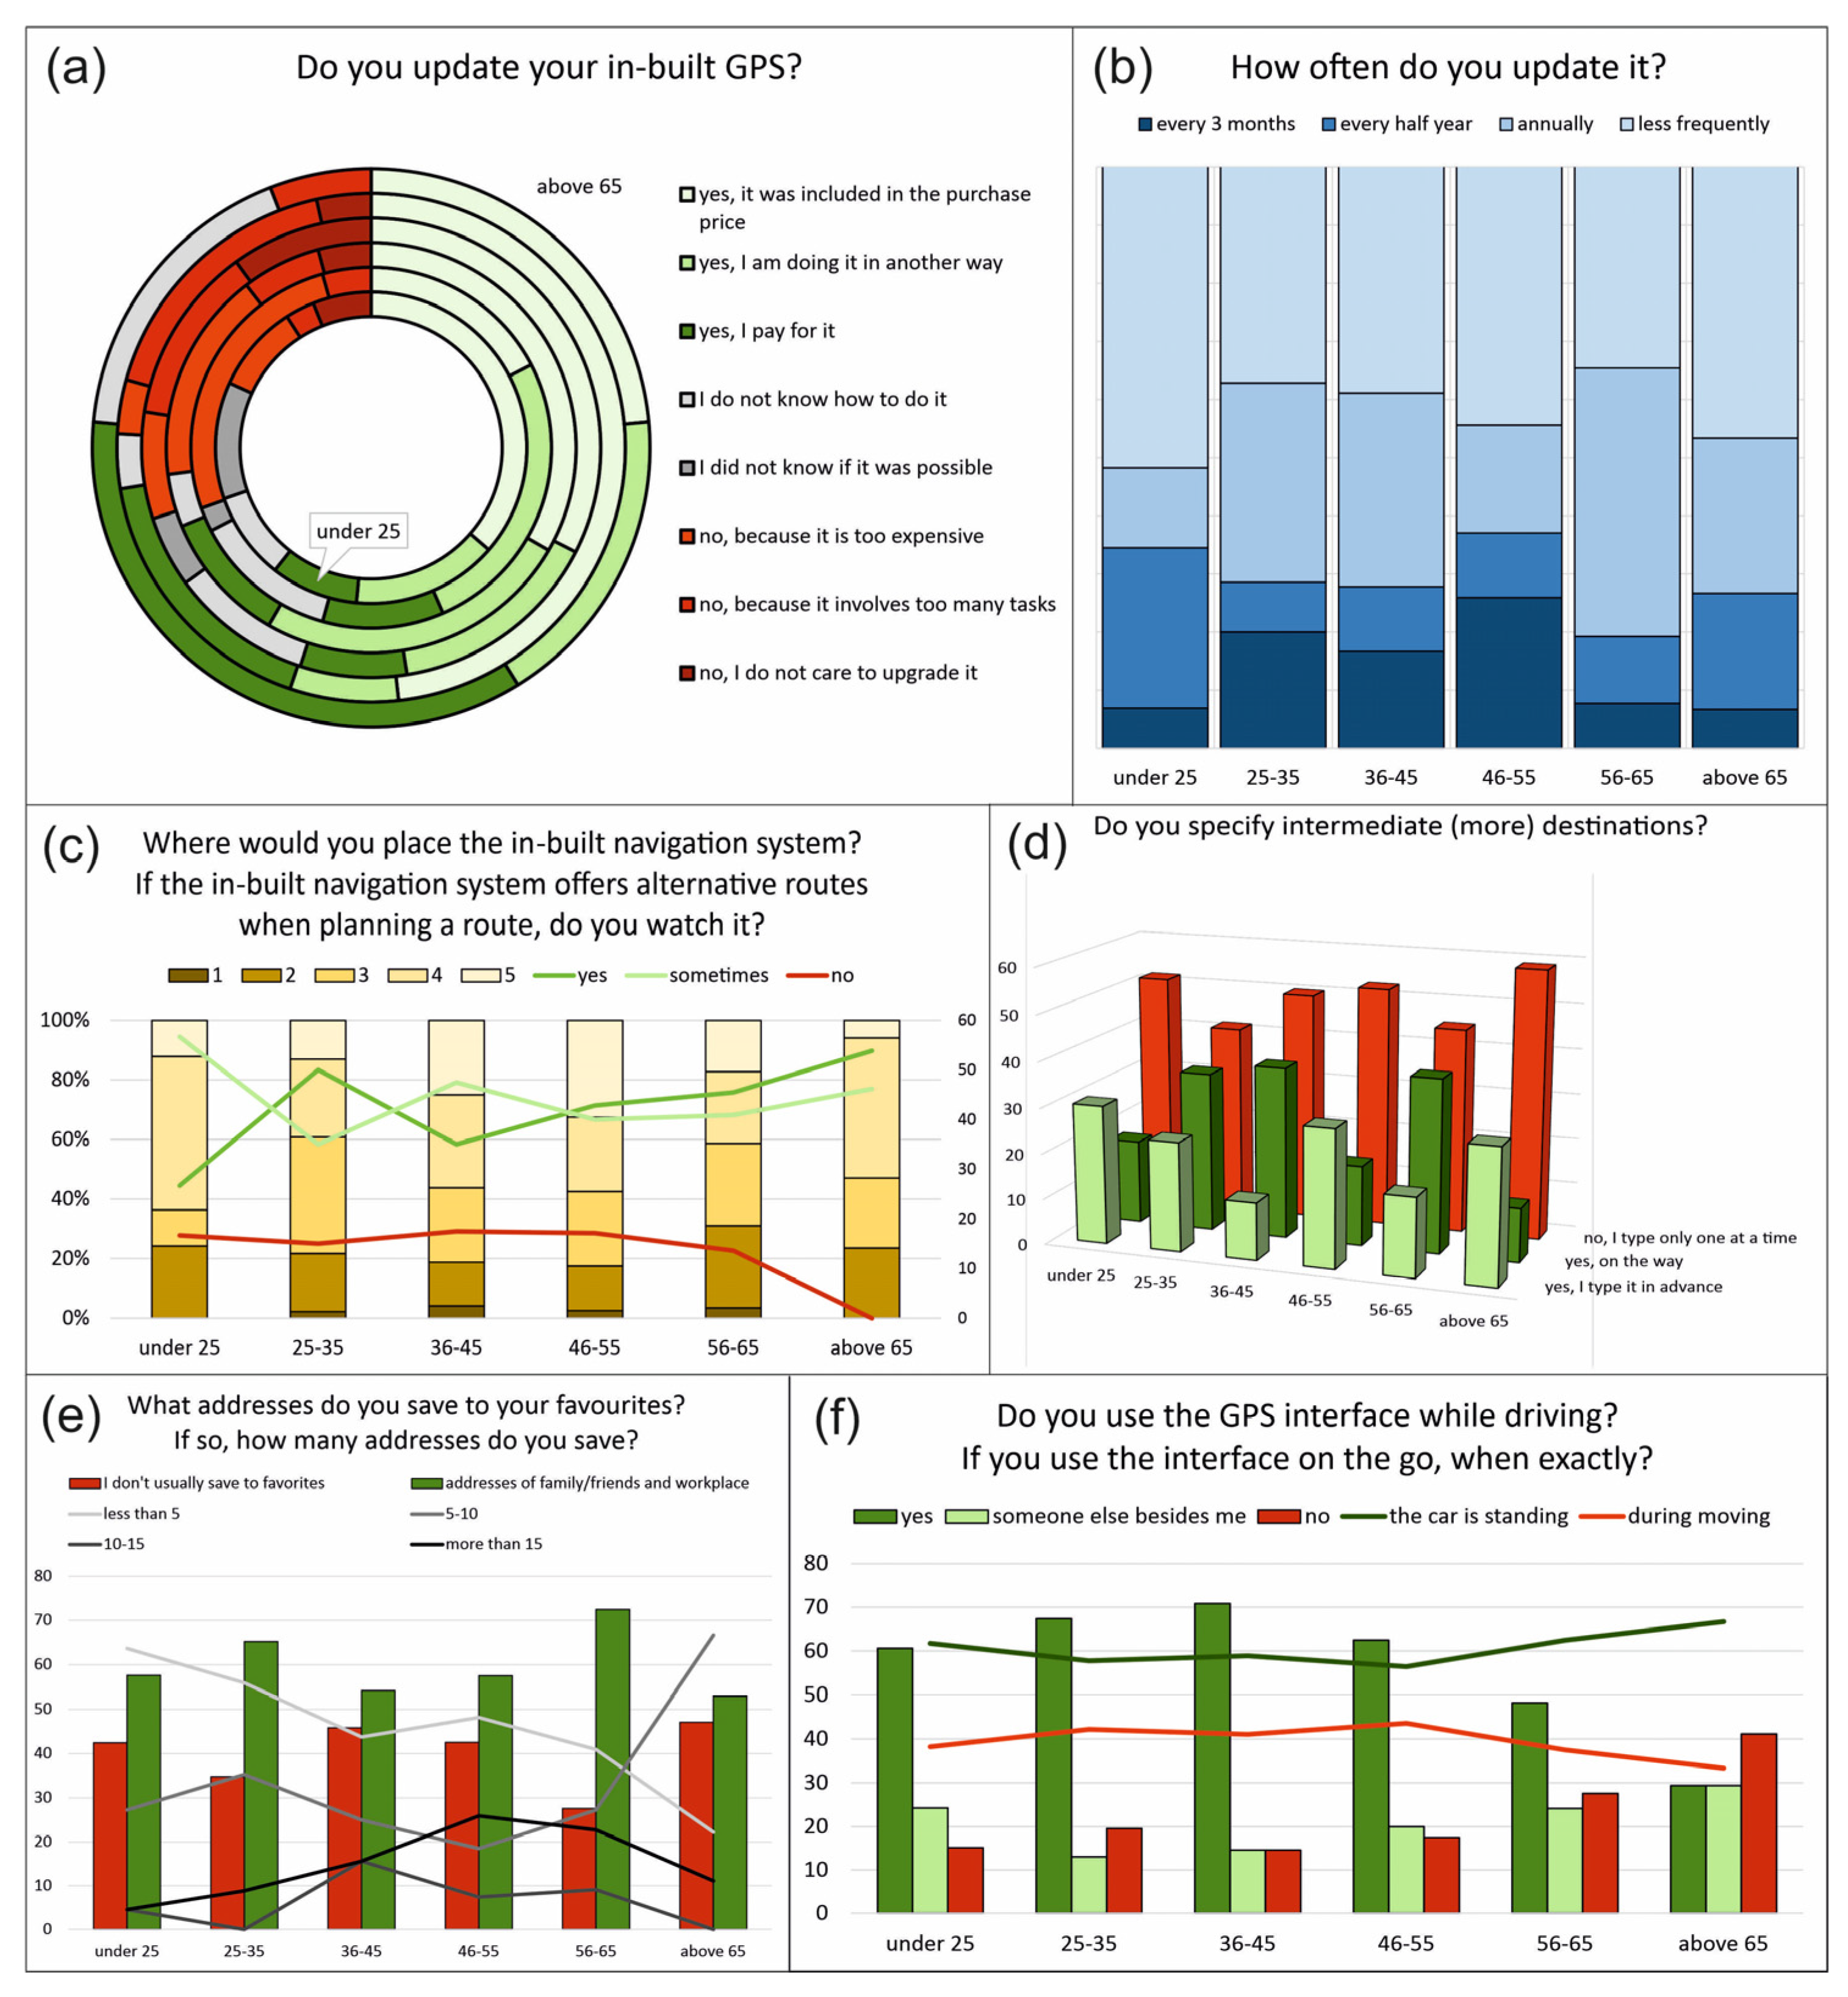
In more than half of the cases (in some cases, more than 3/4), drivers update their databases in the navigation units. For the most part, the older someone is, the more likely they are to deal with an older database. For each age group, there are several answers that address whether users pay for this service. Regardless, however, the most common reason for not upgrading is the expense. In
Figure 5b, it can be seen that even if they pay attention to upgrading their system, half of the respondents do it less than annually.
In the questionnaire, five options for built-in navigation systems were given. The 1st option favors left-handers in particular, as it is easier for them to handle the surface on the left. The 2nd place is behind the wheel on the dashboard. The 3rd option is at the top of the central console. GPS in the central console itself, in its “usual place”, is the 4th possible place; while the 5th is when the surface is projected onto the glass. Only a few votes were cast for the first option (
Figure 5c). In general, the other four options are equally desirable for drivers. The “usual place” is most coveted by the youngest and oldest groups. Most like the night mode on the display. Everyone, regardless of age, checks the alternative routes offered—the oldest group in every case. Everyone loves the “night mode” feature as they do not turn it off. There is no trend of giving waypoints—the majority do not take this opportunity. The younger generation save fewer addresses to favorites (mostly family members) than the older ones. Based on
Figure 5f, it can be said that someone is more likely to use GPS while driving if they are younger. Forty percent of drivers interact with it when the car is moving—not when they are stopped. As you get older, people are increasingly handing over navigation to someone else. In the vast majority of cases, they use the interface to enter a new address.
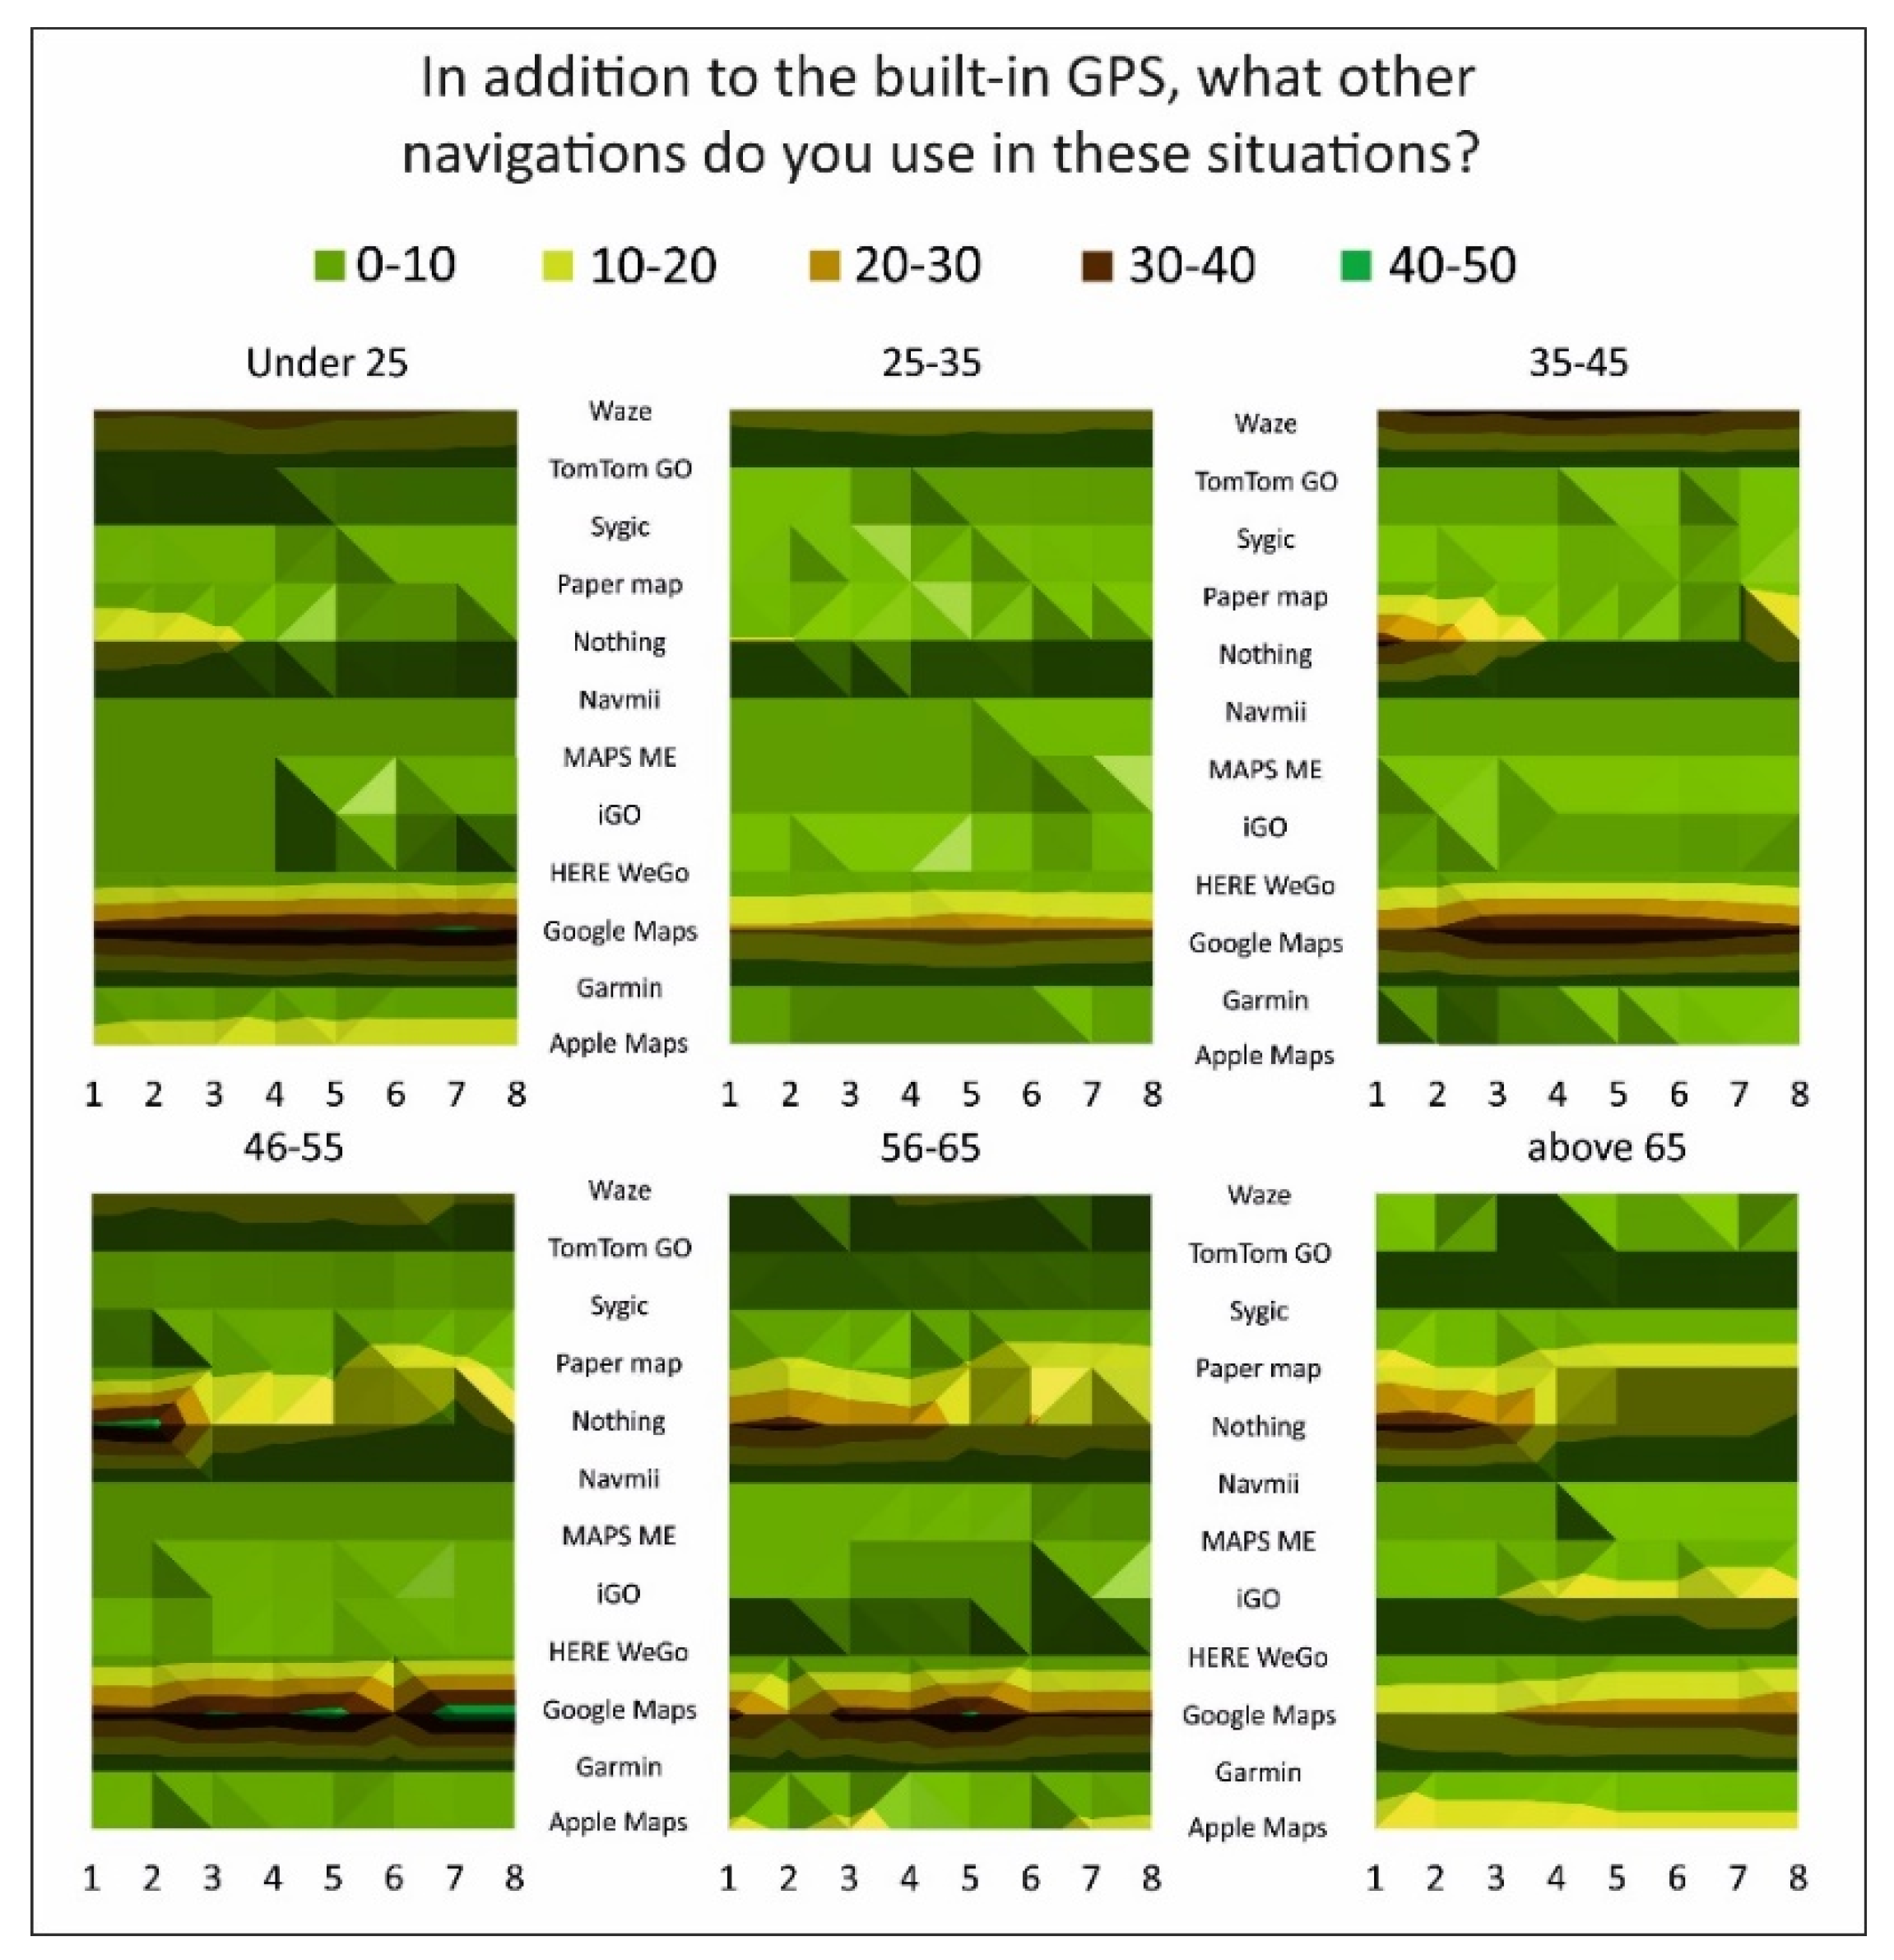
The surface chart in
Figure 6 shows what other additional navigation is used by drivers. The numbers in the
x-axis represent the driving situations presented in
Table 3. Options were given in the questionnaire for what apps and devices can be used in addition to the built-in ones. These can be seen on the
y-axis. Coloring depends on the ratio (%) of responses to a given situation; these numeric values are specific values at the intersection of situations and application options. The coloring between grids is created by interpolation to give a hypsometry-similar look.
Several correlations can be drawn: (1) the younger age group uses far fewer types of applications than the older ones: Google Maps, Waze, and Apple Maps dominate (but the latter is only for the youngest); (2) older people use paper maps more often, especially for unknown (foreign) roads; and (3) drivers under 35 are much more likely to bring out some aids to navigate.
3.2. Results Based on Gender
Hypothesis 3: There is a demonstrable difference in the driving habits of women (bad drivers) and men (good drivers). This means that, according to our prejudices, women drive less (more in the city) and less confidently and use electronic devices less.
Results for men are presented, followed by those for women. The average age of men’s cars is 14.7 years, while women’s are 15.2. In terms of usage, the data are almost identical: 66–63% had used cars, and 21–21% had new cars. In
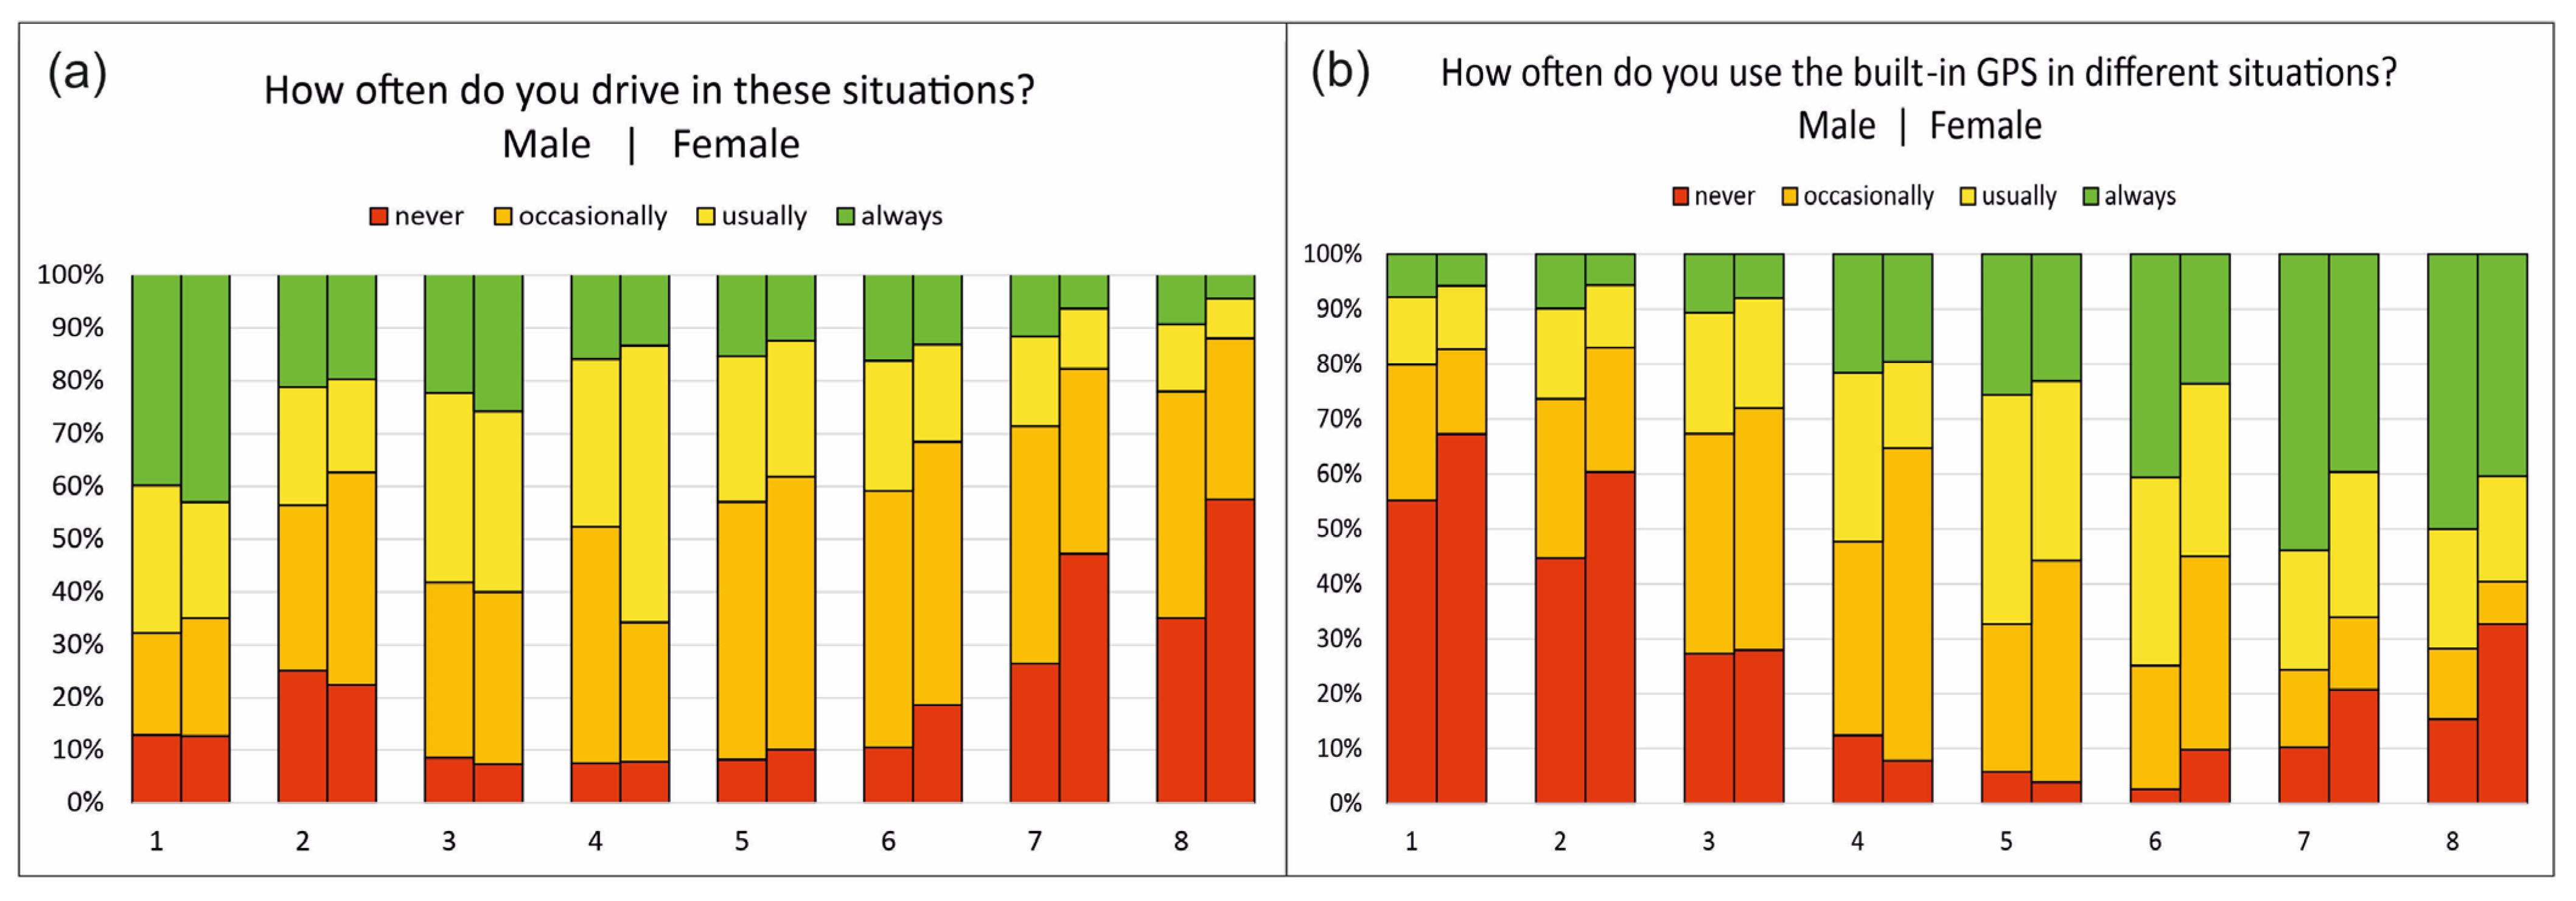
Figure 7a, the declining trend presented earlier is shown: the less “close” a road is, the less often people drive. There is only a few percent difference between the genders; 23–15% have a built-in GPS and about 64% use them. Women use the built-in GPS less often (proportions of “always” and “never” answers in
Figure 7b). There is not much difference for everyday trips. The difference is greater for less frequent trips.
Figure 7a,b are almost perfect mirror images of each other. It can be seen from this that there is a correlation between the frequency of built-in GPS usage and driving.
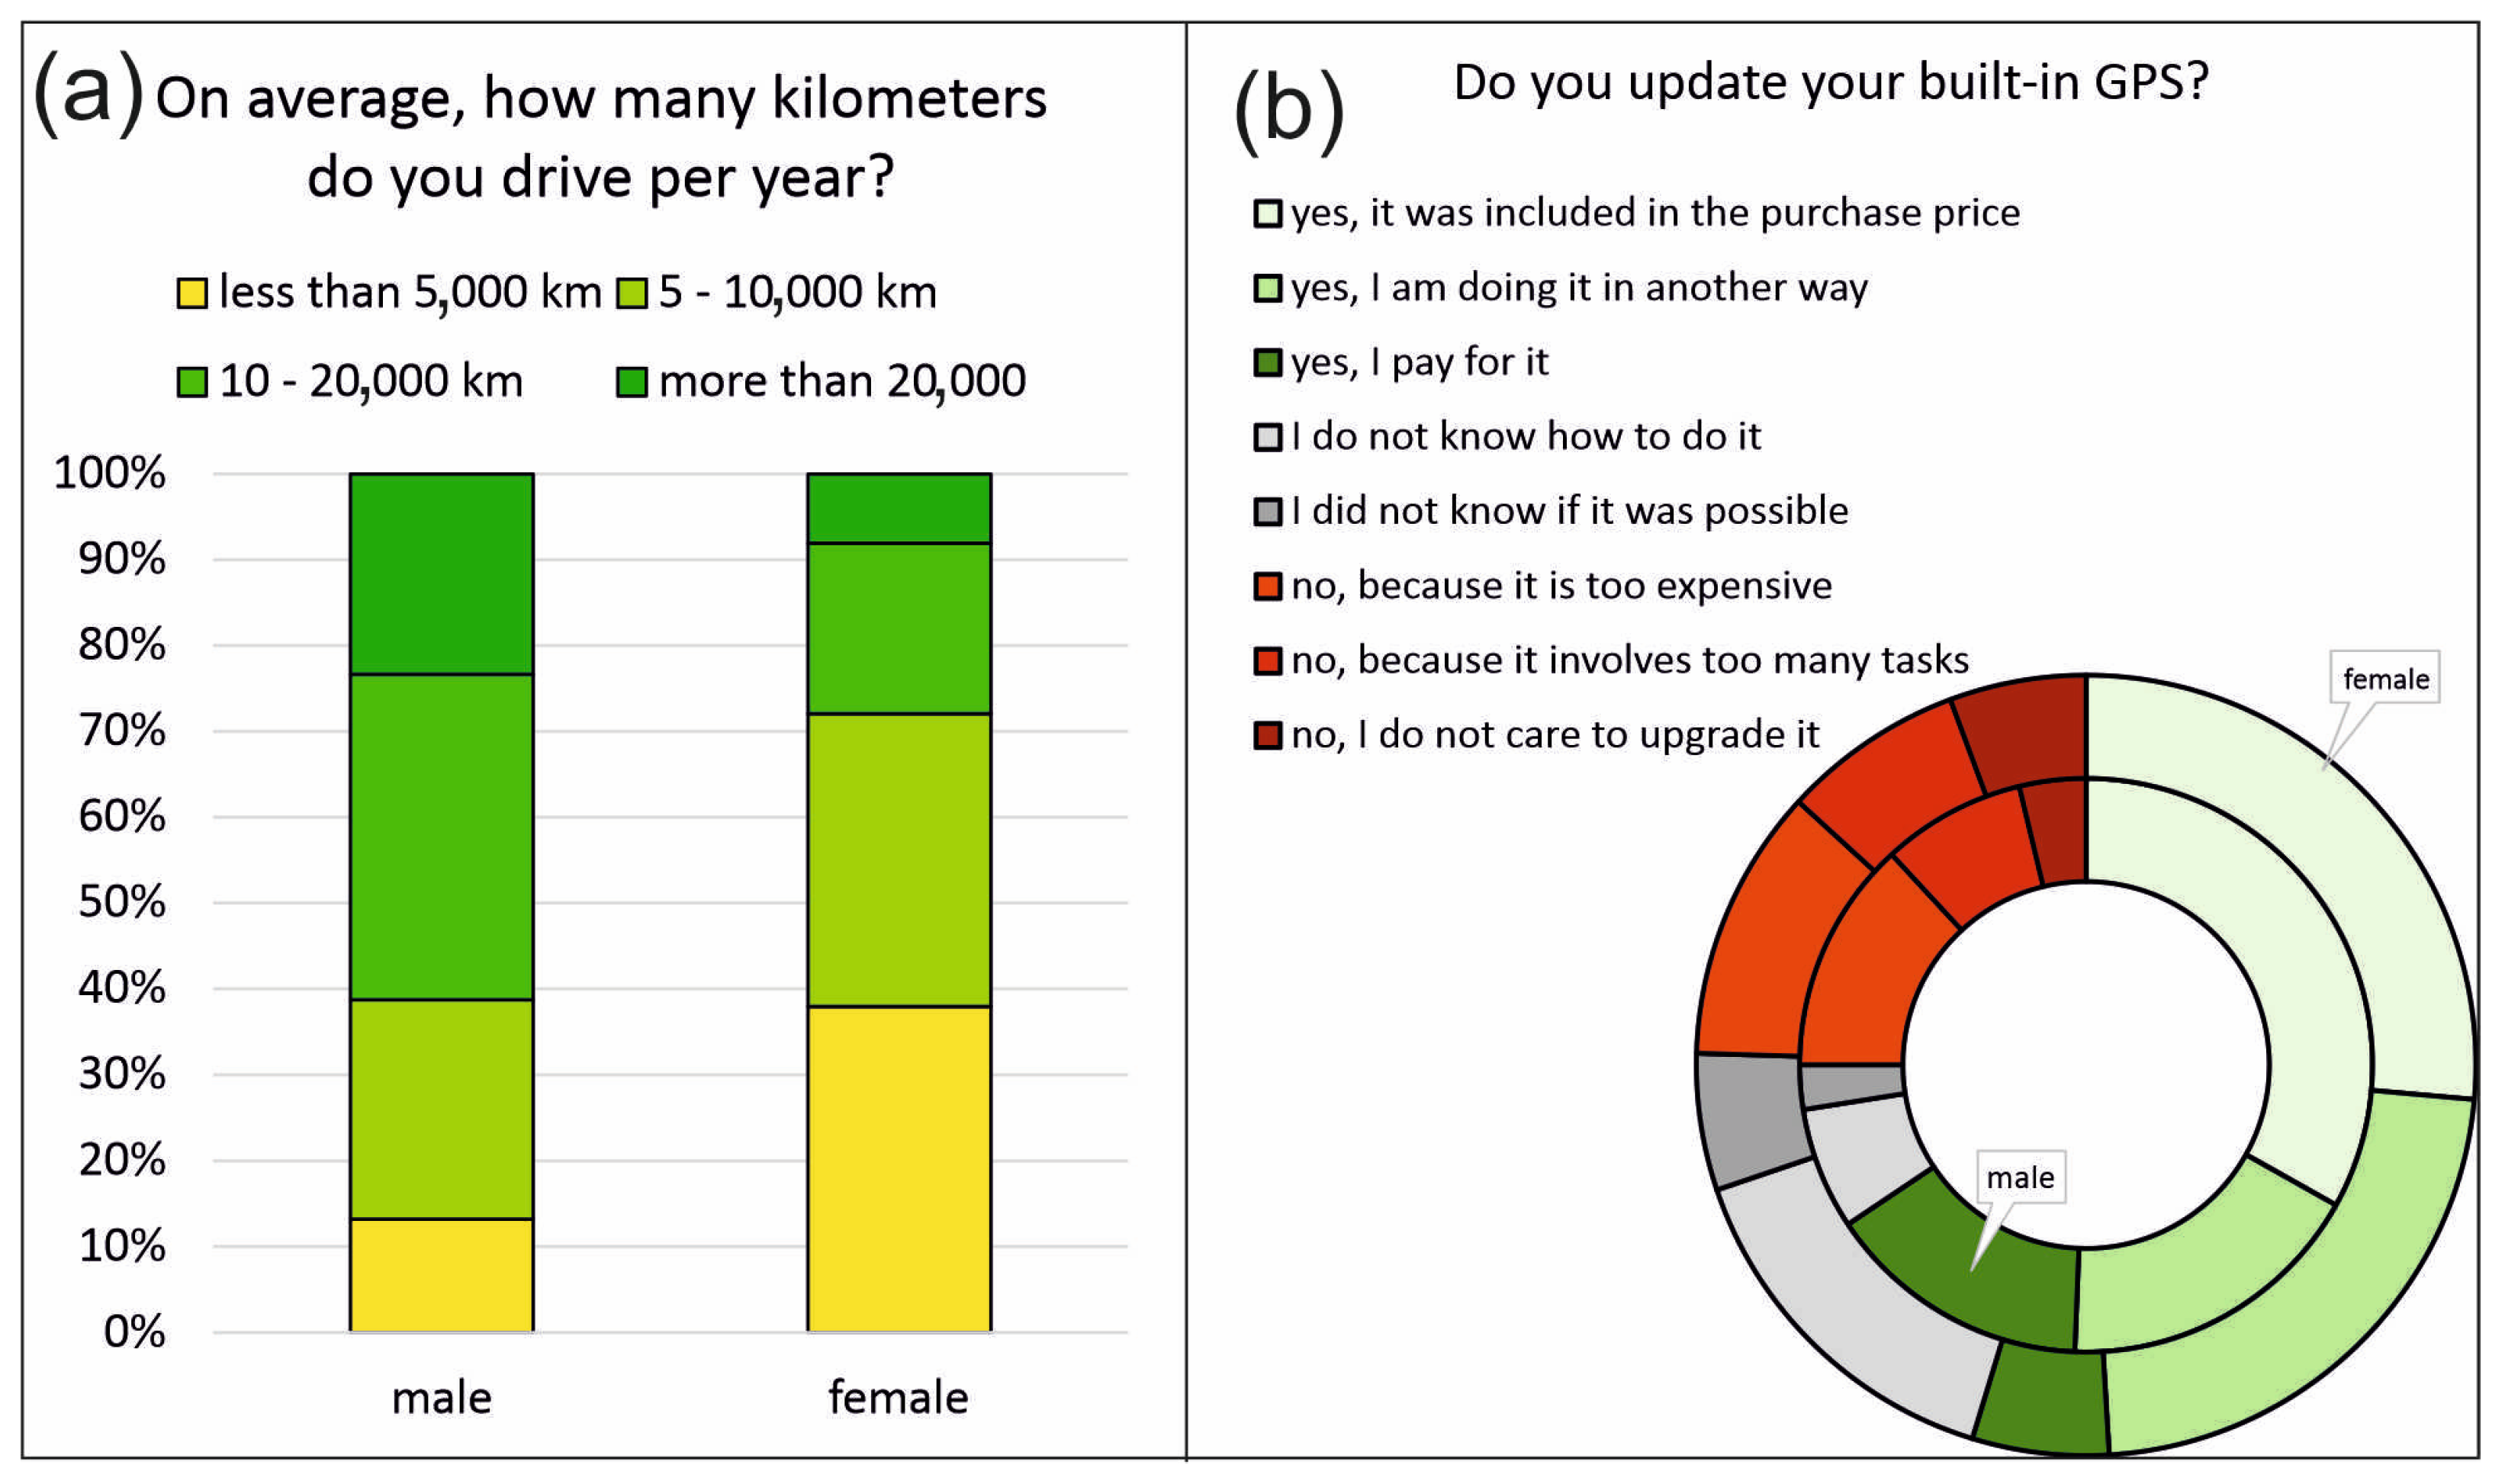
The difference in mileage is more striking, as can be seen in
Figure 8a. Sixty percent of men drive over 10,000 km/year, compared to 30% of women (usually, when the family goes on vacation together, men prefer to drive). In terms of updating the database, women are less aware of their options and almost a quarter of them do not know how to do it. However, the ratio of non-updates between the two genders is quite similar (both 25%) (
Figure 8b). The frequency of updates is almost the same: 30% do it more often than annually.
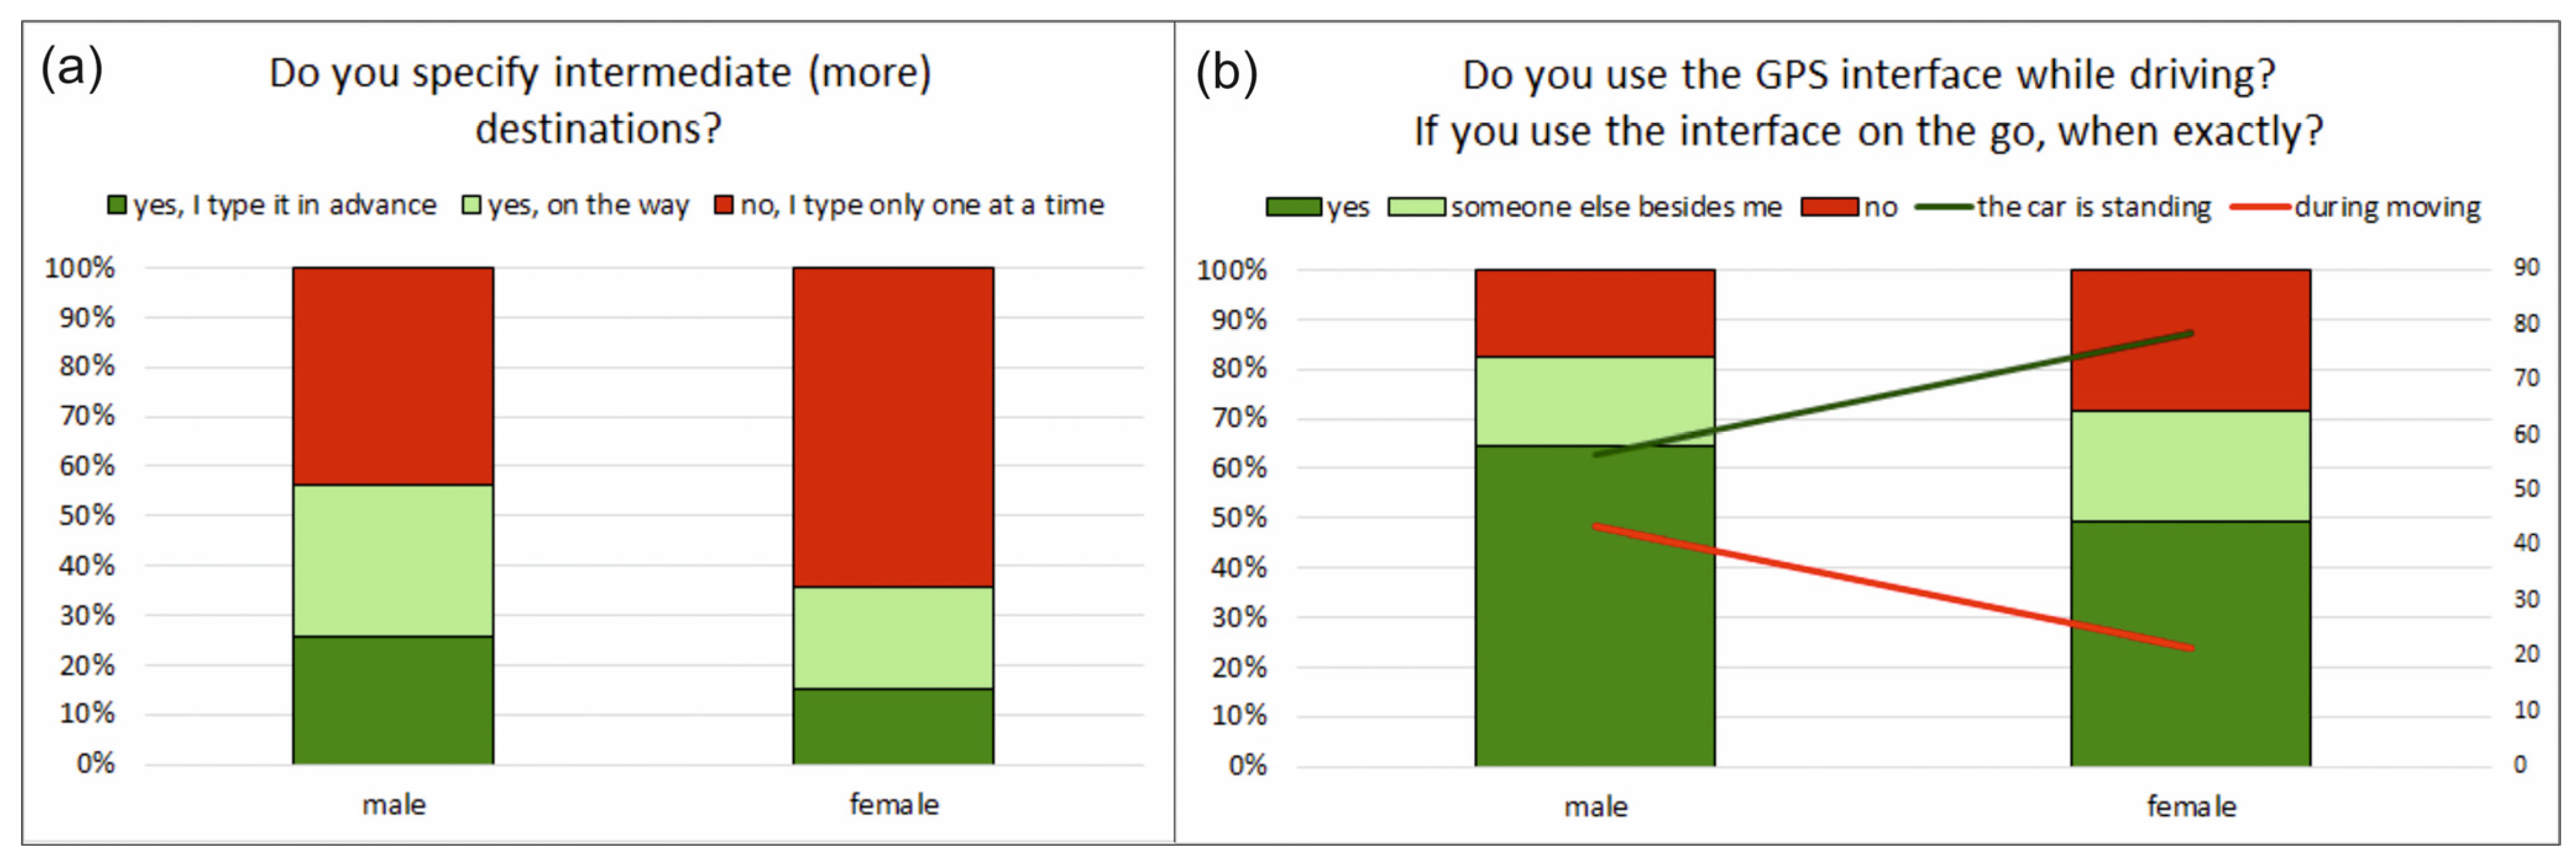
We examined by gender if the respondents specify intermediate destinations. More than 60% of women enter only one destination at a time, compared to only 40% of men. Men enter extra destinations while driving twice as many times as women (see
Figure 9a). Just over half of the women save addresses to favorites, and 70% of them save less than five. Men do just the opposite.
Figure 9b shall be understood as follows: the results indicated by the green and red lines (answers for the question “If you use the interface on the go, when exactly?”) are obtained by examining the two “yes” answers to the first question (“Do you use the GPS interface while driving?”).
The above-mentioned contrast also appears when using GPS while driving: almost 70% of men and less than 50% of women use it by themselves on the way (not the passenger). Of those who use it, in almost every second case, men do it when the car is moving. For women, this rate is only 20% (
Figure 9b). For both genders, it is mainly used to input a new address.
A few differences for other used applications can be detected: (1) men know and use more applications, (2) women drive only on the most daily roads without any help, (3) women mainly use google maps in all situations. Fifty percent of men and 30% of women would drive a self-driving car if they could choose this possibility. There is no significant difference in the location of planning either: on average, women plan their journey 10–12% more times in advance. With the exception of two situations (3,5) men plan their journeys less often. Even in this case (grouping by gender), in addition to the “left-handed” (1) option, the answers are roughly evenly distributed among the other four, where they want to place the built-in GPS. The majority (~80%) do not turn off night mode.
3.3. Results Based on Habitancy Groups
Hypothesis 4: People who grow up in different environments have different driving/navigation habits. This follows from the different distances, road conditions and environment (whether natural or built).
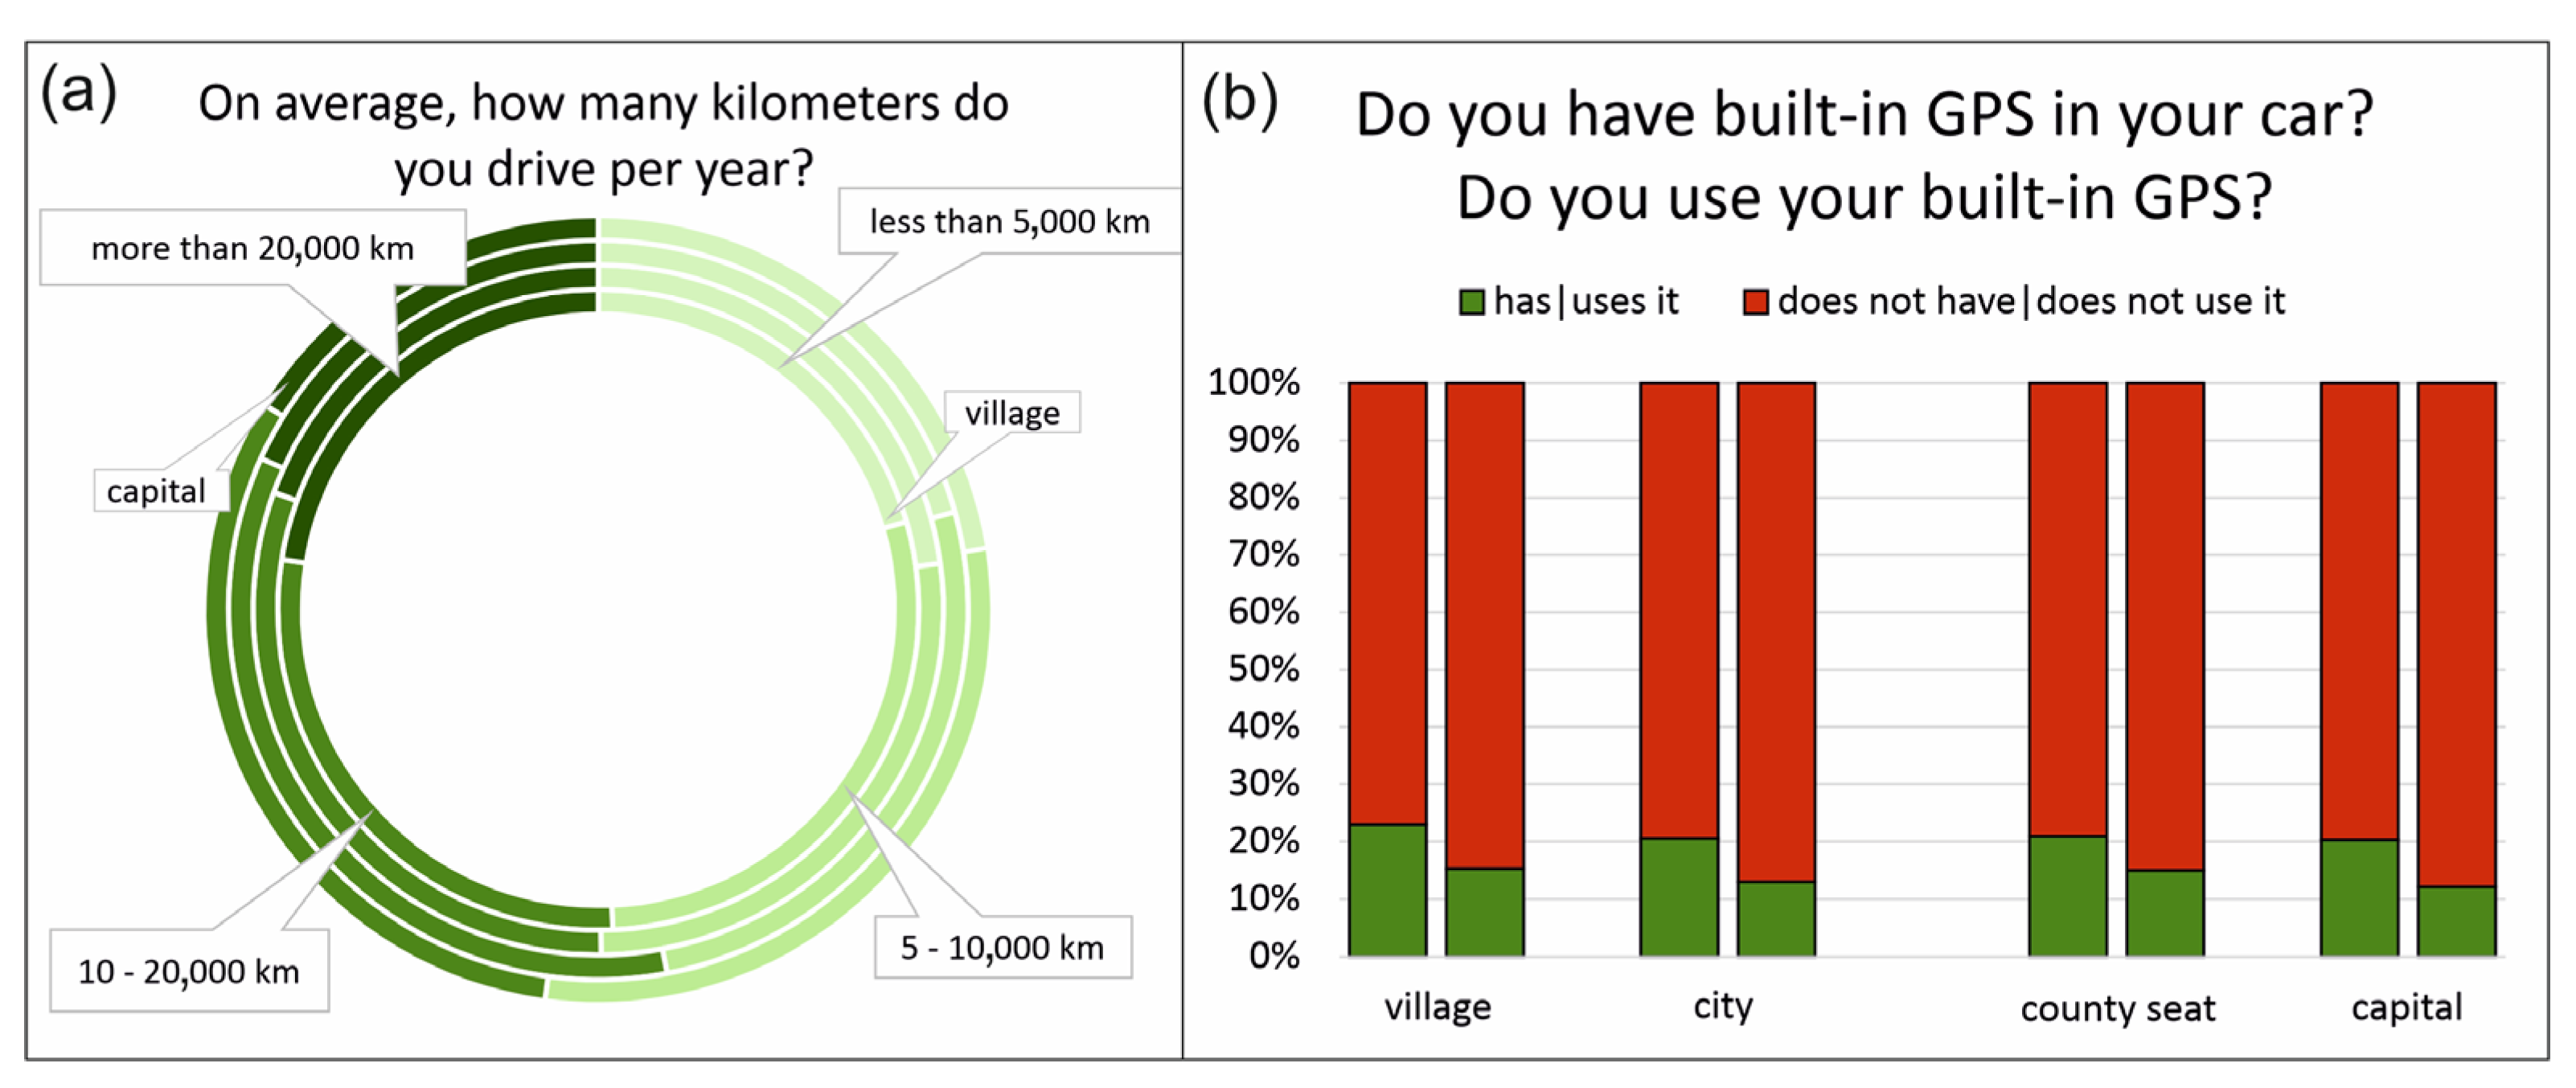
Four types of residences could be selected: village, city, county seat and capital; with results presented in this order. In terms of the age of the cars, 15-15.2-15.2-14.2, there is no significant difference. Cars of those living in the capital are one year younger. Moreover, 65–69% of drivers bought used cars, except (again) in the capital where it was only 60%. This difference also appears in the “I use other’s car” option, where in the capital almost 20% do so. In the other three scenarios, only 10% marked this answer. There is no significant difference in the number of kilometers driven annually (
Figure 10a), or in the existence and use of GPS.
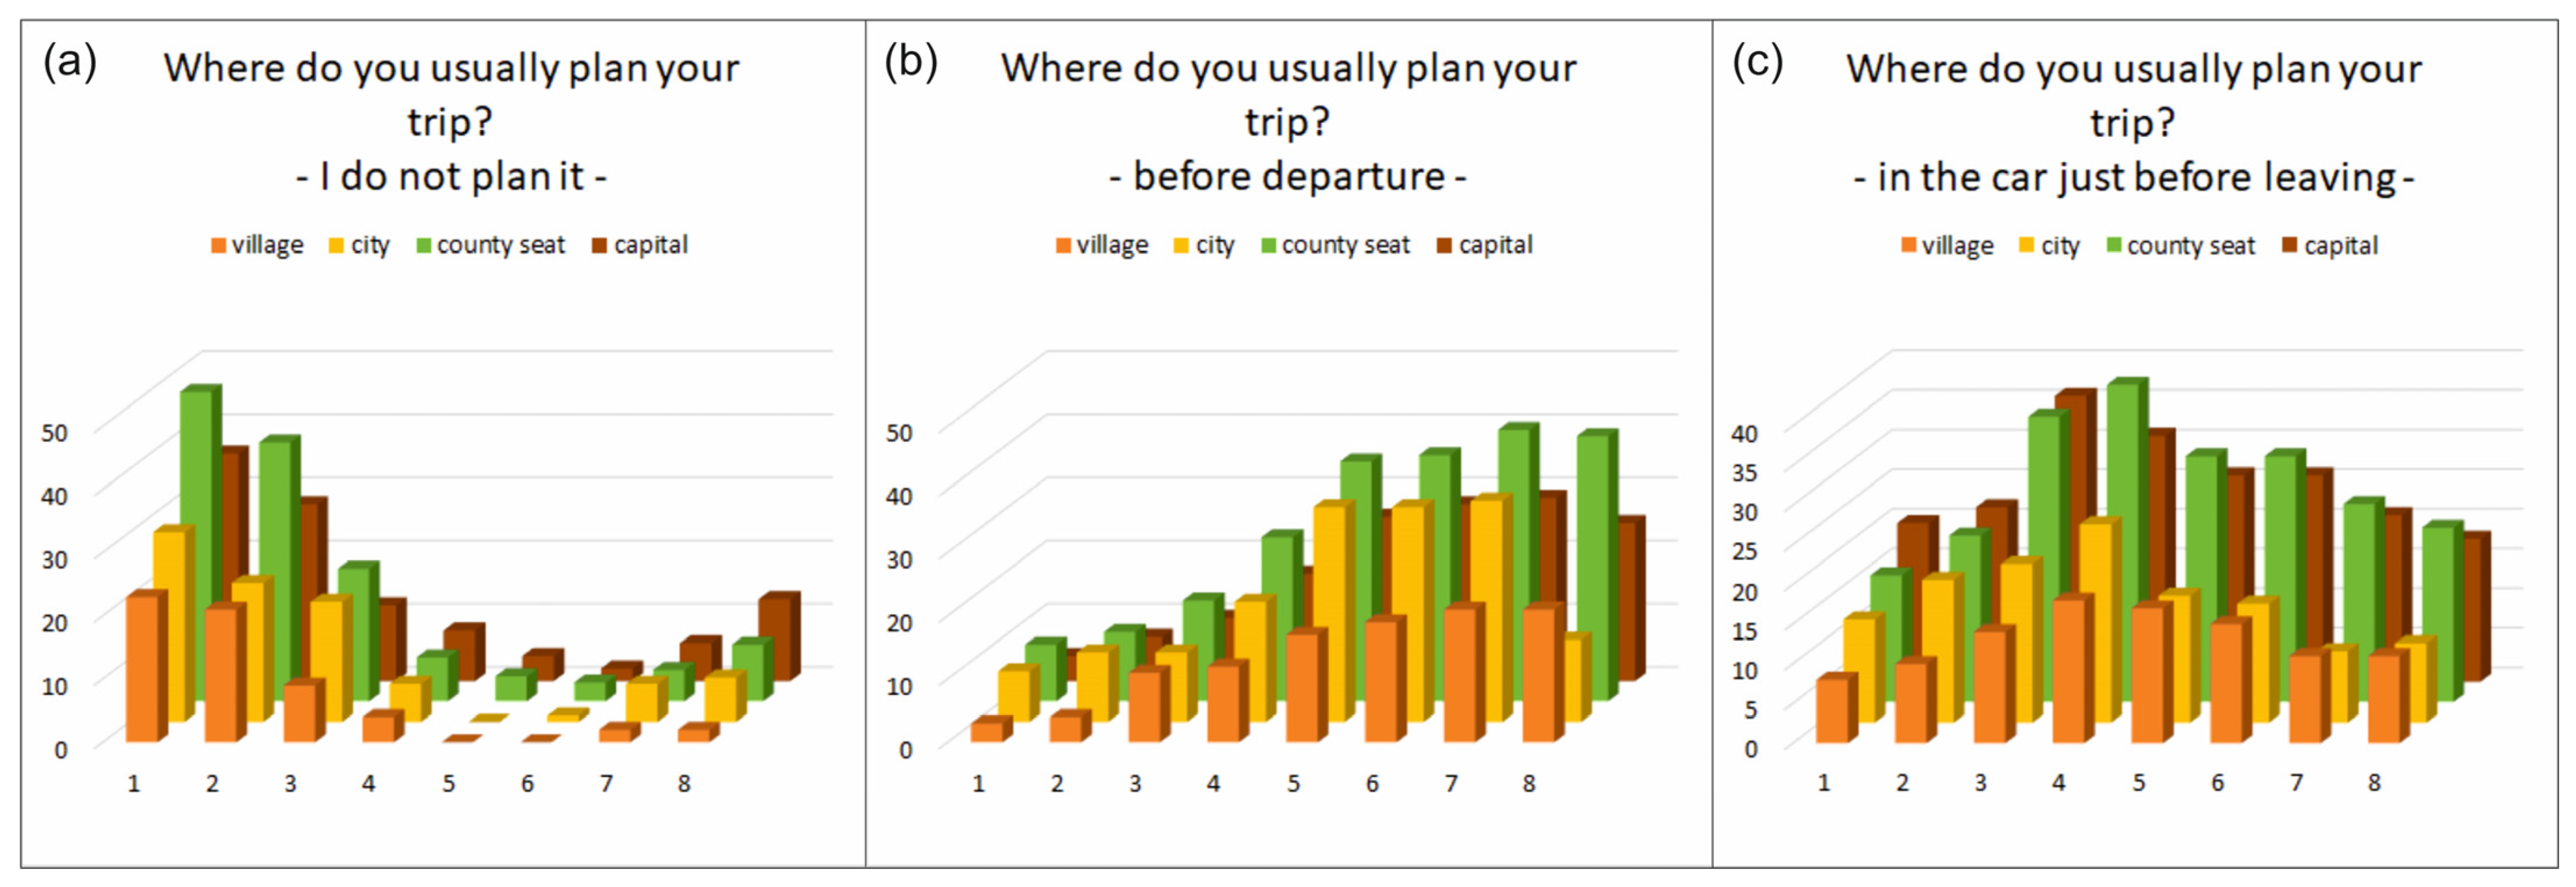
Figure 11 should be interpreted as follows: the driving situations defined in
Table 3 are shown on the
x-axis (from 1 to 8). The answers (“I do not plan it”, “before departure” and “in the car just before leaving”) to the question (“Where do you usually plan your trip?”) can be seen grouped by place of residence on the
y-axis. Regarding GPS usage, the proportion of “always” answers increases from 1 to 8 in all cases, while “never” changes as follows: it decreases from 1 to 5 (so weekend trips have the fewest never answers), then increases again. There is a slight difference in the ratio of “usually” and “occasionally” answers—the least common in the capital being “occasionally”. Likewise, no significant changes in road planning can be seen in
Figure 11a–c. The more distant they travel, the more they tend to plan ahead; earlier, in their living area, not immediately before departure.
A small difference can be detected in the update of the built-in navigation: only 50% of the respondents living in the capitals upgrade, while in the other three places this value is closer to 70%. Almost 10% of the residents of the capitals and county seats do not know how to carry out the update. This was not the case in the case of those in villages and towns. Roughly 30% update it more often than once a year—interestingly, this is done least often in villages and capitals.
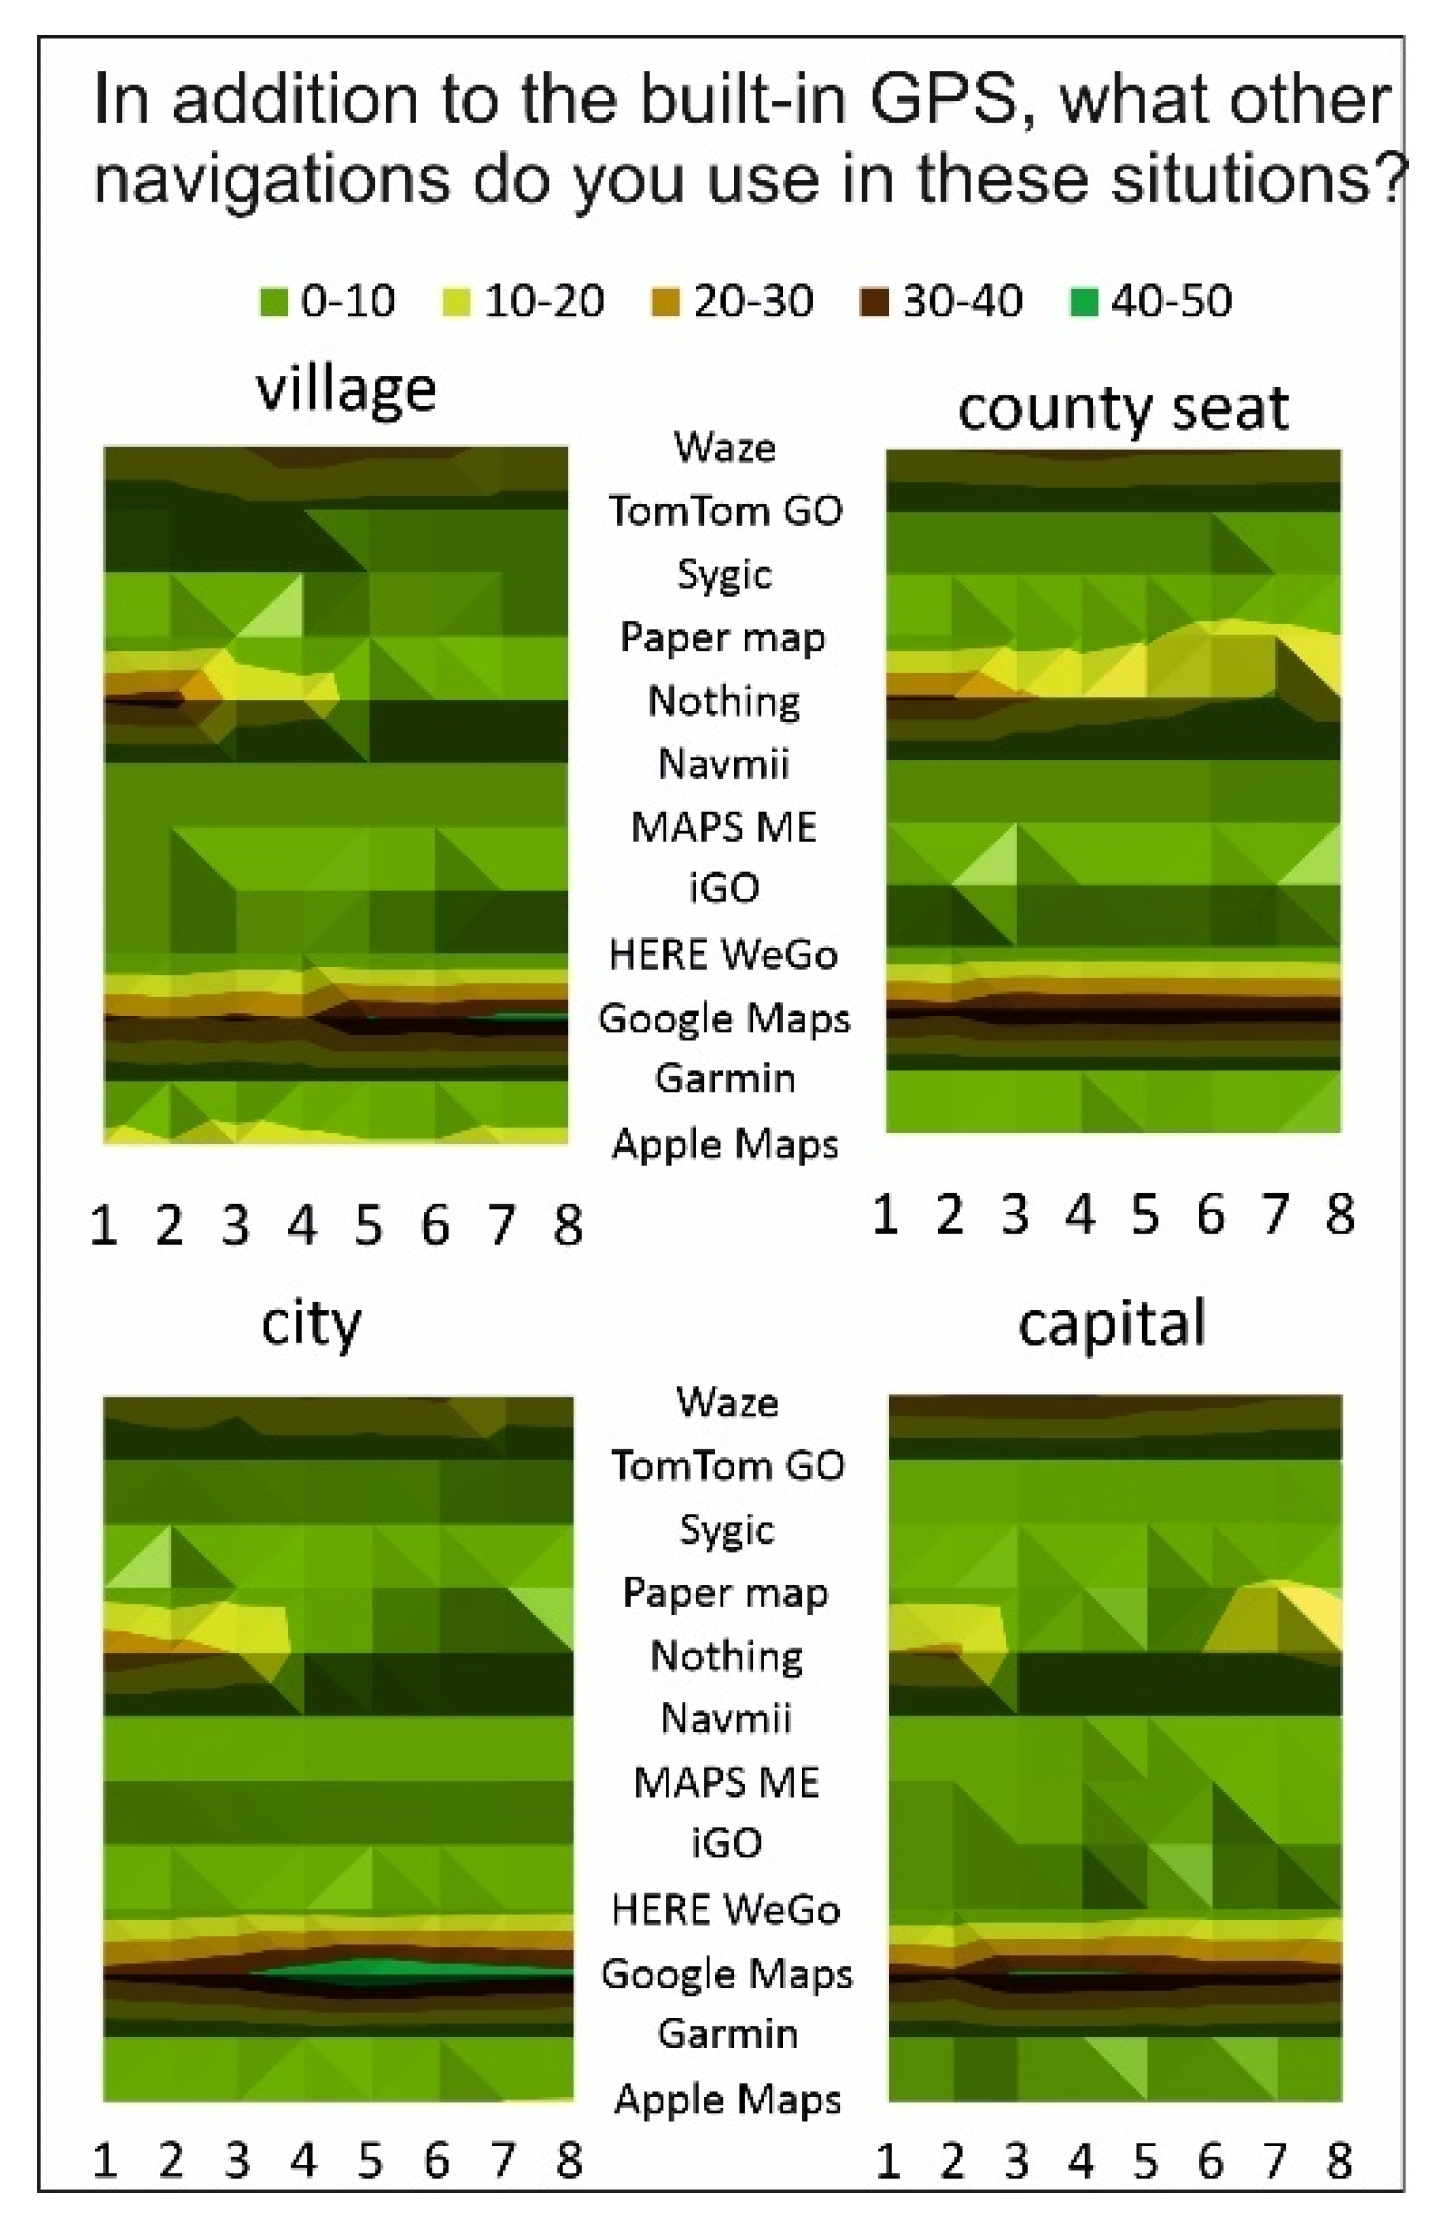
Regardless of where they live, most people use “Google Maps” for navigation. Waze is used second-most. In the case of villages, approx. 20% use “Apple Maps”. A significant difference can be observed in the case of “nothing” and “paper map”. In the case of villages and towns, situation 4 is last, while it is present in all driving situations in the county seats (~20%). In the case of the capital, they are indicated at 1–2 and 6–8, only for (weekend) holidays were they not given as an answer (
Figure 12).
In the case of respondents in capitals, the least number indicated that they would like to see the orientation information projected on the windshield. They would place it at 25–35% in the “current location”. The 3rd option (top of the central console) was nominated by only a few people from the city; the other three places of residence all wanted ~25%.
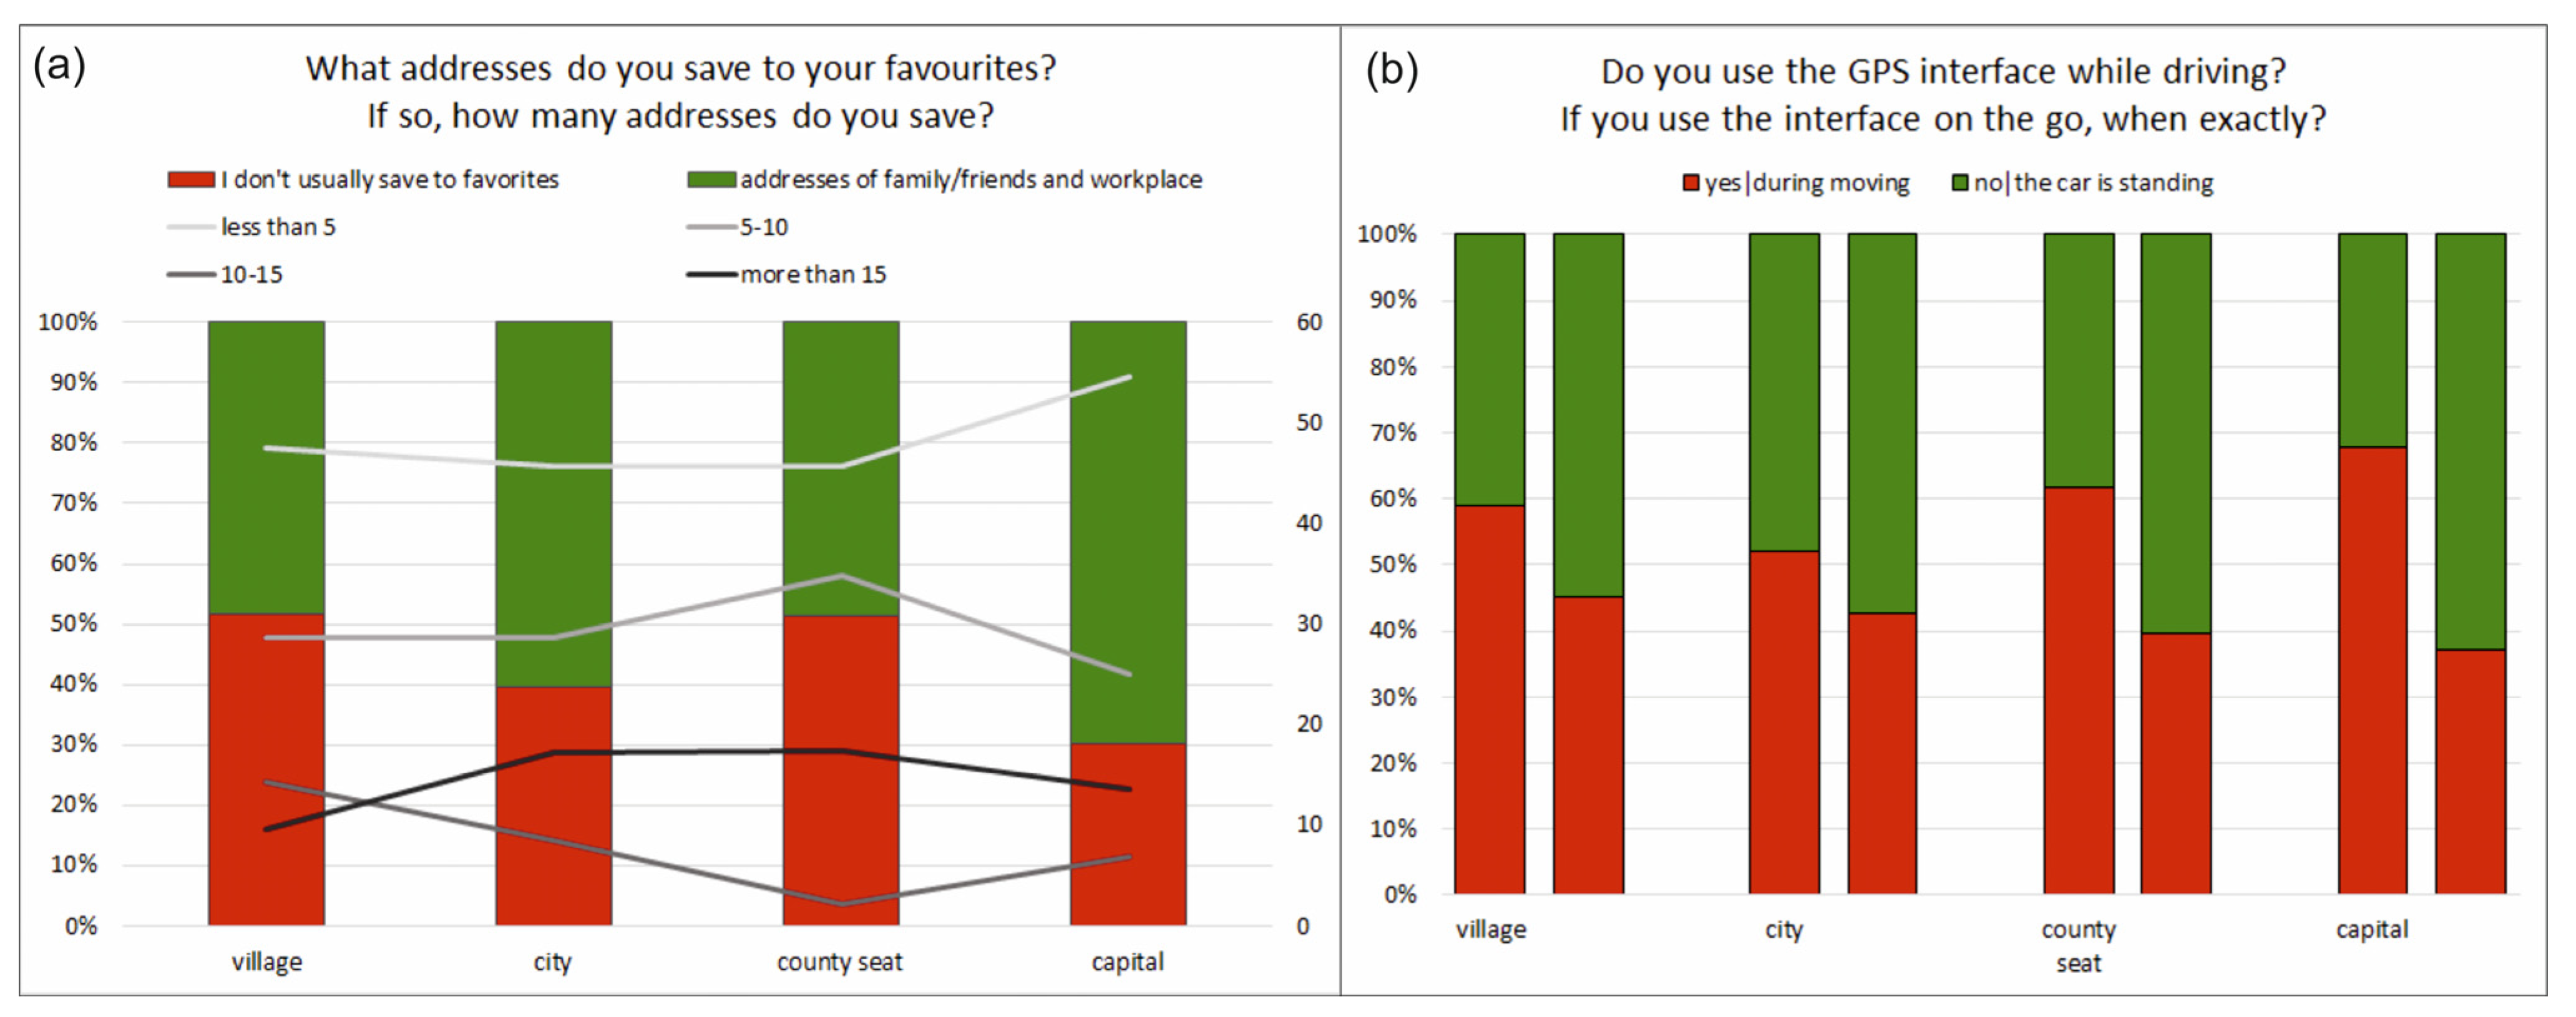
The ratio is exactly the opposite for option 2 (behind the wheel on the dashboard). Alternative routes are looked at least often in county seats. Variability can be found in specifying intermediate targets. The bigger a settlement, the less they think ahead. In villages and county seats, they prefer not to enter more, while in the capital/cities, entering addresses on the way dominates. There is also no correlation in the addresses saved/unsaved in favorites: the largest proportion (70%) of the residents of the capitals use this opportunity: about 50% save less than 5 addresses (
Figure 13a). Most people (70%) use the GPS interface while driving in the capital, but the fewest (cities) use it also, at 55%. Both “when” (60% in a standing car) and “for what” (to enter a new address) received the same proportion of answers (
Figure 13b).
3.4. Results Based on Habitat Groups
Hypothesis 4: People who grow up in different environments have different driving/navigation habits. Differences due to different financial and cultural backgrounds can be detected here.
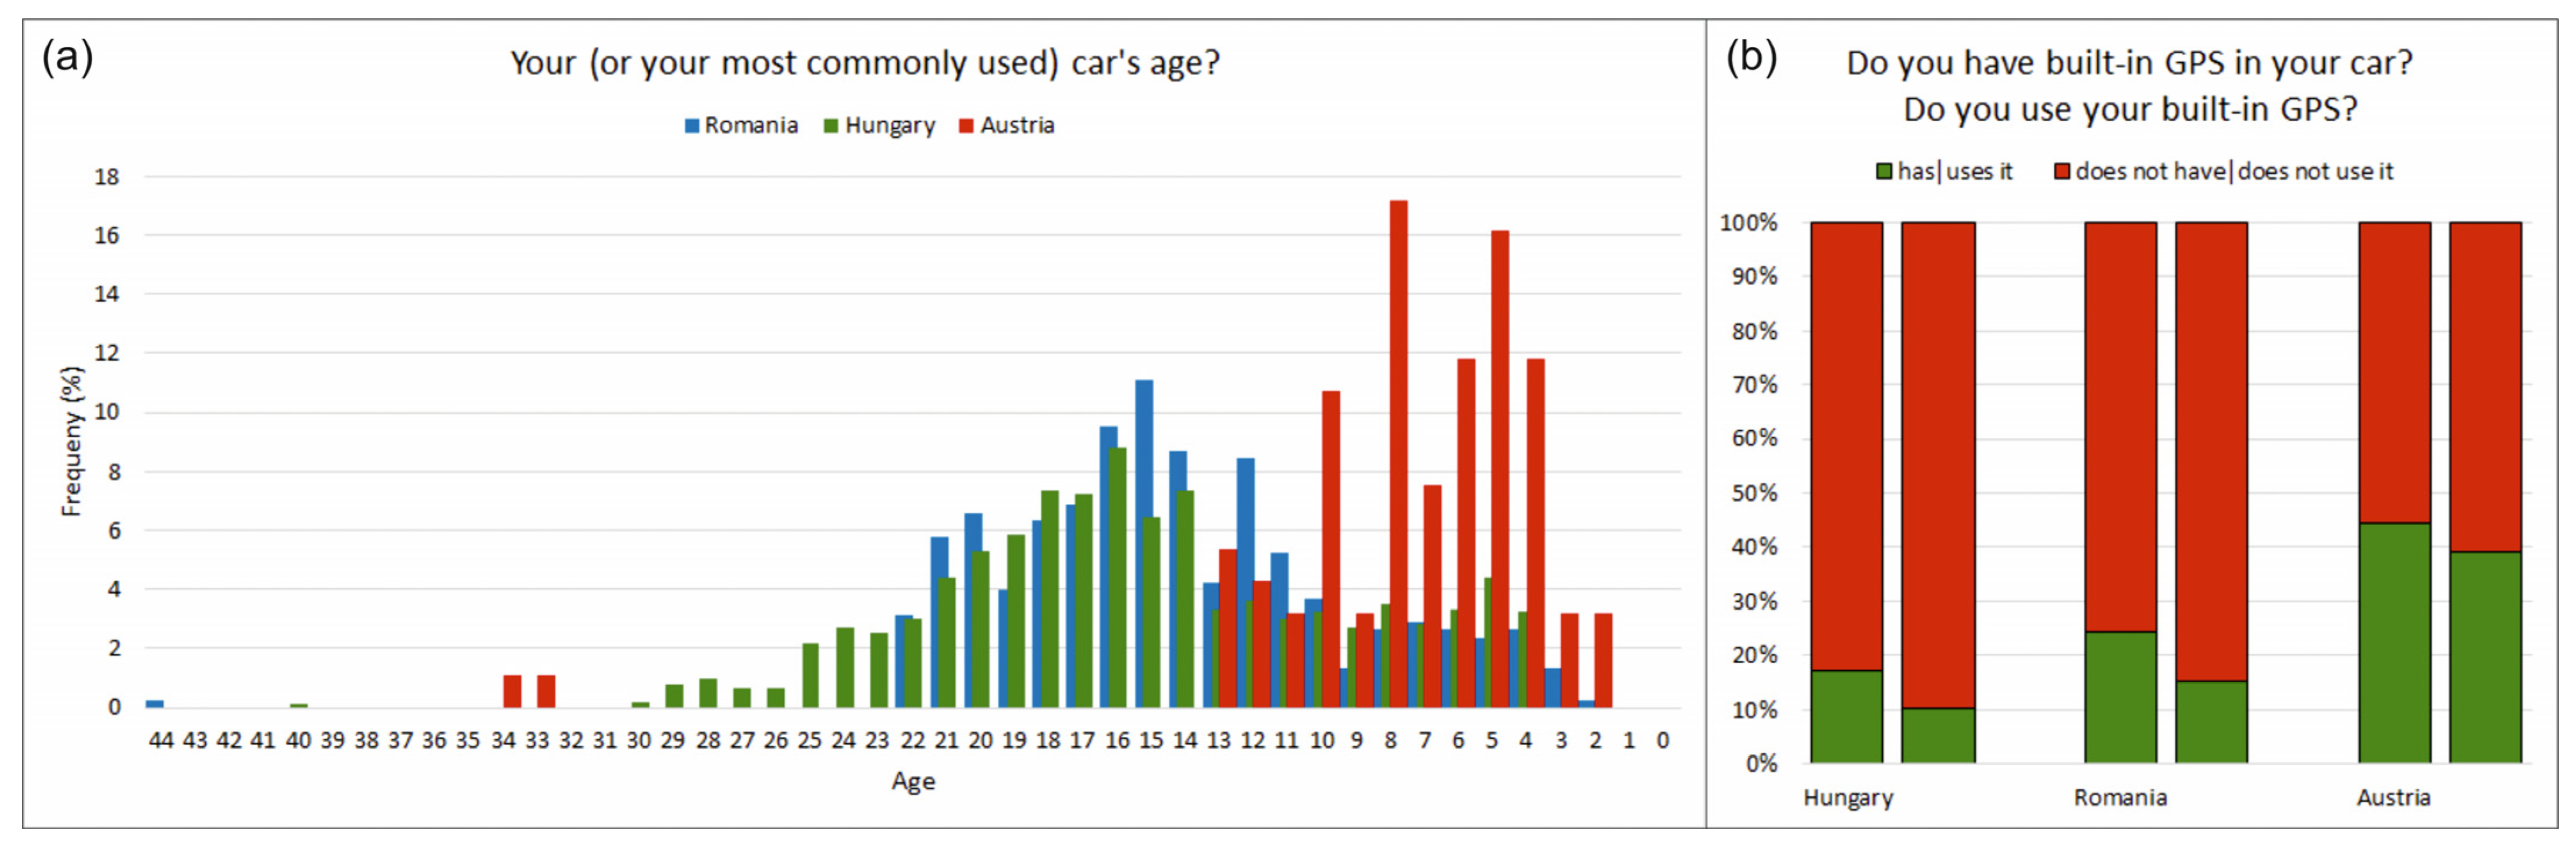
The questionnaire was completed in three countries (in this order): Hungary, Romania and Austria. There is a great difference in the age of used vehicles: while the average age of Hungarian and Romanian cars is ~15 years, the average age of Austrian cars is significantly younger, 10 years (
Figure 14a). 65% of Hungarians and 74% of Romanians bought a used car, while only 37% did so in Austria. In contrast, Austrians drive other people’s cars at a higher percentage. Hungarians and Romanians drive more often on “everyday” roads, and this proportion decreases along with further distances. While in the case of Austrians, this decrease cannot be seen.
Austrians drive abroad almost as often as they do at home, on a daily basis. Interestingly, however, looking at the average number of kilometers driven per year, it is more common for Austrians to travel less. While in the other two countries, the distances are distributed practically exactly the same (20-30-30-20%); in the case of the Austrians it is: 30-35-30-5%. Austrians would rather use a self-driving car, but even in their case, only half of the respondents answered this.
Significantly fewer Hungarian (18%) and Romanian (22%) cars have built-in GPS (Austrian: 45%). These are also the proportions in their use: Hungarians (10%) use it the least, and Austrians (40%) the most (out of all the people interviewed). If we examine the percentage of drivers who have a device in their car and use it, the situation is better. However, there is a difference here as well: 88% of Austrians and 60–63% of drivers in the other two countries use it (
Figure 14b).
GPS usage in certain situations can be seen in
Figure 15. The nature of the answers is the same in the three countries: the proportion of “always” answers increases continuously from 1 to 8. The “never” responses decrease until situation 6, and then start to increase again. The difference lies in the proportions: Austrians have fewer “always” answers than the other two countries, and more answer “usually”. The same is true for planning the road. “I don’t plan” decreases until situation 6, and then starts to increase again; while the opposite is true for planning in the car (immediately before driving): its frequency increases until situation 4, and then decreases. On everyday trips, Hungarians tend not to plan.
Three quarters of Romanians, 60% of Hungarians, and only half of Austrians update their GPS database. Austrians most commonly answered that they do not know how to update. The most common reason for not updating is that it is too complicated. None of the Romanians indicated this reason. In connection with this, 30% of Romanians update it every 3 months—in a similar proportion, only 30% do it less often than a year. Austrians perform the worst: approx. 5% do it every 3 months, while more than 60% update it less often than one year.
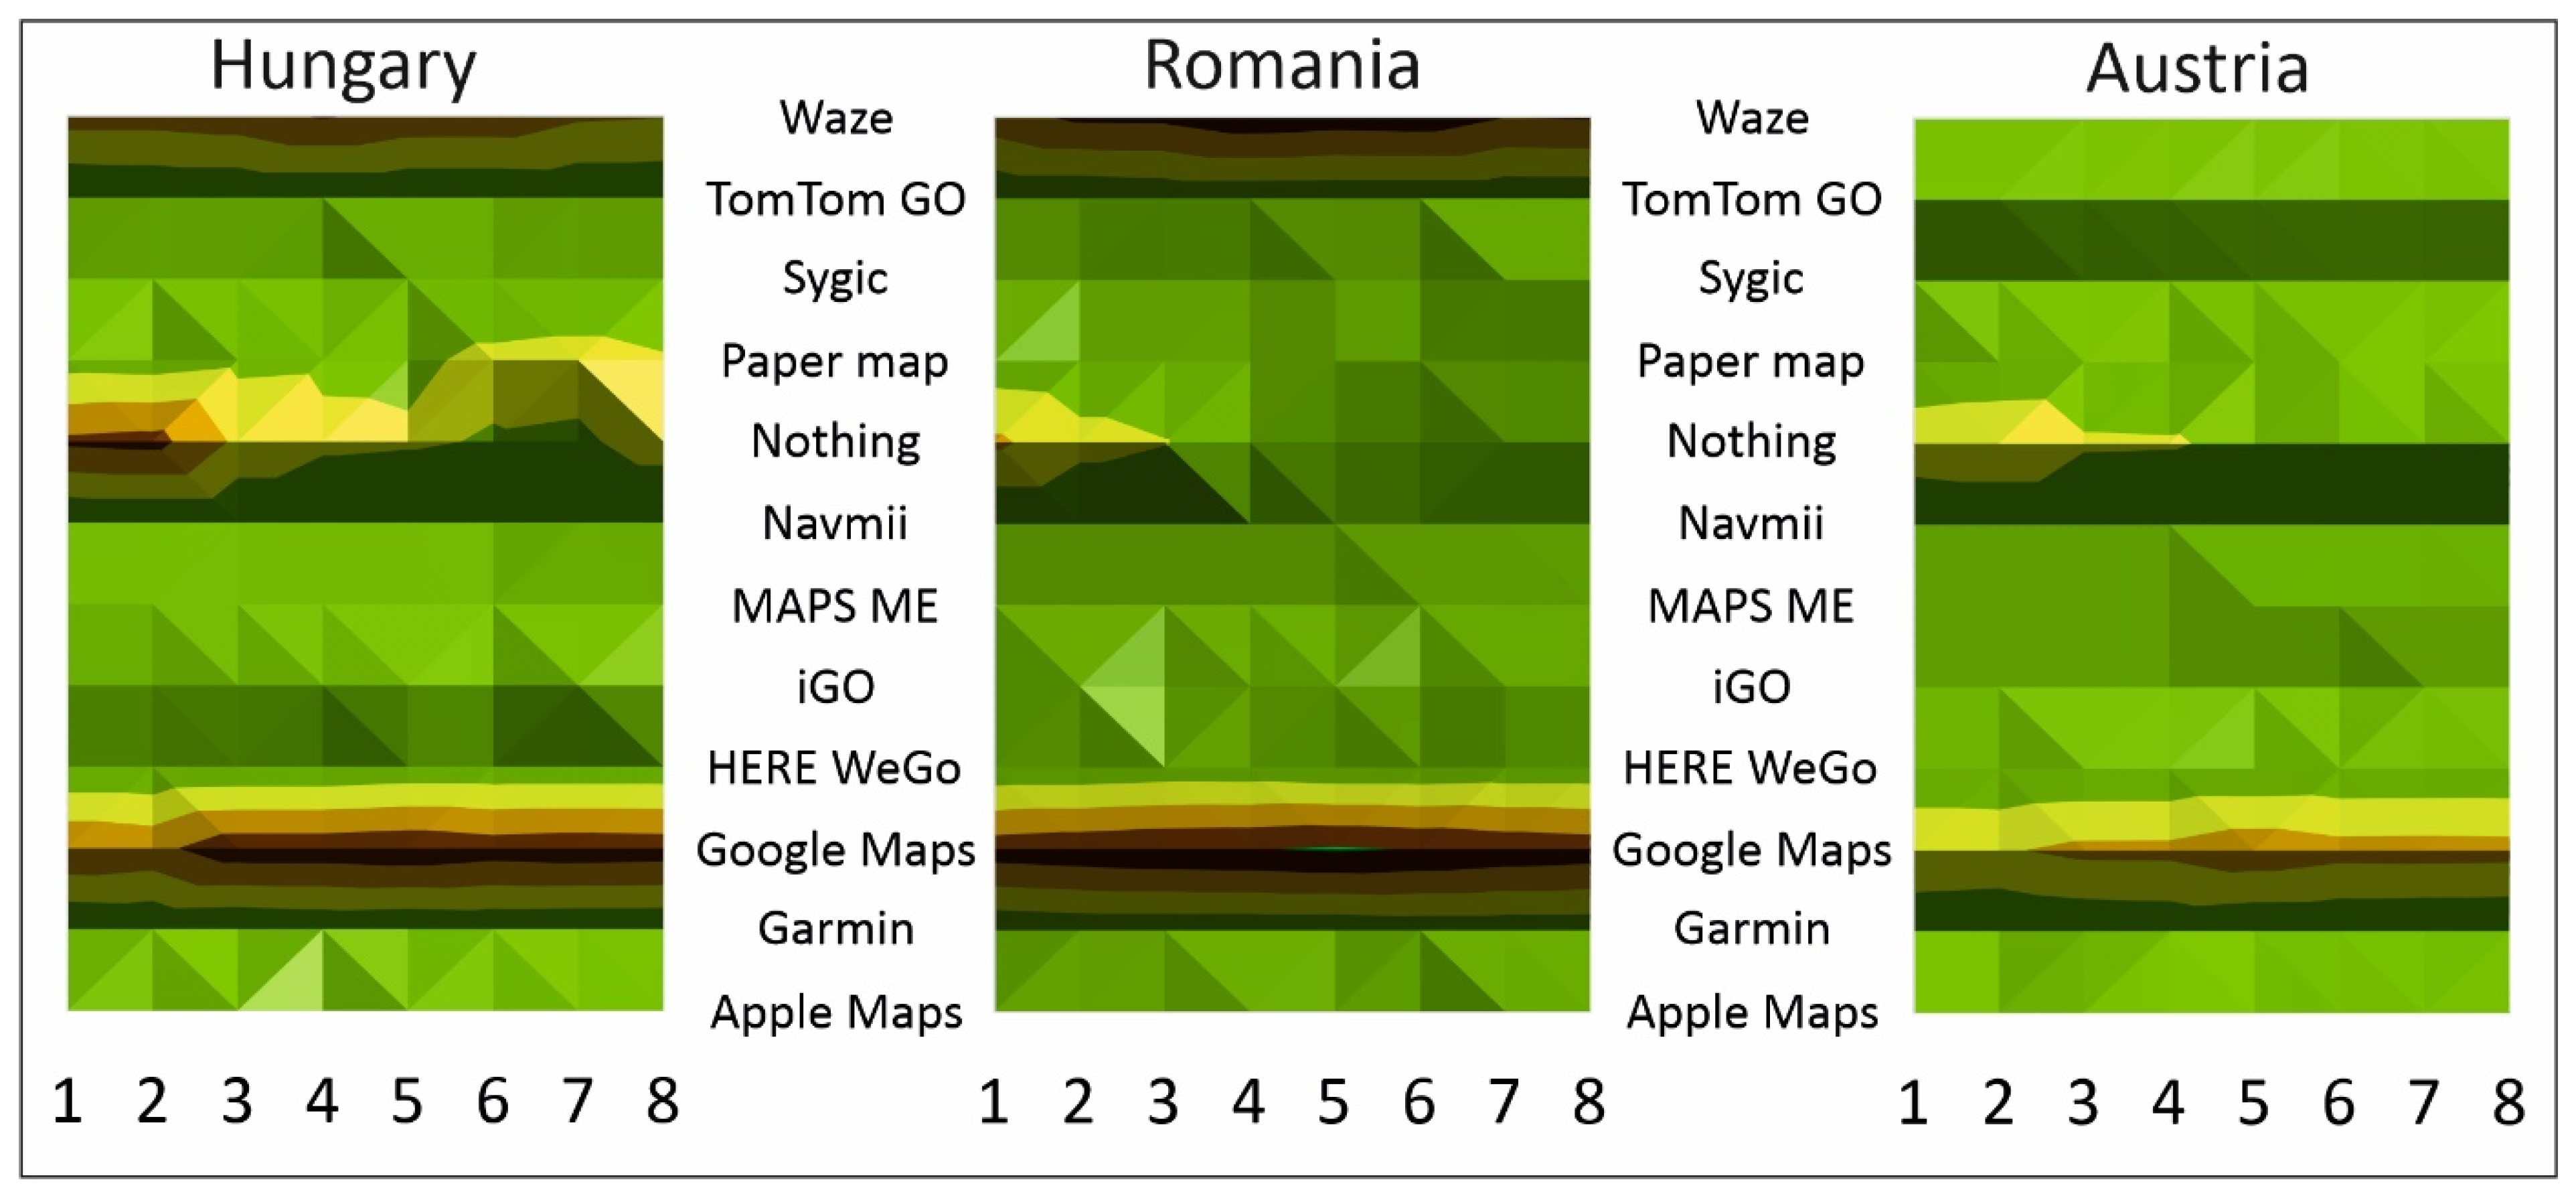
Significant differences can be observed in what applications/devices drivers use (
Figure 16). The Hungarians show the most diverse picture: regardless of the driving situation; Google Maps is used most often, closely followed by Waze. What is interesting is that both the “paper map” and “nothing else” appear in a significant percentage of all cases—especially often for everyday (“nothing else”) and foreign trips (“paper map”). The same is typical for Romanians: Google Maps and Waze are used in 40–50% of cases, but “nothing else” and “paper map” are typical only in the first three situations. They use something for navigation in all the other cases. The most homogeneous answers came from the Austrians: Google Maps dominates unanimously (60%), and in addition to “nothing else”, only Apple Maps received a significant number of votes.
Hungarians do not clearly know where they want the built-in navigation interface—the answers are split 25–25% (except for the left-handed option). In the case of Romanians, it can already be seen that the fold-out and the current placement are the favorites. The situation is the clearest with the Austrians: almost half of the respondents are satisfied with the current placement.
Concerning the night function, a very small percentage of drivers disable this function; 84% (Hun, Au) and 92% (Ro) like and use it. Romanians look at alternative routes most often—50% always, 30% occasionally. In the case of the other two countries, the results are just the opposite. The drivers of all three countries prefer to enter one point in the device at the same time—in the case of the Austrians, the “type it in advance” also appears in a significant percentage. In their case, the fewest addresses are saved to favorites: 70% save less than 5. It’s the opposite for the Hungarians, in their case the most common is to save several (up to 10) addresses.
Whether drivers use GPS while driving makes no difference: 60% do so in all three countries. Unfortunately, almost 40% do this when the car is moving—the Romanians are the most careful with only 30% doing so, while 40% prefer to stop when touching the surface.
4. Discussion
Stereotypes are based on placing one (or several) groups above or below others in a given topic—that is, comparison (usually without any scientific aspects). We did the same through the results presented above. Following the previous research, the obtained results were also tested with a statistical test.
The Pearson Chi-square (χ2) test is a statistical procedure for examining variables with (or can be converted to) discrete distributions. Nominal (or categorical) variables are considered discrete variables. There are different categorical variables, the basic expectation is that an entity (person, thing, etc.) can only fall into one category (the most common example of this type of variable is gender). But it is also a categorical variable whether someone answered the question correctly or not, and who among the potential candidates they voted for in the end. It is important to note that variables with a continuous distribution can also be made discrete by forming a finite number of categories (for example, age categories, etc.). In the case of discrete variables, the frequency of which elements/variables fall into each category can be analyzed. Relationship analysis is worth doing if we are wondering whether there is a correlation between what an individual assumes within two categorical variables—do the expected frequencies in each category differ in a random level?
We first examine whether having a built-in GPS is related to the age of drivers. In this case, the null hypothesis is that possession is independent of age. If
p > 0.05 then the null hypothesis is rejected. In
Table 3 the
p values are presented for every question. It is important to note that we are only showing whether there is a correlation—and between which groups, etc. For
p = 0.05, depicted with red numbers, we can say that there is some correlation. In cases where there were several possible answers, the results have been aggregated.
We now examine whether the stereotypes that we (and previous research) have described are supported by our results:
We assume that the older someone is, the slower and safer they drive, as they are aware of their own limitations (see previous research), and they are not aware of newer technological tools (or even if they are, they don’t use them that often). Examining the first column of
Table 5 (and the Results section), it can be seen that this is only partially true. They are more thoughtful (e.g., planning habits), drive less and pay more attention to safety (e.g., they don’t use the built-in GPS while driving), which supports what was found by others [
15,
16,
17]. Surprisingly, they know and use the device anyway. Based on these results, it seems that their GPS usage habits are the same as those of younger people.
The most common stereotype is that women cannot drive, and that the act itself is considered a male occupation. In other research, we have seen that women tend to pay more attention to safety and drive more carefully, as found in [
36,
37]. That is why they give up driving first if they deem the situation tiring/dangerous. Longer trips are preferred to be handed over to male members of the family. The other prejudice is that women are not as friendly with electronic devices. Based on the research, these stereotypes all prove to be true. However, women who have GPS use it with the same confidence as men.
When examining respondents living in different types of settlements, we might expect different driving habits. Based on the results, no differences were found.
Wherever we live in the world, we probably all have our own preconceived notions about the countries (and inhabitants) around our own country. The authors of this article are no exception—they had their own prejudices in relation to the three countries examined. Some of these turned out to be true: examining the last column of
Table 5, it can be said that the western country with a higher GDP (Austria) is clearly separated from the other two in half of the examined questions. In the other half, however, there is no difference: if we look at those who use built-in GPS, there is no difference in usage habits from this point of view. After examining the answers to the questionnaire grouped by age, gender, place of residence and habitat, the following can be said:
Hypothesis 1: Stereotypes about car navigation (and driving) have a basis.
Any driving or navigation habits are independent of habitancy. In the case of the other three aspects, a significant difference can be shown in half of the 16 examined questions. In general, most of these connected to the drivers’ earnings/financial background. Based on this, it cannot be said that there is a clear connection between certain social characteristics and driving habits.
Hypothesis 2: As we age, our driving habits get worse, and this can be detected. So, (1) we assume that due to the deterioration of health, the elderly drive less and demand more safety, and (2) they do not use electronic navigation aids as regularly as young people, because they do not know how to use them.
A difference can be shown in the (non)planning, “night mode” usage and the usage of the GPS while driving. A closer look reveals that the older age group prefers to plan ahead and does not use the device while driving—which shows that they are more thoughtful and pay more attention to safety.
Hypothesis 3: There is a demonstrable difference in the driving habits of women (bad drivers) and men (good drivers). The general opinion is, women drive less (more in the city) and less confidently and use electronic devices less.
There is a difference between giving multiple addresses (women do not do it) and using the interface while driving: men use it more, while women prefer not to do it, or if they do, only when the vehicle is stationary (e.g., at a red light). On the one hand, this shows the thoughtfulness of women, and on the other hand, that they prefer to avoid more complex tasks.
Hypothesis 4: People who grow up in different living environments have different driving/navigation habits. Differences due to different financial and cultural backgrounds can be detected.
Any driving or navigation habits are independent of inhabitancy; in the examined three countries (see more in [
56]), there are differences in planning and updating habits, although the latter may also be related to earnings.
5. Conclusions
Because stereotypes can influence how we behave, it is important to examine their legitimacy. It seems that the stereotypes we have on driving and navigation are mostly false. If the drivers have similar backgrounds, there will be no differences in their habits, even if we assume that women or older people do not understand the devices. Although, in this article, we only examined navigation and closely related driving habits, based on the fact that no clear differences can be shown in most comparisons, we can assume that there will be no significant differences in other driving habits either (e.g., in the male-female relationship). Based on the issues examined here, it would be worthwhile to examine this with comprehensive research in the future—not using an online questionnaire, but, e.g., testing with eye tracking.
The following limits can be stated during the questionnaire: (1) due to the fact that the questionnaire was online, it was more difficult to reach the older age group (it required a different form of distribution), so we were able to achieve fewer completions. (2) Since the distribution of the questionnaire began in a university environment, the age group thus reached was also a difficulty. (3) Due to the same reason, the number of fillings in the capital was also in the majority. In summary, we warn against using unfounded stereotypes as examples because it seems (with one or two exceptions that have their own social reasons) that most driving and navigation differences depend not on the social but on the material background.


