Article

Study on the Prediction of the Uniaxial Compressive Strength of Rock Based on the SSA-XGBoost Model

1
School of Environment and Resource, Southwest University of Science and Technology, Mianyang 621010, China
2
Ocean College, Zhejiang University, Zhoushan 316021, China
3
School of Resources and Safety Engineering, Central South University, Changsha 410083, China
4
School of Civil Engineering and Geomatics, Southwest Petroleum University, Chengdu 610500, China
*
Author to whom correspondence should be addressed.
Sustainability 2023, 15(6), 5201; https://doi.org/10.3390/su15065201
Submission received: 16 February 2023 / Revised: 6 March 2023 / Accepted: 10 March 2023 / Published: 15 March 2023

Abstract

:
The uniaxial compressive strength of rock is one of the important parameters characterizing the properties of rock masses in geotechnical engineering. To quickly and accurately predict the uniaxial compressive strength of rock, a new SSA-XGBoost optimizer prediction model was produced to predict the uniaxial compressive strength of 290 rock samples. With four parameters, namely, porosity (n,%), Schmidt rebound number (Rn), longitudinal wave velocity (Vp, m/s), and point load strength (Is(50), MPa) as input variables and uniaxial compressive strength (UCS, MPa) as the output variables, a prediction model of uniaxial compressive strength was built based on the SSA-XGBoost model. To verify the effectiveness of the SSA-XGBoost model, empirical formulas, XGBoost, SVM, RF, BPNN, KNN, PLSR, and other models were also established and compared with the SSA-XGBoost model. All models were evaluated using the root mean square error (RMSE), correlation coefficient (R2), mean absolute error (MAE), and variance interpretation (VAF). The results calculated by the SSA-XGBoost model (R2 = 0.84, RMSE = 19.85, MAE = 14.79, and VAF = 81.36), are the best among all prediction models. Therefore, the SSA-XGBoost model is the best model to predict the uniaxial compressive strength of rock, for the dataset tested.

1. Introduction

The uniaxial compressive strength of rock is one of the most important mechanical properties of rock and is widely used in rock foundation design, rock mass quality classification, and rock mass engineering stability analysis [1,2]. The method of determining the uniaxial compressive strength of rocks by standard laboratory rock mechanics tests requires a large number of test samples; this process is expensive and time-consuming [3]. Therefore, many scholars have proposed indirect methods to predict the uniaxial compressive strength of rock by simple easy-to-obtain indices including porosity, Schmidt rebound number, longitudinal wave velocity, etc. [4]. Therefore, the uniaxial compressive strength of rock can be economically and quickly obtained based on these indirect methods [5].
Currently, the empirical formula methodologies are the widely used methods of assessment. These methods are mainly based on statistical mathematical formulas to predict the uniaxial compressive strength of rock. Yang et al. [6] proposed an empirical formula for determining the anisotropic uniaxial compressive strength. He et al. [7] established an empirical formula for determining the uniaxial compressive strength by analyzing the relationship between the point load strength and the uniaxial compressive strength. Li et al. [8] established a more accurate prediction formula for uniaxial compressive strength based on the dry density and P-wave velocity of rock. Kahraman et al. [9] and Kilic et al. [10] analyzed the influence of the point load strength, P-wave velocity, and Schmidt hardness rebound number on the uniaxial compressive strength. A subsequent empirical regression equation was derived which had a good correlation with the dataset used. Zhang et al. [11] established an empirical formula between saturated compressive strength and natural compressive strength based on statistics, which produced good, predicted results. The empirical formula method has the advantage of the simplicity of operation when predicting the uniaxial compressive strength of rock. However, it is based on statistical principles in nature, has great uncertainty, and has a limited range of application. Furthermore, it is difficult to demonstrate the reasonableness of its prediction index selection. Therefore, a more effective prediction method is also required in engineering practice.
With the rapid development of intelligent calculation, many intelligent forecasting methods, including machine learning methods such as Ge et al.’s neural networks [12], Li et al.’s support vector machines [13], Peng et al.’s cloud model [14], and random forests, have been used to generate predict rock uniaxial compressive strength. The artificial intelligence methodology offers considerable advantages. Ma et al. [15] and Mohamad et al. [16] constructed a back-propagation neural network to predict the uniaxial compressive strength of 38 sandstone samples from two excavation sites in Malaysia, and the predicted results were very accurate. Tiryaki et al. [17] used artificial neural network (ANN) and regression tree methods to accurately predict the uniaxial compressive strength of rock from other properties of competent rock by combining principal component analysis and factor analysis. Momeni et al. [18] proposed an artificial neural network model based on particle swarm optimization for predicting the uniaxial compressive strength of rock and verified the rationality of the model. Madhubabu et al. [19] established a neural network model for predicting the uniaxial compressive strength of carbonates. The obtained results indicated that the model has better performance than the multiple linear regression analysis model. Li et al. [20] established a prediction model of shale uniaxial compressive strength considering rock density, point load strength, and longitudinal wave velocity. The analysis used a multiple linear regression 70 (MLR) and least squares support vector machine (LS-SVM) methodology. The obtained results showed that both MLR and LS-SVM can accurately predict rock uniaxial compressive strength. Matin et al. [21] indirectly predicted the uniaxial compressive strength of rock using a stochastic forest model and compared the predicted results with a multivariate regression model and generalized regression neural network (GRNN), which confirmed the rationality of the model. These works all provide a good reference value for the prediction of the uniaxial compressive strength of rock, but they fail to overcome the problems of limited forecast accuracy and range applicability. Furthermore, all of the suggested methods have high forecast risk, which has engineering implications for design looking to produce sustainable designs [22].
To overcome the shortcomings of current published research, the XGBoost algorithm was used to predict the uniaxial compressive strength of rock. XGBoost, proposed by Dr. Chen et al. [23] in 2014, is an optimization of the traditional gradient lifting decision tree (GBDT) algorithm, which overcomes the overfitting problem by reducing the complexity of the model. As a new arithmetic, it has been preliminarily applied in the field of engineering prediction. He et al. [24] proposed a forecast model of tunnel settlement monitoring based on Bayesian optimization XGBoost, which can accurately predict tunnel settlement. Ye et al. [25] combined the leave-one method (LOO) with the limit gradient lifting (XGBoost) algorithm to build a LOO-XGBoost rock blasting fragment prediction model, which provides a new idea for rock blasting fragment prediction. Xie et al. [26] applied the XGBoost algorithm to rockburst grade prediction. The authors constructed the CRITIC-XGBoost prediction model and compared it with random forest (RF) and support vector machine (SVM) to verify the rationality of the model. This study used the sparse search algorithm (SSA) to train the XGBoost algorithm to obtain an SSA-XGBoost model with high forecast accuracy and strong global search ability. In this model, compared with other traditional optimization algorithms, the sparrow search algorithm has the characteristics of fast convergence and a good optimization effect [27]. The parameters of the XGBoost algorithm are optimized, and the performance of the prediction model is improved. In this study, the SSA-XGBoost model is used to predict the uniaxial compressive strength of rock, and the prediction results are compared with those of the XGBoost, SVM, RF, and BPNN models (which have not been optimized) and those of the empirical model method to verify the actual prediction effect of the model.

2. Data Analysis

The rock sample data in this study are from the research results of Wu et al. [28] (290 groups, including magmatic, sedimentary, and metamorphic rocks). A total of 290 rock test samples constitute the training set and verification set, and the number of training set samples accounts for 70% of the total samples. The dataset contains the porosity (n), Schmidt rebound number (Rn), longitudinal velocity (Vp), point load strength (Is(50)), and uniaxial compressive strength (UCS) of each sample, as shown in Table 1.
The rock sample dataset contains many rock types, including granite, limestone, slate, dolomite, schist, marble, sandstone, calcite, claystone, etc. It corresponds to a wide range of uniaxial compressive strengths of rock, and each characteristic contains a wide range of values with high universality, as shown in Figure 1. The volume of data points in the figure represents the porosity n (%). The larger the porosity, the larger the volume of data points.
The rational selection of prediction indices is decisive for accurate prediction [29]. Considering the availability of data acquisition, the four most effective parameters are selected in this paper, namely, porosity (n), Schmidt rebound number (Rn), longitudinal velocity (Vp), and point load strength (Is(50)), were selected as prediction indices for the compressive strength of rock samples in this study. Porosity refers to the ratio of pore volume to the total volume of rock, which has great significance when predicting the hydraulic and mechanical properties of rock. The larger the porosity, the more voids and fissures there are in the rock, and the lower the strength of the rock. The Schmidt rebound number is an important index of rock mechanical properties and has an exponential relationship with the water retaining and compressive strength of rock under certain conditions [30]. Research shows that there is a specific relationship between the longitudinal wave velocity and the uniaxial compressive strength of rock [31]. It can be used as an important index to predict the uniaxial compressive strength of rock. Generally, the higher the uniaxial compressive strength of rock, the higher the longitudinal wave velocity. The point load strength is an indispensable index for predicting the uniaxial compressive strength of rocks [32]. It is of great significance for predicting the uniaxial compressive strength of fractured and hard-to-sample rocks. It is more scientific and reasonable to incorporate the index system for predicting the uniaxial strength of rocks.
A correlation analysis based on rock sample data is shown in Figure 2. The shape of the ellipse is related to the size of the correlation coefficient, and the flatter the ellipse, the more obvious the correlation. As shown in Figure 2, the correlation between most indicators is not clear; thus, the indicators are relatively independent. The porosity is negatively correlated with the Schmidt rebound number, which is related to the structure of the rock itself. Porosity is also negatively correlated with longitudinal wave velocity, which is related to longitudinal wave propagation conditions. Velocity is related to the density of the propagation medium. The more pores there are, the smaller the rock density, and the slower the wave velocity propagates. Therefore, the results are consistent with the actual situation, which further confirms the reliability of the data.
The box diagram of the original dataset shows the diagonal position in Figure 2. The data digits of most indices are not in the center of the box, and the data are asymmetrically distributed. In addition, anomalies less frequently occur. The anomalies in porosity, longitudinal wave velocity, and point load strength may be influenced by errors caused by individual rock samples during measurement due to their own factors or human factors. Overall, the data distribution is reasonable.

3. SSA-XGBoost Model

3.1. XGBoost Model

XGBoost is an extensible machine learning system [33]. It internally realizes the GBDT model and is the optimization of the traditional GBDT algorithm. The complexity of the model is greatly reduced. It effectively solves the overfitting problems often occurring in traditional models and maintains an extremely fast speed while achieving high accuracy. The XGBoost forecasting principle is to continuously add a tree model, divide the growth tree by its characteristics, and fit the residuals of the last forecast. The final forecast value is the sum of the forecasted values obtained by each tree, and the expression is:
y ^ i = Φ ( x i ) = k = 1 K f k ( x i ) , f k F
In the formula, f k is a stand-alone tree and F is the regression tree space.
As an integrated model for predicting the uniaxial compressive strength of rocks, the objective function is selected as the superposition of the loss function and penalty function because it cannot be optimized according to Euro-space:
L ( Φ ) = i l ( y ^ i , y i ) + k Ω ( f k )
where l is the loss function and Ω is the penalty function. The penalty function is expressed as:
Ω ( f ) = γ T + 1 2 λ w 2
The optimum value of the forecast result can be obtained by minimizing the objective function. To smoothly minimize the objective function, the following transformations are needed:
Assume the 0th Tree:
y ^ i ( 0 ) = 0
The first tree is obtained by adding the residuals of the 0th and 1st trees:
y ^ i ( 1 ) = f 1 ( x i ) = y ^ i ( 0 ) + f 1 ( x i )
Likewise, the Kth Tree:
y ^ i ( k ) = f 1 ( x i ) + f 2 ( x i ) + + f k 1 ( x i ) + f k ( x i ) = y ^ i ( k 1 ) + f k ( x i )
Therefore, the final loss function is expressed as:
i l ( y i , y ^ i ( k 1 ) + f k ( x i ) )
Without affecting the accuracy, the final loss function is expanded by Taylor’s second-order expansion:
i l ( y i , y ^ i ( k 1 ) ) + g i f k ( x i ) + 1 2 h i f k 2 ( x i )
In the formula, g i and h i are y ^ i ( k 1 ) first-order and second-order derivatives that are variable independent constants. The penalty function is expanded to obtain the objective function by removing the items that have no effect on the optimization of the objective function, i.e., the predicted values and residuals of the previous (k − 1) tree:
L ( t ) = j = 1 T ( i g i ) w j + 1 2 ( i h i + λ ) w j 2 + γ T
When seeking the minimum value of the formula, w j is fixed:
w j = G j H j + λ
At this point, the objective function obtains the uniquely determined minimum:
L = 1 2 j = 1 T G j H j + λ + γ T
For a tree, the objective function is calculated once for each split. When the cost of information gained from the split exceeds the limit, the tree stops splitting, and the structural score of the tree is the final objective function.

3.2. Sparrow Search Algorithm

The sparrow search algorithm is a group intelligent optimization algorithm proposed by Xue et al. [33] in 2020 based on sparrow feeding behavior. The sparrow population consists of three types of sparrows: discoverers, joiners, and vigilantes. Discoverers search for food for the population and joiners approach and compete for food once they find it. The vigilantes are predators that watch their surroundings for companions and threats, and sparrows that sense danger will sound an alarm to warn their companions away from it. In the process of foraging, the location of the three will be constantly updated to obtain the optimal food source, and the optimal food source location is the optimal solution.
To simplify the algorithm, the following assumptions are made:
(1)
When a predator approaches the sparrow population and is found by the alert, the alert will warn the population to transfer its position in time by chirping;
(2)
The identities of the discoverer and the participant can be interchanged under certain circumstances;
(3)
The lower the energy reserve level of the sparrows, the worse and more dangerous the areas where they can feed;
(4)
The joiners can compete for food with the discoverers; the winners obtain food, and the losers are forced to leave;
(5)
The discoverer has the highest stockpiling level, has the priority to locate areas containing a large amount of food, and provides the joiners with food location information;
(6)
When a predator is close to a sparrow population, individuals at the edge of the sparrow population close to the predator move to a safe area and occupy a better food search position.
The sparrow search algorithm works as Figure 3:
In the model construction, it is assumed that a sparrow population contains N sparrows, and each sparrow’s specific location is represented in the form of a matrix:
X = x 1 , 1 x 1 , 2 x 1 , d x 2 , 1 x 2 , 2 x 2 , d x n , 1 x n , 2 x n , d
where n is the number of sparrows, and d is the dimension of the variable to be optimized. Therefore, the fitness value of the sparrow is expressed as:
F X = f ( x 1 , 1 x 1 , 2 x 1 , d ) f x 2 , 1 x 2 , 2 x 2 , d f ( x n x n , 2 x n , d )
In the formula, f indicates the sparrow fitness value.
Discoverers have a high degree of adaptability in the population; thus, they have a preference for food when searching for it. Discoverers also provide food locations for the sparrows and guide them to search for food; thus, the formula for updating the location of sparrows is as follows:
X i , j t + 1 = X i , j t exp ( i α i t e r max ) i f R 2 < S T X i , j t + Q L i f R 2 S T
where t is the current iteration number, X i , j t is the ith sparrow in the jth dimension, α α 0 , 1 is a random number, i t e r max is the maximum number of iterations, R 2 R 2 0 , 1 is the security threshold, and S T is the warning value of vigilance. When the safety threshold is higher than the warning value of the alert, there are no natural enemies in the foraging environment of sparrows, and they can search and eat safely. When the alert value is higher than the safety threshold, natural enemies will appear around the sparrow flock. At this time, the alert will transmit information in a timely manner to each sparrow in the sparrow flock so that the entire sparrow flock can move out of danger and go to a new safe area to find food.
There are two types of joiners: those who are grabbing food from discoverers and those who are watching for food around them. The second type competes for food with discoverers when appropriate. If the joiner wins, it can immediately obtain the food and leave the food location, which is updated as follows:
X i , j t + 1 = Q exp ( X w o r s t X i , j t i 2 ) i f i < n 2 X p t + 1 + X i , j t X P t + 1 A + L o t h e r w i s e
where X p is the optimal position for the current discoverer to find food and X w o r s t is the current most unfavorable position. A is a matrix of 1 × d , where each element is randomly assigned to 1 and −1, and the matrix satisfies A + = A T ( A A T ) 1 . When i > n 2 , the joiner with lower fitness does not obtain food and must move to another area for foraging.
Assuming that the number of vigilantes accounts for 10% of the number of sparrows in the entire sparrow group, when a natural enemy approaches, the sparrow position is updated as follows:
X i , j t + 1 = X b e s t t + β X i , j t X b e s t t i f f i > f g X i , j t + K X i , j t X w o r s t t f i f w + ε i f f i = f f
where X b e s t is the current discoverers that find the best place for food, X w o r s t is the current discoverers that find the worst place for food, K is a random number between 0 and 1, β is a random number between 0 and 1 that obeys the normal distribution, f g is the global optimal fitness, and f ω is the global worst fitness. When the individual fitness is equal to the global optimal fitness value, the sparrow at the center of the population will approach other sparrows for safety.

3.3. SSA-XGBoost Composite Model

Using the sparrow search algorithm with strong global optimization ability to optimize some super parameters in XGBoost can enhance the prediction performance and operational efficiency of the model. To this end, 75% of the datasets are divided to train the SSA-XGBoost model, and the remaining 25% of the datasets are used as test sets to evaluate the prediction effect of the model. Then, the sparrow search algorithm parameters are set. The number of sparrows is set to 30, and the maximum number of iterations is set to 10. It is necessary to optimize the maximum number of iterations, depth, and learning rate. Finally, the SSA-XGBoost model after parameter optimization is used to predict the uniaxial compressive strength of rock. The structure of the SSA-XGBoost model used to predict the uniaxial compressive strength of rock is shown in Figure 4.

4. Prediction Results and Analysis

To test whether the SSA-XGBoost model built to predict the uniaxial compressive strength of rock is effective, the uniaxial compressive strength of rock samples is predicted and compared with the prediction results of XGBoost, SVM, RF, BPNN, and other models without superparameter optimization and the prediction effect of the empirical model method to reasonably evaluate the performance and improvement effect of the SSA-XGBoost prediction model compared with other models. The empirical formula method is based on relevant research results [34]. The empirical formula is as follows:
Empirical formula (I):
UCS = 2.96 + 0.43 × 0 . 001 × V P + 0.46 R n 0.78 n + 6.9 I s ( 50 )
Empirical formula (II):
UCS = 16.02 19.9 V P 1.79 R n 3.58 n + 45.93 I S 50 + 2.29 V P 2 + 0.02 R n 2 + 0.23 n 2 4.31 I S 50 2

4.1. SSA-XGBoost Model Parameter Optimization Results

Considering the influence of parameters on the accuracy of the model, reducing overfitting and algorithm efficiency, it was finally decided to optimize the maximum number of iterations, depth, and learning rate and compare the model with XGBoost. The maximum number of iterations is a very important indicator. If it is too small, it may not converge. If it is too large, it may cause time waste. The depth of the tree will also affect the performance of the model to a certain extent. When it reaches the specified value, it will stop splitting to avoid infinite downward division. The appropriate learning rate can make the objective function converge to the local minimum at the appropriate time. The optimization result is shown in the following Table 2:

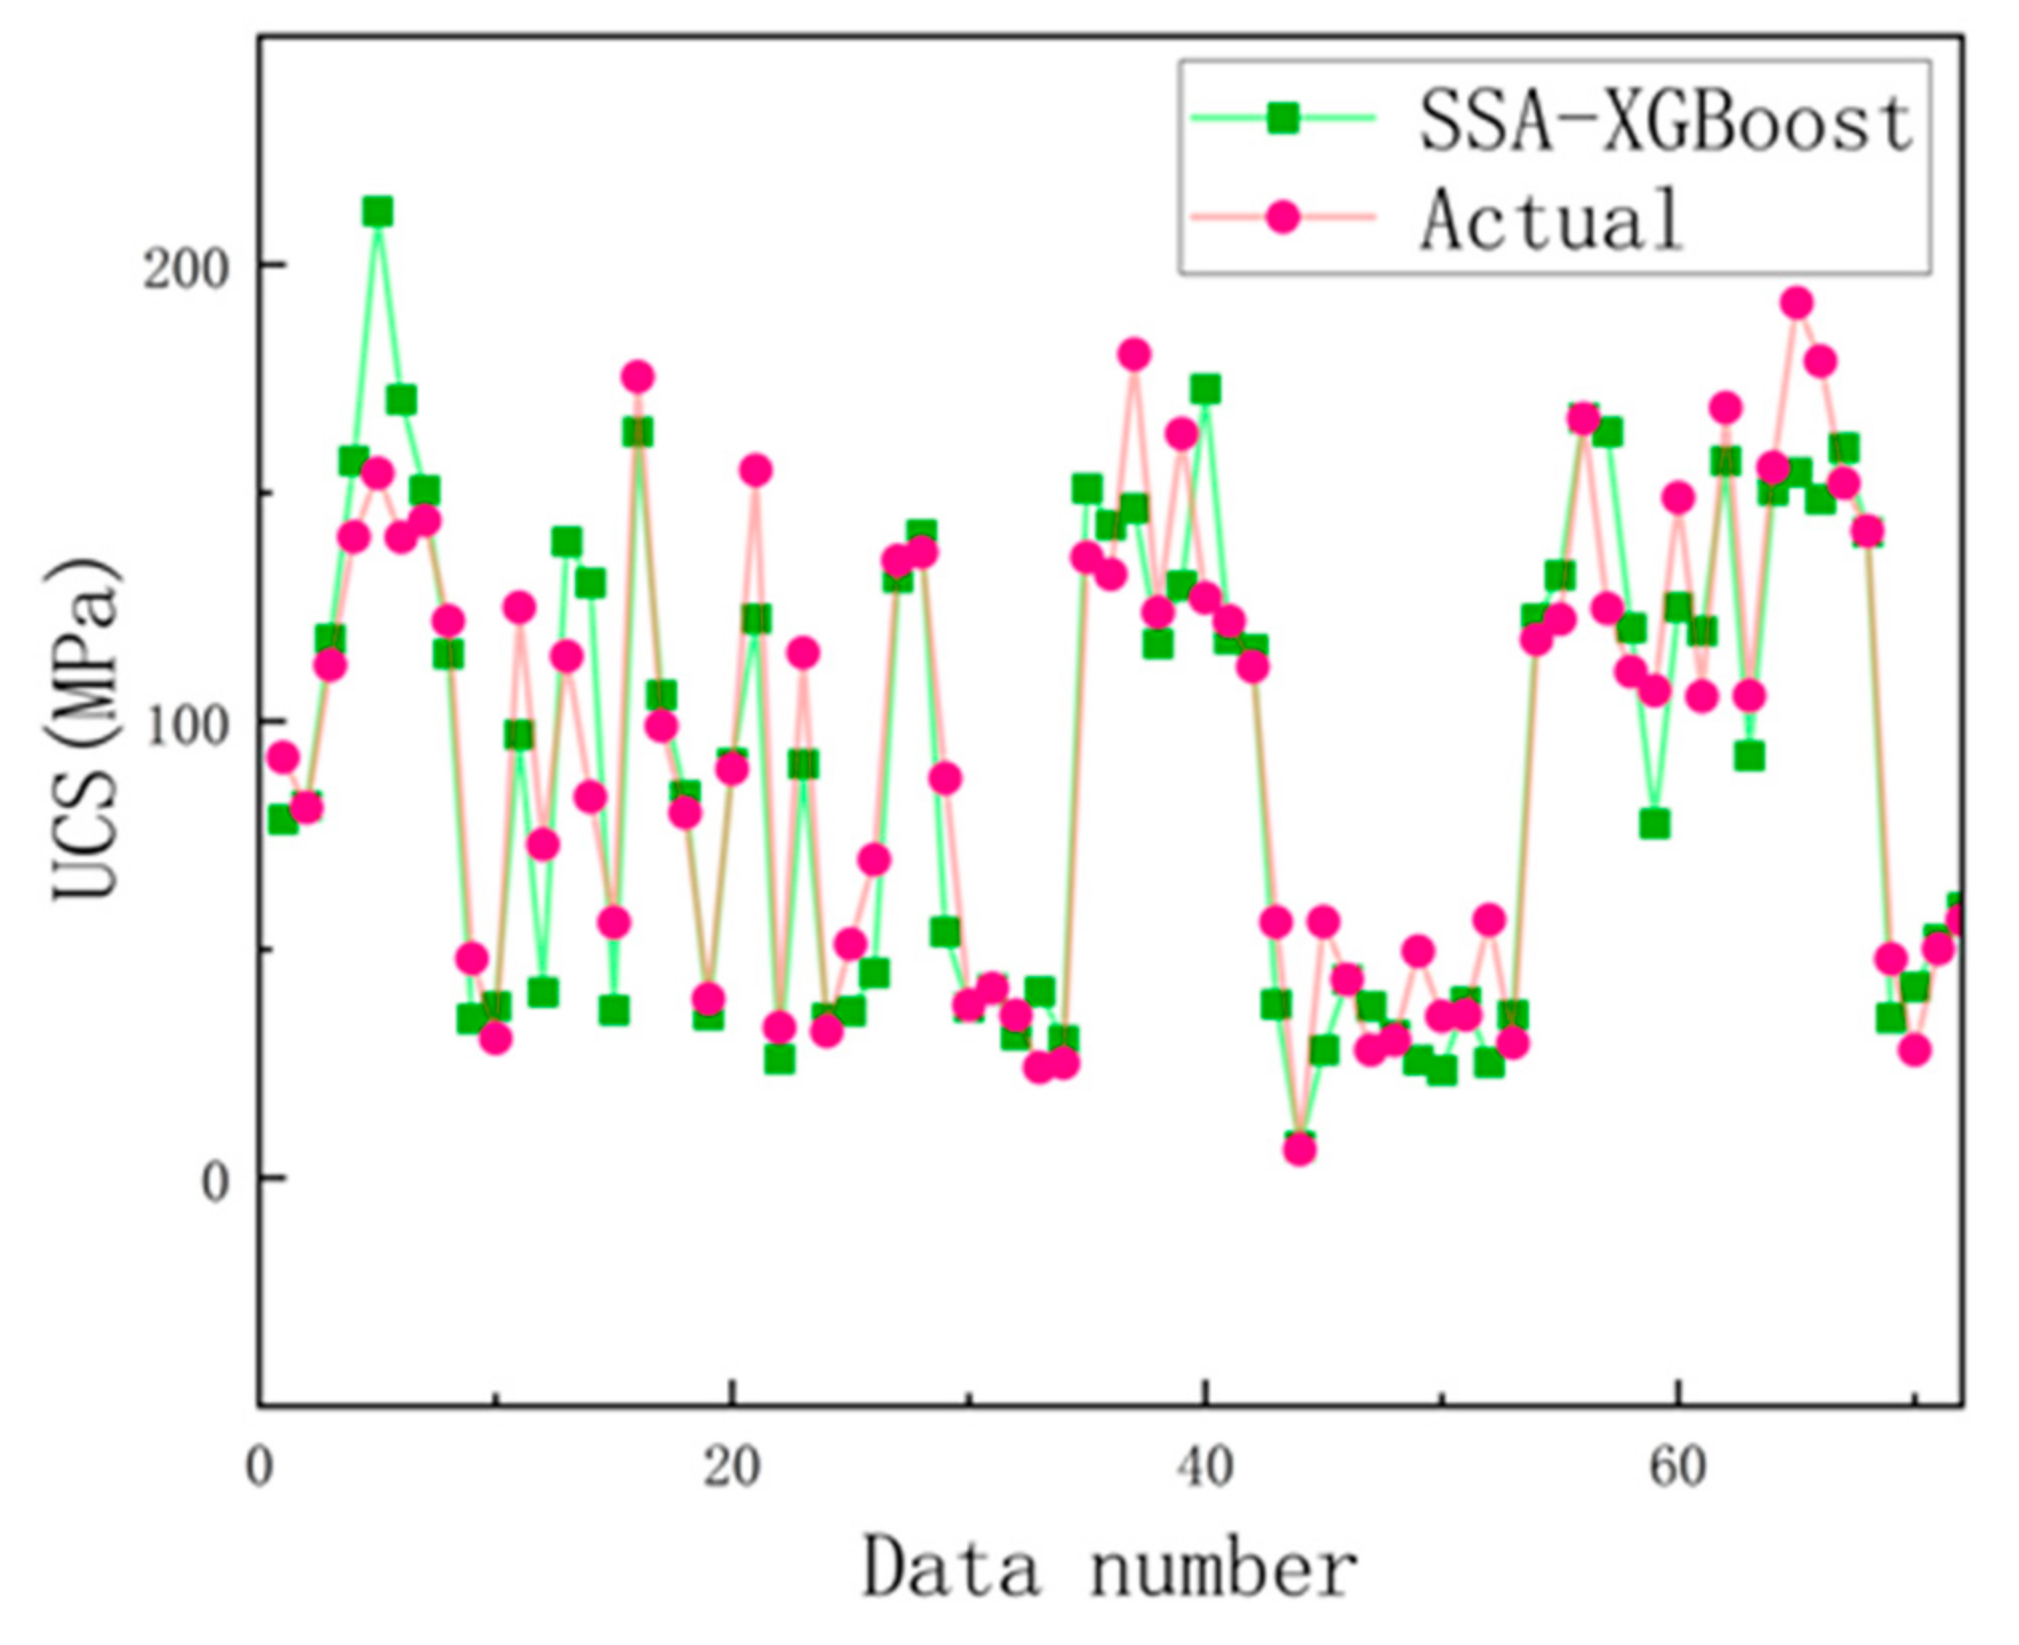
4.2. SSA-XGBoost Prediction Result Analysis

According to the abovementioned steps, the uniaxial compressive strength of 72 rock samples in the validation set was predicted according to the SSA-XGBoost model, and the prediction results of 72 groups of data are shown in Figure 5, which are highly consistent with the actual situation. Compared with the XGBoost model without parameter optimization, as shown in Figure 6, the accuracy of the prediction results of the SSA-XGBoost model has been improved to a certain extent.
To further compare the prediction performance of the SSA-XGBoost model with XGBoost, BPNN, SVM, and other models and the empirical formula method, Figure 7 shows the regression diagram of all models in the test phase. As shown in the figure, the horizontal axis represents the actual UCS value, while the vertical axis represents the UCS value predicted by the model and the predicted value calculated by the empirical equation. When the UCS predicted value is equal to the actual value, the data points will appear on the blue diagonal in each graph. Therefore, the closer are the data points to the blue diagonal, the better will be the prediction performance of the model.
To further compare the advantages and disadvantages of SSA-XGBoost with BPNN, RF, SVM, AdaBoost, RS, KNN prediction models, and the empirical formula methods, it was necessary to evaluate the changes in algorithm performance before and after the sparrow search algorithm. XGBoost parameters, the root mean square error (RMSE), correlation coefficient (R2), mean absolute error (MAE), and variance interpretation (VAF) are used to evaluate the prediction performance of all models. Thus, Equations (19)–(22) were used for calculation. The calculation results are shown in Table 3.
M A E = 1 n i = 1 n y i y i
R 2 = 1 i = 1 n y i y i 2 i = 1 n y i y ¯ 2
R M S E = 1 n i = 1 n y i y i 2
V A F = 1 var y y var y × 100
A more concise and comprehensive Taylor chart can be drawn based on the error analysis of the prediction results of various models in Table 3, excluding SVM and empirical formula (II) with poor prediction performance, as shown in Figure 8. The Taylor chart evaluates the performance of the model according to the correlation of the model prediction results, the ratio of root mean square difference, and variance [35].
In the Taylor chart, the black arc represents the standard deviation, and the green arc represents the RMSE. The closer the RMSE is to the right, the smaller the error. The blue dotted line represents the size of the correlation coefficient. The RMSE and correlation coefficient of the actual uniaxial compressive strength of rock are 0 and 1, respectively, and other model parameters have been standardized to form a contrast with them. The values are calculated according to their predicted value. It can be clearly seen from the figure that SSA-XGBoost has the best performance, followed by XGBoost and BPNN, and other prediction models have poorer prediction performance than the former.
Comprehensively considering the comparison of prediction results and error calculation results between SSA-XGBoost and XGBoost, SVM, RF, BPNN, and other prediction models and empirical formula methods, BPNN, GD, LASSO, PLSR, and SR can roughly predict the uniaxial compressive strength of rock samples, but there is a certain error compared with the actual situation. The XGBoost model can be used to accurately predict the uniaxial compressive strength of rock samples, which is basically consistent with the actual situation, with a small error. After parameter optimization, the performance of the SSA-XGBoost model is better than that of XGBoost, where the accuracy of prediction results is further improved compared with that of XGBoost. The refined methods error is extremely low. Therefore, to accurately predict the uniaxial compressive strength of rock in actual geotechnical engineering and to reduce unnecessary sample consumption when conducting indoor experiments, SSA-XGBoost has been shown to be a superior method. Compared with other currently used methods, this method can forecast the true uniaxial compressive strength of rock with a high degree of certainty. This has significant potential for geotechnical engineering and indoor rock experiments.

5. Conclusions

In this study, designed to evaluate rock uniaxial compressive strength of rock types, the SSA-XGBoost prediction model was established. According to the porosity, Schmidt rebound number, longitudinal wave velocity, and point load strength, the rock uniaxial compressive strength is predicted. The traditional empirical formula prediction method and other machine learning prediction models were compared and analyzed, and the following conclusions are drawn:
(1)
A total of 290 groups of rock sample data, including many types of rocks, were collected in the study. Based on the data, an XGBoost model was introduced, and a sparrow search algorithm was used to optimize its parameters to obtain better prediction performance, which provides a new method for predicting rock uniaxial compressive strength.
(2)
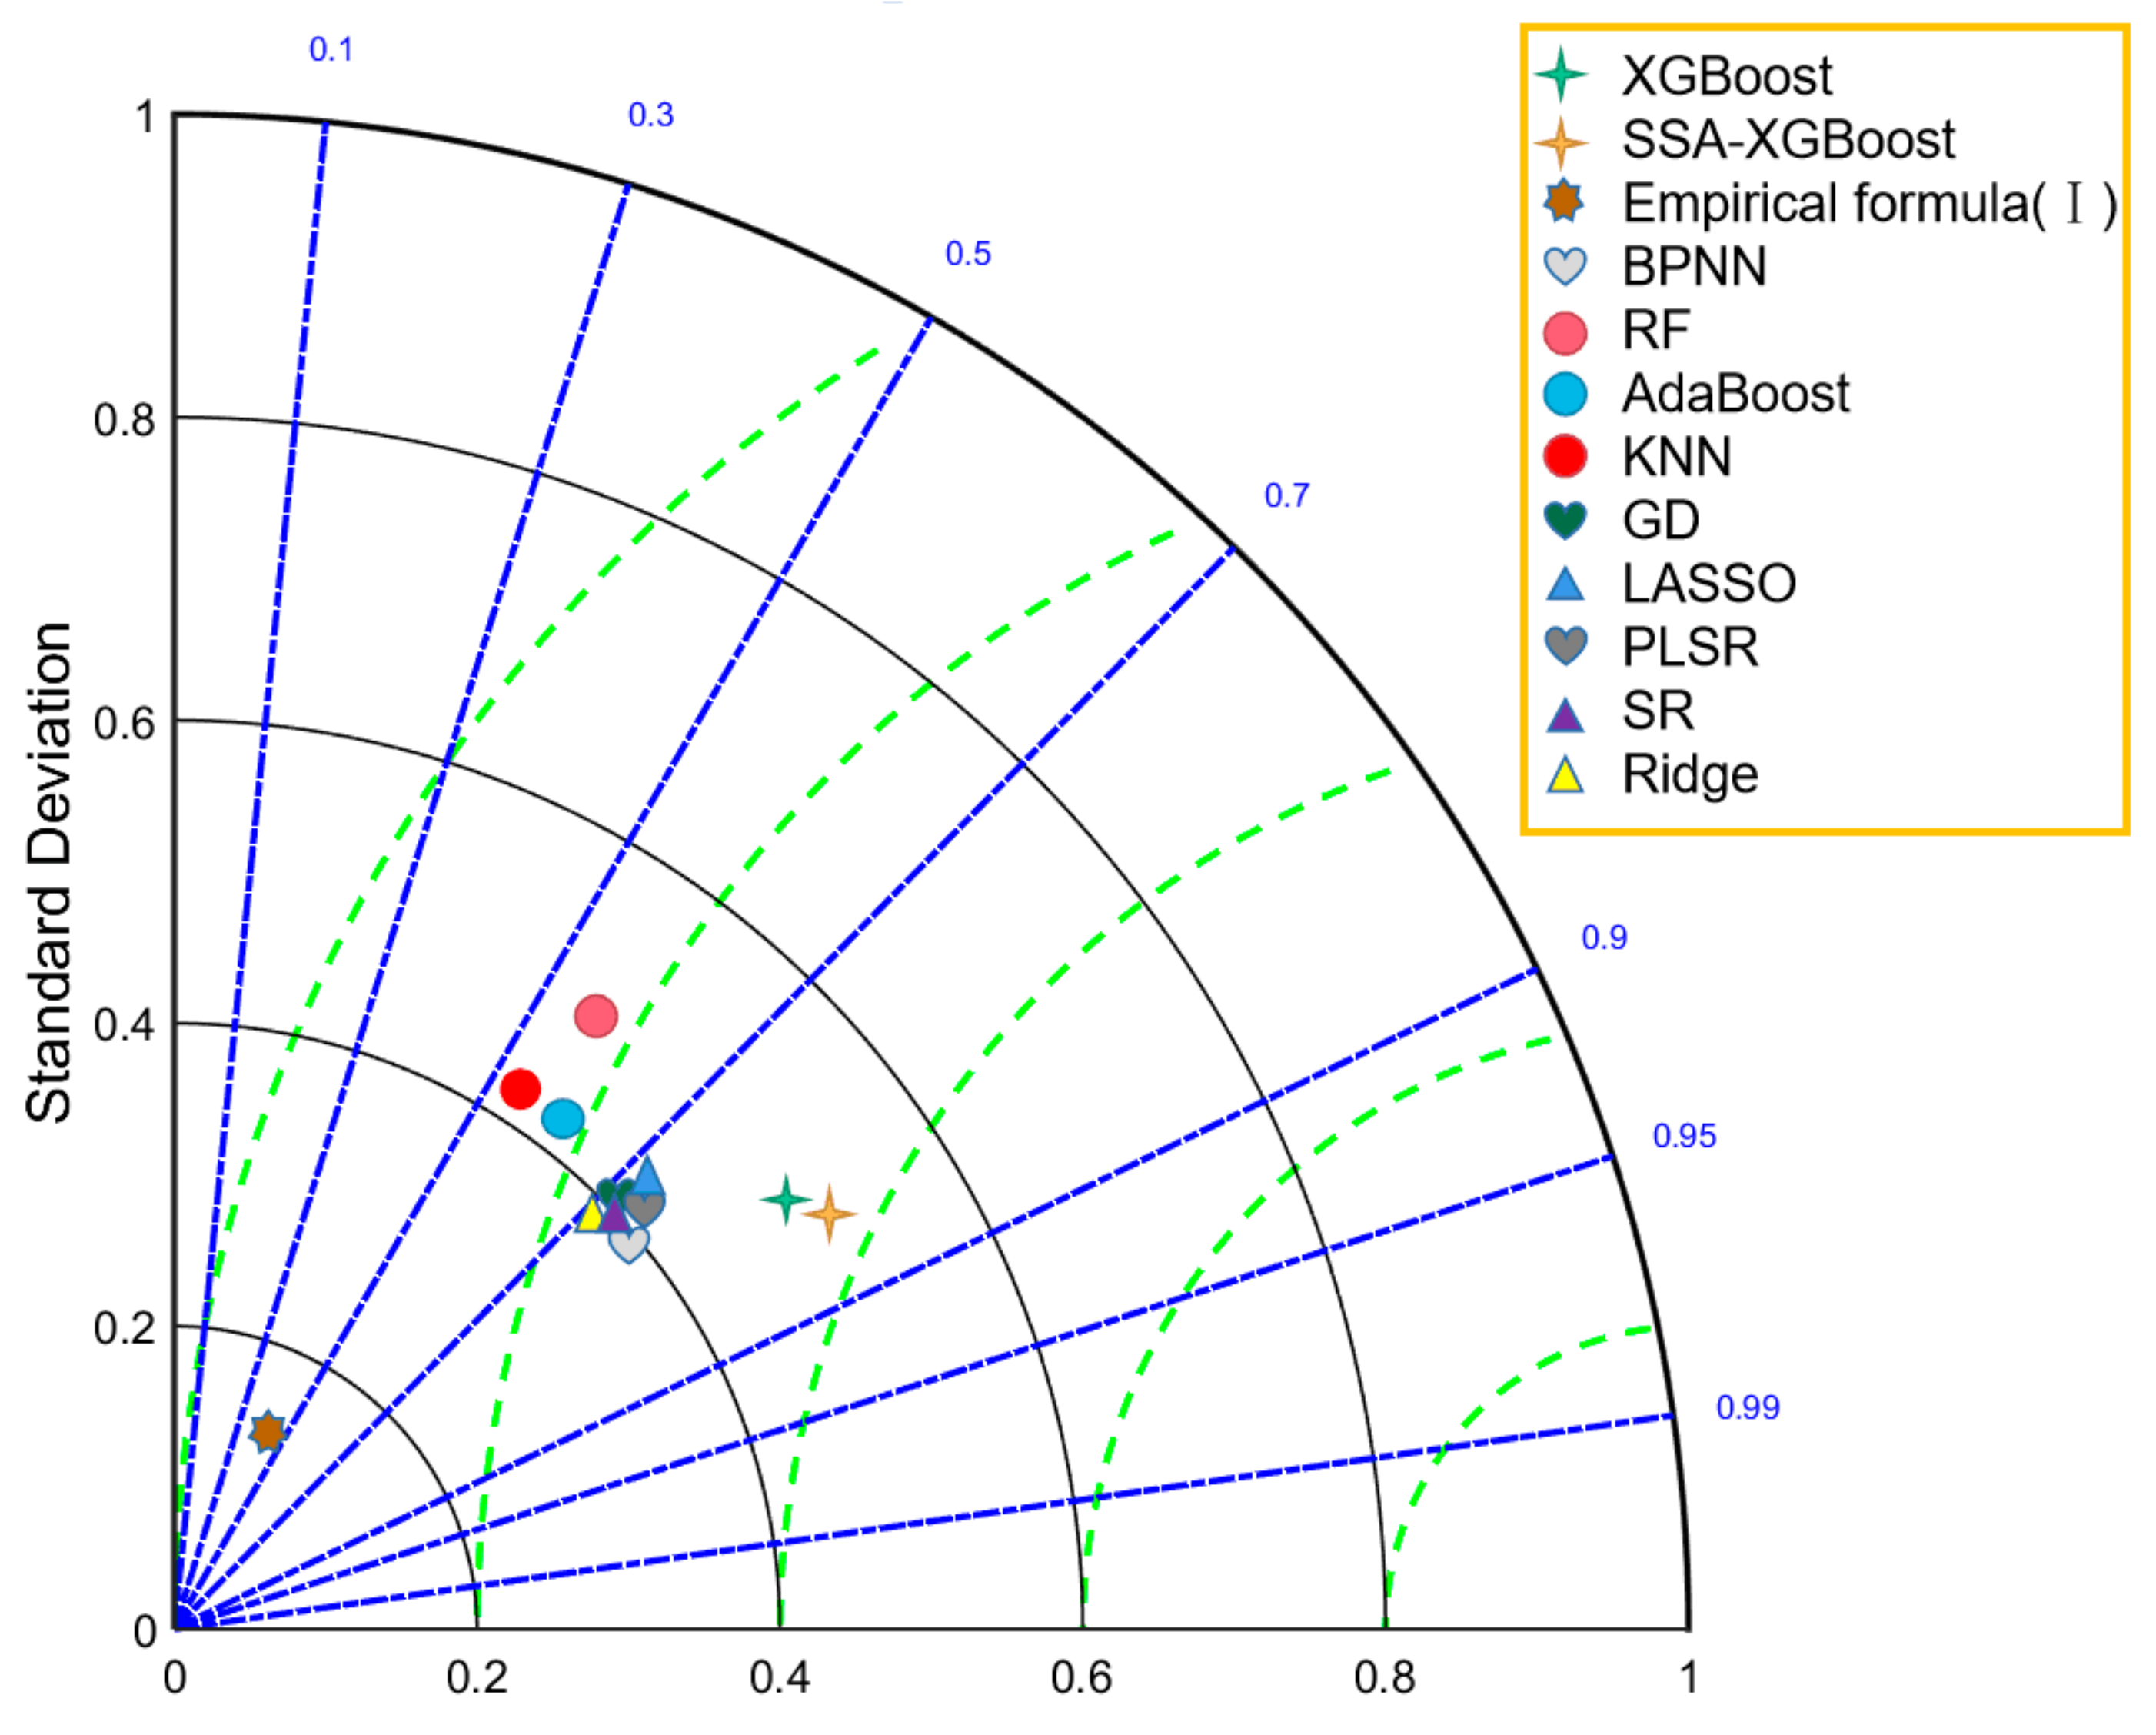
Compared with empirical formula methods and other machine learning prediction models, the SSA-XGBoost, XGBoost, and BPNN models have good R2, RMSE, VAF, and MAE values. Meanwhile, the SSA-XGBoost model (with higher R2 and VAF and lower RMSE and MAE, R2 = 0.84, VAF = 81.36, RMSE = 19.85, and MAE = 14.79) can achieve the best prediction results, which indicated that the SSA-XGBoost model has the best generalization ability and more accurate prediction results and can solve the problem that other machine learning prediction models have of lower accuracy in predicting different types of rocks.

Author Contributions

Conceptualization, T.M. and B.X.; methodology, T.M.; software, T.M.; validation, T.M., B.X. and H.L.; formal analysis, T.M.; investigation, D.W.; resources, B.X.; data curation, W.S.; writing—original draft preparation, T.M., B.X. and Y.T.; writing—review and editing, T.M. and D.W.; visualization, T.M. and H.L.; supervision, B.X., T.M. and W.S.; project administration, B.X. and Y.T.; funding acquisition, B.X. and D.W. All authors have read and agreed to the published version of the manuscript.

Funding

The research presented in this paper was jointly supported by the National Natural Science Foundation of China (grant No. 42171108).

Institutional Review Board Statement

Not applicable.

Informed Consent Statement

Not applicable.

Data Availability Statement

Not applicable.

Conflicts of Interest

The authors declare no conflict of interest.

References

  1. Chen, X. Study of uniaxial compressive strength of Shaximiao formation rock in Chongqing urban area. Rock Soil Mech. 2014, 35, 2994–2999. [Google Scholar]
  2. Li, Z.; Liu, J.; Liu, H.; Zhao, H.; Xu, R.; Gurkalo, F. Stress distribution in direct shear loading and its implication for engineering failure analysis. Int. J. Appl. Mech. 2023. [Google Scholar] [CrossRef]
  3. Li, Z.; Liu, J.; Xu, R.; Liu, H.; Shi, W. Study of grouting effectiveness based on shear strength evaluation with experimental and numerical approaches. Acta Geotech. 2021, 16, 3991–4005. [Google Scholar] [CrossRef]
  4. Xie, S.; Han, Z.; Hu, H.; Lin, H. Application of a novel constitutive model to evaluate the shear deformation of discontinuity. Eng. Geol. 2022, 304, 106693. [Google Scholar] [CrossRef]
  5. Xie, S.; Lin, H.; Duan, H. A novel criterion for yield shear displacement of rock discontinuities based on renormalization group theory. Eng. Geol. 2023, 314, 107008. [Google Scholar] [CrossRef]
  6. Yang, X.; Meng, Y.; Li, G.; Wang, L.; Li, C. An empirical equation to estimate uniaxial compressive strength for anisotropic rocks. Rock Soil Mech. 2017, 38, 2655–2661. [Google Scholar]
  7. He, L.; Fu, Z.; Wang, Q.; Fang, T.; Gao, N. Linear relationship between point load strength and uniaxial compressive strength of rock. Coal Geol. Explor. 2014, 42, 68–73. [Google Scholar]
  8. Li, W.; Tan, Z. Prediction of uniaxial compressive strength of rock based on P-wave modulus. Rock Soil Mech. 2016, 37, 381–387. [Google Scholar]
  9. Kahraman, S.; Gunaydin, O. The effect of rock classes on the relation between uniaxial compressive strength and point load index. Bull. Eng. Geol. Environ. 2009, 68, 345–353. [Google Scholar] [CrossRef]
  10. Kiliç, A.; Teymen, A. Determination of mechanical properties of rocks using simple methods. Bull. Eng. Geol. Environ. 2008, 67, 237–244. [Google Scholar] [CrossRef]
  11. Zhang, L.; Wu, N.; Wang, R.; Chen, K.; Xia, J. Study the Relationship between Uniaxial Compressive Strength of Rock Mass and Bedding Joint Dip Angle of Jurassic Shaximiao Formation in Chongqing Area. J. Nanchang Univ. (Nat. Sci.) 2022, 46, 98–102. [Google Scholar]
  12. Ge, H.; Liang, Y.; Liu, W.; Gu, X. Application of artificial neural neyworks and genetic alogorithms to rock mechanics. Chin. J. Rock Mech. Eng. 2004, 23, 1542–1550. [Google Scholar]
  13. Li, W.; Tan, Z. Research on Rock Strength Prediction Based on Least Squares Support Vector Machine. Geotech. Geol. Eng. 2017, 35, 385–393. [Google Scholar] [CrossRef]
  14. Peng, T.; Deng, H.; Lin, Y.; Jin, Z. Assessment on water resources carrying capacity in karst areas by using an innovative DPESBRM concept model and cloud model. Sci. Total Environ. 2020, 767, 144353. [Google Scholar] [CrossRef] [PubMed]
  15. Ma, T.; Lin, Y.; Zhou, X.; Zhang, M. Grading Evaluation of Goaf Stability Based on Entropy and Normal Cloud Model. Adv. Civ. Eng. 2022, 2022, 9600909. [Google Scholar] [CrossRef]
  16. Tonnizam Mohamad, E.; Jahed Armaghani, D.; Momeni, E.; Yazdavar, A.H.; Ebrahimi, M. Rock strength estimation: A PSO-based BP approach. Neural Comput. Appl. 2018, 30, 343–354. [Google Scholar]
  17. Tiryaki, B. Predicting intact rock strength for mechanical excavation using multivariate statistics, artificial neural networks, and regression trees. Eng. Geol. 2008, 99, 51–60. [Google Scholar] [CrossRef]
  18. Momeni, E.; Armaghani, D.J.; Hajihassani, M.; Amin, M.F.M. Prediction of uniaxial compressive strength of rock samples using hybrid particle swarm optimization-based artificial neural networks. Measurement 2015, 60, 50–63. [Google Scholar] [CrossRef]
  19. Madhubabu, N.; Singh, P.K.; Kainthola, A.; Mahanta, B.; Tripathy, A.; Singh, T.N. Prediction of compressive strength and elastic modulus of carbonate rocks. Measurement 2016, 88, 202–213. [Google Scholar] [CrossRef]
  20. Li, W.; Tan, Z. Comparison on Rock Strength Prediction Models Based on MLR and LS-SVM. J. Min. Res. Dev. 2016, 36, 36–40. [Google Scholar]
  21. Matin, S.S.; Farahzadi, L.; Makaremi, S.; Chehreh Chelgani, S.; Sattari, G. Variable selection and prediction of uniaxial compressive strength and modulus of elasticity by random forest. Appl. Soft Comput. 2018, 70, 980–987. [Google Scholar] [CrossRef]
  22. Tan, H.; Yang, Q.; Xing, J.; Huang, K.; Zhao, S.; Hu, H. Photovoltaic Power Prediction based on XGBoost-LSTM Model. Acta Energ. Sol. Sin. 2022, 43, 75–81. [Google Scholar]
  23. Chen, T.; Guestrin, C. XGBoost: A Scalable Tree Boosting System. In Proceedings of the 22nd ACM SIGKDD International Conference on Knowledge Discovery and Data Mining, San Francisco, CA, USA, 13–17 August 2016; pp. 785–794. [Google Scholar]
  24. He, J.; Lin, G.; Shen, X.; Xu, L.; Fei, L.; Yu, T. Prediction of Tunnel Subsidence Based on Bayesian Optimized XGBoost. Comput. Syst. Appl. 2022, 31, 379–385. [Google Scholar]
  25. Ye, H.; Hu, J.; Lei, T.; Li, N.; Wang, Q.; Ghislain, D.M. Fragmentation Prediction of rock Blasting by LOO-XGboost Model. Blasting 2022, 39, 16–21. [Google Scholar]
  26. Xie, X.; Li, D.; Kong, L.; Ye, Y.; Gao, S. Rockburst propensity prediction model based on CRITIC-XGB algorithm. Chin. J. Rock Mech. Eng. 2020, 39, 1975–1982. [Google Scholar]
  27. Li, H.; Zhang, Y.; Zhang, Y. Study of transformer fault diagnosis based on improved sparrow search algorithm optimized support vector machine. J. Electron. Meas. Instrum. 2021, 35, 123–129. [Google Scholar]
  28. Wu, S.; Wang, Y.; Zhang, H. Study on Prediction Method of Uniaxial Compressive Strength of Rocks Based on Stacking Ensemble Algorithm. Min. R D 2022, 42, 105–111. [Google Scholar]
  29. Ma, T.; Lin, Y.; Zhou, X.; Wei, P.; Li, R.; Su, J. Entropy weight-normal cloud model for water inrush risk prediction of coal seam floor. China Saf. Sci. J. 2022, 32, 171–177. [Google Scholar]
  30. Zhang, Q.; Guan, S.; Lin, J. Estimation of Uniaxial Compressive Strength by Rebound Hardness. Constr. Technol. 2020, 47, 48–49. [Google Scholar]
  31. Zhao, C.; Liu, C.; Zhou, P.; Miao, Y. Prediction of Uniaxial Compressive Strength of Granite Based on P-wave Modulus. Mod. Min. 2022, 642, 126–128, 132. [Google Scholar]
  32. Lei, S.; Kang, H.; Gao, F.; Zhang, X. Point load strength test of fragile coal samples and predictive analysis of uniaxial compressive strength. Coal Sci. Technol. 2019, 47, 107–113. [Google Scholar]
  33. Xue, J.; Shen, B. A novel swarm intelligence optimization approach: Sparrow search algorithm. Syst. Sci. Control. Eng. 2020, 8, 22–34. [Google Scholar] [CrossRef]
  34. Barzegar, R.; Sattarpour, M.; Deo, R.; Fijani, E.; Adamowski, J. An ensemble tree-based machine learning model for predicting the uniaxial compressive strength of travertine rocks. Neural Comput. Appl. 2020, 32, 9065–9080. [Google Scholar] [CrossRef]
  35. Taylor, K.E. Summarizing multiple aspects of model performance in a single diagram. J. Geophys. Res. Atmos. 2001, 106, 7183–7192. [Google Scholar] [CrossRef]
Figure 1. Scatter plot of rock sample data.
Sustainability 15 05201 g001
Figure 2. Correlation map of rock samples (r is the pearson correlation coefficient ).
Sustainability 15 05201 g002
Figure 3. Schematic diagram of sparrow search algorithm.
Sustainability 15 05201 g003
Figure 4. SSA-XGBoost prediction model structure.
Sustainability 15 05201 g004
Figure 5. SSA-XGBoost prediction results.
Sustainability 15 05201 g005
Figure 6. XGBoost prediction results.
Sustainability 15 05201 g006
Figure 7. Regression chart of model prediction results.
Sustainability 15 05201 g007aSustainability 15 05201 g007bSustainability 15 05201 g007c
Figure 8. Taylor Chart for comparison of multiple models.
Sustainability 15 05201 g008
Table 1. Rock Sample Data.
Sample Numbern/%RnVp/
(km·s−1)
Is(50)/MPaUCS/MPa
13.3527.425.663.0063.68
29.3527.385.382.8647.46
38.1430.135.093.6337.89
42.2425.755.813.1056.08
59.7627.385.353.3943.46
69.6427.634.822.5425.17
74.5026.005.593.1630.96
88.3229.755.254.0127.08
99.4529.135.393.7441.51
102.1126.135.542.7328.00
2811.18 57.00 4.763.90 143.00
2824.41 57.00 5.574.00 131.00
2830.35 60.00 6.003.00 127.00
2842.32 52.00 4.753.30 122.00
2850.66 59.00 5.842.20 112.00
2862.39 55.00 4.582.60 111.00
2870.98 50.00 4.711.70 72.00
2886.25 48.00 3.481.50 70.00
2894.17 46.00 4.501.70 62.00
29012.37 41.00 3.211.60 56.00
Table 2. Parameter optimization results.
Model Type ParameterMaximum IterationsLearning RateMaximum Depth of Tree
SSA-XGBoost880.90195
XGBoost700.94959
Table 3. Error analysis of prediction results of multiple models.
ModelR2RMSEMAEVAF
XGBoost0.8125.4317.2570.98
SSA-XGBoost0.8419.8514.7981.36
Empirical formula (I)0.4364.0350.7939.10
Empirical formula (II)−1.4383.4669.4444.80
SVM−1.4375.8856.25−103.3
BPNN0.7524.4720.1275.43
RF0.5831.7123.3057.41
AdaBoost0.6030.8824.6458.88
KNN0.5433.0026.6652.67
GD0.7126.1520.9471.21
LASSO0.7325.0322.7869.07
PLSR0.7324.9922.8173.75
SR0.7324.9622.5073.75
Ridge0.7126.8224.4765.93
Disclaimer/Publisher’s Note: The statements, opinions and data contained in all publications are solely those of the individual author(s) and contributor(s) and not of MDPI and/or the editor(s). MDPI and/or the editor(s) disclaim responsibility for any injury to people or property resulting from any ideas, methods, instructions or products referred to in the content.

