Article

Land Use Changes in the Teles Pires River Basin’s Amazon and Cerrado Biomes, Brazil, 1986–2020

by
Aline Kraeski
1,
Frederico Terra de Almeida
1,2,*,
Adilson Pacheco de Souza
1,2,
Tania Maria de Carvalho
2,
Daniel Carneiro de Abreu
2,3,
Aaron Kinyu Hoshide
3,4 and
Cornélio Alberto Zolin
5
1
Environmental Sciences, Federal University of Mato Grosso, Sinop 78557-267, MT, Brazil
2
Institute of Agrarian and Environmental Sciences, Federal University of Mato Grosso, Sinop 78557-287, MT, Brazil
3
AgriSciences, Federal University of Mato Grosso, Sinop 78555-267, MT, Brazil
4
College of Natural Sciences, Forestry and Agriculture, The University of Maine, Orono, ME 04469, USA
5
EMBRAPA Agrossilvipastoril, Brazilian Agricultural Research Corporation, Sinop 78550-970, MT, Brazil
*
Author to whom correspondence should be addressed.
Sustainability 2023, 15(5), 4611; https://doi.org/10.3390/su15054611
Submission received: 28 December 2022 / Revised: 21 February 2023 / Accepted: 24 February 2023 / Published: 4 March 2023
(This article belongs to the Special Issue Sustainable Agricultural Development Economics and Policy)

Abstract

:
The Teles Pires River basin in Brazil’s center-west has recently expanded agricultural economic development at the expense of both the Amazon rainforest and Cerrado savannah. We evaluated these changes occurring in this basin over the last 34 years. Maps were generated to determine changes in land use classifications between 1986, 1991, 1996, 2000, 2005, 2011, 2015, and 2020. The supervised classification of Landsat 5 and 8 images used the maximum likelihood algorithm. Satellite spatial data on land use downloaded from the United States Geological Survey were validated according to 1477 locations, where our research team categorized land use in the field during 2020. The growth in agricultural crops (+643%) and pasture (+250%) from 1986 to 2020 were detrimental to natural areas, such as the rainforest and savannah. The percentage increase in the agricultural areas between the evaluated years peaked around 1996 and stabilized in 2020 at 40% of the Teles Pires River basin’s land area. Land use change patterns were related to political/economic events in Brazil, forest/pasture conversions until 2011, and the change from pasture to crops from 2011 to 2020. There was greater intensity in the changes in the upper Teles Pires River basin toward the south, which expanded northward over time. Sustainable agricultural intensification is needed in such stabilized, frontier areas.

1. Introduction

Humans historically have dominated their geographical surroundings, interacting, and modifying it according to their interests. Unfortunately, this often causes degradation of the natural resources due to the different forms of environmental impacts [1]. An important example involves changes in land cover, which, when associated with the absence of conservation practices, generate impacts such as a reduction in water supply [2,3] resulting from changes in the hydrological cycle [4,5]. In Brazil, this has involved deforestation of the Amazon rainforest and habitat conversion of the Cerrado savannahs for agricultural use [6,7]. Natural habitat areas are typically converted to pasture for extensive livestock (e.g., Bos taurus Nelore beef breed) grazing and/or the export of commodity crops, such as soybeans (Glycine max L.), maize (Zea mays L.), and cotton (Gossypium sp.). These recent land use conversions and the resulting agricultural economic development have been driven by international demand for food and livestock feed [6]. Continued habitat conversions and/or changes in the climate could make the sole reliance on rain-fed agriculture more challenging if precipitation continues to decline in the Amazon [8].
In order to meet the growing needs of humans (e.g., food) and mitigate the environmental impacts of agricultural production by more efficiently using natural resources, it is essential to adopt planning policies that integrate environmental, social, and economic aspects [9]. Monitoring changes in land classifications (i.e., classes), as a function of different land uses, has become an effective tool to support land use planning. In particular, the use of technologies such as remote sensing, which can currently count on a variety of sensors operating at different scales, allow for the acquisition of information on land use classifications over large areas at low cost [10,11].
Data resulting from remote sensing can be easily processed using geoprocessing programs that make it possible to carry out different types of operations to generate information. In studies that aim to characterize land use and occupation, the application of the image classification method [12] stands out. This method consists of labeling the image pixels according to their spectral characteristics, using, for this purpose, mathematical techniques that perform the pattern recognition resulting in thematic maps [13].
Due to the global importance and recognition for the ecological services it offers, the Amazon has been monitored for decades using remote sensing and image classification products. This monitoring has sought to evaluate changes to this rich biome in order to help implement public policies for Amazon conservation. In a study carried out in the Colombian Amazon, Landsat images and supervised classification were used to map the changes in land cover and identify locations affected by deforestation over a period of sixteen years, between 2000 and 2016 [14]. Other researchers have dedicated themselves to mapping and monitoring forest changes in the Brazilian Amazon in the state of Pará from 2000 to 2019, using multitemporal remote sensing data and machine learning classification [15]. In the upper Teles Pires River basin’s transition zone between the Amazon and Cerrado biomes, previous research mapped the spatial and temporal dynamics of land use from 1986 to 2014, using Landsat images and supervised classification. The results showed an intense reduction in native vegetation as a result of agricultural expansion [16].
Several other studies around the world have already employed remote sensing to identify the forms of appropriation of spaces and changes in landscapes. Changes in land use in poor areas of China were mapped between 2013 and 2018 [17]. Another study monitored land cover changes in a district of India between 1990 and 2010 [18]. Other studies focus on mapping specific targets, such as that conducted by researchers [19], who monitored the urban spatial–temporal dynamics in Nagpur, India, between 1991 and 2010. In Brazil, one of the nationwide actions for mapping land cover and land use is the MapBiomas project, aimed at the conservation of the different Brazilian biomes, which has generated a historical series of annual maps from an initiative involving a collaborative network of specialists [20].
Our present study focused on mapping the changes that occurred in the Teles Pires River basin (Figure 1). The largest part of the Teles Pires River basin is located in the state of Mato Grosso, Brazil. The Mato Grosso state is characterized by great socioeconomic and ecological diversity, where the Pantanal, Amazon and Cerrado biomes share space [21]. Both the Amazon and Cerrado biomes are found within the Teles Pires River basin. The region has been in full economic development mode, driven by industrial agricultural exports. In the last decade, Mato Grosso has installed large hydroelectric projects, which has resulted in profound changes to the landscape, pointing to the need to monitor such changes in view of the possible impacts on the environment. Despite this region’s importance in the national and international context, the region lacks continuous monitoring of the changes in land use resulting from agricultural expansion by large farming enterprises. The goals of our research were to expand the knowledge about the land use dynamics in the region in order to better manage the water resources and plan economic activities. The objective of our study was to evaluate the changes in land use in the Teles Pires River basin over a 34-year period from 1986 to 2020.

2. Using Remotely Sensed Data for Conservation

Despite the current abundance of research that generates information on land occupation and use, globally, there is still a lack of adequate information that allows for assessing the intensity of the changes that occur in terms of land use. This makes it impossible to estimate and evaluate the effects, impacts, or potential expansion of agricultural production in ecologically diverse biomes [22]. Gradually, this deficiency has been overcome thanks to the use and improvement of technologies such as remote sensing, which facilitates the acquisition of information in large areas and allows for the collection of historical data [23].
The longest record of orbital images of the Earth’s surface already covers five decades and corresponds to the Landsat mission, which is a partnership between the National Aeronautics and Space Administration (NASA) and the United States Geological Survey (USGS), having launched the first satellite in 1972, the Landsat 1 [24]. Over the years, the Landsat mission has outdone itself with the launch of satellites carrying increasingly innovative sensors. Currently, the Landsat series includes the Landsat 8 and 9 satellites, the last one having launched in September 2021 [25]. The Landsat data set currently provides a global basis for monitoring the changes in environments due to the expansion of human occupation, data that are freely available to the public and open source [24].
Through the use of software and geoprocessing tools, the data obtained through remote sensing, such as satellite images, can be treated and processed, allowing for the extraction of information of interest and the generation of products, such as thematic maps. One of the most used processes in the generation of thematic maps from remote sensing images is so-called image classification, which can also be distinguished as being either supervised or unsupervised. The unsupervised classification is characterized by not requiring prior knowledge of the study area, as the algorithm examines the unknown pixels of the image and divides them into different classes. Meanwhile, the supervised classification demands knowledge of the study area, as it is up to the analyst to select the training pixels representative of each class, so that the algorithm performs the classification [26]. One of the most popular supervised classification methods used is the maximum likelihood algorithm [18].
The maximum likelihood algorithm is based on the probability that each pixel in the image belongs to each of the classes identified by the analyst during training. The maximum likelihood algorithm then assigns pixels to the class with the highest likelihood of being in a particular classification [27]. For this, it evaluates the variance and covariance of the spectral response of the training class when classifying the unknown pixels, generating accurate results, as it is based on statistical parameters [28].
With rapid technological advancement occurring in this area, several new methodologies have been developed and applied in satellite image processing [29], such as machine learning techniques [30], the random forest algorithm [31], neural networks, and others [32]. Even so, classic methods such as maximum likelihood continue to be used due to their easy access and availability in various software, and when well executed they result in land use and occupation data of satisfactory accuracy [33].
In order to measure the quality of the information generated in the classification of images, it is essential to validate the results, identifying the accuracy of the mapping. This can be easily obtained by comparing a set of classified pixels with terrestrial truth data [12]. The most common way of representing the accuracy of the classification of remote sensing data has been the use of an error matrix, which is the basis for a series of statistical analyzes, such as general accuracy and the kappa index [34]. Together, the error matrix and the kappa index have come to represent the standard way of evaluating the accuracy of image classification [12]. Following such verification to improve data accuracy, such remotely sensed data become more reliable for use. Thus, maps resulting from image classification can be used to follow-up and monitor changes in land use and occupation, especially in areas threatened by environmental degradation, such as tropical rainforests and savannahs.
In tropical regions, monitoring human intervention in environments is essential, given the intense pace of the conversion of the natural areas into arable areas. About half of the world’s remaining tropical rainforests are in Latin America. The tropical rainforests in both Central America and South America are also experiencing the world’s highest rates of deforestation, largely driven by large-scale commercial agricultural production [35].
Based on mapping global deforestation footprints between 2001 and 2015 [36], tropical forests are under increasing threat. This is especially the case in tropical countries, such as Brazil, with high historical deforestation footprints that have allowed for the production and export of agricultural commodities, such as cattle, soybeans, coffee, cocoa, and wood, to other countries. Thus, it is possible to associate spatial patterns of deforestation with global supply chains [37]. Massive investments have been made to support the production of export commodities in tropical countries, resulting in high rates of deforestation [38]. This activity requires significant conversion of the land for use. Governments sometimes see these investments as beneficial, by improving the use of land seen as idle, disregarding that many of these lands are occupied by traditional peoples and ignoring the ecological importance of natural systems [38].

3. Materials and Methods

3.1. Study Area

The Teles Pires River basin is located between latitudes 7°16′47″ and 14°55′17″ south and longitudes 53°49′46″ and 58°7′58″ west, occupying a territorial area of 141,524 square kilometers in the Brazilian states of Mato Grosso and Pará, within the limits of the Legal Amazon (Figure 1). Integrated into the Amazon hydrographic region, its main river is the Teles Pires, which together with the Juruena River is responsible for the formation of the Tapajós River, one of the main tributaries of the right bank of the Amazon River. The wide latitudinal extension of the basin causes it to have a diversity of environments, allowing for easy regional classification into the upper, middle, and lower Teles Pires (Figure 1). The lower and middle portions of the Teles Pires River basin are characterized by the presence of the Amazon biome, while the upper Teles Pires is marked by the Cerrado biome. The predominant climate in the area, according to Köppen’s classification, is Aw tropical climate with dry winter and rainy summer, present in the entire upper and part of the middle Teles Pires, while the rest of the basin has an Am humid tropical climate with a short dry season and more precipitation [39].

3.2. Spatial Data Sources

The area of study was delimited using the ArcGis 10.1 software, the ArcHydro extension, and the Digital Elevation Model (DEM) from the Brazilian Agricultural Research Corporation, also known as Embrapa [40]. We used Shuttle Radar Topography Mission (SRTM) data with a spatial resolution of 90 m and the drainage network from the Brazilian Institute of Geography and Statistics [41]. The ArcGis spatial data used a continuous database of the Brazilian territory using a scale of 1:250,000. These were the only spatial data sources with complete coverage for the region.
The DEM was reconditioned by imposing the drainage pattern by following an automated ArcHydro Tools algorithm in the ArcGis software (AGREE), a method that deepens the DEM in order to coincide with the vector hydrography and assists in the hydrological analyses in areas with low topographic differences [42]. Soon after, the correction of the depressions was performed and the flow direction was obtained by the eight direction pour point model method, which assumes that the water flows to one of the eight neighboring cells according to the greatest slope, used for generating the accumulated flow, and calculation of the upstream cells that drain to each cell of the raster. Spatial data in ArcGis are either shape or gridded (i.e., raster). The raster drainage network was generated using the threshold of 250 cells of accumulated flow to define the drainage. The outlet of the basin was identified, located at the coordinates 7°20′58″ south latitude and 58°7′57″ west longitude, and the area was delimited from this point.

3.3. Mapping Land Use

The data used were orbital images from the Thematic Mapper and Operational Land Imager sensors, Landsat 5 and 8, respectively. These were obtained free of charge as Level 1 products from the Earth Explorer platform of the United States Geological Survey or USGS [43]. The images are high quality for temporal analysis and have a spatial resolution of 30 m for both sensors, while the radiometric resolution is 8 bits for the Thematic Mapper sensor and 16 bits for the Operational Land Imager sensor. The ArcGis software version 10.1 and the ENVI software were used in the processing steps.
In order to characterize the changes in land use gradually, we used an average interval of five years between the classifications. The factors influencing our choice of years were the availability and quality of the data and the absence of apparent clouds. This resulted in the use of data for 1986, 1991, 1996, 2000, 2005, 2011, 2015, and 2020 (Table 1). We used data from the dry season in the region between the months of May and September, when there is low cloudiness, which favors the classification of images.
All the images were subjected to conversion from digital number (DN) to reflectance at the top of the atmosphere using the radiometric calibration module in ENVI and atmospheric correction with the FLAASH (Fast Line-of-sight Atmospheric Analysis of Spectral Hypercubes) module, based on the MODTRAN (Moderate Resolution Atmospheric Transmission) radiation transfer model, with the application of the tropical atmospheric model, resulting in surface reflectance values. Thereafter, all the processing steps were carried out in ArcGis using the spectral bands of red, near infrared, and medium infrared (measured in micrometers or μm = 1 × 10⁻⁹ km), corresponding to bands 3 (0.63–0.69 μm), 4 (0.76–0.90 μm), and 5 (1.55–1.75 μm) of the Thematic Mapper (TM) sensor and 4 (0.64–0.67 μm), 5 (0.85–0.88 μm), and 6 (1.57–1.65 μm) of the Operational Land Imager (OLI) sensor. Mosaics were created and the red, green, blue (RGB) color composition was generated using the combination of bands 5, 4, and 3 for the TM, and 6, 5, and 4 for the OLI, which facilitates the interpretation of images, favoring the identification of vegetated areas [44].
Supervised classification was then used for identifying the classes present in the area and selecting representative samples, which consisted of the training phase of the classifier. At this stage, techniques for the visual interpretation of the images, based on elements such as color, texture, shape, and pattern, were employed, creating interpretation keys for the features [45]. In order to obtain better results in view of the variability of the spectral responses identified for some classes, resulting from the different stages in the development of the vegetation or crops, these classes were divided into subclasses in the training and classification steps, and the sample sets by classes/subclasses had a value greater than 1000 pixels.
The algorithm adopted for the classification was the maximum likelihood, which among the conventional classifiers is efficient in the classification of medium-resolution images [18,28]. From the information determined during training, the algorithm calculates the probability of the pixels of the image belonging to each class and assigns them to the one with the highest probability [27]. After classification, the subclasses were grouped, resulting in the classes summarized in Table 2.
The classifications were subjected to post-processing with the application of a filter that eliminates isolated pixels on the map, replacing their values based on contiguous neighbors, using the majority filter tool. The files were finally converted into vector format and the areas occupied by each class/year were calculated. In order to check for regional differences, the data were segmented based on the water planning units established by the National Water Agency (ANA), which divides the basin into the upper, middle, and lower Teles Pires [46]. To detect the area conversions that occurred, a method for comparing different classifications was used, based on the area of polygons in 1986 and 2020. Using the intersection tool in the ArcGis software, the two maps were crossed (1986 and 2020), making it possible to identify the areas that remained in the same land use and occupation class during the period, and the areas that were converted to other classes. Such data were compiled using cross tabulation resulting in an area conversion matrix, similar to that produced by [17]. The area conversion matrix was used to identify the land use classes with the most significant modifications. Thus, changes in land use were compared between all the mapped time periods.

3.4. Mapping Validation

Information from ground truth was acquired to estimate the accuracy of the classifications. During field expeditions in 2020, 1477 points distributed throughout the area were collected (Figure 2), specifically 42 for water, 350 for forest, 77 representing Cerrado, 621 for pasture, 323 in crops, and 64 others. The 2020 images used in the classification were dated between 10 June and 17 July 2020, and field visits were carried out between 26 July and 28 September 2020.
In order to assess the mapping accuracy of all classified years and obtain better distribution of samples and more significant sample sets, samples were also selected through visual identification using high-resolution historical images from the Google Earth platform and Landsat images with dates close to those of the classifications. For the years 1986, 1991, and 1996, due to the absence of high-resolution images, sampling was performed exclusively with Landsat images. To ensure total independence in the validation, samples coinciding with the areas used in the classify training were not used.
Each point collected was associated with the class present at the site and its geographic coordinates, and these data were compared with those of the corresponding classifications, enabling the construction of error matrices. These were then used to calculate the overall, producer, and user accuracy indices [34], and the kappa index [47].
Using the same sample set of points created in the previous step, an agreement analysis was used between the classification results and the data set produced by the MapBiomas project [48]. Confusion matrices were based on the methodology from Shimabukuro et al. 2020 [31]. This type of matrix shows the classification accuracy of remotely sensed spatial data (e.g., MapBiomas) compared to ground truth classification from our ground surveys (Figure 2), as well as from other geographic and spatial sources. Differences in legend between the mapping in this study and MapBiomas were adjusted according to Table 3. As there is no class corresponding to the burned area in MapBiomas, samples from this category were not used in the analysis. The area values of the MapBiomas mapping per class were also quantified for comparison with the areas obtained in the mapping of this study.

4. Results

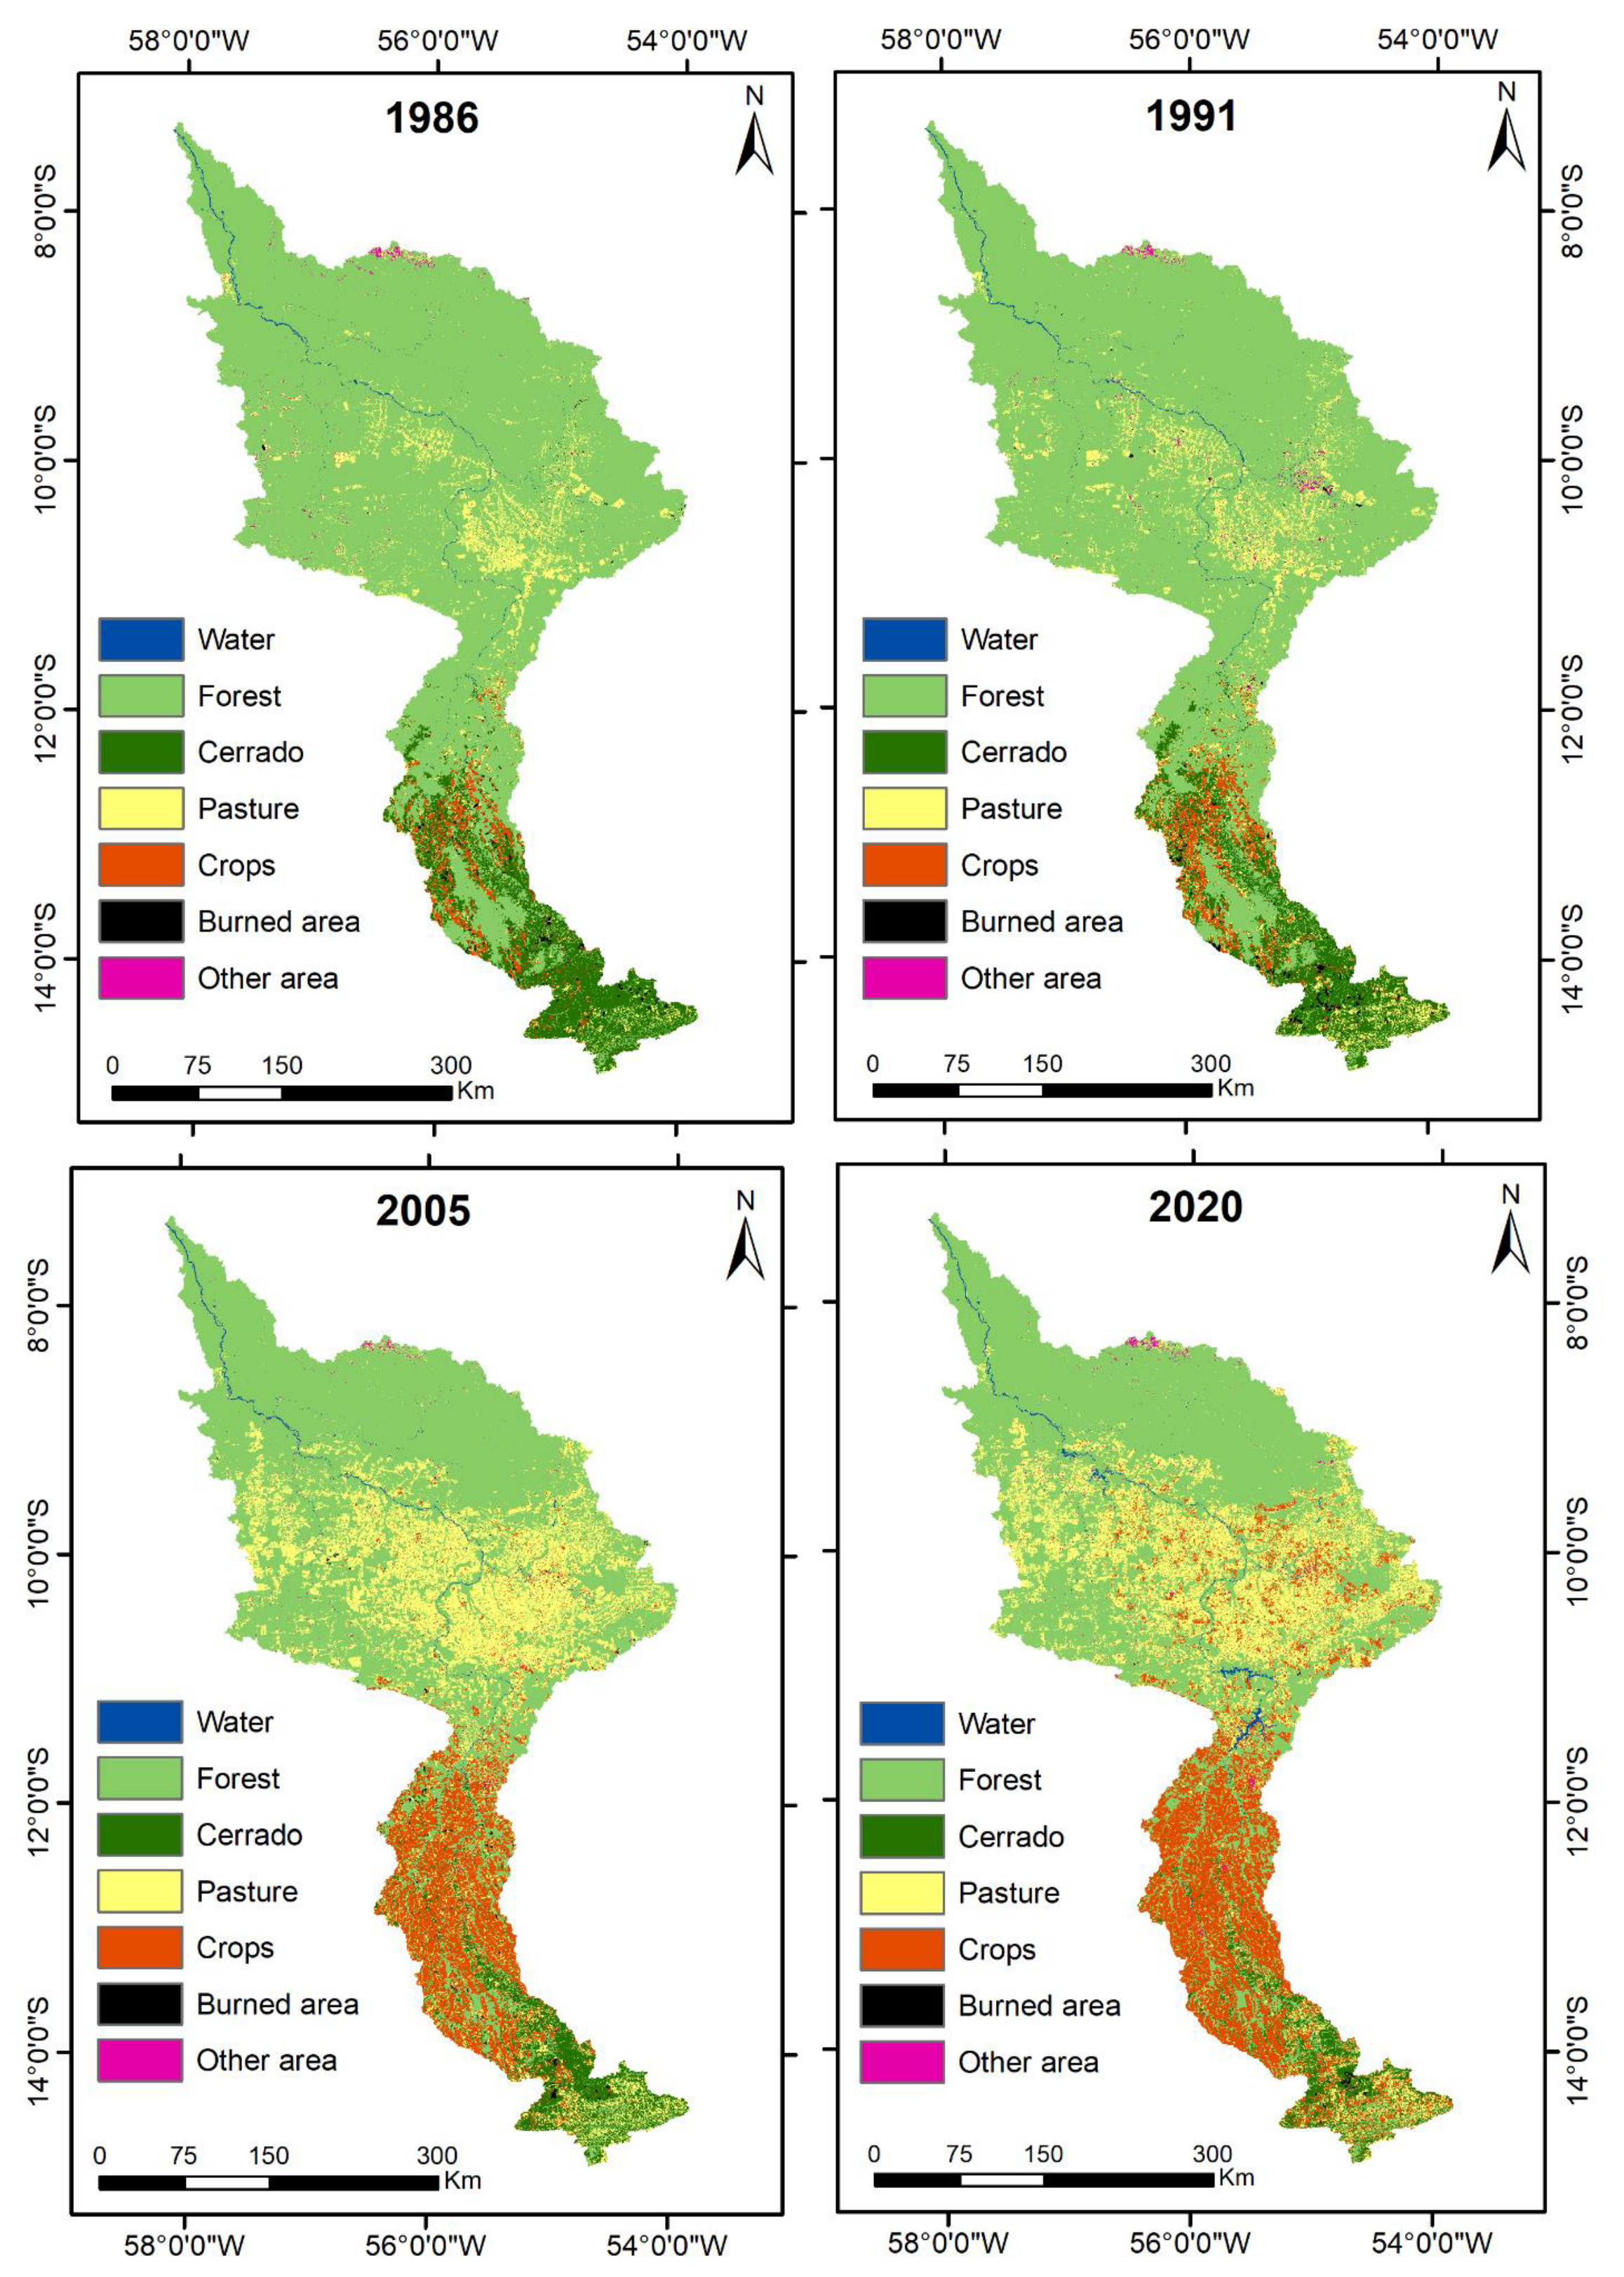
The Teles Pires River basin has an area of 141,524 square kilometers (km2), of which 34,453 km2 corresponds to the region of the upper Teles Pires, 55,890 km2 to the middle Teles Pires, and 51,181 km2 to the lower Teles Pires. These regions represent 24.34%, 39.49%, and 36.16% of the basin, respectively. Figure 3 and Figure A1 show the maps obtained in the classification of land use for the basin between 1986 and 2020. The results of the accuracy indices generated in the validation step are shown in Table 4, Table 5, Table A1 and Table A2.
The overall accuracy of the classifications based on Google Earth and Landsat data varied between 97.97 and 98.73%, while the kappa index values were between 0.96 and 0.97 (Table 4), classified as excellent according to the evaluation proposed by [49]. The general accuracy obtained for 2020, considering only the data collected in the field, was 89.44%, and the kappa index was 0.85 (Table 5), still considered excellent for being in the range of 0.80 and 1 [49]. The agreement between the mapping generated in this study and that of the MapBiomas project also had a satisfactory result, with overall accuracy between 91.60 and 96.56%, and a kappa index between 0.83 and 0.94 (Table A1 and Table A2).
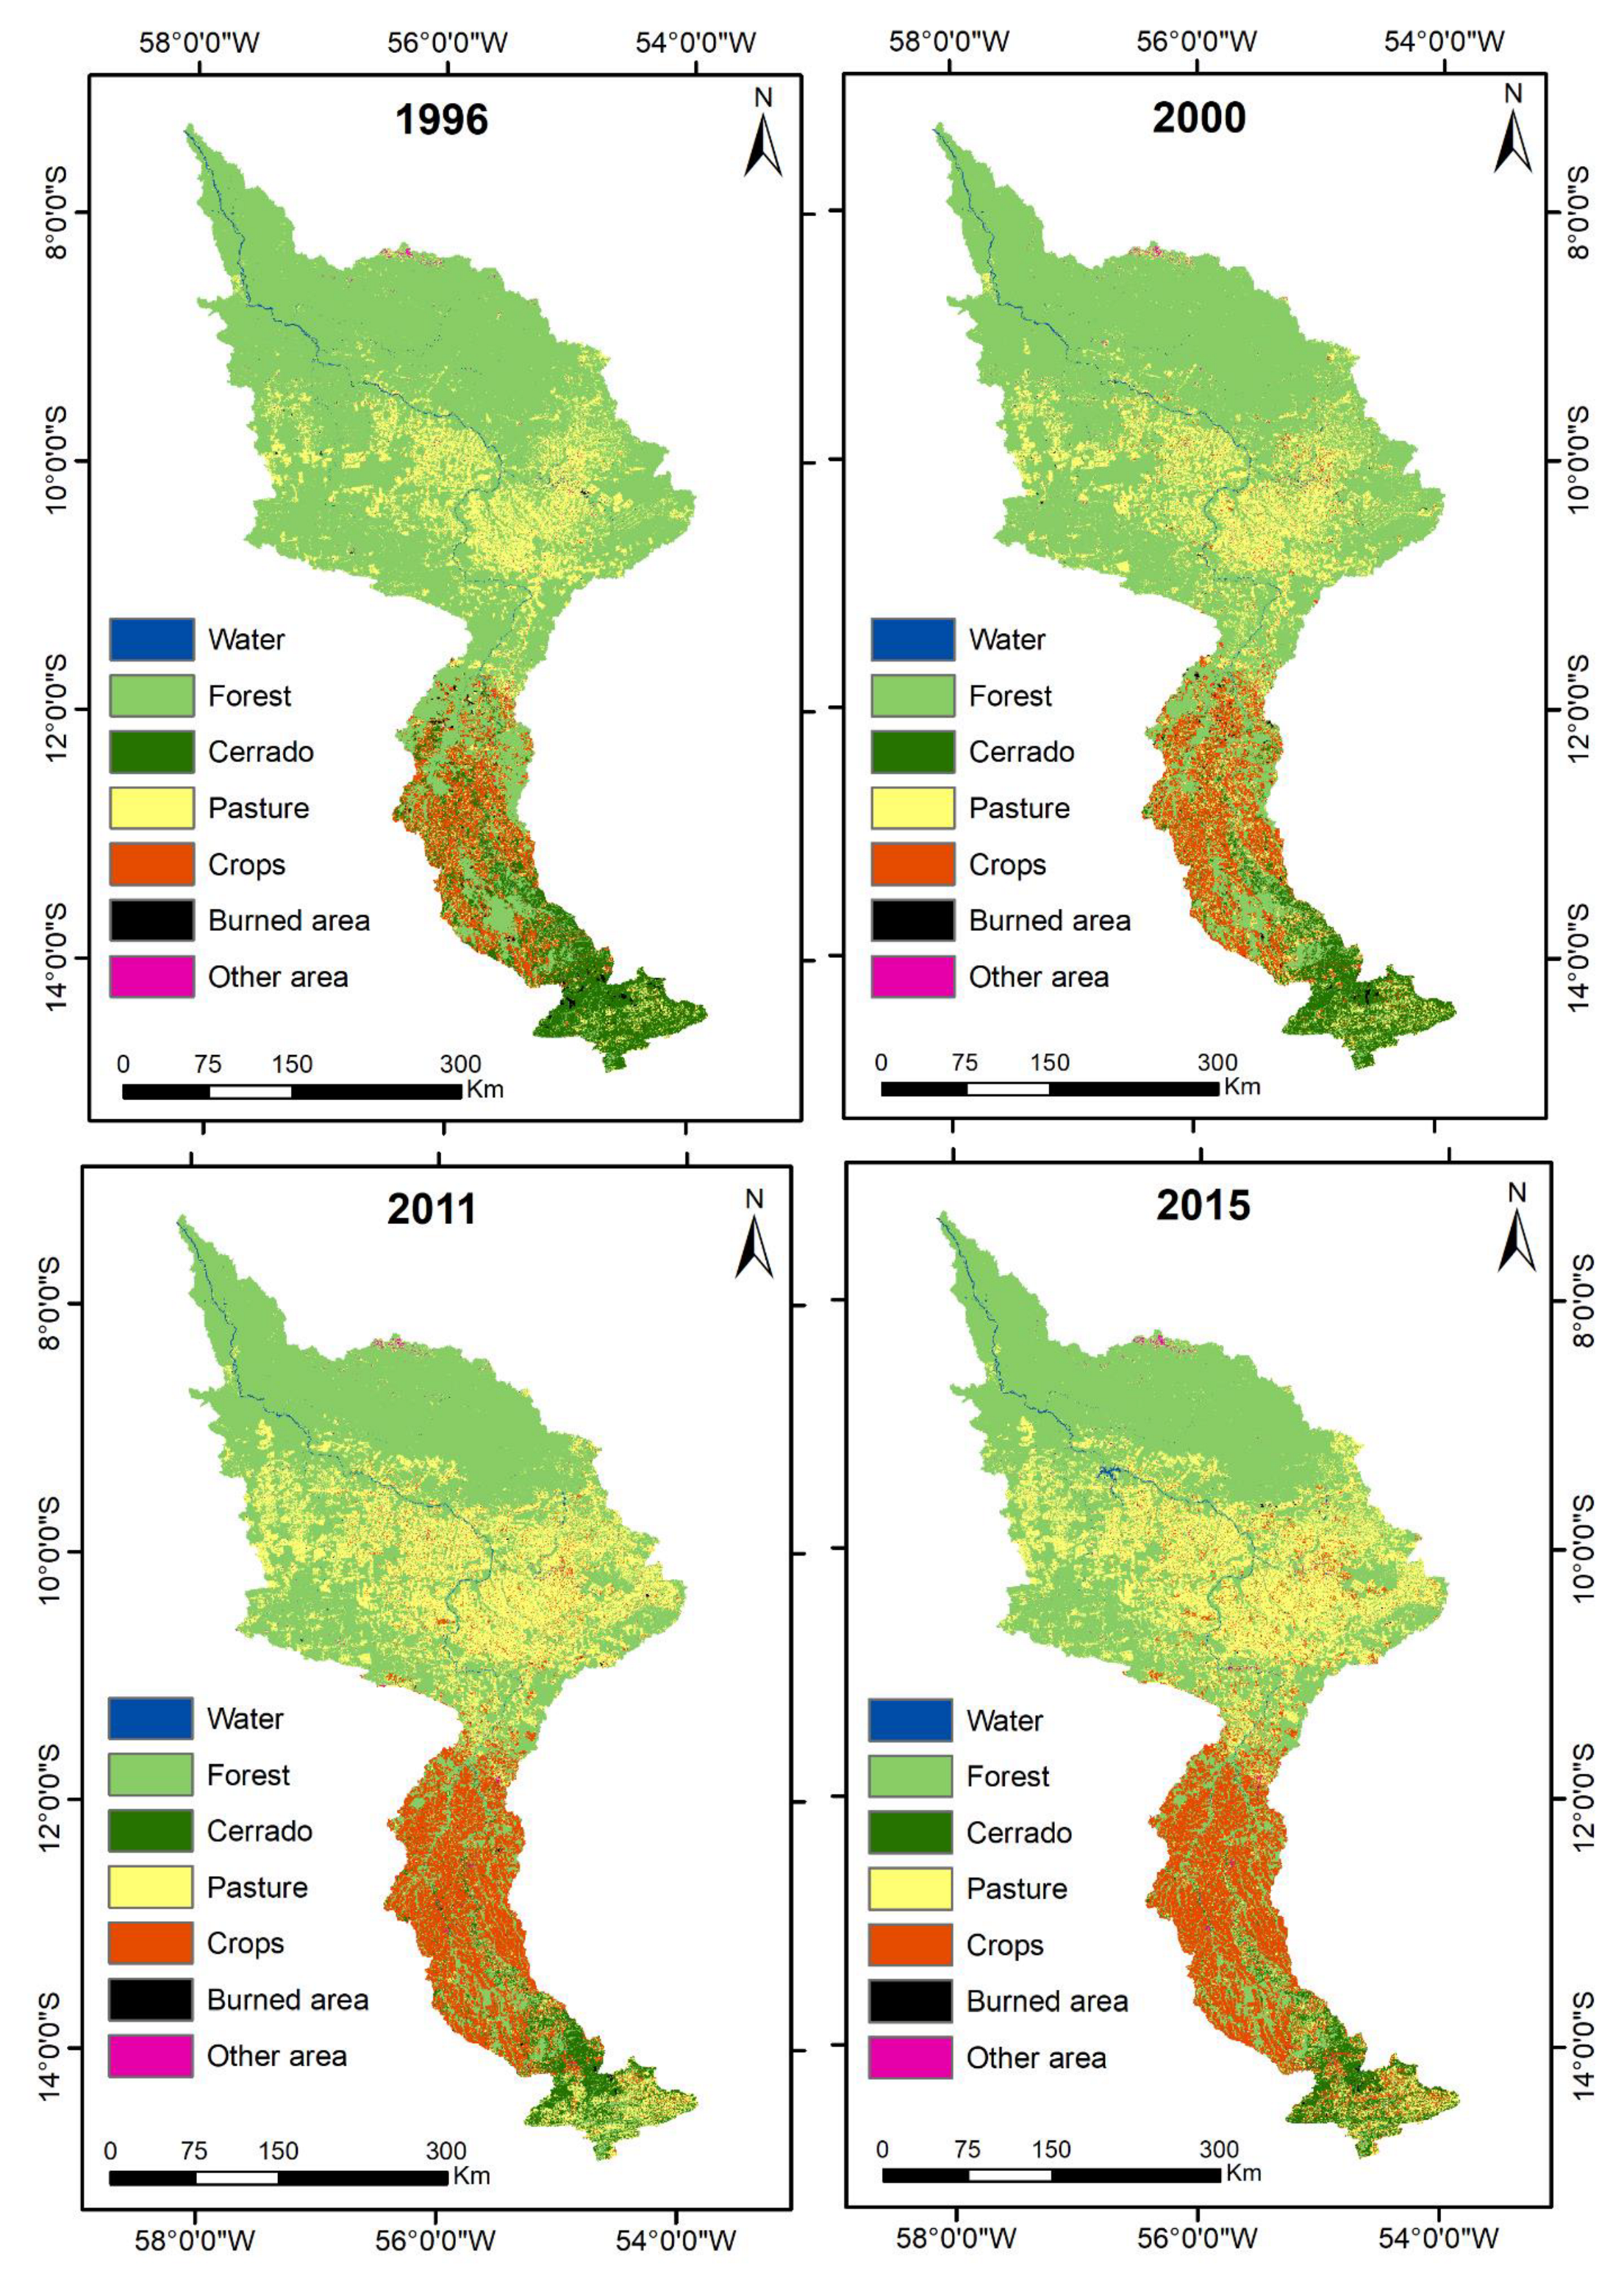
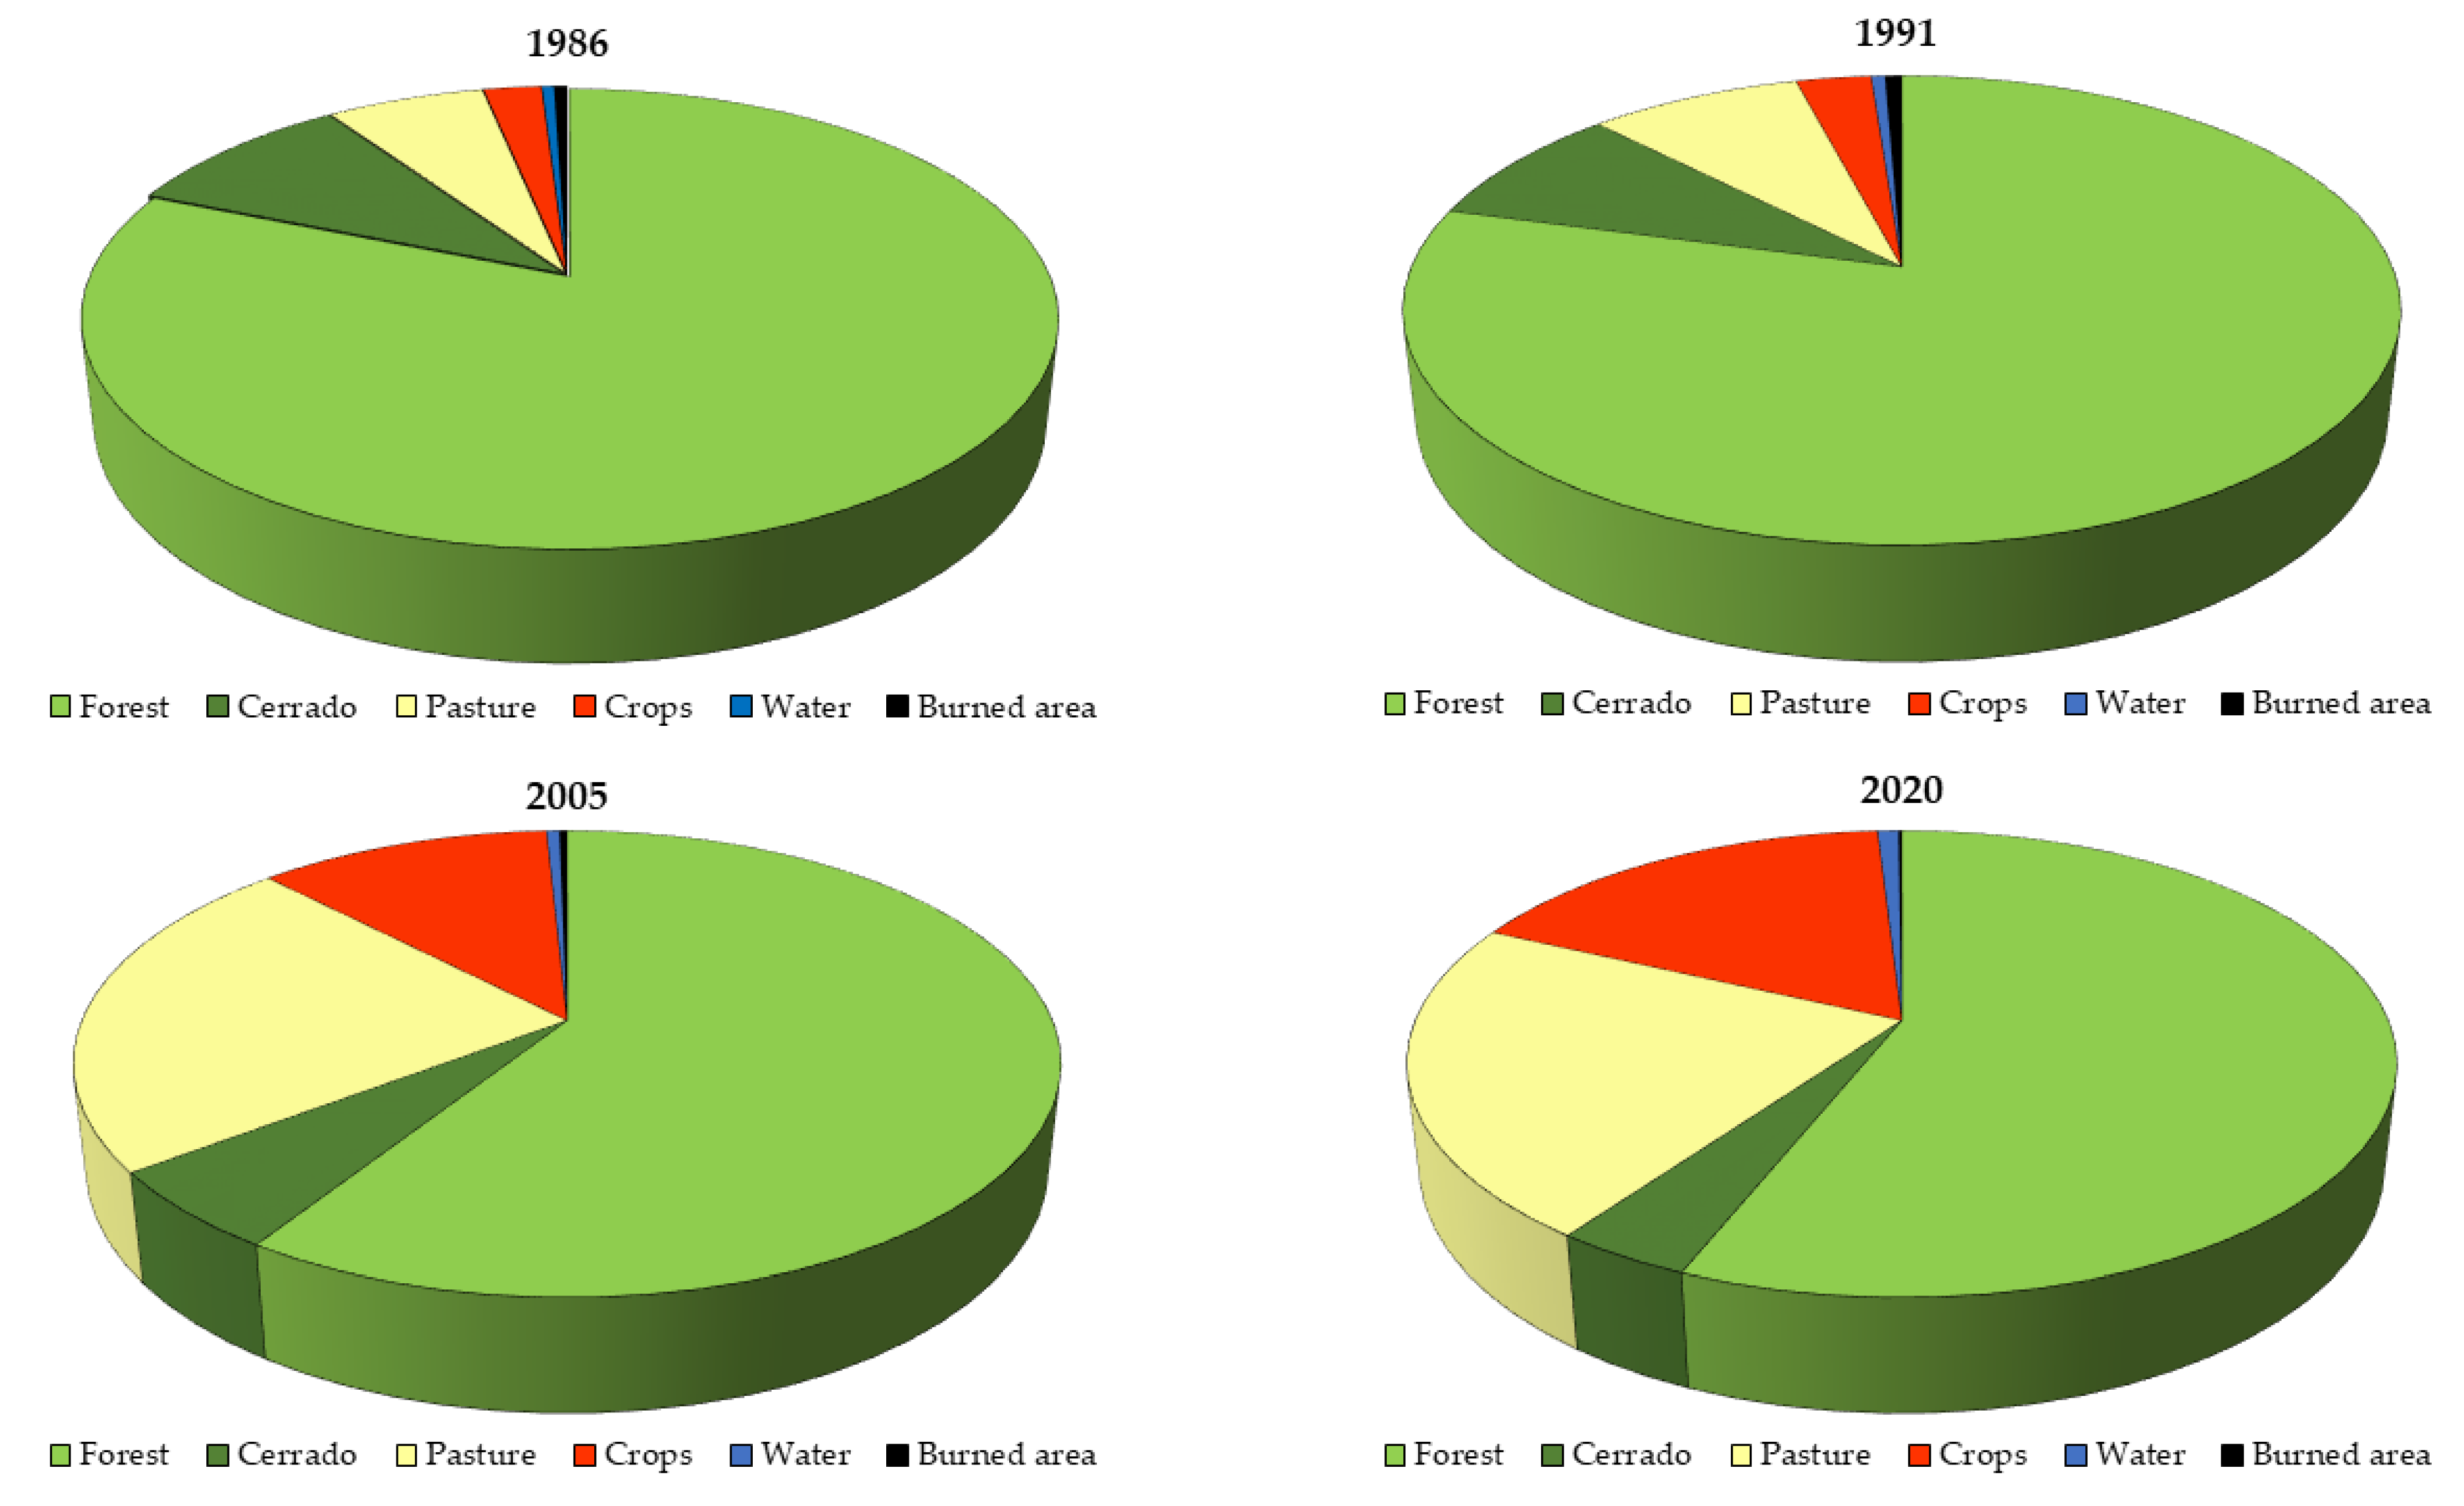
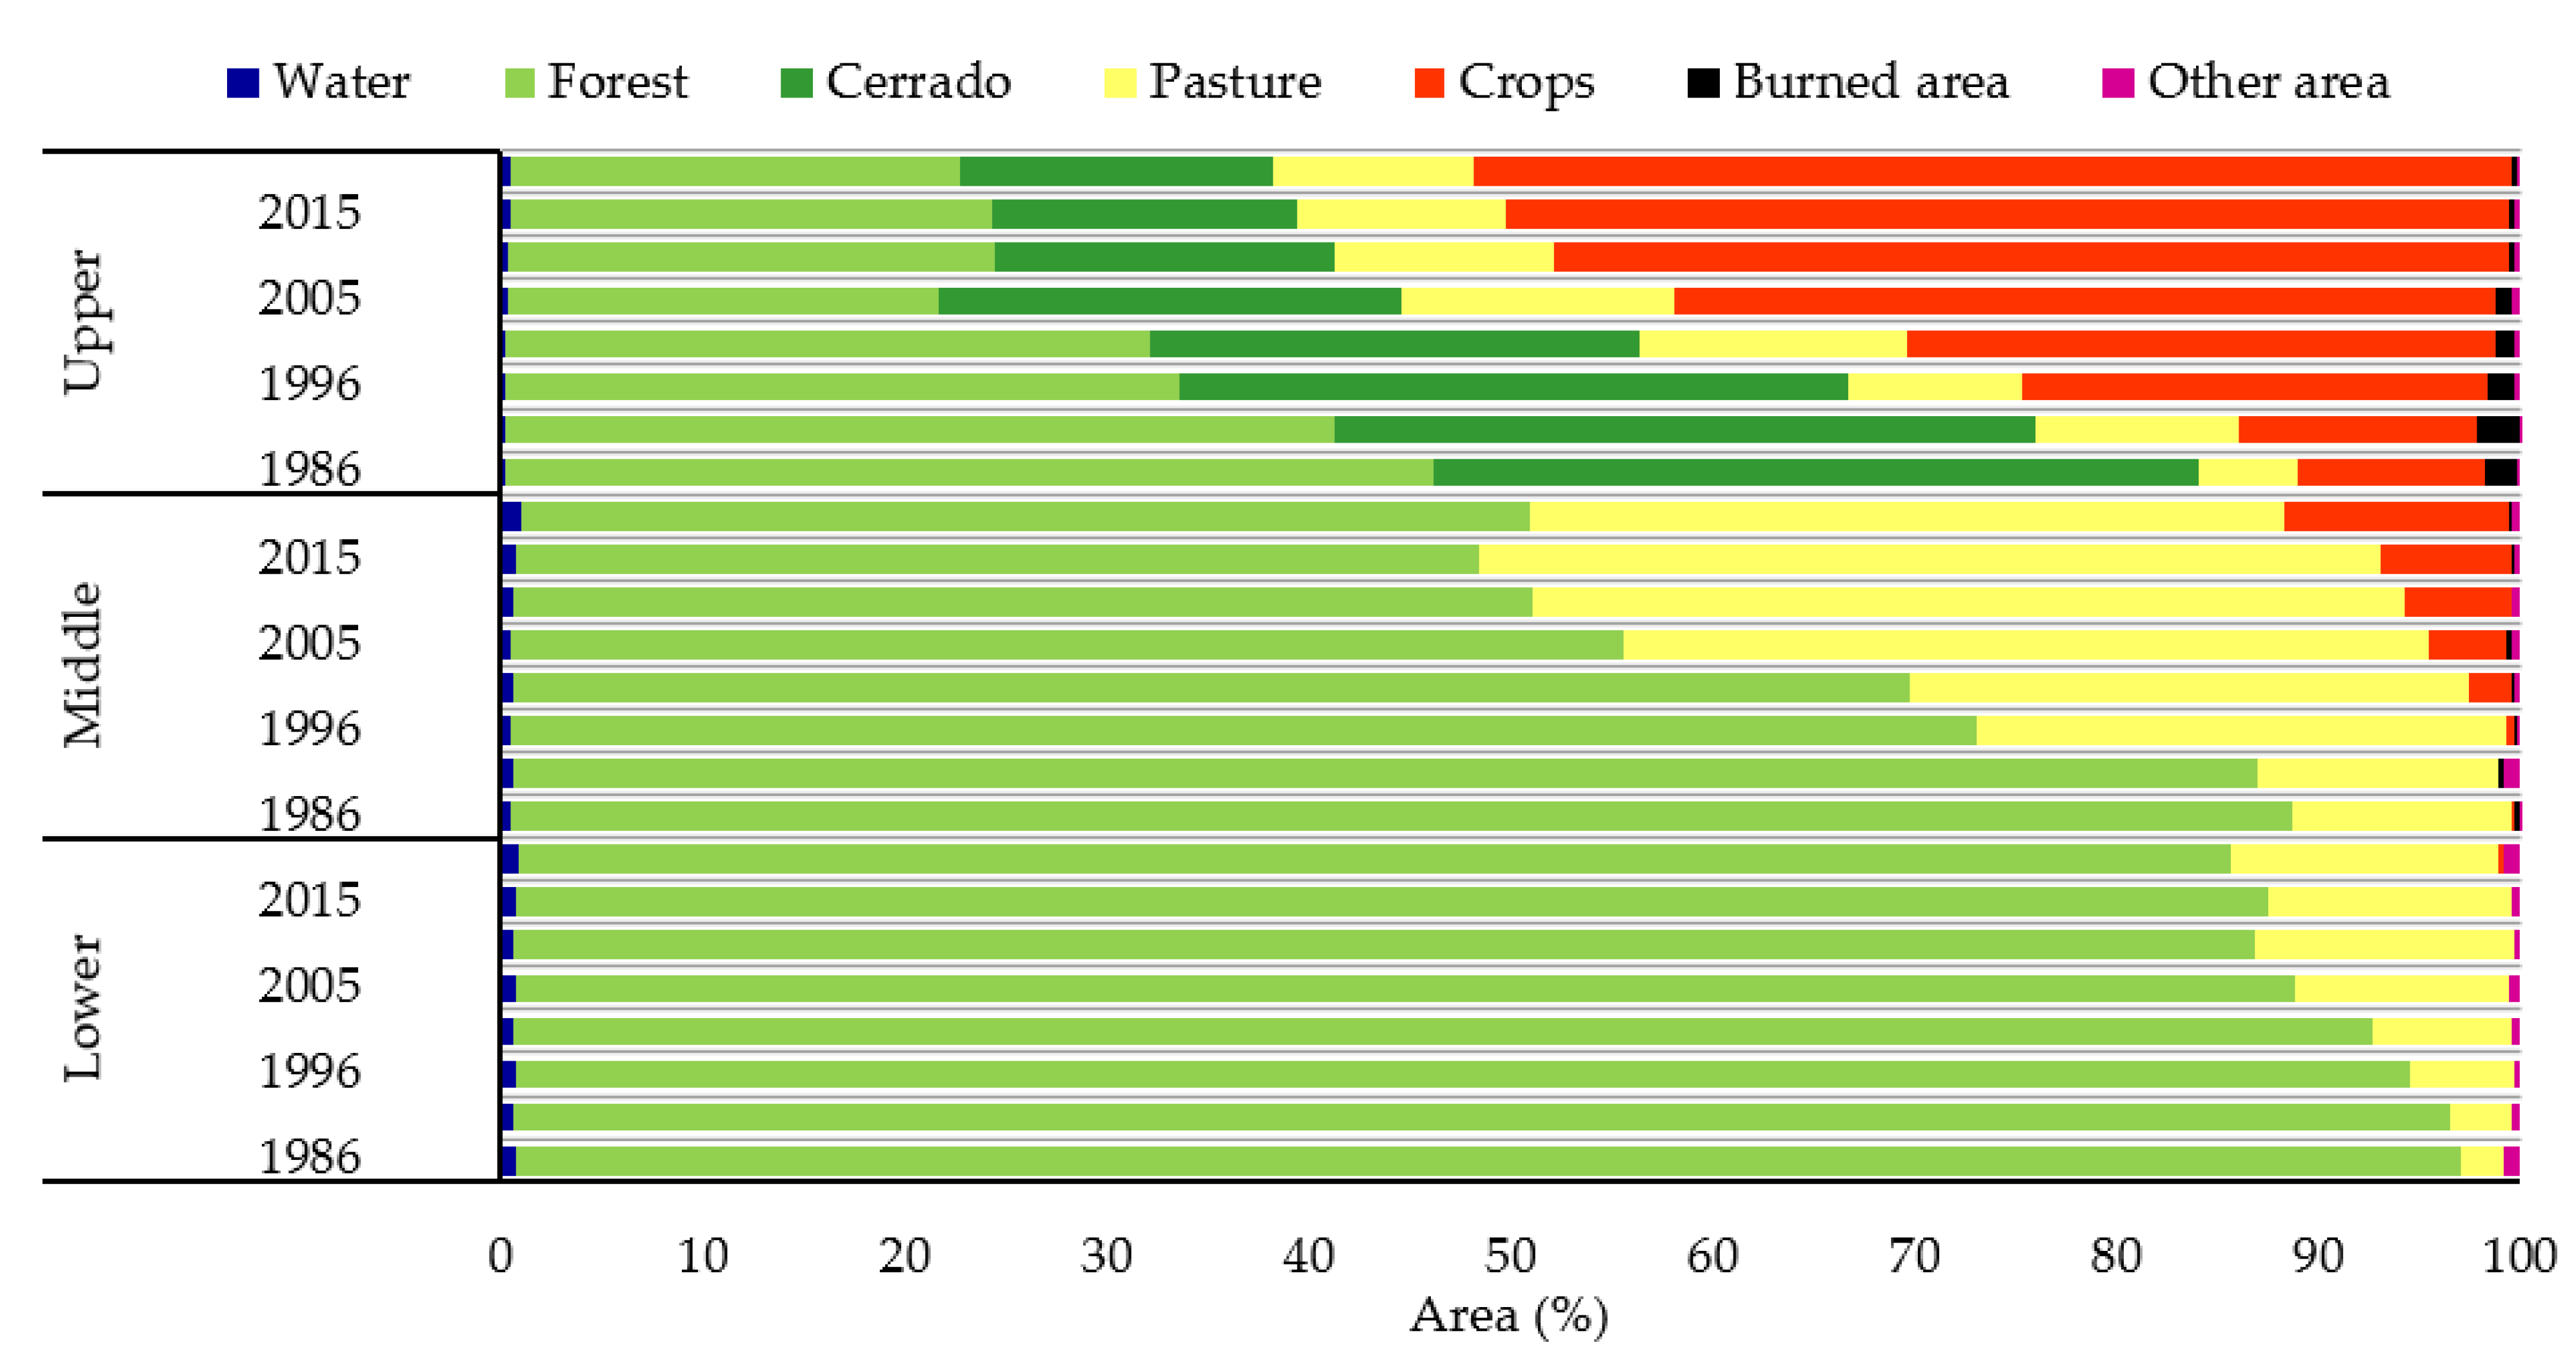
In general, producer accuracy was superior for the classifications for natural areas, such as water and forest as well as for burned areas, indicating that they are more likely to be correctly classified. The user accuracy was higher for the classes for water, the Cerrado biome, burned areas, and other areas, indicating higher probability of the classified areas actually representing these categories in the field. Table 6 presents the areas for land use and occupation obtained from these classifications, in addition to those for crops and pasture. Changes over time for these classifications are shown in Figure 4 (1986, 1991, 2005, and 2020) and Figure A2 (1996, 2000, 2011, and 2015), respectively.
Our land use classifications when compared to the ground truth data we collected had a relatively lower accuracy (289/394 = 73.35%) for crops compared to other land use categories, which all had >93% accuracy (Table 5). The times that we misclassified crops as something else was highest for the pasture (75), other area (24), Cerrado (4), and forest (2), land use classes (Table 5). Our land use classifications using Landsat data in 2020 for crops was (3280/3463 = 94.72%) (Table A2). Misclassification as something other than crops were for other areas (143), and pasture (38). Misclassification of crops with some other land use ranged from 89.39% in 1986 (Table A1) to 95.14% in 2005 (Table A2).
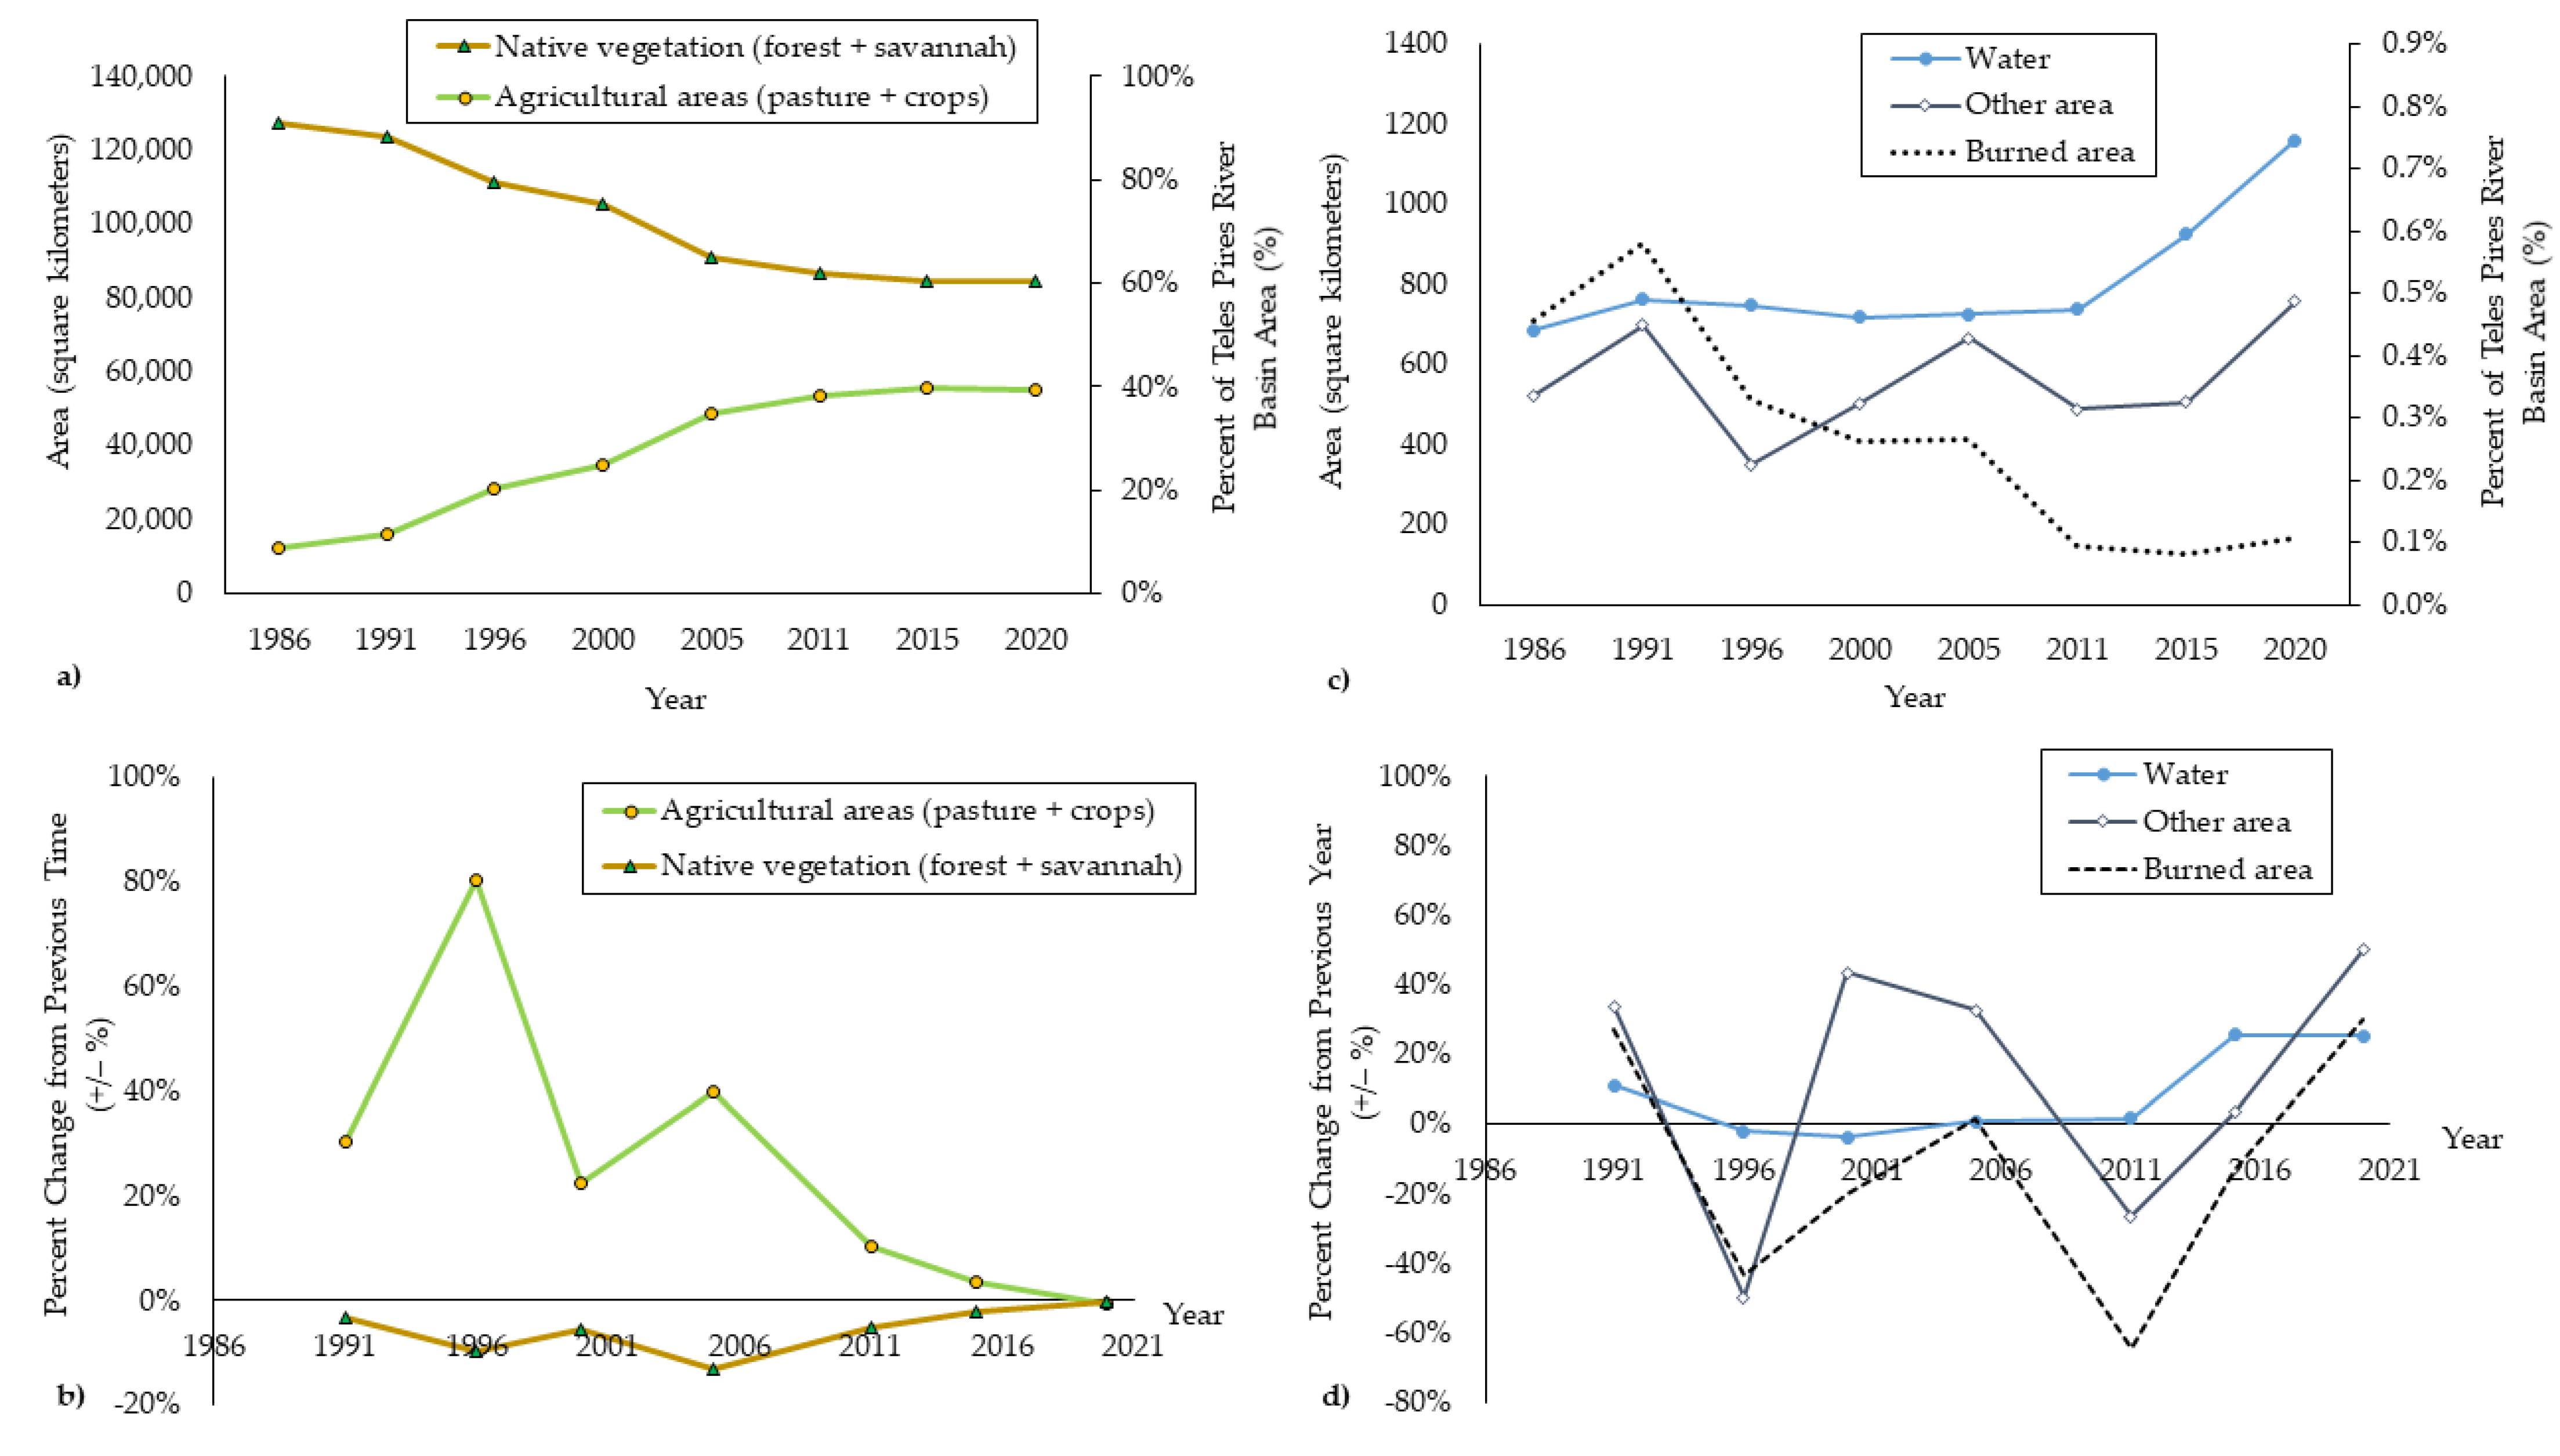
Our results indicated growth of areas occupied by agricultural areas (i.e., pasture and crops), which led to the reduction of native vegetation (i.e., forest and Cerrado savannah) with recent stabilization to ~60% native vegetation and ~40% crops for the Teles Pires River basin (Figure 5a). Figure 5b presents the changes between the time periods evaluated. The percent growth in agricultural areas increased drastically by 80% from 1991 to 1996, and then by 40% from 2000 to 2005, while more recently declining by −0.6% from 2015 to 2020. This recent minor decline in total agricultural area is driven by the −10.55% drop in pasture, which takes up more land area than crops which actually increased from 2015 to 2020 (Table 6). The percentage reduction in native vegetation has been less drastic, with greater declines from 1991 to 1996 (−9.6%) and from 2000 to 2005 (−13.3%), with stabilization to around zero with −0.2% growth from 2015 to 2020 (Figure 5b). This has predominantly been driven by reductions in forest, since the Cerrado increased slightly by 3.05% from 2015 to 2020 (Table 6). Between 2015 and 2020, both declines in the increase in agricultural areas and the decrease in native vegetation to near 0% (Figure 5b) does not mean that there was no expansion of agriculture or deforestation. Rather this indicates a relative stabilization of the recent rates of agricultural expansion and deforestation.
The regionalization of land use and occupation show differences in the occupation patterns of the different parts of the Teles Pires River basin (Figure 6). Forest was the predominant class in the basin in both years, but showed great variation of the area in the period, from 114,400 to 78,900 km2. More than 80% of the entire mapped forest was located in the regions of the lower and middle Teles Pires, which in 1986 had forest areas corresponding to 49,200 and 49,300 km2, respectively. The lower Teles Pires had the smallest decline in forest areas, still showing about 43,300 km2 in 2020. In the upper Teles Pires, forests share the space with areas of the Cerrado, which also corresponds to the indigenous environment of this sub-region.
In the upper Teles Pires, forest areas showed variation between 15,700 and 7700 square kilometers (km2) of occupied area during the period, while the Cerrado areas varied between 13,000 and 5300 km2, the latter represented the class with the greatest percentage reduction in our study. Considering the forest and Cerrado classes together, in the upper Teles Pires, there was an area variation from 28,800 to 13,000 km2 between 1986 and 2020, corresponding to 84% and 38% of the region, respectively. This was the part of the Teles Pires River basin with the lowest percentage of natural vegetation in 2020.
Crops was the land use class with the greatest growth in the period. In 1986, it occupied about 2% of the basin and increased to about 16% in 2020, from 3200 to 24,100 km2 of the area. Most of the area mapped as agriculture is concentrated in the upper Teles Pires, a region that in 2020 was more than 70% agriculture. Crops already occupy approximately 50% of the upper Teles Pires. In the middle Teles Pires, crops have increased, occupying about 10% of the region in 2020, whereas in the lower Teles Pires crops are less than 0.5% of the land area (Figure 6). Pasture represents the predominant form of agricultural land use in the basin, covering more than 8000 km2 in 1986, corresponding to 6% of the total area of the basin. Pastures occupied 31,000 km2 in 2020, 22% of the land area, decreasing from the peak values of 32,385.7 and 34,643.2 km2 that it occupied between 2005 and 2015 (Table 6). It is in the middle Teles Pires that most of the pastures mapped are concentrated, with more than 20,000 km2 of pasture areas in 2020, equivalent to 37% of the land area in this region.
Water also increased between 2011 and 2020, from 737 to 1159 square kilometers, a 57% growth in surface area over this 9-year period (Figure 5c). The percentage increase from one time period to the next was more variable for other area and burned area (Figure 5d). Formed by the junction between areas of minority territorial occupation, the classification of other area also showed an increase, primarily from the growth of urban areas in 23 municipalities within the basin. Mining areas were mostly located on the banks of large tributaries of the Teles Pires River, especially in the middle portion of the basin. Burned areas could not be analyzed. Mapping burned areas requires consideration of the temporal distribution of wildfires, using images with dates that correspond to the end of the wildfire season taking place during the dry season, with 80 to 90% of fires occurring between the months of June and October [50].
The area conversions that occurred between land use classes were detected using a method for comparing different maps, based on the classifications of 1986 and 2020, and then the area conversion matrix presented in Table 7 was generated. This made it possible to identify the losses experienced by each of the classes, as well as the allocation classes of these areas. In the matrix, the values in the diagonal cells indicate the area that remained in the same class of land use and occupation between 1986 and 2020, while the other values indicate the changes that occurred in the area. The rows in Table 7 identify the losses for each land use class, while the columns correspond to the gains and their origin.
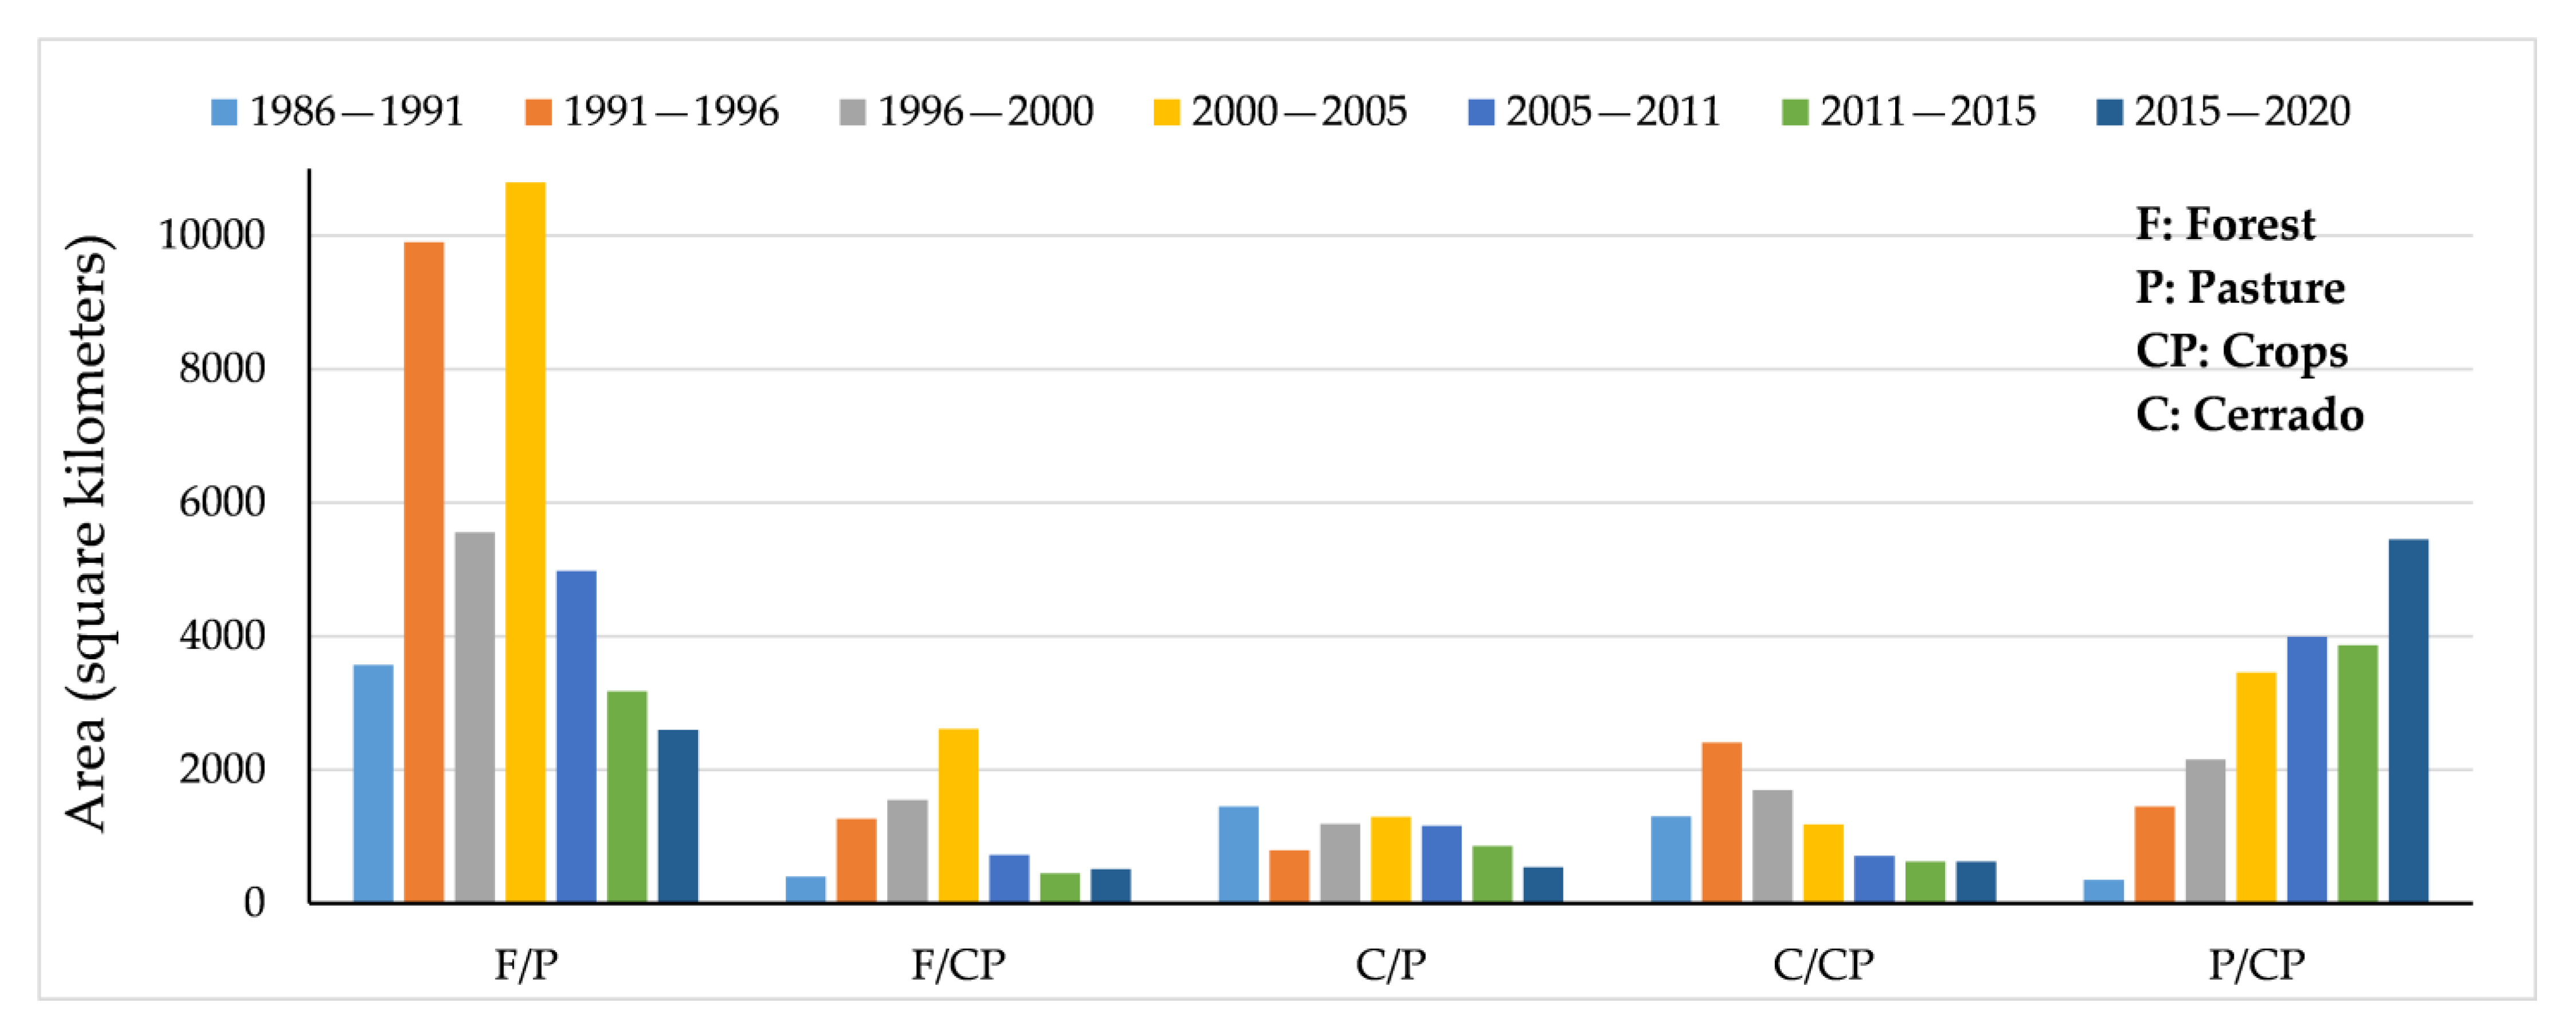
The conversion matrix makes it evident that the greatest losses of Cerrado and forest areas resulted from their conversion to crops and pasture. The forest had the highest loss of 37,900 km2, where 23,200 km2 was converted to pasture, and 12,700 km2 transitioned to crops. Forest losses were also recorded due to the conversion to water. The Cerrado had the highest proportion of losses compared to the pre-existing area, with 69% being converted to other uses, representing 9000 km2 of the lost area, of which 5800 km2 was converted to crops and 2100 km2 was opened to pasture. Losses of pasture area were also recorded during this period (1986 to 2020), and these were mainly due to the conversion to crops. As the main area conversions identified in the basin were from forest to crops (F/CP), forest to pasture (F/P), Cerrado to crops (C/CP), Cerrado to pasture (C/P), and pasture to crops (P/CP), these conversions were compared for all the yearly intervals mapped (Figure 7).
Forest areas showed greater conversion to pasture for all the evaluated time periods, with higher values recorded between 2000 and 2005, when more than 10,000 km2 was converted. This period was also responsible for the greatest conversion of forest into crops. The replacement of the Cerrado areas with pasture and crops varied between the periods. From 1986 to 1991 and from 2000 to 2015, the conversion of Cerrado to pasture was higher, whereas from 1991 to 2000 the conversion of Cerrado to crops was higher, with the peak conversion recorded between 1991 and 1996. The dynamics of pasture conversion to crops was characterized by progressive growth, representing the most significant type of conversion in more recent periods.
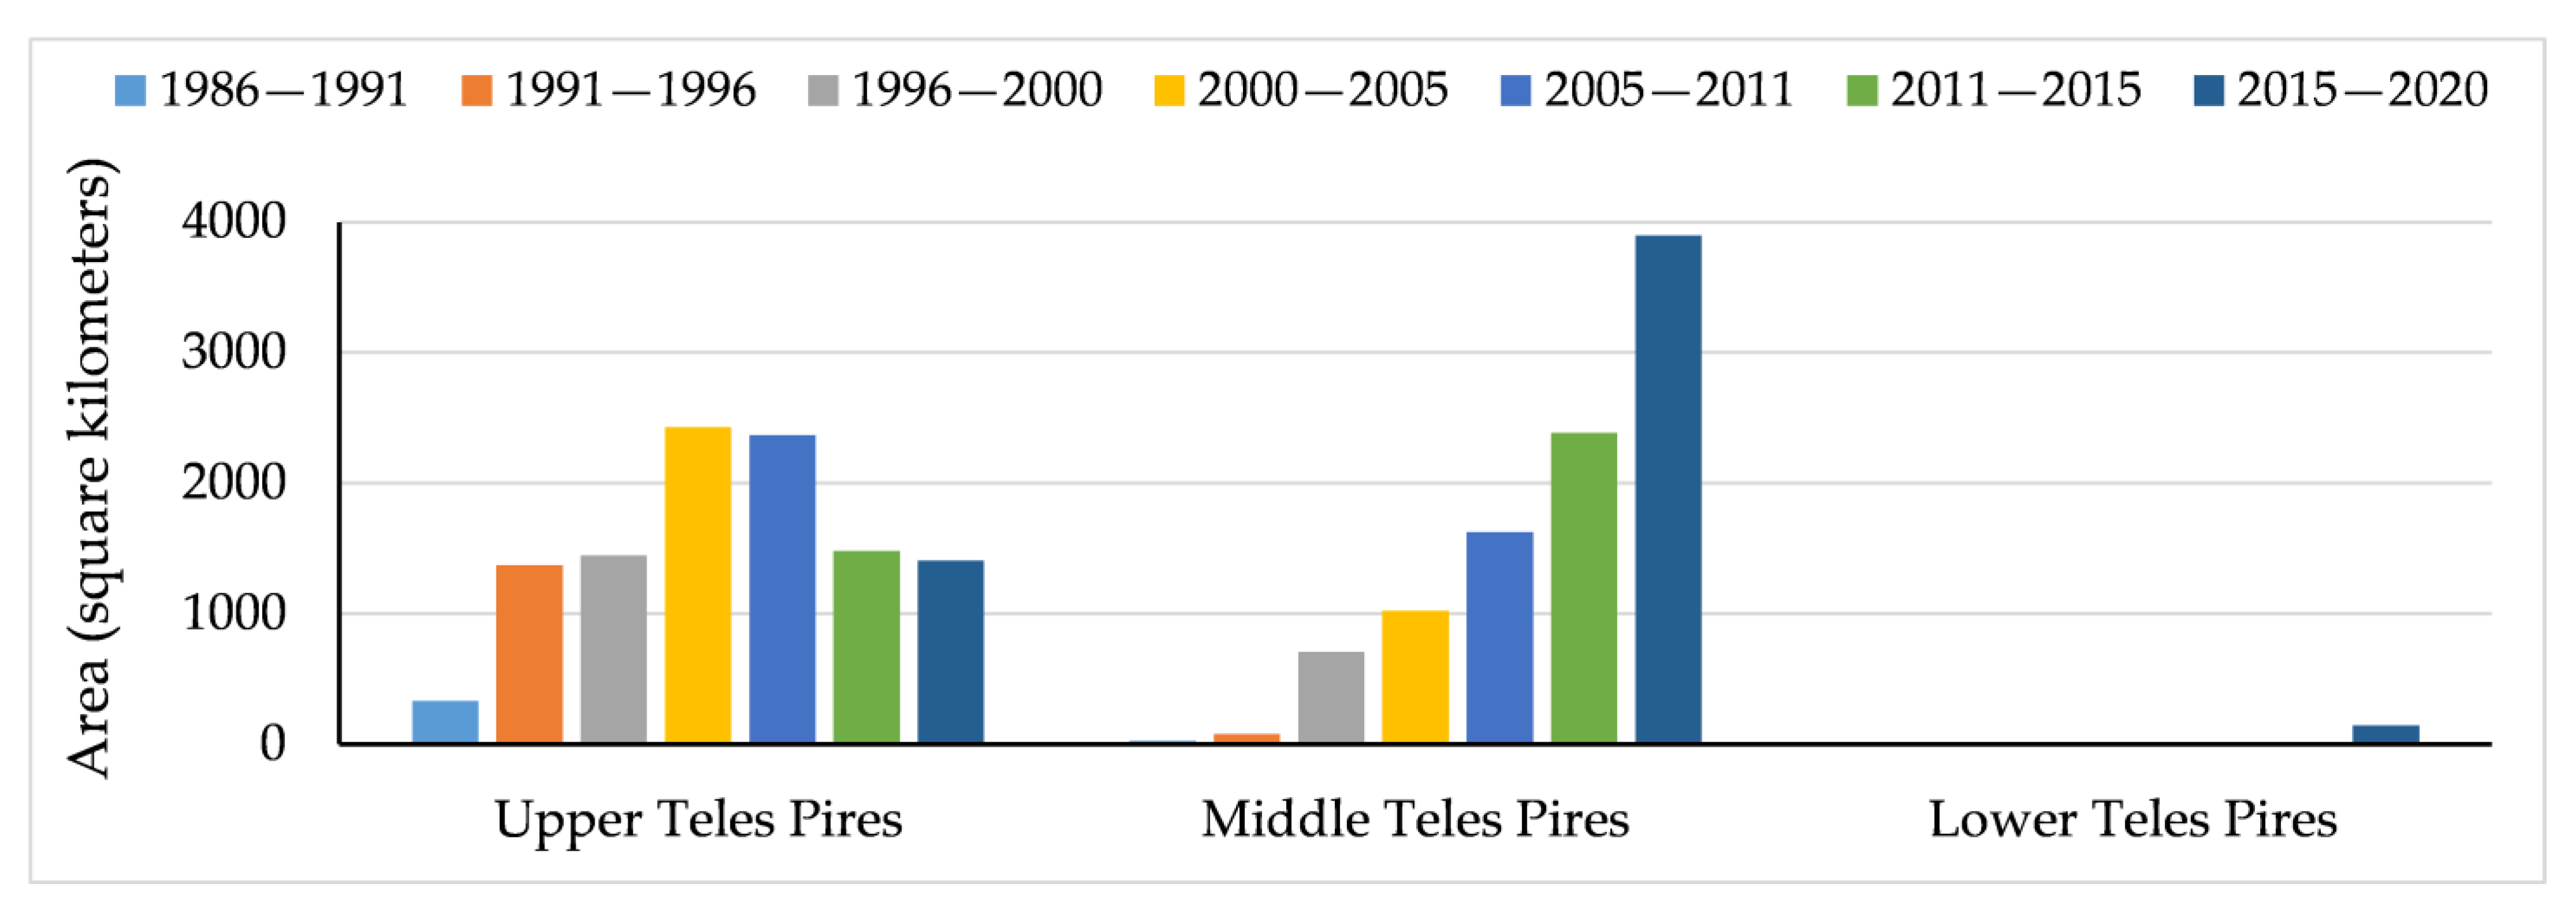
Figure 8 shows the values of the conversion of pasture to crops over the years, mapped for all three sub-regions of the Teles Pires River basin. In the upper Teles Pires, this form of conversion from pasture to crops increased, peaking between 2000 and 2005, when about 53% of the pastures in the region were converted to crops. This type of land use conversion subsequently decreased. In the middle Teles Pires, the conversion of pastures to crops has increased, with a conversion of 3900 km2 recorded between 2015 and 2020, representing 16% of the pre-existing pastures in 2015. In the lower Teles Pires, this type of conversion is still a recent phenomenon.

5. Discussion

5.1. Potential Misclassifications and Comparisons to Previous Studies

The occupation of states belonging to the Legal Amazon was historically marked by policies to encourage land occupation [51]. This occurred through a colonization model that led to disorderly occupation of the region, contributing to high rates of deforestation [52]. In our study of the Teles Pires River basin, which is located in the states of Mato Grosso and Pará, our results indicate a significant reduction in natural areas between 1986 and 2020, a period marked by intense occupation of the region. One of the greatest challenges encountered during the study is the presence of Cerrado and transition areas, which results in difficulties in the mapping of these areas due to the different plant physiognomies and the natural dynamics shown by this classification, leading to varied spectral responses, which hinders the correct mapping of these features [53]. This is demonstrated by the omission of significant areas of the Cerrado, erroneously classified as forest.
Another class that also had areas omitted during the classification of images was the other land use class, which was confused with crops and pasture. The other class encompassed categories of territorial occupation that were spatially limited and had mostly heterogeneous spectral response, such as urban and mining areas. The maximum likelihood classifier assumes that the training data are representative and normally distributed, but highly heterogeneous response classes do not have this type of data distribution, leading to low efficacy of the classification. This is one of the main limitations of the classification method we adopted [54].
When comparing the data obtained in the present study with the areas mapped by the MapBiomas project’s collection 4, for the Teles Pires River basin area, similar classes were identified and some of these showed very similar results, corroborating our results. Considering the forest cover classes of MapBiomas, values between 116,100 and 79,200 km2 were found for the basin area for 1986 and 2015, respectively. Values very close to those found in our study were also documented by MapBiomas for the years 1991, 1996, 2011, and 2015. The areas of crops, represented in the MapBiomas by three categories ((1) Pasture, (2) Annual crops, and (3) Perennial crops), ranged from 3 to 14% between 1986 and 2015, and the percentages of pasture varied between 6 and 24% between 1986 and 2015, respectively. The areas occupied by water in the Teles Pires River basin, according to MapBiomas data, were between 0.5% and 0.6% between 1986 and 2015. These values are consistent with our results.
In addition to pointing out the accelerated decline of the natural areas in the basin, our research shows that most of the area losses have been occurring in the upper and middle regions of the Teles Pires, which are most impacted by human occupation. Meanwhile, the lower Teles Pires still conserves much of its natural areas and stands out for covering protected areas corresponding to portions of the Juruena National Park, and Munduruku and Kayabi indigenous lands. This highlights the role of protected areas in curbing deforestation in the Legal Amazon [55,56]. The greatest losses of natural area were recorded in the upper Teles Pires, giving the region the status of strongly altered area, due to the high percentage of the area that is already suffering from deforestation [57].
The Teles Pires River basin has more significant losses of natural areas to the south, upper Teles Pires, which evolve in the north direction, toward the middle and lower Teles Pires. Other researchers [58] have already reported the occurrence of this phenomenon in the region where the changes caused by deforestation expand from south to north in the state of Mato Grosso, destroying areas of primary vegetation for agricultural production in the central areas of the state and for livestock farming to the north.
Crops currently represents the predominant land use in the upper Teles Pires. This is consistent with [16], who found that 47.8% of the land area in the region was for agricultural use in 2014. The middle part of the basin is characterized by wide anthropic occupation of the areas by pasture. Livestock farming was the primary driver of deforestation in the municipality of Paranaíta, with an area corresponding to 6445.05 km2, located in the Teles Pires River basin between the middle and lower portions, with 32.73% of the municipality occupied by pasture in 2016 [52]. This result is similar to the pattern found in the middle Teles Pires region in the present study.
The significant growth of the areas occupied by water observed in the basin can be explained by the construction of four large dams for the installation of hydroelectric power plants (HPPs) in the course of the Teles Pires River in recent years. This has created lakes upstream of the Teles Pires, São Manoel, Colíder, and Sinop HPPs, built between 2011 and 2020. The installation of these HPPs results in an increase in water surfaces and generally also contributes to the reduction of native vegetation [59]. Native vegetation was suppressed in the Teles Pires River basin during the installation of the Teles Pires HPP between the municipalities of Paranaíta, Mato Grosso, and Jacareacanga, Pará, with negative impacts such as deforestation and fragmentation of the areas [52].
The construction of dams in the Amazon generates impacts that can spread on a local, regional, and global scale. Dams modify the natural flow of the watercourse, changing upstream environments from lotic to lentic, which affects water quality and the transport of sediments and nutrients [60]. These changes can reduce local biodiversity, being especially harmful to migratory and endemic aquatic species, and favoring generalist species [61]. The impacts of dams go far beyond directly influencing rivers. Sometimes dams displaced people to make way for the development and this can increase deforestation from the opening of new roads [62]. Dams with large hydroelectric plants located in tropical regions can also generate significant emissions of greenhouse gases, such as carbon dioxide and methane [63].
As for the conversion of areas in the basin, there is a clear, intense replacement of natural, Cerrado and forest areas with agricultural and pasture areas, which have been pointed out as the main drivers of deforestation in the region for a long time, both by direct conversion and indirect conversion through the displacement of the forms of land use [64,65,66]. The Cerrado, identified in this study as the class with the highest proportion of area losses, has had its destruction documented for years [67,68]. The Cerrado is the most threatened biome in Brazil, with deforestation rates higher than those of the Amazon [69,70], due to more scarce protection policies [70]. In addition to the high losses of natural areas, another evident phenomenon of the conversion in the Teles Pires River basin is the conversion of pastures, resulting from their transformation into agricultural areas. This occurrence in the state of Mato Grosso has also been reported by other researchers [69,71].
Our results suggest that more ground truthing is needed to confirm whether the misclassification of crops is as prevalent in other areas in Brazil outside of the Teles Pires River basin. Improved ground truthing using real-world data collected in the field is clearly needed since our land use classifications using Landsat data from 2020 had a much greater classification accuracy for crops at 94.72% when compared to MapBiomas (Table A2), versus only 73.35% accuracy when validating against ground truth data collected in the field (Table 5). While MapBiomas is annually produced, other land use data sets, such as TerraClass which is released biennially, may be able to distinguish more accurately between forest and successional stages of forest regrowth, as well as between agriculture and pasture [20]. Thus, TerraClass could be used for future validations.

5.2. Agricultural Development Policies and Future Sustainable Intensification

In the Brazilian Legal Amazon, deforestation rates have followed the political and economic scenario, and the results found here reflect this pattern. For instance, high conversion of forest areas were recorded between 1991 and 1996, which may have been associated with high deforestation rates recorded in the Amazon after the implementation of the Real Plan in 1994 [72]. Peak deforestation occurred between 2000 and 2005, which may be associated with the increase in prices of agricultural commodities, especially soybean [73]. In this context, policies to reduce deforestation, such as changes made to the Forest Code [74], also stand out, and more recently deforestation rates of the Legal Amazon have slowed due to policies to combat deforestation [65].
In the Teles Pires River basin, high values of forest conversion to crops were recorded between 1991 and 2005, with a peak recorded in the last five years of this period. Between 2001 and 2006, soybean plantations expanded in the Amazon and record deforestation rates were found, with the occurrence of direct conversion of forests to agricultural production [68]. The subsequent reduction in this conversion is associated with the Soy Moratorium, an agreement signed aimed at reducing deforestation caused by the expansion of soybeans in the Brazilian Amazon. Launched in 2006, the Soy Moratorium involved civil society organizations and companies linked to the soybean industry committing to not buying soybean grown on deforested land after July 2006 [75,76]. This triggered the expansion of soybean production to pasture areas, which originated from previously deforested areas [70]. Our results show that in the Teles Pires River basin, the conversion of pastures to crops increased, especially in the middle part of the basin since the mid-1990s, with higher conversion rates recorded after 2005, corresponding to the period following the adoption of the Soy Moratorium.
It is more common for agricultural production to expand through the conversion of pastures, with the establishment of these pastures to newly deforested areas [76]. Thus, agricultural expansion of Brazil’s beef industry, historically used for holding claim to land, has indirectly caused deforestation [68]. This has occurred in the Teles Pires River basin, where pastures continue to expand through the occupation of natural areas. When analyzing changes in land use and occupation between 1986 and 2014 in the upper Teles Pires, [16] reported this pattern of replacement of natural areas first with pastures and then with crops, which corroborates the occurrence of the high values of pasture conversion to crops found in our study. Such pasture to crops conversions may be even greater, since the interval between mapped years may have been insufficient to portray such dynamics. It is worth pointing out that in this region, commodity cropping is already the dominant land use, covering about half of the region’s total area in 2020, while pasture areas have declined. Based on the high percentages of pasture conversion to crops found in the upper Teles Pires region, this type of conversion tends to expand in the north direction of the basin, to the middle and lower Teles Pires regions, where there is a large number of pasture areas available for conversion.
The prevalence of conversions of areas of natural vegetation to pasture and agriculture can cause changes in soil cover resulting in potential negative environmental impacts, such as soil degradation and changes to the physical properties of the soil [69,77,78], as well as changes in water availability and quality [56,79,80]. Therefore, the need to evaluate the occurrence of such impacts in the Teles Pires River basin is evident. Improved organization of production and optimization of the use of the natural resources can improve economic development of the Mato Grosso state in Brazil, while adopting better management practices to help conserve river basins. These practices include sustainable intensification strategies for Brazil’s beef and commodity crop industries to increase production on an agricultural land base that has stabilized (Figure 5a). Mato Grosso’s beef production can potentially increase on the same pasture area by supplementing pasture with grain, re-seeding degraded pastures [81], integrating cattle with crops [82], and reducing the time to slaughter [83]. Increasing commodity crop productivity can be accomplished by better hybrid development, especially for maize versus soybeans [84], as well as irrigation during the dry season, to allow for three cropping seasons per year compared to the current two seasons [85].

5.3. Policy Implications

Since deforestation is the main threat to biodiversity, mapping and quantifying changes in land use and occupation is necessary for understanding the dynamics of the landscape to adequately manage development through improved decision-making [18]. Thus, remotely sensed satellite data and maps developed over time can help public policy makers identify critical locations and potential environmental fragility and where efforts to contain deforestation should be prioritized [86]. Only through efficient land governance will it be possible to reduce deforestation in areas such as the Amazon [87]. Such governance must encompass rules and processes that inform decision makers about land use and control, how decisions are implemented, and how antagonistic interests in land use can be resolved. It is worth highlighting the importance of understanding the link between deforestation and global food supply chains in order to create better regulatory policies to protect tropical forests in biodiversity hotspots [36]. The conservation of tropical forests requires comprehensive and long-term solutions, understanding potential socio-ecological trade-offs, and ensuring a balance between land use, environmental goals, and sustainable development [38].

6. Conclusions

Agriculture (e.g., commodity crops) has been the classification with greatest growth in the Teles Pires River basin and, despite the current policies to curb deforestation, it continues to expand by incorporating anthropic areas already consolidated, through the conversion of pasture areas, which has led to their displacement to new areas, maintaining the continuity of deforestation in the basin, even if at lower rates. High values of direct conversion of natural areas to crops were recorded until the year 2005, from which this type of conversion decreased and the growth of agricultural areas through the conversion of pastures began to prevail. In recent years, the middle Teles Pires has stood out for having high occurrences of this type of conversion.
The changes that occurred in the Teles Pires River basin may be related to the expansion of areas for crops and pasture, while the form and intensity of area conversions between the analyzed years accompanied regional trends, denoting the strong influence of Brazil’s economic and political dynamics. The different sub-regions of the basin have experienced different stages of land conversion, with the upper Teles Pires toward the south of the basin, showing a higher degree of anthropic alteration. This conversion has expanded northwards over time. The northernmost part of the basin, the lower Teles Pires, continues to have the highest percentage of natural areas. Current land use is characterized by commodity agriculture in the upper Teles Pires, pasture in the middle Teles Pires, and native forest in the lower Teles Pires. The construction of infrastructure for implementing hydroelectric projects along the course of the Teles Pires River in the last decade has also contributed to the reduction of natural areas in this river basin.

Author Contributions

Data collection, writing, methodology, formal analysis, figures—A.K., F.T.d.A. and T.M.d.C.; data collection, review, editing, supervision and financial support—A.P.d.S.; methodology, review, editing—C.A.Z.; review, editing and financial support, figures—A.K.H. and D.C.d.A. All authors have read and agreed to the published version of the manuscript.

Funding

This study was financed by the Coordenação de Aperfeiçoamento de Pessoal de Nível Superior—Brasil (CAPES) and the Agência Nacional de Águas e Saneamento Básico (ANA), Finance Code—001 and Process 88887.144957/2017-00. The authors wish to thank the Conselho Nacional de Desenvolvimento Científico e Tecnológico (CNPq) for their support with scientific initiation grants and a productivity grant (Process 308784/2019-7).

Institutional Review Board Statement

Not applicable.

Informed Consent Statement

Not applicable.

Data Availability Statement

Study data can be obtained by request to the corresponding author or the second author, via email. It is not available on the website as the research project is still under development.

Acknowledgments

The authors also thank all the students and professors in the Tecnologia em Recursos Hídricos no Centro-Oeste” research group (Available online: dgp.cnpq.br/dgp/espelhogrupo/2399343537529589 accessed on 3 March 2023). We thank three anonymous reviewers whose comments and edits substantially improved the quality of this work.

Conflicts of Interest

The authors declare no conflict of interest. Supporting entities had no role in the design of the study; in the collection, analyses, or interpretation of data; in the writing of the manuscript, or in the decision to publish the results.

Appendix A

Figure A1. Maps of land use in the Teles Pires River basin during 1996, 2000, 2011, and 2015.
Sustainability 15 04611 g0a1
Figure A2. Change in land-use classification percentages for Teles Pires River basin for 1996, 2000, 2011, and 2015.
Sustainability 15 04611 g0a2
Table A1. Confusion matrix between the mapping in this article and the MapBiomas project for the years 1986, 1991, 1996, and 2000.
MapBiomas
1986WaterForestCerradoPastureCropsOther areaTotalUA (%)
Water1419000001419100.00
Forest020,0231200020,03599.94
Cerrado012812199000348063.19
Pasture0031455844151096.36
Crops000261475149165089.39
Other area210221592837360361.86
Total144021,30422361640151156628,697
PA (%)98.5493.9998.3588.7297.6265.90
Overall accuracy (%):93.89 Kappa Index:0.87
1991WaterForestCerradoPastureCropsOther areaTotalUA (%)
Water187010000187199.95
Forest018,678500018,68399.97
Cerrado011202461000358168.72
Pasture000308721612331593.12
Crops000452939158314293.54
Other area90424331233583140.31
Total187919,79925083565316750531,423
PA (%)99.5294.3498.1386.5992.8066.34
Overall accuracy (%):93.47 Kappa Index:0.89
1996WaterForestCerradoPastureCropsOther areaTotalUA (%)
Water1306000001306100.00
Forest021,2111260021,23899.87
Cerrado022291491000372040.08
Pasture01040301771411997.84
Crops000328313189492.95
Other area00341658044372261.36
Total130623,4411526425392854531,999
PA (%)100.0090.4997.7194.7689.5581.28
Overall accuracy (%):91.60 Kappa Index:0.83
2000WaterForestCerradoPastureCropsOther areaTotalUA (%)
Water204910000205099.95
Forest019,774900019,78399.95
Cerrado013202355000367564.08
Pasture00047916427488298.14
Crops0091134121176441993.26
Other area1450852240152776.09
Total206321,10023734989420760435,336
PA (%)99.3293.7299.2496.0397.9666.39
Overall accuracy (%):94.78 Kappa Index:0.92
PA = producer accuracy; UA = user accuracy.
Table A2. Confusion matrix between the mapping in this article and the MapBiomas project for the years 2005, 2011, 2015, and 2020.
MapBiomas
2005WaterForestCerradoPastureCropsOther areaTotalUA (%)
Water73700000737100.00
Forest020,8057700020,88299.63
Cerrado013021422100272552.18
Pasture000411011711423896.98
Crops000723931129413295.14
Other area1400383444553183.80
Total75122,10714994221408258533,245
PA (%)98.1494.1194.8697.3796.3076.07
Overall accuracy (%):94.60 Kappa Index:0.90
2011WaterForestCerradoPastureCropsOther areaTotalUA (%)
Water80300000803100.00
Forest023,06010700023,16799.54
Cerrado09042519000342373.59
Pasture022144157466442593.94
Crops000573081167330593.22
Other area1720431043650885.83
Total82023,96828404257313760935,631
PA (%)97.9396.2188.7097.6598.2171.59
Overall accuracy (%):95.58 Kappa Index:0.92
2015WaterForestCerradoPastureCropsOther areaTotalUA (%)
Water1160000001160100.00
Forest019,8015500019,85699.72
Cerrado0111616680011279559.68
Pasture008372013844391095.14
Crops000774242146446595.01
Other area10015505146859478.79
Total117020,91717463847443166932,780
PA (%)99.1594.6695.5396.7095.7369.96
Overall accuracy (%):94.75 Kappa Index:0.91
2020WaterForestCerradoPastureCropsOther areaTotalUA (%)
Water1541000001541100.00
Forest019,90710010020,00899.50
Cerrado0144391720500426691.82
Pasture00438644700433889.07
Crops200383280143346394.72
Other area641040073781590.43
Total160720,06140254108375088034,431
PA (%)95.8999.2397.3294.0687.4783.75
Overall accuracy (%):96.56 Kappa Index:0.94
PA = producer accuracy; UA = user accuracy.

References

  1. Verma, A.K. Sustainable Development and Environmental Ethics. Int. J. Environ. Sci. 2019, 10, 1–5. Available online: https://ssrn.com/abstract=3689046 (accessed on 1 July 2022).
  2. Araújo Neto, J.R.; Andrade, E.M.; Palácio, H.A.Q.; Sales, M.M.; Maia, A.R.S. Influence of land use/occupation on water quality in the Trussu river valley, Ceará, Brazil. Rev. Ciênc. Agron. 2017, 48, 59–69. [Google Scholar] [CrossRef] [Green Version]
  3. Shi, P.; Zhang, Y.; Li, Z.; Li, P.; Xu, G. Influence of land use and land cover patterns on seasonal water quality at multi-spatial scales. Catena 2017, 151, 182–190. [Google Scholar] [CrossRef]
  4. McMillan, H.; Montanari, A.; Cudennec, C.; Savenije, H.; Kreibich, H.; Krueger, T.; Liu, J.; Mejia, A.; Van Loon, A.F.; Aksoy, H.; et al. Panta Rhei 2013–2015: Global perspectives on hydrology, society and change. Hydrol. Sci. J. 2016, 61, 1174–1191. [Google Scholar] [CrossRef] [Green Version]
  5. Van Loon, A.F.; Rangecroft, S.; Coxon, G.; Naranjo, J.A.B.; Van Ogtrop, F.; Van Lanen, H.A.J. Using paired catchments to quantify the human influence on hydrological droughts. Hydrol. Earth Syst. Sci. 2019, 23, 1725–1739. [Google Scholar] [CrossRef] [Green Version]
  6. Joly, C.A.; Scarano, F.R.; Bustamante, M.; Gadda, T.M.C.; Metzger, J.P.W.; Seixas, C.S.; Ometto, J.P.H.B.; Pires, A.P.F.; Boesing, A.L.; Sousa, F.D.R.; et al. Brazilian assessment on biodiversity and ecosystem services: Summary for policy makers. Biota Neotrop. 2019, 19, e20190865. [Google Scholar] [CrossRef]
  7. Silva, C.M. Entre Fênix e Ceres: A grande aceleração e a fronteira agrícola no Cerrado. Var. Hist. 2018, 34, 409–444. [Google Scholar] [CrossRef] [Green Version]
  8. Lathuillière, M.J.; Coe, M.T.; Johnson, M.S. A review of green- and blue-water resources and their trade-offs for future agricultural production in the Amazon Basin: What could irrigated agriculture mean for Amazonia? Hydrol. Earth Syst. Sci. 2016, 20, 2179–2194. [Google Scholar] [CrossRef] [Green Version]
  9. Butler, D.; Ward, S.; Sweetapple, C.; Astaraie-Imani, M.; Diao, K.; Farmani, R.; Fu, G. Reliable, resilient and sustainable water management: The Safe & SuRe approach. Glob. Chall. 2016, 1, 63–77. [Google Scholar] [CrossRef]
  10. Rogan, J.; Chen, D. Remote sensing technology for mapping and monitoring land-cover and land-use change. Prog. Plann. 2004, 61, 301–325. [Google Scholar] [CrossRef]
  11. Liping, C.; Yujun, S.; Saeed, S. Monitoring and predicting land use and land cover changes using remote sensing and GIS techniques—A case study of a hilly area, Jiangle, China. PloS ONE 2018, 13, e0200493. [Google Scholar] [CrossRef]
  12. Rwanga, S.S.; Ndambuki, J.M. Accuracy Assessment of Land Use/Land Cover Classification Using Remote Sensing and GIS. Int. J. Geosci. 2017, 8, 611–622. [Google Scholar] [CrossRef] [Green Version]
  13. Mahmon, N.A.; Ya’acob, N.; Yusof, A.L. Differences of image classification techniques for land use and land cover classification. In Proceedings of the 2015 IEEE 11th International Colloquium on Signal Processing & Its Applications (CSPA), Kuala Lumpur, Malaysia, 6–8 March 2015; pp. 90–94. [Google Scholar] [CrossRef]
  14. Murad, C.A.; Pearse, J. Landsat study of deforestation in the Amazon region of Colombia: Departments of Caquetá and Putumayo Remote Sens. Appl. Soc. Environ. 2018, 11, 161–171. [Google Scholar] [CrossRef]
  15. Brovelli, M.A.; Sun, Y.; Yordanov, V. Monitoring Forest Change in the Amazon Using Multi-Temporal Remote Sensing Data and Machine Learning Classification on Google Earth Engine. ISPRS Int. J. Geo-Inf. 2020, 9, 580. [Google Scholar] [CrossRef]
  16. Zaiatz, A.P.S.R.; Zolin, C.A.; Vendrusculo, L.G.; Lopes, T.R.; Paulino, J. Agricultural land use and cover change in the Cerrado/Amazon ecotone: A case study of the upper Teles Pires river basin. Acta Amazon. 2018, 48, 168–177. [Google Scholar] [CrossRef] [Green Version]
  17. Ge, Y.; Hu, S.; Ren, Z.; Jia, Y.; Wang, J.; Liu, M.; Zhang, D.; Zhao, W.; Luo, Y.; Fu, Y.; et al. Mapping annual land use changes in China’s poverty-stricken areas from 2013 to 2018. Remote Sens. Environ. 2019, 232, e111285. [Google Scholar] [CrossRef]
  18. Rawat, J.S.; Kumar, M. Monitoring land use/cover change using remote sensing and GIS techniques: A case study of Hawalbagh block, district Almora, Uttarakhand, India. Egypt. J. Remote Sens. Space Sci. 2015, 18, 77–84. [Google Scholar] [CrossRef] [Green Version]
  19. Kar, R.; Obi Reddy, G.P.; Kumar, N.; Singh, S.K. Monitoring spatio-temporal dynamics of urban and peri-urban landscape using remote sensing and GIS—A case study from Central India. Egypt. J. Remote Sens. Space Sci. 2018, 21, 401–411. [Google Scholar] [CrossRef]
  20. Neves, A.K.; Korting, T.S.; Fonseca, L.M.G.; Escada, M.I.S. Assessment of TerraClass and MapBiomas data on legend and map agreement for the Brazilian Amazon biome. Acta Amazon. 2020, 50, 170–182. [Google Scholar] [CrossRef]
  21. Souza, A.P.; Mota, L.L.; Zamadei, T.; Martim, C.C.; Almeida, F.T.; Paulino, J. Climate classification and climatic water balance in Mato Grosso state, Brazil. Nativa. 2013, 1, 34–43. Available online: https://periodicoscientificos.ufmt.br/ojs/index.php/nativa/article/view/1334 (accessed on 1 July 2022). [CrossRef]
  22. Kuemmerle, T.; Erb, K.; Meyfroidt, P.; Müller, D.; Verburg, P.H.; Estel, S.; Haberl, H.; Hostert, P.; Jepsen, M.R.; Kastner, T.; et al. Challenges and opportunities in mapping land use intensity globally. Curr. Opin. Environ. Sustain. 2013, 5, 484–493. [Google Scholar] [CrossRef] [PubMed]
  23. Souza, S.O. Geotechnologies applied to time-space analysis of land use and occupation in coastal plain of Caravelas (BA). Goiano Bull. Geogr. 2015, 35, 71–89. [Google Scholar] [CrossRef]
  24. Wulder, M.A.; Roy, D.P.; Radeloff, V.C.; Loveland, T.R.; Anderson, M.C.; Johnson, D.M.; Healey, S.; Zhu, Z.; Scambos, T.A.; Pahlevan, N.; et al. Fifty years of Landsat science and impacts. Remote Sens. Environ. 2022, 280, 113195. [Google Scholar] [CrossRef]
  25. Showstack, R. Landsat 9 Satellite Continues Half-Century of Earth Observations: Eyes in the sky serve as a valuable tool for stewardship. BioScience 2022, 72, 226–232. [Google Scholar] [CrossRef]
  26. Jog, S.; Dixit, M. Supervised classification of satellite images. In Proceedings of the 2016 Conference on Advances in Signal Processing (CASP), Pune, India, 9–11 June 2016; pp. 93–98. [Google Scholar] [CrossRef]
  27. Ali, M.Z.; Qazi, W.; Aslam, N. A comparative study of ALOS-2 PALSAR and landsat-8 imagery for landcover classification using maximum likelihood classifier. Egypt. J. Remote Sens. Space Sci. 2018, 21, 329–330. [Google Scholar] [CrossRef]
  28. Shalaby, A.; Tateishi, R. Remote sensing and GIS for mapping and monitoring land cover and land-use changes in the Northwestern coastal zone of Egypt. Appl. Geogr. 2007, 27, 28–41. [Google Scholar] [CrossRef]
  29. Asokan, A.; Anitha, J.; Ciobanu, M.; Gabor, A.; Naaji, A.; Hemanth, D.J. Image Processing Techniques for Analysis of Satellite Images for Historical Maps Classification—An Overview. Appl. Sci. 2020, 10, 4207. [Google Scholar] [CrossRef]
  30. Souza, C.M., Jr.; Z.Shimbo, J.; Rosa, M.R.; Parente, L.L.; A.Alencar, A.; Rudorff, B.F.T.; Hasenack, H.; Matsumoto, M.; G.Ferreira, L.; Souza-Filho, P.W.M.; et al. Reconstructing Three Decades of Land Use and Land Cover Changes in Brazilian Biomes with Landsat Archive and Earth Engine. Remote Sens. 2020, 12, 2735. [Google Scholar] [CrossRef]
  31. Shimabukuro, Y.E.; Arai, E.; Duarte, V.; Dutra, A.C.; Cassol, H.L.G.; Sano, E.E.; Hoffmann, T.B. Discriminating Land Use and Land Cover Classes in Brazil Based on the Annual PROBA-V 100 m Time Series. IEEE J. Sel. Top. Appl. Earth Obs. Remote Sens. 2020, 13, 3409–3420. [Google Scholar] [CrossRef]
  32. Gavade, A.B.; Rajpurohit, V.S. Systematic analysis of satellite image-based land cover classification techniques: Literature review and challenges. Int. J. Comput. Appl. 2019, 43, 514–523. [Google Scholar] [CrossRef]
  33. Opedes, H.; Mücher, S.; Baartman, J.E.M.; Nedala, S.; Mugagga, F. Land Cover Change Detection and Subsistence Farming Dynamics in the Fringes of Mount Elgon National Park, Uganda from 1978–2020. Remote Sens. 2022, 14, 2423. [Google Scholar] [CrossRef]
  34. Congalton, R.G. A review of assessing the accuracy classifications of remotely sensed data. Remote Sens. Environ. 1991, 37, 35–46. [Google Scholar] [CrossRef]
  35. Pendrill, F.; Persson, U.M. Combining global land cover datasets to quantify agricultural expansion into forests in Latin America: Limitations and challenges. PLoS ONE 2017, 12, e0181202. [Google Scholar] [CrossRef] [Green Version]
  36. Hoang, N.T.; Kanemoto, K. Mapping the deforestation footprint of nations reveals growing threat to tropical forests. Nat. Ecol. Evol. 2021, 5, 845–853. [Google Scholar] [CrossRef]
  37. Pendrill, F.; Persson, U.M.; Godar, J.; Kastner, T. Deforestation displaced: Trade in forest-risk commodities and the prospects for a global forest transition Environ. Res. Lett. 2019, 14, 055003. [Google Scholar] [CrossRef]
  38. Davis, K.F.; Koo, H.I.; Dell’Angelo, J.; D’Ororico, P.; Estes, L.; Kehoe, L.; Kharratzadeh, M.; Kuemmerle, T.; Machava, D.; Rodrigues Pais, A.J.; et al. Tropical forest loss enhanced by large-scale land acquisitions. Nat. Geosci. 2020, 13, 482–488. [Google Scholar] [CrossRef]
  39. Dubreuil, V.; Pechutti, F.K.; Planchon, O.; Sant’anna Neto, J.L. The types of annual climates in Brazil: An application of the classification of Köppen from 1961 to 2015. Confins 2018, 37. [Google Scholar] [CrossRef]
  40. Brazilian Agricultural Research Corporation—Embrapa. Brazil in Relief. Available online: https://www.cnpm.embrapa.br/projetos/relevobr/ (accessed on 1 July 2022).
  41. Brazilian Institute of Geography and Statistics (Instituto Brasileiro de Geografia e Estatística or IBGE). Statistics and Geosciences Downloads. Available online: https://downloads.ibge.gov.br/index.htm (accessed on 1 July 2022).
  42. Ettritch, G.; Hardy, A.; Bojang, L.; Cross, D.; Bunting, P.; Brewer, P. Enhancing digital elevation models for hydraulic modelling using flood frequency detection. Remote Sens. Environ. 2018, 217, 506–522. [Google Scholar] [CrossRef]
  43. United States Geological Survey (USGS). EarthExplorer. Available online: http://earthexplorer.usgs.gov/ (accessed on 1 July 2022).
  44. Santos, L.A.C.; Batista, A.C.; Neves, C.O.M.; Carvalho, E.V.; Santos, M.M.; Giongo, M. Multi-temporal analysis of land use and cover in nine municipalities in the south of Tocantins using Landsat images. Rev. Agroambiente 2017, 11, 111–118. [Google Scholar] [CrossRef] [Green Version]
  45. Furtado, L.G.; Morales, G.P.; Silva, D.F.; Pontes, A.N. Land use and land cover transformations in the Murucupi river basin, Barcarena, Pará. Rev. Bras. Geogr. Física 2020, 13, 2340–2354. [Google Scholar] [CrossRef]
  46. National Water Agency (Agência Nacional de Águas e Saneamento Básico or ANA). Dados Abertos da Agência Nacional de Águas e Saneamento Básico. Available online: https://dadosabertos.ana.gov.br (accessed on 1 July 2022).
  47. Cohen, J.A. Coefficient of agreement for nominal scales. Educational and Psycol. Meas. 1960, 20, 37–46. [Google Scholar] [CrossRef]
  48. MapBiomas. Annual Mapping of Land Cover and Land Use in Brazil. Available online: http://mapbiomas.org (accessed on 1 February 2023).
  49. Landis, J.R.; Koch, G.G. The measurement of observer agreement for categorical data. Biometrics 1977, 33, 159–174. [Google Scholar] [CrossRef] [PubMed] [Green Version]
  50. Shimabukuro, Y.E.; Miettinen, J.; Beuchle, R.; Grecchi, R.C.; Simonetti, D.; Achard, F. Estimating burned area in Mato Grosso, Brazil, using an object-based classification method on a systematic sample of medium resolution satellite images. IEEE J. Select. Top. Appl. Earth Observ. Rem. Sens. 2015, 8, 4502–4508. [Google Scholar] [CrossRef]
  51. Oliveira, N.A. “Winning the West”: Amazônia Legal Brasileira and the case of Nova Xavantina/MT. Front. Rev. Hist. 2015, 17, 248–272. Available online: https://1library.org/document/zgg09p2z-conquistando-oeste-amazonia-legal-brasileira-caso-nova-xavantina.html (accessed on 1 July 2022).
  52. Silva, M.; Deluski, E.C.; Santos, S.K.F.; Claudino, W.V.; Silva, E.P. Use of geotechnologies in the dynamics of soil occupation in the Municipality of Paranaita-MT. Agr. Acad. 2018, 5, 334–346. [Google Scholar] [CrossRef]
  53. Batista, F.R.Q.; Nogueira, S.H.; Ferreira, L.G. Mapping of Cerrado Phytophysiognomies by Remote Sensing: Challenges and Possibilities. In Brazilian Symposium on Remote Sensing (SBSR), 19, 2019, Santos; Electronic analytics; INPE: São José dos Campos, Brazil, 2019; pp. 403–406. Available online: http://urlib.net/rep/8JMKD3MGP6W34M/3TUPA2H (accessed on 1 July 2022).
  54. Phiri, D.; Morgenroth, J. Developments in Landsat land cover classification methods: A review. Remote Sens. 2017, 9, 967. [Google Scholar] [CrossRef] [Green Version]
  55. Santos, F.A.A.; Rocha, E.J.P.; Santos, J.S. Dynamics of Landscape and its Environmental Impacts in the Amazon. Rev. Bras. Geogr. Física 2019, 12, 1794–1815. [Google Scholar] [CrossRef] [Green Version]
  56. Santos, V.; Laurent, F.; Abe, C.; Messner, F. Hydrologic response to land use change in a large basin in Eastern Amazon. Water 2018, 10, 429. [Google Scholar] [CrossRef] [Green Version]
  57. Zeilhofer, P.; Alcantara, L.H.; Fantin-Cruz, I. Effects of deforestation on spatio-temporal runoff patterns in the upper Teles Pires watershed, Mato Grosso, Brazil. Rev. Bras. Geogr. Física 2018, 11, 1889–1901. [Google Scholar] [CrossRef] [Green Version]
  58. Yoshikawa, S.; Sanga-Ngoie, K. Deforestation dynamics in Mato Grosso in the southern Brazilian Amazon using GIS and NOAA/AVHRR data. Int. J. Remote Sens. 2011, 32, 523–544. [Google Scholar] [CrossRef]
  59. Diniz, M.B.; Oliveira Junior, J.N.; Neto, N.T.; Diniz, M.J.T. Causes of deforestation in the Amazon: An application of the Granger causality test on the main sources of deforestation in the municipalities of the Brazilian legal Amazon. Nova Econ. 2009, 19, 121–151. [Google Scholar] [CrossRef] [Green Version]
  60. Timpe, K.; Kaplan, D. The changing hydrology of a dammed Amazon. Sci. Adv. 2017, 3, e1700611. [Google Scholar] [CrossRef] [Green Version]
  61. Lees, A.C.; Peres, C.A.; Fearnside, P.M.; Schneider, M.; Zuanon, J.A.S. Hydropower and the future of Amazonian biodiversity. Biodivers. Conserv. 2016, 25, 451–466. [Google Scholar] [CrossRef]
  62. Winemiller, K.O.; McIntyre, P.B.; Castello, L.; Fluet-Chouinard, E.; Giarrizzo, T.; Nam, S.; Baird, I.G.; Darwall, W.; Lujan, N.K.; Harrison, I.; et al. Balancing hydropower and biodiversity in the Amazon, Congo, and Mekong. Science 2016, 351, 128–129. [Google Scholar] [CrossRef] [PubMed] [Green Version]
  63. Faria, F.A.M.; Jaramillo, P.; Sawakuchi, H.O.; Richey, J.E.; Barros, N. Estimating greenhouse gas emissions from future Amazonian hydroelectric reservoirs Environ. Res. Lett. 2015, 10, 124019. [Google Scholar] [CrossRef] [Green Version]
  64. Gollnow, F.; Lakes, T. Policy change, land use, and agriculture: The case of soy production and cattle ranching in Brazil, 2001-2012. Appl. Geogr. 2014, 55, 203–211. [Google Scholar] [CrossRef]
  65. Gusso, A.; Ducati, J.R.; Bortolotto, V.C. Analysis of soybean cropland expansion in the southern Brazilian Amazon and its relation to economic drivers. Acta Amazon. 2017, 47, 281–292. [Google Scholar] [CrossRef] [Green Version]
  66. Simões, R.; Picoli, M.C.A.; Camara, G.; Maciel, A.; Santos, L.; Andrade, P.R.; Sánches, A.; Ferreira, K.; Carvalho, A. Land use and cover maps for Mato Grosso State in Brazil from 2001 to 2017. Sci. Data 2020, 7, 1–10. [Google Scholar] [CrossRef] [Green Version]
  67. Klink, C.A.; Machado, R.B. Conservation of the Brazilian Cerrado. Conserv. Biol. 2005, 19, 707–713. [Google Scholar] [CrossRef]
  68. Gibbs, H.K.; Rausch, L.; Munger, J.; Schelly, I.; Morton, D.C.; Noojipady, P.; Soares Filho, B.; Barreto, P.; Micol, L.; Walker, N.F. Brazil’s Soy Moratorium. Science 2015, 347, 377–378. [Google Scholar] [CrossRef]
  69. Hunke, P.; Roller, R.; Zeilhofer, P.; Schröder, B.; Mueller, E.N. Soil changes under different land-use in the Cerrado of Mato Grosso, Brazil. Geoderma Reg. 2015, 4, 31–43. [Google Scholar] [CrossRef]
  70. Picoli, M.C.A.; Rorato, A.; Leitão, P.; Camara, G.; Maciel, A.; Hostert, P.; Sanches, I.D. Impacts of public and private sector policies on soybean and pasture expansion in Mato Grosso-Brazil from 2001 to 2017. Land 2020, 9, 20. [Google Scholar] [CrossRef] [Green Version]
  71. Cohn, A.S.; Gil, J.; Berger, T.; Pellegrina, H.; Toledo, C. Patterns and processes of pasture to crop conversion in Brazil: Evidence from Mato Grosso State. Land Use Policy 2016, 55, 108–120. [Google Scholar] [CrossRef]
  72. Fearnside, P.M. Deforestation in Brazilian Amazonia: History, Rates, and Consequences. Conserv. Biol. 2005, 19, 680–688. [Google Scholar] [CrossRef]
  73. Ferreira, M.D.P.; Coelho, A.B. Recent Deforestation in the States of the Legal Amazon: An analysis of the contribution of agricultural prices and government policies. Rev. Econ. Sociol. Rural 2015, 53, 93–108. [Google Scholar] [CrossRef] [Green Version]
  74. Pacheco, R.; Rajão, R.; Soares-Filho, B.; Hoff, R.V.D. Regularization of Legal Reserve Debts: Perceptions of rural producers in the state of Pará and Mato Grosso in Brazil. Ambient. Soc. 2017, 20, 181–200. [Google Scholar] [CrossRef] [Green Version]
  75. Rudorff, B.F.T.; Adami, M.; Aguiar, D.A.; Moreira, M.A.; Mello, M.P.; Fabiani, L.; Amaral, D.F.; Pires, B.M. The soy moratorium in the Amazon biome monitored by remote sensing images. Remote Sens. 2011, 3, 185–202. [Google Scholar] [CrossRef] [Green Version]
  76. Spera, S.A.; Cohn, A.S.; VanWey, L.K.; Mostarda, J.F.; Rudorff, B.F.; Risso, J.; Adami, M. Recent cropping frequency, expansion, and abandonment in Mato Grosso, Brazil had selective land characteristics. Environ. Res. Lett. 2014, 9, 064010. [Google Scholar] [CrossRef] [Green Version]
  77. Zilverberg, C.J.; Heimerl, K.; Schumacher, T.E.; Malo, D.D.; Schumacher, J.A.; Johnson, W.C. Landscape dependent changes in soil properties due to long-term cultivation and subsequent conversion to native grass agriculture. Catena 2018, 160, 282–297. [Google Scholar] [CrossRef]
  78. Dionizio, E.A.; Costa, M.H. Influence of land use and land cover on hydraulic and physical soil properties at the Cerrado Agricultural Frontier. Agric. 2019, 9, 24. [Google Scholar] [CrossRef] [Green Version]
  79. Scanlon, B.R.; Jolly, I.; Sophocleous, M.; Zhang, L. Global impacts of conversions from natural to agricultural ecosystems on water resources: Quantity versus quality. Water Resour. Res. 2007, 43, W03437. [Google Scholar] [CrossRef] [Green Version]
  80. Borella, D.R.; de Souza, A.P.; de Almeida, F.T.; de Abreu, D.C.; Hoshide, A.K.; Carvalho, G.A.; Pereira, R.R.; da Silva, A.F. Dynamics of Sediment Transport in the Teles Pires River Basin in the Cerrado-Amazon, Brazil. Sustainability 2022, 14, 16050. [Google Scholar] [CrossRef]
  81. Pedrosa, L.M.; Hoshide, A.K.; Abreu, D.C.; de Molossi, L.; Couto, E.G. Financial transition and costs of sustainable agricultural intensification practices on a beef cattle and crop farm in Brazil’s Amazon. Renew. Agric. Food Sys. 2019, 36, 26–37. [Google Scholar] [CrossRef]
  82. Molossi, L.; Hoshide, A.K.; Pedrosa, L.M.; Oliveira, A.S.; Abreu, D.C. Improve pasture or feed grain? Greenhouse gas emissions, profitability, and resource use for Nelore beef cattle in Brazil’s Cerrado and Amazon biomes. Animals 2020, 10, 1386. [Google Scholar] [CrossRef] [PubMed]
  83. Skidmore, M.E.; Sims, K.M.; Rausch, L.L.; Gibbs, H.K. Sustainable intensification in the Brazilian cattle industry: The role for reduced slaughter age. Environ. Res. Lett. 2022, 17, 064026. [Google Scholar] [CrossRef]
  84. Pinheiro, D.T.; Santos, D.M.S.; Martins, A.R.R.; da Silva, W.M.; de Araújo, C.V.; de Abreu, D.C.; Hoshide, A.K.; Molossi, L.; de Oliveira, R.A. Closing the gap: Sustainable intensification implications of increased corn yields and quality for second-crop (safrinha) in Mato Grosso, Brazil. Sustainability 2021, 13, 13325. [Google Scholar] [CrossRef]
  85. Da Silva, W.M.; Bianchini, A.; Amorim, R.S.S.; Couto, E.G.; dos Santos Weber, O.L.; Hoshide, A.K.; Pereira, P.S.X.; Cremon, C.; de Abreu, D.C. Soil efflux of carbon dioxide in Brazilian Cerrado wheat under variable soil preparation and irrigation. Agriculture 2022, 12, 163. [Google Scholar] [CrossRef]
  86. Kraeski, A.; Almeida, F.T.; Carvalho, T.M.; Souza, A.P. Identification of land use conflicts in Permanent Preservation Area in a Brazilian Amazon sub-basin. Soc. E Nat. 2022, 35, e65951. [Google Scholar] [CrossRef]
  87. Reydon, B.P.; Fernandes, V.B.; Telles, T.S. Land governance as a precondition for decreasing deforestation in the Brazilian Amazon. Land Use Policy 2020, 94, 104313. [Google Scholar] [CrossRef]
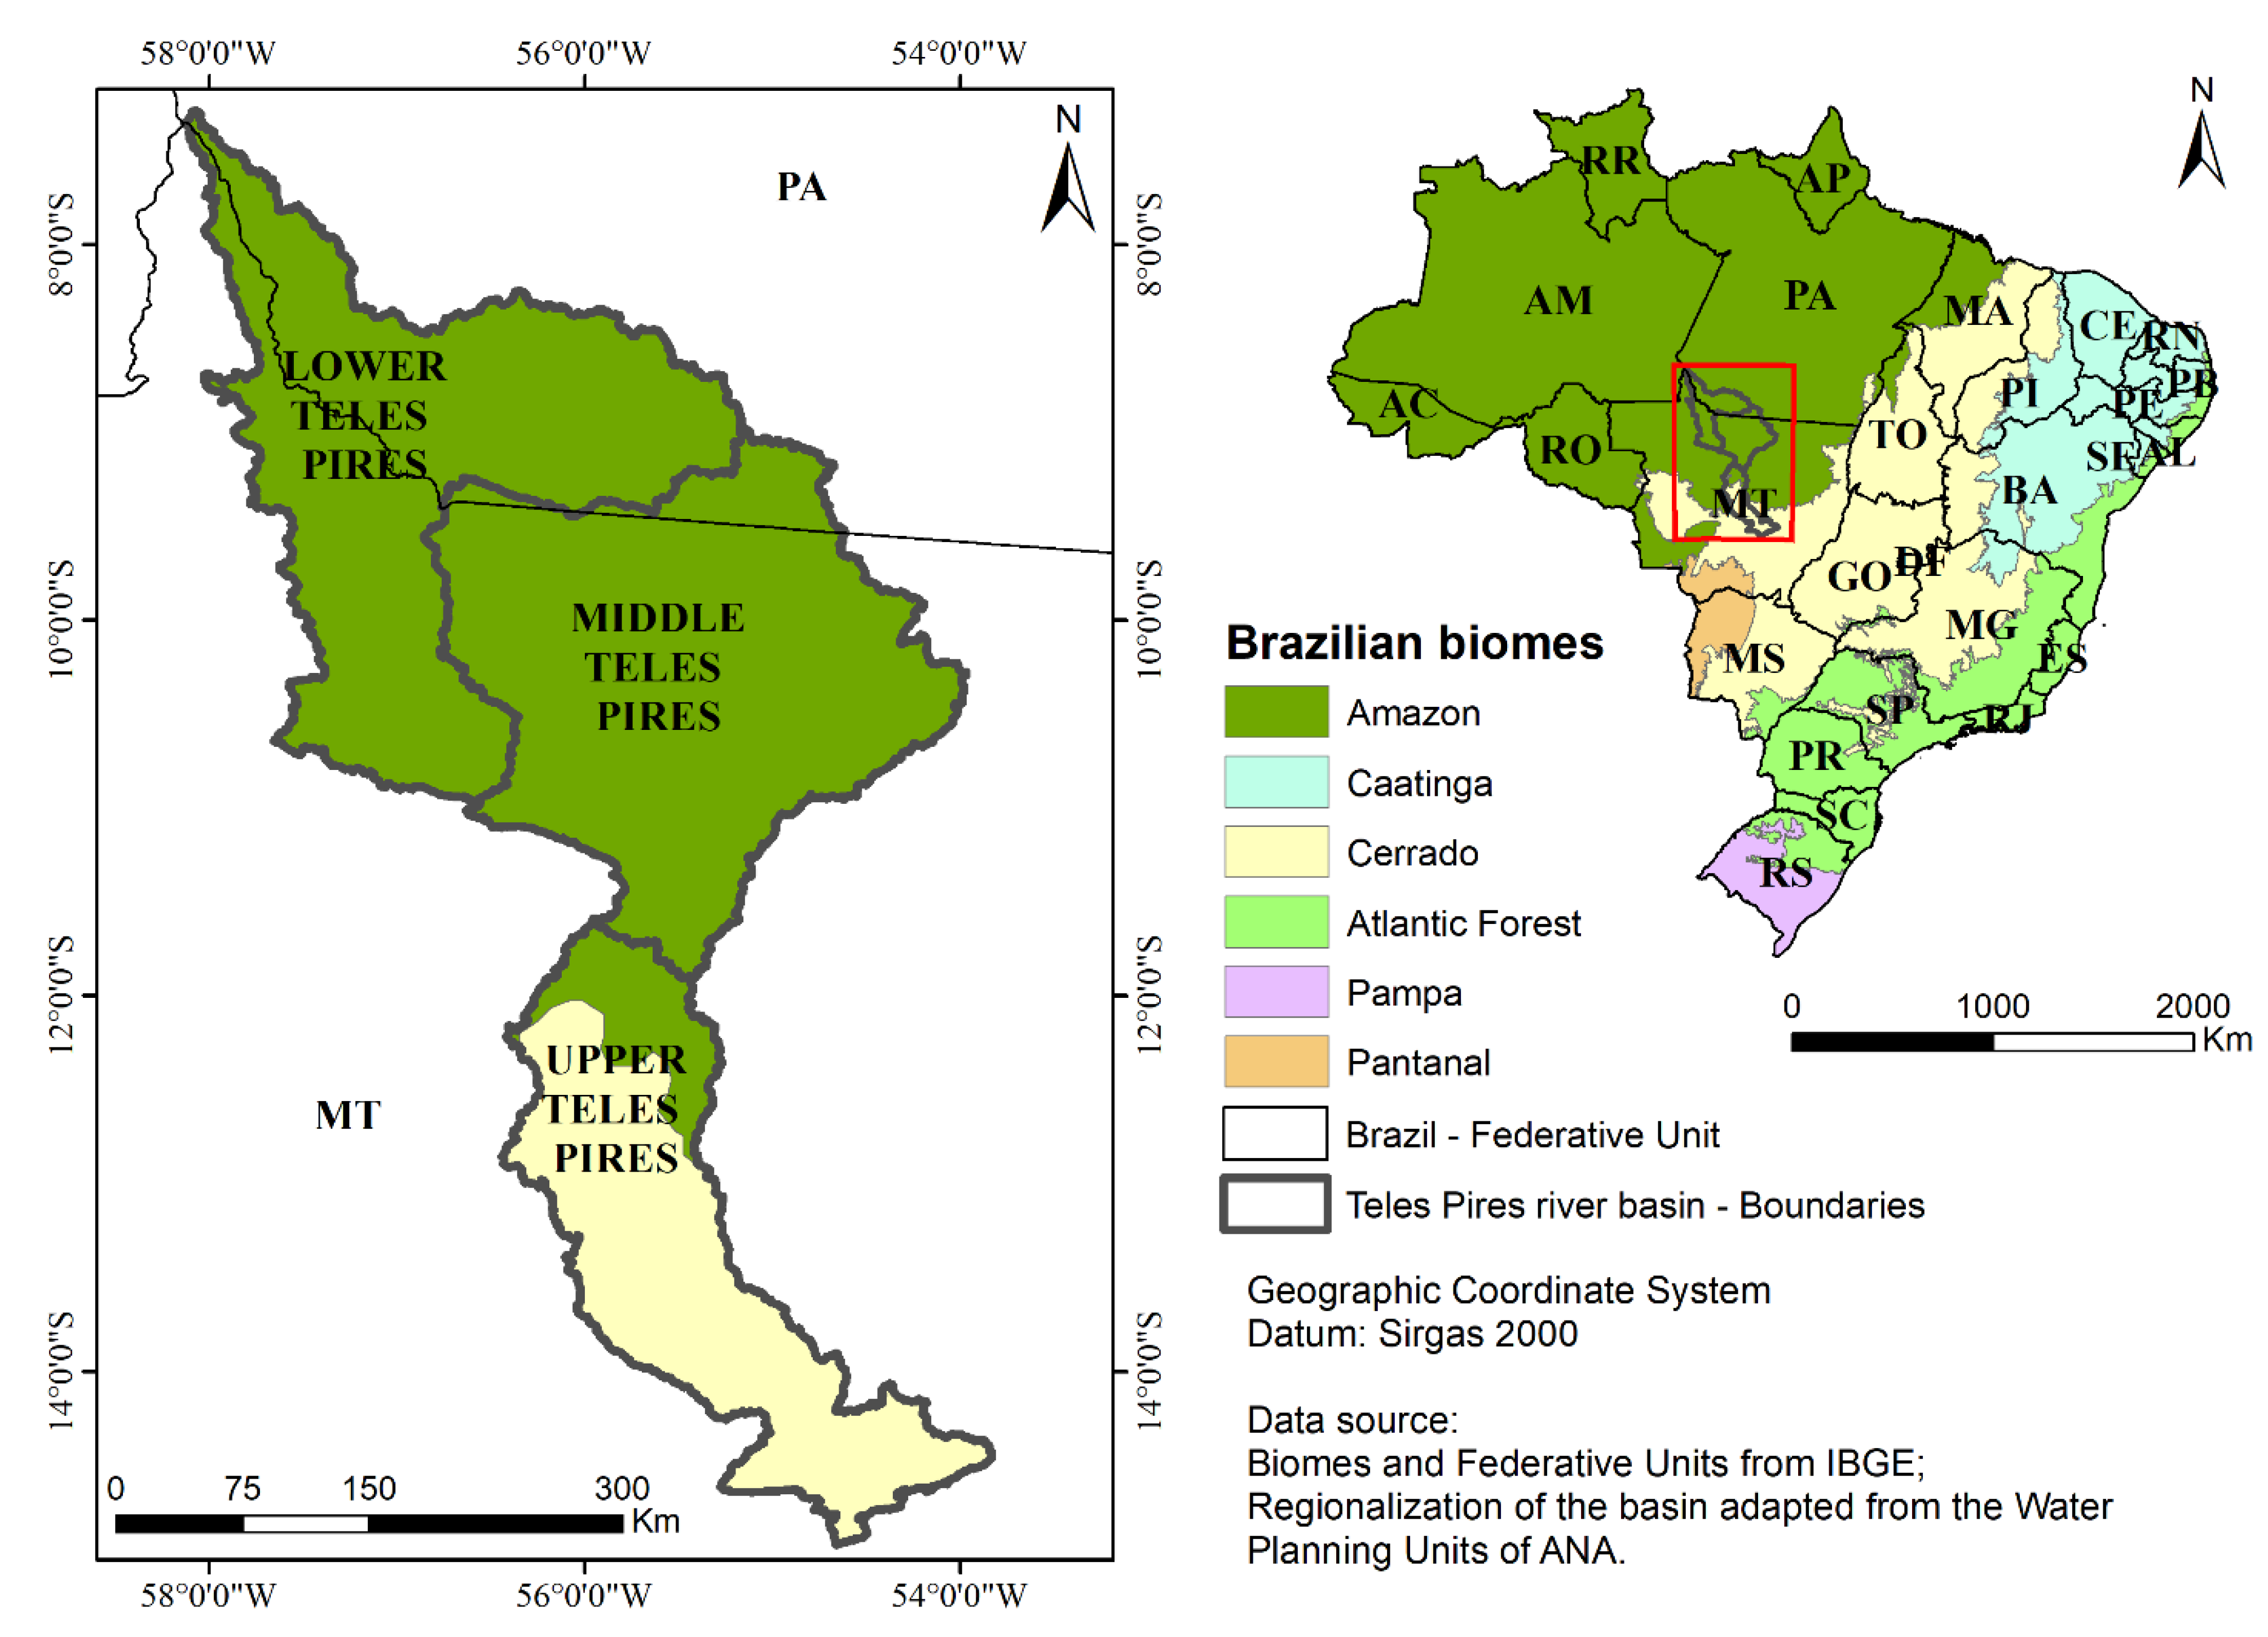
Figure 1. Location and regions of Teles Pires River basin in Brazil.
Sustainability 15 04611 g001
Figure 2. Distribution of points collected in the field in Brazil’s Teles Pires River basin in 2020.
Sustainability 15 04611 g002
Figure 3. Maps of land use in the Teles Pires River basin during 1986, 1991, 2005, and 2020.
Sustainability 15 04611 g003
Figure 4. Change in land use classification percentages for the Teles Pires River basin for 1986, 1991, 2005, and 2020.
Sustainability 15 04611 g004
Figure 5. Native vegetation and agricultural (a) area, and (b) percent change from the previous time period, and water, other, and burned (c) areas, and (d) percent change from previous time period, in Brazil’s Teles Pires River basin from 1986 to 2020.
Sustainability 15 04611 g005
Figure 6. Evolution of land use in Brazil’s upper, middle, and lower Teles Pires regions in percent (%) of areas occupied per class.
Sustainability 15 04611 g006
Figure 7. Conversion of areas between forest (F), pasture (P), crops (CP), and Cerrado (C) land use classes between the years mapped in the Teles Pires River basin.
Sustainability 15 04611 g007
Figure 8. Pasture areas converted to crops in the different regions of the Teles Pires River basin.
Sustainability 15 04611 g008
Table 1. Orbit/point and day/month of images used for mapping land use and occupation in the Teles Pires River watershed.
Orbit/PointYear
19861991199620002005201120152020
225/7029 June29 July11 Aug.21 July17 June20 July16 Aug.10 June
226/668 Sept.18 June1 July28 July10 July12 Aug.7 Aug.3 July
226/678 Sept.20 July1 July10 June10 July12 Aug.7 Aug.3 July
226/687 Aug.20 July1 July10 June26 July12 Aug.7 Aug.3 July
226/697 Aug.20 July30 May10 June26 July13 Sept.7 Aug.3 July
226/707 Aug.20 July1 July10 June26 July11 July7 Aug.3 July
227/6627 June27 July6 June17 June17 July18 July14 Aug.10 July
227/6727 June27 July6 June17 June17 July3 Aug.14 Aug.10 July
227/6827 June27 July6 June1 June17 July3 Aug.14 Aug.10 July
227/6927 June27 July6 June1 June17 July3 Aug.14 Aug.10 July
228/655 Aug.18 July15 July10 July8 July25 July5 Aug.17 July
228/665 Aug.18 July15 July26 July8 July25 July5 Aug.17 July
228/675 Aug.18 July31 July26 July8 July25 July5 Aug.15 June
229/6528 Aug.26 Aug.23 Aug.17 July15 July1 Aug.12 Aug.22 June
SensorTMTMTMTMTMTMOLIOLI
TM = Thematic Mapper sensor; OLI = Operational Land Imager sensor.
Table 2. Description of the land use classes mapped for the Teles Pires River basin in Brazil.
Land Use ClassesDescription
WaterSurfaces covered by water, encompassing the water bodies of the basin.
ForestArea of tree forest vegetation with high density of trees.
CerradoArea of vegetation with predominance of shrub stratum, showing variations with areas of low-density forest formation.
PastureAreas covered by natural or planted perennial forage intended for cattle grazing.
CropsAreas intended for the cultivation of food crops, fibers, and agribusiness commodities.
Burned areaSurfaces that have undergone recent burning processes, with evidence of the affected areas.
Other areaFormed by the junction of land occupation classes with reduced spatial cover in the basin, including urban areas, mining areas, sandbanks, and rock formations.
Table 3. Legend adjustments of classes mapped by the MapBiomas project with those mapped in this study.
ClassificationMapBiomas
WaterRiver, lake, and ocean.
ForestForest training and silviculture.
CerradoSavanna formation, grassland formation, and other non-forest natural formations.
PasturePasture.
CropsCrops, temporary crops, sugarcane, soybeans, other temporary crops, and cotton.
Burned area-
Other areaUrbanized area, other non-vegetated areas, and mining.
Table 4. Results of the accuracy indices of land use classifications for all mapped years for Brazil’s Teles Pires River basin based on Google Earth and Landsat data.
19861991199620002005201120152020
Kappa Index0.960.960.970.970.970.970.970.97
Overall Accuracy (%)98.4397.9798.7398.0398.2498.4998.0498.46
Producer Accuracy (%)
Water100100100100100100100100
Forest10010010010010099.9910099.98
Cerrado93.2794.4693.4491.0689.9392.5691.9795.96
Pasture98.5898.6599.2197.5598.2998.7197.9097.67
Crops99.4693.0998.4599.1697.7998.5397.0697.30
Burned area10010010099.9310010099.57100
Other area75.6679.4586.6771.7079.1474.6074.7283.50
User Accuracy (%)
Water100100100100100100100100
Forest98.7598.8898.7798.1898.5498.8198.7799.18
Cerrado10010010010010010010099.95
Pasture96.2392.7397.8498.6597.6498.7895.4597.72
Crops89.9492.6292.3993.2395.1493.2294.7692.51
Burned area100100100100100100100100
Other area100100100100100100100100
Table 5. Confusion matrix between classification and field data for the year 2020.
2020Earthly Truth
WaterForestCerradoPastureCropsBurned AreaOther AreaTotalUA (%)
Water4200000042100.00
Forest03467110035597.46
Cerrado025900006196.72
Pasture007545330058593.16
Crops0247528902439473.35
Burned area00000000-
Other area0000004040100.00
Total42350776213230641477
PA (%)100.0098.8676.6287.7689.47-62.50
Overall accuracy (%):89.44 Kappa Index:0.85
PA = producer accuracy; UA = user accuracy.
Table 6. Areas corresponding to the classes of land use and occupation in Brazil’s Teles Pires River basin mapped between 1986 and 2020.
Land Use Classes19861991199620002005201120152020Percent Change 1986–2020
Waterkm2686.6762.6747.1718.8724.7737.2924.81159.168.82
% of total0.490.540.530.510.510.520.650.82
% change-11.07−2.03−3.790.821.7325.4525.34
Forestkm2114,444.0111,470.4100,091.796,777.983,218.480,710.779,330.578,979.0−30.99
% of total80.8778.7770.7368.3958.8157.0356.0655.81
% change-−2.60−10.21−3.31−14.01−3.01−1.71−0.44
Cerradokm213,069.511,923.211,416.08381.77927.55805.75196.45356.1−59.02
% of total9.248.438.075.925.604.103.673.78
% change-−8.77−4.25−26.58−5.42−26.77−10.493.07
Pasturekm28839.711,658.020,248.223,533.132,385.734,423.234,643.230,988.6250.56
% of total6.258.2414.3116.6322.8924.3324.4821.90
% change-31.8873.6916.2237.626.290.64−10.55
Cropskm23244.04098.78150.711,194.616,177.619,201.620,787.824,105.9643.09
% of total2.292.905.767.9111.4313.5714.6917.03
% change-26.3598.8637.3544.5118.698.2615.96
Burned areakm2708.4902.0509.9406.2412.3145.6125.9163.8−76.87
% of total0.500.640.360.290.290.100.090.12
% change-27.33−43.47−20.341.50−64.69−13.5330.10
Other areakm2522.8699.4350.0502.5667.2489.4505.1757.944.98
%0.370.490.250.360.470.350.360.54
% change-33.78−49.9643.5732.78−26.653.2150.05
Table 7. Matrix of conversion of areas in square kilometers (km2) for land use classifications in the Teles Pires River basin between 1986 and 2020.
Columns = Gains for Each Class between 1986 and 2020
ClassWaterForestCerradoPastureCropsBurned AreaOther AreaTotalLosses
(1986–2020)
Rows = Losses for each
class between 1986 and 2020
Water523.50145.764.044.292.000.826.11686.52163.03
Forest537.8676,550.19925.6323,232.5912,694.8761.91421.31114,424.4037,874.17
Cerrado26.891012.664011.002081.095822.5487.6320.1713,061.989050.97
Pasture40.201132.88195.125055.312296.688.63108.048836.863781.55
Crops4.5721.85131.03245.182812.592.9924.413242.62430.04
Burned area10.4933.8885.85167.17404.291.554.93708.16706.61
Other area15.5674.181.10199.5859.030.30172.71522.46349.76
Total1159.0778,971.405353.7730,985.2124,092.00163.83757.68
Gains
(1986–2020)
635.572421.211342.7725,929.9021,279.41162.28584.98
Bold numbers on the diagonal indicate the area in each class that was maintained in 1986 and 2020.
Disclaimer/Publisher’s Note: The statements, opinions and data contained in all publications are solely those of the individual author(s) and contributor(s) and not of MDPI and/or the editor(s). MDPI and/or the editor(s) disclaim responsibility for any injury to people or property resulting from any ideas, methods, instructions or products referred to in the content.