
Estimating Sugarcane Yield in a Subtropical Climate Using Climatic Variables and Soil Water Storage

 ,
,  , and
, and
Abstract
1. Introduction
2. Materials and Methods
2.1. Study Location and Agrometerological Data
2.2. Sugarcane Data
2.3. Adjustment of the Multiple Linear Regression Model
2.4. Statistical Analyses
3. Results
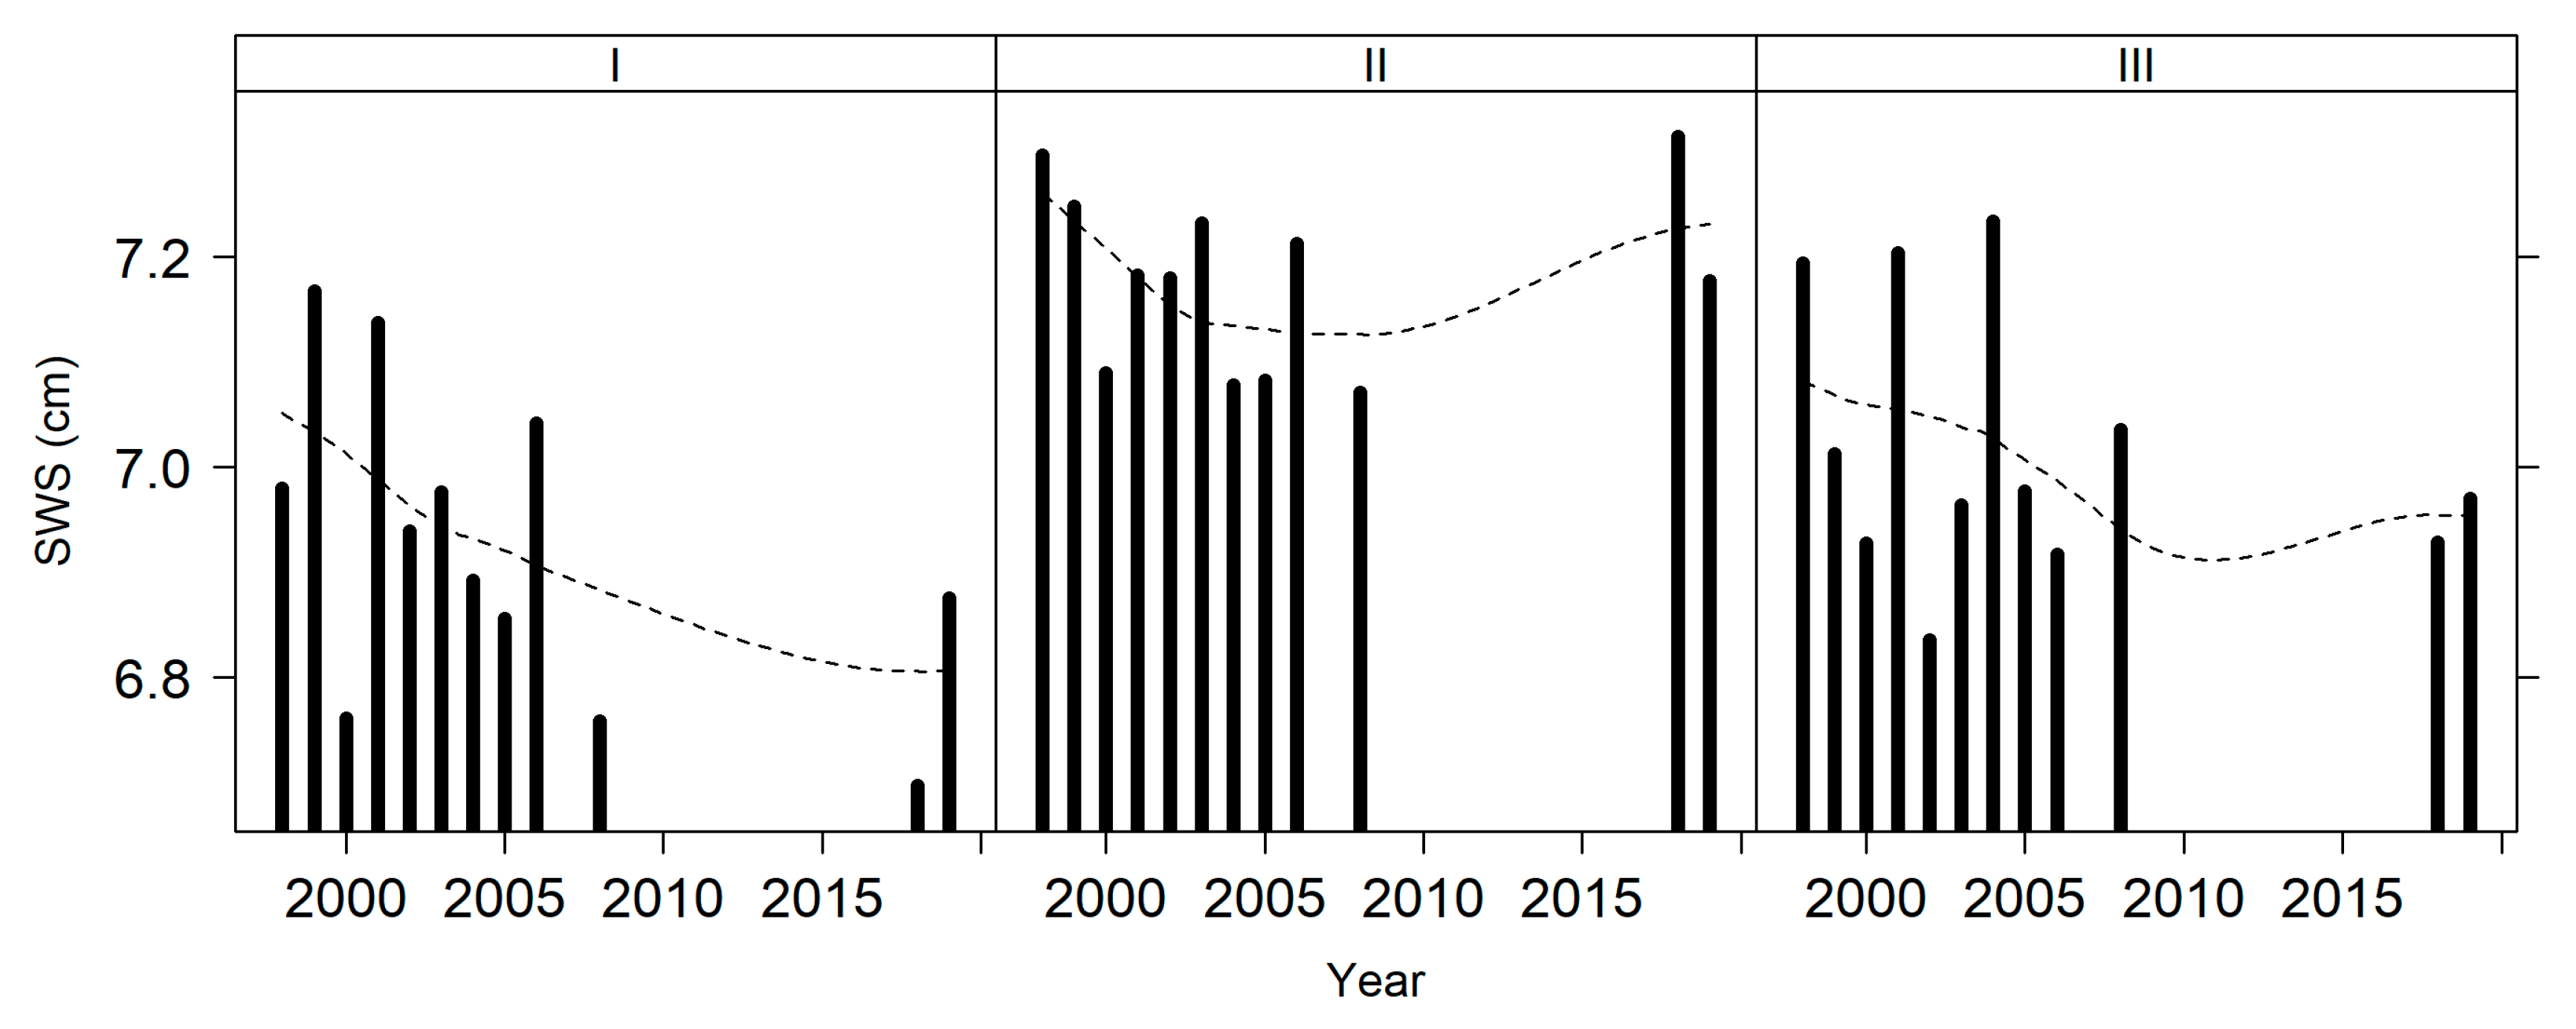
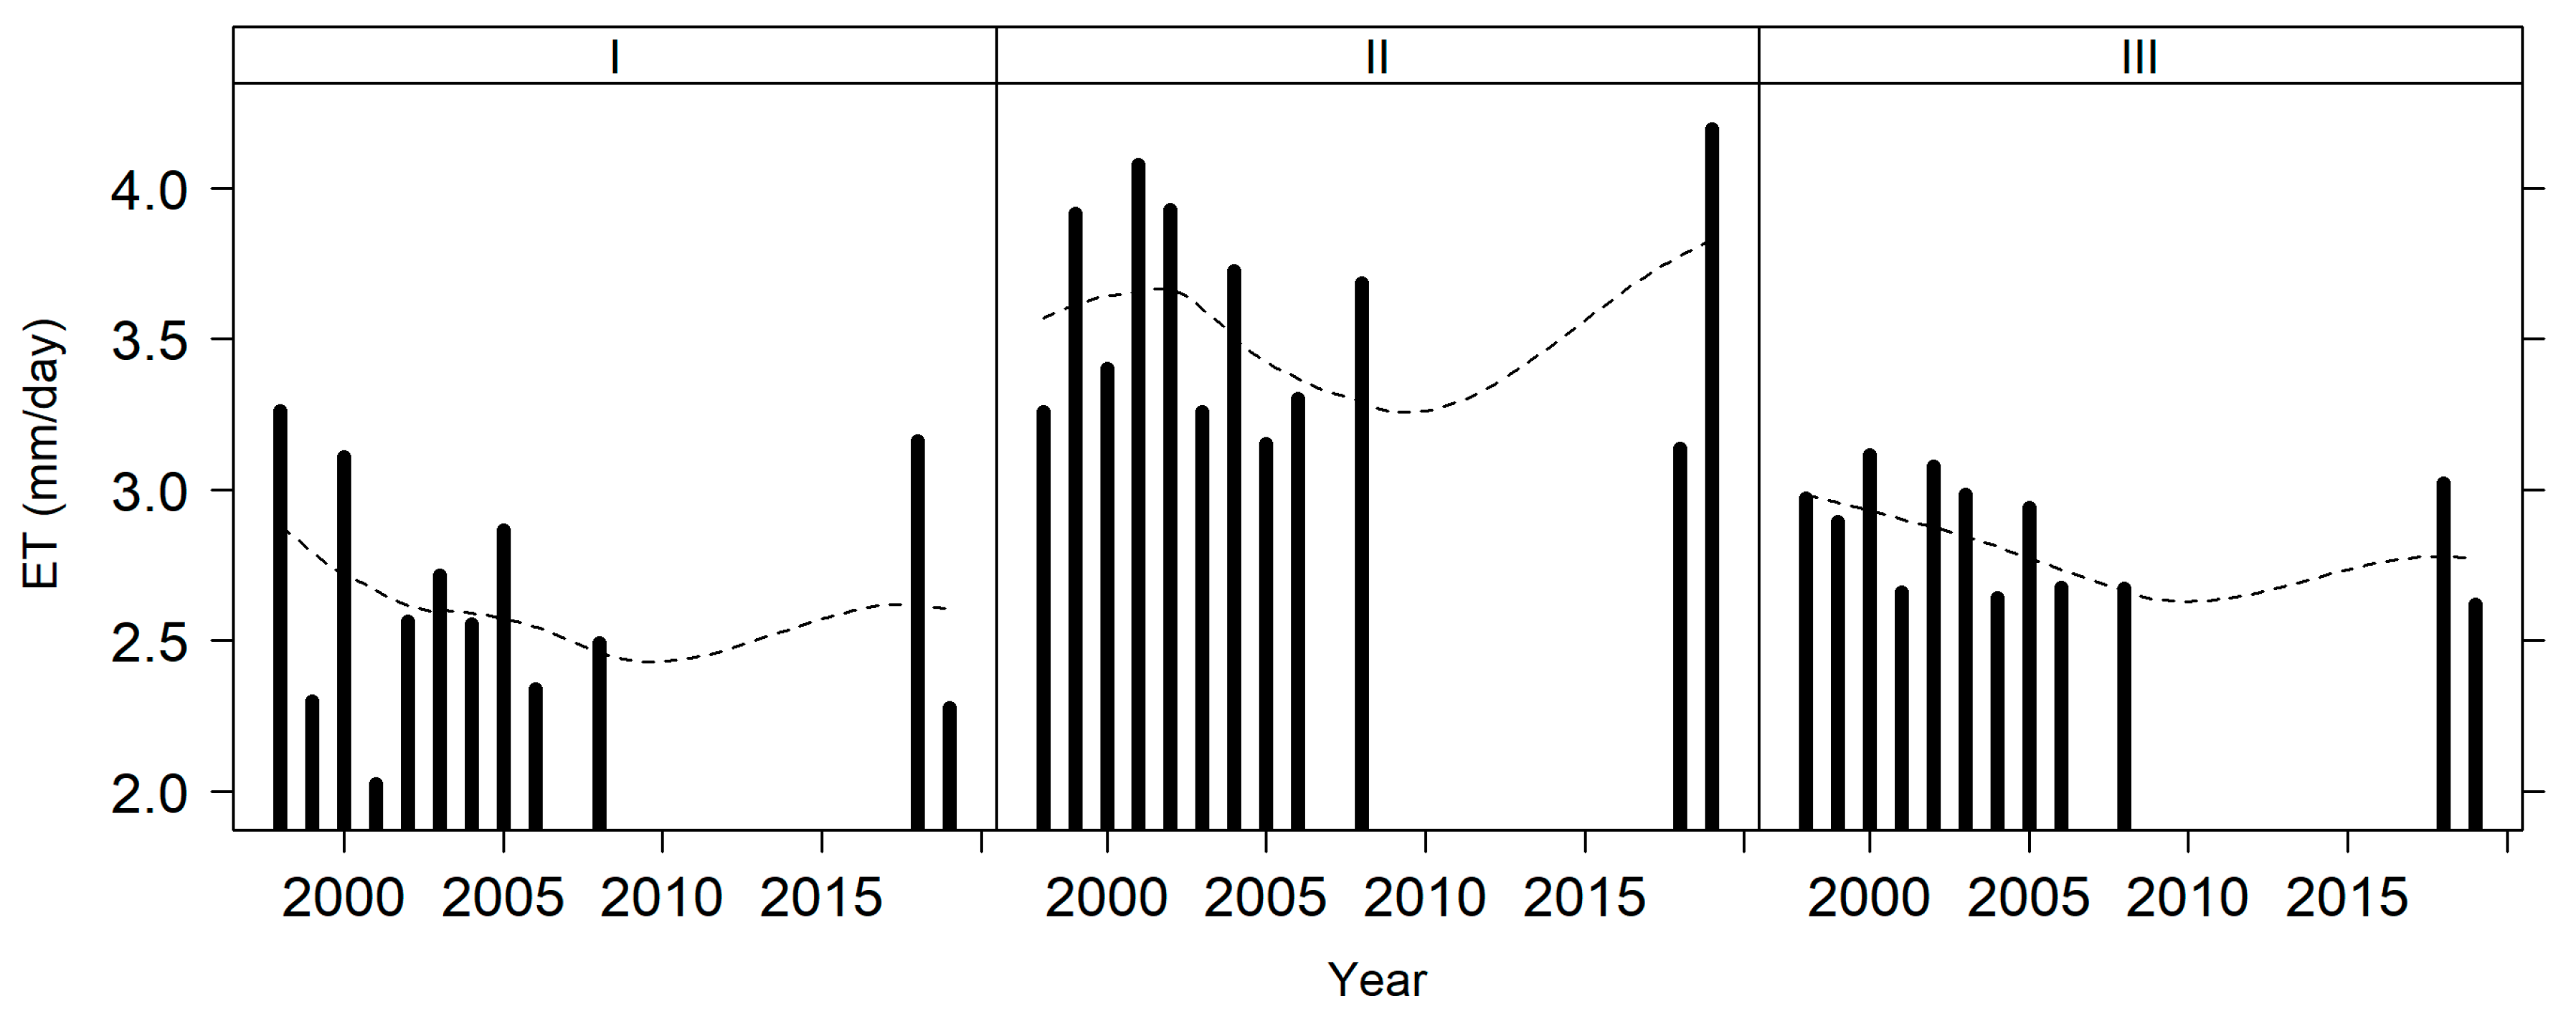
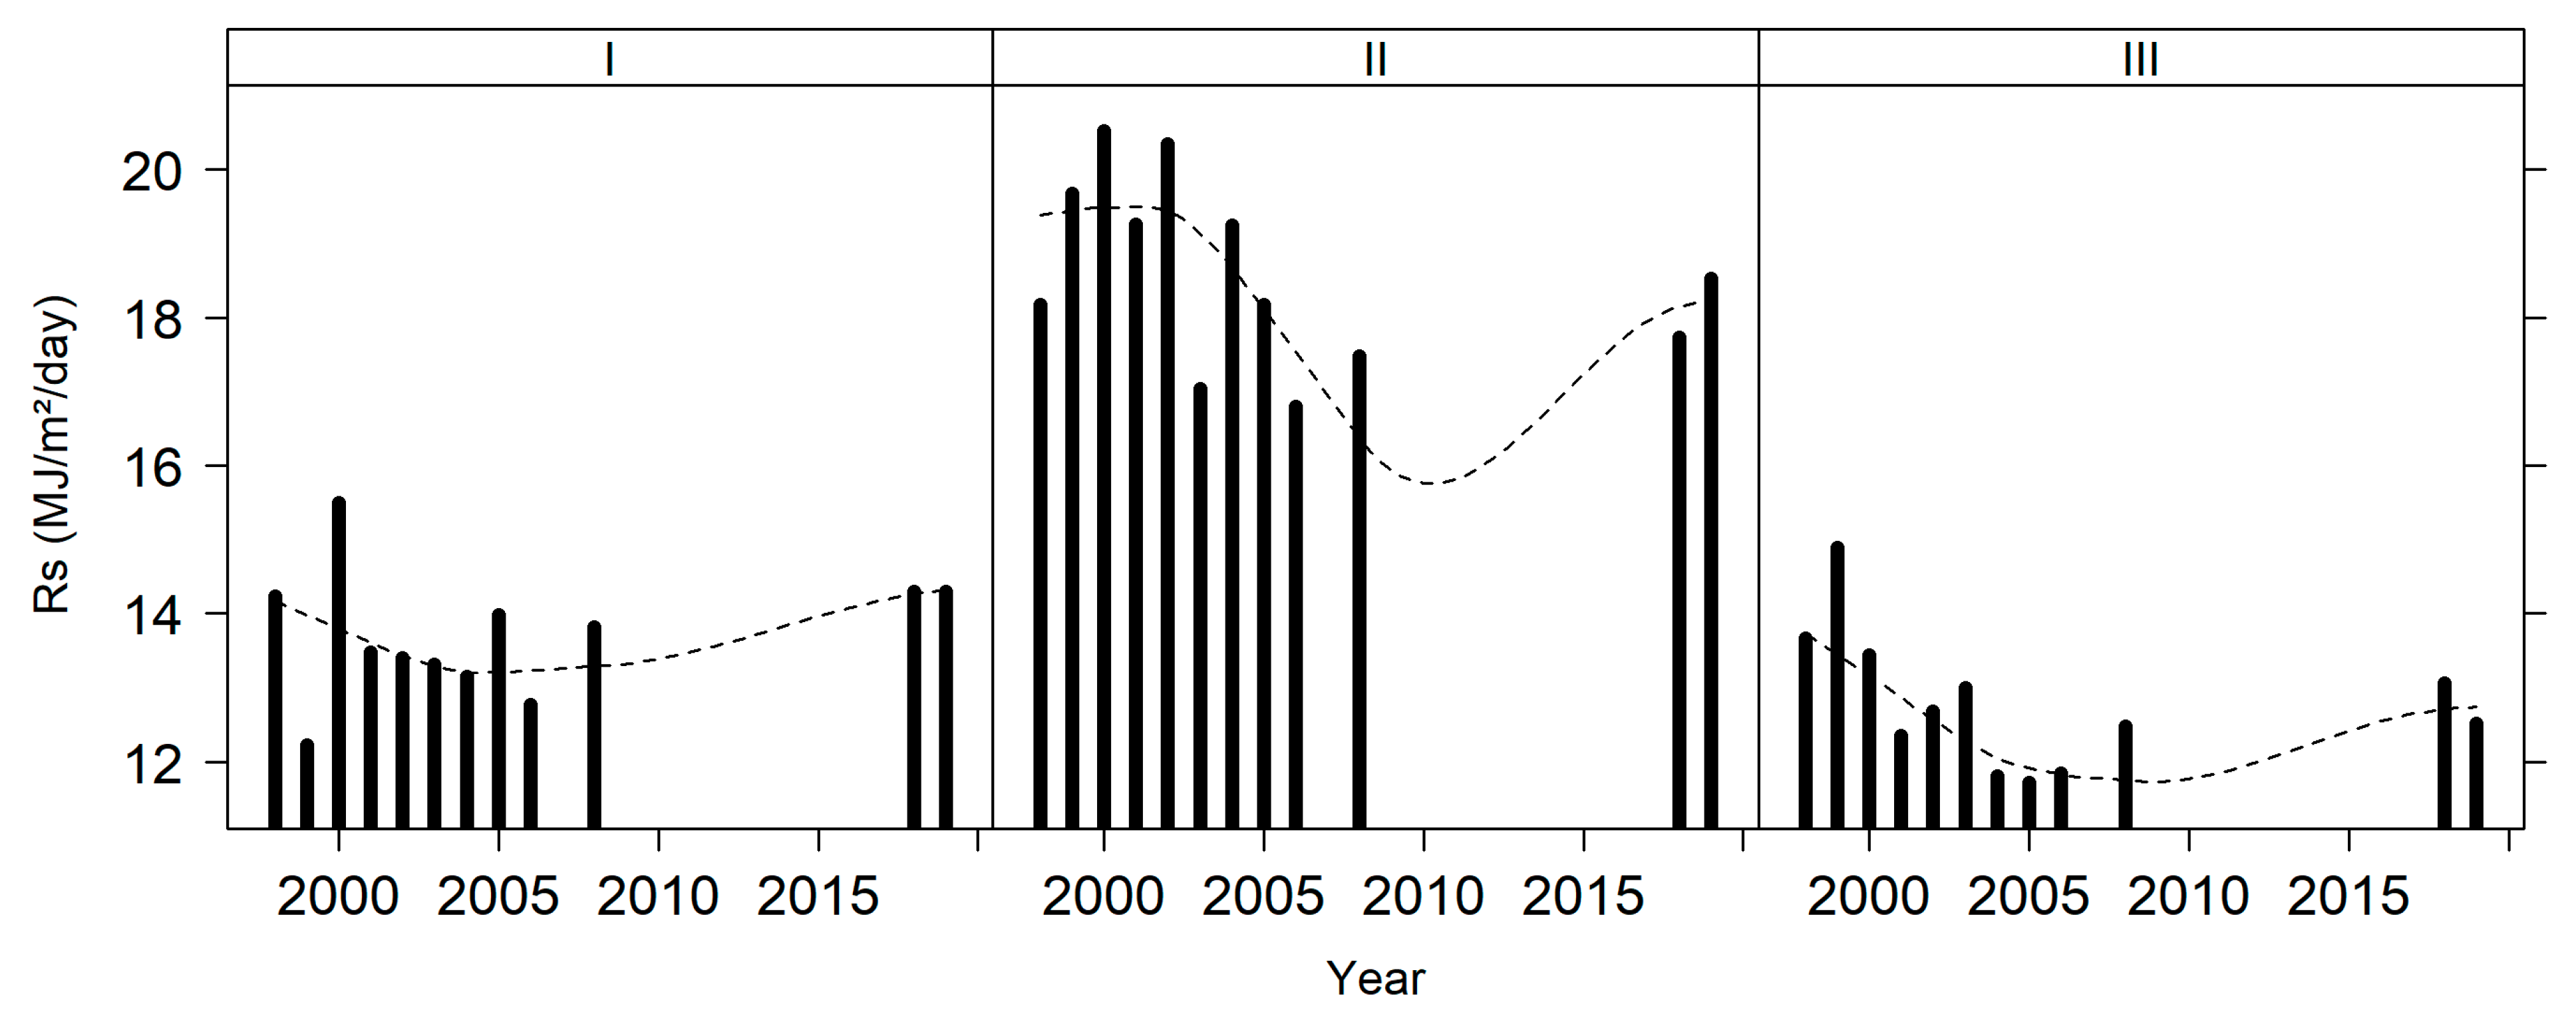
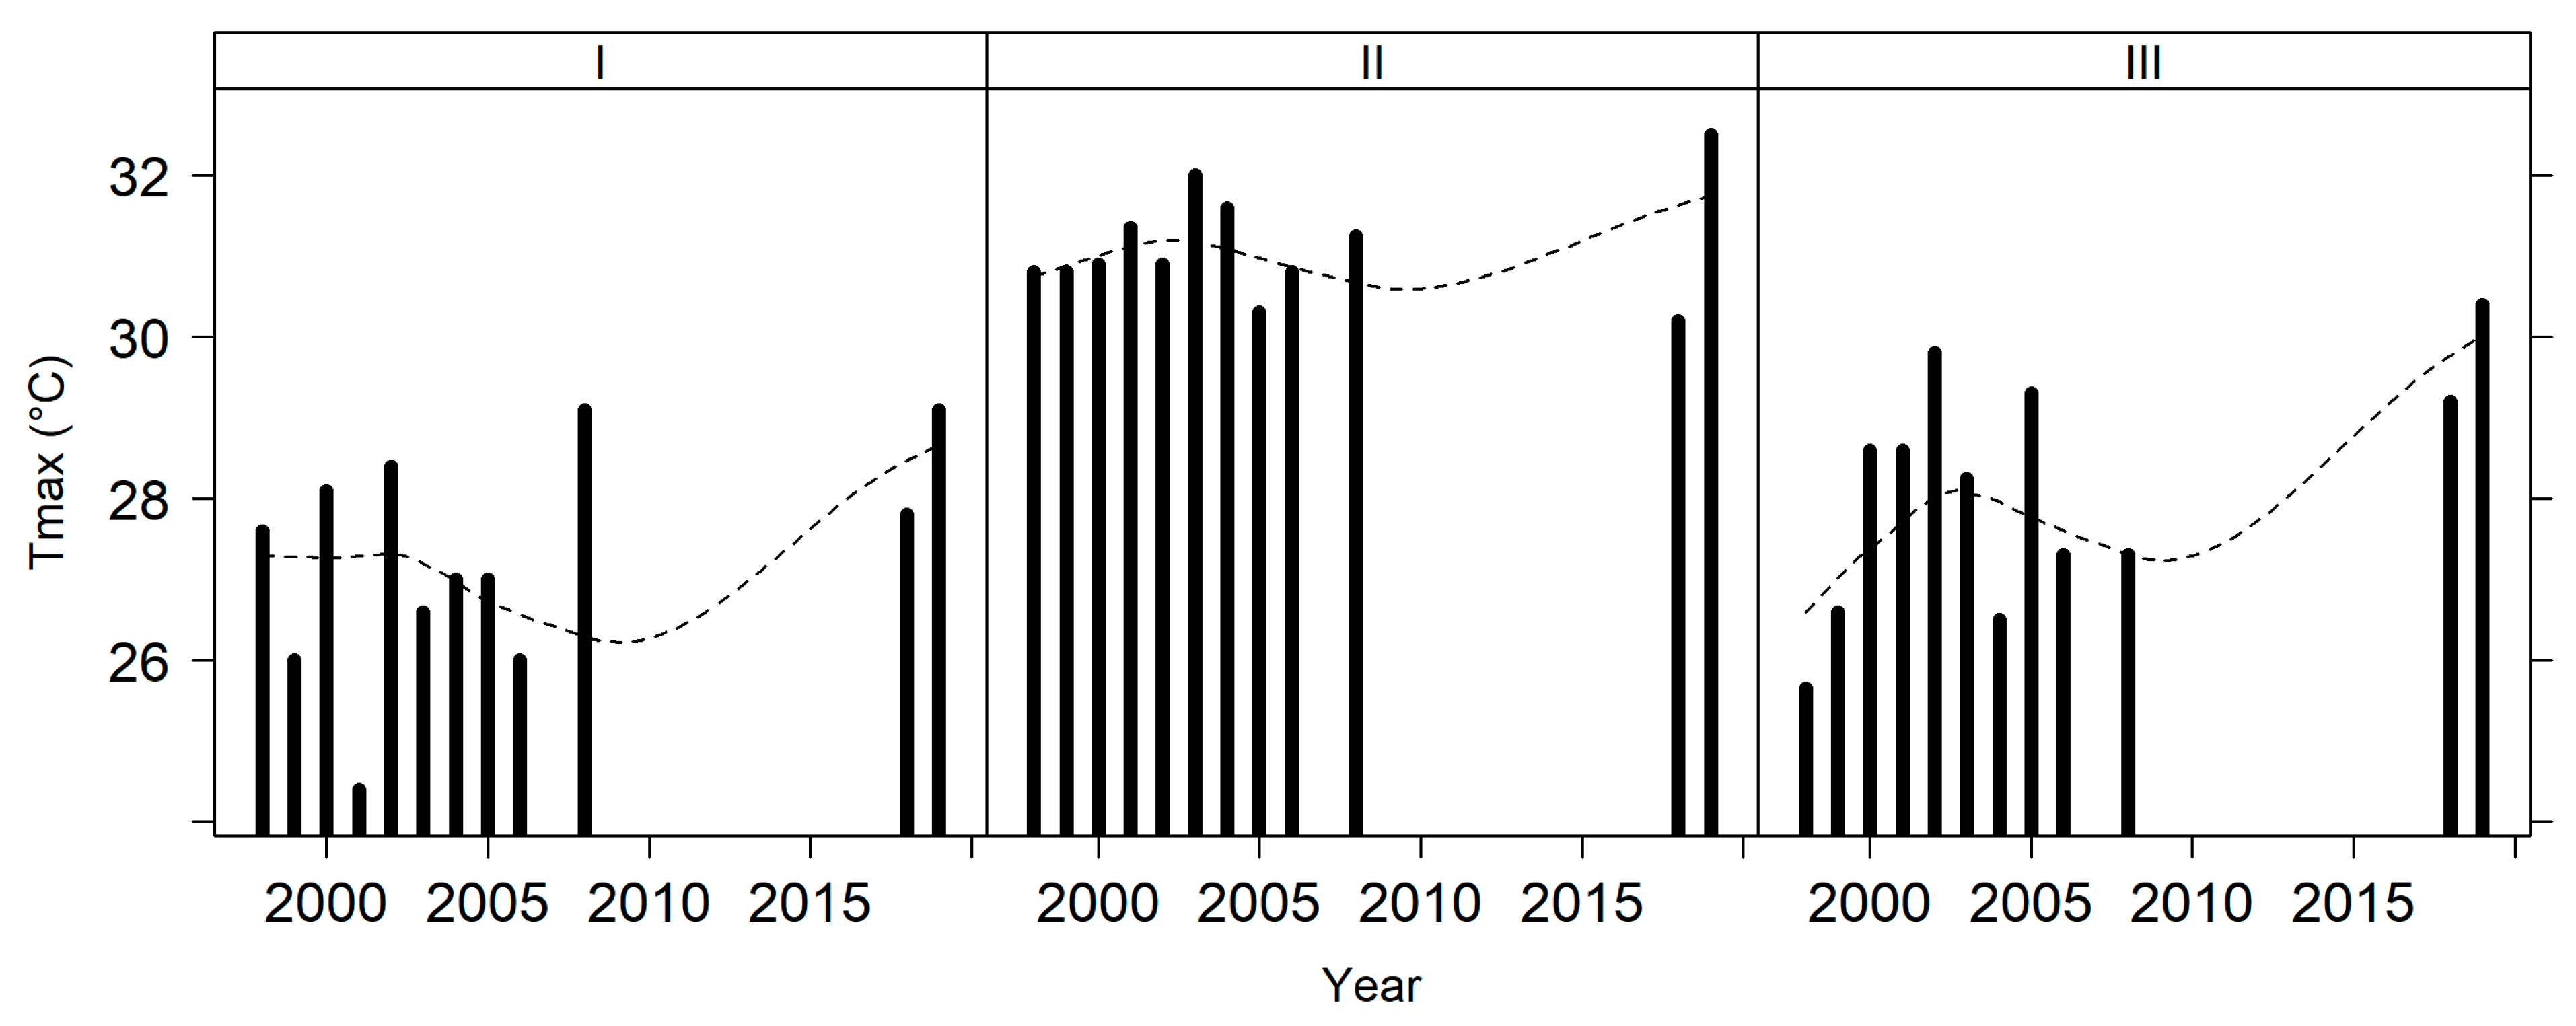
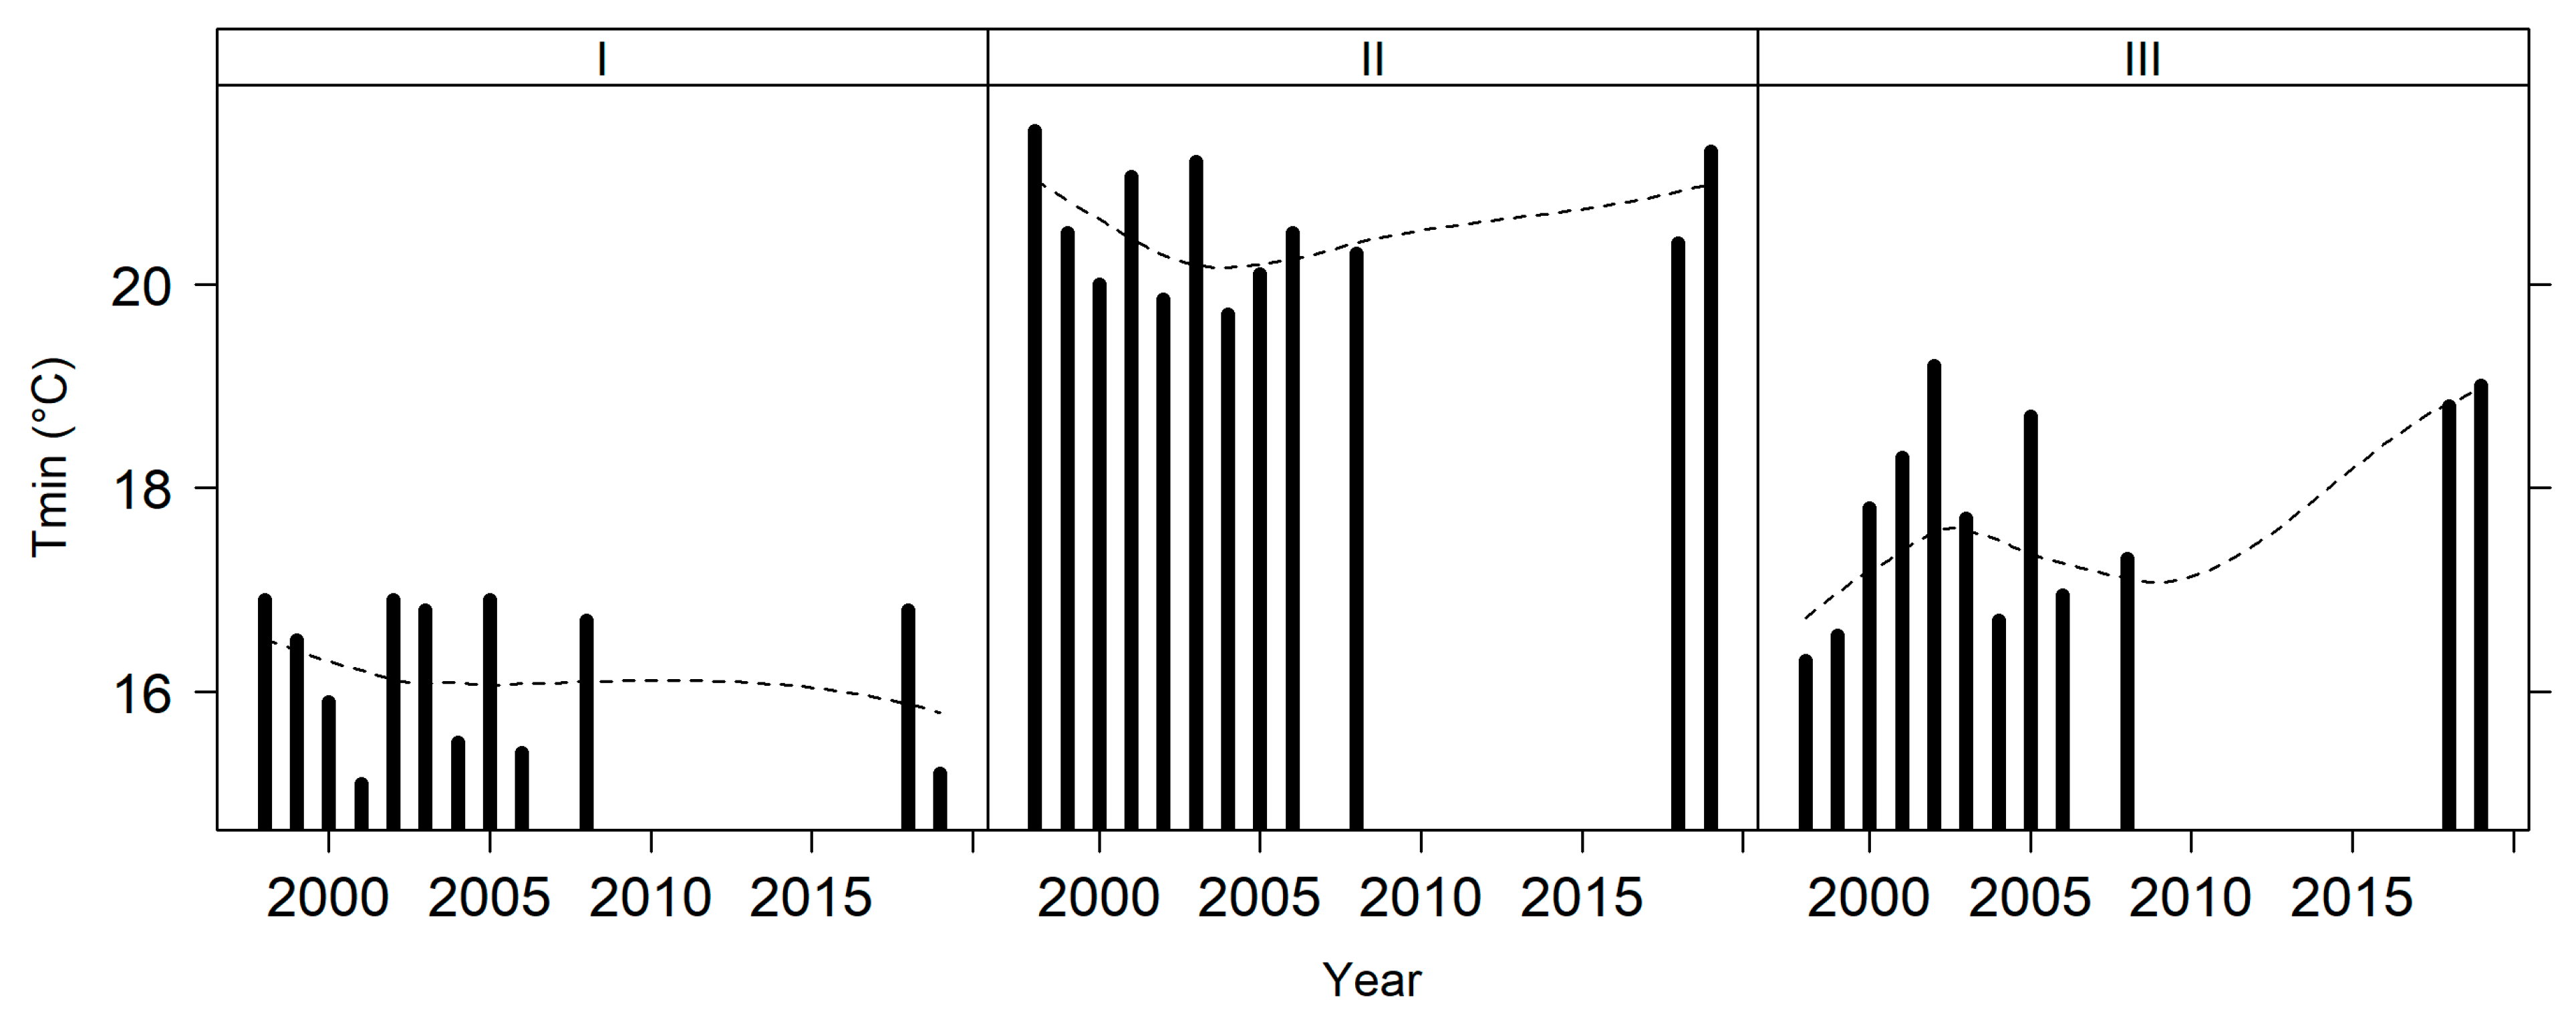
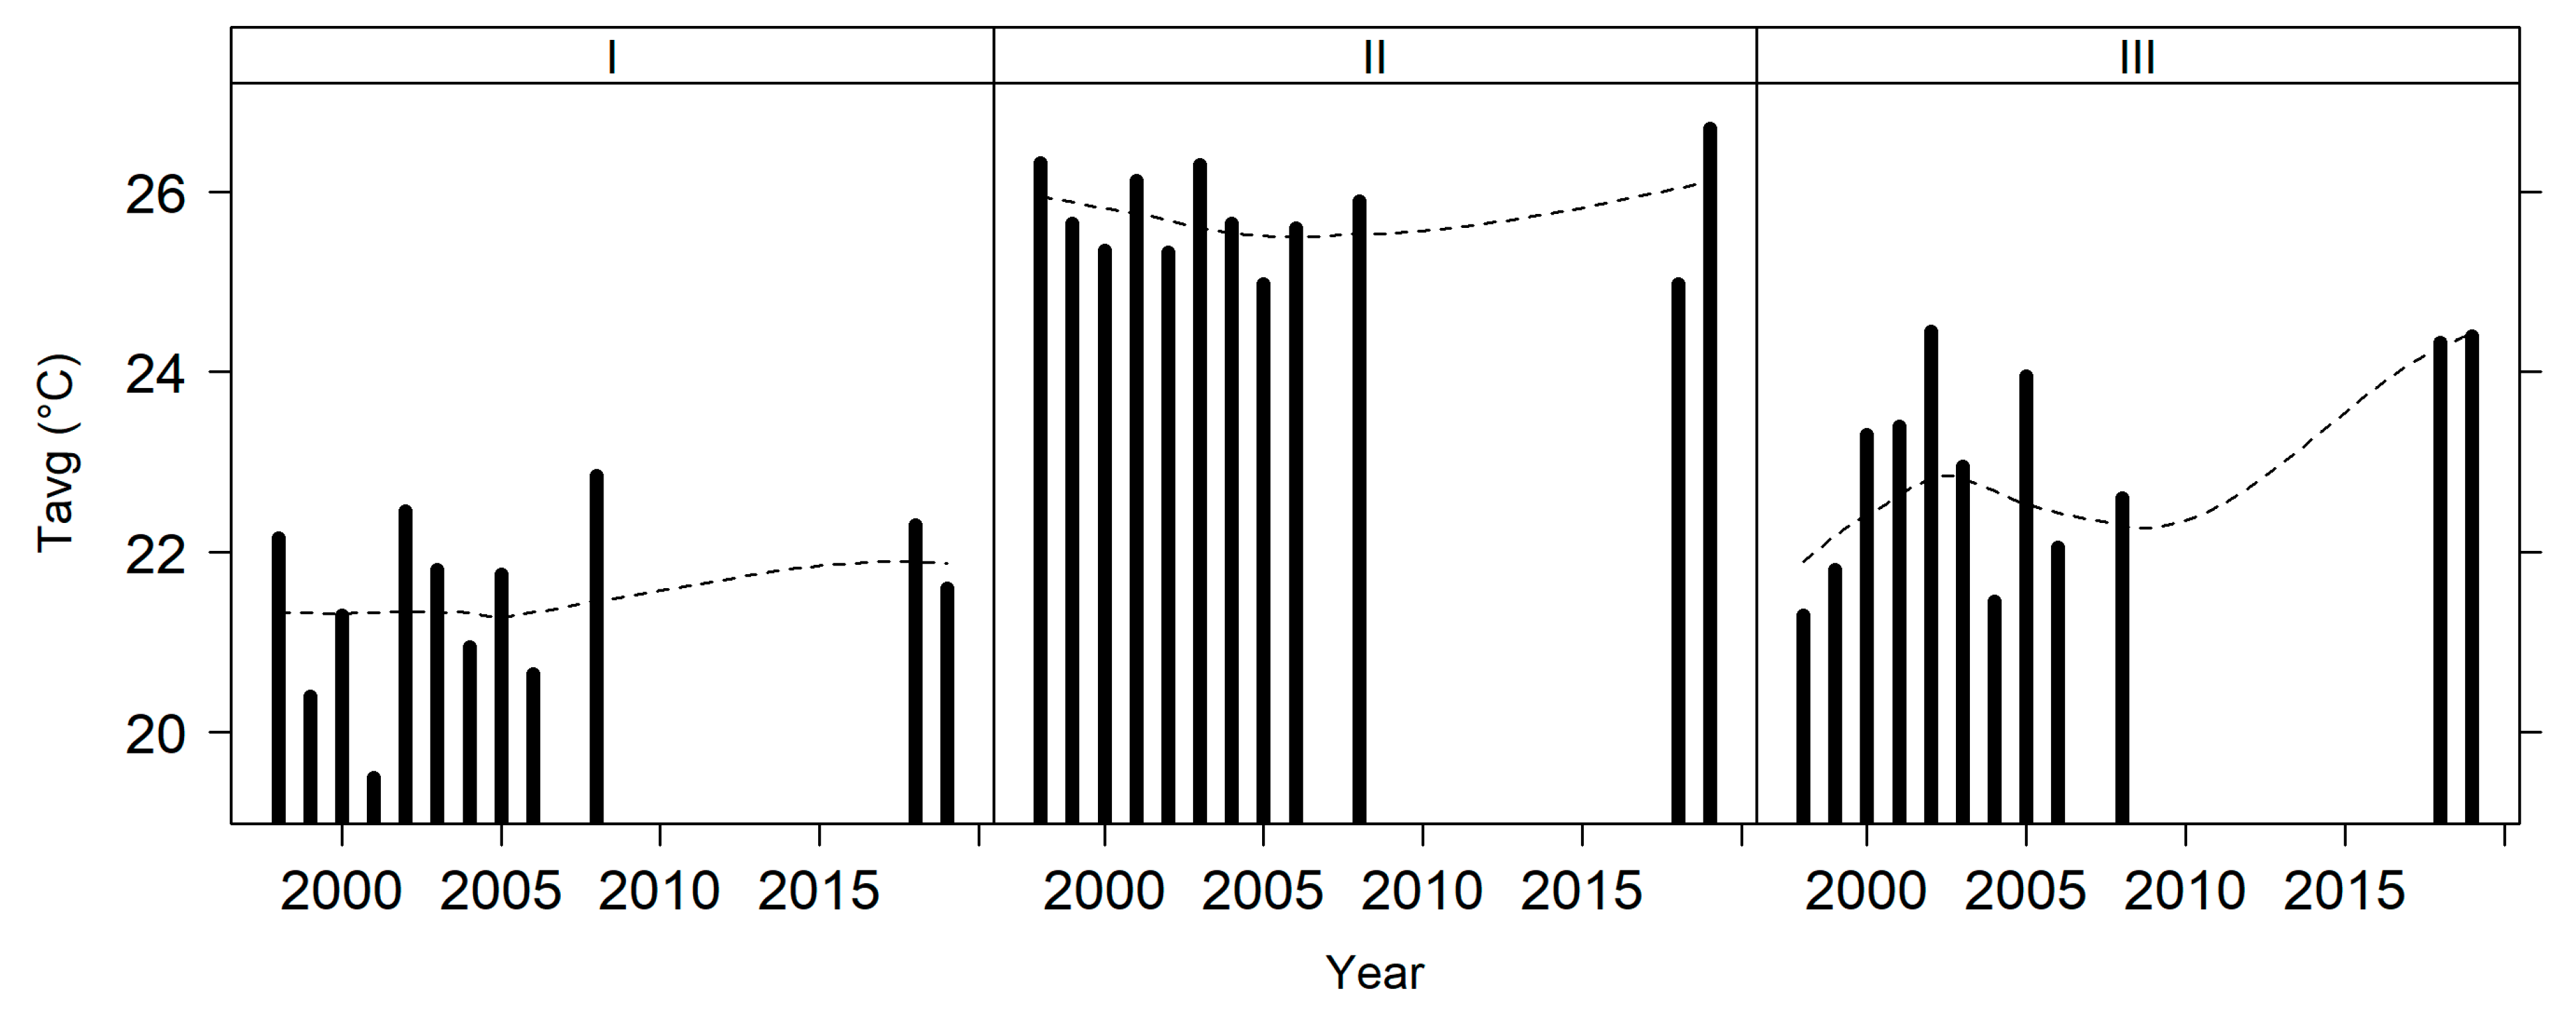
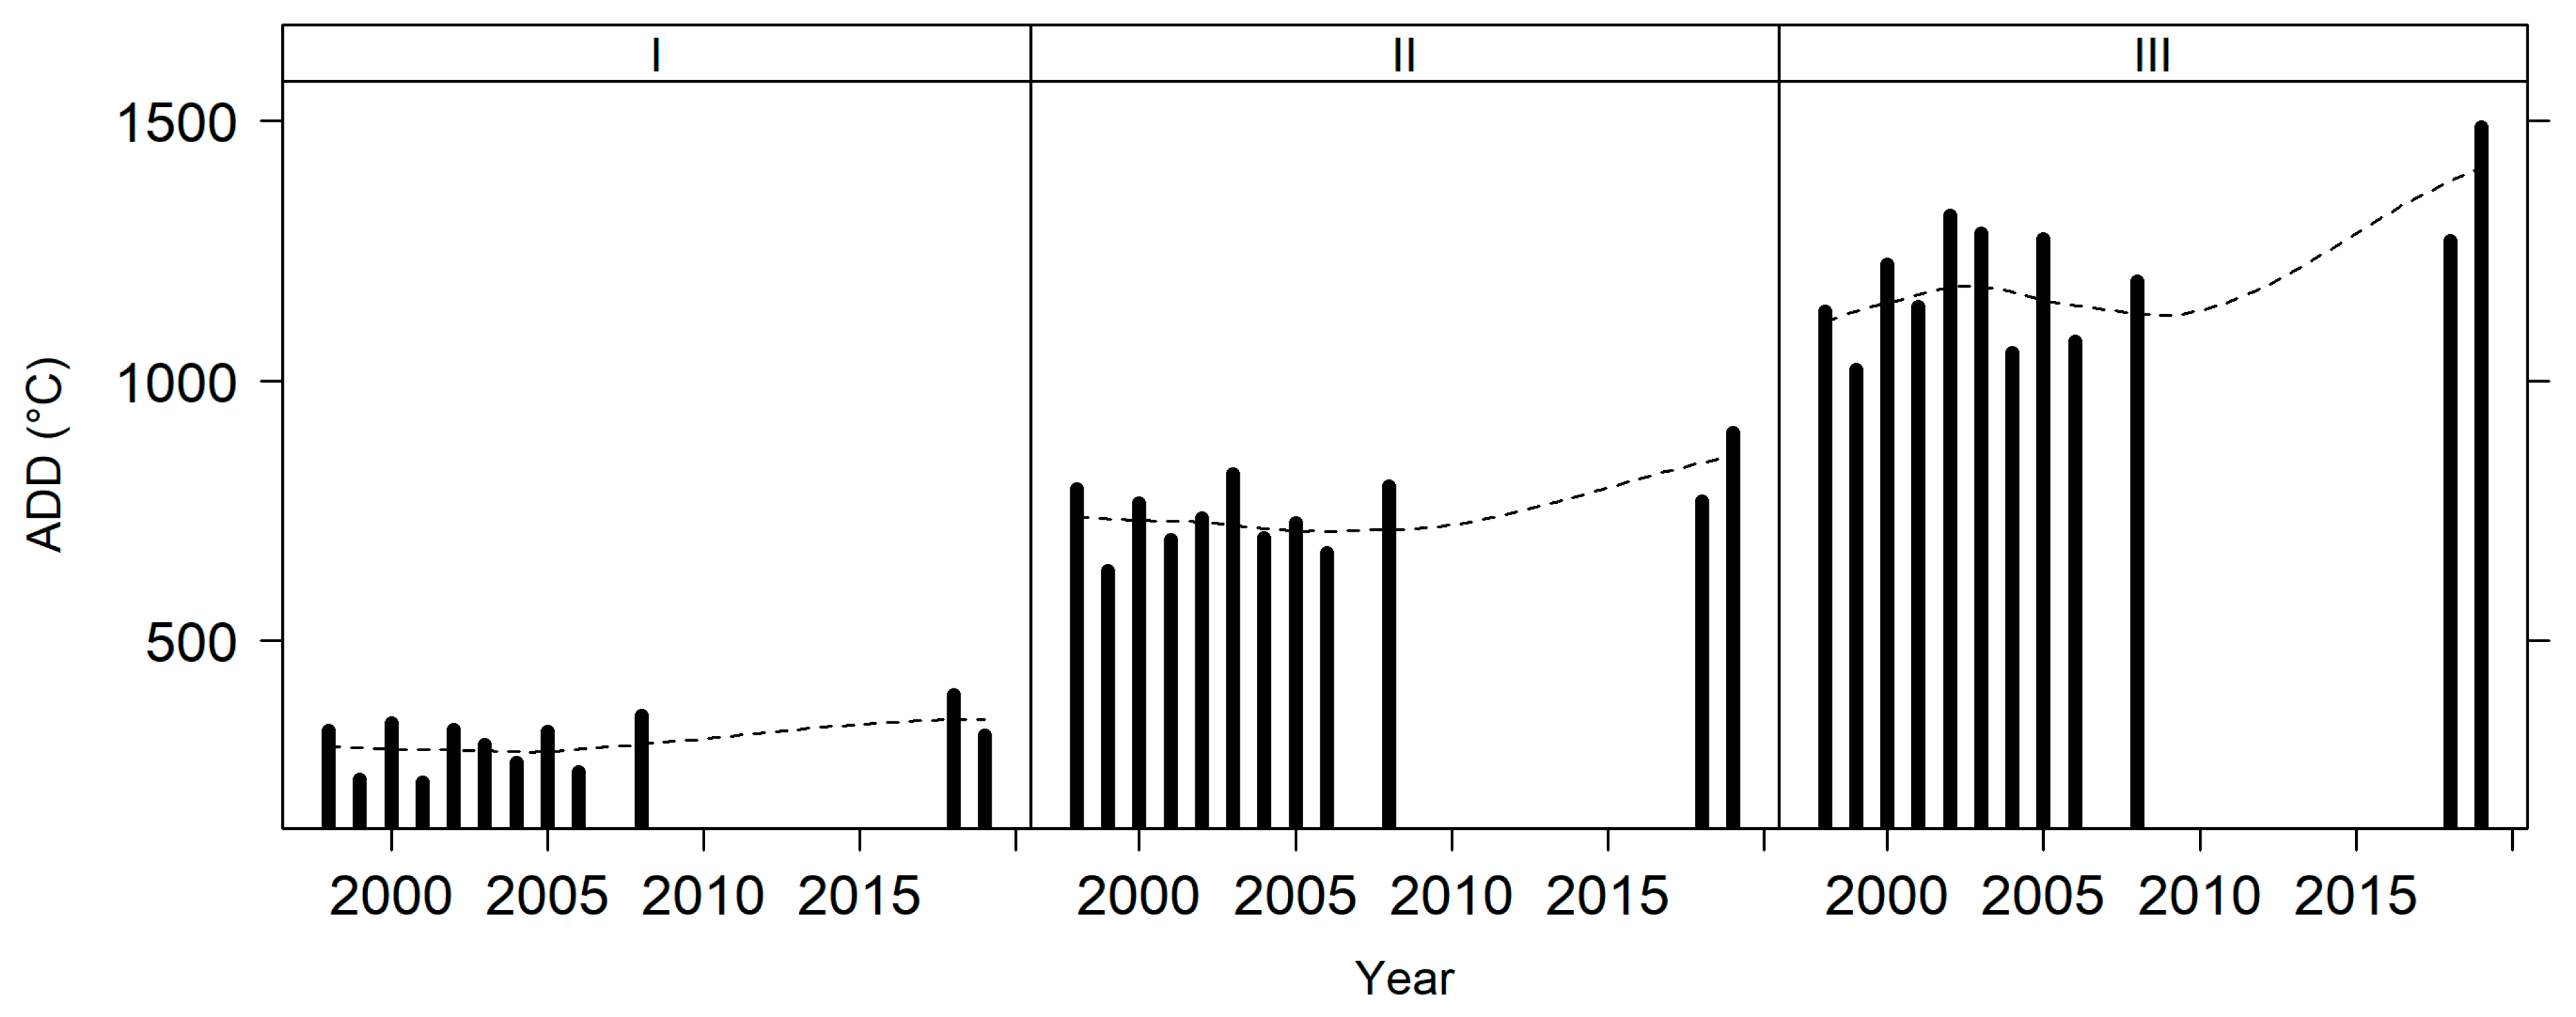
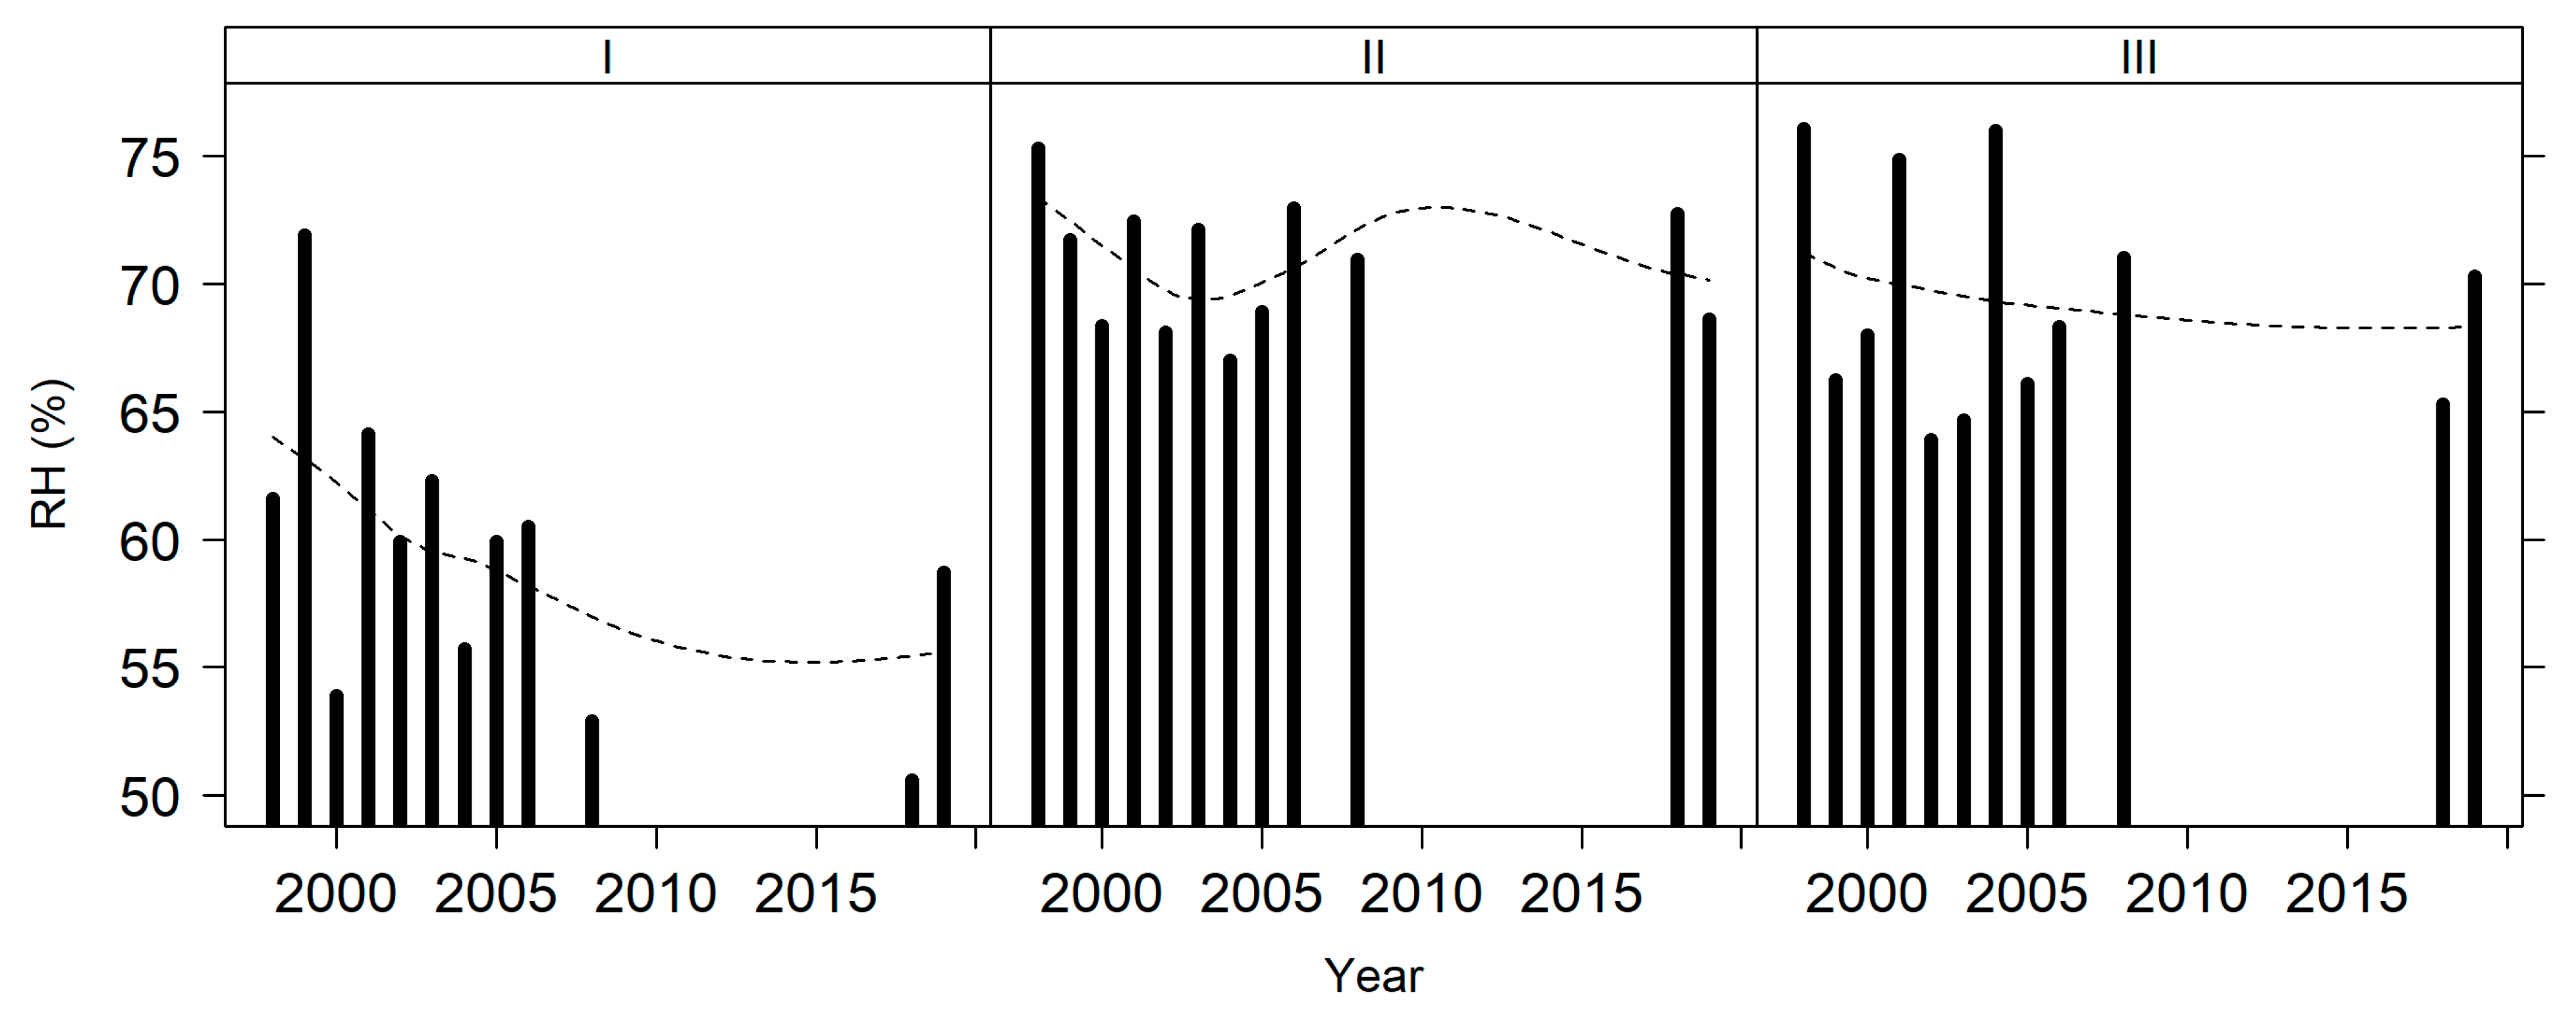
3.1. Agrometerological Data
3.2. Multiple Linear Regressions
4. Discussion
4.1. Application to Previous Sugarcane Modeling
4.2. Sustainable Agricultural Implications
5. Conclusions
Author Contributions
Funding
Institutional Review Board Statement
Informed Consent Statement
Data Availability Statement
Acknowledgments
Conflicts of Interest
Appendix A


References
- CONAB (Companhia Nacional de Abastecimento). Acompanhamento da Safra Brasileira de Cana-de-Açúcar, Safra 2021/22—Segundo Levantamento, Brasília. Available online: https://www.conab.gov.br/info-agro/safras/cana (accessed on 27 April 2021).
- Scarpari, F.V.; van Lier, Q.J.; Corrêa, S.T.R.; Barros, A.H.C.; Marin, F.R.; Nassif, D.S.P. Modelos de crescimento da cana-de-açúcar e sua parametrização—Revisão. Rev. Agric. 2012, 87, 66–80. [Google Scholar] [CrossRef]
- Daros, E.; Oliveria, R.A.; Zambon, J.L.C.; Bespalhok Filho, J.C.; Brasileiro, B.P.; Ido, O.T.; Ruaro, L.; Weber, H. RB036066—A sugarcane cultivar with high adaptability and yield stability to Brazilian South-Central region. Crop Breed. Appl. Biotechnol. 2018, 18, 325–329. [Google Scholar] [CrossRef]
- Manhães, C.M.C.; Garcia, R.F.; Francelino, F.M.A.; Francelino, H.O.; Coelho, F.C. Fatores que afetam a brotação e o perfilhamento da cana-de açúcar. Vértices 2015, 17, 163–181. [Google Scholar] [CrossRef]
- Marin, F.R.; Carvalho, G.L. Spatio-temporal variability of sugarcane yield efficiency in the state of São Paulo, Brazil. Pesqui. Agropecu. Bras. 2012, 47, 149–156. [Google Scholar] [CrossRef]
- Marin, F.R.; Martha, G.B., Jr.; Cassman, K.G.; Grassini, P. Prospects for Increasing Sugarcane and Bioethanol Production on Existing Crop Area in Brazil. BioScience 2016, 66, 307–316. [Google Scholar] [CrossRef] [PubMed]
- Andrade, A.S., Jr.; Noleto, D.H.; Bastos, E.A.; Moura, M.S.B.; Anjos, J.C.R. Demanda hídrica da cana-de-açúcar, por balanço de energia, na microrregião de Teresina, Piauí. Agrometeoro, Passo Fundo 2017, 25, 229–238. [Google Scholar] [CrossRef]
- Araújo, R.M. Influência das Condições Climáticas no Crescimento e Desenvolvimento da Cana-de-Açúcar na Região sul do Brasil. Ph.D. Dissertation, Universidade Federal do Paraná, Setor de Ciências Agrárias, Programa de Pós-Graduação em Agronomia—Produção Vegetal, Curitiba, PR, Brazil, 14 March 2019. [Google Scholar]
- Oliveira, E.C.A.; Freire, F.J.; Oliveira, A.C.; Simões Neto, D.E.; Rocha, A.T.; Carvalho, L.A. Produtividade, eficiência de uso da água e qualidade tecnológica de cana-de-açúcar submetida a diferentes regimes hídricos. Pesqui. Agropecu. Bras. 2011, 46, 617–625. [Google Scholar] [CrossRef]
- Dias, H.B.; Inman-Bamber, G.; Bermejo, R.; Sentelhas, P.C.; Christodoulou, D. New APSIM-Sugar features and parameters required to account for high sugarcane yields in tropical environments. Field Crops Res. 2019, 235, 38–53. [Google Scholar] [CrossRef]
- Marcari, M.A.; Rolim, G.S.; Aparecido, L.E.O. Agrometeorological models for forecasting yield and quality of sugarcane. Aust. J. Crop Sci. 2015, 9, 1049–1056. [Google Scholar]
- Scarpari, M.S. Modelos Para a Previsão da Produtividade da Cana-de-Açúcar (Saccharum spp.) Através de Parâmetros Climáticos. Master’s Thesis, Escola Superior de Agricultura “Luiz de Queiroz”, Universidade de São Paulo, Piracicaba, SP, Brazil, 13 September 2002. [Google Scholar]
- Andretta, R.L. Influência de Variáveis Climáticas, da Água Disponível no solo, e dos Eventos El Niño e La Niña na Produtividade da Cana-de-Açúcar no Estado do Paraná. Master’s Thesis, Universidade Federal do Paraná, Setor de Ciências Agrárias, Programa de Pós-Graduação em Agronomia—Produção Vegetal, Curitiba, PR, Brazil, 29 February 2012. [Google Scholar]
- Berton, G.S.; Oliveira, R.A.; Daros, E.; Zambon, J.L.C.; Bespalhok Filho, J.C.; Brasileiro, B.P.; Ido, O.T.; Ruaro, L.; Weber, H. RB036091—An early-maturing sugarcane cultivar for the Central South of Brazil. Crop Breed. Appl. Biotechnol. 2020, 20, e28852029. [Google Scholar] [CrossRef]
- Borella, J.; Trautenmüller, J.W.; Brasileiro, B.P.; Oliveira, R.A.; Bespalhok Filho, J.C. Logistic model to selection of energy cane clones. Cien. Rural. 2020, 50, e20190750. [Google Scholar] [CrossRef]
- Nitsche, P.R.; Caramori, P.H.; Ricce, W.S.; Pinto, L.F.D. Atlas Climático do Estado do Paraná; Instituto Agronómico do Paraná: Londrina, PR, Brazil, 2019; pp. 1–216. ISBN 978-85-88184-58-3. [Google Scholar]
- Instituto de Desenvolvimento Rural do Paraná (IDR-Paraná)—IAPAR-EMATER. Available online: https://www.idrparana.pr.gov.br/ (accessed on 31 January 2023).
- Aquino, G.S.; Medina, C.C.; Silvestre, D.A.; Gomes, E.C.; Cunha, A.C.B.; Kussaba, D.A.O.; Almeida, L.F.; Shahab, M.; Santiago, A.D. Straw removal of sugarcane from soil and its impacts on yield and industrial quality ratoons. Sci. Agric. 2018, 75, 526–529. [Google Scholar] [CrossRef]
- Rede Interuniversitária Para o Desenvolvimento do Setor Sucroenergético (RIDESA). Available online: https://www.ridesa.com.br/ (accessed on 31 January 2023).
- Gurski, B.C.; Souza, J.L.M.; Gerstemberg, E.; Oliveira, R.A. Water requirements and restrictions to sugarcane in cane plants and ratoon cane cycles in Southern Brazil. Acta Agron. 2020, 69, 135–143. [Google Scholar] [CrossRef]
- Simunek, J.; Sejna, M.; Saiato, H.; Sakai, M.; van Genuchten, M.T. The HYDRUS-1D Software Package for Simulating the One-Dimensional Movement of Water, Heat, and Multiple Solutes in Variably-Saturated Media: Version 4.08; University of California Riverside: Riverside, CA, USA, 2009; pp. 1–330. [Google Scholar]
- Van Genuchten, M.T. A closed-form equation for predicting the hydraulic conductivity of unsaturated soils. Soil Sci. Soc. Am. J. 1980, 44, 892–898. [Google Scholar] [CrossRef]
- Allen, R.G.; Pereira, L.S.; Raes, D.; Smith, M. Crop Evapotranspiration: Guidelines for Computing Crop Water Requirements; Irrigation and Drainage Paper, 56; Food and Agriculture Organization of the United Nations: Rome, Italy, 1998; pp. 1–297. ISBN 92-5-104219-5. [Google Scholar]
- Villa Nova, N.A.; Pedro, M.J., Jr.; Pereira, A.R.; Ometto, J.C. Estimativa de graus-dia acumulados acima de qualquer temperatura base em função das temperaturas máxima e mínima. Ciênc. Terra 1972, 30, 1–8. [Google Scholar]
- R Core Team. R: A language and environment for statistical computing. R Foundation for Statistical Computing, Vienna, Austria. 2020. Available online: https://www.R-project.org/ (accessed on 3 January 2021).
- Mangiafico, S.S. Summary and Analysis of Extension Program Evaluation in R, Version 1.18.1. 2016. Available online: https://rcompanion.org/handbook/ (accessed on 10 January 2021).
- James, G.; Witten, D.; Hastie, T.; Tibshirani, R. An Introduction to Statistical Learning: With Applications in R, 2nd ed.; Springer: Cham, Switzerland, 2014; Available online: https://www.statlearning.com/ (accessed on 2 January 2022).
- Lumley, T. Leaps: Regression Subset Selection. R Package Version 3.1, Based on Fortran Code by Miller, A. 2020. Available online: https://CRAN.R-project.org/package=leaps (accessed on 5 February 2021).
- Kuhn, M. Classification and Regression Training [R Package Caret Version 6.0-90]. 2021. Available online: https://CRAN.R-project.org/package=caret (accessed on 5 February 2021).
- Abreu, M.L.; Silva, M.A.; Teodoro, I.; Holanda, L.A.; Sampaio Neto, G.D. Crescimento e produtividade de cana-de-açúcar em função da disponibilidade hídrica dos Tabuleiros Costeiros de Alagoas. Bragantia. Premissas Campinas 2013, 72, 262–270. [Google Scholar] [CrossRef]
- Daros, E.; Oliveira, R.A.; Barbosa, G.V.S. 45 Anos de Variedades RB de Cana-de-Açúcar: 25 Anos de Ridesa, 1st ed.; Curitiba: Graciosa, Portugal, 2015; pp. 1–156. [Google Scholar]
- Inman-Bamber, N.G. Sugarcane water stress criteria for irrigation and drying off. Field Crops Res. 2004, 89, 107–122. [Google Scholar] [CrossRef]
- Trentin, R.; Zolnier, S.; Ribeiro, A.; Steidle Neto, A.J. Transpiração e temperatura foliar da cana-de-açúcar sob diferentes valores de potencial matricial. Eng. Agrícola Jaboticabal 2011, 31, 1085–1095. [Google Scholar] [CrossRef]
- Marin, F.R.; Jones, J.W. Process-based simple model for simulating sugarcane growth and production. Sci. Agric. 2014, 71, 1–16. [Google Scholar] [CrossRef]
- Batista, E.L.S.; Zolnier, S.; Ribeiro, A.; Lyra, G.B.; Silva, T.G.F.; Boehringer, D. Modelagem do crescimento de cultivares de cana-de-açúcar no período de formação da cultura. Rev. Bras. Eng. Agrícola Ambient. 2013, 17, 1080–1087. [Google Scholar] [CrossRef]
- Holanda, L.A.; Santos, C.M.; Sampaio Neto, G.D.; Sousa, A.P.; Silva, M.A. Variáveis morfológicas da cana-de-açúcar em função do regime hídrico durante o desenvolvimento inicial. Irriga. Botucatu 2014, 19, 573–584. [Google Scholar] [CrossRef][Green Version]
- Ferreira, R.A., Jr.; Souza, J.L.; Lyra, G.B.; Teodoro, I.; Santos, M.A.; Porfirio, A.C.S. Crescimento e fotossíntese de cana-de-açúcar em função de variáveis biométricas e meteorológicas. Rev. Bras. Eng. Agrícola Ambient. 2012, 16, 1229–1236. [Google Scholar] [CrossRef]
- Cardozo, N.P.; Sentelhas, P.C. Climatic effects on sugarcane ripening under the influence of cultivars and crop age. Sci. Agric. 2013, 70, 449–456. [Google Scholar] [CrossRef]
- Scarpari, M.S.; Beauclair, E.G.F. Sugarcane maturity estimation through edaphic-climatic parameters. Sci. Agric. 2004, 61, 486–491. [Google Scholar] [CrossRef]
- Scarpari, M.S.; Beauclair, E.G.F. Physiological model to estimate the maturity of sugarcane. Sci. Agric. 2009, 66, 622–628. [Google Scholar] [CrossRef]
- Marin, F.R.; Jones, J.W.; Singels, A.; Royce, F.; Assad, E.D.; Pellegrino, G.Q.; Justino, F. Climate change impacts on sugarcane attainable yield in southern Brazil. Clim. Chang. 2013, 117, 227–239. [Google Scholar] [CrossRef]
- Jones, M.R.; Singels, A.; Chinorumba, S.; Patton, A.; Poser, C.; Singh, M.; Martiné, J.F.; Christina, M.; Shine, J.; Annandale, J.; et al. Exploring process-level genotypic and environmental effects on sugarcane yield using an international experimental dataset. Field Crops Res. 2019, 244, 107622. [Google Scholar] [CrossRef]
- Inman-Bamber, N.G.; McGlinchey, M.G. Crop coefficients and water-use estimates for sugarcane based on long-term Bowen ration energy balance measurements. Field Crops Res. 2003, 83, 125–138. [Google Scholar] [CrossRef]
- Dias, H.B.; Sentelhas, P.C.; Inman-Bamber, G.; Everingham, Y. Sugarcane yield future scenarios in Brazil as projected by the APSIM-Sugar model. Ind. Crops Prod. 2021, 171, 113918. [Google Scholar] [CrossRef]
- Inman-Bamber, N.G.; Jackson, P.A.; Stokes, C.J.; Verrall, S.; Lakshmanan, P.; Basnayake, J. Sugarcane for water-limited environments: Enhanced capability of the APSIM sugarcane model for assessing traits for transpiration efficiency and root water supply. Field Crops Res. 2016, 196, 112–123. [Google Scholar] [CrossRef]
- Leal, M.R.L.V.; Duft, D.G.; Hernandes, T.A.D.; Bordonal, R.O. Brazilian Sugarcane Expansion and Deforestation. In Proceedings of the 25th European Biomass Conference and Exhibition, Stockholm, Sweden, 12–15 June 2017; pp. 1476–1483. [Google Scholar] [CrossRef]
- Hernandes, T.A.D.; de Oliveira Bordonal, R.; Duft, D.G.; Leal, M.R.L.V. Implications of regional agricultural land use dynamics and deforestation associated with sugarcane expansion for soil carbon stocks in Brazil. Reg. Environ. Chang. 2022, 22, 49. [Google Scholar] [CrossRef]
- Follador, M.; Soares-Filho, B.S.; Philippidis, G.; Davis, J.L.; de Oliveira, A.R.; Rajão, R. Brazil’s sugarcane embitters the EU-Mercosur trade talks. Sci. Rep. 2021, 11, 13768. [Google Scholar] [CrossRef] [PubMed]
- Viana, J.L.; de Souza, J.L.M.; Auler, A.C.; de Oliveira, R.A.; Araújo, R.M.; Hoshide, A.K.; de Abreu, D.C.; da Silva, W.M. Water Dynamics and Hydraulic Functions in Sandy Soils: Limitations to Sugarcane Cultivation in Southern Brazil. Sustainability 2023, submitted.
- Parahyba, R.B.V.; Araújo, M.S.B.; Almeida, B.G.; Rolim Neto, F.C.; Sampaio, E.V.S.B.; Caldas, A.M. Water retention capacity in Arenosols and Ferralsols in a semiarid area in the state of Bahia, Brazil. An. Acad. Bras. Ciênc. 2019, 91, e20181031. [Google Scholar] [CrossRef] [PubMed]
- Viana, J.L. Atributos Físico-Hídricos do Solo, Modelagem do Desenvolvimento Radicu-Lar e Rendimento da Cana-de-Açúcar nas Condições Edafoclimáticas da Região Noroeste do Paraná. Ph.D. Thesis, Universidade Federal do Paraná, Setor de Ciências Agrárias, Programa de Pós-Graduação Ciência do Solo, Curitiba, PR, Brazil, 22 February 2022. [Google Scholar]
- Rawls, W.J.; Pachepsky, Y.A.; Ritchie, J.C.; Sobecki, T.M.; Bloodworth, H. Effect of soil organic carbon on soil water retention. Geoderma 2003, 116, 61–76. [Google Scholar] [CrossRef]
- Auler, A.C.; Romaniw, J.; Sá, J.C.M.; Pires, L.F.; Hartman, D.C.; Inagaki, T.M.; Rosa, J.A. Improvement on soil structure and water retention after application of industrial organic waste as a crop fertilizer. J. Soils Sediments 2020, 20, 2771–2783. [Google Scholar] [CrossRef]
- Fidalski, J.; Tormena, C.A.; Alves, S.J.; Auler, P.A.M. Influência das frações de areia na retenção e disponibilidade de água em solos das Formações Caiuá e Paranavaí. Rev. Bras. Ciência Solo 2013, 37, 613–621. [Google Scholar] [CrossRef]
- De Oliveira Bordonal, R.; Carvalho, J.L.N.; Lal, R.; de Figueiredo, E.B.; de Oliveira, B.G.; La Scala, N., Jr. Sustainability of sugarcane production in Brazil. A review. Agron. Sustain. Dev. 2018, 38, 13. [Google Scholar] [CrossRef]
- Cherubin, M.R.; Bordonal, R.O.; Castioni, G.A.; Guimarães, E.M.; Lisboa, I.P.; Moraes, L.A.A.; Menandro, L.M.S.; Tenelli, S.; Cerri, C.E.P.; Karlen, D.L.; et al. Soil health response to sugarcane straw removal in Brazil. Ind. Crops Prod. 2021, 163, 113315. [Google Scholar] [CrossRef]
- Aquino, G.S.; Medina, C.C.; Porteira, A.L., Jr.; Santos, L.O.; Cunha, A.C.B.; Kussaba, D.A.O.; Santos, J.H., Jr.; Almeida, L.F.; Santiago, A.D. Sistema Radicular e Pro-Dutividade de Soqueiras de Cana de Açúcar sob Diferentes Quantidades de palhada. Pesqui. Agropecu. Bras. 2015, 50, 1150–1159. Available online: https://seer.sct.embrapa.br/index.php/pab/article/view/21795 (accessed on 25 January 2023). [CrossRef]
- Gallo, B.C.; Magalhães, P.S.G.; Demattê, J.A.M.; Cervi, W.R.; Carvalho, J.L.N.; Barbosa, L.C.; Belinasso, H.; de Mello, D.C.; Veloso, G.V.; Alves, M.R.; et al. Soil Erosion Satellite-Based Estimation in Cropland for Soil Conservation. Remote Sens. 2023, 15, 20. [Google Scholar] [CrossRef]
- Ambrosano, E.J.; Cantarella, H.; Ambrosano, G.M.B.; Schammas, E.A.; Dias, F.L.F.; Rossi, F.; Trivelin, P.C.O.; Muraoka, T.; Azcón, R. Produtividade da cana-de-açúcar após o cultivo de leguminosas. Bragantia 2011, 70, 810–818. [Google Scholar] [CrossRef]
- Souza, G.S.; Souza, Z.M.; Silva, R.B.; Barbosa, R.S.; Araújo, F.S. Effects of traffic control on the soil physical quality and the cultivation of sugarcane. Rev. Bras. Cienc. Solo 2014, 38, 135–146. [Google Scholar] [CrossRef]
- Da Cunha Souza, M.; de Oliveira, F.P.; Silva, J.R.; Martins, A.F.; da Silva, P.L.F. Spatial Variability of Resistance to Penetration in Soil Under Sugarcane Crops with Different Harvest Methods. Rev. Caatinga 2020, 33, 480–489. [Google Scholar] [CrossRef]
- Duden, A.S.; Verweij, P.A.; Kraak, Y.V.; van Beek, L.P.H.; Wanders, N.; Karssenberg, D.J.; Sutanudjaja, E.H.; van der Hilst, F. Hydrological impact of ethanol-driven sugarcane expansion in Brazil. J. Environ. Manag. 2021, 282, 111942. [Google Scholar] [CrossRef] [PubMed]
- Perillo, L.I.; de Oliveira Bordonal, R.; de Figueiredo, E.B.; Moitinho, M.R.; Aguiar, D.A.; Rudorff, B.F.T.; Panosso, A.R.; La Scala, N., Jr. Avoiding burning practice and its consequences on the greenhouse gas emission in sugarcane areas southern Brazil. Environ. Sci. Pollut. Res. 2022, 29, 719–730. [Google Scholar] [CrossRef]
- Patino, M.T.O.; de Amorim, F.R.; de Andrade, A.G.; Alam, M.J.; Solfa, F.D.G. Costs of Agronomic Practices: Profitability at Different Scales of Sugarcane Production in Brazil. Int. J. Bus. Adm. 2022, 13, 32–43. [Google Scholar] [CrossRef]
- Ruan, H.; Feng, P.; Wang, B.; Xing, H.; O’Leary, G.J.; Huang, Z.; Guo, H.; Liu, D.L. Future climate change projects positive impacts on sugarcane productivity in southern China. Eur. J. Agron. 2018, 96, 108–119. [Google Scholar] [CrossRef]
- World Population Review. Sugar Producing Counties 2023. Available online: https://worldpopulationreview.com/country-rankings/sugar-producing-countries (accessed on 2 February 2023).


| Cultivar’s Observed Sugarcane Yield (t/ha) | |||||
|---|---|---|---|---|---|
| Year | RB72454 | RB867515 | RB966928 | RB036066 | Average |
| 1998 | 130.604 | - | - | - | 130.604 |
| 1999 | 130.163 | - | - | - | 130.163 |
| 2000 | 98.988 | - | - | - | 98.988 |
| 2001 | 140.830 | - | - | - | 140.830 |
| 2002 | 127.940 | - | - | - | 127.940 |
| 2003 | 115.794 | - | - | - | 115.794 |
| 2004 | 141.600 | 99.304 | 113.417 | - | 118.107 |
| 2005 | 65.997 | 98.910 | 107.333 | - | 90.747 |
| 2006 | 164.190 | 134.173 | - | - | 149.182 |
| 2008 | 67.917 | - | - | - | 67.917 |
| 2018 | - | 80.715 | 152.570 | 101.533 | 111.606 |
| 2019 | - | 91.468 | 105.792 | 85.608 | 94.289 |
| Coefficient 1 | Estimated | Standardized Estimated | Error 2 | t 3 | Pr(>|t|) 4 | R2ajust. 5 |
|---|---|---|---|---|---|---|
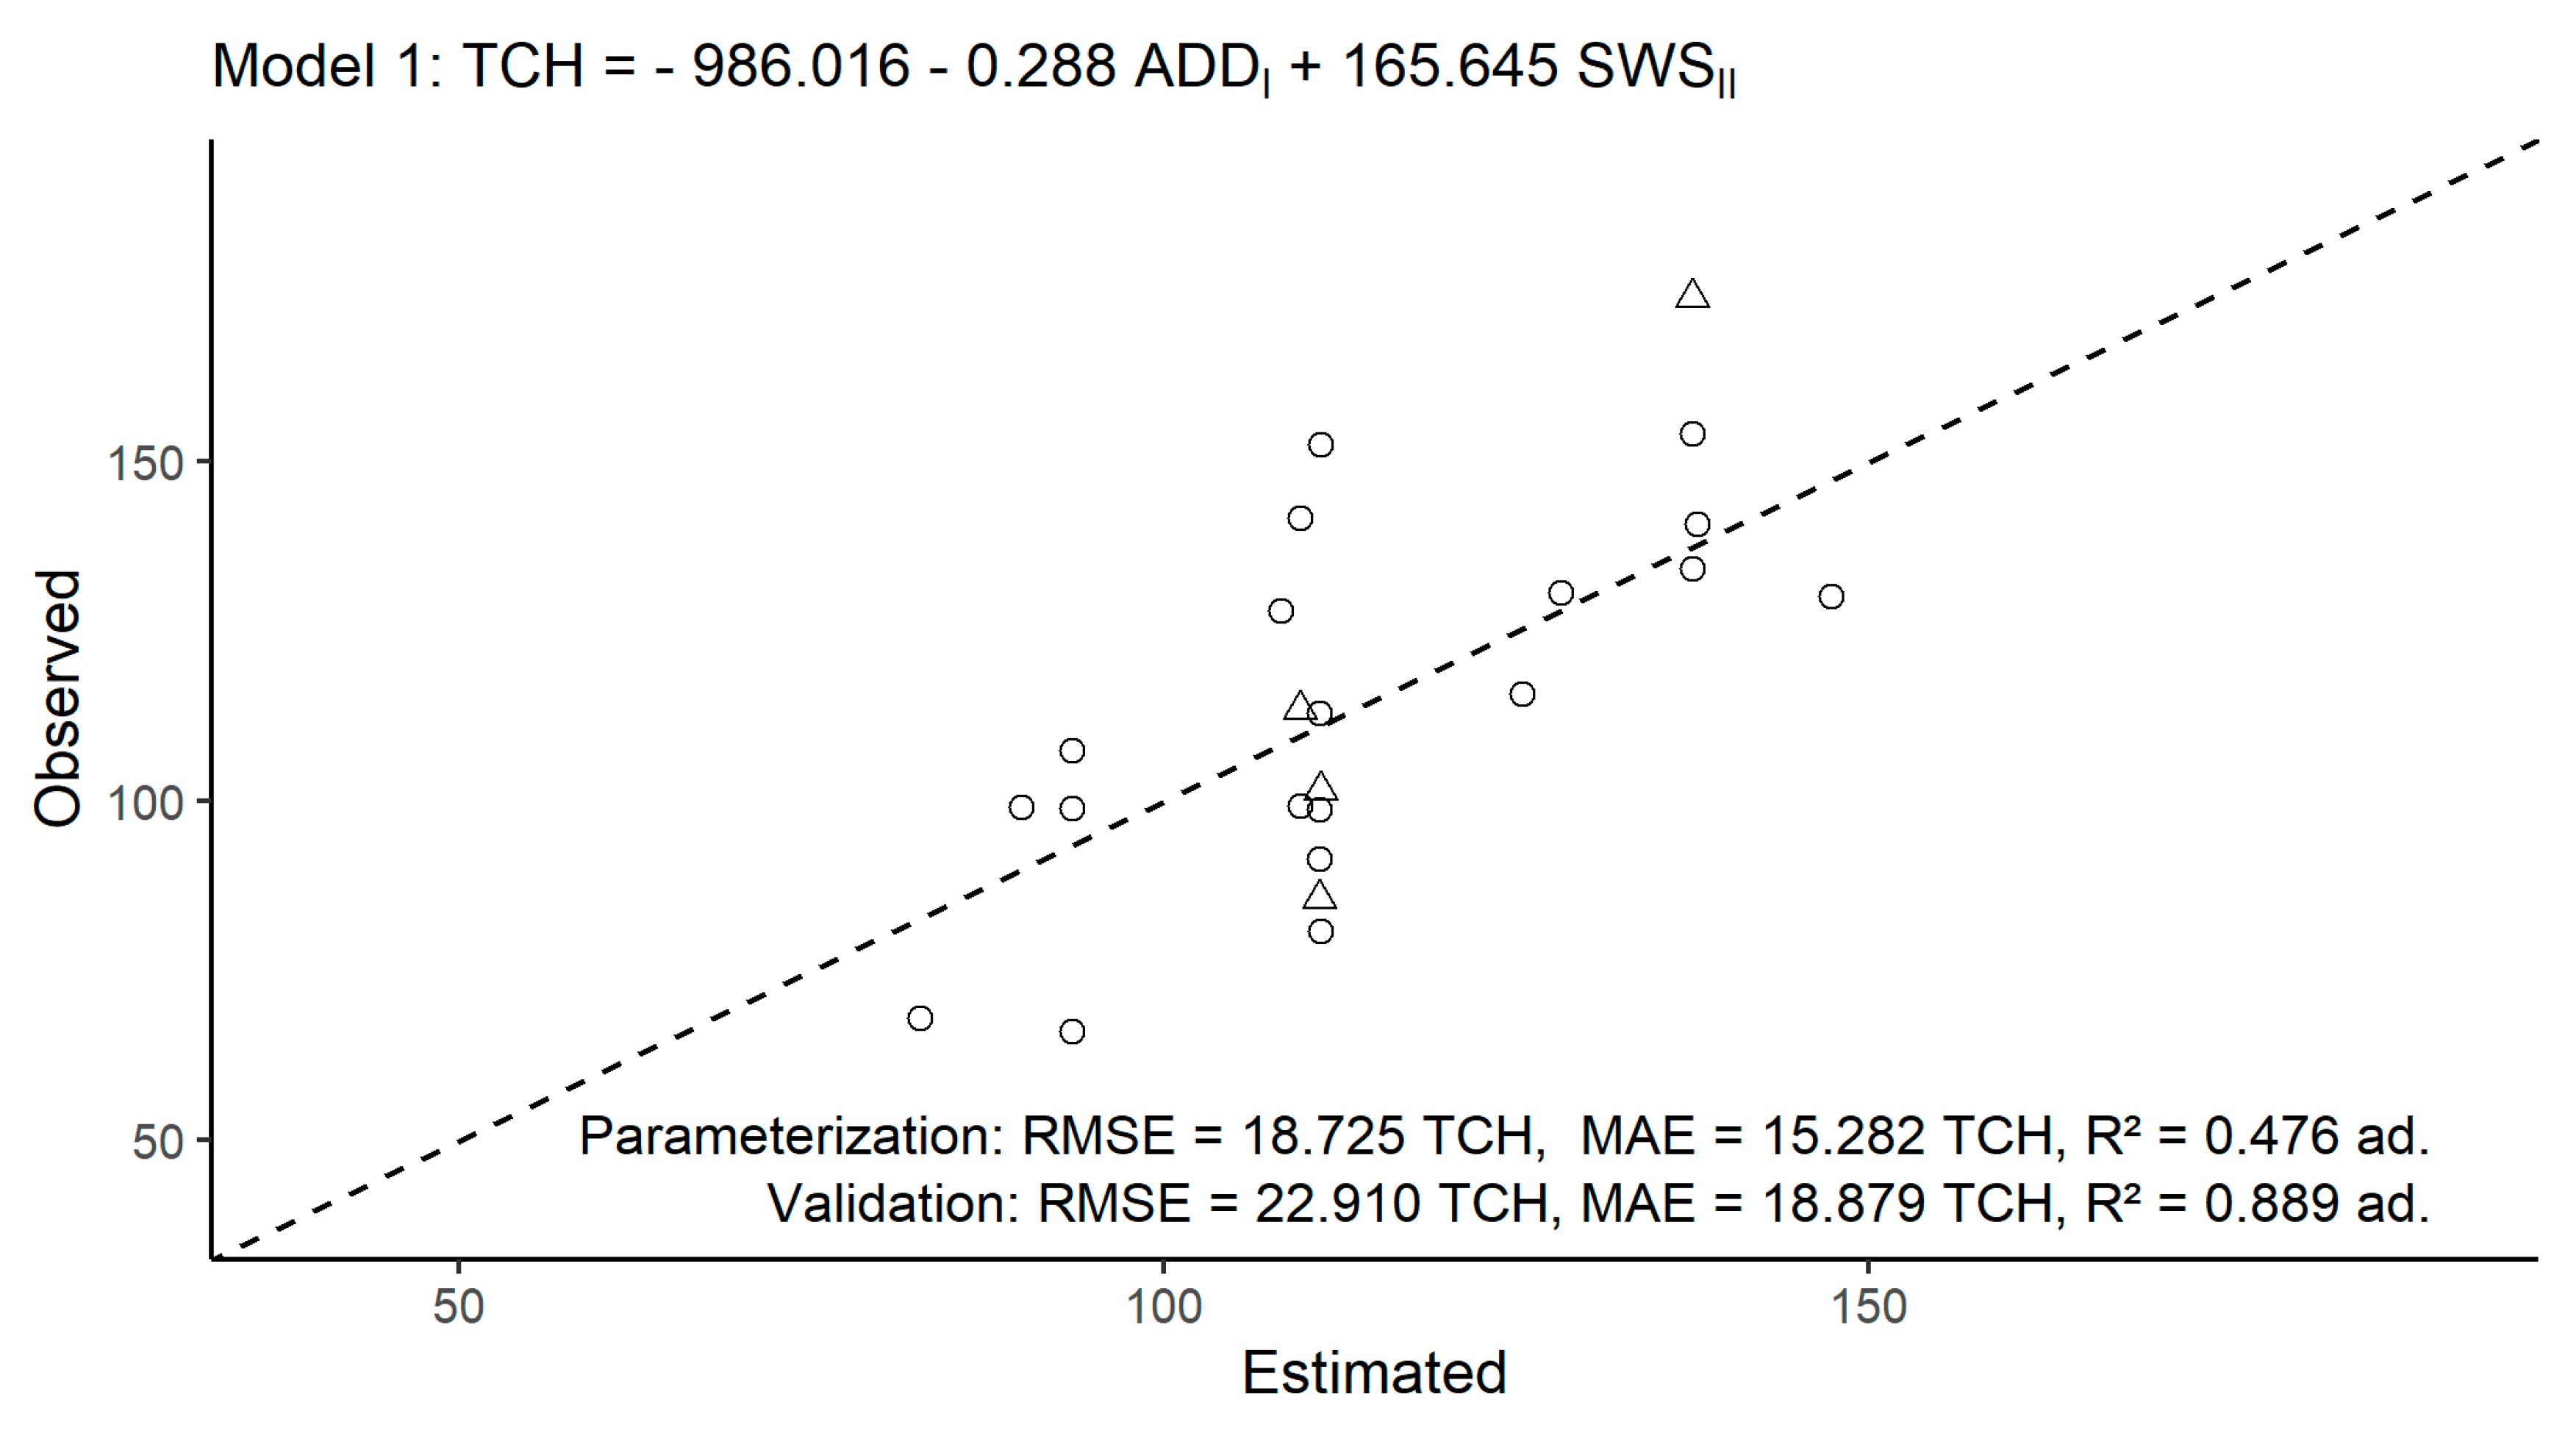
| −986.016 | |0.000| | 412.180 | −2.392 | 0.029 * | ------ | |
| −0.288 | |−0.536| | 0.098 | −2.928 | 0.010 * | 0.410 | |
| 165.645 | |0.524| | 57.961 | 2.858 | 0.011 * | ------ |
| Coefficient 1 | Estimated | Standardized Estimated | Error 2 | t 3 | Pr(>|t|) 4 | R2ajust. 5 |
|---|---|---|---|---|---|---|
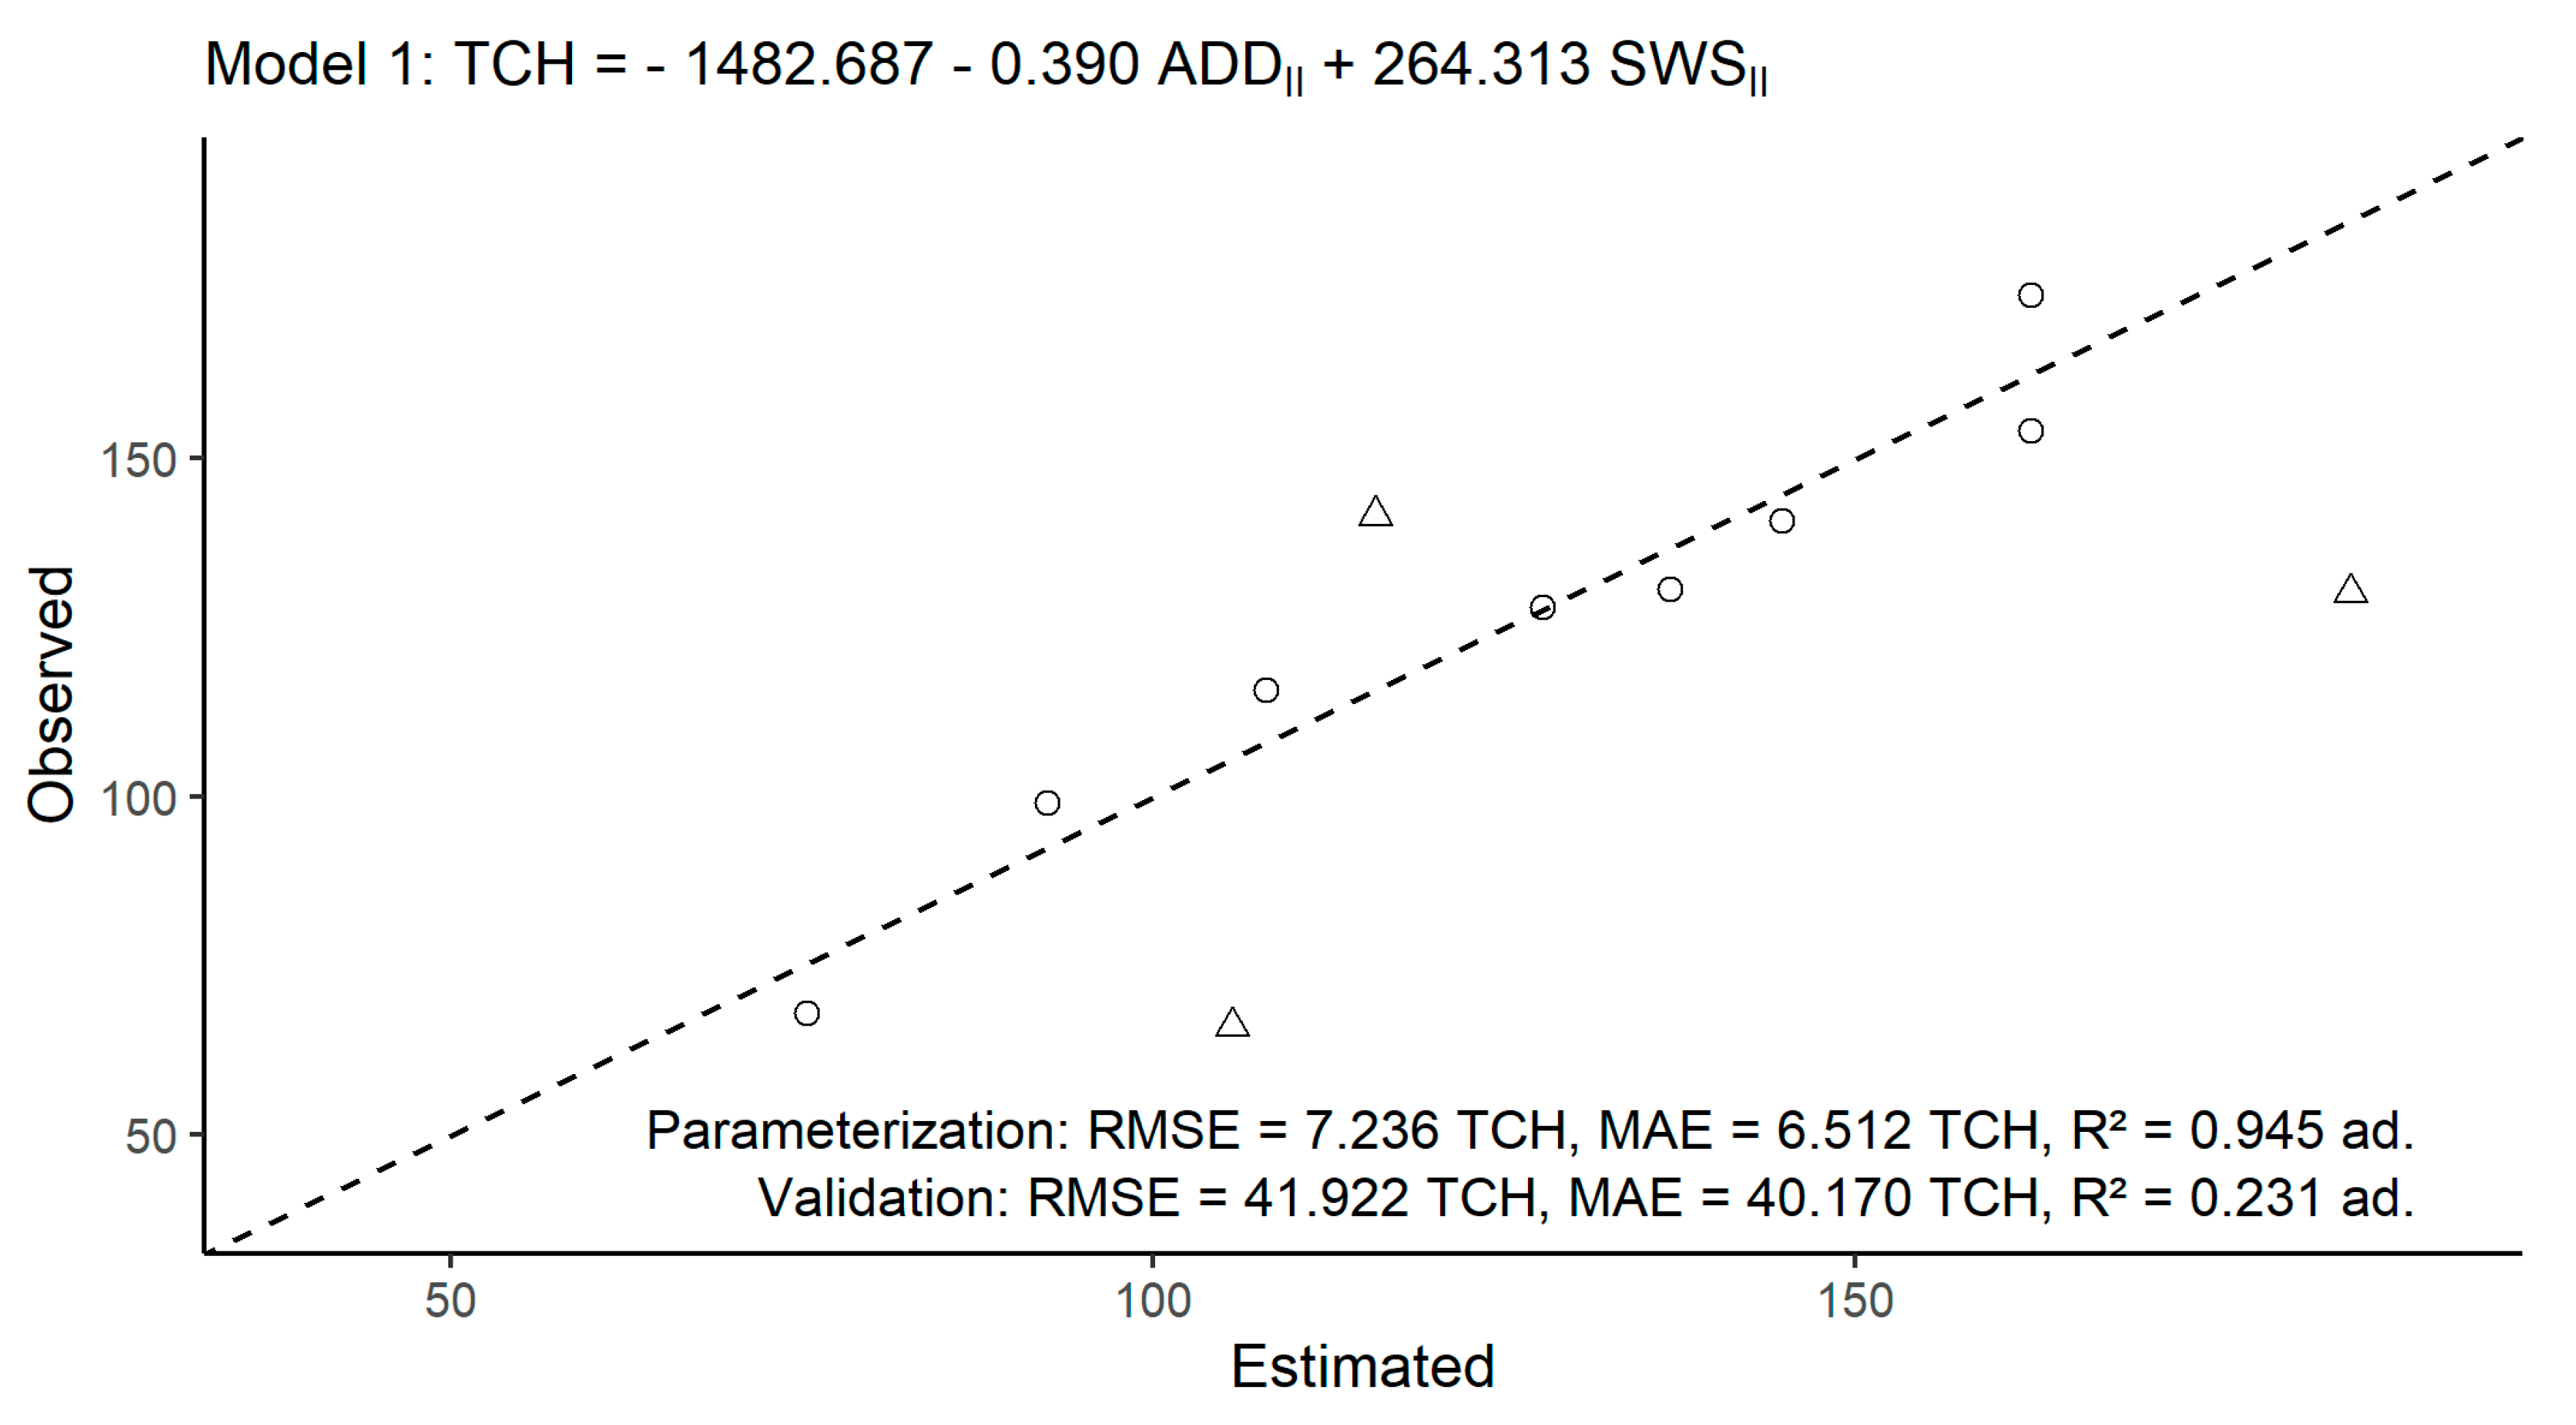
| −1482.687 | |0.000| | 345.400 | −4.292 | 0.008 * | ------ | |
| −0.390 | |−0.713| | 0.058 | −6.746 | 0.001 * | 0.922 | |
| 264.313 | |0.593| | 47.120 | 5.610 | 0.002 * | ------ |
Disclaimer/Publisher’s Note: The statements, opinions and data contained in all publications are solely those of the individual author(s) and contributor(s) and not of MDPI and/or the editor(s). MDPI and/or the editor(s) disclaim responsibility for any injury to people or property resulting from any ideas, methods, instructions or products referred to in the content. |
© 2023 by the authors. Licensee MDPI, Basel, Switzerland. This article is an open access article distributed under the terms and conditions of the Creative Commons Attribution (CC BY) license (https://creativecommons.org/licenses/by/4.0/).
Share and Cite
Viana, J.L.; de Souza, J.L.M.; Hoshide, A.K.; de Oliveira, R.A.; de Abreu, D.C.; da Silva, W.M. Estimating Sugarcane Yield in a Subtropical Climate Using Climatic Variables and Soil Water Storage. Sustainability 2023, 15, 4360. https://doi.org/10.3390/su15054360
Viana JL, de Souza JLM, Hoshide AK, de Oliveira RA, de Abreu DC, da Silva WM. Estimating Sugarcane Yield in a Subtropical Climate Using Climatic Variables and Soil Water Storage. Sustainability. 2023; 15(5):4360. https://doi.org/10.3390/su15054360
Chicago/Turabian StyleViana, Jessica Lima, Jorge Luiz Moretti de Souza, Aaron Kinyu Hoshide, Ricardo Augusto de Oliveira, Daniel Carneiro de Abreu, and Wininton Mendes da Silva. 2023. "Estimating Sugarcane Yield in a Subtropical Climate Using Climatic Variables and Soil Water Storage" Sustainability 15, no. 5: 4360. https://doi.org/10.3390/su15054360
APA StyleViana, J. L., de Souza, J. L. M., Hoshide, A. K., de Oliveira, R. A., de Abreu, D. C., & da Silva, W. M. (2023). Estimating Sugarcane Yield in a Subtropical Climate Using Climatic Variables and Soil Water Storage. Sustainability, 15(5), 4360. https://doi.org/10.3390/su15054360