Article

An Analytical and Numerical Analysis for Hydraulic Fracture Propagation through Reservoir Interface in Coal-Measure Superimposed Reservoirs

1
State Key Laboratory for Geomechanics and Deep Underground Engineering, China University of Mining and Technology, Xuzhou 221116, China
2
School of Mechanics and Civil Engineering, China University of Mining and Technology, Xuzhou 221116, China
*
Author to whom correspondence should be addressed.
Sustainability 2023, 15(5), 4597; https://doi.org/10.3390/su15054597
Submission received: 5 February 2023 / Revised: 28 February 2023 / Accepted: 2 March 2023 / Published: 4 March 2023
(This article belongs to the Section Resources and Sustainable Utilization)

Abstract

:
Hydraulic fracturing technology can be used to jointly exploit unconventional natural gas such as coalbed methane and tight sandstone gas in coal-measure superimposed reservoirs for the enhancement of natural gas production. Hydraulic fracturing usually induces mixed fractures of I and II modes, but existing studies have not considered the influence of reservoir lithology on the stress intensity factor of I/II mixed fractures in coal-measure superimposed reservoirs. This paper develops an analytical stress model and a seepage-mechanical-damage numerical model for the vertical propagation of I/II mixed fractures in coal-measure superimposed reservoirs. The variation of stress intensity factor of I/II mixed fractures is analyzed when the fractures are close to the interface of different lithologic reservoirs and the effects of elastic modulus difference, stress state, fracturing fluid viscosity, shear and tensile failure modes on the vertical propagation of hydraulic fractures are investigated. Finally, the ratio of elastic modulus of adjacent reservoirs is proposed as an evaluation index for the fracture propagation through reservoir interface. These investigations revealed that hydraulic fracture propagation through the reservoir interface is a process of multi-physical interactions and is mainly controlled by the injection pressure and the elastic modulus ratio of adjacent reservoirs. A critical line is formed in the coordinates of elastic modulus ratio and injection pressure. A fracture can propagate through the reservoir interface when the combination of injection pressure and the elastic modulus ratio is in the breakthrough zone. These results can provide theoretical support for the site selection of horizontal wells in coal-measure gas exploitation.

1. Introduction

Coal-measure superimposed reservoirs are important natural gas resources. As clean energy, natural gas produces less carbon dioxide than other fossil fuels when burning. It can also reduce the emissions of sulfur dioxide, dust and nitrogen oxides, reduce the formation of acid rain, slow down the greenhouse effect on the earth and fundamentally improve our environment quality. Hence, the effective exploitation of unconventional natural gas is conducive to environmental protection and ecological sustainable development. A coal-measure stratum refers to a vertically stacked sedimentation of coal seams, tight sandstone layers and shale layers, and is a typical marine–continent transitional facies stratum. Coal-measure strata are widely distributed in many countries, such as the United States, Canada, Australia, Russia and other countries (see Figure 1a). The coal-measure strata in China are mainly distributed in Ordos Basin and Qinshui Basin (see Figure 1b). Coal-measure superimposed gas reservoirs are usually buried deep underground, so the mining process of coal-measure gas is a multi-physical coupling process [1] and should be simulated under deep underground conditions [2]. Coal-measure strata contain abundant natural gas resources, such as coalbed methane, tight sandstone gas and shale gas. Due to the frequent change of sedimentary environments of coal-measures in marine–continent transitional facies, the thickness of each lithology in the reservoir varies greatly, but the cumulative thickness is thick. Such a superimposed stratum hinders the independent exploitation of coalbed methane, shale gas and sandstone gas [3]. A joint exploitation of coal-measure gas is the best option [4,5,6]. The vertical propagation of fractures through the reservoir interface is the key issue to the success of coal-measure gas co-production.
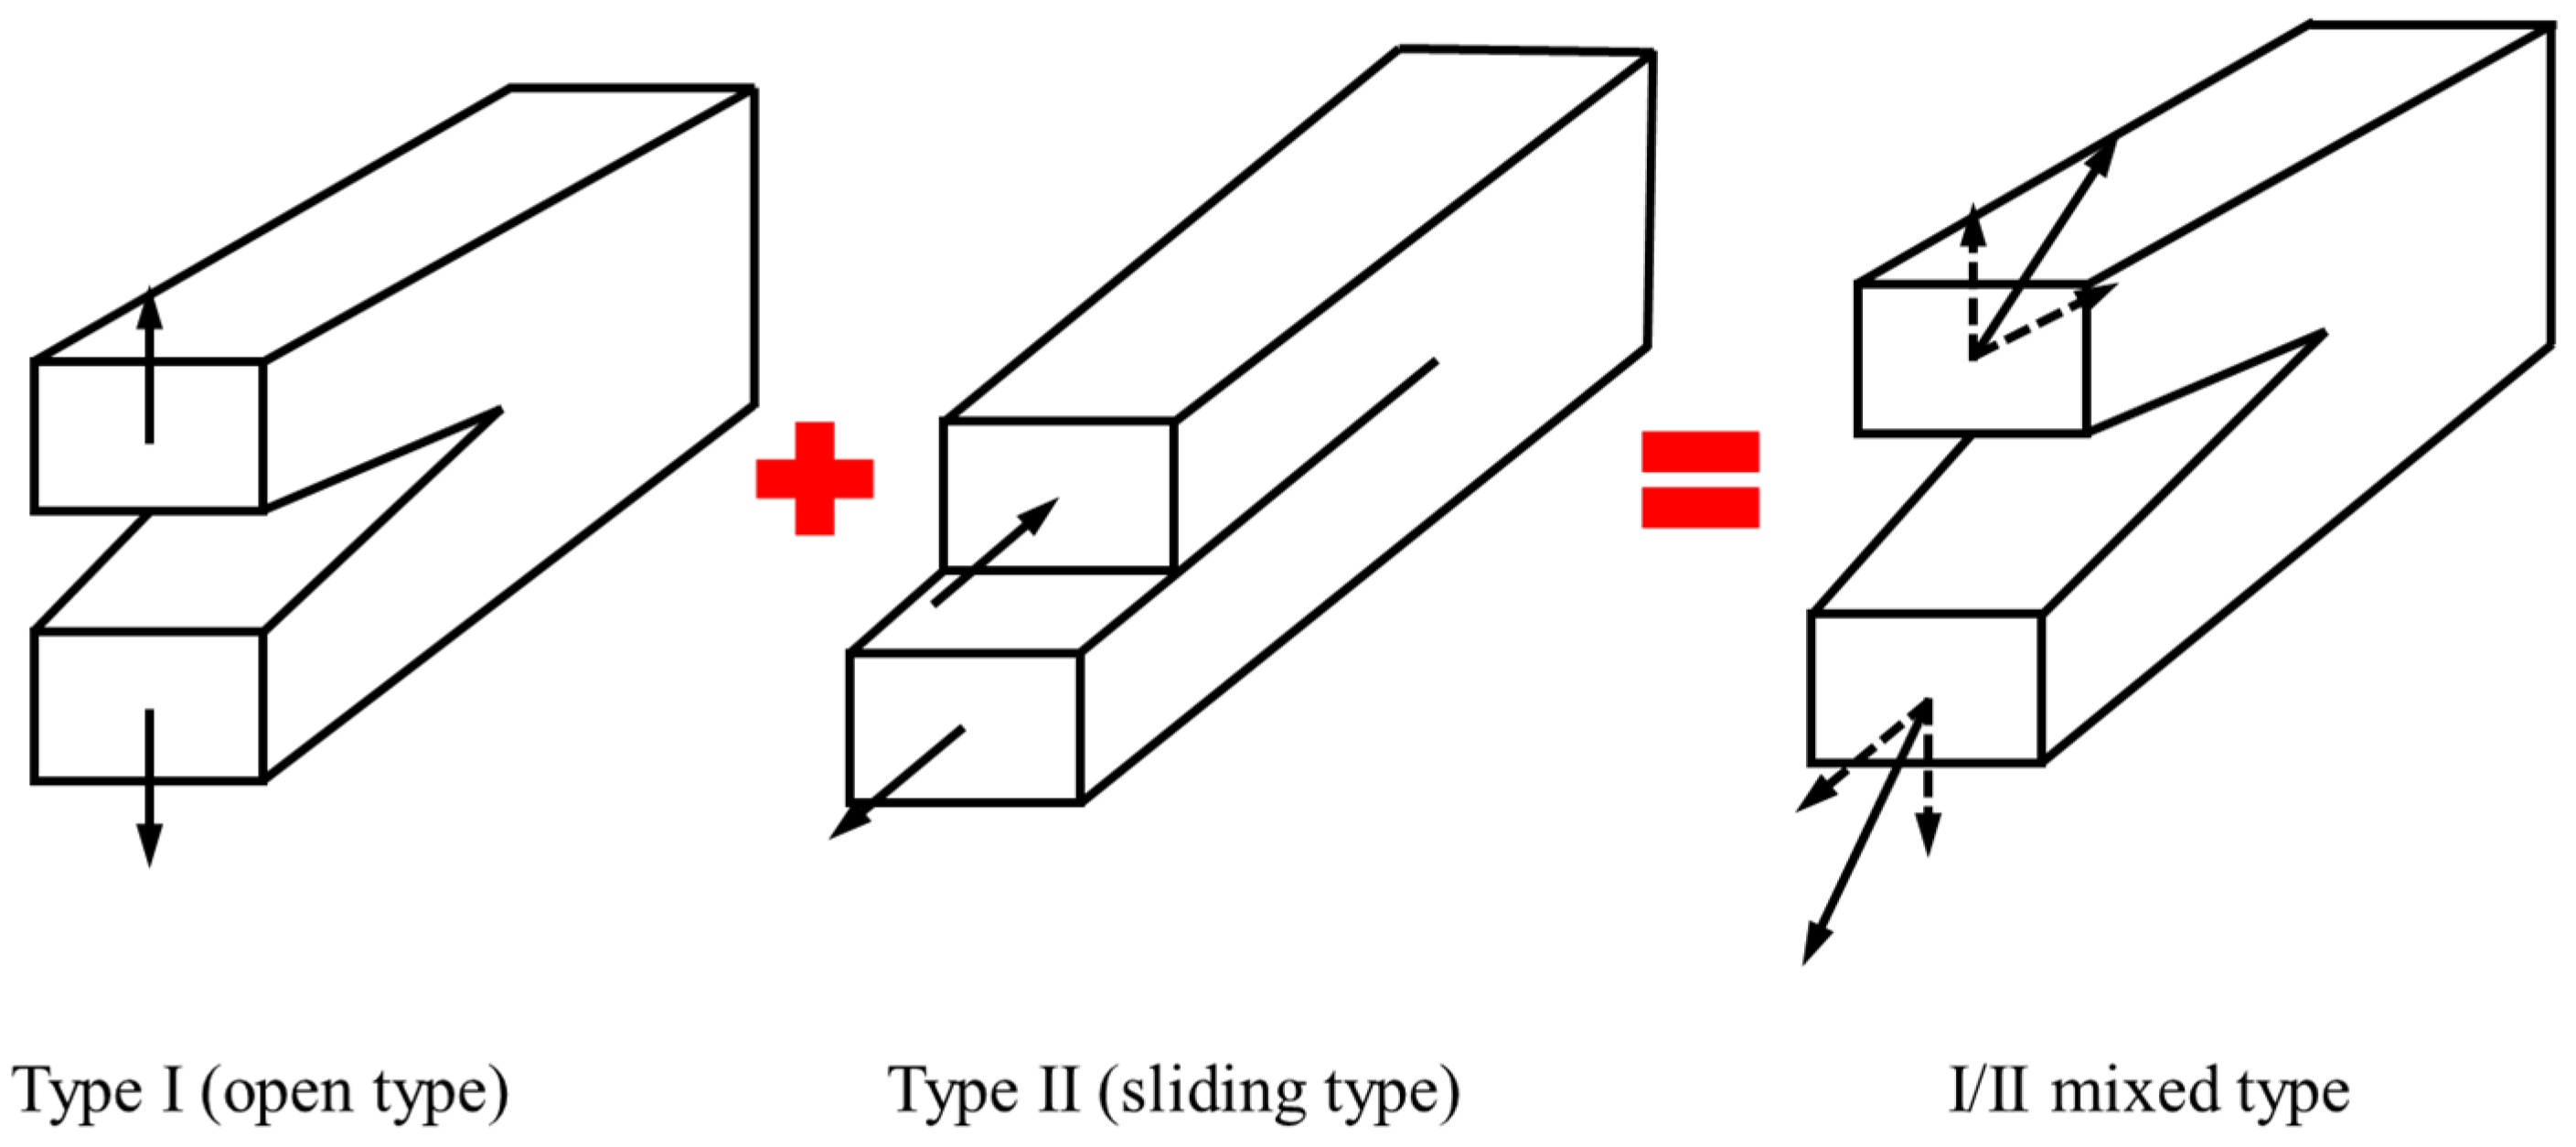
Hydraulic fracturing is a main stimulation technology for coal-measure gas production [7,8]. The vertical propagation of hydraulic fractures can connect adjacent reservoirs and thus enhance coal-measure gas co-production. When the fracture tip is close to the reservoir interface, the fracture type and its change of stress intensity factor will directly affect the vertical propagation of the fracture at the reservoir interface [9,10]. Fractures have three types: Type I fractures are subjected to tensile stresses perpendicular to the fracture surface, so it is called open fractures or tensile fractures. Type II and III fractures are subjected to shear stresses, with the fracture surfaces sliding against each other, which are called shear fractures. Type II fractures are in-plane shear fractures and type III fractures are out-of-plane shear fractures. A lot of studies have been conducted on the effect of stress intensity factors on fracture propagation. Zhou et al. [11] developed a stress intensity factor at the crack tip based on material inhomogeneity theory. They studied the effect of material properties on fracture propagation. Li and Wang [12] developed a stress intensity factor of the inclined crack embedded in the central layer of angle ply laminate through Fourier transform. They studied the crack propagation based on the generalized maximum tangential stress criterion and showed that the fracture propagation direction is closely related to the material inclination and the properties of mixed materials. Zhong et al. [13,14] studied the relationship between the stress intensity factor and fractures which propagate when the type I and type II fractures vertically propagated to the bi-material interface, respectively. Their results showed that both the material properties and the interface strength would affect the stress intensity factor, thereby affecting the fracture propagation. Hydraulic fractures are usually I/II mixed fractures (see Figure 2) [15,16,17], but the research so far only considers the change of stress intensity factor when the tip of I or II cracks is close to the material interface. When the tip of I/II mixed fracture is close to the material interface, the change of stress intensity factor in the hydraulic fracturing process has not been studied so far.
The effects of reservoir physical properties, in situ stress differences and interface mechanical properties on fracture propagation have been studied by different methods [18,19], but the existing research has not quantitatively analyzed the influence of reservoir elastic modulus differences on vertical fracture propagation. Ren et al. [20] established a 3D numerical model with a continuous–discontinuous algorithm and simulated the propagation of hydraulic fractures in the deep coalbed methane reservoirs of Qinshui Basin. Their results showed that reservoir heterogeneity, burial depth (in situ stress) and fracturing fluid viscosity are the main factors to affect the fracture length and maximum fracture width. Tian et al. [21] established a three-dimensional lattice numerical model to explore the synchronous propagation mechanism on the multiple hydraulic fracture clusters in the interbedded tight sandstone reservoirs. They simulated the synchronous propagation mechanism of multiple fractures under different geological conditions and engineering parameters. Their results showed that the differential in situ stress and the strength of reservoir interface will affect the vertical propagation of fractures. Dou et al. [22,23] established a coupling hydraulic fracturing model through discrete element method and simulated the propagation behavior of hydraulic fractures in layered shale. Their investigations showed that the interface mechanical properties and reservoir heterogeneity have significant effects on fracture propagation. Luis et al. [24] proposed a coupling method of finite element (FEM) model and lattice Boltzmann (LB) model. The propagation of I/II mixed fracture in the material containing rigid inclusion is simulated. Their results showed that the fracture propagates around the inclusion due to the high fracture strength of the inclusion. Zhao et al. [25] investigated the fracture propagation in soft–hard interbeds and pointed out that the minimum horizontal stress difference is an important geological factor to affect the vertical propagation of fractures. Through physical experiments, Afşar and Luijendijk [26] found that the thickness of adjacent reservoirs affects the vertical propagation of fractures. Zhao et al. [27] comprehensively studied the influence of cluster spacing and stage spacing on stress distribution, formation pressure and fracture geometry. Their simulation results showed that the fracture spacing of 80 m and the fracture length of 160 m are conducive to the propagation of the secondary fracture system, and the two clusters are more conducive to the formation of uniform fracture geometry under low injection pressure, thus affecting gas production. Wang et al. [28] used the finite element method in the ANSYS software to conduct a numerical simulation of the fracturing process, and quantitatively studied the fracture geometry of the coalbed joint fracturing. Their research observed that the difference of mechanical properties between adjacent layers is one of key factors that affect the vertical propagation of fractures, and the influence of Poisson’s ratio on fractures propagation can be ignored. Through physical experiments and numerical simulations, Hadei and Veiskarami [29] investigated the effects of interface properties, dip angle, reservoir thickness and reservoir mechanical properties on the propagation path of hydraulic fractures and obtained the relationship between the vertical crack propagation and these influence factors. Differences in the elastic modulus of different lithologic reservoirs may affect the vertical propagation of fractures, thereby reducing the production of coal-measure gas. Zhang et al. [30,31] established a fluid-solid-moving boundary coupling model for bedding shale and analyzed the effects of fracturing fluid on the fracture pressure and permeation of the reservoir. The above literature review shows that a lot of investigations have been conducted so far, but the change of stress intensity factor of I/II mixed fracture near the reservoir interface caused by the difference of elastic modulus of the reservoir has not been well studied, and the effect of this change on fracture propagation is still unclear.
This paper will study the effects of reservoir elastic modulus difference on the vertical propagation of hydraulic fractures. Firstly, an analytical stress model is established to analyze the effect of elastic modulus difference on the stress intensity factor at the tip of I/II mixed fractures. Then, a seepage-mechanical-damage numerical model is proposed to study the vertical propagation of fractures during hydraulic fracturing of sandstone–coal superimposed reservoirs. Finally, the effects of elastic modulus differences on fracture propagation are investigated by the numerical model. This paper is organized as follows: In Section 2, the theoretical model and numerical model are established, respectively. The variation of the stress intensity factor is developed when a I/II mixed fracture propagates vertically to the coal-measure reservoir interface and a seepage-mechanical-damage hydraulic fracturing model is established for the sandstone–coal superimposed reservoir and the mathematical formulations of each physical process and damage evolution are presented. These models are verified in Section 3. In Section 4, the simulation results on the fracture propagation are presented for the case that the borehole is in different lithologic reservoirs. In Section 5, the influences of elastic modulus, stress state and fracturing fluid viscosity on vertical fracture propagation are analyzed in detail. Finally, main conclusions are drawn in Section 6.

2. Development of New Stress Intensity Factor at the Tip of a I/II Mixed Crack and Stress-Seepage-Damage Numerical Model

2.1. A New Stress Intensity Factor at the Tip of a I/II Mixed Crack

Stress intensity factor (K) and fracture toughness (KIc) are used to characterize the initiation and propagation of fractures in a material. The fracture toughness of a material characterizes the ability of that material to prevent crack propagation and is usually constant at a constant load and temperature. It is independent of the size, shape and applied stress of the crack; thus, it is an inherent property of that material and expressed by the critical value of stress intensity factor. The stress intensity factor is a physical quantity to reflect the strength of the elastic stress field at the crack tip and is related to the fracture size, the geometric characteristics of the material, and the load. In general, a macroscopic fracture is only initiated when the stress intensity factor at that point is equal to or greater than the fracture toughness at the same point.

2.1.1. A stress Analytical Model at the Tipoff I/II Mixed Crack

The stress intensity factor is affected by the interface characteristics when the crack propagates to the interface. Interfaces are usually defective, and many theoretical models have been established for imperfect interfaces [32,33,34,35], among which a spring model of interfaces has been widely used [15,34]. The spring model assumes that the force is continuous, but the displacement is discontinuous at the interface. That is, interface force and displacement follow a linear relationship [14]:
T n Ι = T n Ι Ι = β n ( u n Ι u n Ι Ι )
T t Ι = T t Ι Ι = β t ( u t Ι u t Ι Ι )
T s Ι = T s Ι Ι = β s ( u s Ι u s Ι Ι )
where T and u represent the interface force and displacement, respectively. The superscripts I and II represent the material I and II, respectively. n denotes the physical quantity perpendicular to the interface. t and s represent the physical quantities tangent to the interface. β n , β t and β s are the interface parameters which are independent of each other.
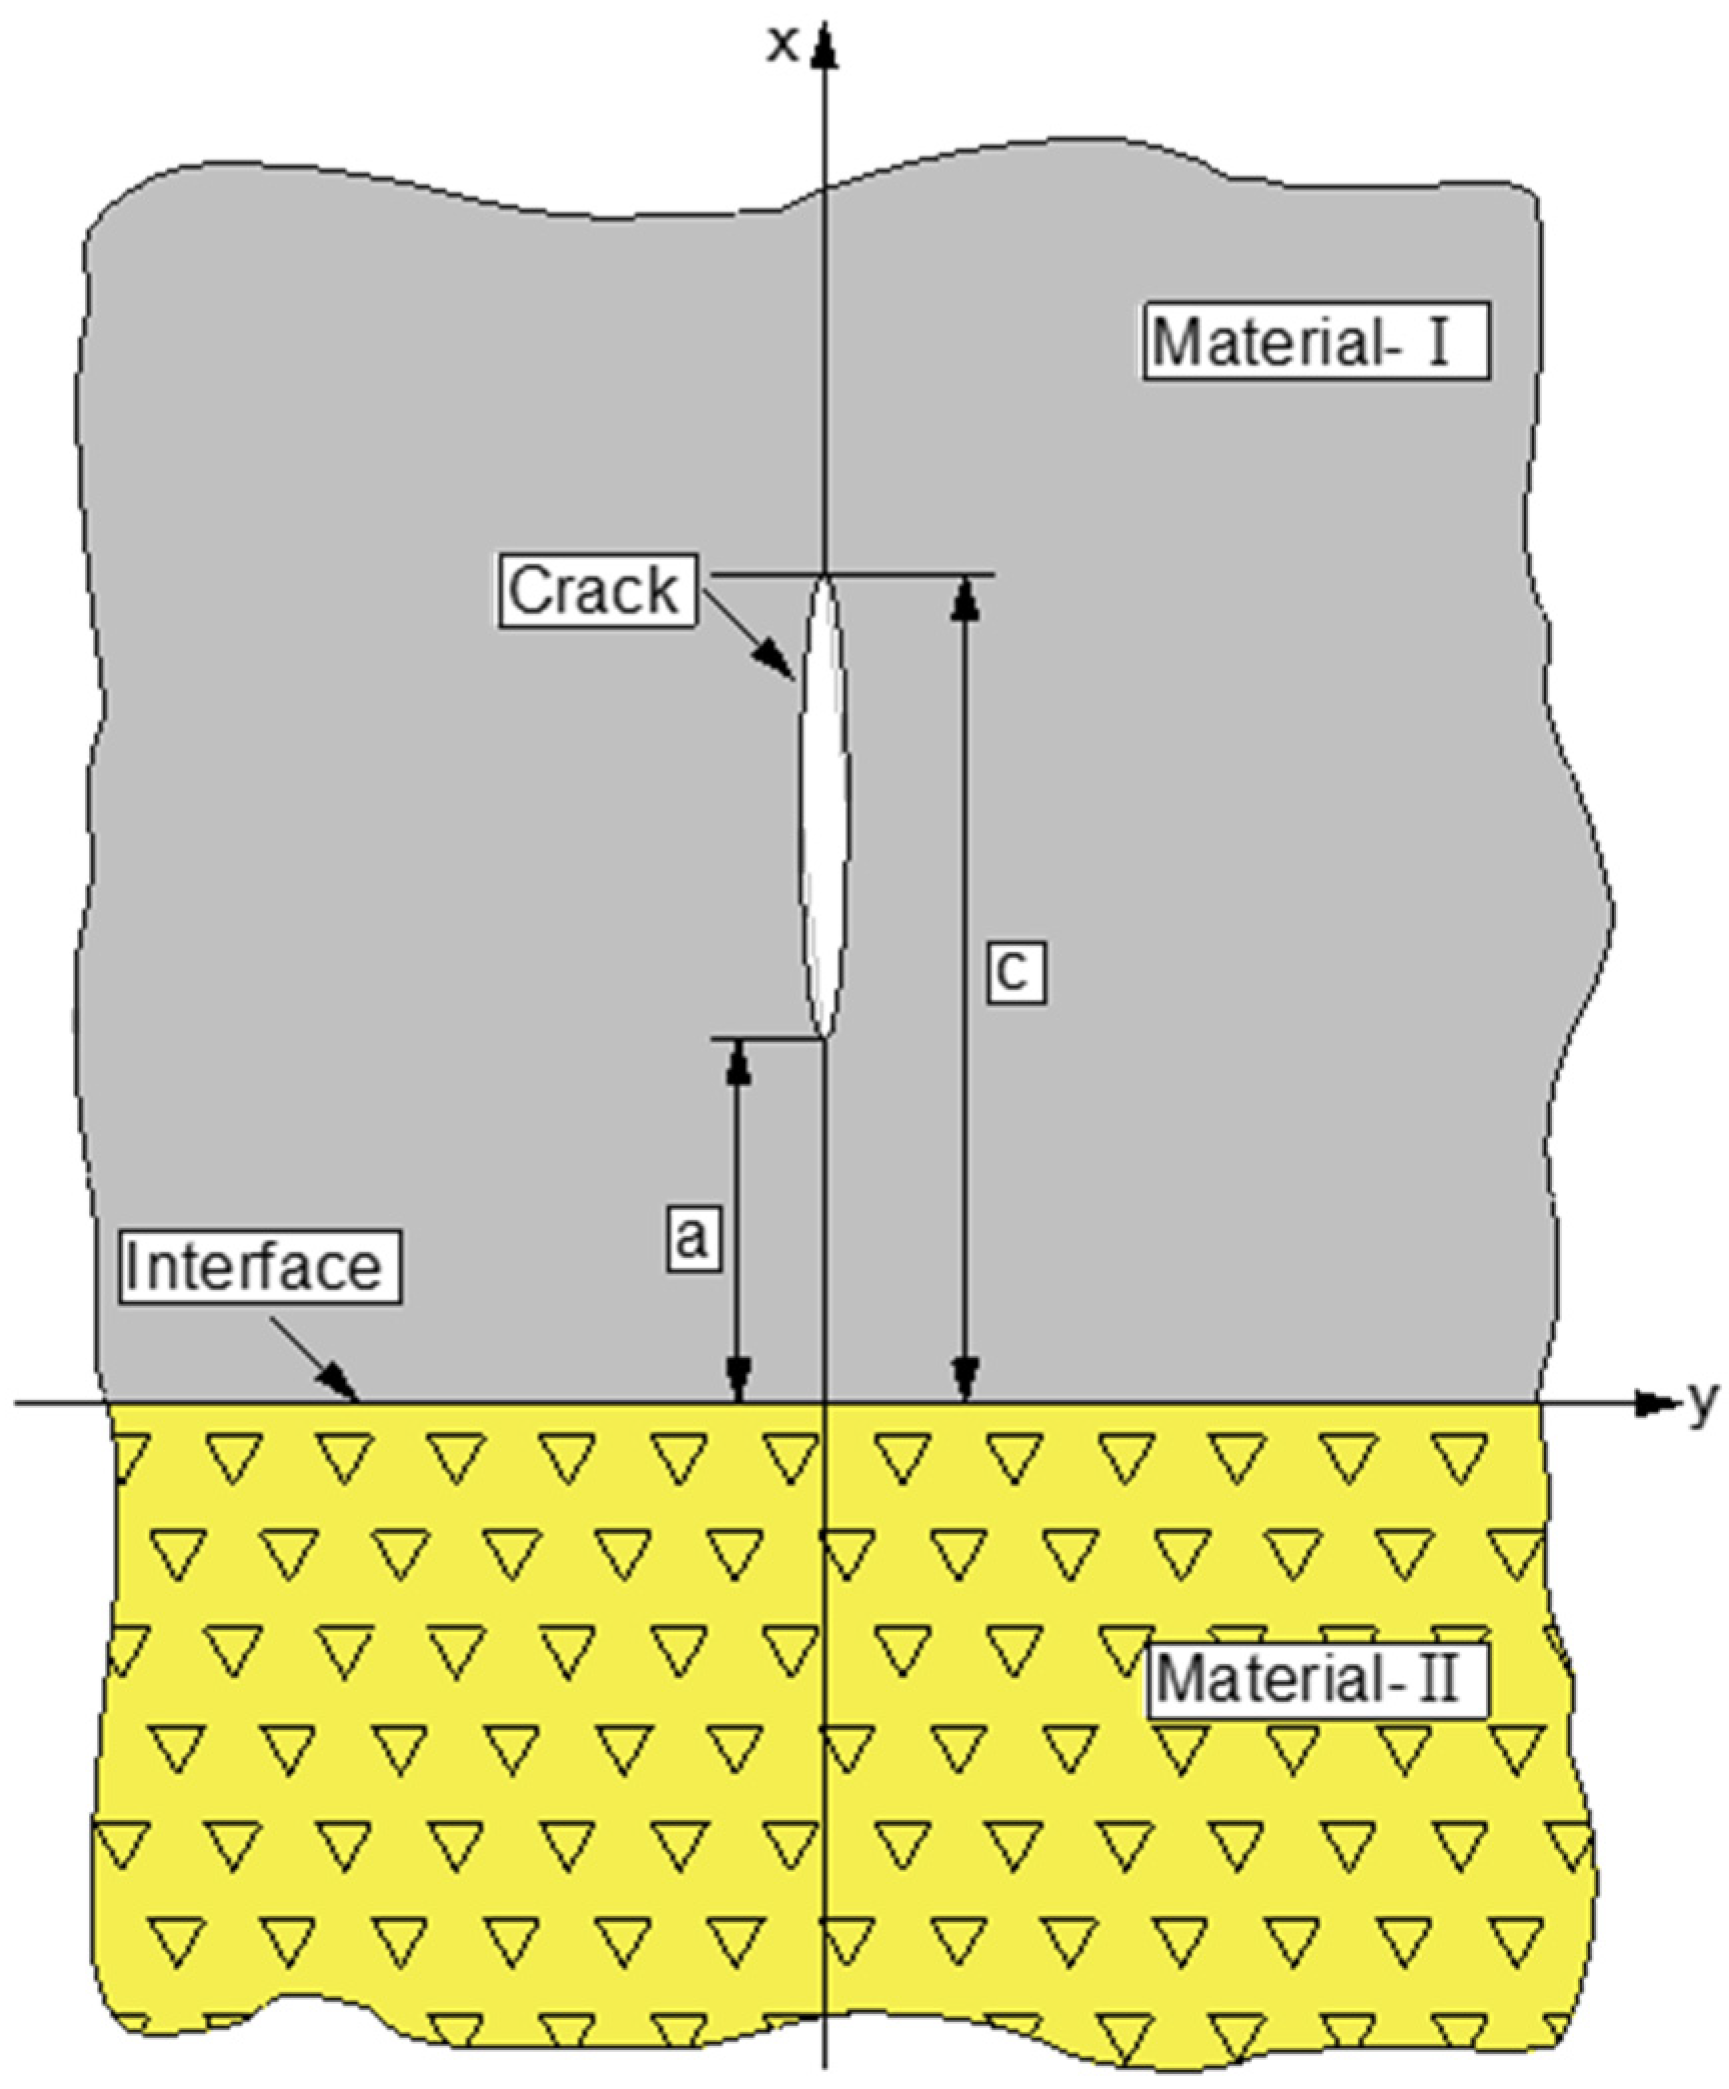
Figure 3 shows that material I and material II are two different materials. The two materials are isotropic and elastic. The material interface is well articulated. The crack is in material I and perpendicular to the interface. Crack coordinates are a < x < c (c > a > 0) and y > 0; thus, the crack length is 2l = c − a. Both tensile and shear loads are simultaneously applied on the crack surface:
σ Ι ( x , 0 ) = σ y y Ι ( x , 0 ) + σ x y Ι ( x , 0 ) = σ 0 τ 0 a < x < c .
For a plane strain problem, the constitutive equation is
σ x x J ( x , y ) = E J 2 ( 1 + μ J ) ( κ J 1 ) [ ( κ J + 1 ) u J x ( κ J 3 ) v J y ]
σ y y J ( x , y ) = E J 2 ( 1 + μ J ) ( κ J 1 ) [ ( κ J + 1 ) v J x ( κ J 3 ) u J y ]
σ x y J ( x , y ) = E J 2 ( 1 + μ J ) ( v J x + u J y )
where EJ is the elastic modulus of material J and μJ is the Poisson’s ratio. uJ and vJ are the displacements in the x-direction and y-direction, respectively. For a plane strain problem, κ J = 3 4 μ J . For a plane stress problem, κ J = ( 3 μ J ) / ( 1 + μ J ) .
The equilibrium equation without body force is
2 u J x 2 + κ J 1 κ J + 1 2 u J y 2 + 2 κ J + 1 2 v J x y = 0
2 v J y 2 + κ J 1 κ J + 1 2 v J x 2 + 2 κ J + 1 2 u J x y = 0 .
At the material interface, the linear spring relations become:
σ x x Ι ( 0 , y ) = σ x x Ι Ι ( 0 , y ) = β n [ u Ι ( 0 , y ) u Ι Ι ( 0 , y ) ]
σ x y Ι ( 0 , y ) = σ x y Ι Ι ( 0 , y ) = β t [ v Ι ( 0 , y ) v Ι Ι ( 0 , y ) ]
where β n and β t are non-negative constants with the unit of N/m3. When β n and β t , the interface is perfect [14]. For this case, the two materials are well articulated, and the upper half-plane elastic field is only considered due to symmetry. The boundary conditions on the crack are
σ x y Ι ( x , 0 ) = 0     0 <   x <
v Ι ( x , 0 ) = 0     0 <   x < a   ;   c < x <
σ x y Ι Ι ( x , 0 ) = 0 ,   v Ι Ι ( x , 0 ) = 0     < x < 0
σ y y Ι ( x , 0 ) = 0   0 <   x <
u Ι ( x , 0 ) = 0   0 <   x < a   ;   c < x <
σ y y Ι Ι ( x , 0 ) = 0 ,   u Ι Ι ( x , 0 ) = 0   < x < 0 .

2.1.2. Analytical Solutions of Stress Intensity Factor

In order to analyze the effect of material properties on crack propagation when the crack propagates to the interface, the Fourier integral transformation is used to express the displacement in the following integral form:
u J ( x , y ) = u Ι J ( x , y ) + u Ι Ι J ( x , y ) = 0 [ A Ι J ( ξ ) + B Ι J ( ξ ) ξ y ] e y ξ sin ( ξ x ) d ξ + 0 [ C Ι J ( ξ ) + D Ι J ( ξ ) ξ x ] e δ J x ξ cos ( ξ y ) d ξ + 0 [ A Ι Ι J ( ξ ) + B Ι Ι J ( ξ ) ξ y ] e y ξ cos ( ξ x ) d ξ 0 [ C Ι Ι J ( ξ ) + D Ι Ι J ( ξ ) ξ x ] e δ J x ξ sin ( ξ y ) d ξ
v J ( x , y ) = v Ι J ( x , y ) + v Ι Ι J ( x , y ) = 0 [ A Ι J ( ξ ) + κ J B Ι J ( ξ ) + B Ι J ( ξ ) ξ y ] e y ξ cos ( ξ x ) d ξ + 0 [ δ J C Ι J ( ξ ) κ J D Ι J ( ξ ) + δ J D Ι J ( ξ ) ξ x ] e δ J x ξ sin ( ξ y ) d ξ 0 [ A Ι Ι J ( ξ ) + κ J B Ι Ι J ( ξ ) + B Ι Ι J ( ξ ) ξ y ] e y ξ sin ( ξ x ) d ξ + 0 [ δ J C Ι Ι J ( ξ ) κ J D Ι Ι J ( ξ ) + δ J D Ι Ι J ( ξ ) ξ x ] e δ J x ξ cos ( ξ y ) d ξ
where δ Ι = 1 and δ Ι Ι = 1 , A Ι J , A Ι Ι J , B Ι J , B Ι Ι J , C Ι J , C Ι Ι J , D Ι J and D Ι Ι J are the coefficients to be determined by boundary conditions. The subscripts in A Ι J and A Ι Ι J represent I and II cracks, respectively.
Through the constitutive equations of Equations (5)–(7), the following stress components are obtained as
σ x x J ( x , y ) = σ Ι x x J ( x , y ) + σ Ι Ι x x J ( x , y )   = E J 2 ( 1 + μ J ) 0 [ 2 A Ι J ( ξ ) + ( κ J 3 ) B Ι J ( ξ ) + 2 B Ι J ( ξ ) ξ y ] ξ e y ξ cos ( ξ x ) d ξ   E J 2 ( 1 + μ J ) 0 [ 2 δ J C Ι J ( ξ ) ( κ J 1 ) D Ι J ( ξ ) + 2 δ J D Ι J ( ξ ) ξ x ] ξ e δ J x ξ cos ( ξ y ) d ξ   E J 2 ( 1 + μ J ) 0 [ 2 A Ι Ι J ( ξ ) + ( κ J 3 ) B Ι Ι J ( ξ ) + 2 B Ι Ι J ( ξ ) ξ y ] ξ e y ξ sin ( ξ x ) d ξ   + E J 2 ( 1 + μ J ) 0 [ 2 δ J C Ι Ι J ( ξ ) ( κ J 1 ) D Ι Ι J ( ξ ) + 2 δ J D Ι Ι J ξ x ] ξ e δ J x ξ sin ( ξ y ) d ξ
σ y y J ( x , y ) = σ Ι y y J ( x , y ) + σ Ι Ι y y J ( x , y )   = E J 2 ( 1 + μ J ) 0 [ 2 A Ι J ( ξ ) + ( κ J + 1 ) B Ι J ( ξ ) + 2 B Ι J ( ξ ) ξ y ] ξ e y ξ cos ( ξ x ) d ξ   + E J 2 ( 1 + μ J ) 0 [ 2 δ J C Ι J ( ξ ) ( κ J + 3 ) D Ι J ( ξ ) + 2 δ J D Ι J ( ξ ) ξ x ] ξ e δ J x ξ cos ( ξ y ) d ξ   + E J 2 ( 1 + μ J ) 0 [ 2 A Ι Ι J ( ξ ) + ( κ J + 1 ) B Ι Ι J ( ξ ) + 2 B Ι Ι J ( ξ ) ξ y ] ξ e y ξ sin ( ξ x ) d ξ   E J 2 ( 1 + μ J ) 0 [ 2 δ J C Ι Ι J ( ξ ) ( κ J + 3 ) D Ι Ι J ( ξ ) + 2 δ J D Ι Ι J ξ x ] ξ e δ J x ξ sin ( ξ y ) d ξ
σ x y J ( x , y ) = σ Ι x y J ( x , y ) + σ Ι Ι x y J ( x , y )   = E J 2 ( 1 + μ J ) { 0 [ 2 A Ι J ( ξ ) + ( κ J 1 ) B Ι J ( ξ ) + 2 B Ι J ( ξ ) ξ y ] ξ e y ξ sin ( ξ x ) d ξ + 0 [ 2 C Ι J ( ξ ) ( κ J + 1 ) δ J D Ι J ( ξ ) + 2 D Ι J ( ξ ) ξ x ] ξ e δ J x ξ sin ( ξ y ) d ξ }   E J 2 ( 1 + μ J ) { 0 [ 2 A Ι Ι J ( ξ ) + ( κ J 1 ) B Ι Ι J ( ξ ) + 2 B Ι Ι J ( ξ ) ξ y ] ξ e y ξ cos ( ξ x ) d ξ + 0 [ 2 C Ι Ι J ( ξ ) ( κ J + 1 ) δ J D Ι Ι J ( ξ ) + 2 D Ι Ι J ξ x ] ξ e δ J x ξ cos ( ξ y ) d ξ } .
These coefficients are determined by the boundary conditions of Equations (12), (14), (15) and (17):
A Ι Ι Ι ( ξ ) = B Ι Ι Ι ( ξ ) = 0 , 2 A Ι Ι ( ξ ) = ( 1 κ Ι ) B Ι Ι ( ξ )
A Ι Ι Ι Ι ( ξ ) = B Ι Ι Ι Ι ( ξ ) = 0 , 2 A Ι Ι Ι ( ξ ) = ( 1 κ Ι ) B Ι Ι Ι ( ξ ) .
Applying interface conditions of Equations (10) and (11) has
E Ι ( 1 + μ Ι ) C Ι Ι ( ξ ) E Ι Ι ( 1 + μ Ι Ι ) C Ι Ι Ι ( ξ ) E Ι 2 ( 1 + μ Ι ) ( κ Ι + 1 ) D Ι Ι ( ξ ) E Ι Ι 2 ( 1 + μ Ι Ι ) ( κ Ι Ι + 1 ) D Ι Ι Ι ( ξ ) = 0
0 [ κ Ι + 1 2 + ξ y ] B Ι Ι ( ξ ) e y ξ d ξ = 0 [ ( 1 + E Ι ξ ( 1 + μ Ι ) β t ) C Ι Ι ( ξ ) + C Ι Ι Ι ( ξ ) ( κ Ι + E Ι ξ ( κ Ι + 1 ) 2 ( 1 + μ Ι ) β t ) D Ι Ι ( ξ ) + κ Ι Ι D Ι Ι Ι ( ξ ) ] sin ( ξ y ) d ξ
E Ι Ι ( 1 + μ Ι Ι ) ξ C Ι Ι Ι ( ξ ) + E Ι Ι ( 1 + μ Ι Ι ) ( κ Ι Ι 1 ) ξ D Ι Ι Ι ( ξ ) = β n [ C Ι Ι ( ξ ) C Ι Ι Ι ( ξ ) ]
0 ( 1 + ξ y ) B Ι Ι ( ξ ) ξ e y ξ d ξ = 0 [ ( ξ + ( 1 + μ Ι ) β n E Ι ) C Ι ( ξ ) ( 1 + μ Ι ) β n E Ι C Ι Ι Ι ( ξ ) ( κ Ι 1 ) ξ 2 D Ι Ι ( ξ ) ] cos ( ξ y ) d ξ
E Ι ( 1 + μ Ι ) C Ι Ι Ι ( ξ ) + E Ι Ι ( 1 + μ Ι Ι ) C Ι Ι Ι Ι ( ξ ) E Ι 2 ( 1 + μ Ι ) ( κ Ι 1 ) D Ι Ι Ι ( ξ ) + E Ι Ι 2 ( 1 + μ Ι Ι ) ( κ Ι Ι + 1 ) D Ι Ι Ι Ι ( ξ ) = 0
0 [ ξ y κ Ι + 1 2 ] B Ι Ι Ι ( ξ ) e y ξ d ξ = 0 [ ( 1 + E Ι ξ ( 1 + μ Ι ) β n ) C Ι Ι Ι ( ξ ) C Ι Ι Ι Ι ( ξ ) E Ι ξ ( κ Ι 1 ) 2 ( 1 + μ Ι ) β n D Ι Ι Ι ( ξ ) ] sin ( ξ y ) d ξ
β t C Ι Ι Ι ( ξ ) + ( β t + E Ι Ι ξ ( 1 + μ Ι Ι ) ) C Ι Ι Ι Ι ( ξ ) κ Ι β t D Ι Ι Ι ( ξ ) + [ κ Ι Ι β t + E Ι Ι ( κ Ι Ι + 1 ) ξ ( 1 + μ Ι Ι ) ] D Ι Ι Ι Ι ( ξ ) = 0
0 ( 1 + ξ y ) B Ι Ι Ι ( ξ ) ξ e y ξ d ξ = 0 [ E Ι Ι ( 1 + μ Ι ) E Ι ( 1 + μ Ι Ι ) C Ι Ι Ι Ι ( ξ ) C Ι Ι Ι ( ξ ) + κ Ι + 1 2 D Ι Ι Ι ( ξ ) + E Ι Ι ( 1 + μ Ι ) ( κ Ι Ι + 1 ) 2 E Ι ( 1 + μ Ι Ι ) D Ι Ι Ι Ι ( ξ ) ] ξ cos ( ξ y ) d ξ .
Performing Fourier inversion transformation on Equations (26), (28), (30) and (32), according to the conclusion of Appendix A, Appendix B ((A13) and (A14)), obtains C Ι J ( ξ ) , C Ι Ι J ( ξ ) , D Ι J ( ξ ) and D Ι Ι J ( ξ ) in terms of G1, G2, G3 and G4:
[ C Ι Ι ( ξ ) C Ι Ι Ι ( ξ ) D Ι Ι ( ξ ) D Ι Ι Ι ( ξ ) ] = [ E Ι 1 + μ Ι E Ι Ι 1 + μ Ι Ι E Ι 2 ( 1 + μ Ι ) ( κ Ι + 1 ) E Ι Ι 2 ( 1 + μ Ι Ι ) ( κ Ι Ι + 1 ) β n β n + E Ι Ι 1 + μ Ι Ι ξ 0 E Ι Ι 2 ( 1 + μ Ι Ι ) ( κ Ι Ι 1 ) ξ 1 + E Ι ξ ( 1 + μ Ι ) β t 1 ( κ Ι + E Ι ξ ( κ Ι + 1 ) 2 ( 1 + μ Ι ) β t ) κ Ι Ι ξ + ( 1 + μ Ι ) β n E Ι ( 1 + μ Ι ) β n E Ι ( κ Ι 1 ) ξ 2 0 ] 1 × [ 0 0 G 1 G 2 ] = [ M Ι Ι ( ξ ) M Ι Ι Ι ( ξ ) N Ι Ι ( ξ ) N Ι Ι Ι ( ξ ) ] G 1 + [ X Ι Ι ( ξ ) X Ι Ι Ι ( ξ ) Y Ι Ι ( ξ ) Y Ι Ι Ι ( ξ ) ] G 2
[ C Ι Ι Ι ( ξ ) C Ι Ι Ι Ι ( ξ ) D Ι Ι Ι ( ξ ) D Ι Ι Ι Ι ( ξ ) ] = [ E Ι 1 + μ Ι E Ι Ι 1 + μ Ι Ι E Ι 2 ( 1 + μ Ι ) ( κ Ι 1 ) E Ι Ι 2 ( 1 + μ Ι Ι ) ( κ Ι Ι 1 ) β t β t + E Ι Ι 1 + μ Ι Ι ξ κ Ι β t κ Ι Ι β t + E Ι Ι 2 ( 1 + μ Ι Ι ) ( κ Ι Ι + 1 ) ξ 1 + E Ι ξ ( 1 + μ Ι ) β n 1 E Ι ξ ( κ Ι 1 ) 2 ( 1 + μ Ι ) β n 0 1 E Ι Ι ( 1 + μ Ι ) E Ι ( 1 + μ Ι Ι ) κ Ι + 1 2 E Ι Ι ( 1 + μ Ι ) ( κ Ι Ι + 1 ) 2 E Ι ( 1 + μ Ι Ι ) ] 1 × [ 0 0 G 3 G 4 ] = [ M Ι Ι Ι ( ξ ) M Ι Ι Ι Ι ( ξ ) N Ι Ι Ι ( ξ ) N Ι Ι Ι Ι ( ξ ) ] G 3 + [ X Ι Ι Ι ( ξ ) X Ι Ι Ι Ι ( ξ ) Y Ι Ι Ι ( ξ ) Y Ι Ι Ι Ι ( ξ ) ] G 4 .
Substituting Equations (33) and (34) into Equations (20)–(22), and using boundary conditions of Equations (4), (13) and (16), we obtain
{ 0 B Ι Ι ( ξ ) cos ( ξ x ) d ξ = 0 0 B Ι Ι Ι ( ξ ) cos ( ξ x ) d ξ = 0 0 < x < a ,   c < x <
{ 0 B Ι Ι ( ξ ) ξ cos ( ξ x ) d ξ 0 { [ M Ι Ι ( ξ ) + ( κ Ι + 3 2 + x ξ ) N Ι Ι ( ξ ) ] G 1 + [ X Ι Ι ( ξ ) + ( κ Ι + 3 2 + x ξ ) Y Ι Ι ( ξ ) ] G 2 } ξ e x ξ d ξ = ( 1 + μ Ι ) σ 0 E Ι 0 B Ι Ι Ι ( ξ ) ξ cos ( ξ x ) d ξ 0 { [ M Ι Ι Ι ( ξ ) + ( κ Ι + 1 2 + x ξ ) N Ι Ι Ι ( ξ ) ] G 3 + [ X Ι Ι Ι ( ξ ) + ( κ Ι + 1 2 + x ξ ) Y Ι Ι Ι ( ξ ) ] G 4 } ξ e x ξ d ξ = ( 1 + μ Ι ) τ 0 E Ι a < x < c .  
It is difficult to obtain the analytical solutions of Equations (35) and (36), so their expressions are converted to singular integral equations with a Cauchy kernel for numerical solutions. An auxiliary function is introduced as in Appendix C (A18) (and. according to the single value condition of displacement v Ι ( a , 0 ) = v Ι ( c , 0 ) = 0 , u Ι ( a , 0 ) = u Ι ( c , 0 ) = 0 , one has
a c g ( x ) d x = 0 .
Using Fourier inversion transform obtains
{ B Ι Ι ( ξ ) = 2 π ξ a c g ( s ) sin ( ξ s ) d s B Ι Ι Ι ( ξ ) = 2 π ξ a c g ( s ) sin ( ξ s ) d s .
Substituting Equation (38) into (36), and using appendices (A3)–(A5), we obtain:
{ 1 π a c g ( s ) s x d s + 1 π a c g ( s ) k Ι ( s , x ) d s = ( 1 + μ Ι ) σ 0 E Ι 1 π a c g ( s ) s x d s + 1 π a c g ( s ) k Ι Ι ( s , x ) d s = ( 1 + μ Ι ) τ 0 E Ι a < x < c
with
{ k Ι ( s , x ) = 1 s + x + 0 { [ M Ι Ι ( ξ ) + ( κ Ι + 3 2 + x ξ ) N Ι Ι ( ξ ) ] ( 2 s ξ 1 κ Ι ) + 2 s ξ 2 [ X Ι Ι ( ξ ) + ( κ Ι + 3 2 + x ξ ) Y Ι Ι ( ξ ) ] } e ( s + x ) ξ d ξ k Ι Ι ( s , x ) = 1 s + x + 0 { [ M Ι Ι Ι ( ξ ) + ( κ Ι + 1 2 + x ξ ) N Ι Ι Ι ( ξ ) ] ( 2 s ξ 1 κ Ι ) + 2 s ξ [ X Ι Ι Ι ( ξ ) + ( κ Ι + 1 2 + x ξ ) Y Ι Ι Ι ( ξ ) ] } e ( s + x ) ξ d ξ
Due to the complexity of the kernel k(s, x), after the introduction of Equation (A19) in Appendix C, Equation (39) is rewritten as
{ 1 π 1 1 g Ι ¯ ( s ¯ ) s ¯ x ¯ d s ¯ + 1 π 1 1 g Ι ¯ ( s ¯ ) k ¯ ( s ¯ , x ¯ ) d s ¯ = 1 1 π 1 1 g Ι Ι ¯ ( s ¯ ) s ¯ x ¯ d s ¯ + 1 π 1 1 g Ι Ι ¯ ( s ¯ ) k ¯ ( s ¯ , x ¯ ) d s ¯ = 1 1 < x ¯ < 1
where
k ¯ ( s ¯ , x ¯ ) = c a 2 k ( s , x )
After considering the stress singularity at the crack tip, g ¯ ( s ¯ ) can be written as
g ¯ ( s ¯ ) = f ( s ¯ ) 1 s ¯ 2
where f ( s ¯ ) is a continuous bounded function on the interval (–1,1). Equation (41) can be discretized into the following system of equations with the Lobatto–Chebyshev formula:
1 n i = 0 n λ i f ( s ¯ i ) s ¯ i x ¯ m + 1 n i = 0 n λ i k ¯ ( s ¯ i , x ¯ m ) f ( s ¯ i ) = 1 , m = 1 , 2 , , n
where x ¯ m = cos [ ( 2 m 1 ) π / ( 2 n ) ] ,   m = 1 , 2 , , n ; s ¯ i = cos ( i π / n ) ,   i = 0 , 1 , 2 , , n ; λ 0 = λ n = 1 / 2 ; λ 1 = λ n 1 = 1 .
Equation (37) can be rewritten as
i = 0 n λ i f ( s ¯ i ) = 0 .
Solving Equations (44) and (45) obtains the stress at the crack tip. In this study, stress intensity factor at the crack tip is obtained as
K = lim x a 2 π ( a x ) [ σ y y Ι ( x , 0 ) + σ x y Ι ( x , 0 ) ] .
Using Equation (43) can obtain the stress intensity factor at the lower end of the crack as
K = π l ( σ 0 + τ 0 ) f ( 1 ) .
This is our new stress intensity factor at the tip of crack. This stress intensity factor considers both the tensile force and the shear force. Further, this expression, for the first time, considers the change of the stress intensity factor at the tip of the I/II mixed fracture when the crack is close to the interface of different lithologic reservoirs. It can judge whether the I/II mixed crack passes through the material layer interface when a crack is close to the material layer interface.

2.1.3. Analysis of Stress Intensity Factor of I/II Mixed Cracks at the Interface

For a well-articulated material interface [14], the kernel k(s, x) can be simplified into
k ( s , x ) = k Ι ( s , x ) + k Ι Ι ( s , x ) = 2 s + x + 0 { E Ι [ ( 2 s ξ 1 κ Ι ) ( κ Ι 1 ) ( 2 s ξ 1 κ Ι ) ( κ Ι + 1 ) ] 2 ( 1 + μ Ι ) + 2 s ξ [ E Ι ( κ Ι Ι 1 ) E Ι Ι ( κ Ι Ι + 1 ) 2 ( 1 + μ Ι ) + ( κ Ι + 3 2 + x ξ ) κ Ι Ι ] } e ( s + x ) ξ d ξ .
Substituting Equation (48) into Equation (39) can obtain the variation of stress intensity factor when the I/II mixed fracture tip is close to the layer interface. This solution introduces the elastic modulus of reservoirs with different lithologies into the mechanical model for stress intensity factor. The effect of the elastic modulus difference of different lithologic reservoirs on the stress intensity factor at the fracture tip can be directly reflected.
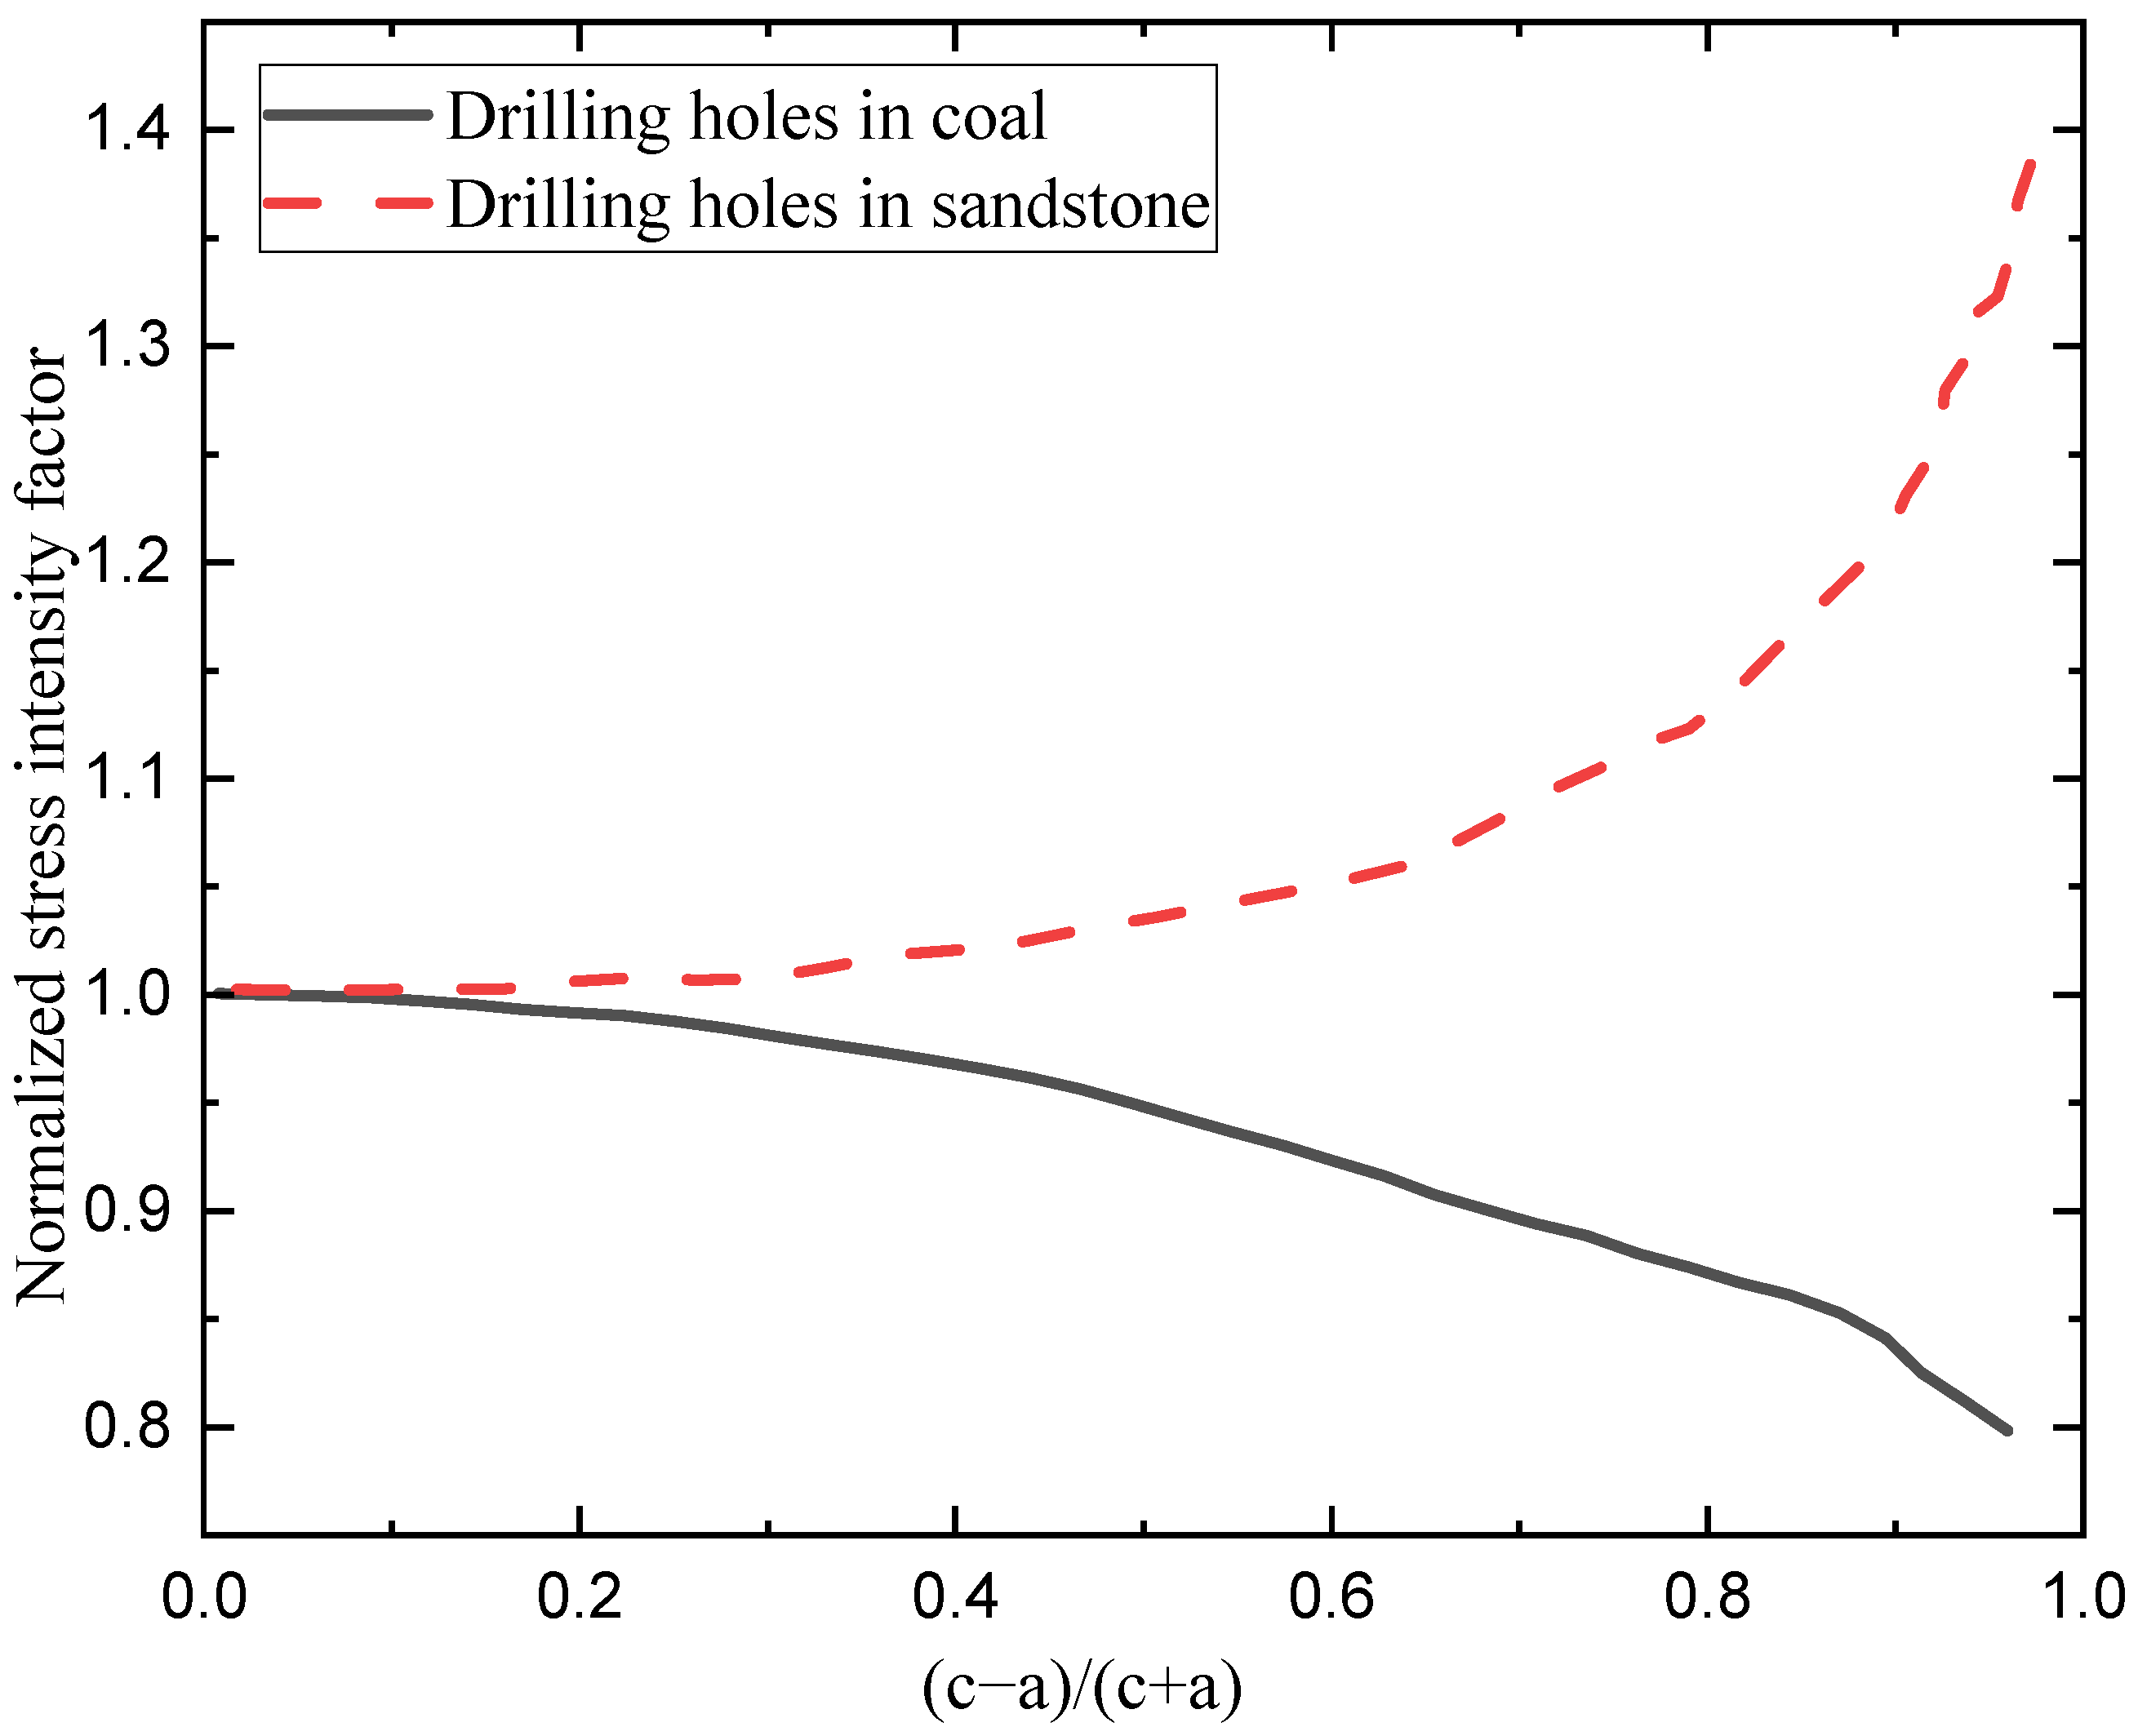
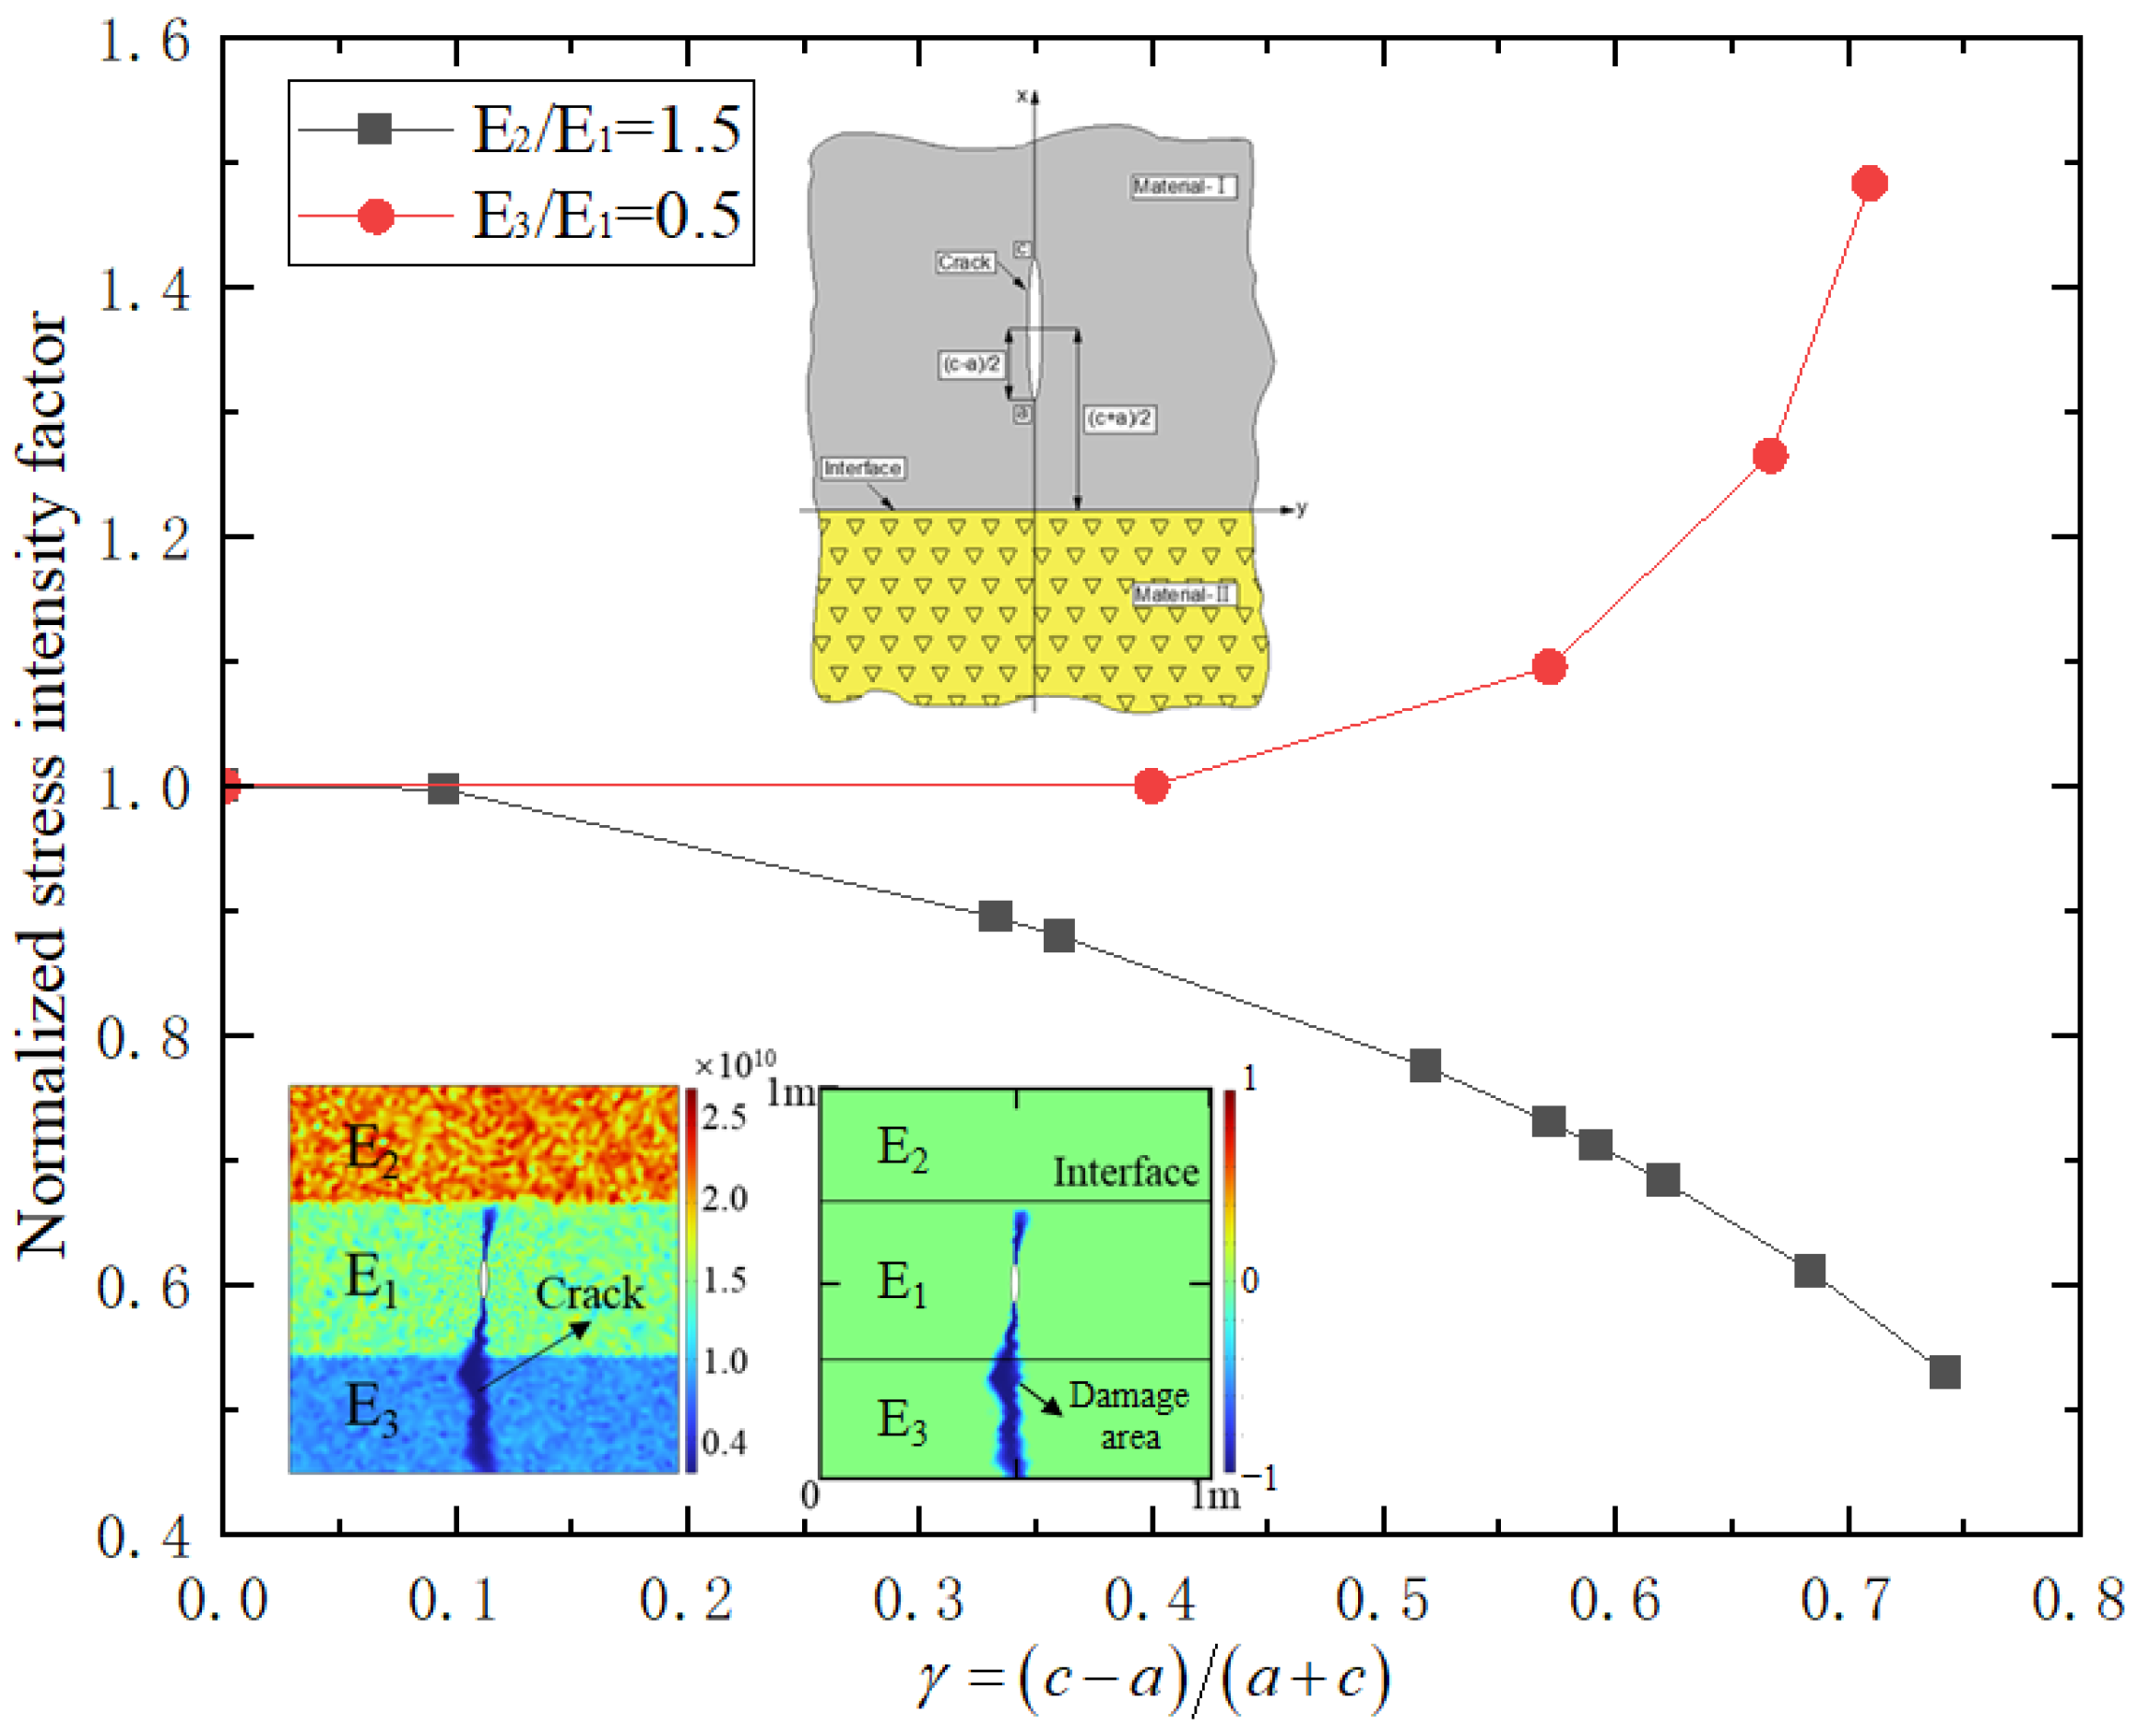
A sandstone–coal superimposed reservoir is selected for calculation. The Poisson’s ratio is taken as 0.2 and 0.4, respectively. Figure 3 plots the variation of stress intensity factor with γ = ( c a ) / ( c + a ) for these two cases when the borehole is located in the coal seam. The red dotted line indicates that the borehole is in the sandstone, and the black solid line indicates that the borehole is in the coal seam. Figure 4 shows that the stress intensity factor of the crack tip gradually decreases with the increase in γ, the distance between the fracture tip and the reservoir layer interface. Since the fracture toughness of coal does not change, the closer to the interface the crack is, the more resistant the stress intensity factor is to reach the fracture toughness of coal, so the coal is less likely to fracture; that is, the crack of this coal is difficult to continuously propagate vertically. When the borehole is located in the sandstone, the stress intensity factor increases gradually with the increase in γ. The closer to the interface the crack is, the more easily it propagates.

2.2. Deevelopment of Seepage-Mechanical-Damage Numerical Model for Hydraulic Fracturing in a Coal–sandstone Superimposed Reservoir

Hydraulic fracturing technology can be applied to coalbed methane extraction, shale gas extraction and so on. For a coal-measure superimposed reservoir, boreholes can be arranged in either coal seam or shale or tight sandstone reservoirs. Aiming at the sandstone–coal superimposed reservoir, the reasonable fracturing parameters were obtained by comparing the effects of different borehole locations on the effect of crack propagation and the connectivity of superimposed reservoir hydraulic fractures.

2.2.1. Geological Setting of Research Area

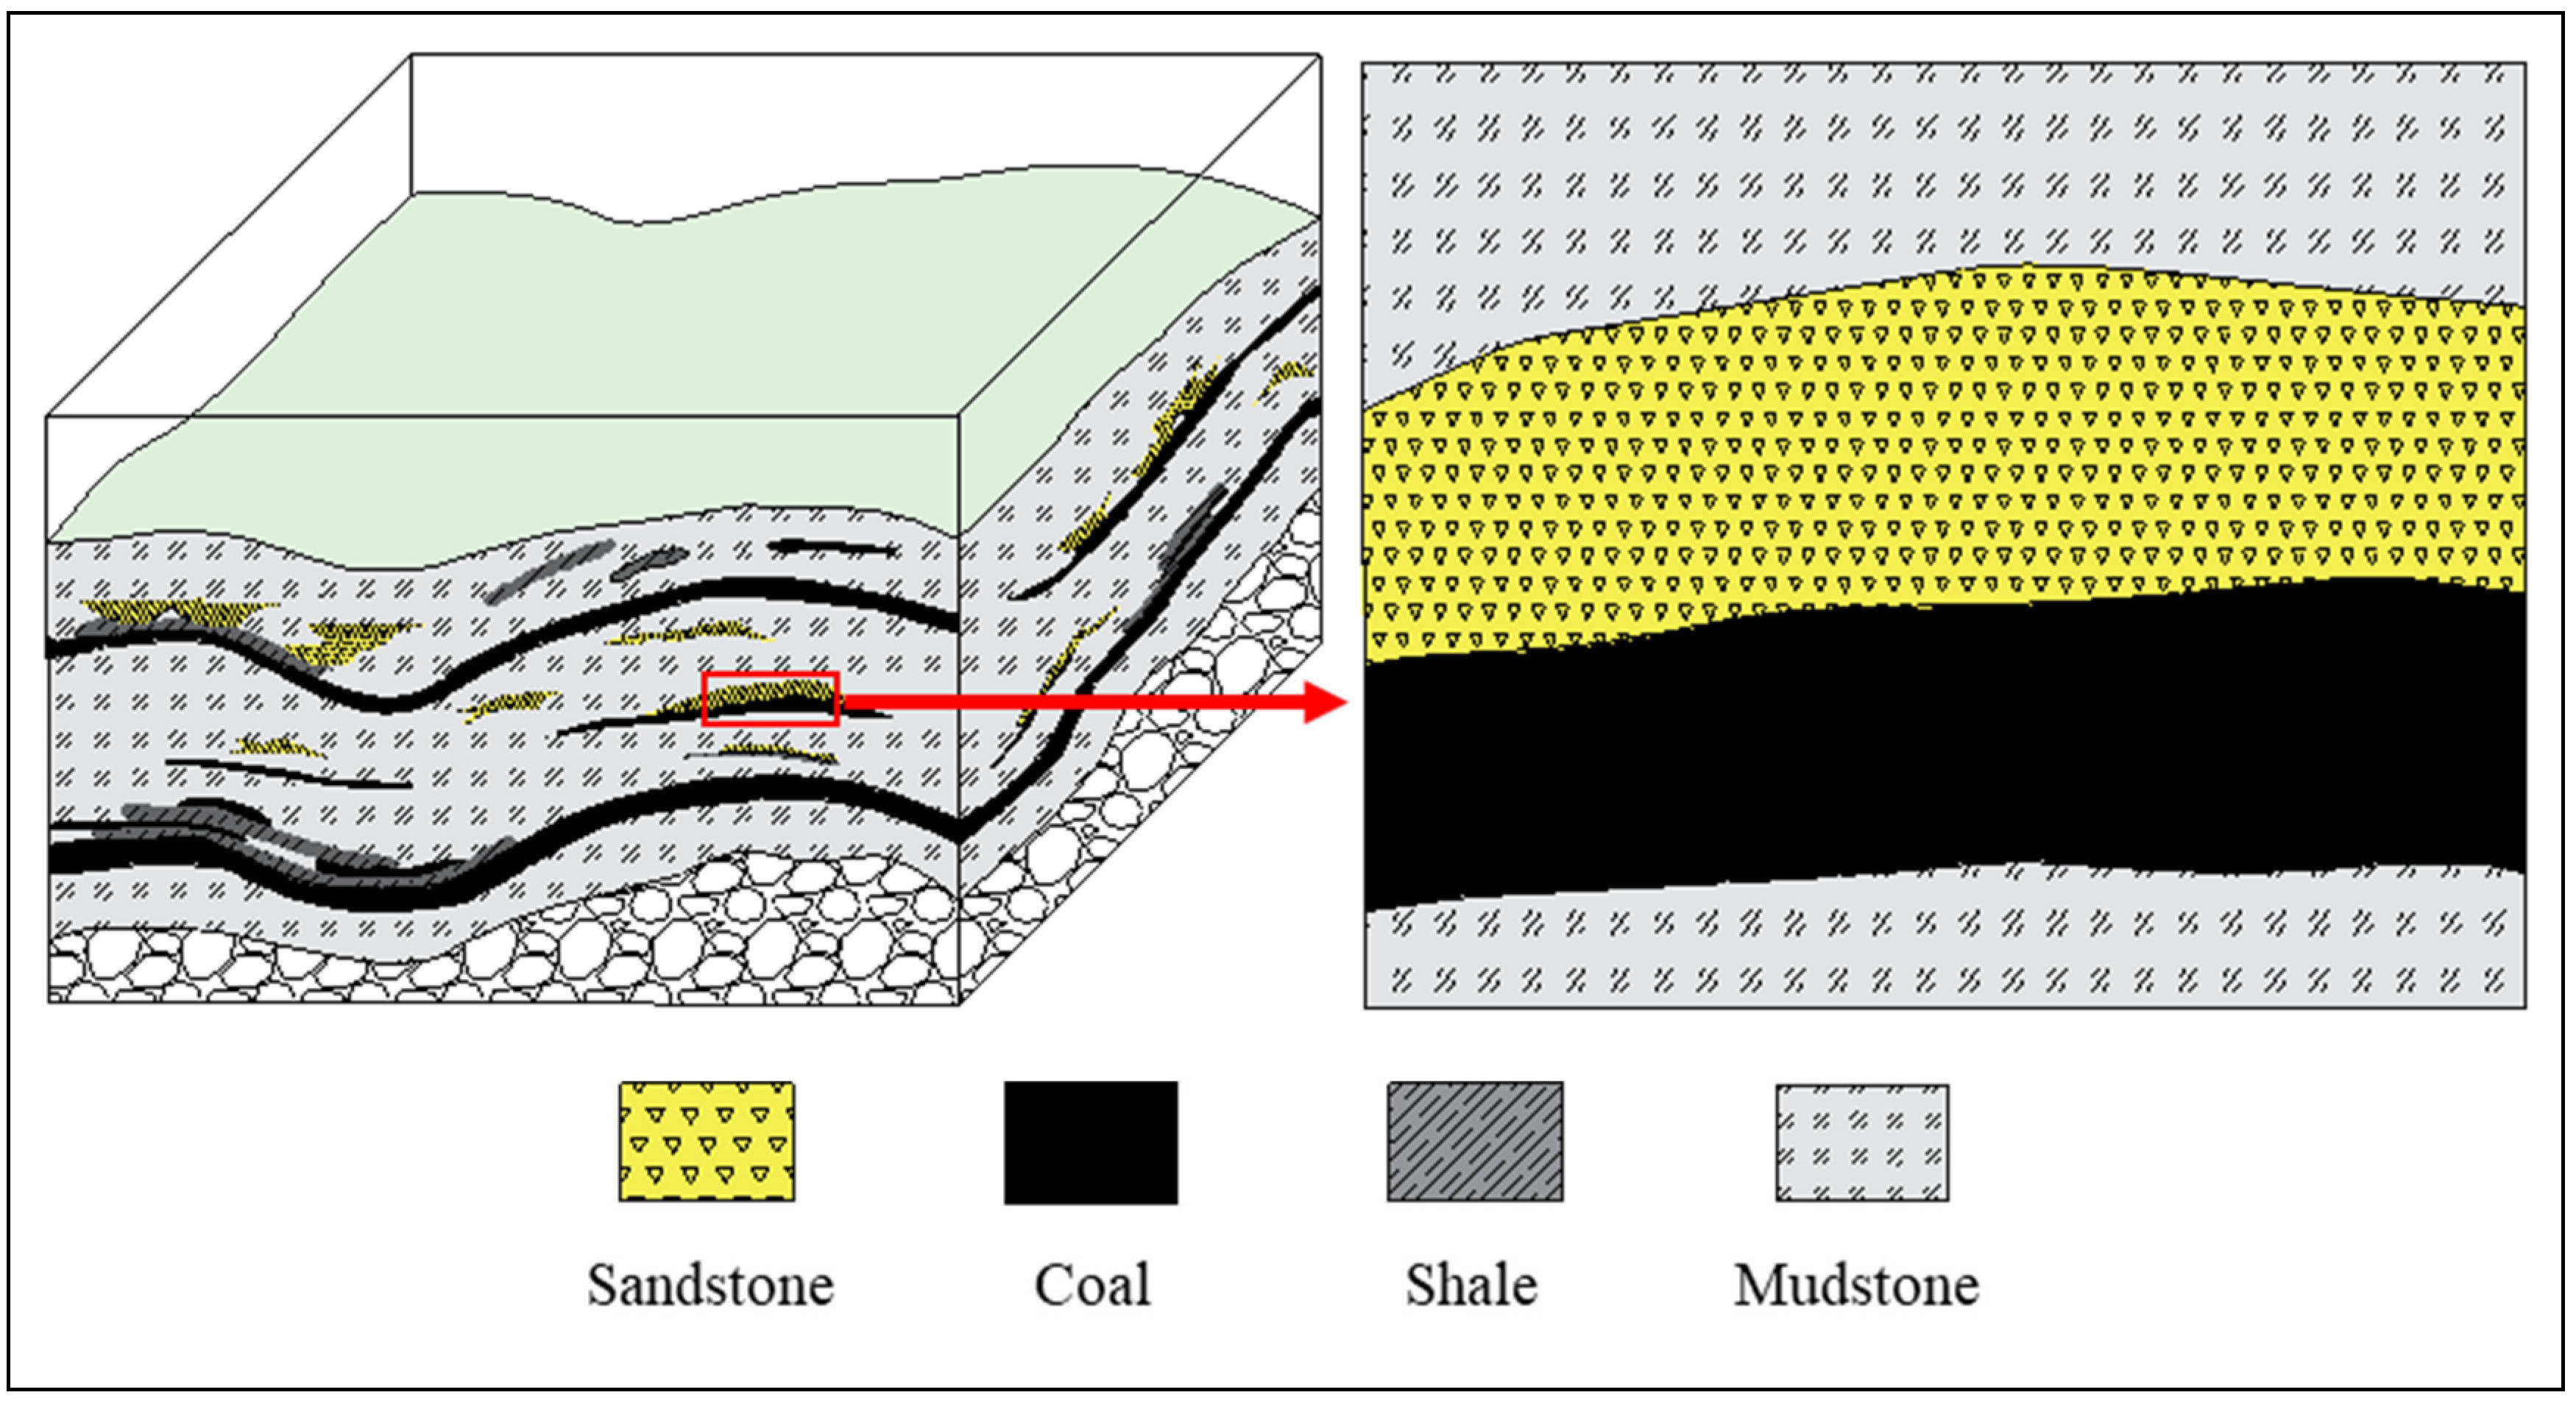
Recent exploration indicated significant coal-measure gas (coalbed methane, shale gas, tight sandstone gas) potential in the Linxing area in the eastern Ordos Basin of China [36]. The coal-measure gas reservoir in the Linxing area is at a depth of about 1650–1800 m, which is a tight sandstone–coal–shale interbedded gas reservoir [37,38]. This paper takes the tight sandstone–coal superimposed reservoir as its research object. The model is shown in Figure 5. The influence factors on crack propagation through the reservoir interface will be explored.
The porosity, Poisson’s ratio and elastic modulus are characterized by experiments based on the rock sample. The sandstone porosity lies in a range of 4.34–10.70%, the Poisson’s ratio ranges from 0.12 to 0.49 [40]. For in situ stress, the maximum horizontal stress is 32.8 MPa, and the minimum horizontal stress is 10.0 MPa. The uniaxial compressive strength of sandstone in the target area ranges from 11.8 to 110.0 MPa, the elastic modulus ranges from 9.51 to 49.89 GPa and tensile strength ranges from 3.06 to 14.5 MPa [39,41]. The thickness of the coal seam area is 0.1–6.1 m, and its average thickness is 2.7 m. The reservoir pressure is 14.5–19.8 MPa and its average is 17.1 MPa. The average reservoir pressure gradient is 0.95 MPa/100 m. Mechanical tests show that the elastic modulus is 3.7–6.4 GPa, Poisson’s ratio is 0.26–0.39 and the uniaxial compressive strength is 2–21 MPa [42]. In this paper, a seepage-mechanical-damage numerical model is established to simulate the vertical propagation of hydraulic fracture in a coal–sandstone superimposed reservoir with these real geologic parameters.

2.2.2. Numerical Model Establishment and Basic Assumptions

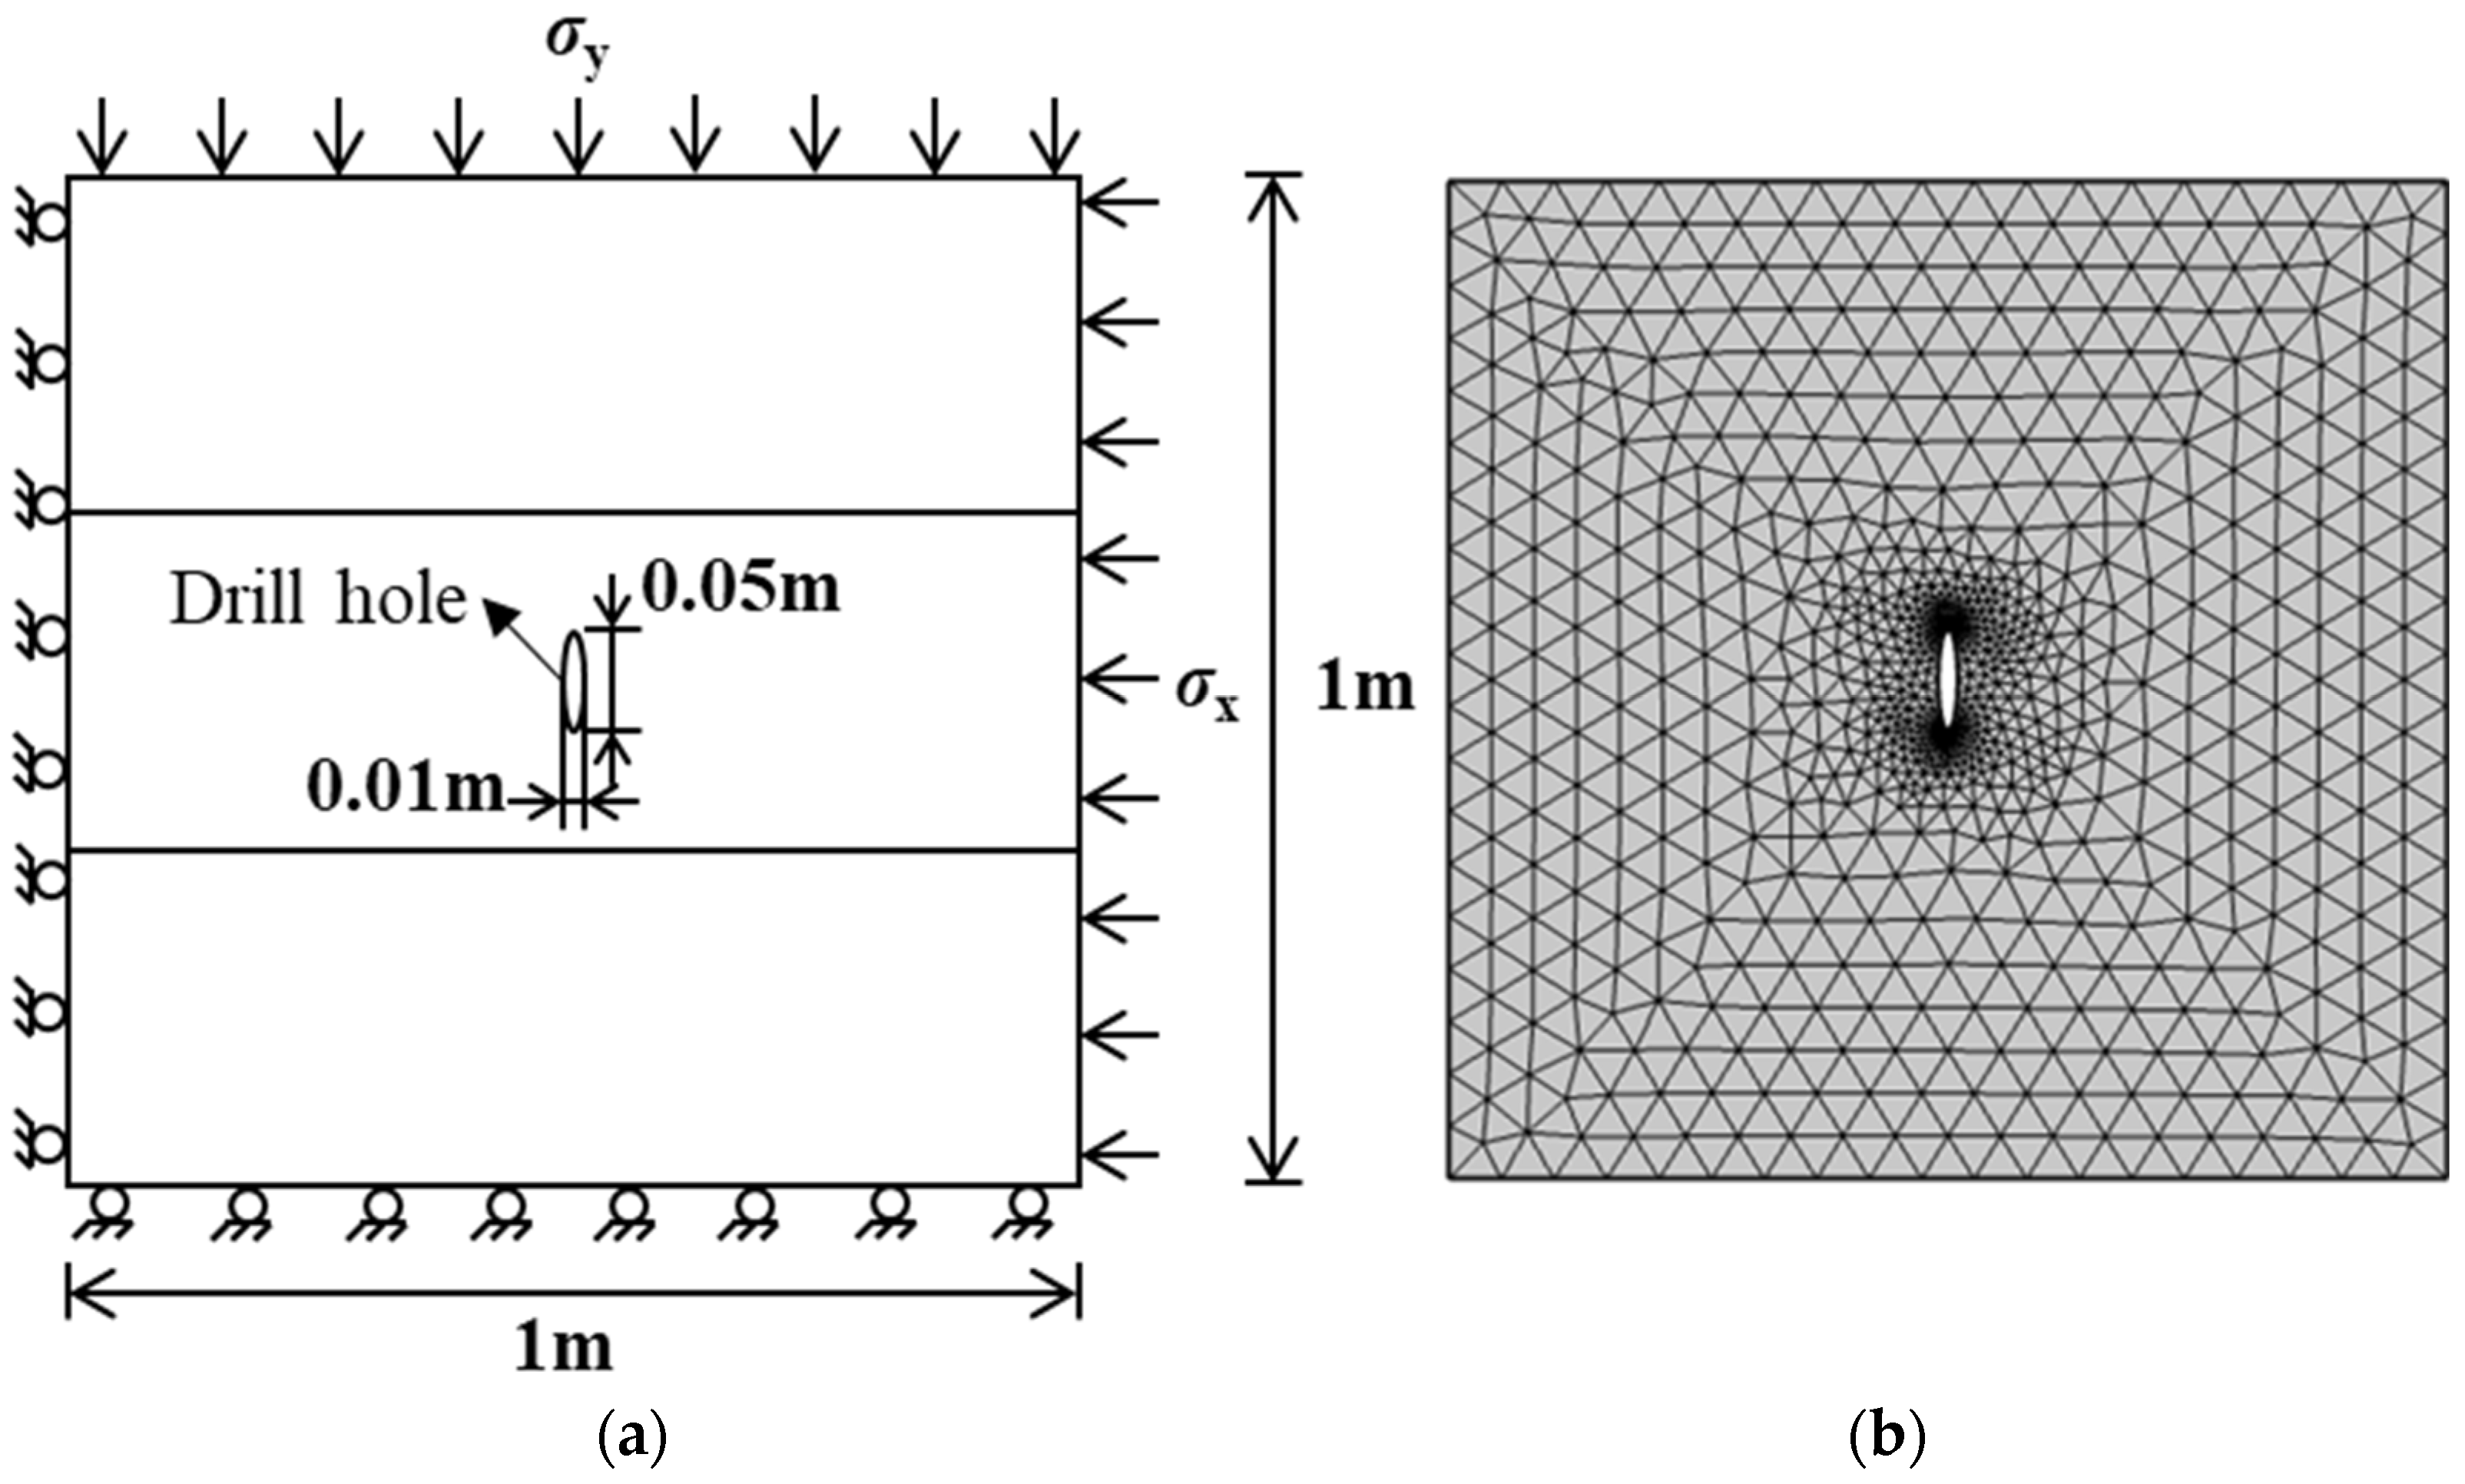
A superimposed reservoir of tight sandstone and coal seams is established: the upper and lower reservoirs are coal seams, and the middle reservoir is tight sandstone. The model is 1 m in square. The thickness of the upper and lower reservoirs is 0.3 m, and the thickness of the middle reservoir is 0.4 m. In combination with horizontal well perforation, the model borehole is shown in Figure 6d, and the vertical fracture caused by perforation is in the red dotted box in Figure 6b.
The model mainly describes the situation when the fracture propagates vertically to the reservoir interface, so the drilling is set as an ellipse with a long axis of 0.05 m and a short axis of 0.01 m, the horizontal in situ stress is σ x = 6 MPa, and the vertical in situ stress σ y = 10 MPa. The fracturing pressure of 2 MPa is applied on the inner wall of the drilling, and the single-step increment is 0.1 MPa. The numerical model is shown in Figure 7.
During hydraulic fracturing, fracturing fluid penetrates the reservoir under injection pressure. The fractures propagation involves physical coupling problems related to mechanical deformation, fluid flow and damage evolution. Combined with previous studies [43,44,45], this model is based on the following assumptions: (1) the sandstone, coal and shale are continuous and heterogeneous porous media and their strain is infinitesimal; (2) both tight sandstone, coal and shale are considered as elastic and isotropic rocks; (3) the water flow in sandstone, coal and shale follows Darcy’s law; (4) during hydraulic fracturing, the water adsorption is not considered; (5) during hydraulic fracturing, the chemical reaction between water and reservoir rock is ignored; (6) the effect of temperature on the whole fracturing process is not considered; (7) different lithologic reservoirs have good cementation at their interface.

2.2.3. Governing Equations of Each Physical Process

If the change of effective stress induced by water pressure is included, the static equilibrium equations for each lithologic reservoir are as follows:
{ G M u i , k k + G M 1 2 v M u k , k i = α M p , i f i G U D u i , k k + G U D 1 2 v U D u k , k i = α U D p , i f i
where GM is the shear modulus of middle reservoir and vM is the Poisson’s ratio of the middle reservoir, GUD is the shear modulus of upper and lower reservoirs and vUD is the Poisson’s ratio of upper and lower reservoirs. α (≤1) is the Biot’s coefficient, α M = 1 K M K s M and α U D = 1 K U D K s U D , where KsM is the skeletal bulk modulus of middle reservoir and K M = 2 G M ( 1 + v M ) 3 ( 1 2 v M ) is the bulk modulus of middle reservoir, KsUD is the skeletal bulk modulus of upper and lower reservoirs and K U D = 2 G U D ( 1 + v U D ) 3 ( 1 2 v U D ) is the bulk modulus of upper and lower reservoirs, ui and fi are the components of displacement and body force in the ith direction, respectively.
If the effect of seepage on the propagation of hydraulic fractures in coal-measure superimposed reservoirs is considered, the seepage equations of fluids in different lithologic reservoirs are described as follows:
{ ϕ M ρ M t + ρ M ϕ M t · ( ρ M k i M μ i p M ) = 0 ϕ U D ρ U D t + ρ U D ϕ M t · ( ρ M k i U D μ i p U D ) = 0
where ϕ M is the porosity of middle reservoir, ϕ U D is the porosity of upper and lower reservoirs, ρ M is the rock density of middle reservoir, ρ U D is the rock density of upper and lower reservoirs, k i M is the permeability of middle reservoir, k i U D is the permeability of upper and lower reservoirs, μ is the dynamic viscosity, i p M is the pore pressure gradient of middle reservoir and i p U D is the pore pressure gradient of the upper and lower reservoirs.

2.2.4. Damage Constitutive Model

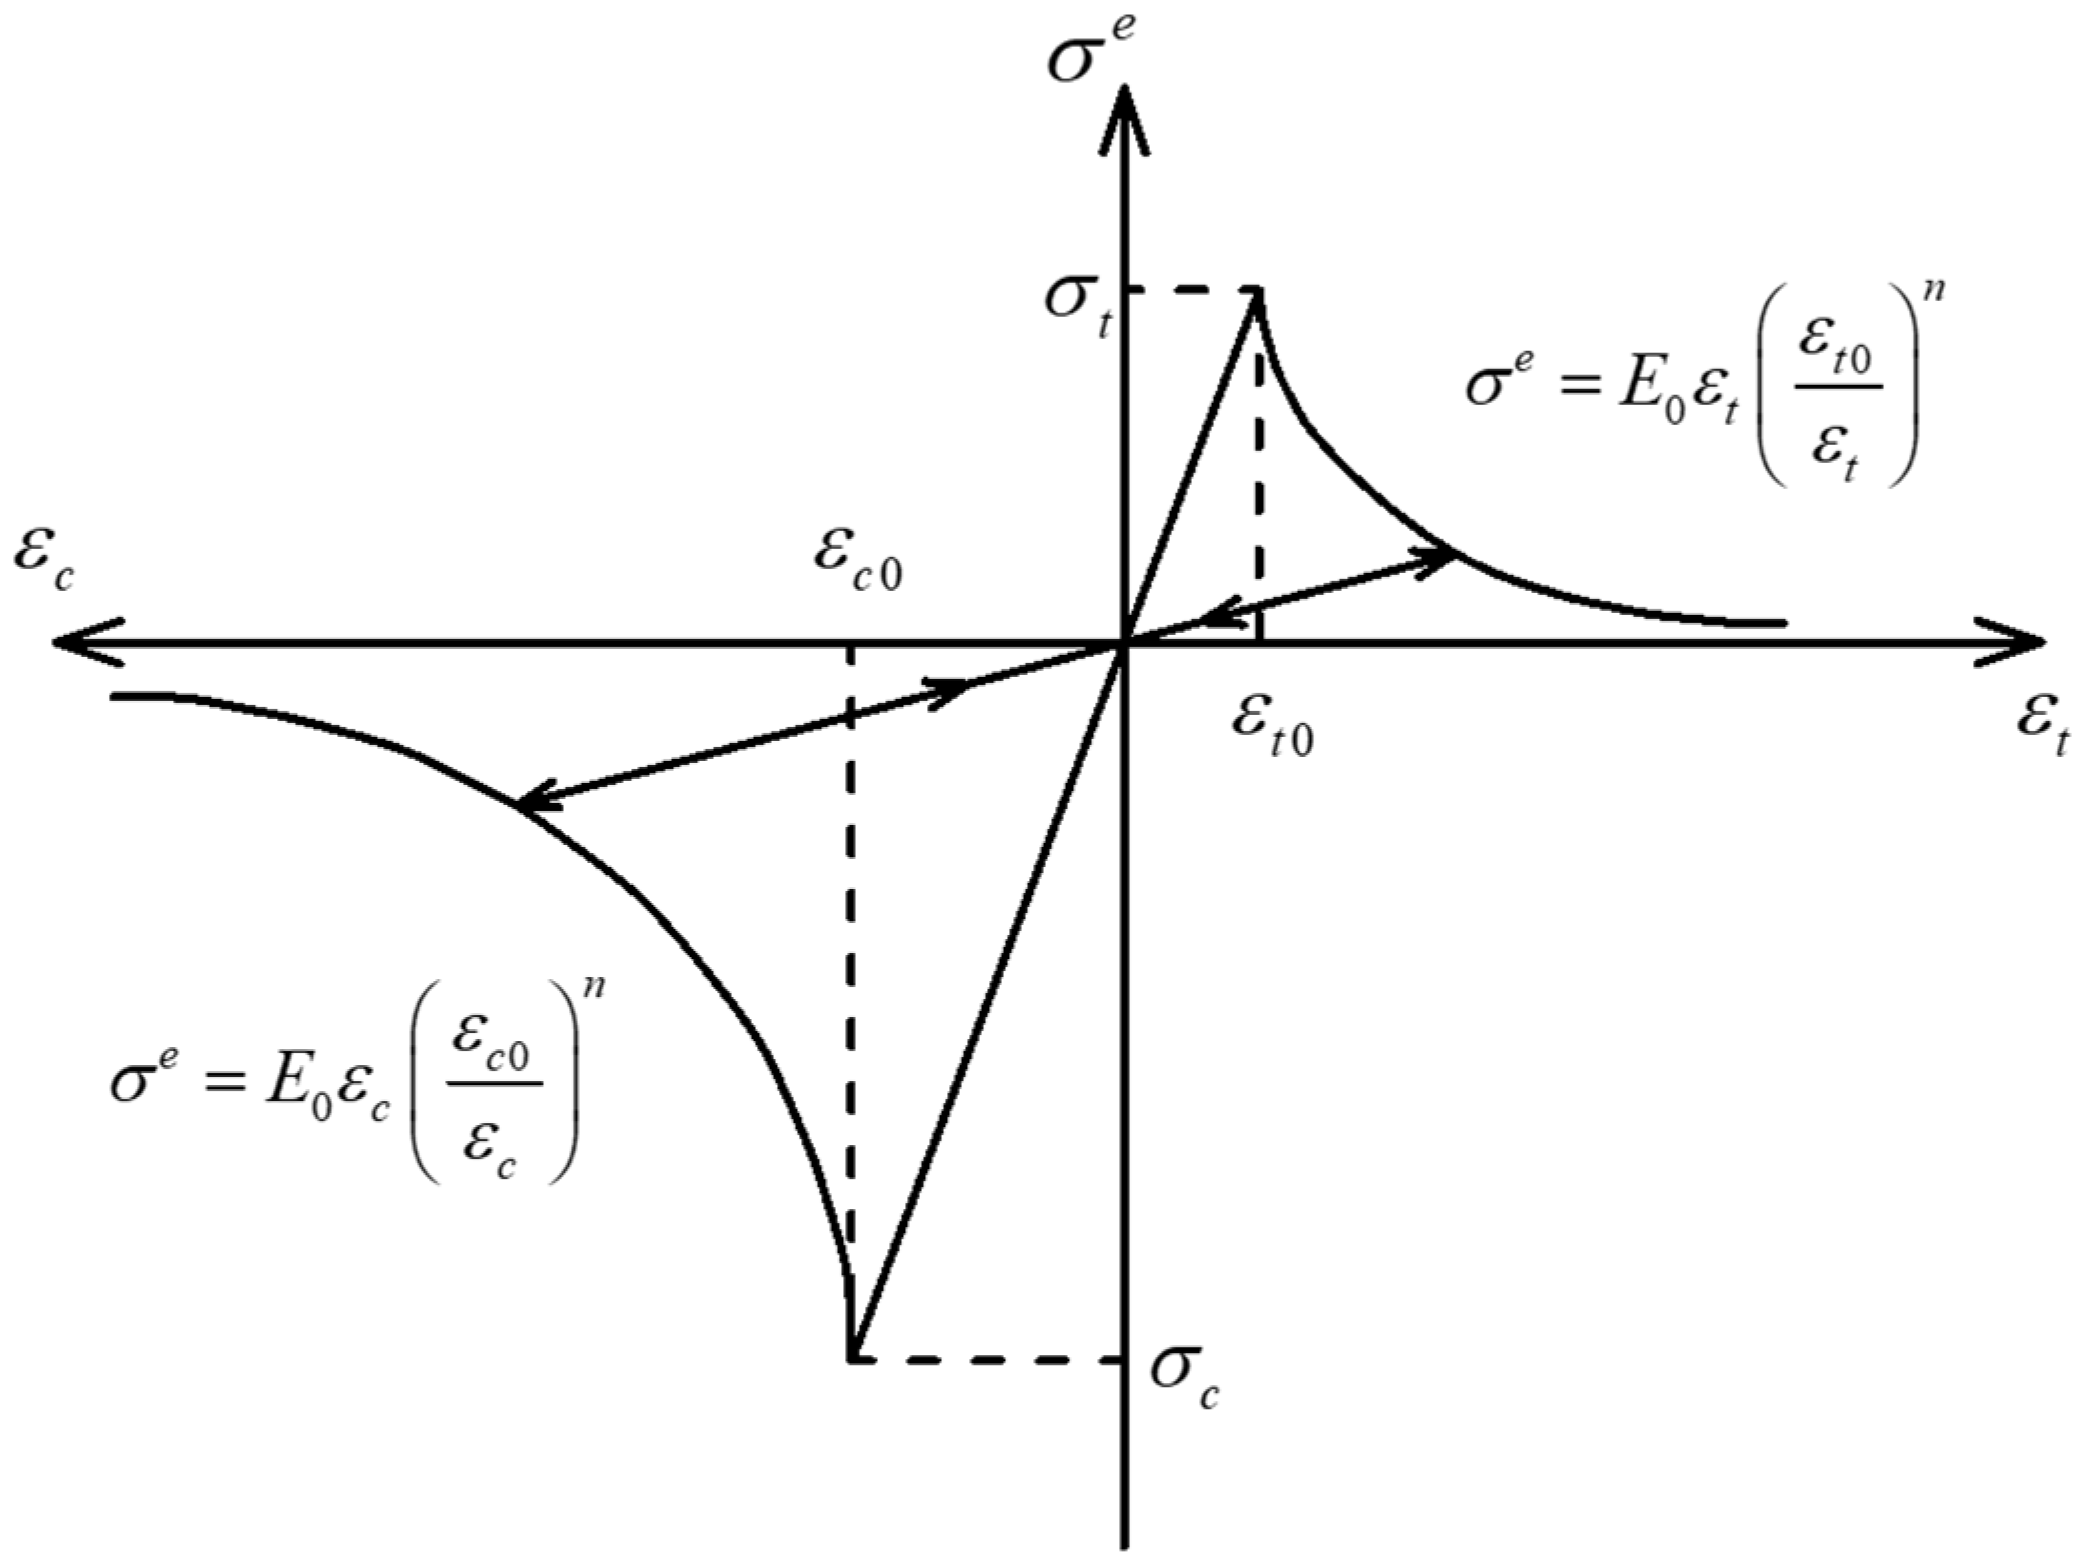
Figure 8 is an elastic damage constitutive curve of rocks. The propagation of fractures is described by the evolution of damage variable [46,47,48]. The maximum tensile stress criterion is used for tensile failure:
F 1 = σ 1 e σ t = 0
where σ 1 e is the first principal effective stress and σ t is the tensile strength.
The tensile damage variable is expressed as
D t = { 0 F 1 < 0   or   Δ F 1 0 ( ε t 0 ε 1 ) n 1 F 1 = 0   and   Δ F 1 = 0
where ε 1 is the first principal strain and ε t 0 is the tensile peak strain, under which the tensile failure occurs.
The Drucker–Prager criterion is used for shear failure:
F 2 = α d p J 1 + J 2 K 3 = 0
where J1 is the first invariant of effective stress tensor and J 1 = σ 1 e + σ 2 e + σ 3 e , J2 is the second invariant of effective stress and J 2 = 1 6 [ ( σ 1 e σ 2 e ) 2 + ( σ 2 e σ 3 e ) 2 + ( σ 1 e σ 3 e ) 2 ] , σ 2 e and σ 3 e are the second and third principal effective stress, respectively; α d p and K3 are the parameters related to stress state, internal friction angle and cohesion, respectively:
α d p = sin φ 3 ( cos θ L 1 3 sin θ L sin φ ) , K 3 = c cos φ cos θ L 1 3 sin θ L sin φ
where φ is the internal friction angle, c is the cohesion, θ L is the Lode angle and θ L = atan 2 σ 2 e σ 1 e σ 3 e 3 ( σ 1 e σ 3 e ) .
Further, the shear damage variable is expressed as
D s = { 0 F 2 < 0   or   Δ F 2 0 1 ( ε c 0 ε 3 ) n F 2 = 0   and   Δ F 2 = 0
where ε 3 is the third principal strain and ε c 0 is the compressive peak strain where the compressive failure occurs.
From Equations (52) and (55), the tensile damage variable is negative, and the shear damage variable is positive. Here, the sign is only related to the damage type, not the damage extent. As shown in Figure 7, the stress is positive in tension. Before the stress reaches the peak value, the stress–strain curve is a straight line, the rock does not damage, the damage variable is 0 and the mechanical parameters remain unchanged. After the stress reaches the peak value, the stress–strain curve can be expressed in a power function. At this time, the rock is damaged, the damage increases with loading and the mechanical parameters change accordingly.

2.2.5. Effect of Rock Damage on Elastic Modulus and Permeability

The damage variable can reflect the failure mode of each node. The elastic modulus of rock changes with damage variable as
{ E M = E M 0 ( 1 D ) E U D = E U D 0 ( 1 D )
where EM and EM0 are the elastic modulus of the damaged and undamaged middle reservoirs, respectively, EUD is the elastic modulus of the damaged upper and lower reservoirs and EUD0 is the elastic modulus of the undamaged upper and lower reservoirs.
The permeability of different lithology reservoirs changes with the damage as
{ k M k M 0 = ( ϕ M ϕ M 0 ) 3 exp ( α D D ) k U D k U D 0 = ( ϕ U D ϕ U D 0 ) 3 exp ( α D D ) ,
where kM0 is the initial permeability of the undamaged middle reservoirs, ϕ M 0 is the initial porosity of the undamaged middle reservoirs, kUD0 is the initial permeability of the undamaged upper and lower reservoirs, ϕ U D 0 is the initial porosity of the undamaged upper and lower reservoirs and αD is an amplification factor to indicate the effect of damage on the permeability.
A reservoir is divided into multiple mesoscopic units to characterize its heterogeneity. The mechanical parameters on each unit obey Weibull distribution as
w ( α ) = m α 0 ( α α 0 ) m 1 exp ( α α 0 ) m ,
where α is the elastic modulus, α0 is the scale parameter, which is the average value of elastic modulus, and m is the shape parameter to characterize the heterogeneity of reservoir.

2.2.6. Implementation of Seepage-Mechanical-Damage Numerical Model and Parameters

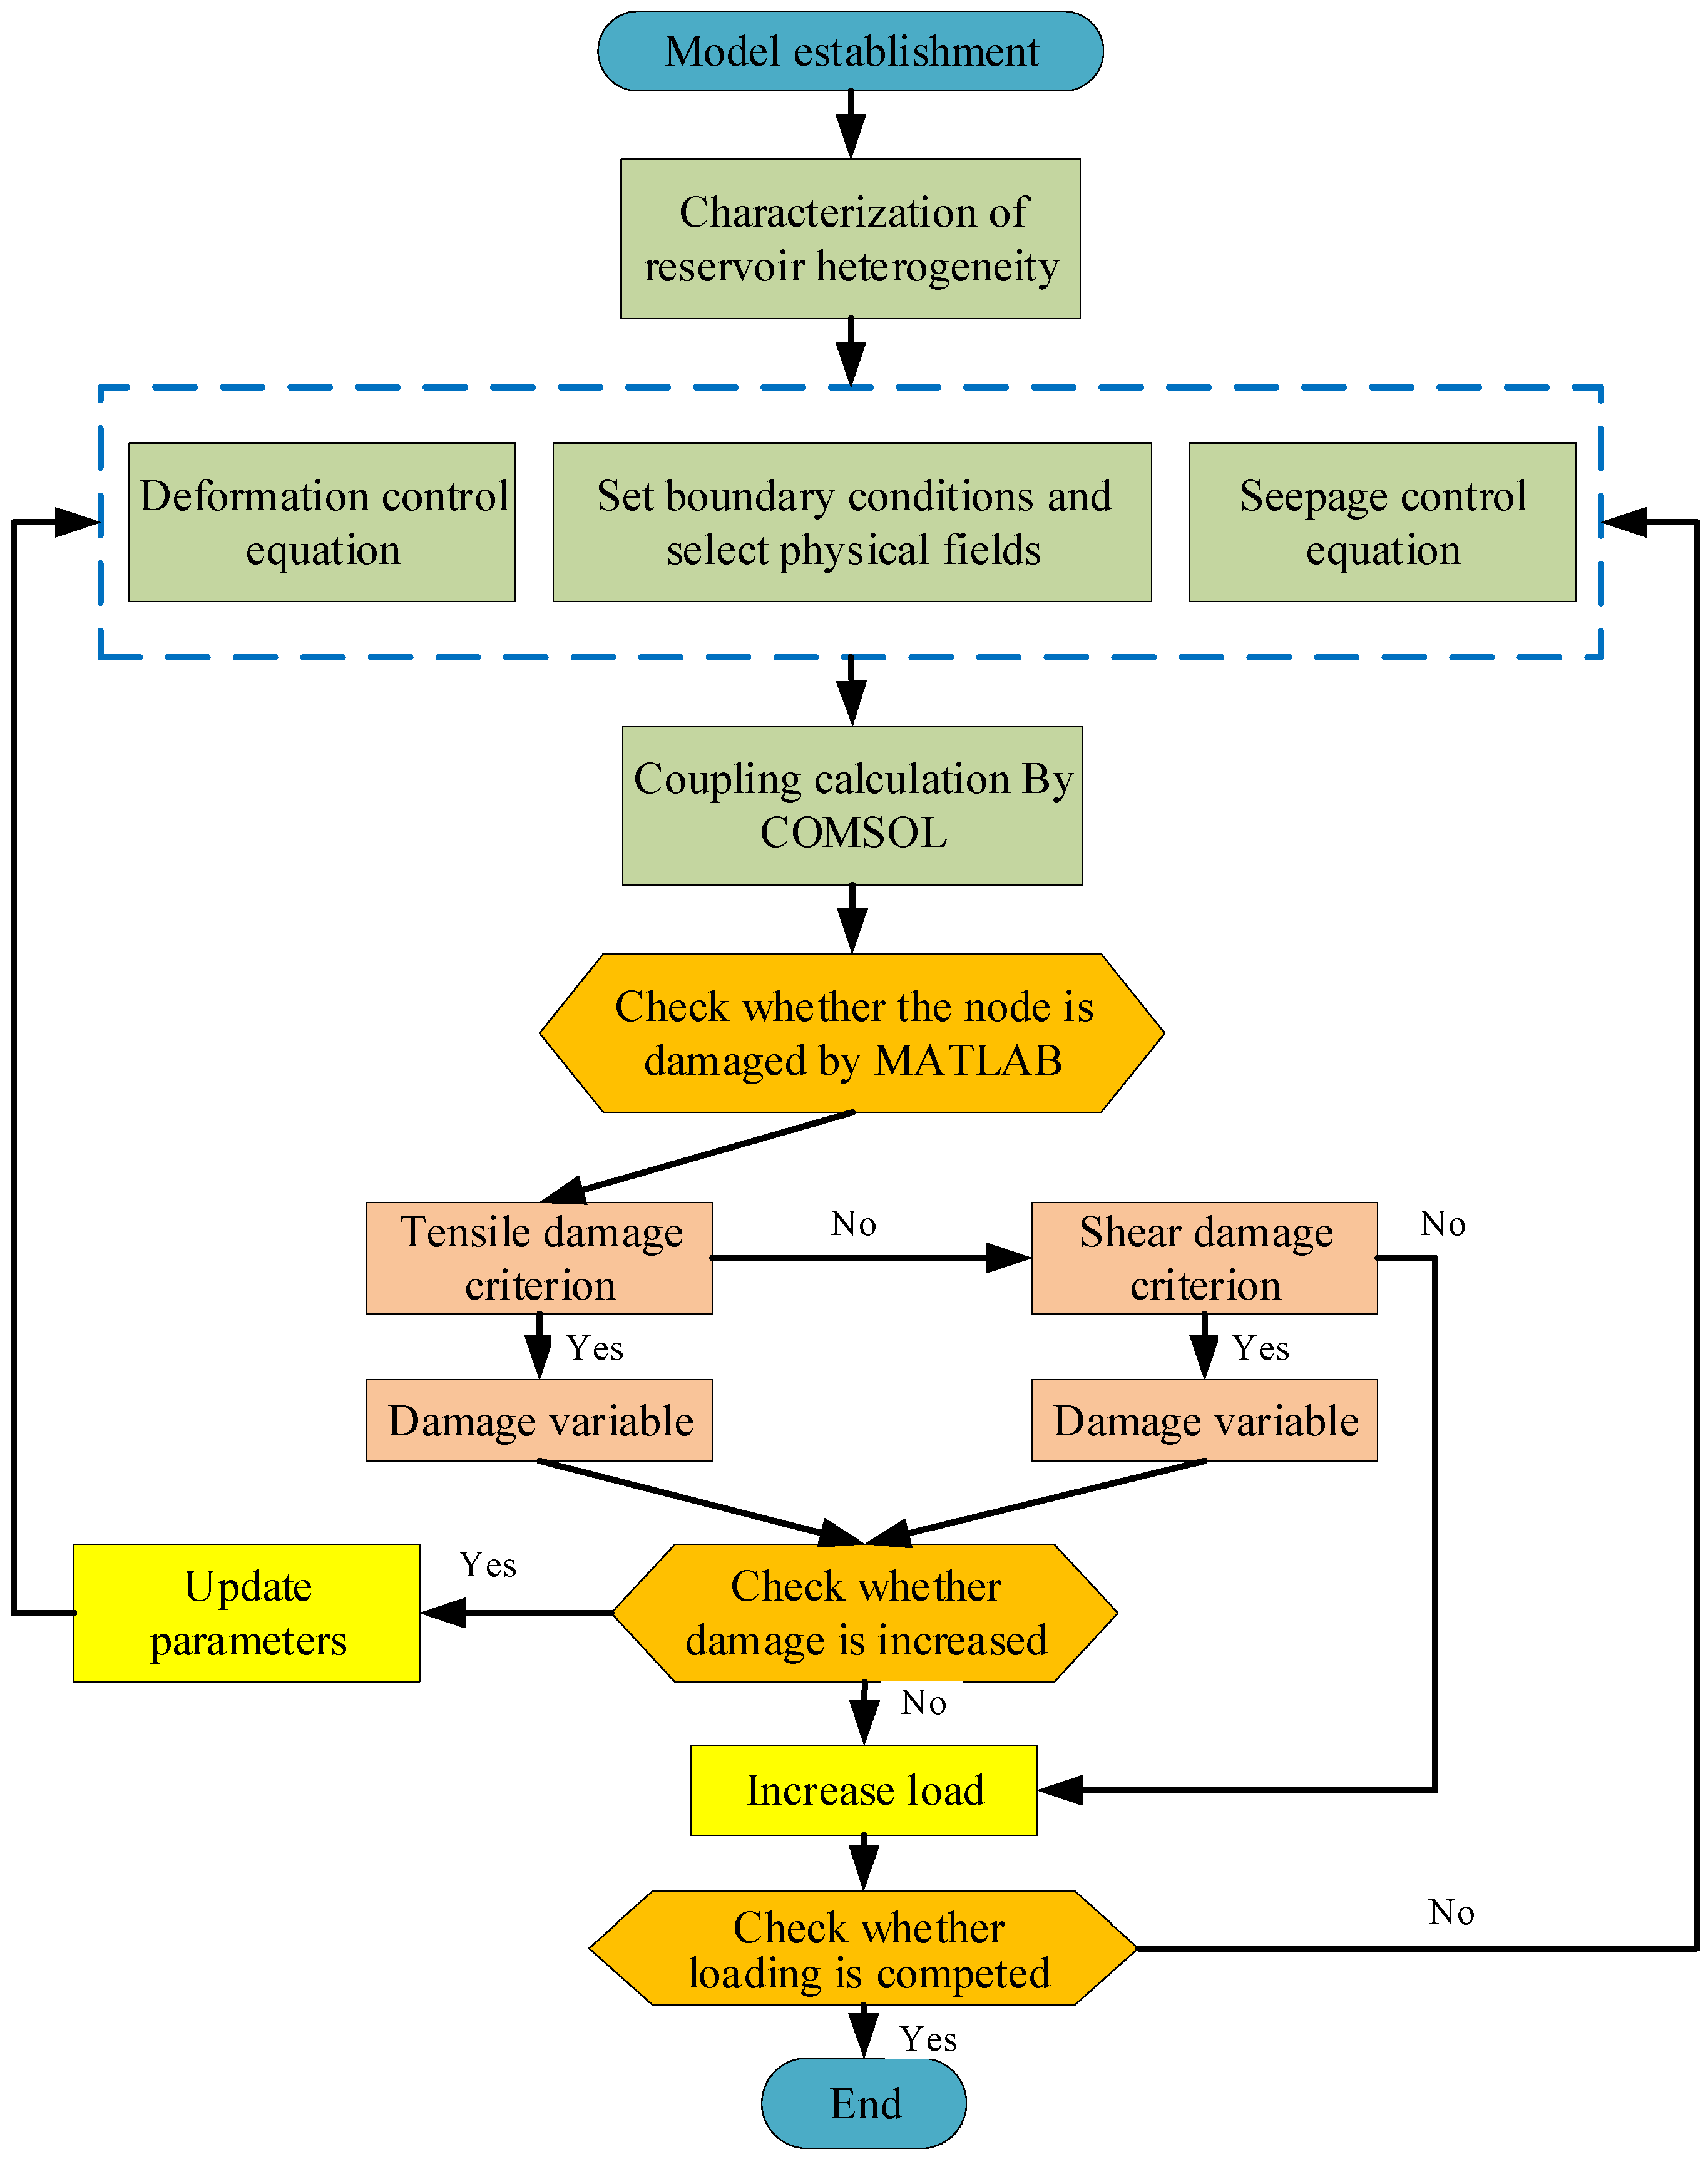
The governing equations for water flow, mechanical deformation and the damage evolution formulate a seepage-mechanical-damage numerical model. The damage units form a fracture network. This numerical model was used to investigate the fracture propagation during hydraulic fracturing and simulate the fracture propagation process through COMSOL with MATLAB platform. The seepage equation is realized by “PDE” module, and the deformation equation is implemented in the “solid mechanics” module. The identification of damage and the update of the damage variable are conducted with MATLAB. The numerical simulation results are used to judge the occurrence of damage at each position. The computational scheme is shown in Figure 9 and summarized as follows: (1) each node is assigned the parameter value according to the Weibull distribution to characterize heterogeneity; (2) the coupling of rock deformation and fracturing fluid flow is calculated for given boundary conditions and parameters; (3) the occurrence of damage is judged with the results from step (2); (4) for the occurrence of damage, the parameters are updated and the calculation returns to step (2); (5) if no damage occurs, the load is increased and the boundary conditions are updated. Based on previous experimental study [49,50], the mechanical parameters used in simulations are listed in Table 1.

3. Verification of Numerical Simulation Model

This seepage-mechanical-damage numerical model is verified by three hydraulic fracture experiments on the reservoirs with different lithologies (shale, tight sandstone and coal). The fracture path is compared between the simulation and the experiment to verify the correctness of this numerical model.

3.1. Hydraulic Fracturing of Coal-Measure Shale in the Linxing Area

Tan et al. [51] took the coal-measure shale in the Linxing area in the northeastern Ordos Basin as the research object. They processed the shale into 300 mm × 300 mm × 300 mm cubic samples and used a sand-carrying fluid as fracturing fluid in their self-designed hydraulic fracturing experiment device. The hydraulic fracture morphology was studied. The experiment parameters are shown in Table 2.
In this section, this seepage-mechanical-damage numerical model is verified by these physical experimental results of shale hydraulic fracturing (see Figure 10). Figure 10a–c are the numerical simulation results of shale hydraulic sand fracturing. With the injection of hydraulic fracturing fluids, tensile cracks are initiated at the wellbore and further propagated under the hydraulic pressure to form two main fractures, leading, in the final instance, to specimen failure. Figure 10d shows the corresponding experimental results. The numerical simulation results are in good agreement with the experimental results. The numerical simulation can well reproduce the whole process of crack initiation and propagation. This verifies that this hydraulic fracturing model can well simulate the shale hydraulic fracturing.

3.2. Hydraulic Fracturing of Sandstone in Southern Sichuan Basin

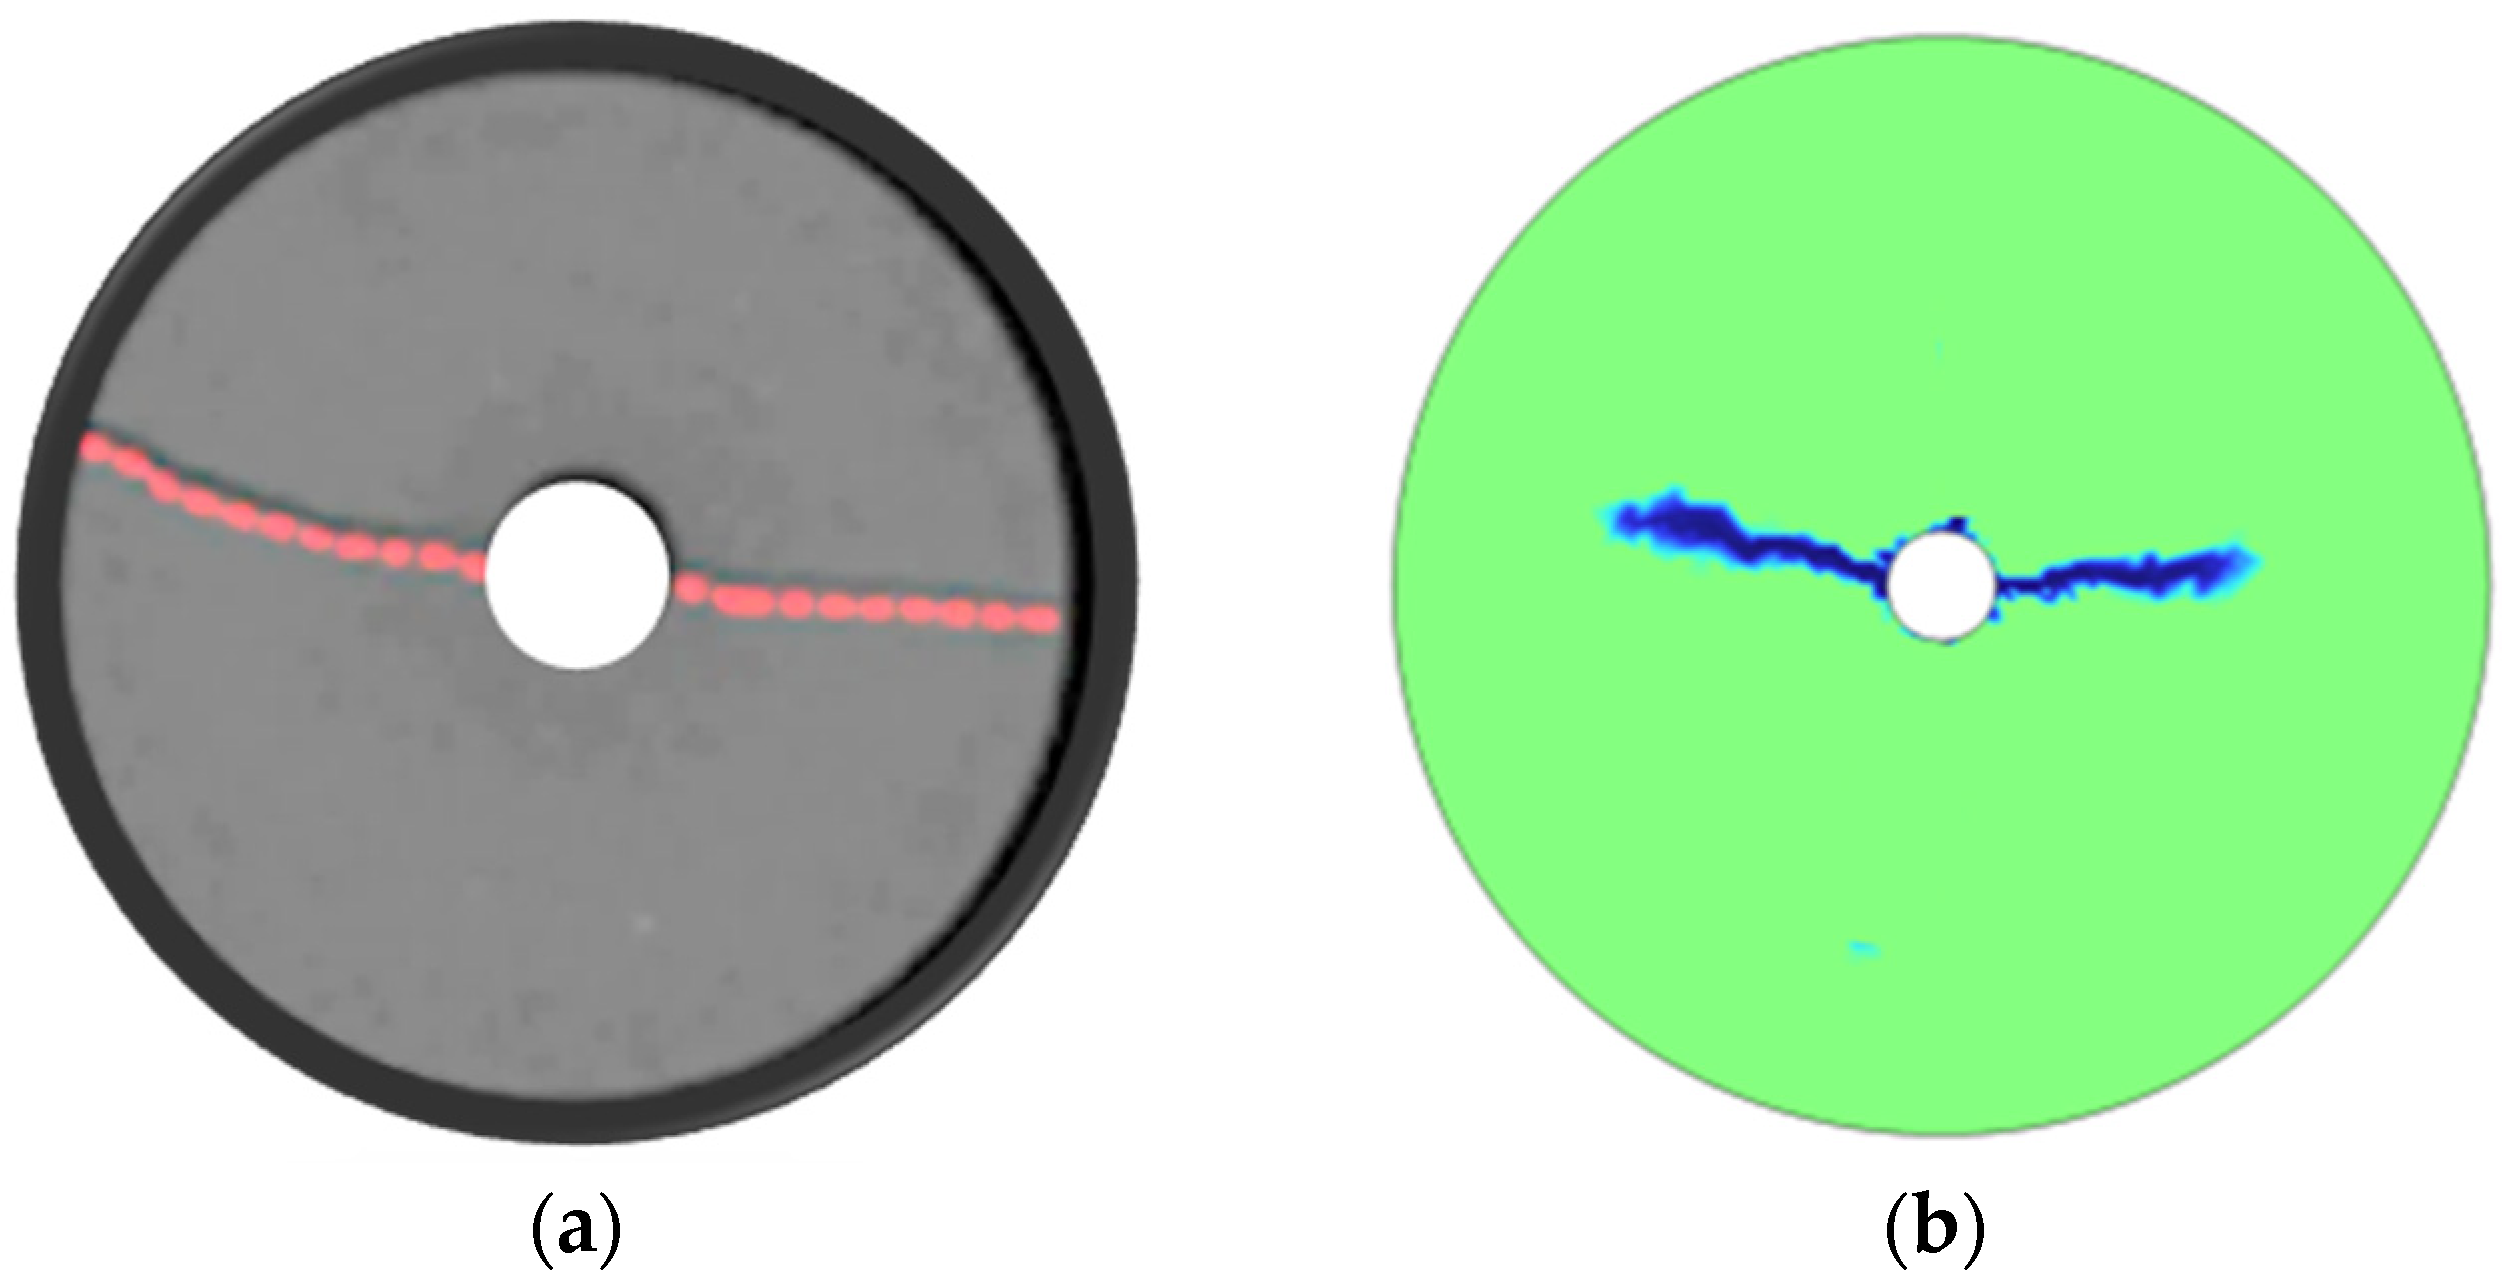
The hydraulic fracturing experiment on sandstone cores in the southern Sichuan Basin was conducted by He et al. [49]. The experiment was carried out using the GCTS RTX-3000 triaxial rock testing system at Tongji University, China, with a confining pressure of 20 MPa. The sample diameter was 50 mm, the height was 90 mm and the drilling hole diameter was 8 mm. The experiment parameters are listed in Table 3. They scanned the fractured samples with X-ray computed tomography (CT) equipment to obtain fracture propagation paths. The experimental result is presented in Figure 11, where the red dotted line represents the hydraulic fracturing fracture. With the injection of fracturing fluid, the fractures start from the wellbore and propagate in a roughly symmetrical path. The numerical simulation result is similar to that in the experiment. This proved that the seepage/mechanical-damage numerical model is suitable for the simulation of hydraulic fracturing in the sandstone reservoir.

3.3. Simulation of Coal Pulse Hydraulic Fracturing

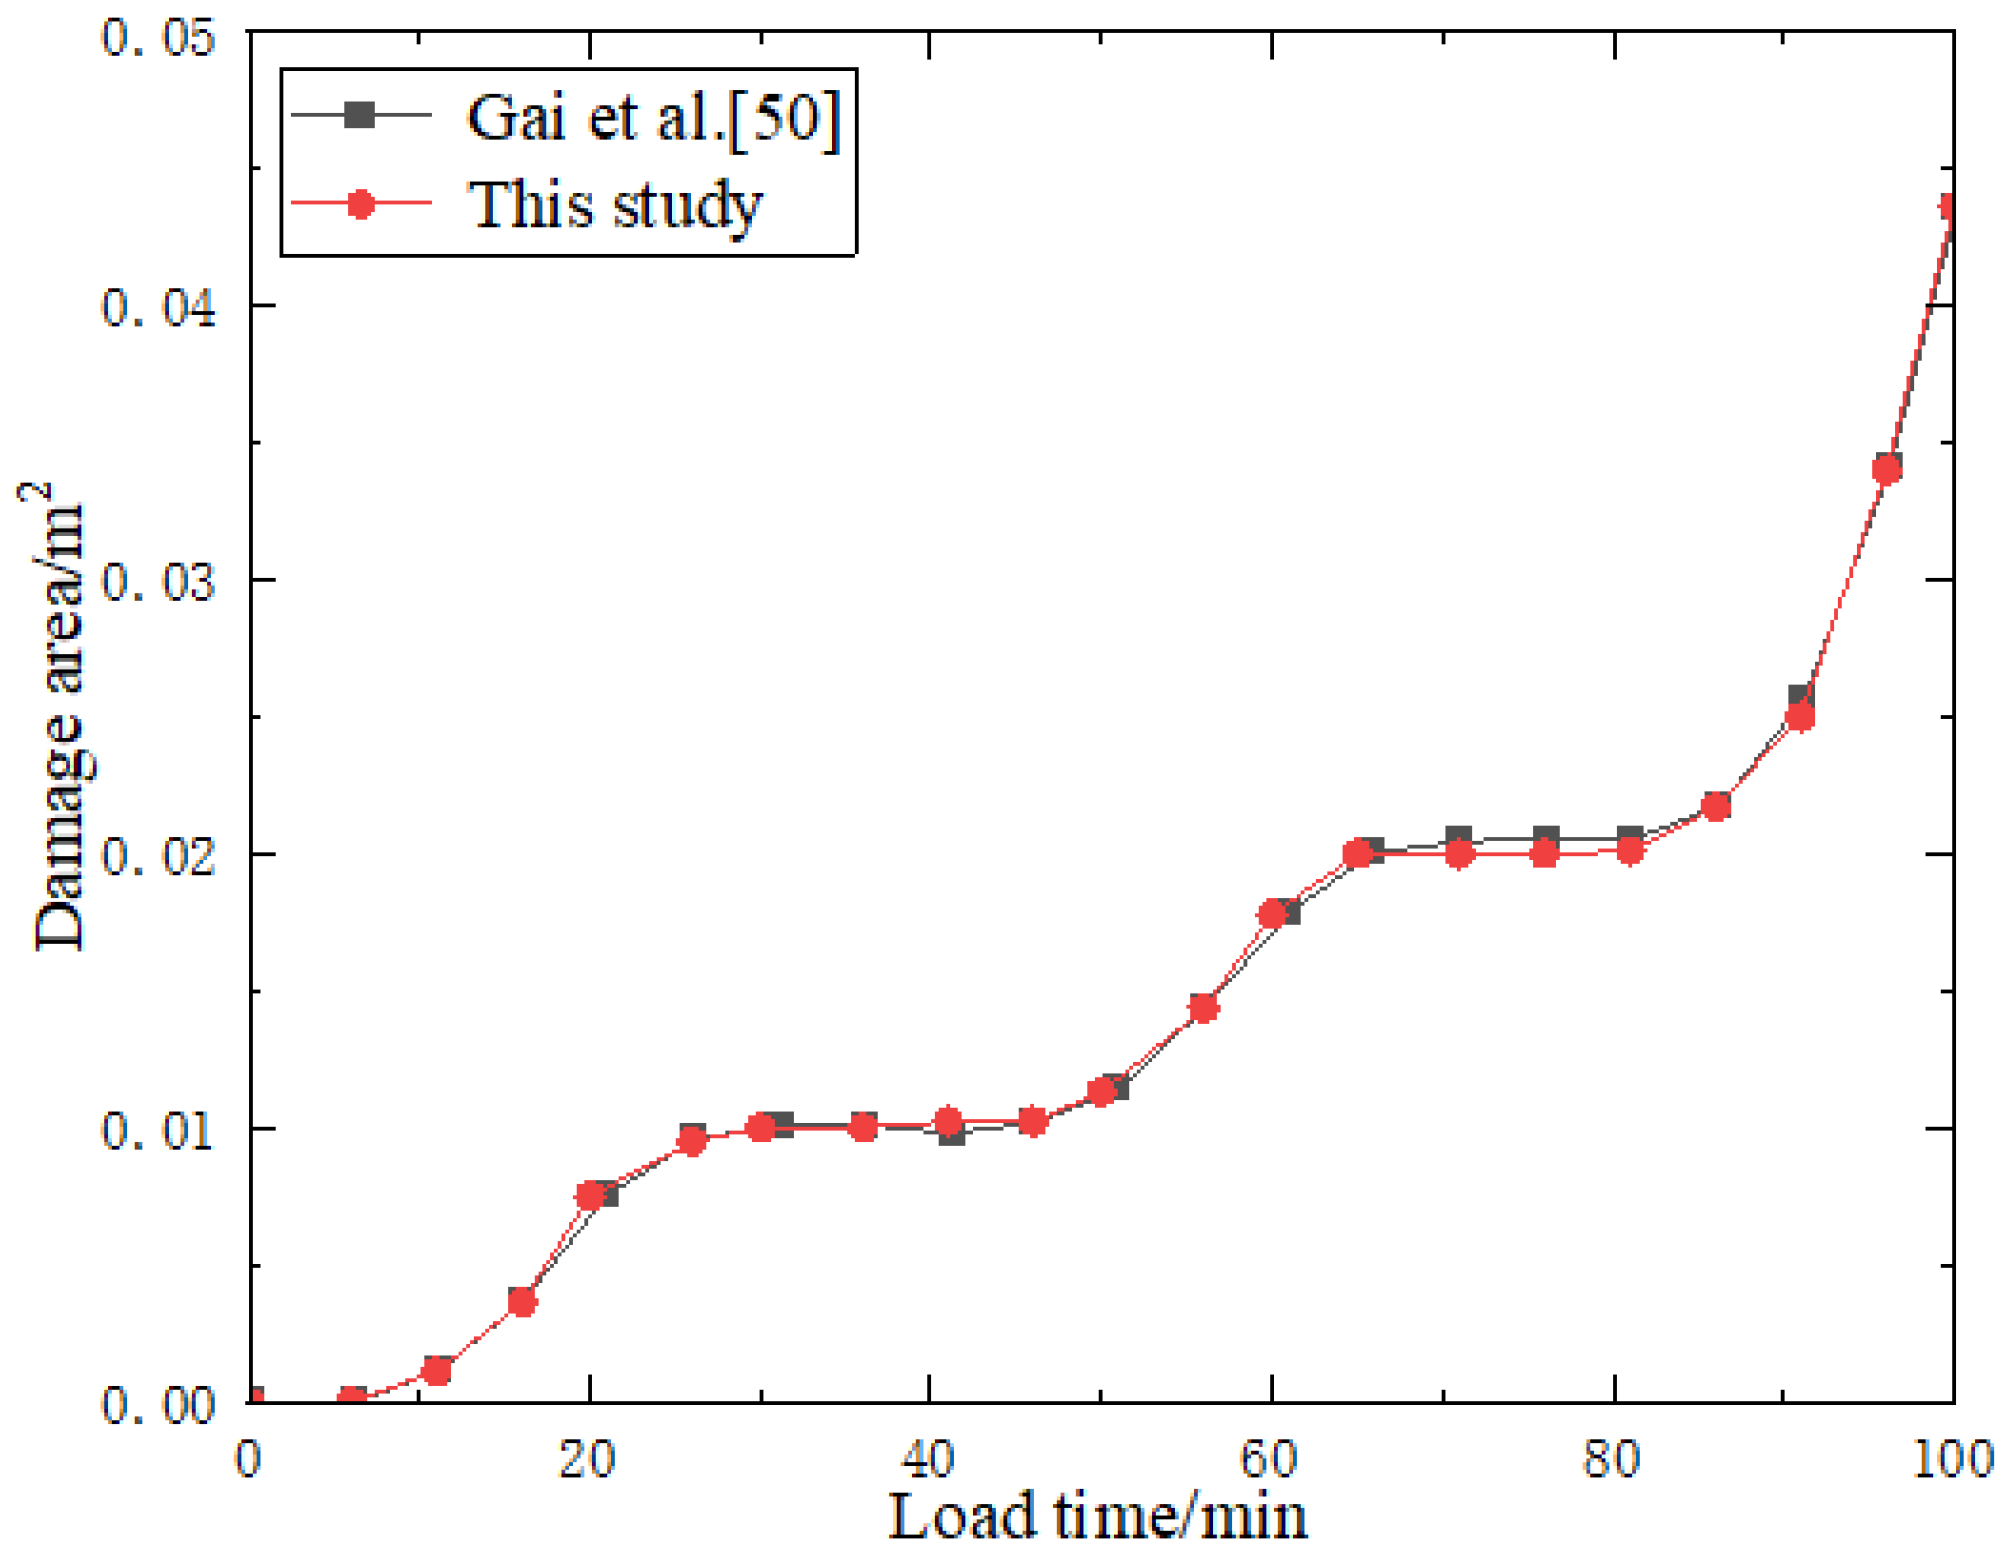
The coal pulse hydraulic fracturing by Gai et al. [51] is used to further verify the seepage/mechanical-damage numerical model in this paper. Based on damage mechanics, Gai et al. [50] established a numerical model for pulse hydraulic fracturing and studied the crack propagation under the pulse fracturing. The model size is 600 mm × 600 mm and the injection hole is 16 mm in diameter. The mechanical parameters used in the numerical simulation are listed in Table 4. Figure 12a–c shows the numerical simulation results. Four main fractures appeared under the pulse fracturing. This is due to the cyclic loading of pulse pressure, which redistributes the internal stress of the rock many times, resulting in the generation of secondary fractures. The development of fractures in this pulse fracturing is more complicated. Figure 12d shows the simulation results obtained by Gai et al. [50]. These two simulation results are in good agreement. The crack initiation and propagation can be reproduced by our numerical model. Figure 13 shows the change of the damage area of the two models under different load times. The damage area (the area formed by damaged node connection) gradually increases with the increase in time, and the damage areas obtained by the two models are similar. This can quantitatively prove the correctness of our numerical model. These indicate that the fracturing model and its numerical solution in this paper are applicable to hydraulic fracturing simulations.

4. Numerical Simulation Results

Three numerical simulation models were established to investigate the influence of the elastic modulus difference between adjacent lithologic reservoirs on the vertical propagation of fractures. These three models were designed according to the combination of lithological characteristics in coal-measure superimposed reservoirs. In Model 1, the middle layer is a tight sandstone, the upper and lower layers are coal and the borehole is located in the tight sandstone layer. In Model 2, the middle layer is coal, the upper and lower layers are tight sandstone and the borehole is in the coal layer. In Model 3, the middle layer is tight sandstone, the upper layer is a high elastic modulus layer, the lower layer is coal and the borehole is located in the tight sandstone layer.

4.1. Fracture Propagation in a Coal-Sandstone–Coal Reservoir

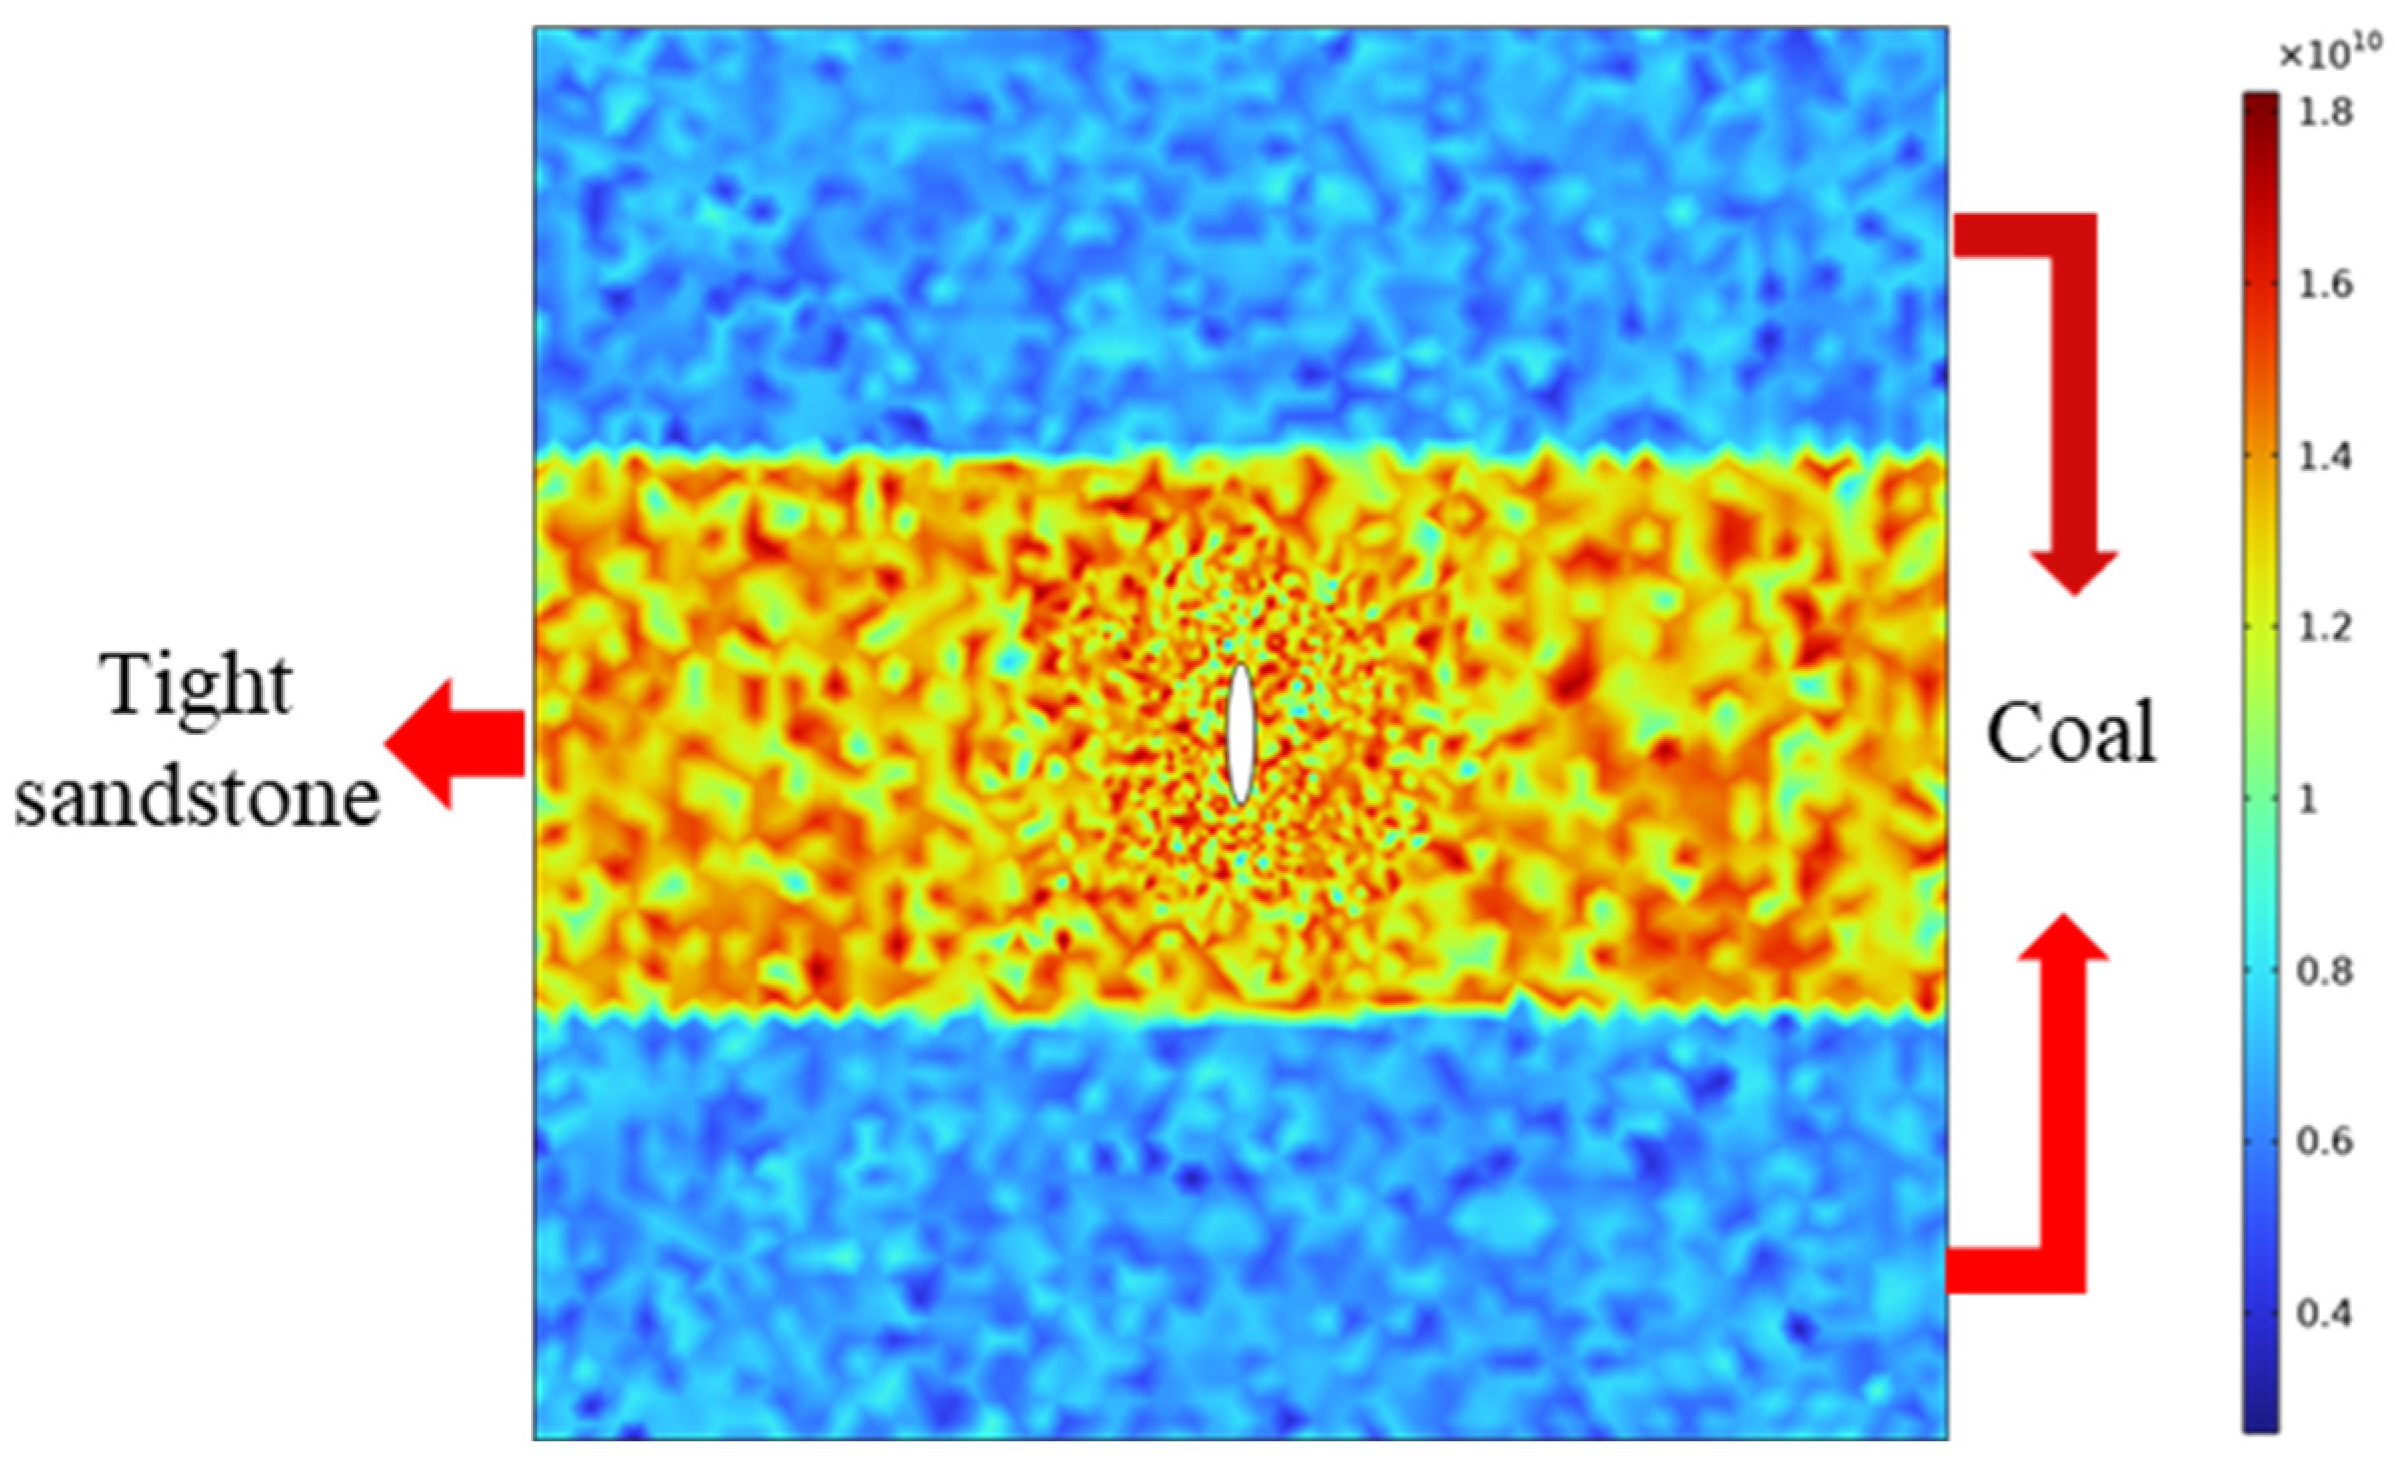
The distribution of elastic modulus in Model 1 is shown in Figure 14. The individual reservoirs are well articulated. Figure 15 shows the fracture propagation during fracturing. Fractures start in the wellbore and gradually propagate vertically. Due to the large elastic modulus of the tight sandstone layer, the crack width is narrow during the fracturing process. When the crack reaches the reservoir interface, it can smoothly enter the coal seam through the reservoir interface. When the fracture passes through the interface and propagates into the coal seam, the fracture width increases significantly. This is because the coal seam has small elastic modulus and low hardness; thus, its resistance to fracturing is small and the fracture width is large.

4.2. Fracture Propagation in a Sandstone–Coal–Sandstone Reservoir

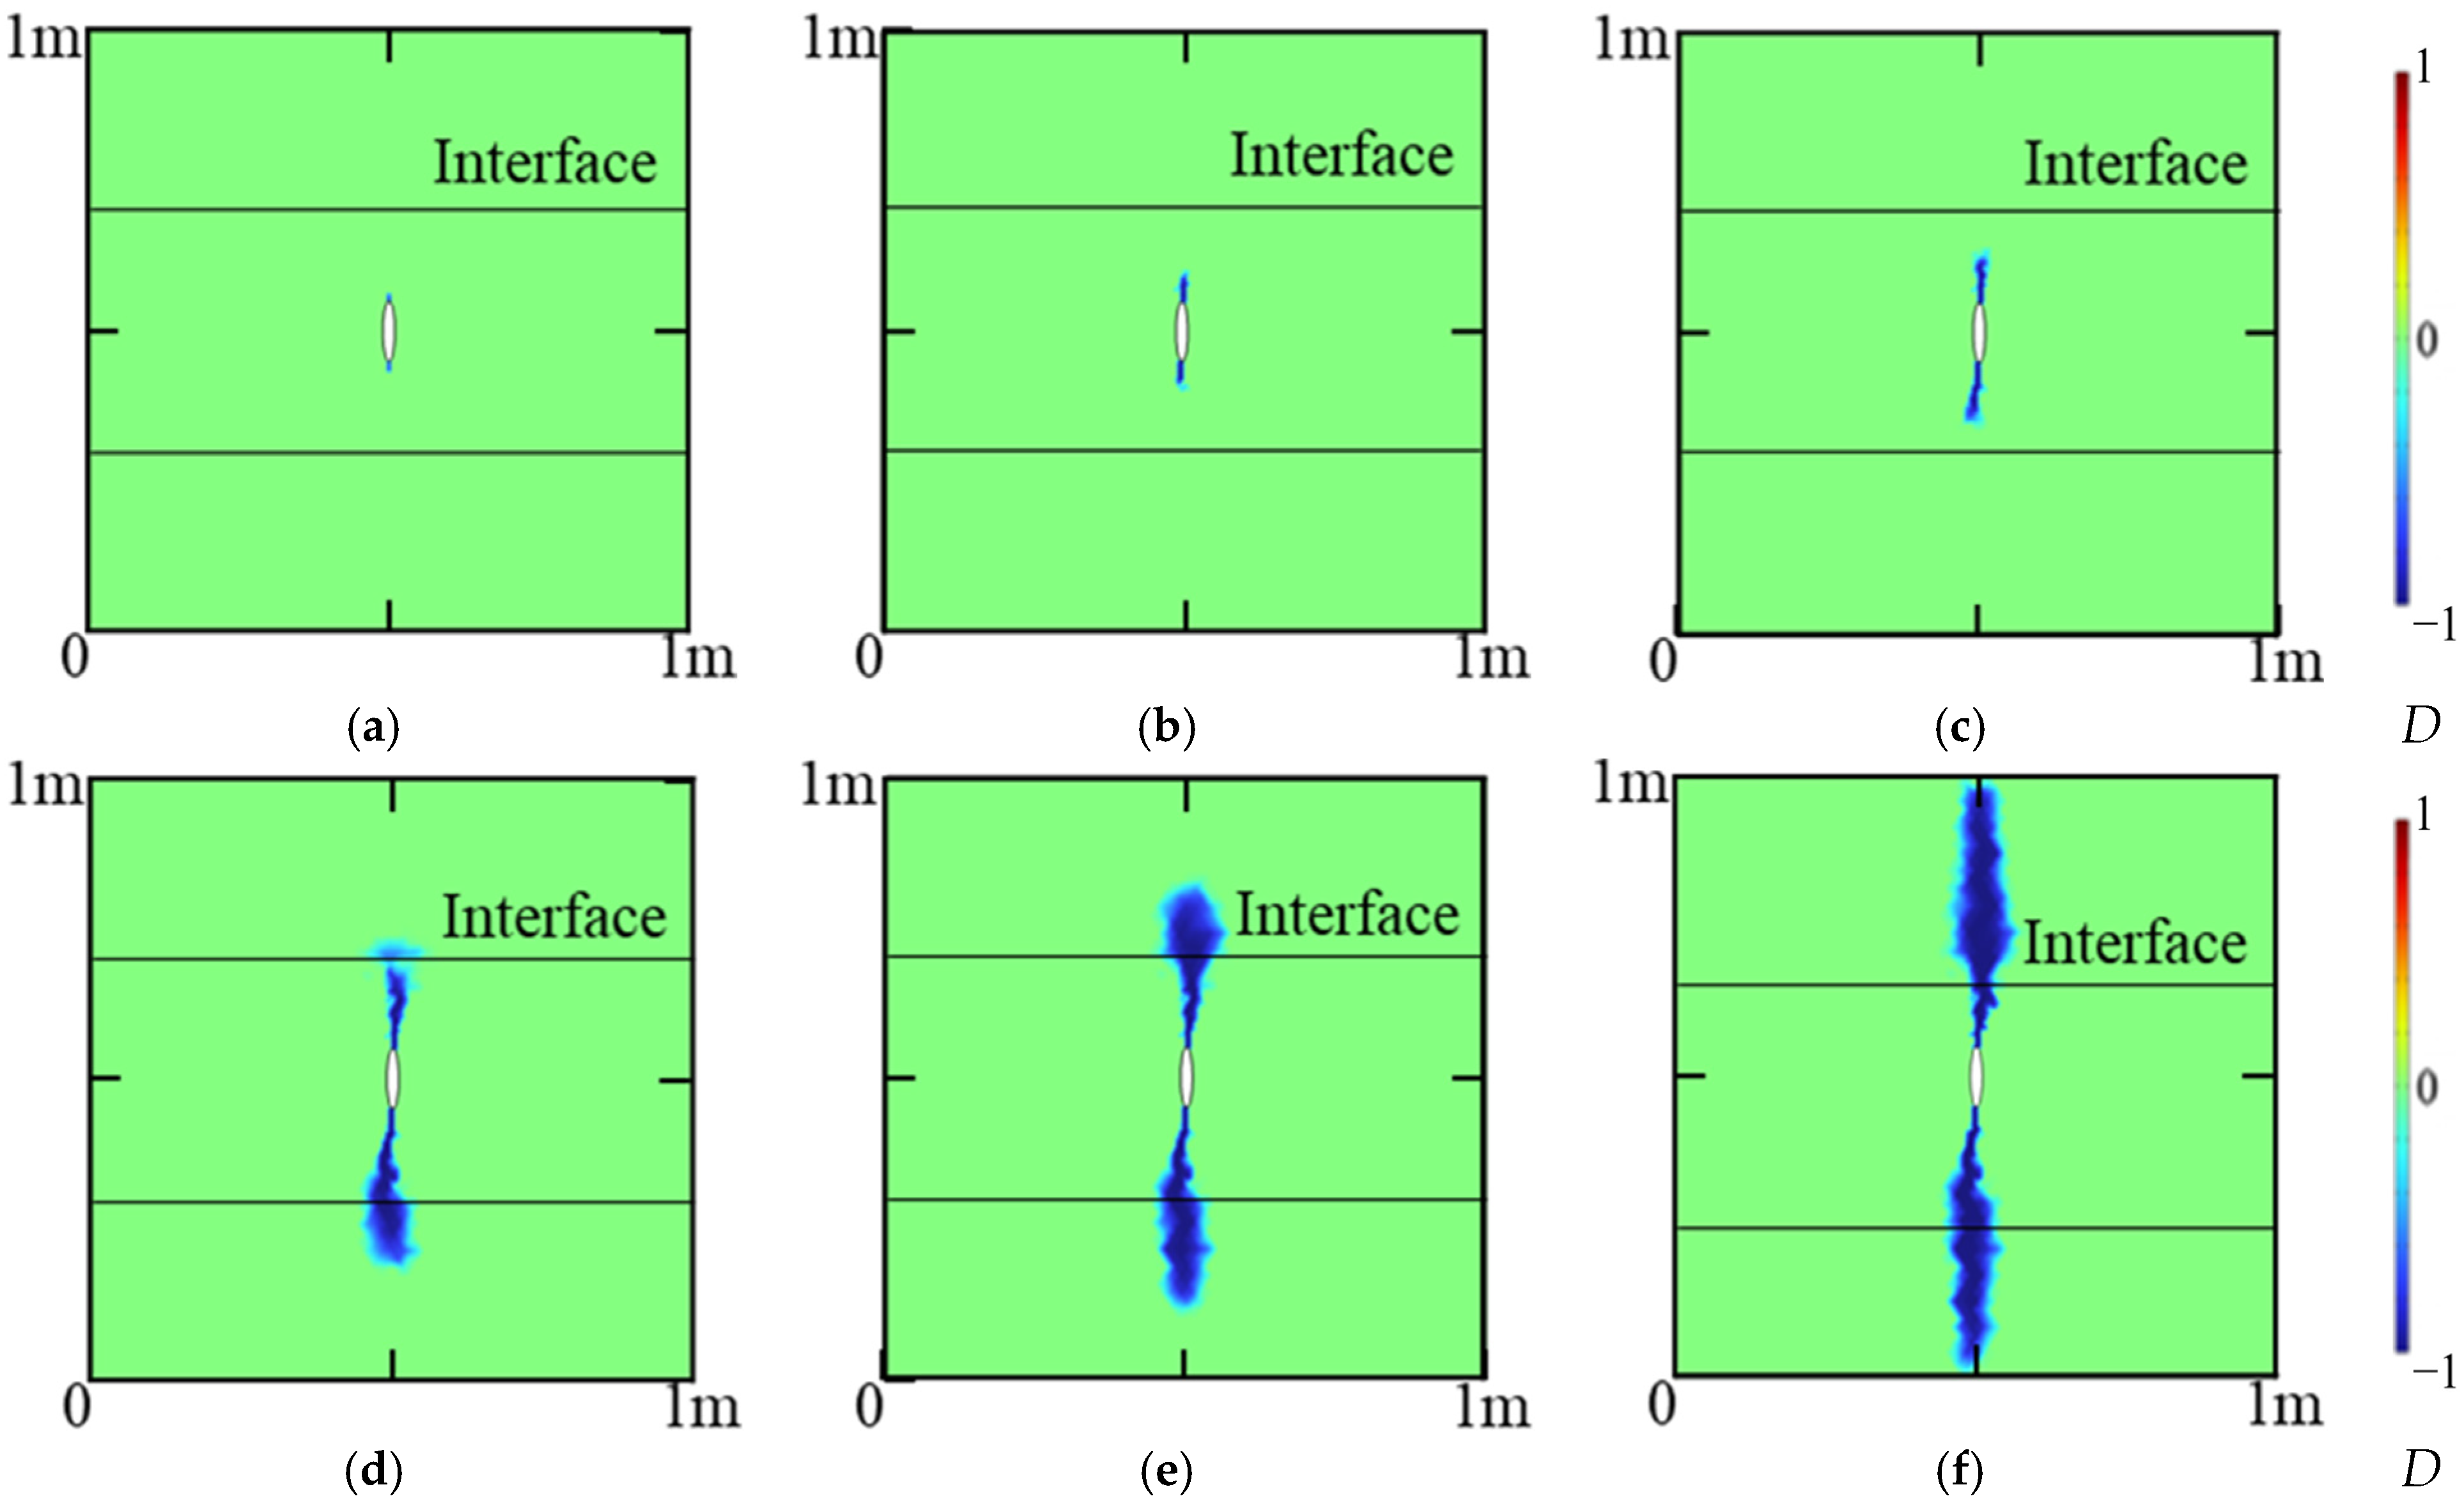
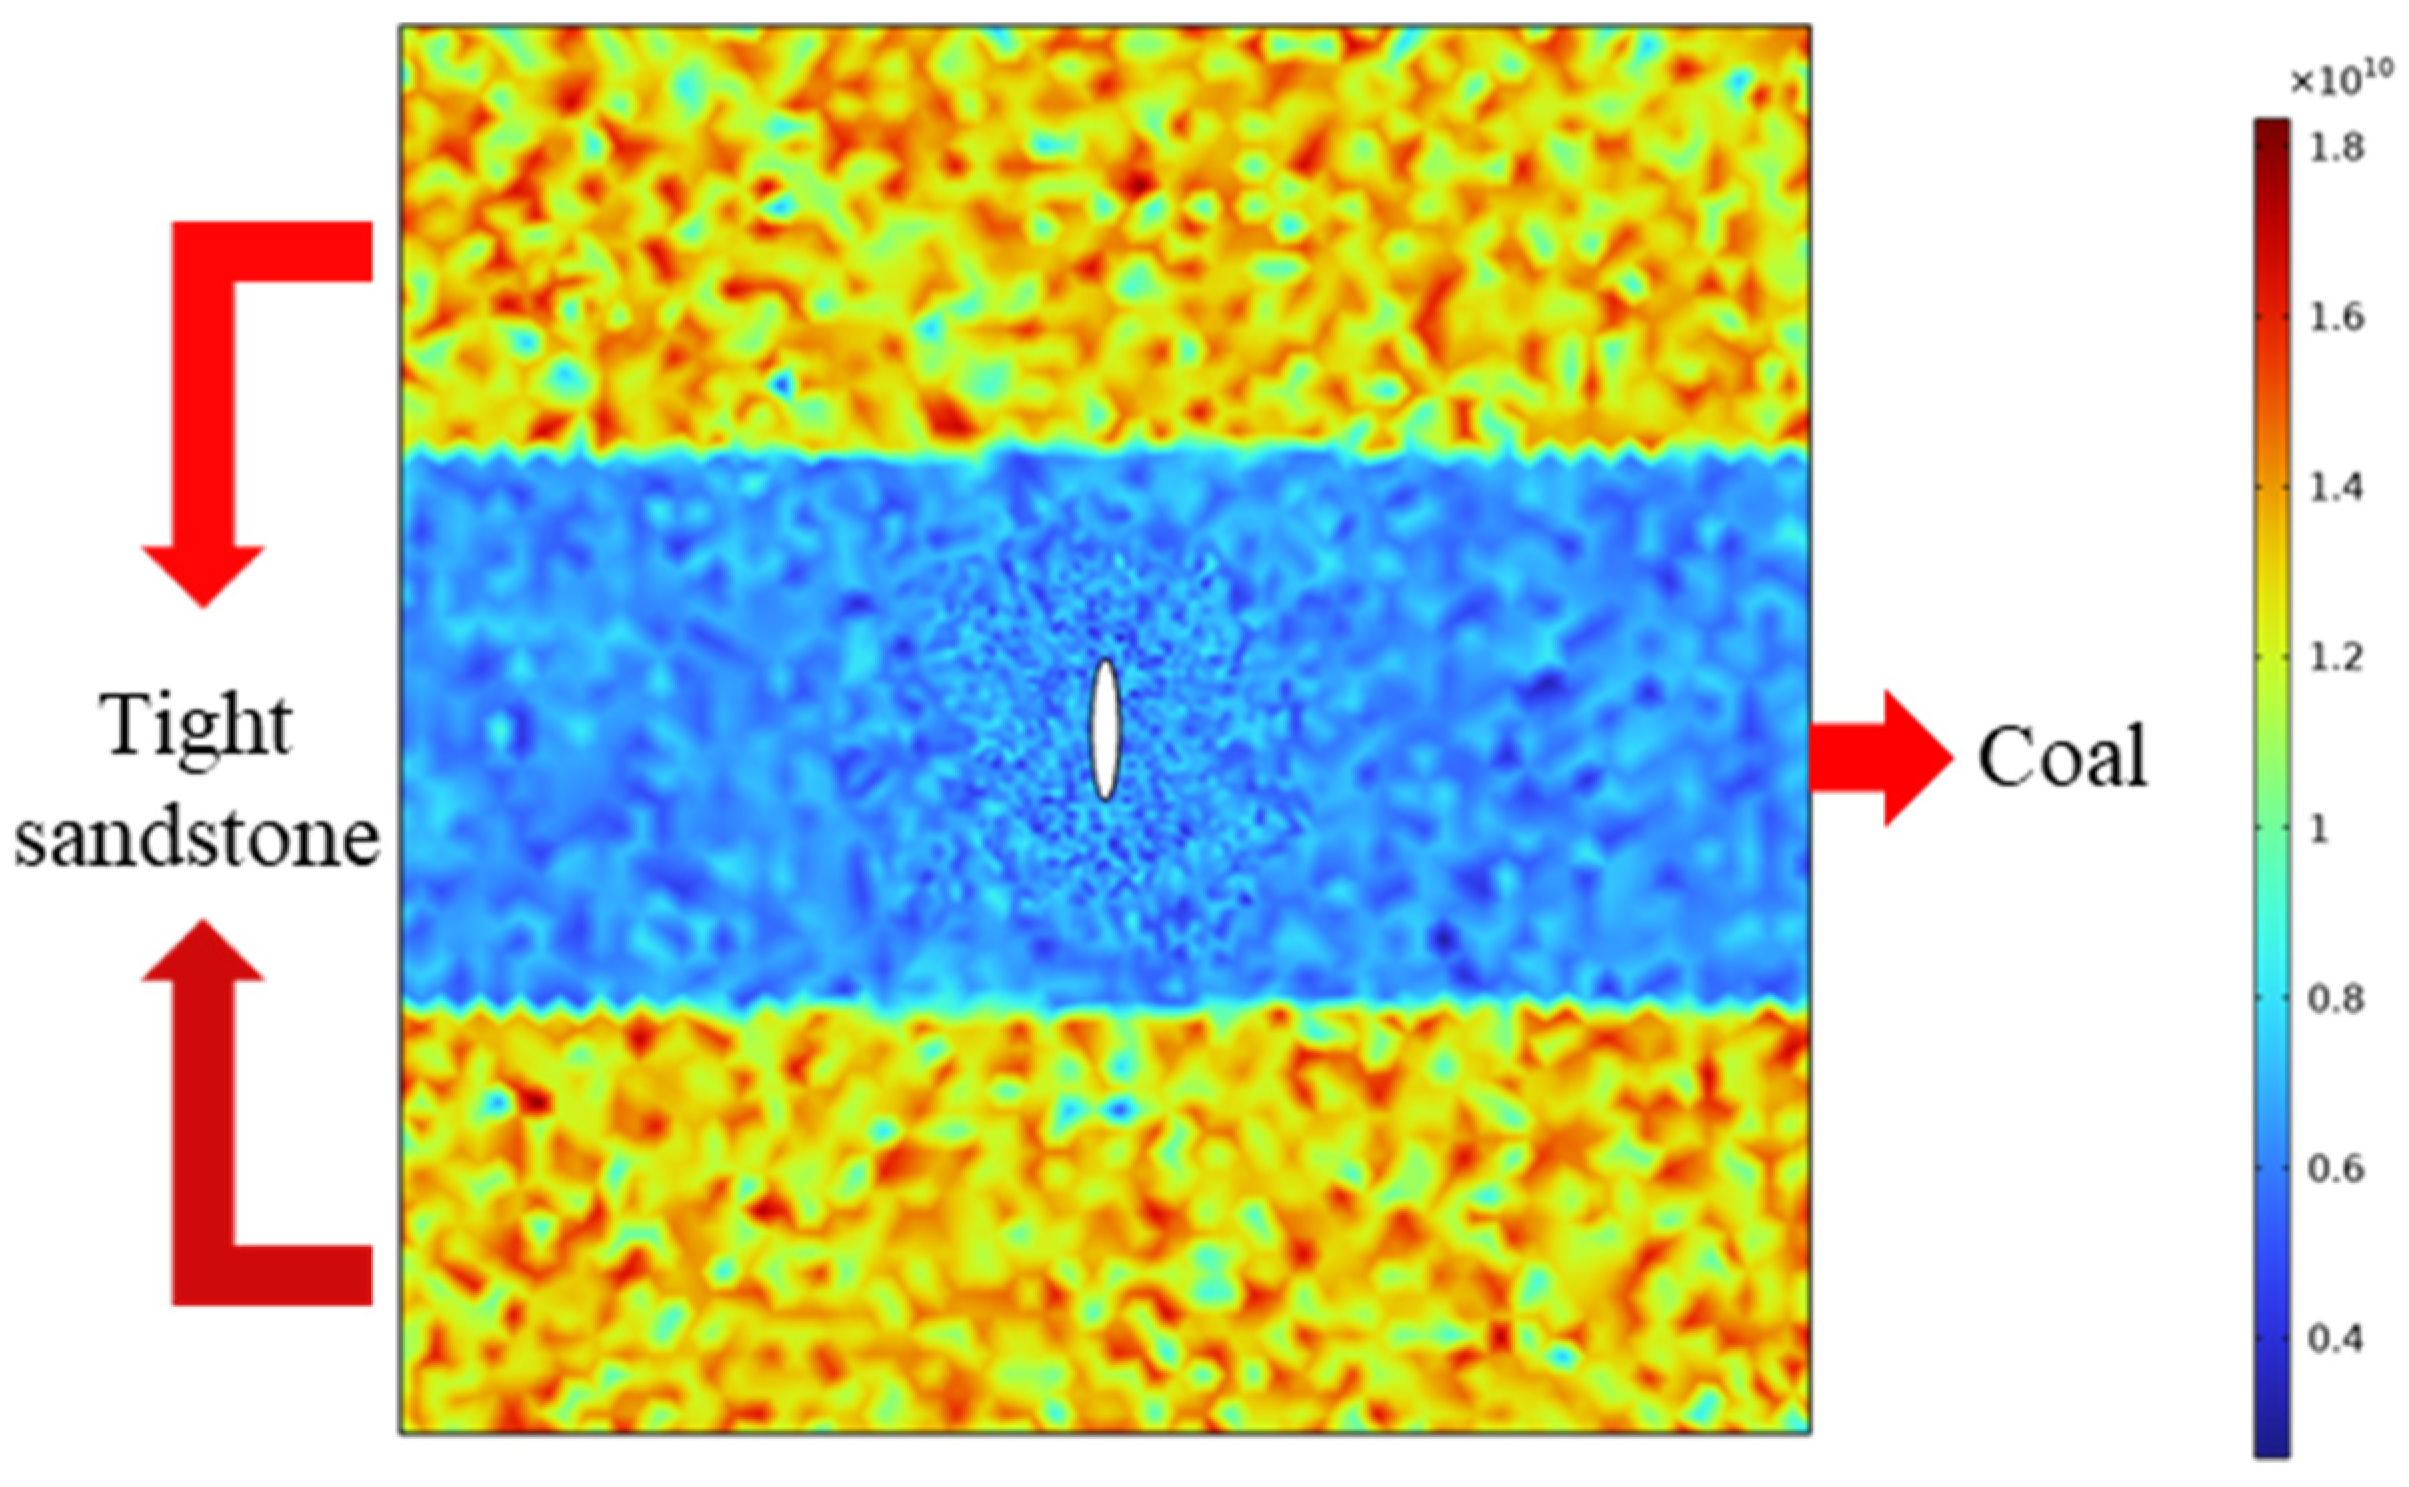
The distribution of elastic modulus in Model 2 is shown in Figure 16. The individual reservoirs are well articulated, and the legend indicates the value range of elastic modulus. Figure 17 shows the fracture propagation when the borehole is in the coal seam, where the rightmost column represents the range of damage variable, −1 represents tensile damage and 1 represents shear damage. Likewise, fractures start at the wellbore and grow vertically with the increase in injection pressure. As the pressure gradually increases, the vertical propagation distance of the crack increases slowly, but the crack width increases gradually, and fracture stops propagating vertically when it reaches the reservoir interface. The fracture bifurcation occurs in this coal seam. This is because the elastic modulus of the coal seam is small. When the cracks propagate in the coal seam, the propagation resistance is small. When the cracks reach the reservoir interface, the resistance of crack propagation suddenly increases; thus, the cracks are difficult to pass through the interface. With the increase in injection pressure, the crack width gradually increases, or bifurcation occurs in the coal seam.

4.3. Fracture Propagation in High Elastic Modulus Rock-Sandstone–coal Reservoirs

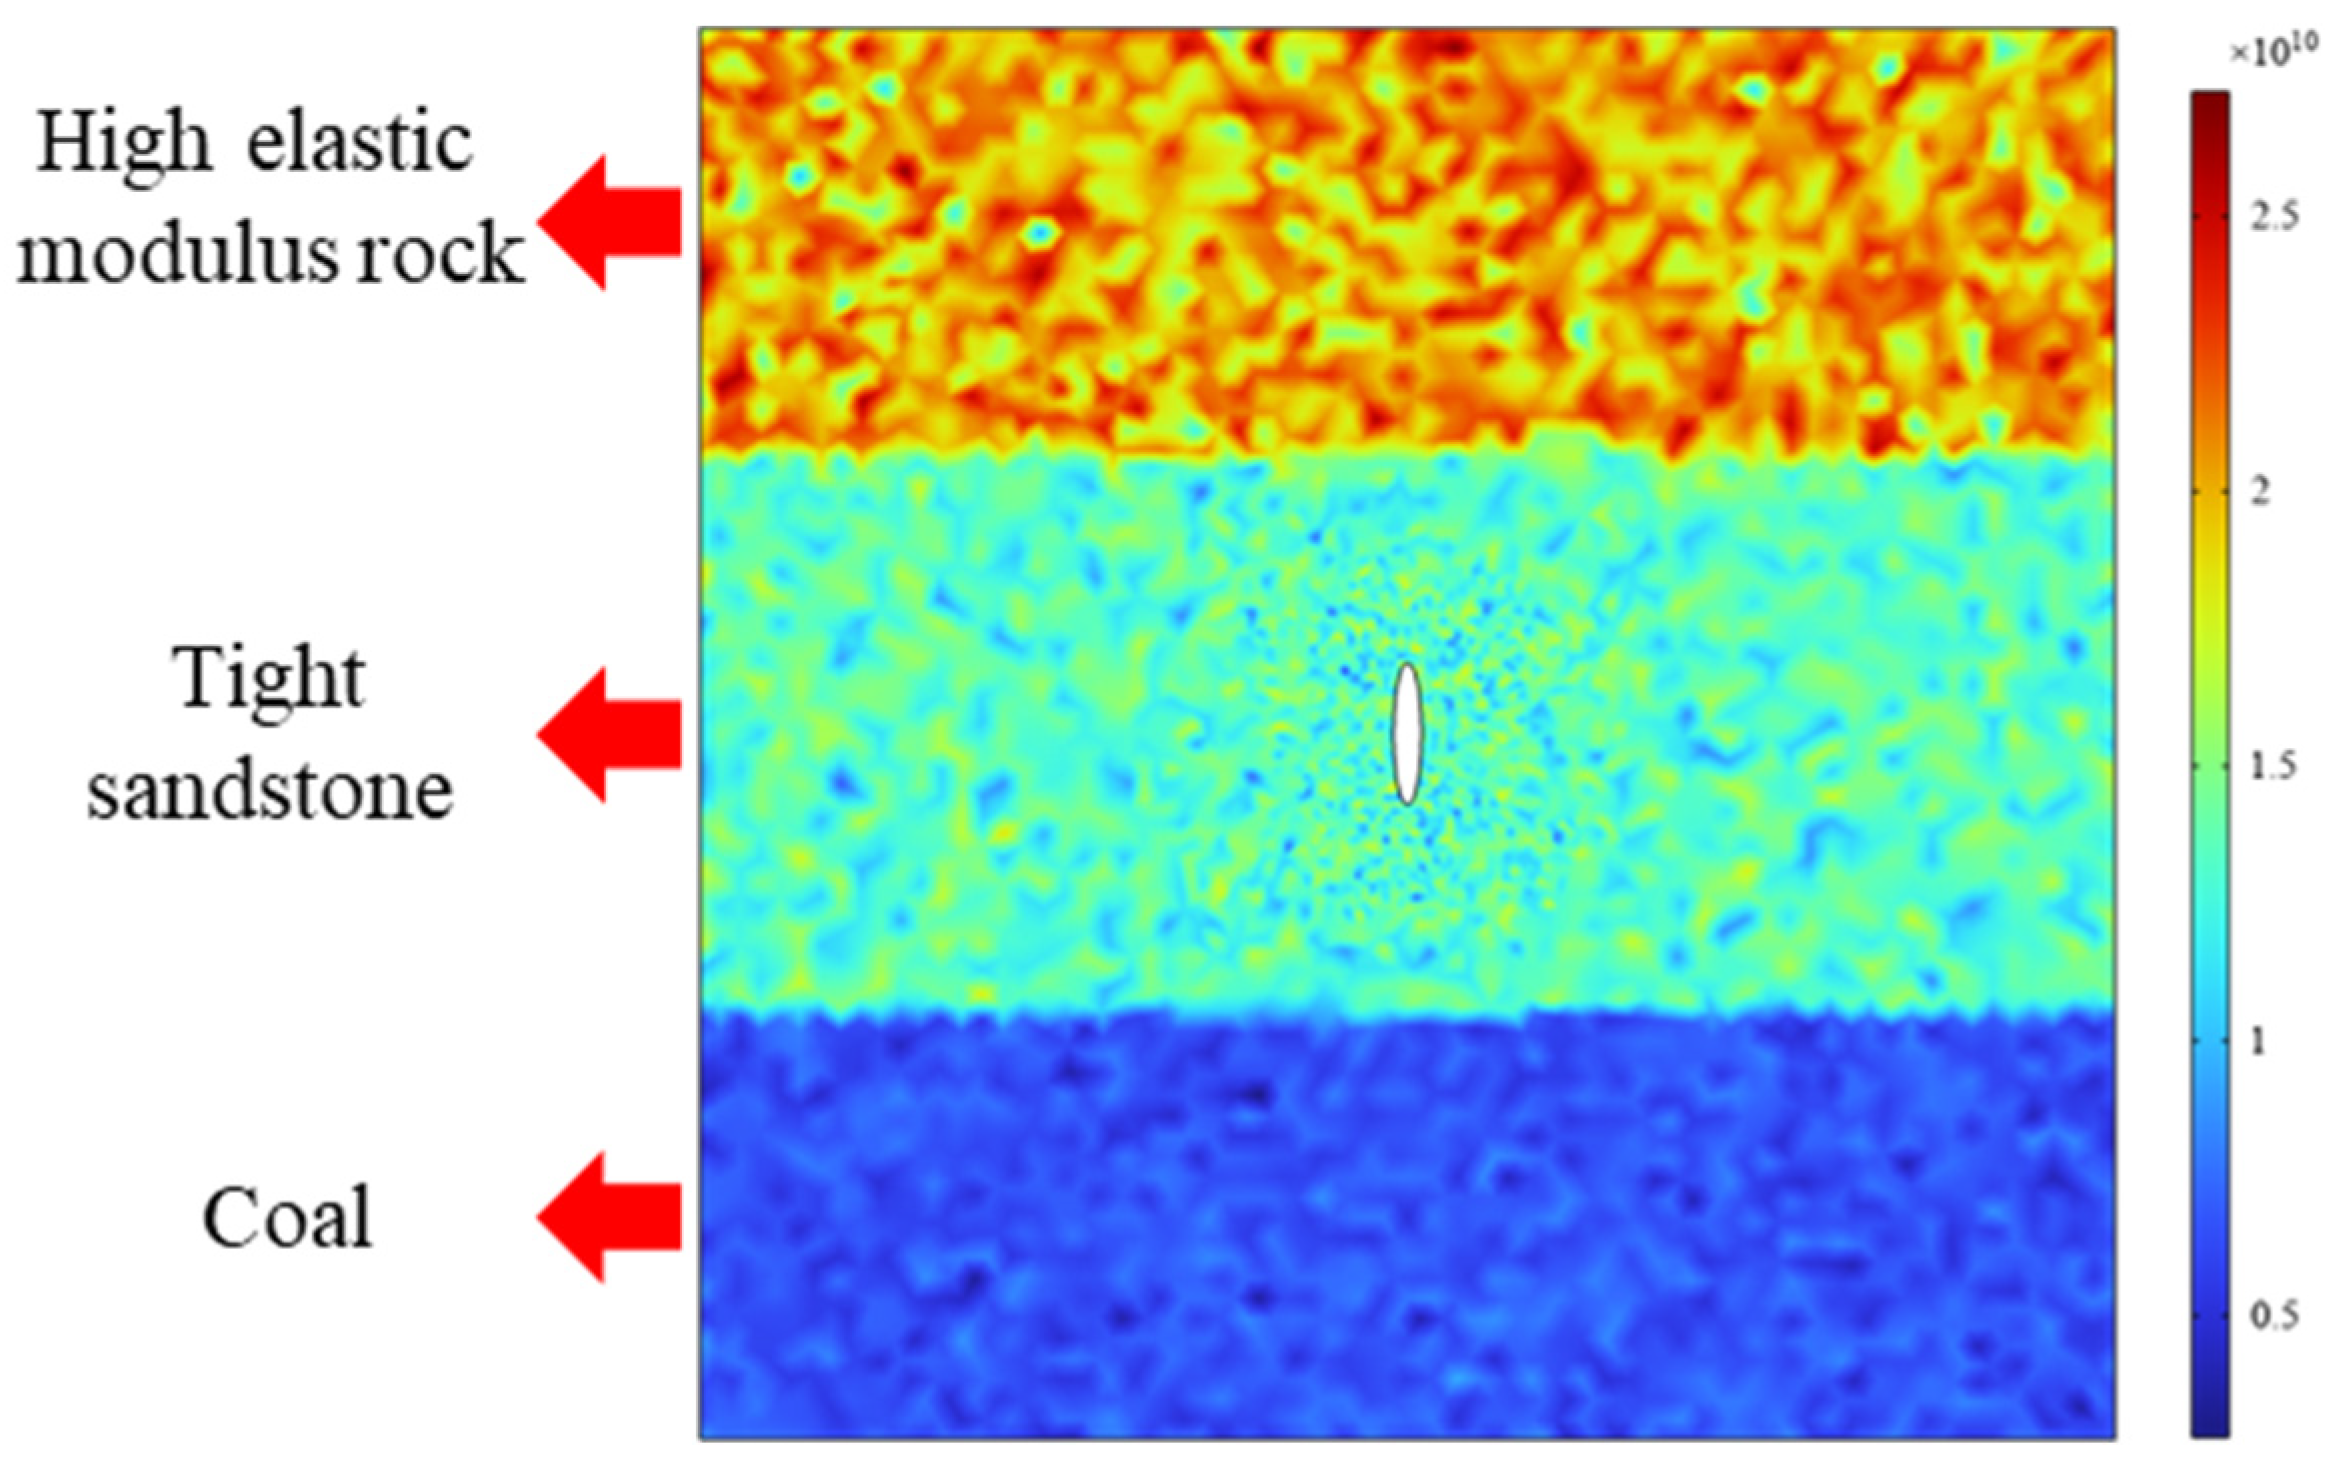
The distribution of elastic modulus in Model 3 is shown in Figure 18. These individual reservoirs are well articulated together. This model is designed to directly explore the influence of elastic modulus on the vertical propagation of fractures under the same injection pressure at the same borehole.
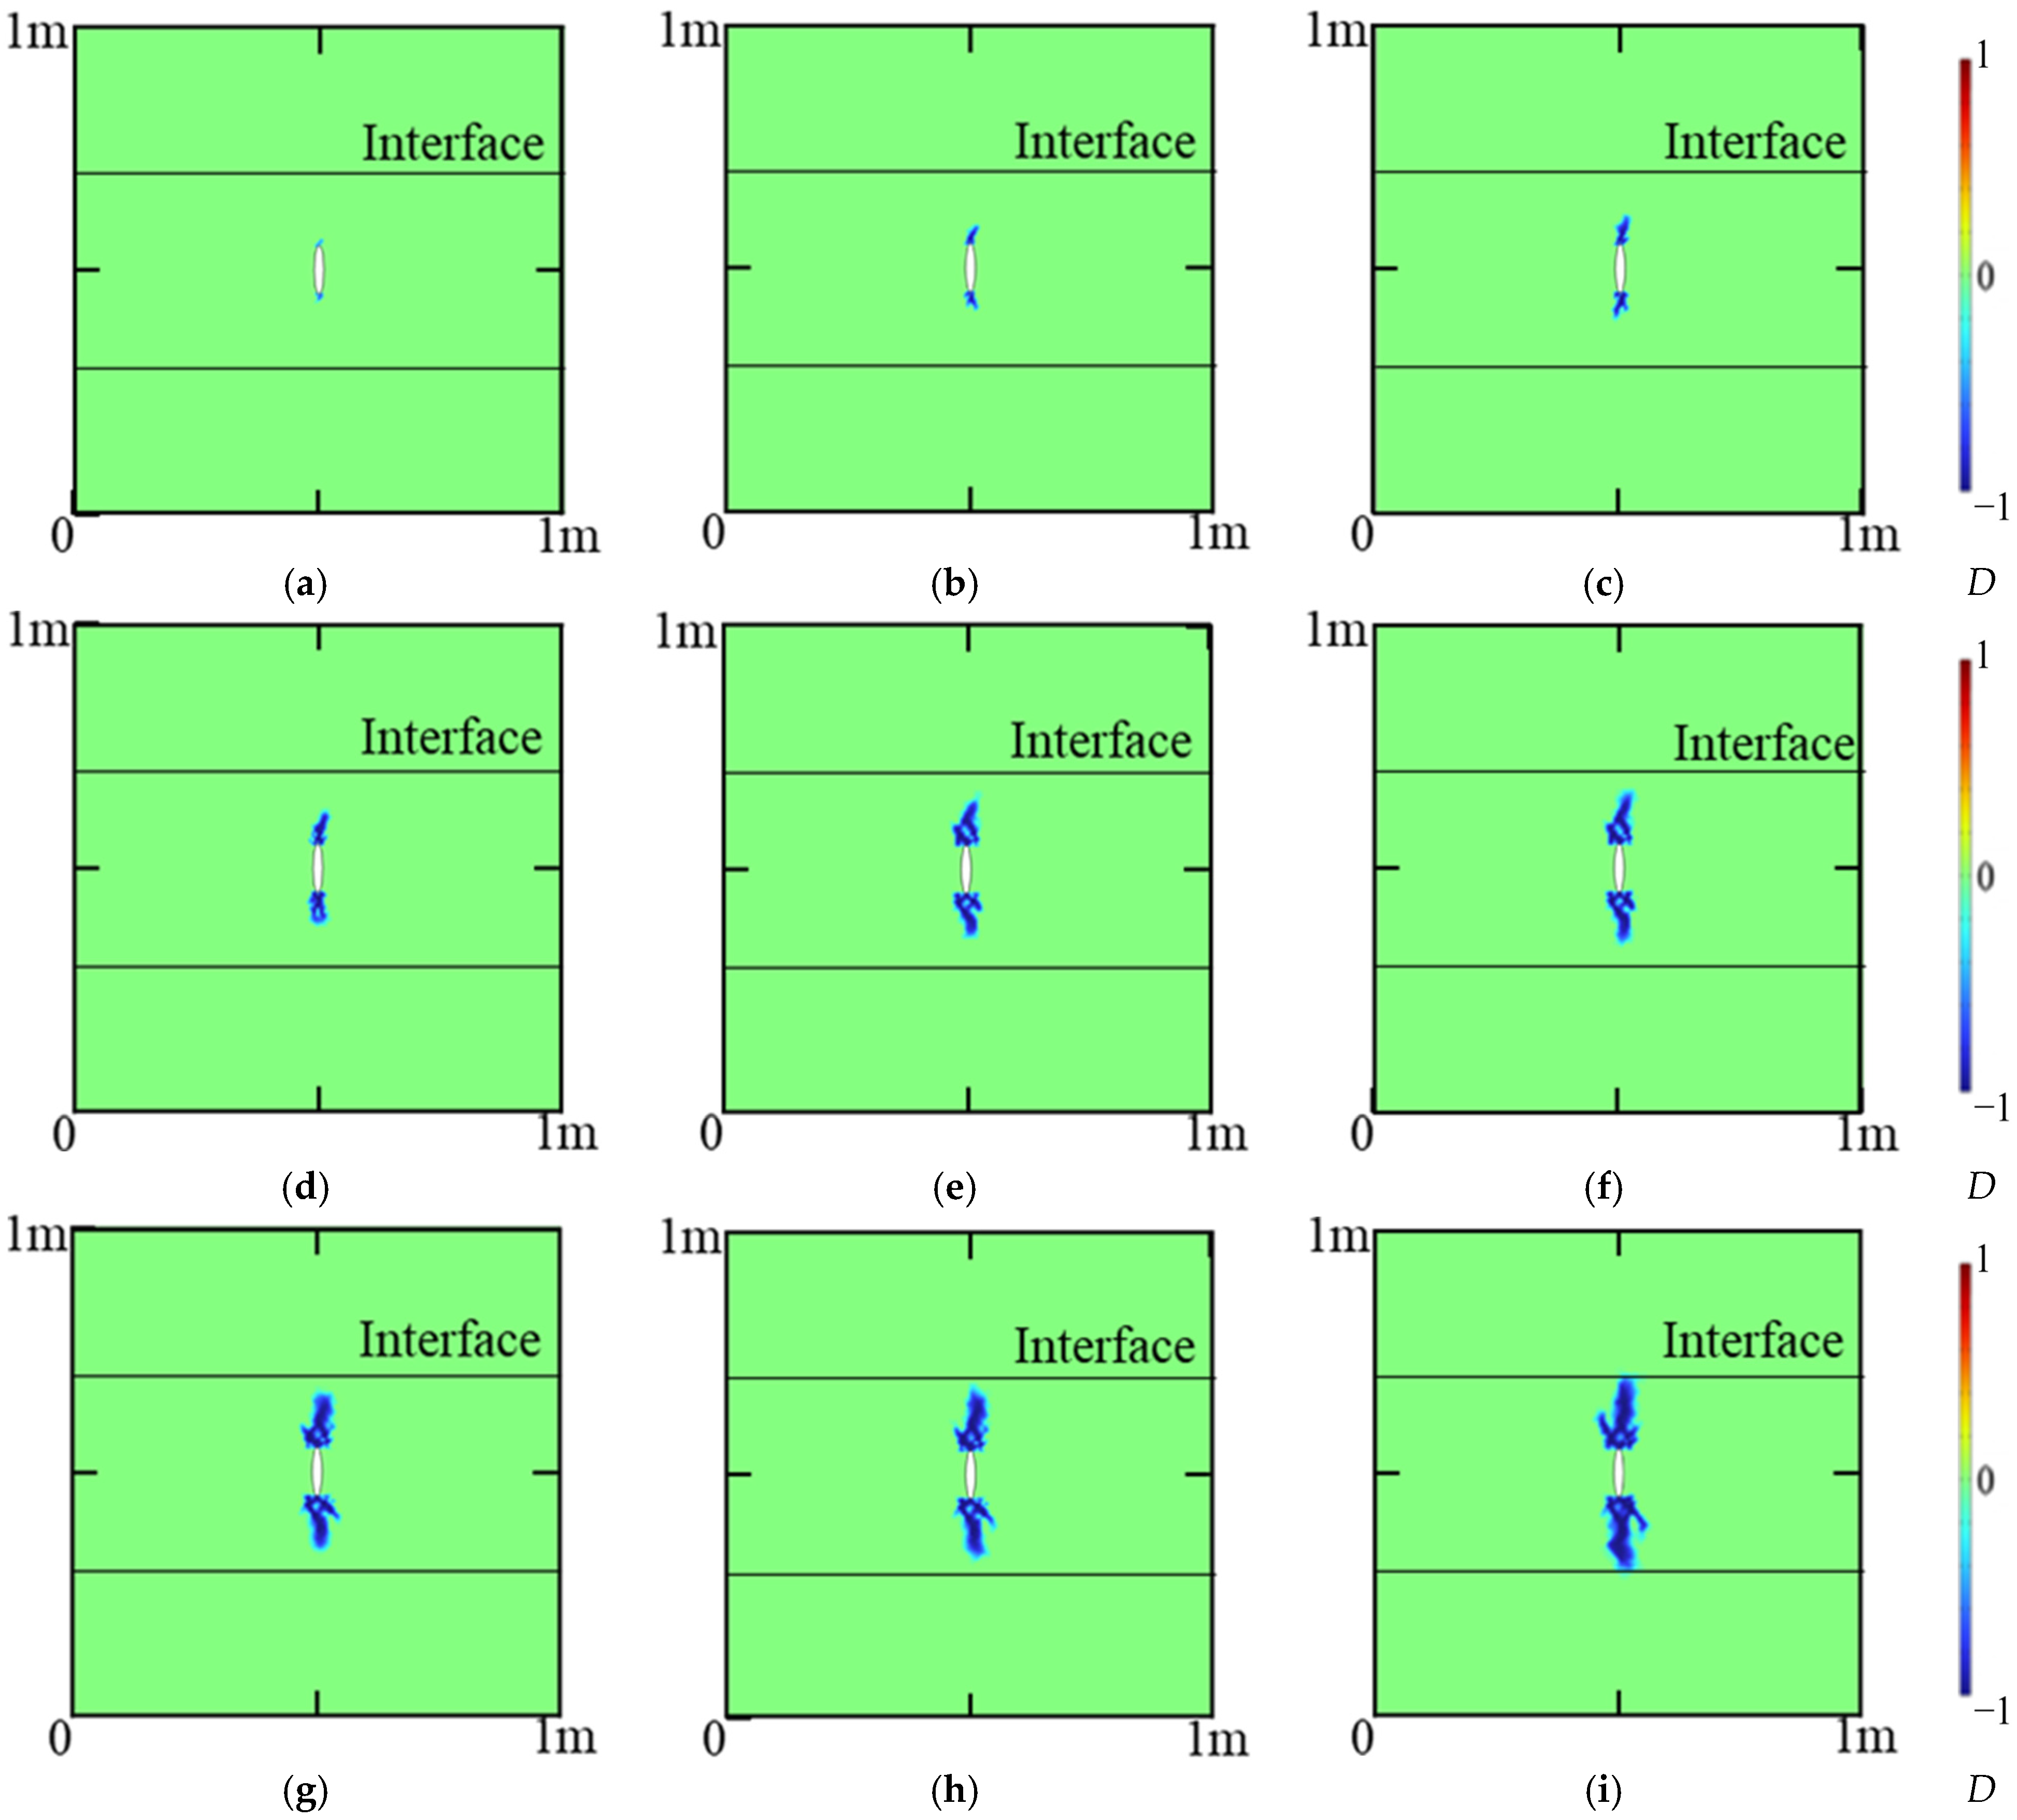
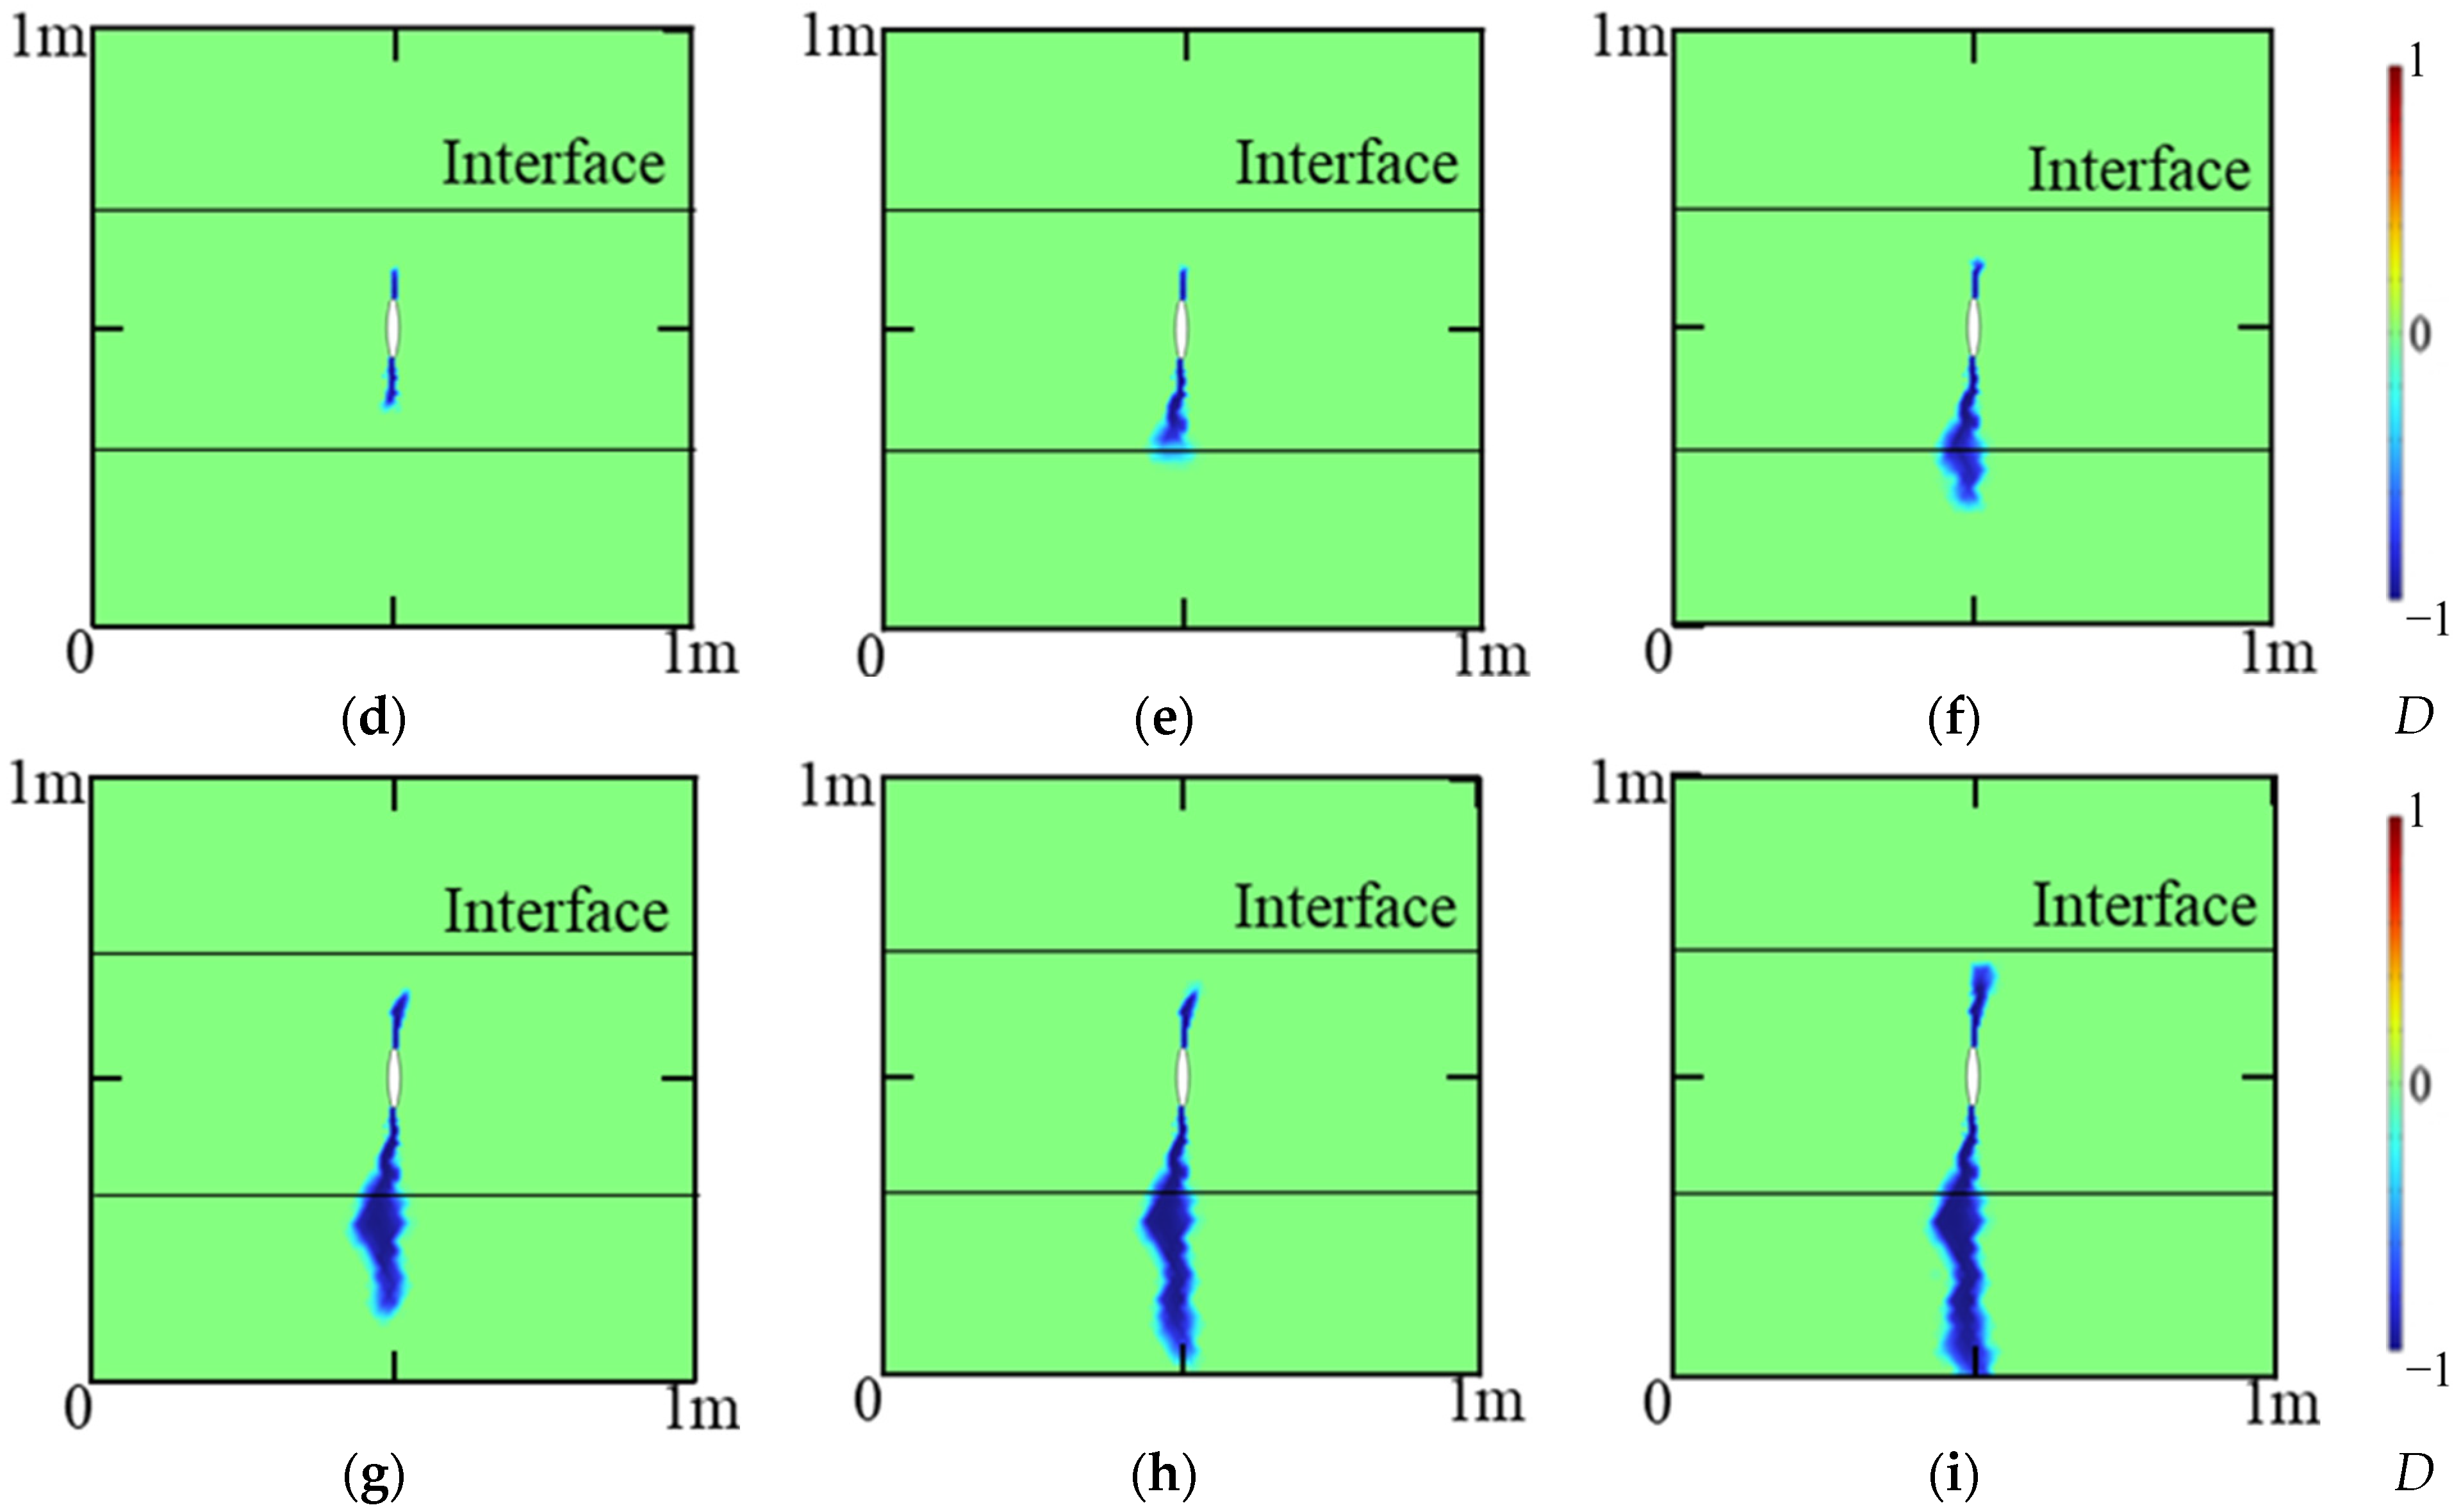
Figure 19 shows the vertical propagation of fractures in the three reservoirs with different elastic modulus. As shown in Figure 19a–c, the fractures start at the borehole and gradually propagate vertically with the increase in injection pressure. Since these fractures are far away from the reservoir interface, the upper and lower fractures propagate similarly. With the increase in injection pressure, the downward fractures gradually reach and cross the interface and enter the coal seam, while the propagation speed of upward fractures gradually slows down, see Figure 19d–f. The downward fractures continuously propagate after passing through the interface into the coal seam, while the upwardly propagating fractures stop propagation when they reach the reservoir boundary, see Figure 19g–i. It is difficult for the fracture to cross the reservoir interface when the fracture propagates from the low elastic modulus reservoir to the high elastic modulus reservoir. The fracture can easily propagate into the reservoir with low elastic modulus from the reservoir with high elastic modulus. The fracture width will also increase significantly when the fracture propagates in low elastic modulus reservoirs.

4.4. Fracture Propagation in Different Stress States

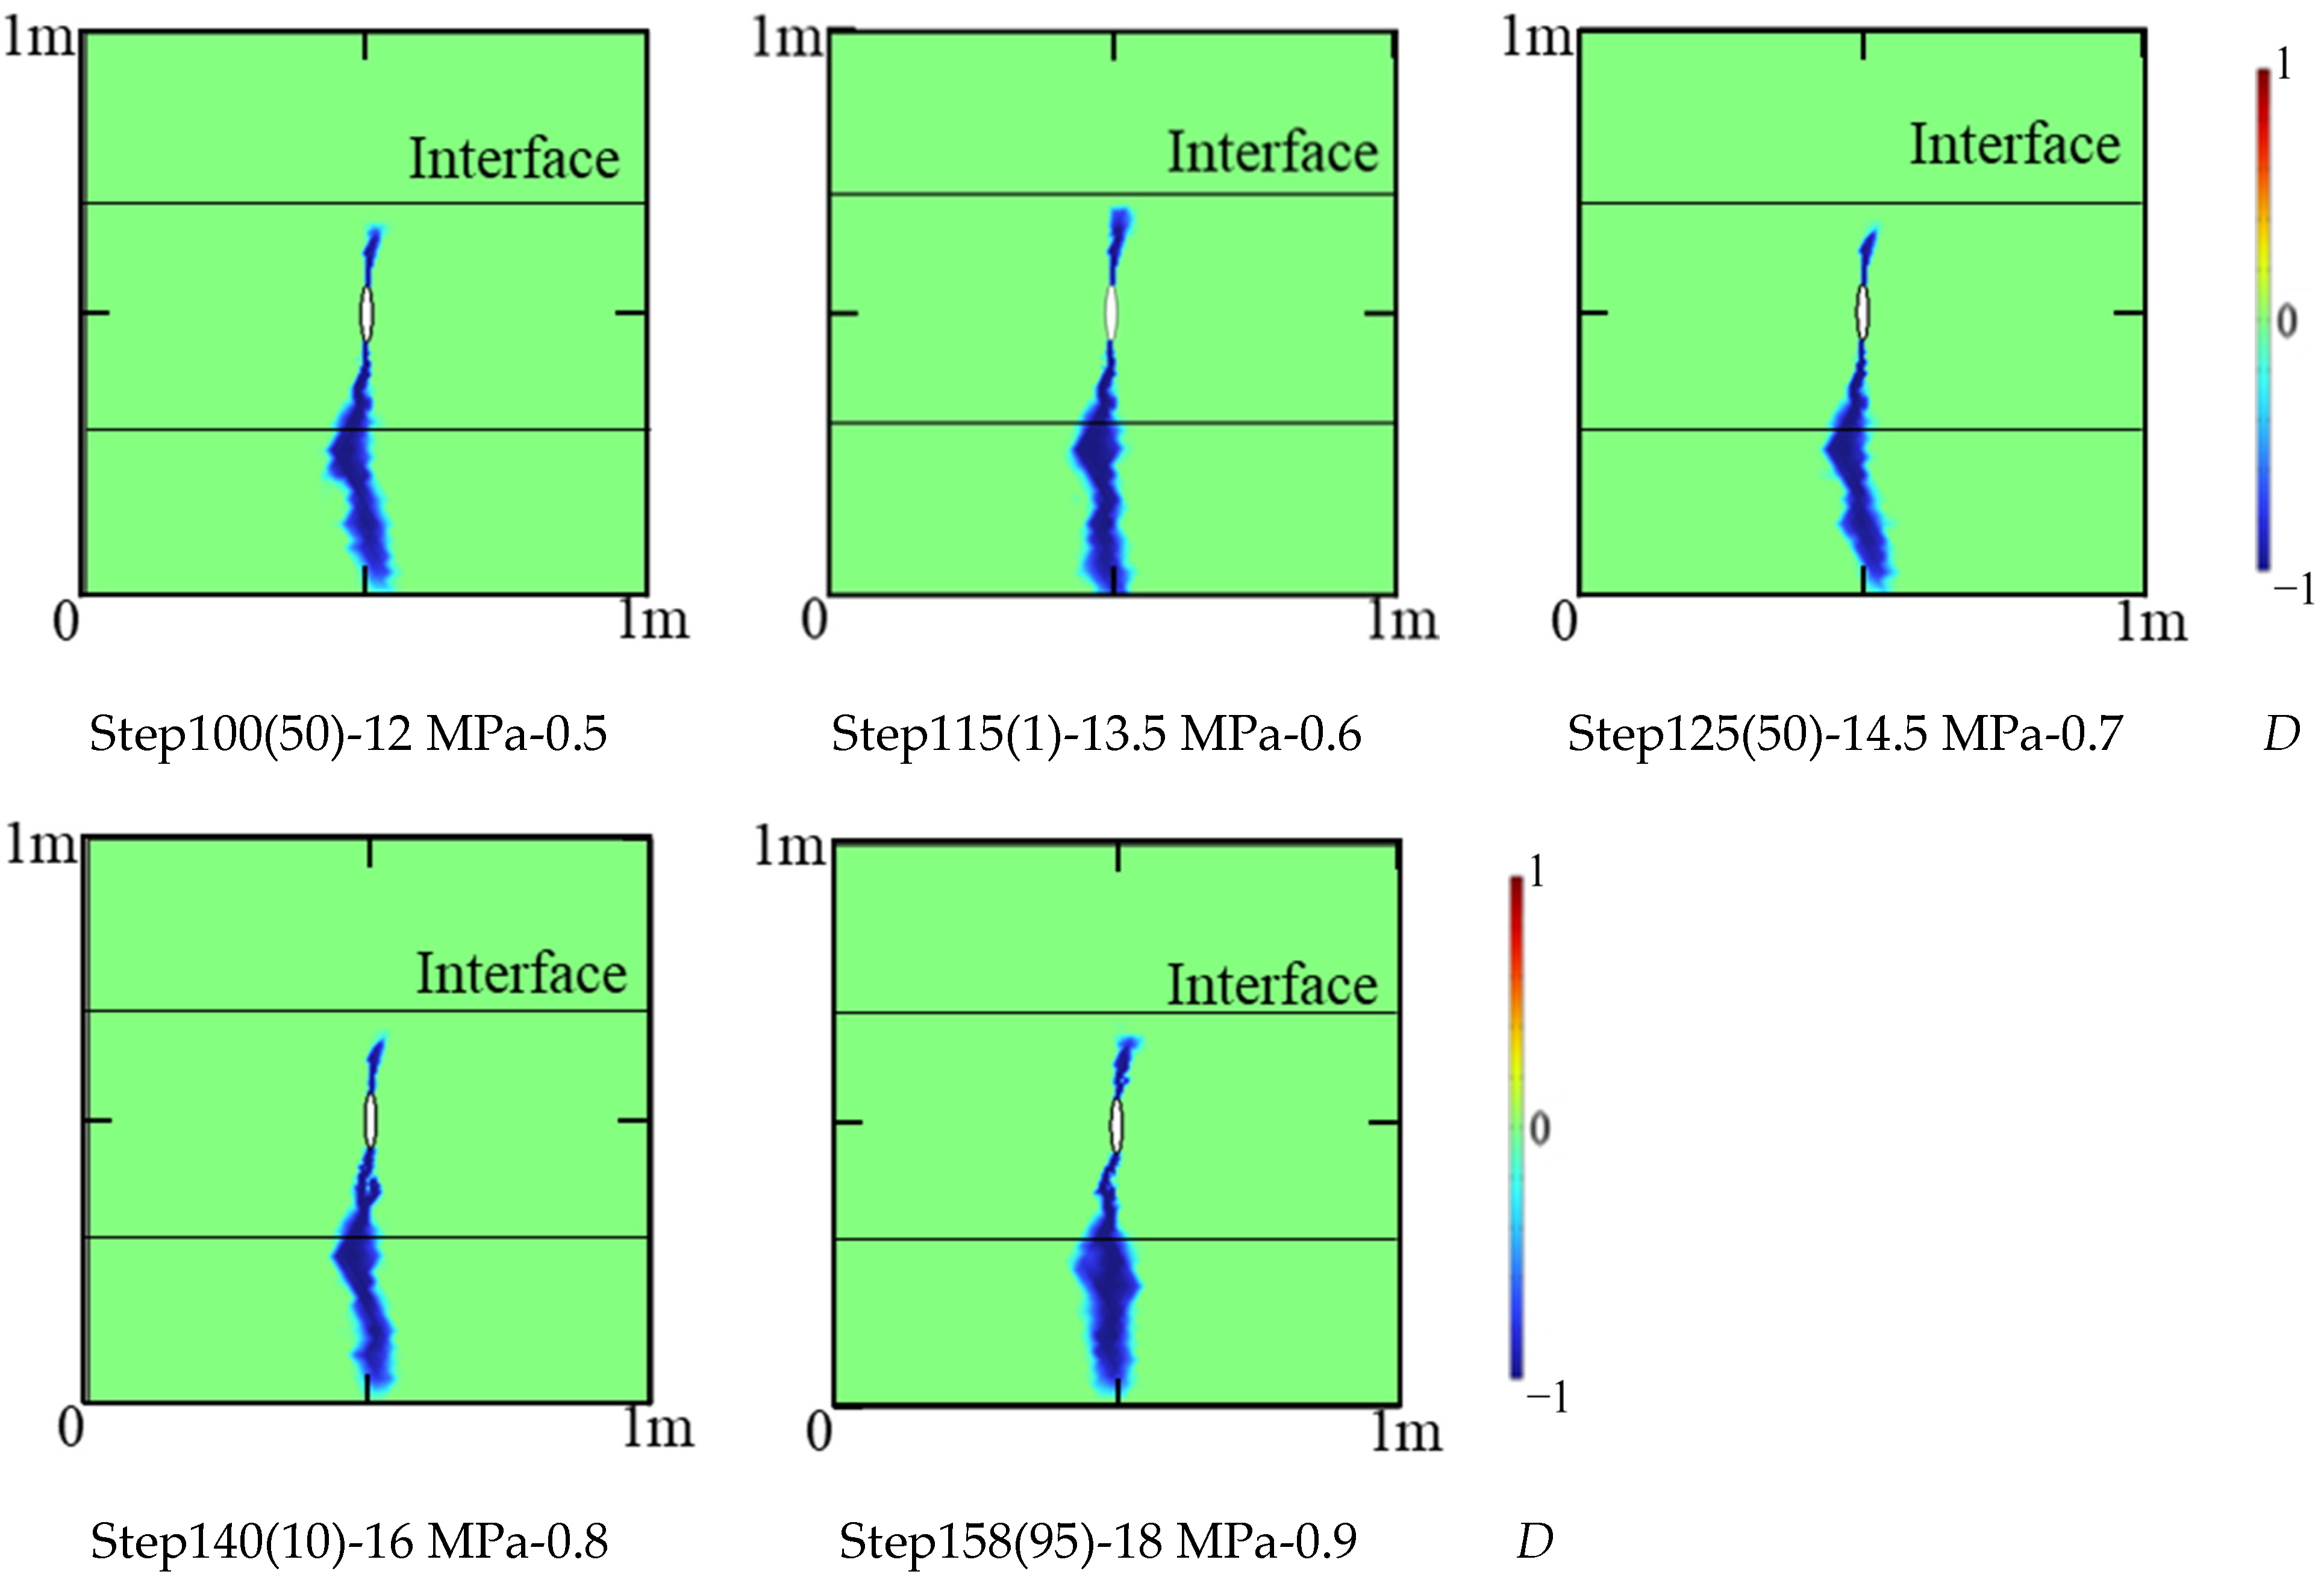
This section takes Model 3 as an example and sets up five groups of numerical simulations to analyze the influence of stress state on fracture propagation. In the simulations, the stress state is 10 MPa and is 5 MPa, 6 MPa, 7 MPa, 8 MPa and 9 MPa, respectively. Their stress ratios are 0.5, 0.6, 0.7, 0.8 and 0.9, respectively.
Figure 20 shows the evolution of reservoir damage under different stress states during hydraulic fracturing. Tensile damage is dominant and shear damage is rare. When the stress ratio is less than 1—that is, the horizontal principal stress is less than the vertical principal stress—the crack shape is less affected by stress state. However, with the increase in stress ratio, the injection pressure required for fracture propagation gradually increases. When the stress ratio is 0.6, the fracture completely penetrates the reservoir when the injection pressure is 13.5 MPa. When the stress ratio is 0.9 and the injection pressure is 18 MPa, the reservoir has not been completely penetrated.

4.5. Fracture Propagation in Different Fracturing Fluid Viscosity

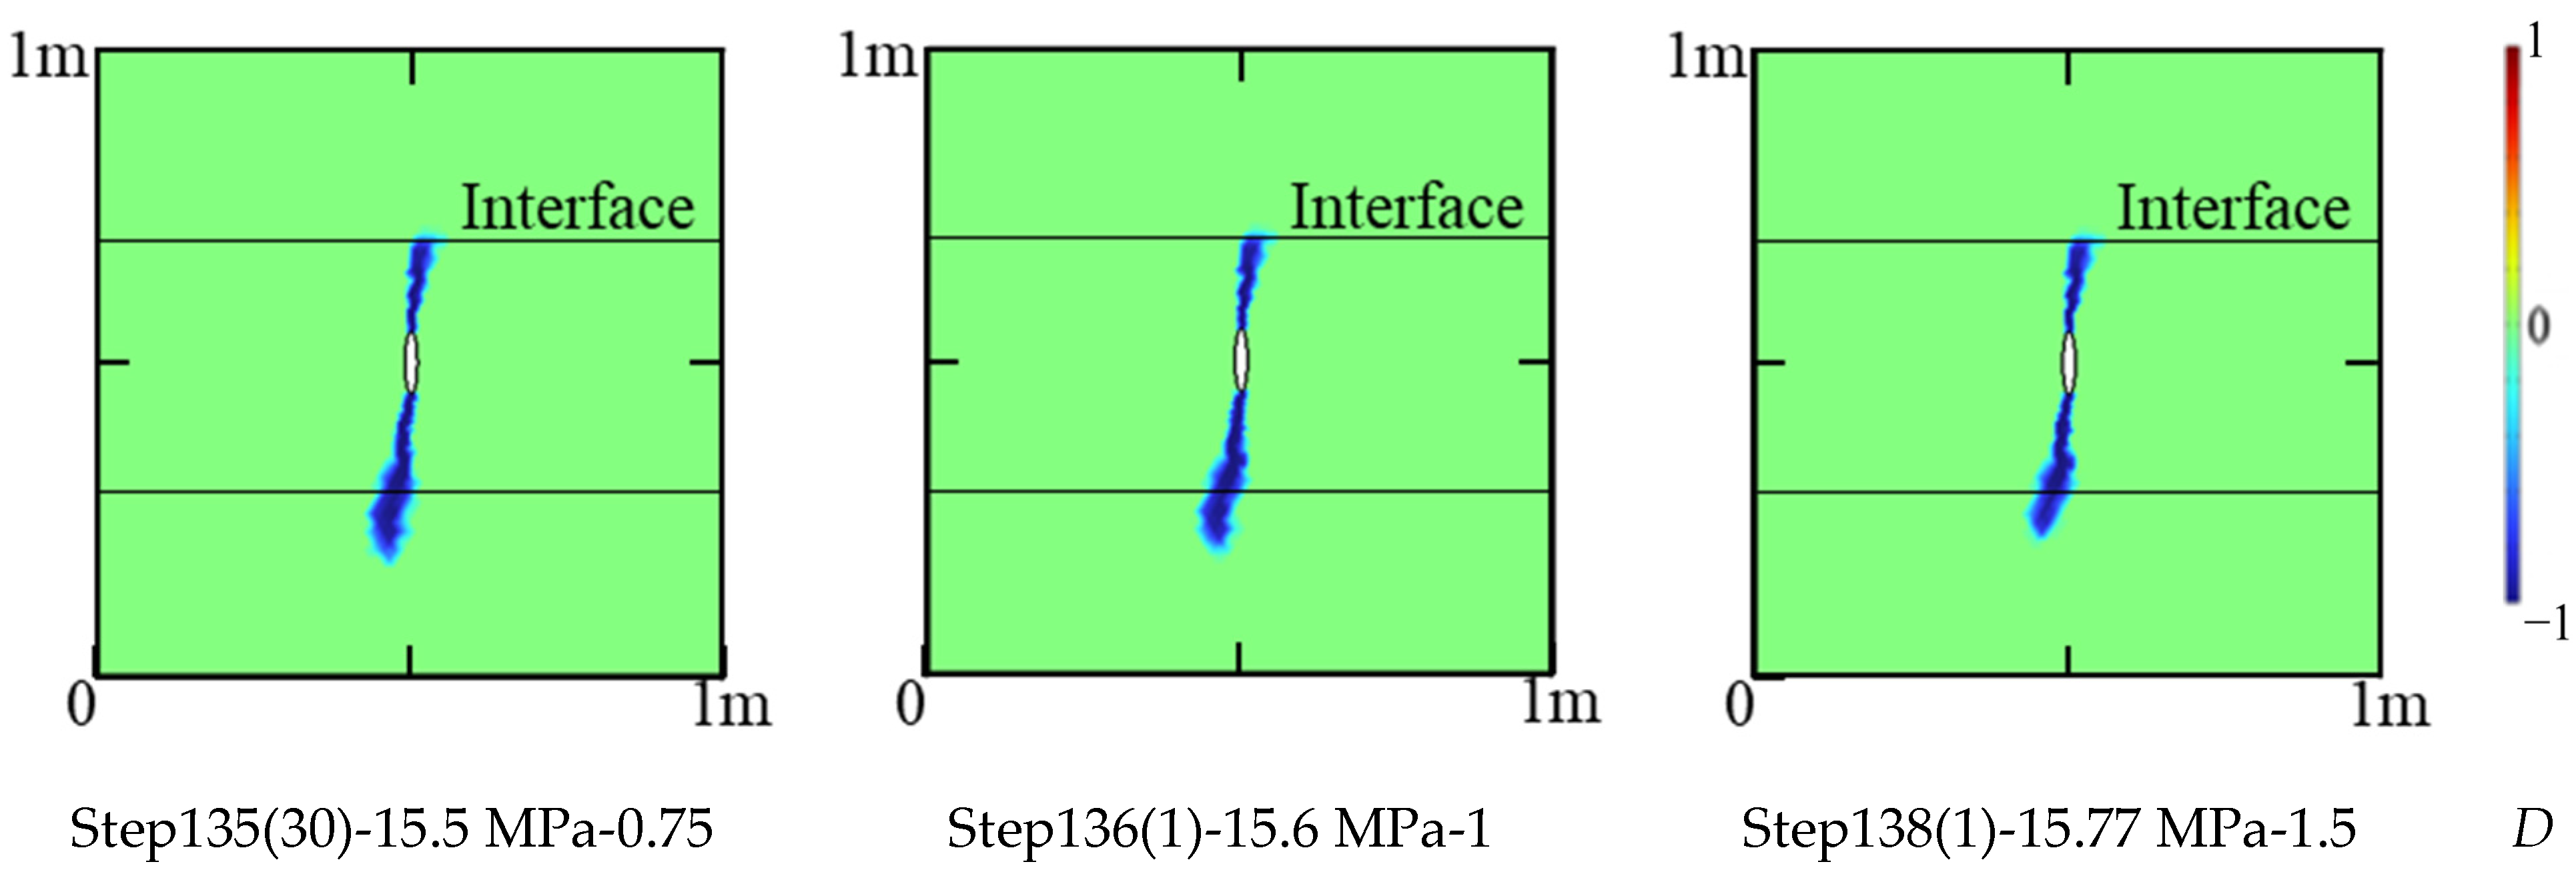
The fracturing fluid viscosity is an important parameter in hydraulic fracturing design. This section studies the influence of three different fracturing fluid viscosities on fracture propagation. This section takes Model 3 as an example to establish three groups of numerical simulations, the viscosity of fracturing fluids is taken as 0.75, 1 and 1.5, respectively. As shown in Figure 21 that the fracture needs less pressure to reach the reservoir interface when the fracturing fluid is 0.75. However, under different fracturing fluid viscosity, the effect of fracture propagation through layers is similar.

5. Discussion

5.1. Influence of Elastic Modulus Difference between Adjacent Reservoirs on Fracture Propagation

The simulation results of Model 1 demonstrate a small fracture width. This is because a tight sandstone reservoir has large elastic modulus and thus has a large resistance to the fracture; this results in a small fracture width. When the fracture propagates to the reservoir interface, it can propagate through the reservoir interface. When the fracture propagates to coal seam, the fracture width increases. This is because the coal seam has small elastic modulus and low hardness, so its anti-fracture ability is small, and the resistance of fracture is reduced. For this case, from high elastic modulus reservoir to low elastic modulus reservoir, the fracture can easily propagate through the reservoir interface and has a larger fracture width. The simulation results of Model 2 show that a fracture is difficult to propagate through the interface from sandstone layer to coal seam. This is because the tight sandstone reservoir has large elastic modulus, large hardness and high resistance to fracture. With the increase in pressure, the fracture can only propagate in the coal seam and show a bifurcation phenomenon. As a comparison result, Model 3 can more intuitively see the influence of elastic modulus difference on fracture propagation. Under the same injection fracturing, if the elastic modulus of the reservoir on the other side of the interface is small and the reservoir hardness is low, the resistance received by the fracture is small, so the fracture can easily propagate through the reservoir interface. As a summary, the above three models show that the difference of elastic modulus is a key parameter which can control the fracture propagation through the reservoir interface.

5.2. Influence of Elastic Modulus Difference of Adjacent Reservoirs on Stress Intensity Factor

The change of stress intensity factor with distance from crack tip to interface is calculated by using the stress intensity factor model established in Section 2 and the boundary conditions of Model 3. The results are shown in Figure 22. The boreholes are arranged in tight sandstone layers. The black line represents the fracture’s propagation from the tight sandstone layer to high elastic modulus shale reservoirs, and the red line represents the fracture propagation in coal seams. When the fracture propagates from the tight sandstone reservoir (low elastic modulus rock) to shale (high elastic modulus rock), the stress intensity factor at the crack tip gradually decreases and it is difficult to overcome the fracture toughness, so the fracture is initiated and propagated with difficulty. When the fracture propagates from tight sandstone reservoir (rock with high elastic modulus) to coal seam (rock with low elastic modulus), the stress intensity factor at the crack tip gradually increases and easily reaches the fracture toughness, so the fracture is easily initiated and propagated. The change of stress intensity factor can reflect the capacity of fracture propagation through the reservoir interface. The trend of the calculated results using the stress intensity factor model established in Section 2 is the same as that of the simulation results obtained in Model 3, which also proves the rationality and accuracy of the model established in Section 2.

5.3. Influence of Elastic Modulus Difference of Adjacent Reservoirs on Damage

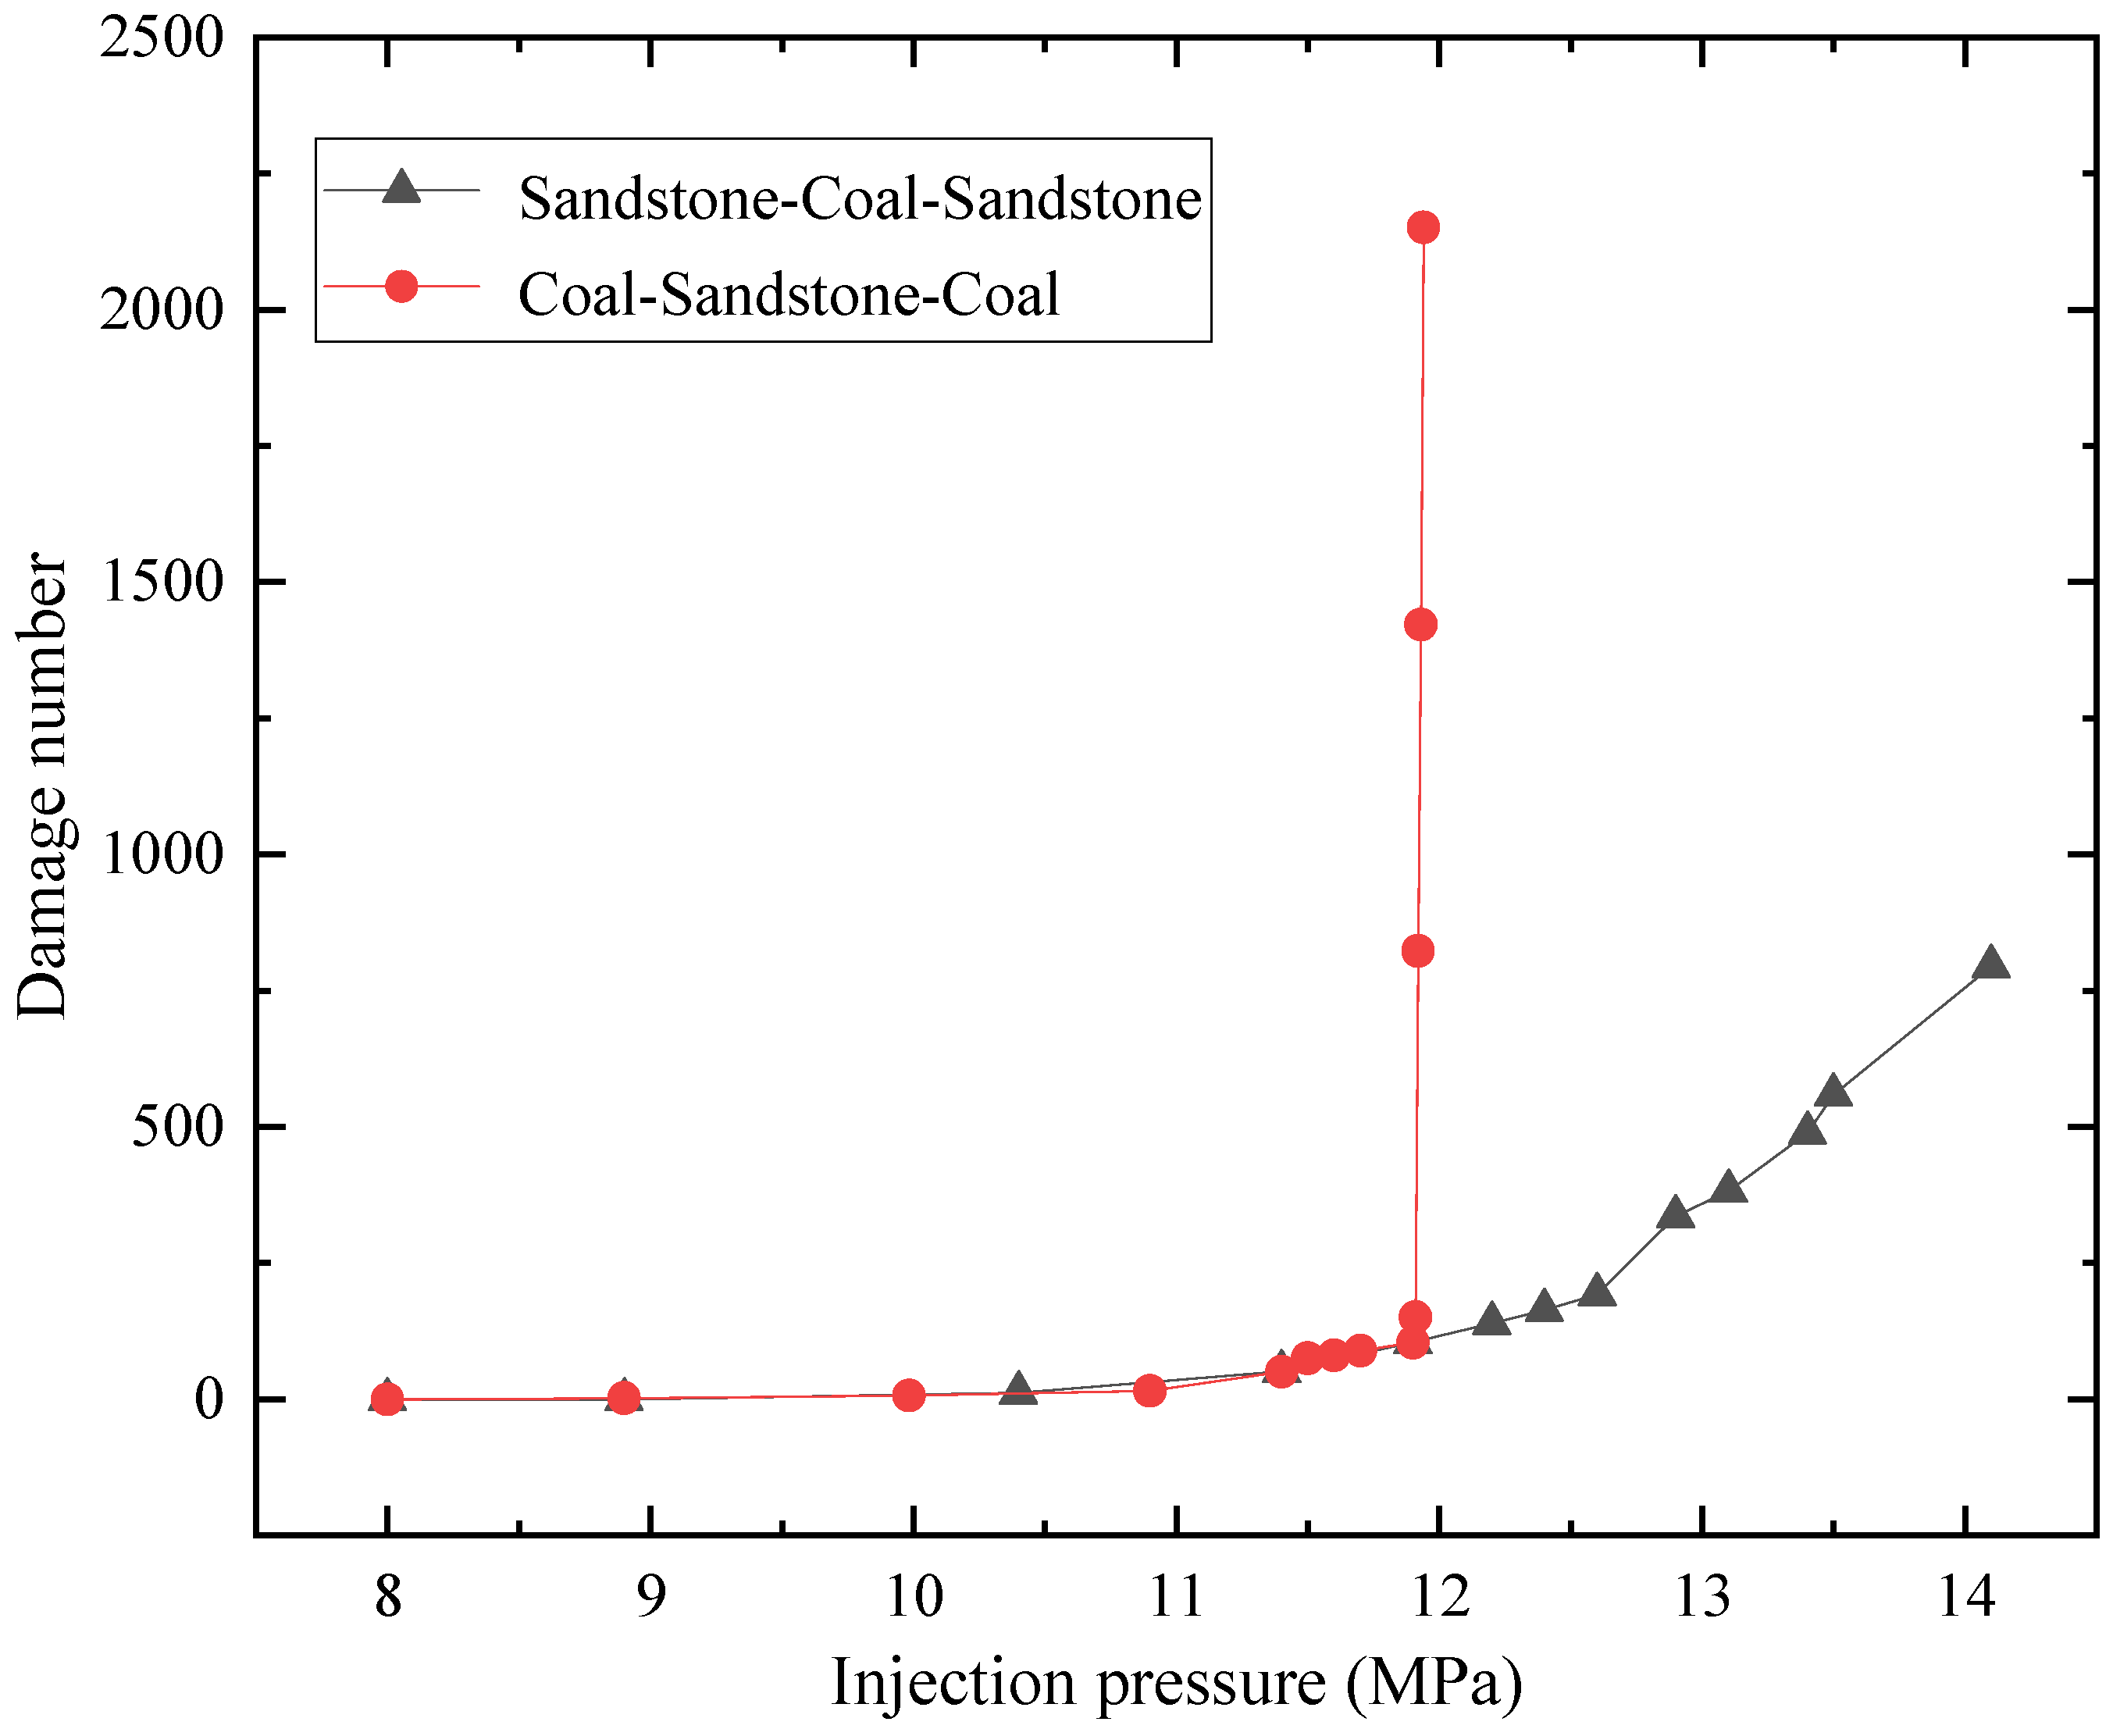
Figure 23 shows the change in the number of damages with injection pressure when the borehole is in coal seams and tight sandstone layers, respectively. The “CSC” means that the middle layer is the sandstone and the upper and lower reservoirs are coal seams. When the borehole is in the tight sandstone layer, the number of damages gradually increases with the increase in injection pressure. When the injection pressure is smaller than 11.5 MPa, the number of damages increases slowly. When the injection pressure is close to 12 MPa, the number of damages increases instantaneously. This is because the cracks propagate from the tight sandstone reservoir to the coal seam and enter the coal seam. The length and width of the cracks increase instantaneously; thus, the number of damages increases. The “SCS” means that the middle layer is a coal seam and the upper and lower reservoirs are tight sandstone. When the borehole is in the coal seam, the number of damages increases gradually with the increase in injection pressure, but the growth rate is slow. The damage number is still smaller than that of the “CSC”. When the injection pressure exceeds 12 MPa, the growth rate of the damage number becomes larger. This is due to the increase in crack width and the appearance of bifurcation, similar to the crack propagation situation in Figure 17.
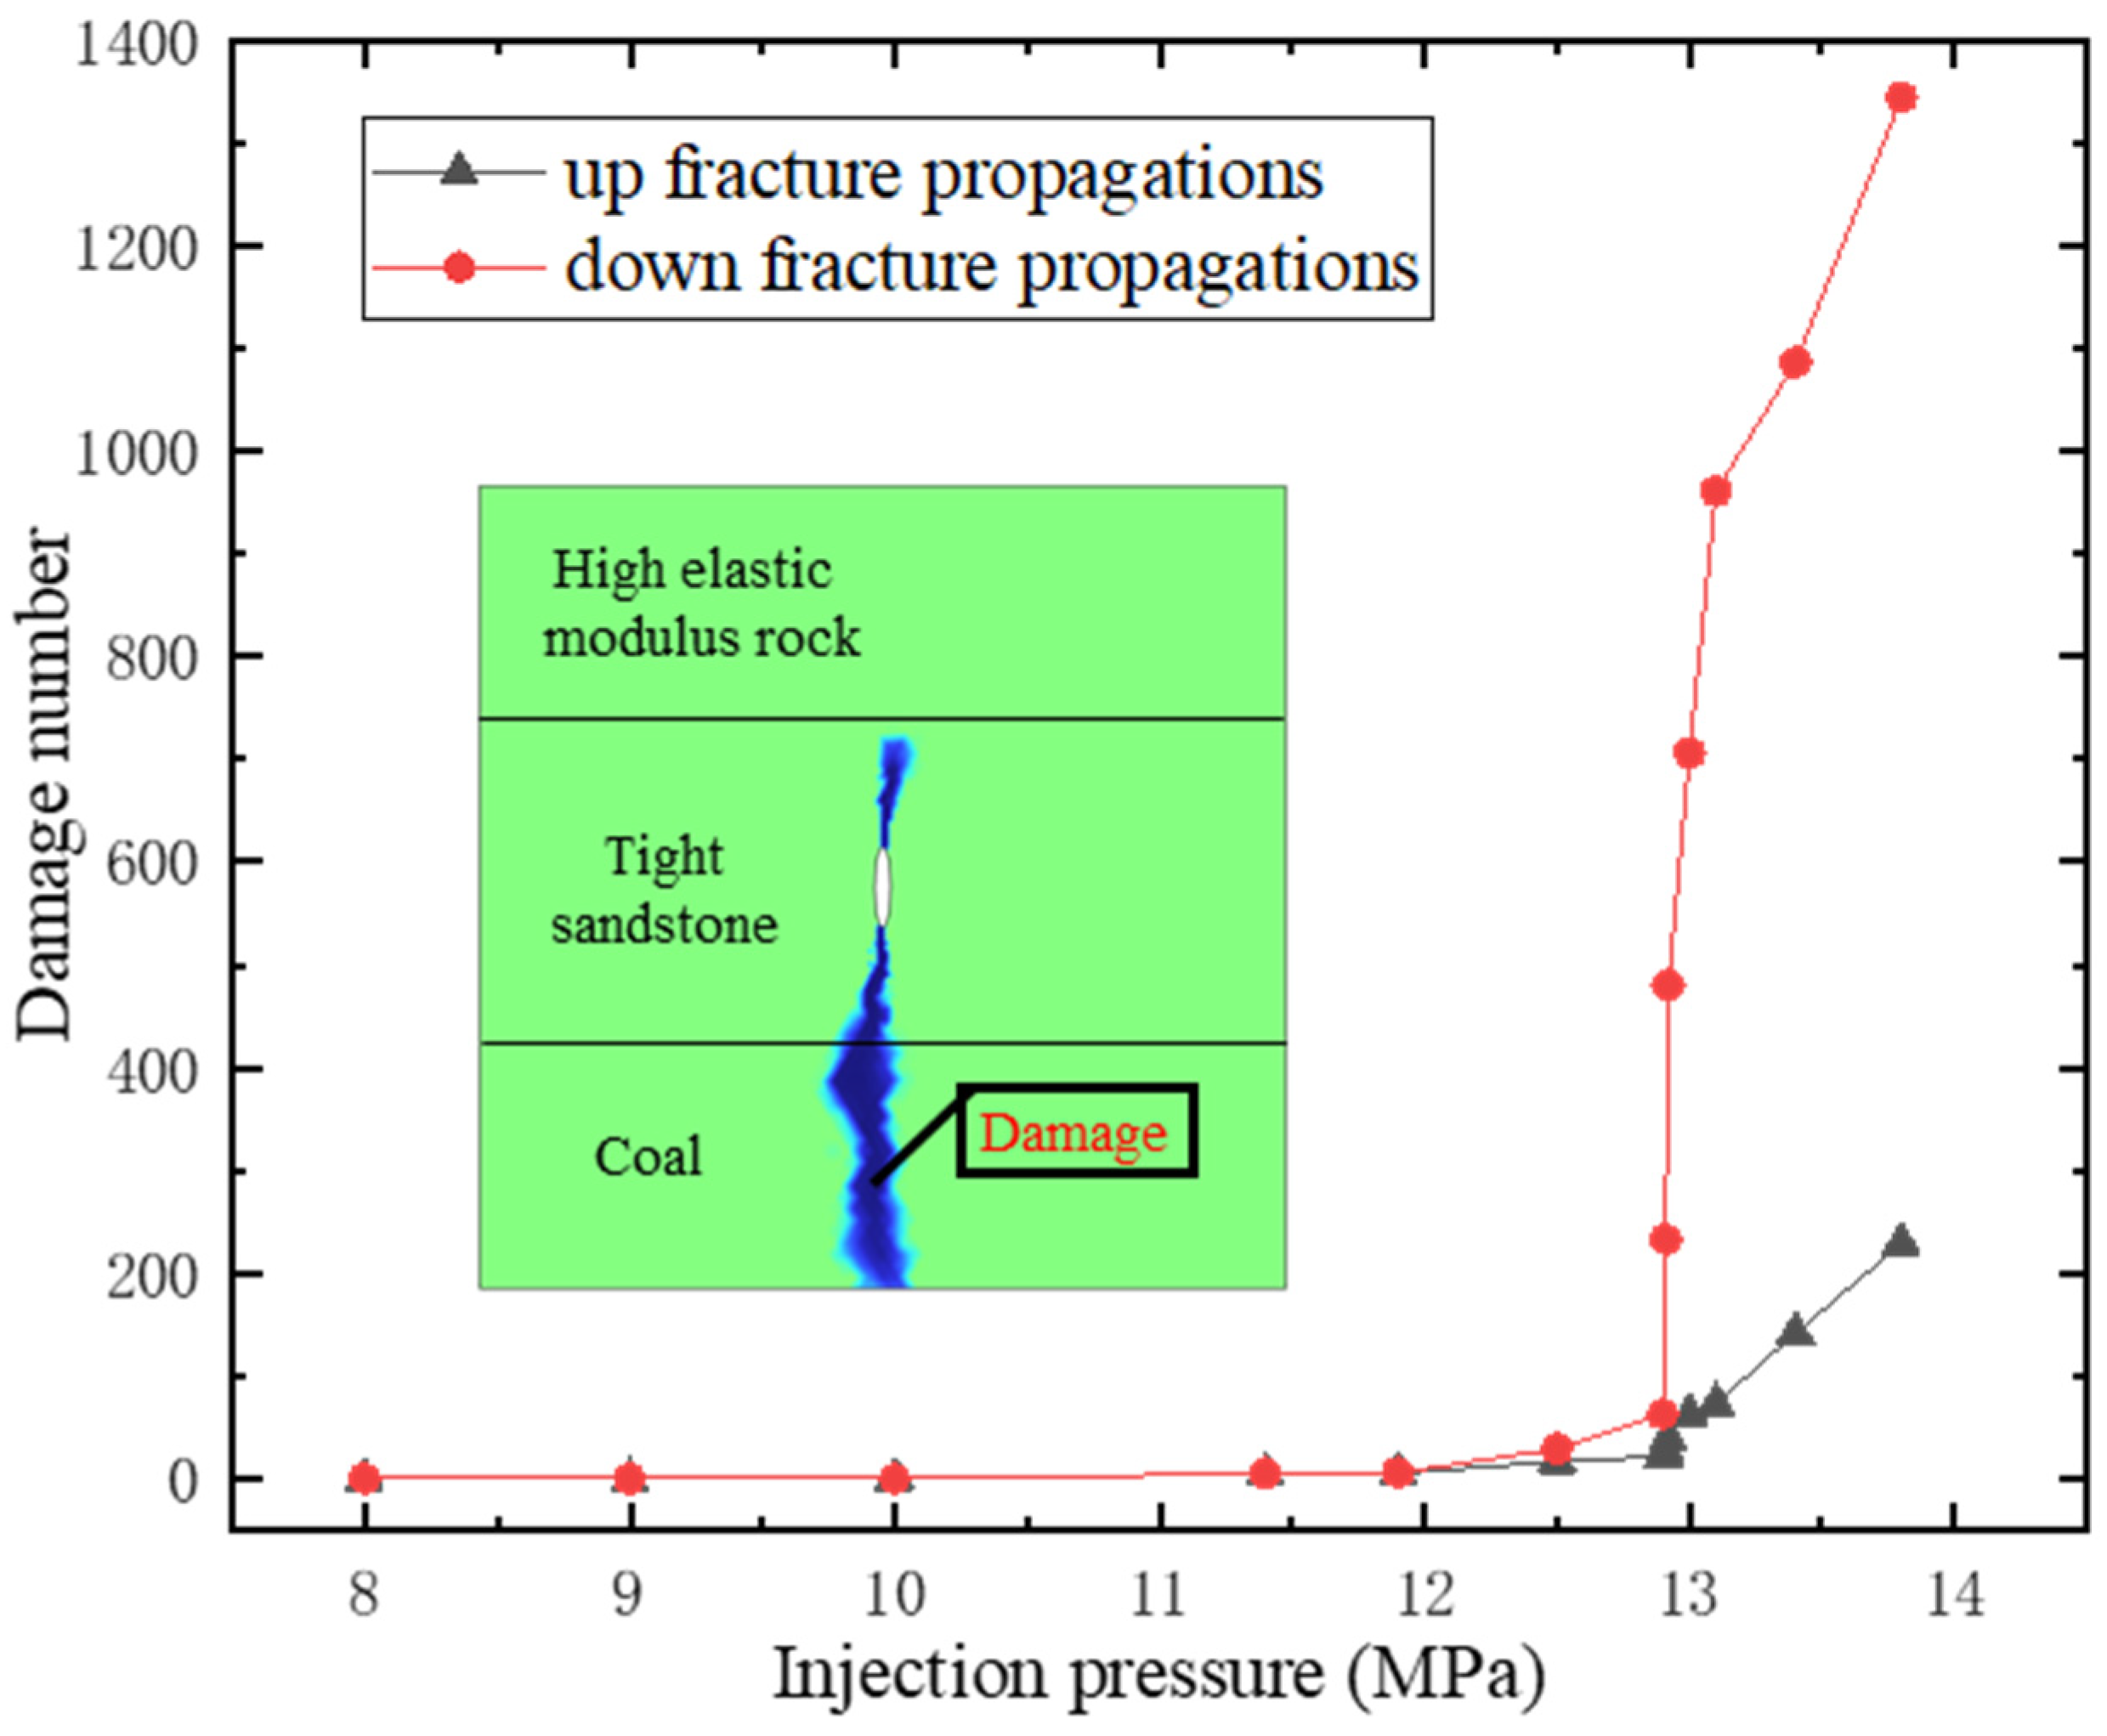
Figure 24 compares the change of damage number during crack propagation in Model 3. In the initial stage, the upper and lower crack propagation speeds are the same, and there is almost no difference in damage number. As the injection pressure increases, the cracks propagate slowly upward, and the damage number increases slowly. When the cracks approach to the reservoir interface, it is difficult for them to pass through the reservoir interface and enter the upper reservoir due to the large elastic modulus of the upper reservoir. With the increase in injection pressure, the increment of damage quantity is small, and this increment is mainly caused by the increase in crack width. On the contrary, as the injection pressure gradually increases, the fractures propagate rapidly downwards, and the number of damages increases significantly when the fractures reach the reservoir interface and pass through the interface. This is because the fractures enter the low elastic modulus reservoir from the high elastic modulus reservoir, the resistance is significantly reduced and the length and width of the fracture greatly increase in a short period of time, thus having a significant increase in damage number.

5.4. Effect of Elastic Modulus Difference of Adjacent Reservoirs on Fracture Length

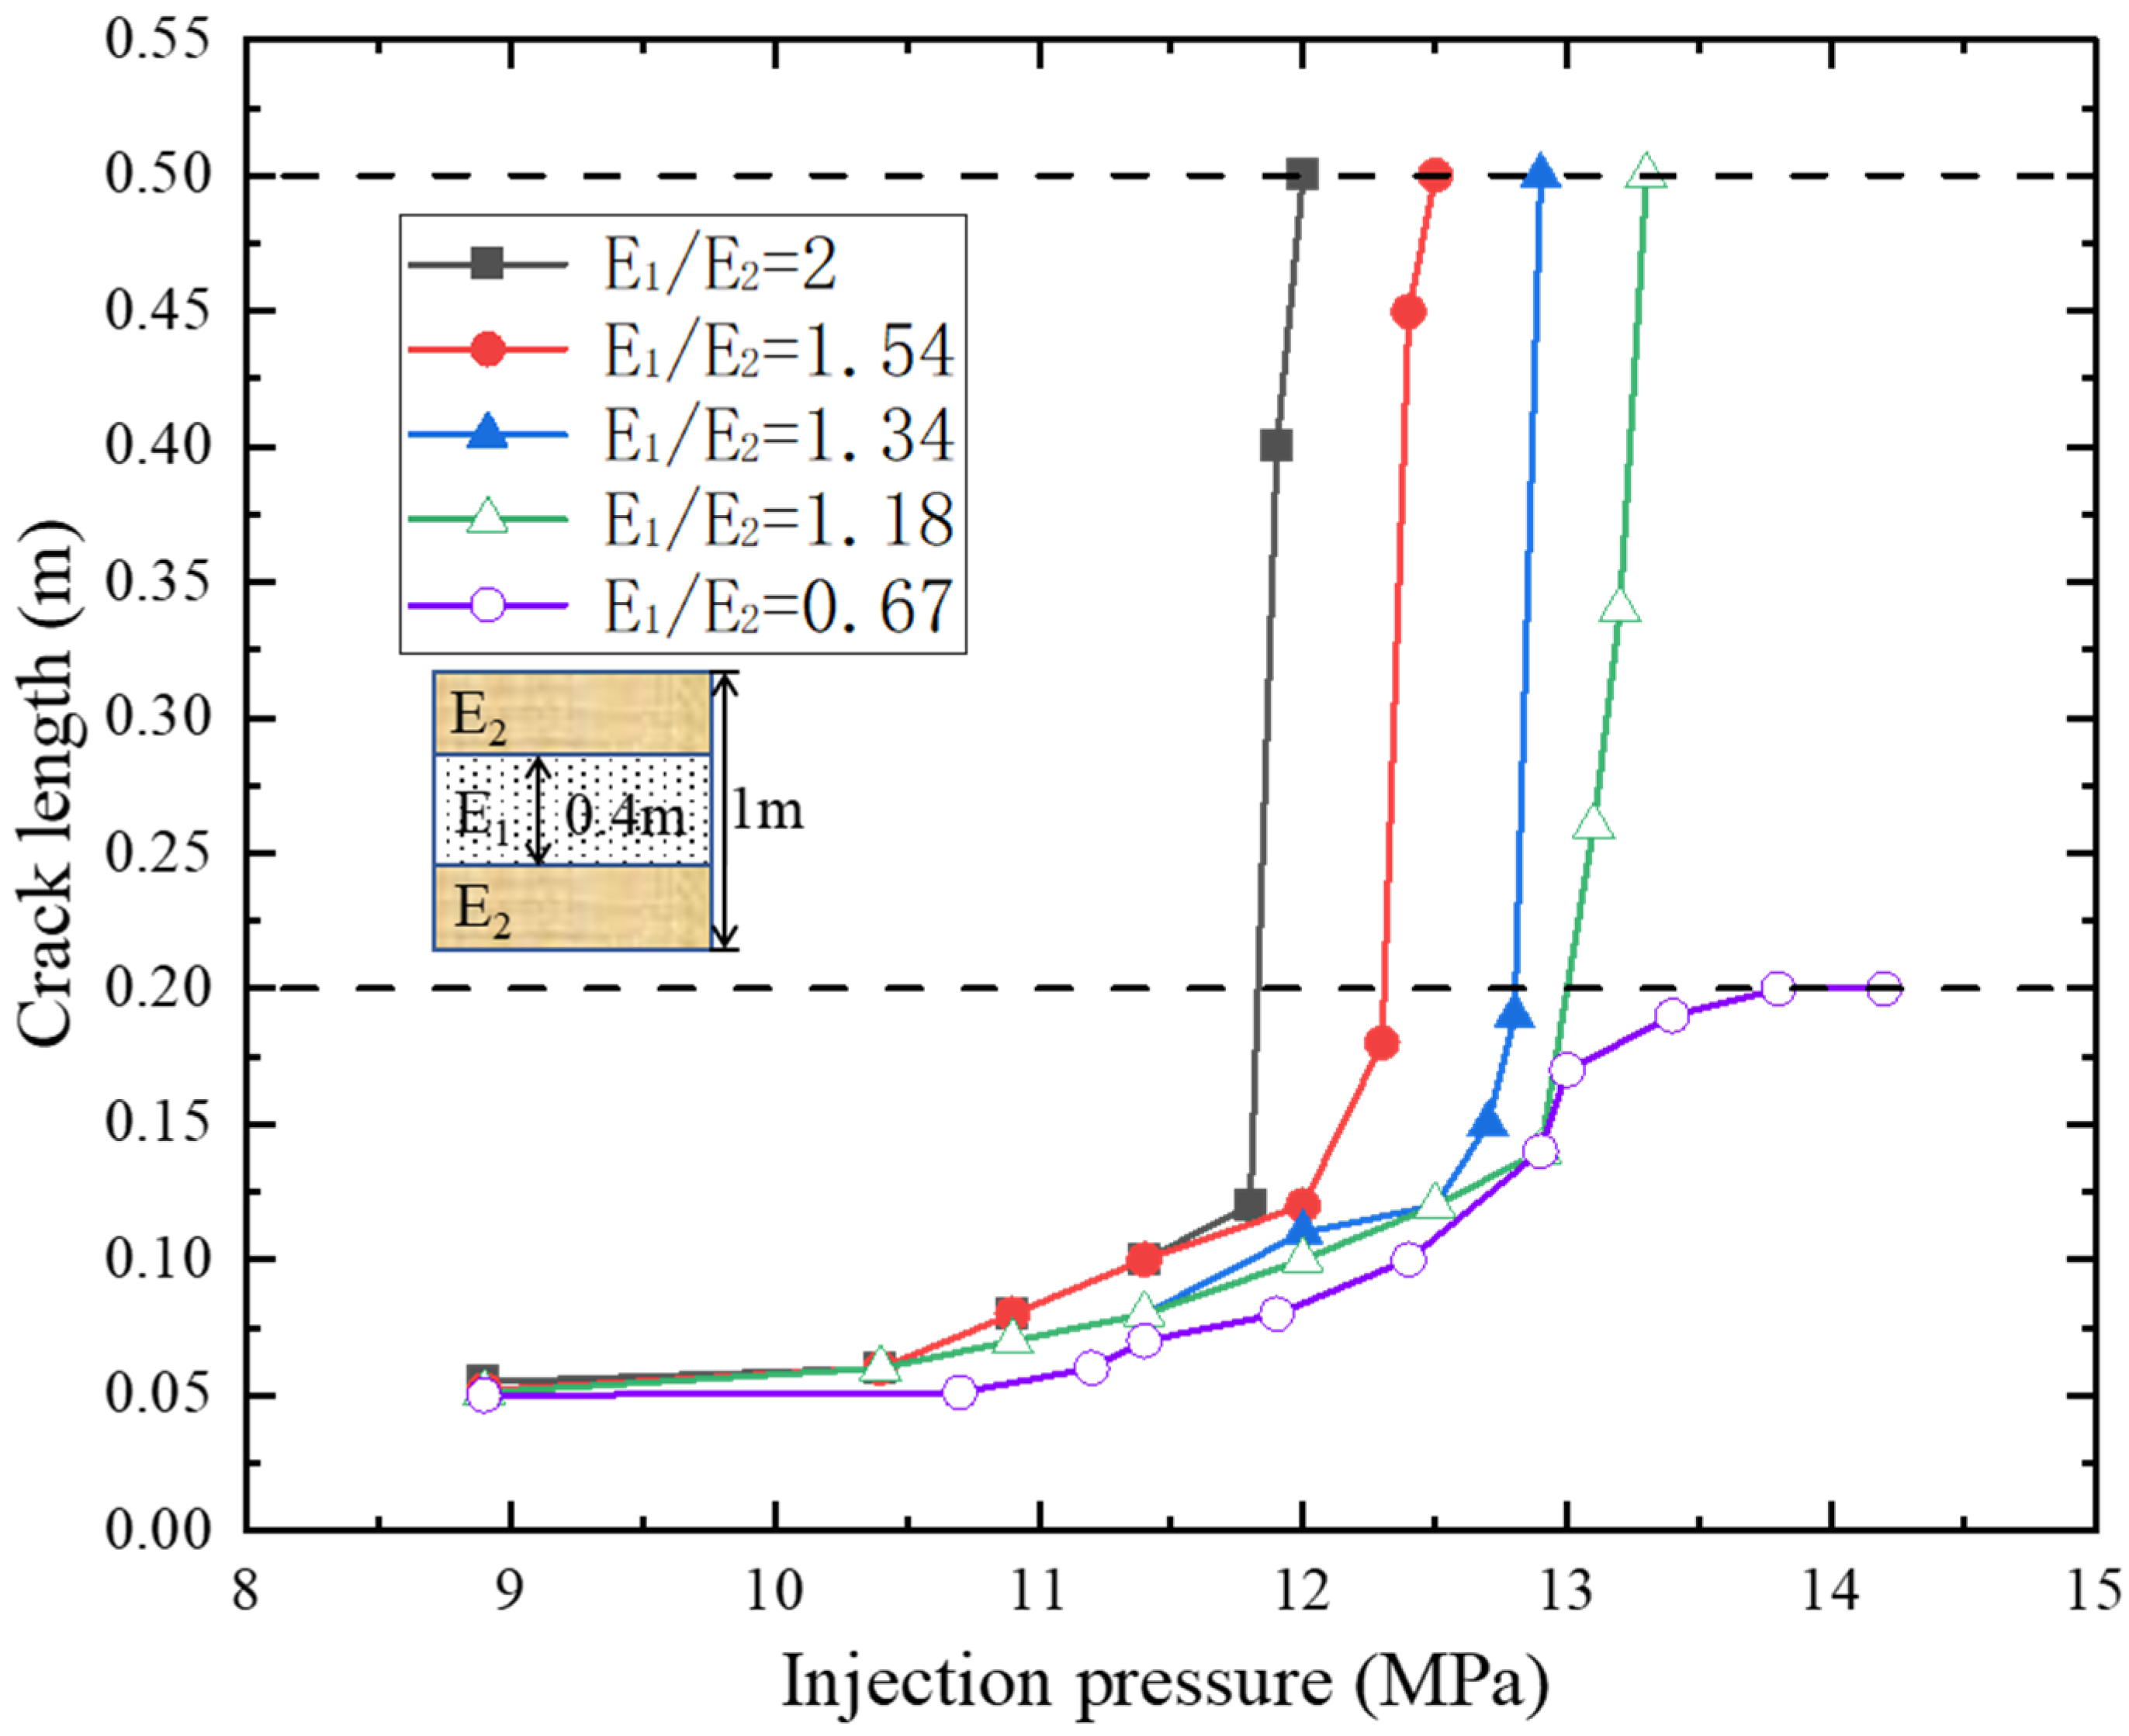
As shown in Figure 25, the elastic moduli of the two lithologic reservoirs are E1 and E2, respectively. The fracture length is 0.2 m and 0.5 m, which represent the distance from the borehole to the different lithologic reservoir interface and the distance from the borehole to the reservoir boundary, respectively. When E1/E2 is bigger than 1, the elastic modulus of the middle reservoir is higher than those of the upper and lower reservoirs, the fracture length gradually increases with the injection of fracturing fluid. The sample is destroyed after the fracture length reaches 0.5 m. If E1/E2 is smaller than 1, the fractures gradually increase with the increase in injection pressure but stops propagation when the fractures propagate to the interface of different lithologic reservoirs. The longest fracture is 0.2 m.
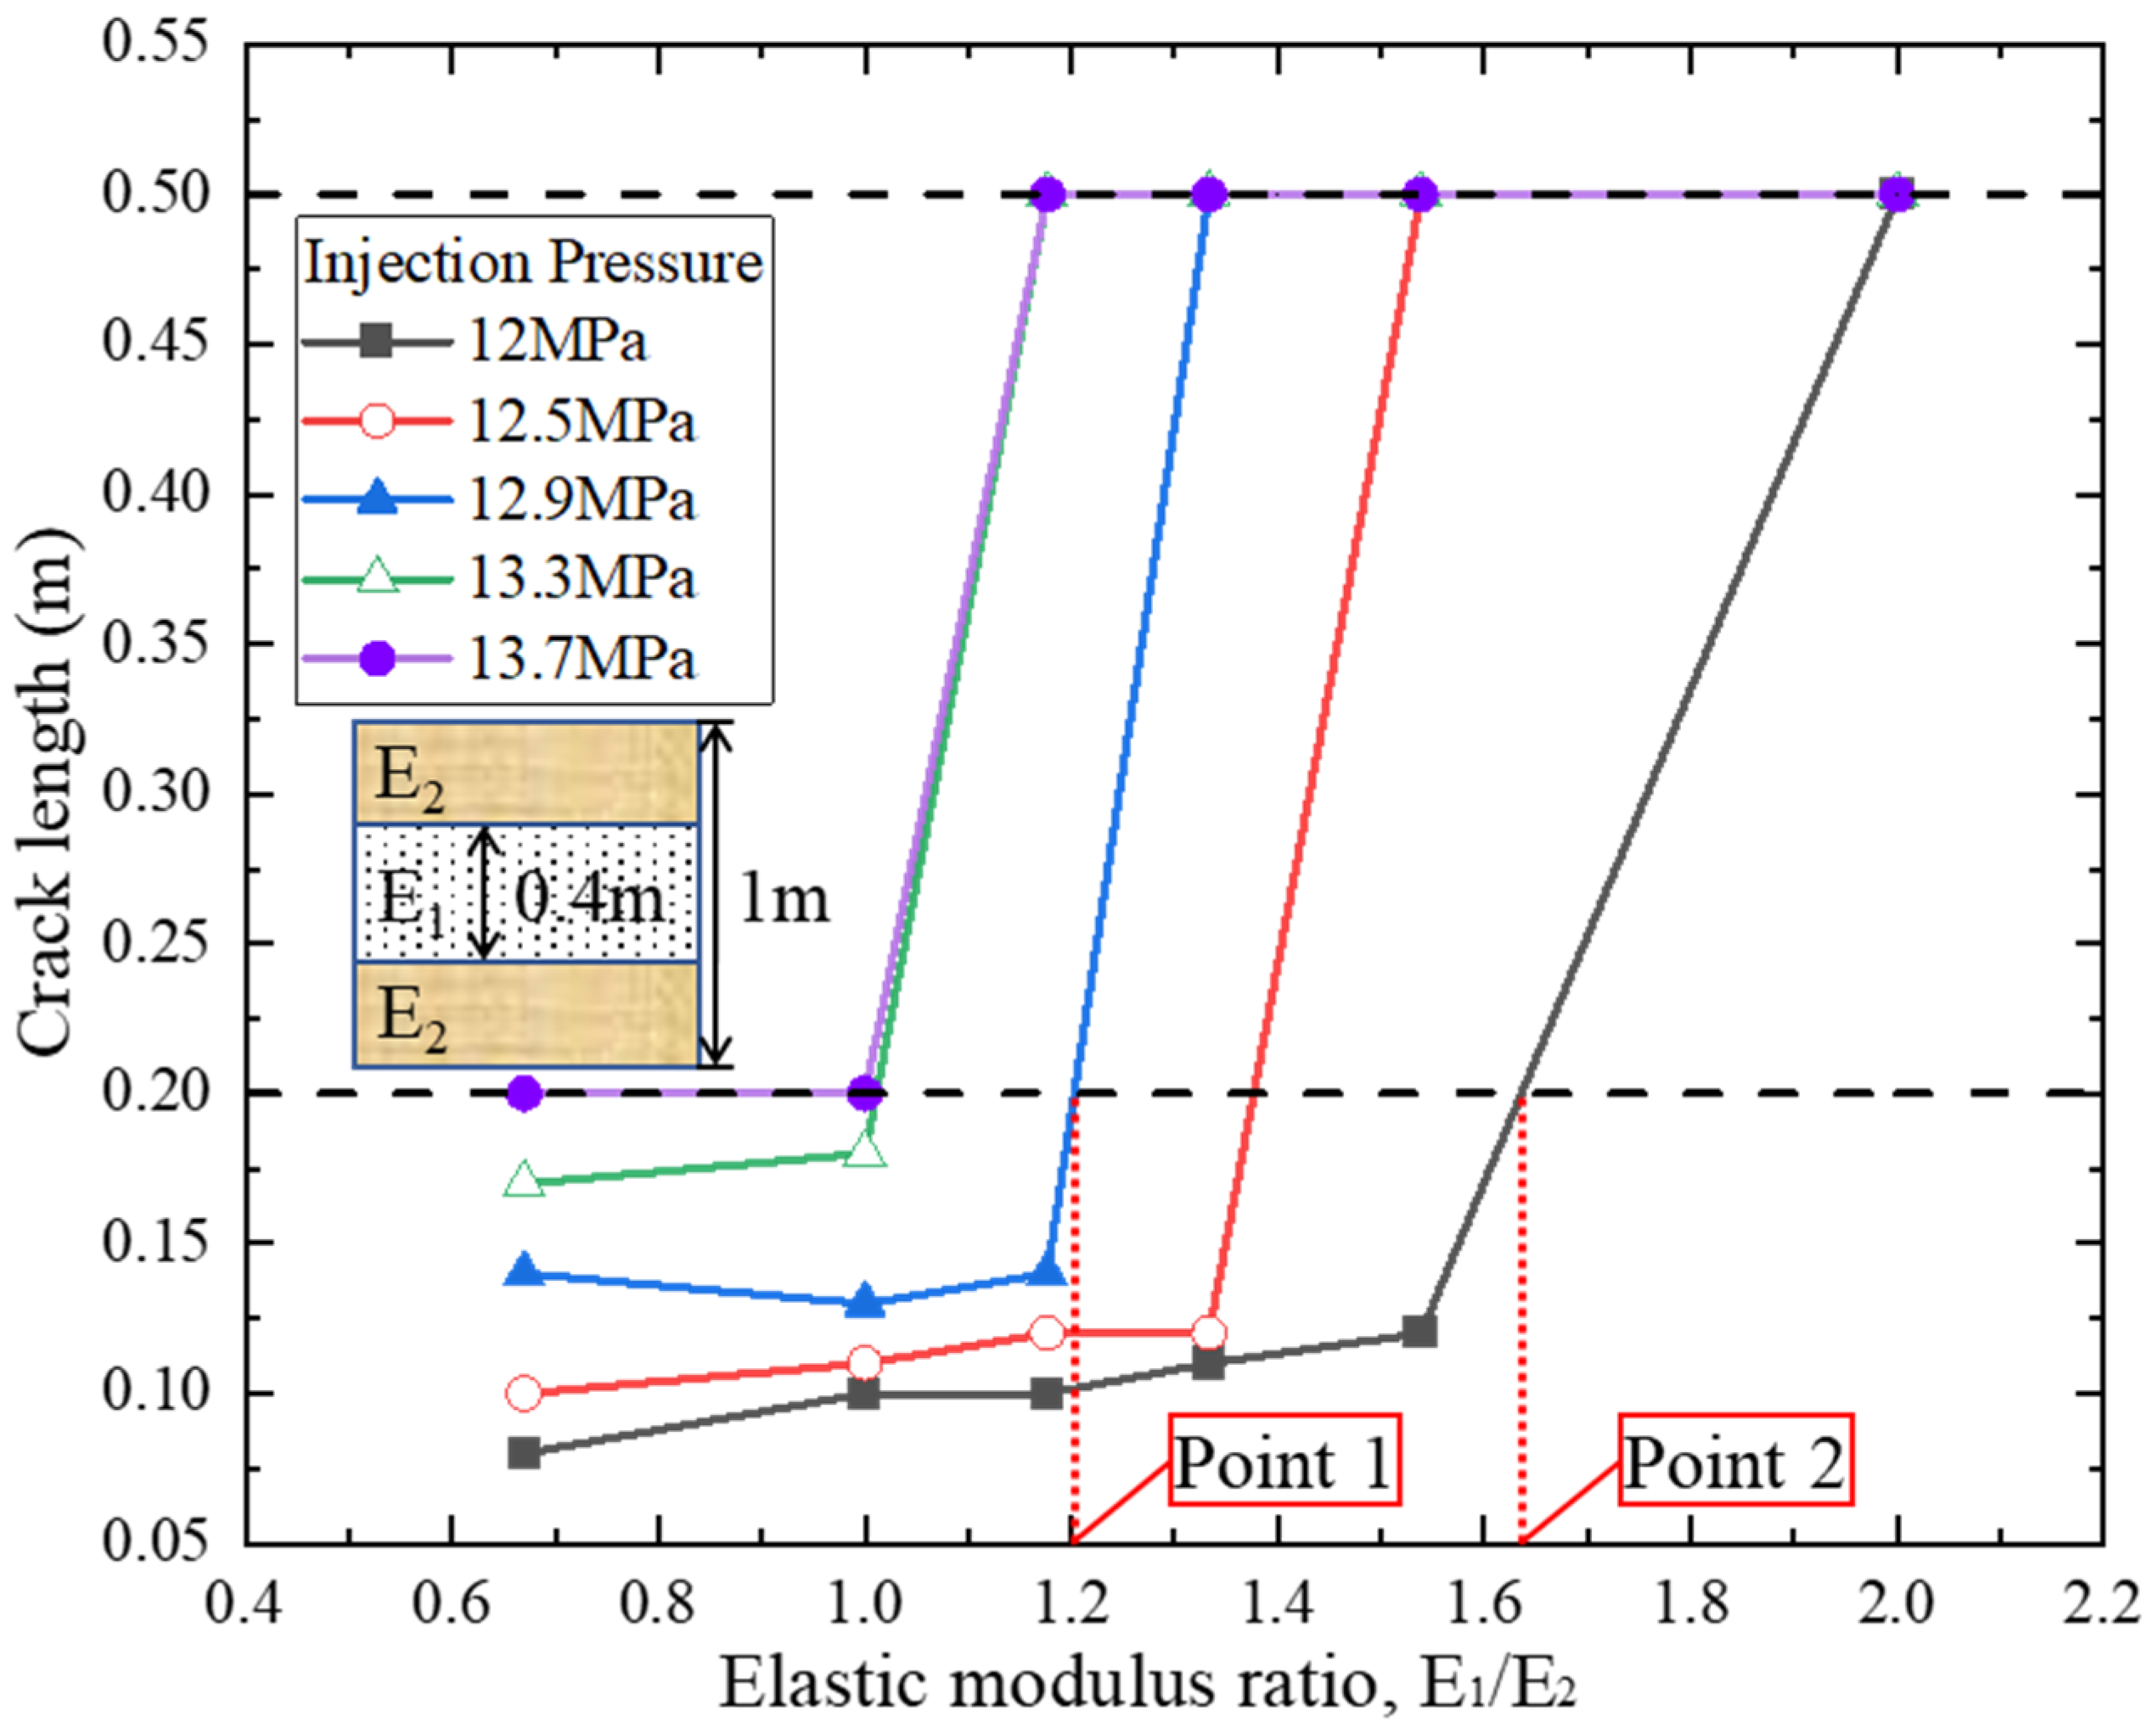
At a constant injection pressure, the elastic modulus ratio of the different lithologic reservoirs is an index to determine whether the fracture can pass through the reservoir interface or not. The injection pressures of 12 MPa and 12.9 MPa are taken as examples as shown in Figure 26, the abscissa of intersection of the curve and y = 0.2 m is the critical elastic modulus ratio at which the fracture can propagate through the different lithologic reservoirs interface under this pressure. Among them, the critical point is point 1 for the injection pressure of 12.9 MPa and point 2 for the injection pressure of 12 MPa. The modulus ratio is 1.201 at point 1 and 1.62 at point 2; that is to say, when the injection pressure is 12 MPa, the fracture can pass through the reservoir interface only when the elastic modulus ratio is greater than 1.62; when the injection pressure is 12.9 MPa, the fracture can pass through the reservoir interface only when the elastic modulus ratio is greater than 1.201.

5.5. Conceptual Zoning for Hydraulic Fracture Propagation through Reservoir Interface

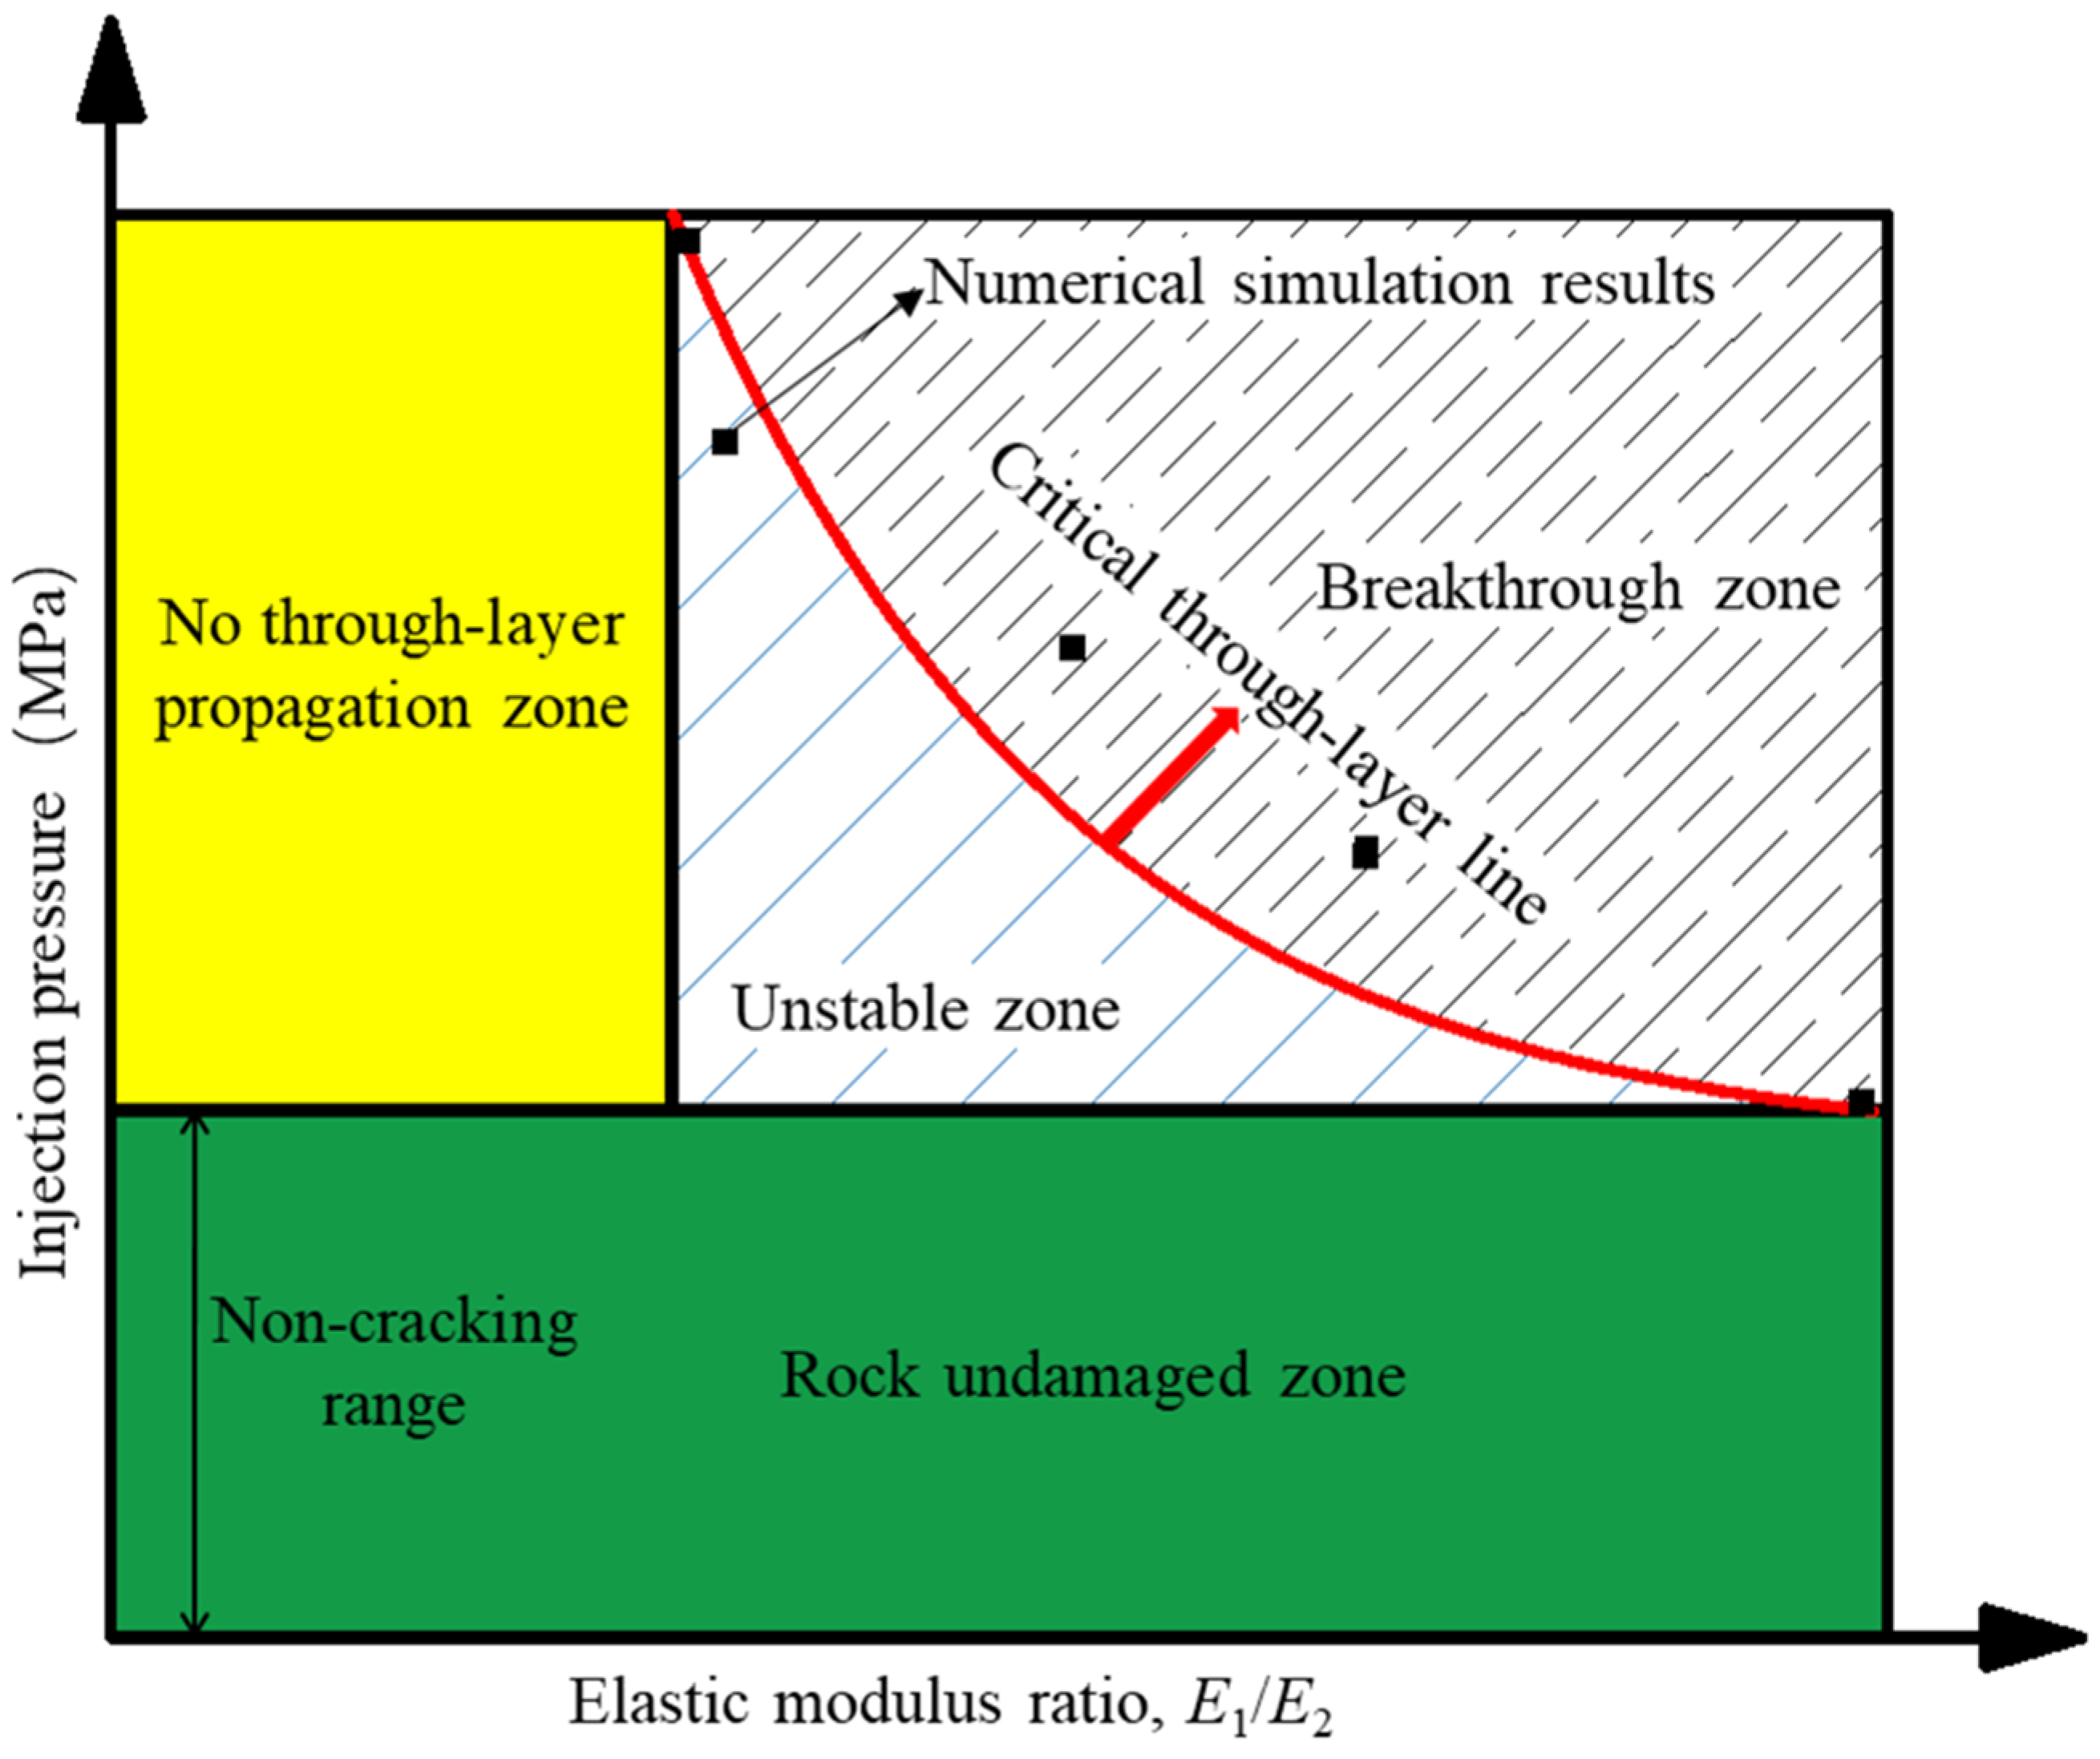
The effect of hydraulic fracture propagation through the reservoir interface can be described by the conceptual zoning in Figure 27. The horizontal axis is the elastic modulus ratio of adjacent reservoirs with different lithology, and the vertical axis is the injection pressure. This diagram is drawn based on injection pressure, reservoir properties and potential interactions. The whole zone is divided into the undamaged zone, no through-layer propagation zone, unstable zone and breakthrough zone. When the injection pressure is within the non-cracking pressure range, the reservoir has no damage. At this time, the fracture is not initialized, and this zone is called the rock undamaged zone. When the injection pressure is over the non-cracking range, the rock will be damaged, and the fracture will propagate in the reservoir. When the elastic modulus ratio between adjacent reservoirs is within the range of the modulus ratio of no through-layer propagation, the fracture can only propagate in this reservoir and will not pass through the reservoir interface. This zone is called the no through-layer propagation zone. When the injection pressure exceeds the non-cracking pressure range and the elastic modulus ratio between adjacent reservoirs exceeds the modulus ratio range of no through-layer propagation, the fracture propagates with pressure injection. When the injection pressure or elastic modulus ratio reaches a critical value, the fracture passes through the reservoir interface and propagates in the adjacent reservoir.
The unstable zone and breakthrough zone form a multi-physical interaction zone. This zone is bounded by both the non-cracking pressure and the modulus ratio of no through-layer propagation. The multi-physical interaction may occur in this zone and affect the path of crack propagation. The black points are the numerical simulations under different injection pressures and elastic modulus ratios. The red line is the critical through-layer line which is obtained by fitting the simulation results. The critical through-layer line divides the zone into unstable zone and breakthrough zone. In an unstable zone, fractures cannot pass through the reservoir interface for the current conditions. In the penetration zone, fractures will directly pass through the reservoir interface. Thus, this critical through-layer line can be crossed either by increasing injection pressure or changing the ratio of reservoir elastic modulus. For example, if a process is in an unstable zone at the beginning, the breakthrough zone may be activated with the increase in injection pressure which will make the fracture pass through the reservoir interface.

5.6. Influence of Stress State and Fracturing Fluid Viscosity on Fracture Propagation through Layers

Figure 20 shows that the stress state has no effect on the fracture propagation through the layer interface. With the increase in pressure ratio, the pressure required for fracture propagation gradually increases. However, under different stress states, fractures are easy to expand from a harder reservoir to a softer reservoir, but it is difficult to propagate from a softer reservoir to a harder reservoir. In hydraulic fracturing, the viscosity of fracturing fluid has a significant influence on the fracture’s propagation. The Model 3 is taken as an example in Section 4.5 to establish three groups of numerical simulations. Figure 21 shows that the pressure required for fracture propagation gradually increases with the increase in fracturing fluid viscosity. When the fracturing fluid is 0.75, the fracture needs less pressure for further propagation. The viscosity of fracturing fluid has no effect on the fracture propagation through the reservoir interface. The difference of elastic modulus has a greater influence on the fracture propagating through the reservoir interface than the viscosity of the fracturing fluid.

6. Conclusions

In this study, a mechanical model for the stress intensity factor of I/II mixed fractures was proposed and a seepage/mechanical-damage model for the hydraulic fracturing of coal-measure superimposed reservoirs was established. These two models fully considered the mechanical deformation of the sandstone–coal reservoir, water flow and damage criteria. These models were verified by hydraulic fracturing experiments on shale, sandstone and coal. Based on these studies, the following conclusions can be drawn.
First, the change of stress intensity factor can reflect the capacity of fracture propagation through the reservoir interface. When the reservoir on the other side of the interface has a lower elastic modulus, the stress intensity factor gradually increases, and the hydraulic fracture propagates through the interface.
Second, the elastic modulus difference of reservoirs has a significant effect on the propagation of fractures through the reservoir interface and the fracture width. When the reservoir on the other side of the interface has a lower elastic modulus, the fracture can easily propagate through the reservoir interface, and the fracture width increases. Conversely, it is difficult for the fractures to propagate through the reservoir interface and the fracture appears to bifurcate.
Thirdly, the elastic modulus ratio of adjacent reservoirs is as an evaluation index of the fracture’s propagation through the reservoir interface. When the injection pressure is constant, only when the critical value of the elastic modulus ratio is exceeded can the fracture propagate through the reservoir interface.
Last, when the buried depth is constant—that is, when the vertical stress is constant—the stress ratio (which is always less than 1) and the fracturing fluid viscosity have little influence on the fracture’s propagation through the reservoir interface.

Author Contributions

Methodology, J.W; Software, R.S.; Validation, W.L.; Formal analysis, P.L.; Investigation, P.L.; Resources, J.W.; Data curation, W.L. and R.S.; Writing—original draft, P.L.; Writing—review & editing, J.W. All authors have read and agreed to the published version of the manuscript.

Funding

The authors are grateful for the financial support from the National Natural Science Foundation of China [No. 42030810, 51674246].

Institutional Review Board Statement

Not applicable.

Informed Consent Statement

Not applicable.

Data Availability Statement

The data presented in this study are available on request from the Corresponding author.

Conflicts of Interest

The authors declare no conflict of interest.

Appendix A

The Fourier inversion used in this paper is [13,14]
0 [ κ Ι + 1 2 + ξ y ] B Ι Ι ( ξ ) e y ξ d ξ = 0 [ ( 1 + E Ι ξ ( 1 + μ Ι ) β t ) C Ι Ι ( ξ ) + C Ι Ι Ι ( ξ ) ( κ Ι + E Ι ξ ( κ Ι + 1 ) 2 ( 1 + μ Ι ) β t ) D Ι Ι ( ξ ) + κ Ι Ι D Ι Ι Ι ( ξ ) ] sin ( ξ y ) d ξ
0 ( 1 + ξ y ) B Ι Ι ( ξ ) ξ e y ξ d ξ = 0 [ ( ξ + ( 1 + μ Ι ) β n E Ι ) C Ι ( ξ ) ( 1 + μ Ι ) β n E Ι C Ι Ι Ι ( ξ ) ( κ Ι 1 ) ξ 2 D Ι Ι ( ξ ) ] cos ( ξ y ) d ξ
0 [ ξ y κ Ι + 1 2 ] B Ι Ι Ι ( ξ ) e y ξ d ξ = 0 [ ( 1 + E Ι ξ ( 1 + μ Ι ) β n ) C Ι Ι Ι ( ξ ) C Ι Ι Ι Ι ( ξ ) E Ι ξ ( κ Ι 1 ) 2 ( 1 + μ Ι ) β n D Ι Ι Ι ( ξ ) ] sin ( ξ y ) d ξ
0 ( 1 + ξ y ) B Ι Ι Ι ( ξ ) ξ e y ξ d ξ = 0 [ E Ι Ι ( 1 + μ Ι ) E Ι ( 1 + μ Ι Ι ) C Ι Ι Ι Ι ( ξ ) C Ι Ι Ι ( ξ ) + κ Ι + 1 2 D Ι Ι Ι ( ξ ) + E Ι Ι ( 1 + μ Ι ) ( κ Ι Ι + 1 ) 2 E Ι ( 1 + μ Ι Ι ) D Ι Ι Ι Ι ( ξ ) ] ξ cos ( ξ y ) d ξ .
The Fourier inverse transform is applied to Equations (A1)–(A4), and we obtain
( 1 + E Ι ξ ( 1 + μ Ι ) β t ) C Ι Ι ( ξ ) + C Ι Ι Ι ( ξ ) ( κ Ι + E Ι ξ ( κ Ι + 1 ) 2 ( 1 + μ Ι ) β t ) D Ι Ι ( ξ ) + κ Ι Ι D Ι Ι Ι ( ξ ) = G 1
( ξ + ( 1 + μ Ι ) β n E Ι ) C Ι Ι ( ξ ) ( 1 + μ Ι ) β n E Ι C Ι Ι Ι ( ξ ) ( κ Ι 1 ) ξ 2 D Ι Ι ( ξ ) = G 2
( 1 + E Ι ξ ( 1 + μ Ι ) β n ) C Ι Ι Ι ( ξ ) C Ι Ι Ι Ι ( ξ ) E Ι ξ ( κ Ι 1 ) 2 ( 1 + μ Ι ) β n D Ι Ι Ι ( ξ ) = G 3
C Ι Ι Ι ( ξ ) + E Ι Ι ( 1 + μ Ι ) E Ι ( 1 + μ Ι Ι ) C Ι Ι Ι Ι ( ξ ) + κ Ι + 1 2 D Ι Ι Ι ( ξ ) + E Ι Ι ( 1 + μ Ι ) ( κ Ι Ι + 1 ) ξ E Ι ( 1 + μ Ι Ι ) D Ι Ι Ι Ι ( ξ ) = G 4
with
G 1 = 2 π 0 [ κ Ι + 1 2 ξ ξ 2 + η 2 + 2 ξ η 2 ( ξ 2 + η 2 ) 2 ] C Ι Ι ( η ) d η
G 2 = 2 π 0 [ η 2 ξ 2 + η 2 + η 2 ( η 2 ξ 2 ) ( ξ 2 + η 2 ) 2 ] C Ι Ι ( η ) d η
G 3 = 2 π 0 [ κ Ι + 1 2 ξ ξ 2 + η 2 + 2 ξ η 2 ( ξ 2 + η 2 ) 2 ] B Ι Ι Ι ( η ) d η
G 4 = 2 π ξ 0 [ η 2 ξ 2 + η 2 + η 2 ( η 2 ξ 2 ) ( ξ 2 + η 2 ) 2 ] B Ι Ι Ι ( η ) d η .

Appendix B

The integral formula used in this paper is [52]
0 e y η sin ( ξ y ) d y = ξ ξ 2 + η 2 ,   0 y e y η sin ( ξ y ) d y = 2 η ξ ( ξ 2 + η 2 ) 2
0 e y η cos ( ξ y ) d y = η ξ 2 + η 2 ,   0 y e y η cos ( ξ y ) d y = η 2 ξ 2 ( ξ 2 + η 2 ) 2
2 π 0 sin ( s ξ ) cos ( x ξ ) d ξ = 1 π ( 1 s x + 1 s + x )
0 sin ( s η ) ( ξ 2 + η 2 ) η d η = π ( 1 e ξ s ) 2 ξ 2 ,   0 η sin ( s η ) ξ 2 + η 2 d η = π 2 e ξ s
0 η sin ( s η ) ( ξ 2 + η 2 ) 2 d η = π s 4 ξ e ξ s .

Appendix C

Auxiliary function used in this paper is [13,14]
g ( x ) = 0 B Ι ( ξ ) ξ sin ( ξ x ) d ξ a < x < c
x = c a 2 x ¯ + c + a 2 ,   s = c a 2 s ¯ + c + a 2 ,   g Ι ( s ) = ( 1 + v Ι ) σ 0 E Ι g Ι ¯ ( s ¯ ) ,   g Ι Ι ( s ) = ( 1 + v Ι ) τ 0 E Ι g Ι Ι ¯ ( s ¯ ) .

References

  1. Xie, H.; Leung, C.; Wang, J.; Li, X. Advancing deep underground research through integration of engineering and science. Deep. Undergr. Sci. Eng. 2022, 1, 1–2. [Google Scholar] [CrossRef]
  2. Hu, L.; Wang, J.; Ali Karrech Li, X.; Zhao, P.; Liu, L. Exploring the frontiers of deep underground sciences and engineering—China Yunlong Lake Laboratory is striving to be the best. Deep. Undergr. Sci. Eng. 2022, 1, 130–136. [Google Scholar] [CrossRef]
  3. Li, Z.; Wang, S.; Li, L.; Zhang, J. Numerical investigation on interference of multiple hydraulic fractures in layered formation. Front. Earth Sci. 2022, 10, 865155. [Google Scholar] [CrossRef]
  4. Lu, Y.; Zhang, H.; Zhou, Z.; Ge, Z.; Chen, C.; Hou, Y.; Ye, M. Current status and effective suggestions for efficient exploitation of coalbed methane in China: A review. Energy Fuels 2021, 35, 9102–9123. [Google Scholar] [CrossRef]
  5. Ali, R.; Fahd, S.; Birol, D.; Mohamed, Y. A review on factors influencing the rock mechanics of the gas bearing formations. J. Nat. Gas Sci. Eng. 2020, 80, 103348. [Google Scholar]
  6. Zou, C.; Yang, Z.; Huang, S.; Ma, F.; Sun, Q.; Li, F.; Pan, S.; Tian, W. Resource types, formation, distribution and prospects of coal-measure gas. Pet. Explor. Dev. 2019, 46, 451–462. [Google Scholar] [CrossRef]
  7. Pouria, B.; Mohammad, B.; Alireza, G.; Sohrab, Z. A new technique to conduct hydraulic fracture design in coal bed methane reservoirs by incorporating stress variations. J. Pet. Sci. Eng. 2019, 174, 1208–1222. [Google Scholar]
  8. Vanessa, S.; Ayrton, R.; Raymond, J.; Suzanne, H.; Zhen, J. Modeling and economic analyses of graded particle injections in conjunction with hydraulic fracturing of coal seam gas reservoirs. SPE J. 2022, 27, 1633–1647. [Google Scholar]
  9. Wang, H.; Wu, Z.; Wang, Y.; Yu, R. Investigation on crack propagation perpendicular to mortar–rock interface: Experimental and numerical. Int. J. Fract. 2020, 226, 45–69. [Google Scholar] [CrossRef]
  10. Zhou, B.; Zhou, C.; Yu, X.; Chang, L.; Li, J.; Miao, X.; Ye, C.; Zhang, B. Investigation on the fatigue crack behavior of Zr702/TA2/Q345R mixed plate with a crack normal to interface. Fatigue Fract. Eng. Mater. Struct. 2019, 43, 20–35. [Google Scholar] [CrossRef]
  11. Zhou, B.; Zhou, L.; Chang, L.; Zhou, C.; Ye, C.; Zhang, B. Investigation on fatigue crack propagation law of the crack perpendicular to interface for Zr/Ti/steel mixed plate. Int. J. Press. Vessel. Pip. 2022, 195, 104594. [Google Scholar] [CrossRef]
  12. Li, S.; Wang, J. The stress intensity factor and propagation of an inclined crack in the central layer of a mixed laminate under tension. Theor. Appl. Fract. Mech. 2018, 93, 128–136. [Google Scholar] [CrossRef]
  13. Zhong, X.; Li, X.; Lee, K. Analysis of a mode-I crack perpendicular to an imperfect interface. Int. J. Solids Struct. 2009, 46, 1456–1463. [Google Scholar] [CrossRef] [Green Version]
  14. Zhong, X.; Zhang, K. Fracture analysis of mode-II crack perpendicular to imperfect bimaterial interface. Appl. Math. Mech. 2012, 33, 357–370. [Google Scholar] [CrossRef]
  15. Wu, J.; Yang, X.; Song, Y.; Sun, Q.; Pei, Y. Study on a new inversion method for non-uniform distribution of rock material parameters. Bull. Eng. Geol. Environ. 2022, 81, 280. [Google Scholar] [CrossRef]
  16. Xia, B.; Li, Y.; Hu, H.; Luo, Y.; Peng, J. Effect of crack angle on mechanical behaviors and damage evolution characteristics of sandstone under uniaxial compression. Rock Mech. Rock Eng. 2022, 55, 6567–6582. [Google Scholar] [CrossRef]
  17. Xi, X.; Zoe, K.S.; Jackie, E.K.; Andrew, F.; Julien, M.; Katriona, E.; Christopher, I.M.; Yang, S. Mixed-mode fracture modelling of the near-wellbore interaction between hydraulic fracture and natural fracture. Rock Mech. Rock Eng. 2022, 55, 5433–5452. [Google Scholar] [CrossRef]
  18. Ju, M.; Li, X.; Li, X.; Zhang, G. A review of the effects of weak interfaces on crack propagation in rock: From phenomenon to mechanism. Eng. Fract. Mech. 2022, 263, 108297. [Google Scholar] [CrossRef]
  19. Mahmoud, K.; Alissar, Y.; Elsa, M. Propagation and geometry of multi-stage hydraulic fractures in anisotropic shales. Geomech. Geophys. Geo-Energy Geo-Resour. 2022, 8, 124. [Google Scholar]
  20. Ren, Q.; Zhao, Y.; Zhu, X.; Zhou, Y.; Jiang, Y.; Wang, P.; Zhang, C. CDEM-based simulation of the 3D propagation of hydraulic fractures in heterogeneous Coalbed Methane reservoirs. Comput. Geotech. 2022, 152, 104992. [Google Scholar] [CrossRef]
  21. Tian, F.; Jin, Y.; Jin, F.; Ma, X.; Shi, L.; Zhang, J.; Qiu, D.; Zhang, Z. Multi-fracture synchronous propagation mechanism of multi-clustered fracturing in interlayered tight sandstone reservoir. Sustainability 2022, 14, 8768. [Google Scholar] [CrossRef]
  22. Dou, F.; Wang, J.G. A numerical investigation for the impacts of shale matrix heterogeneity on hydraulic fracturing with a two-dimensional particle assemblage simulation model. J. Nat. Gas Sci. Eng. 2022, 104, 104678. [Google Scholar] [CrossRef]
  23. Dou, F.; Wang, J.G.; Wang, H.; Hu, B.; Li, C. Discrete element analysis for hydraulic fracture propagations in laminated reservoirs with complex initial joint properties. Geofluids 2019, 2019, 3958583. [Google Scholar] [CrossRef]
  24. Luis, A.; Vargas, E.D.A., Jr.; Raquel, Q.; Glaucio, H. Simulation of hydraulic fracturing processes in rocks by coupling the lattice Boltzmann model and the Park-Paulino-Roesler potential-based cohesive zone mode. Int. J. Rock Mech. Min. Sci. 2018, 112, 339–353. [Google Scholar]
  25. Zhao, H.; Wang, X.; Liu, Z.; Yan, Y.; Yang, H. Investigation on the hydraulic fracture propagation of multilayers-commingled fracturing in coal measures. J. Pet. Sci. Eng. 2018, 167, 774–784. [Google Scholar] [CrossRef]
  26. Afşar, F.; Luijendijk, E. Quantifying a critical marl thickness for vertical fracture extension using field data and numerical experiments. Geosci. Front. 2019, 10, 2135–2145. [Google Scholar] [CrossRef]
  27. Zhao, J.; Zhao, J.; Hu, Y.; Zhang, S.; Huang, T.; Liu, X. Numerical simulation of multistage fracturing optimization and application in coalbed methane horizontal wells. Eng. Fract. Mech. 2020, 223, 106738. [Google Scholar] [CrossRef]
  28. Wang, K.; Tang, S.; Zhang, S.; Guo, Y.; Lin, D.; Niu, Z. Numerical simulation of fracture propagation characteristics of hydraulic fracturing in multiple coal seams, eastern Yunnan, China. Front. Earth Sci. 2022, 10, 854638. [Google Scholar] [CrossRef]
  29. Hadei, M.R.; Veiskarami, A. An experimental investigation of hydraulic fracturing of stratified rocks. Bull. Eng. Geol. Environ. 2020, 80, 491–506. [Google Scholar] [CrossRef]
  30. Zhang, X.; Wang, J.G.; Gao, F.; Ju, Y.; Liu, J. Impact of water and nitrogen fracturing fluids on fracturing initiation pressure and flow pattern in anisotropic shale reservoirs. Comput. Geotech. 2017, 81, 59–76. [Google Scholar] [CrossRef]
  31. Zhang, X.; Wang, J.G.; Gao, F.; Ju, Y. Impact of water, nitrogen and CO2 fracturing fluids on fracturing initiation pressure and flow pattern in anisotropic shale reservoirs. J. Nat. Gas Sci. Eng. 2017, 45, 291–306. [Google Scholar] [CrossRef]
  32. Cruz-González, O.L.; Rodríguez-Ramos, R.; Lebon, F.; Sabina, F.J. Modeling of imperfect viscoelastic interfaces in mixed materials. Coatings 2022, 12, 705. [Google Scholar] [CrossRef]
  33. Raffa, M.L.; Lebon, F.; Rizzoni, R. A micromechanical model of a hard interface with micro-cracking damage. Int. J. Mech. Sci. 2022, 216, 106974. [Google Scholar] [CrossRef]
  34. Hashemi, R. On the overall viscoelastic behavior of graphene/polymer nanomixeds with imperfect interface. Int. J. Mech. Sci. 2016, 105, 38–55. [Google Scholar]
  35. Chen, W.; Zhou, Y.; Lü, C.; Ding, H. Bending of multiferroic laminated rectangular plates with imperfect interlaminar bonding. Eur. J. Mech. A/Solids 2009, 28, 720–727. [Google Scholar] [CrossRef]
  36. Tan, P.; Jin, Y.; Hou, B.; Zheng, X.; Guo, X.; Gao, J. Experiments and analysis on hydraulic sand fracturing by an improved true tri-axial cell. J. Pet. Sci. Eng. 2017, 158, 766–774. [Google Scholar] [CrossRef]
  37. Shen, J.; Li, K.; Zhang, H.; Shabbiri, K.; Hu, Q.; Zhang, C. The geochemical characteristics, origin, migration and accumulation modes of deep coal-measure gas in the west of Linxing block at the eastern margin of Ordos Basin. J. Nat. Gas Sci. Eng. 2021, 91, 103965. [Google Scholar] [CrossRef]
  38. Shen, J.; Zhang, C.; Qin, Y.; Zhang, B. Effect factors on co-mining of sandstone gas and coalbed methane in coal series and threshold of parameter in Linxing block, Ordos Basin. Nat. Gas Geosci. 2017, 28, 479–487. [Google Scholar]
  39. Li, Y.; Yang, J.; Pan, Z.; Meng, S.; Wang, K.; Niu, X. Unconventional natural gas accumulations in stacked deposits: A discussion of upper paleozoic coal-bearing strata in the east margin of the Ordos Basin, China. Acta Geol. Sin. Engl. Ed. 2019, 93, 111–129. [Google Scholar] [CrossRef] [Green Version]
  40. Li, Y.; Cao, D.; Meng, S.; Niu, X.; Wu, P.; Xu, H.; Liu, J. Permeability and elastic parameters under different pressures of tight gas sandstones in eastern Ordos basin, China. J. Nat. Gas Sci. Eng. 2016, 35, 362–371. [Google Scholar] [CrossRef]
  41. Cheng, J.; Li, R.; Qin, X.; Li, D.; Zhao, B.; Li, J.; Wu, X.; Wang, N. Impact of diagenetic facies on mechanical properties of sandstone rock in low-permeability reservoirs: A case study of the Upper Paleozoic gas reservoir in east Ordos Basin. Acta Pet. Sin. 2016, 37, 1256–1264. [Google Scholar]
  42. Zhang, G.; Wang, D.; Zeng, Q.; Yang, H.; Li, Z.; Zhao, Z.; Guo, S. Characteristics of coal-measure source rock and gas accumulation belts in marine-continental transitional facies fault basins: A case study of the oligocene deposits in the Qiongdongnan Basin located in the northern region of the South China Sea. Energy Explor. Exploit. 2019, 37, 1752–1778. [Google Scholar]
  43. Wang, J.; DElsworth Wu, Y.; Liu, J.; Zhu, W.; Liu, Y. The influence of fracturing fluids on fracturing processes: A comparison between water, oil and SC-CO2. Rock Mech. Rock Eng. 2017, 51, 299–313. [Google Scholar] [CrossRef]
  44. Ma, D.; Duan, H.; Zhang, Q.; Zhang, J.; Li, W.; Zhou, Z.; Liu, W. A numerical gas fracturing model of coupled thermal, flowing and mechanical effects. Comput. Mater. Contin. 2020, 65, 2123–2141. [Google Scholar] [CrossRef]
  45. Zhang, X.; Lu, Y.; Tang, J.; Zhou, Z.; Liao, Y. Experimental study on fracture initiation and propagation in shale using supercritical carbon dioxide fracturing. Fuel 2016, 190, 370–378. [Google Scholar] [CrossRef]
  46. Yu, Y.; Zhu, W.; Li, L.; Wei, C.; Yan, B.; Li, S. Multi-fracture interactions during two-phase flow of oil and water in deformable tight sandstone oil reservoirs. J. Rock Mech. Geotech. Eng. 2020, 12, 821–849. [Google Scholar] [CrossRef]
  47. Zhang, X.; Wang, J.G.; Gao, F.; Wang, X. Numerical study of fracture network evolution during nitrogen fracturing processes in shale reservoirs. Energies 2018, 11, 2503. [Google Scholar] [CrossRef] [Green Version]
  48. Zhu, W.; Yu, Y.; Li, L.; Wei, C.; Zhang, X.; Qin, C.; Song, X. Simulations on hydraulic fracture propagation of coal-rock combination in deep underground. Hazard Control Tunn. Undergr. Eng. 2019, 1, 96–108. [Google Scholar]
  49. He, J.; Lin, C.; Li, X.; Wan, X. Experimental investigation of crack extension patterns in hydraulic fracturing with shale, sandstone and granite cores. Energies 2016, 9, 1080. [Google Scholar] [CrossRef] [Green Version]
  50. Gai, D.; Zhu, W.; Wei, C.; Niu, L. Pulse fracturing model based on damage mechanics and its numerical simulation. J. Min. Saf. Eng. 2016, 33, 945–950. [Google Scholar]
  51. Tan, P.; Jin, Y.; Han, K.; Zheng, X.; Hou, B.; Gao, J.; Chen, M.; Zhang, Y. Vertical propagation behavior of hydraulic fractures in coal measure strata based on true triaxial experiment. J. Pet. Sci. Eng. 2017, 158, 398–407. [Google Scholar] [CrossRef]
  52. Gradshteyn, I.S.; Ryzhik, I.M. Table of Integrals Series and Products; Academic Press: New York, NY, USA, 1980. [Google Scholar]
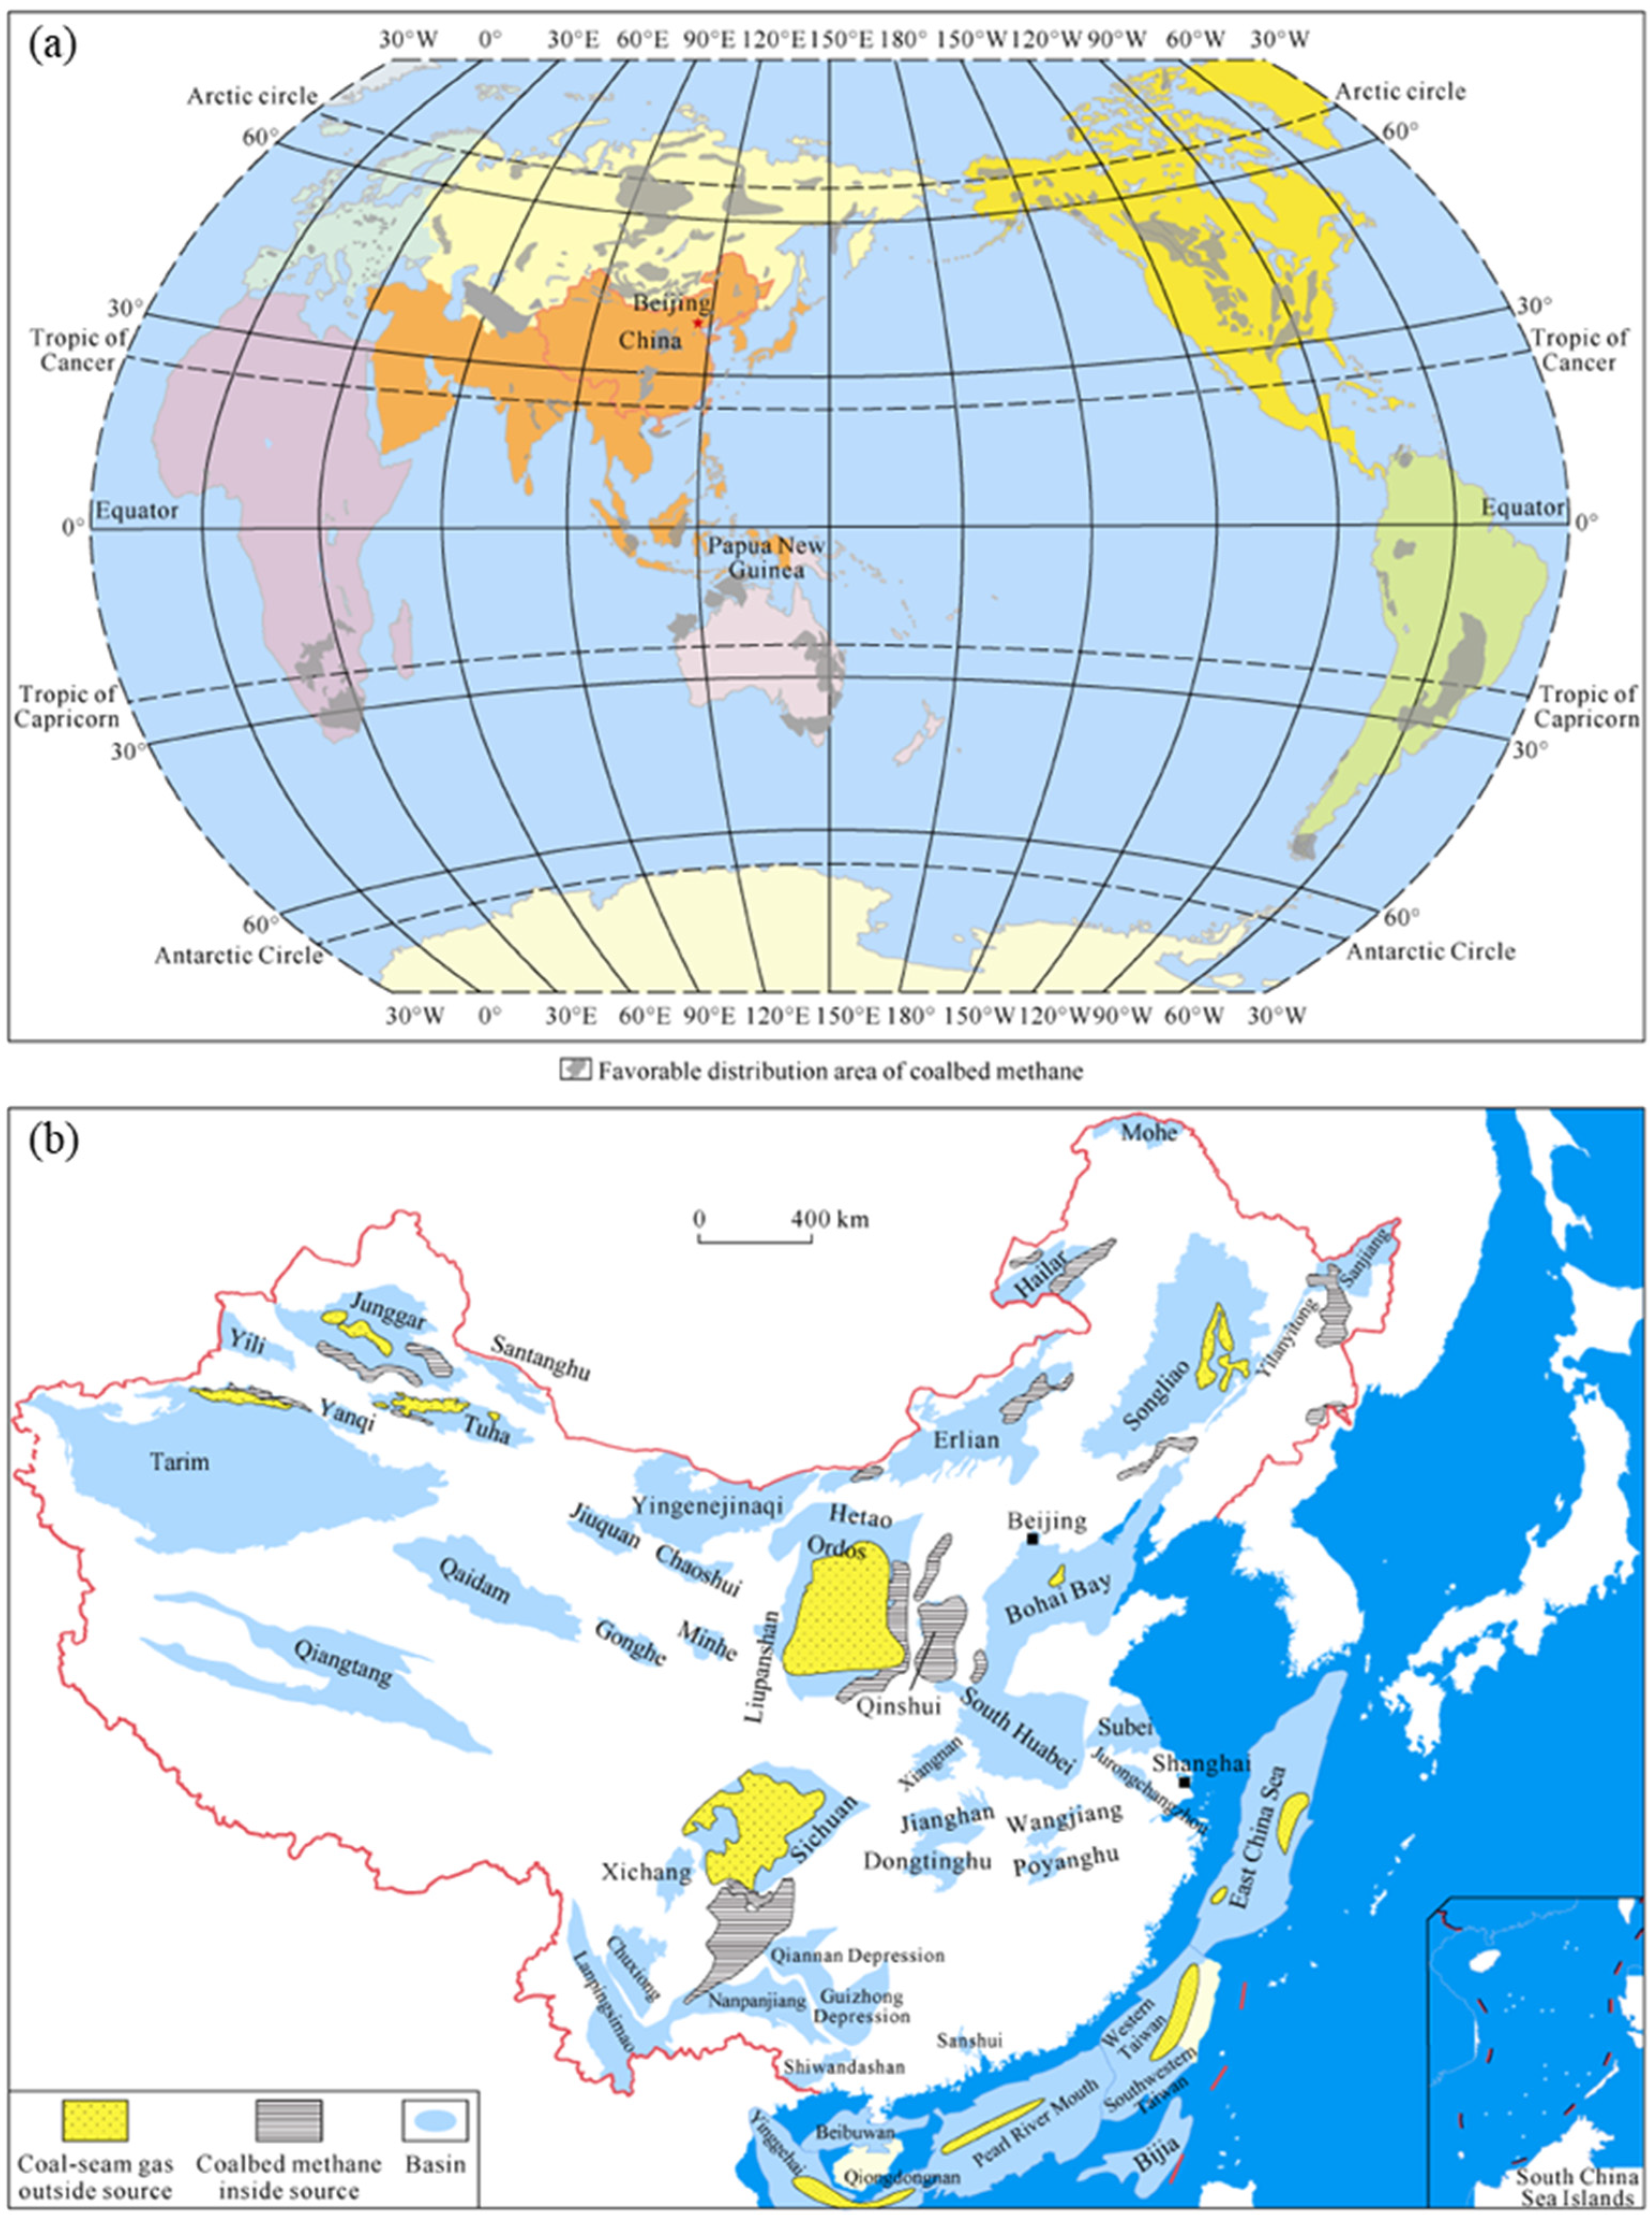
Figure 1. Distribution of coal-measure gas areas (a) Distribution of coal-measure gas areas in the world, (b) Distribution of coal-measure gas areas in China [6].
Sustainability 15 04597 g001
Figure 2. Schematic diagram of mixed type I/II fractures.
Sustainability 15 04597 g002
Figure 3. Schematic diagram of a crack perpendicular to a bi-material interface.
Sustainability 15 04597 g003
Figure 4. Variation of stress intensity factor with the relative distance from crack tip to interface.
Sustainability 15 04597 g004
Figure 5. A typical coal-measure superimposed reservoir in the Linxing area [39].
Sustainability 15 04597 g005
Figure 6. Schematic diagram for horizontal well perforation (a) Schematic diagram of staged fracturing, (b) Planar graph of horizontal well perforation, (c) Schematic diagram of horizontal well perforation, (d) Planar graph of perforation.
Sustainability 15 04597 g006
Figure 7. A computational model for a sandstone–coal superimposed reservoir. (a) Geometry, (b) FEM mesh.
Sustainability 15 04597 g007
Figure 8. The elastic damage constitutive relation of rocks.
Sustainability 15 04597 g008
Figure 9. The flowchart of the computational procedure for the seepage-mechanical-damage numerical model.
Sustainability 15 04597 g009
Figure 10. Comparison between numerical simulation and experiment on shale hydraulic fracturing. (a) Step 526, (b) Step 560, (c) Step 599, (d) Experiment.
Sustainability 15 04597 g010
Figure 11. Comparison between numerical simulation and experiment on sandstone. (a) Experimental result, (b) Simulation result.
Sustainability 15 04597 g011
Figure 12. Comparison between numerical simulation and experiment on coal. (a) Step 25, (b) Step 50, (c) Step 74, (d) Experiment.
Sustainability 15 04597 g012
Figure 13. Comparison between numerical simulation and experiment on damage area.
Sustainability 15 04597 g013
Figure 14. The elastic modulus distribution for a coal–sandstone–coal superimposed reservoir.
Sustainability 15 04597 g014
Figure 15. The evolution of hydraulic fracture network in Model 1. (Step80 denotes the number of tension iteration steps; (1) denotes the number of shear iteration steps; 10 MPa is the injection pressure.). (a) Step80(1)-10 MPa, (b) Step100(1)-12 MPa, (c) Step100(60)-12.1 MPa, (d) Step100(120)-12.5 MPa, (e) Step100(135)-12.6 MPa, (f) Step100(172)-12.7 MPa.
Sustainability 15 04597 g015
Figure 16. The elastic modulus distribution of a sandstone–coal–sandstone reservoir.
Sustainability 15 04597 g016
Figure 17. The evolution of hydraulic fracture network in Model 2 (Step95 denotes the number of tension iteration steps; (1) denotes the number of shear iteration steps; 11.5 MPa is the injection pressure.). (a) Step95(1)-11.5 MPa, (b) Step105(1)-12.5 MPa, (c) Step110(1)-13 MPa, (d) Step115(1)-13.5 MPa, (e) Step120(1)-14 MPa, (f) Step122(1)-14.2 MPa, (g) Step125(1)-14.5 MPa, (h) Step126(13)-14.6 MPa, (i) Step132(11)-15.2 MPa.
Sustainability 15 04597 g017
Figure 18. Elastic modulus distribution of a superimposed reservoir with high elastic modulus rock and sandstone and coal.
Sustainability 15 04597 g018
Figure 19. The evolution of fracture network in Model 3 (Step90 denotes the number of tension iteration steps; (1) denotes the number of shear iteration steps; 11 MPa is the injection pressure.). (a) Step90(1)-11 MPa, (b) Step100(1)-12 MPa, (c) Step106(1)-12.6 MPa, (d) Step110(1)-13 MPa, (e) Step110(70)-13 MPa, (f) Step110(100)-13 MPa, (g) Step111(1)-13.1 MPa, (h) Step112(1)-13.2 MPa, (i) Step115(1)-13.5 MPa.
Sustainability 15 04597 g019aSustainability 15 04597 g019b
Figure 20. Evolution of rock damage under different stress ratios. (Step100 denotes the number of tension iteration steps; (50) denotes the number of shear iteration steps; 12 MPa is the injection pressure; and 0.5 denotes the stress ratio.).
Sustainability 15 04597 g020
Figure 21. Evolution of rock damage with fracturing fluid viscosity (Step135 denotes the number of tension iteration steps, (30) denotes the number of shear iteration steps, 15.5 MPa is the injection pressure; and 0.75 is the viscosity of fracturing fluid).
Sustainability 15 04597 g021
Figure 22. Variation of stress intensity factor with relative distance from crack tip to interface at two elastic modulus ratios.
Sustainability 15 04597 g022
Figure 23. Variation of damage number with injection pressure during fracturing.
Sustainability 15 04597 g023
Figure 24. The change of damage number with injection pressure in up and down fracture propagations.
Sustainability 15 04597 g024
Figure 25. Variation of crack length with injection pressure at different elastic modulus ratios.
Sustainability 15 04597 g025
Figure 26. Variation of crack length with different elastic modulus ratio under different injection pressures.
Sustainability 15 04597 g026
Figure 27. Conceptual zoning of hydraulic fracture propagation through reservoir interface.
Sustainability 15 04597 g027
Table 1. Main parameters of in coal tight sandstone superimposed reservoir used in hydraulic fracturing simulations.
LithologyCoalTight Sandstone
Elastic modulus (GPa)7.214
Poisson’s ratio0.40.2
Compressive strength (MPa)10.5363.89
Tensile strength (MPa)1.0536.389
Initial permeability (m2)7.9 × 10−177.9 × 10⁻¹⁶
Density (kg/m3)12502000
Internal friction angle (°)2530
Table 2. The parameters of coal-measure shale used in experiments [51].
RockYoung’s Modulus (GPa)Poisson’s RatioIn situ Stress σv/σh (MPa)Fluid Viscosity (MPa·s)
Shale40.60.1218/123
Table 3. The parameters of sandstone used in experiment [49].
RockUniaxial Compressive Strength (GPa)Density (g/cm3)Tensile Strength (MPa)Fluid Viscosity (MPa·s)
Sandstone652.456.41
Table 4. The parameters for coal hydraulic fracturing test.
RockElastic Modulus (GPa)Poisson’s Ratio Tensile Strength (MPa)Density
(kg·m−3)
Coal10.151.31800
Disclaimer/Publisher’s Note: The statements, opinions and data contained in all publications are solely those of the individual author(s) and contributor(s) and not of MDPI and/or the editor(s). MDPI and/or the editor(s) disclaim responsibility for any injury to people or property resulting from any ideas, methods, instructions or products referred to in the content.