Article

Study on Location of Bus Stop in Subway Service Area Based on Residents’ Travel Accessibility

School of Traffic and Transportation Engineering, Dalian Jiaotong University, Dalian 116028, China
*
Author to whom correspondence should be addressed.
Sustainability 2023, 15(5), 4517; https://doi.org/10.3390/su15054517
Submission received: 18 January 2023 / Revised: 26 February 2023 / Accepted: 1 March 2023 / Published: 2 March 2023
(This article belongs to the Topic Sustainable Transportation)

Abstract

:
This research aims at establishing an integrated urban public transport system with a subway route supplemented by conventional bus lines, in order to enable residents’ “door-to-door” travel. This paper first analyzed the attraction area of the subway, and then used the GIS tools to calculate and analyze residents’ accessibility to adjacent bus stops. Moreover, it created a preliminary layout of bus stops for residential areas with extremely low accessibility using an improved potential model. From the perspective of minimizing residents’ travel costs and bus stop infrastructure deployment costs, a bus stop site selection optimization model was developed. According to the characteristics of the model, the non-dominated sorting genetic algorithm II (NSGA-II) was employed to solve the optimal bus stop locations. In addition, the entropy weight technique for order of preference by similarity to ideal solution (TOPSIS) evaluation model was used to evaluate and sort candidate schemes, accordingly, and thus the optimal site selection scheme was identified. Finally, a before-after comparative analysis on residents’ travel accessibility was conducted. Results show that the proposed method can effectively improve residents’ accessibility to bus stops, which facilitates residents to transfer from conventional bus to subway. Furthermore, it provides a basis for the follow-up optimization of the connection between subway and conventional bus lines.

1. Introduction

In most of the metropolises in China, subways and conventional buses are the two main components of the urban public transportation system, which are crucial to the sustainable development of the city. With the rapid development of subway system, the conflicts between subways and conventional buses are increasingly significant. Therefore, it is urgent to build an urban public transportation system with the subway network as the main part and the conventional bus network as the supplementary part. In current practice, the integration between conventional bus transportation and the subway network is still relatively weak, and it is still a challenge for residents to walk to the bus stop, and then transfer to the subway. This has been a critical barrier for realizing “door-to-door” travel via public transportation. Optimizing the location of bus stops will improve the accessibility of residents within the attraction area of subway stations. It will not only provide more convenient services for residents to transfer between conventional buses and the subway, but also promotes the sustainable development of the city [1].
At present, there are four typical research methods for determining the location of conventional bus stops. The first type is to optimize the bus stop through analyzing multi-source data. For example, Li et al. [2] proposed a visual analysis model for bus stop optimization by sharing bicycle and urban interest point data and designed a visual analysis system. Cheng et al. [3] established an evaluation index of the rationality of bus stop layout based on the data of interest points and used the matter-element model to evaluate and apply the rationality of bus stop layout. Duan et al. [4] extracted and integrated bus GPS data and card swiping data, analyzed residents’ travel rules, and proposed bus stop optimization suggestions. Based on the multi-dimensional attributes collected by in-vehicle GPS, Yue et al. [5] extracted the OD and traffic data of the residential districts and explored the potential areas for deploying bus stops. Garg et al. [6] developed a new algorithm that can automatically locate bus stops using GPS data. The second type is to study the location of bus stops using graph theory. For example, Zhu et al. [7], Ge et al. [8], Wang et al. [9] used the Voronoi diagram to establish bus stop location optimization models. The third method is to use GIS technology to optimize the bus stop locations. For example, Zhao [10], Bai and Liu [11] used the GIS spatial analysis function to optimize the site selection factors. Xie and Du [12] used the GIS buffer analysis and superposition analysis tools, as well as optimization theory to analyze the suitability of bus stops for determining the optimal bus stop location. Shatnawi et al. [13] used GIS technology, PSO algorithm, and GA algorithm to optimize bus travel time and service capacity. Delmelle et al. [14] developed a simulated annealing algorithm in GIS to identify redundant bus stops. The last type is based on mathematical analysis. For example, Huang et al. [15], Otto and Boysen [16], Ibeas et al. [17] developed bi-level programming models to optimize bus stop locations. Tang [18] transformed the functional types of bus stops into impact factors and established a multi-objective optimization model. Mohammad et al. [19] proposed a multi-heuristic method for location optimization based on the location of existing bus stops and other factors, such as land use, construction cost, and node connectivity. Cipriani et al. [20] developed a many-to-many algorithm for passenger demand with Rome as a case study. Nikolić and Teodorovic [21] proposed a swarm intelligence bee colony algorithm to optimize bus stops.
In summary, a critical prerequisite for solving bus stop optimization is to establish an optimization objective (s). The selection of optimization objectives may include minimizing bus delays to reduce passenger travel costs [22,23], minimizing total construction costs [24], and reducing operational costs by optimized bus stop spacing [25]. The basic status of bus stop location research is shown in Figure 1.
Although there have been quite a few research efforts on the location of bus stops, most of them considered only a monotonous factor which cannot comprehensively and intuitively optimize the location of bus stops. Therefore, based on the previous research, this paper made the following contributions to the research on the location of bus stops:
  • Based on the influence range of subway and from the perspective of residents’ travel accessibility, this paper used the potential model to improve the characteristics of bus stops. Meanwhile, considering the travel costs of residents and the bus stop infrastructure deployment costs, the location optimization model was established with the full coverage of bus stops as the constraint.
  • Using GIS technology, the accessibility of residents was calculated and visualized. Combined with the actual road conditions, the bus stops are deployed to make the bus routing scheme more realistic and reliable.
  • Considering the conflict between the two types of objective functions in the model, the non-dominated sorting genetic algorithm II (NSGA-II) was used to solve the problem, and was combined with the entropy weight technique for order of preference by the similarity to ideal solution (TOPSIS) evaluation model to obtain the equilibrium solution that can simultaneously optimize the two conflicting objective functions.

2. Methods

Residents’ travel accessibility reflects the convenience of travelers using the corresponding transportation system and the difficulty of obtaining public facility services. From the perspective of residents’ travel accessibility, we can judge the current situation of urban public transportation system, provide index basis for locating public facilities, and provide optimization direction for urban sustainable development [26]. In this paper, residents’ travel accessibility was defined as the convenience for residents to obtain bus services from their demand points by walking.
First, this paper adopted the improved potential model to calculate the accessibility level of residents to bus stops within the subway attraction area through ArcGIS, and used the Kriging interpolation tool to analyze the results. Then, developed a preliminary layout of the optimized locations of bus stops based on accessibility level. Finally, aiming at minimizing residents’ travel costs and infrastructure deployment costs, NSGA-II algorithm and entropy weight TOPSIS evaluation model were employed to solve the optimal site selection scheme. An overview of the framework of this research is shown in Figure 2.

2.1. Improved Potential Model

In this paper, an improved potential model was introduced according to the difficulty of residents’ access to bus stops, and the accessibility of residents’ demand points to bus stops were calculated and analyzed. Potential model is one of the classic models in regional economics and geography to study the interaction between social and economic space through the law of universal gravitation [27]. The classic potential model is depicted as follows:
A i = j = 1 n A i j = j = 1 n M j D i j β
The potential model has been widely used to measure the spatial accessibility of various public facilities, including hospitals, schools, garbage-disposal sites, etc. Nevertheless, the classical potential model only considers the service capacity of facilities and travel impedance. In this paper, based on the characteristics of bus stops, the potential model was improved to accommodate the various compounding factors, such as the residents’ competition of bus ridership at an identical bus stop (i.e., on-board demand may vary by bus stops, and thus the spatial accessibility varies), and the service range of a bus stop (i.e., when the bus stop exceeds the acceptable walking distance of residents, they may not choose this bus stop). In terms of residents’ maximum acceptable walking distance, according to the current China Urban Road Traffic Planning and Design Specifications, the service range of bus stops is usually between 300 and 500 m. The improved potential model is described as follows:
A i = j = 1 J S j Y i j V j D i j β
S j = 60 n R t a
V j = i = 1 I P i Y i j D i j β
Y i j = 1 ( D i j D j ) β
where A i represents the accessibility of residents’ demand point i ; I and J represent the total number of residents’ demand points and bus stops; S j represents the bus stop’s service capability; V j represents the population impact factor of bus stop j ; P i represents the population of residents’ i ; D i j represents the travel impedance factor of residents’ demand point i to the bus stop j , which was set as distance in meters; β represents the travel friction coefficient; n represents the number of bus lines at the bus stops; R represents the capacity of the bus in number of passengers; t a represents the bus departure interval; D j represents the maximum acceptable walking distance from residents’ demand point i to the bus stop j , which was set to 500 m. If the travel distance exceeds 500 m, residents will not choose this bus stop; Y i j represents the service radius influence factor of bus stop j ; Y i j = 0 if D i j D j 1 .

2.2. Optimization Model

The accessibility analysis of residents’ demand points was conducted with the improved potential model and ArcGIS analysis tools. For the initial layout of bus stops for residents’ demand points with accessibility less than or equal to α , it was found that there were operational issues, such as dense distribution of bus stops and overlapped service areas. To avoid the increase in bus stop development and operation costs, it is needed to ensure that bus stops meet the accessibility requirements of residents, without over-deployment of bus stops. Therefore, this research allocated at least one bus stop within the travel origin of each residents’ demand point, and meanwhile minimize residents’ travel costs and bus line operational costs. The objective function of the bus stop location site selection optimization is depicted as follows:
min ( z 1 ) = i = 1 I j = 1 J P i D i j W i j
min ( z 2 ) = j = 1 J C j X j
s . t . D i j [ 0 , 500 ]
j = 1 J W i j 1
W i j X j
where z 1 represents the travel cost of residents; z 2 represents the operational cost of the bus line; P i represents the population of residential demand points with a low accessibility; D i j represents the walking distance from the bus stop to the residential demand point; W i j represents the distribution relationship between candidate bus stops and residential demand points; W i j = 1 means residents’ demand point i is allocated to bus stop j , otherwise, W i j = 0 ; c j represents the average bus stop deployment cost; X j represents whether candidate bus stop j is selected or not; X j = 1 means the candidate bus stop is selected, otherwise, X j = 0 .
Equations (6) and (7) are objective functions, while Equations (8)–(10) are constraint functions. Equation (8) indicates that the residents take the bus walking distance constraint; Equation (9) suggests that each residential demand point has a bus stop constraint for its service; and Equation (10) indicates that the selected bus stops are constrained by residential demand points.

2.3. Algorithm Solution

Considering the conflict between the two objective functions in the optimization model, it is challenging to accommodate both objective functions when solving the optimal site selection scheme. Therefore, this paper used the NSGA-II algorithm and the entropy weight TOPSIS evaluation model to optimize the site selection scheme.
NSGA-II algorithm is a multi-objective optimization algorithm based on the genetic algorithm and Pareto selection strategy. The steps of the algorithm are described as follows: First, initialize a randomly generated species group with a size of N, in which each location has a certain probability of being selected. Second, after the species group is sorted non-dominantly, the first generation descendants are obtained through selection, crossover, and mutation. Then, starting from the second generation, the parent and the descendants are merged for fast non-dominated sorting, and the crowding degree is calculated at the same time. According to the non-dominated relationship and individual crowding degree, an appropriate subgroup is selected to form a new parent. Finally, a new descendant is generated by the basic operation of genetic algorithm. Until the iteration process is completed, the candidate solution sets of the optimal site selection scheme that satisfy the multi-optimization objectives are finally obtained.
Since the NSGA-II algorithm obtains the candidate solution sets rather than the optimal scheme, the entropy weight TOPSIS evaluation model is used to evaluate and sort the obtained solution sets, and eventually generate the optimal scheme [24].
The steps of entropy weight TOPSIS evaluation model are specified as follows: First, the objective function values of each scheme in the solution set are combined into the initial calculation matrix. Second, the two objective functions are transformed from minimal index to maximal index, and the matrix is standardized. Third, the objective entropy weight method is used to determine the weight of the objective functions, and the positive and negative ideal solutions are solved. Finally, the distance and closeness between each scheme and the ideal solution are calculated and sorted for identifying the optimal scheme.

3. Data Preparation

3.1. Establishment of Basic Data System

Based on ArcGIS, this paper plotted subway routes and stations and the conventional bus lines within subway attraction areas in six layers: Traffic community layer, urban road network layer, bus stop layer, bus line layer, subway route layer, and residents’ demand point layer, as shown in Figure 3, Figure 4, Figure 5, Figure 6, Figure 7 and Figure 8.

3.2. Screening Road Network

By comprehensively considering the road hierarchy, road conditions, road network conditions, and other influencing factors, the roads that are suitable for operating conventional buses were selected, and the ArcGIS topology check was used to generate a road network that can satisfy the requirements of conventional bus operation. The specific steps are specified as follows:
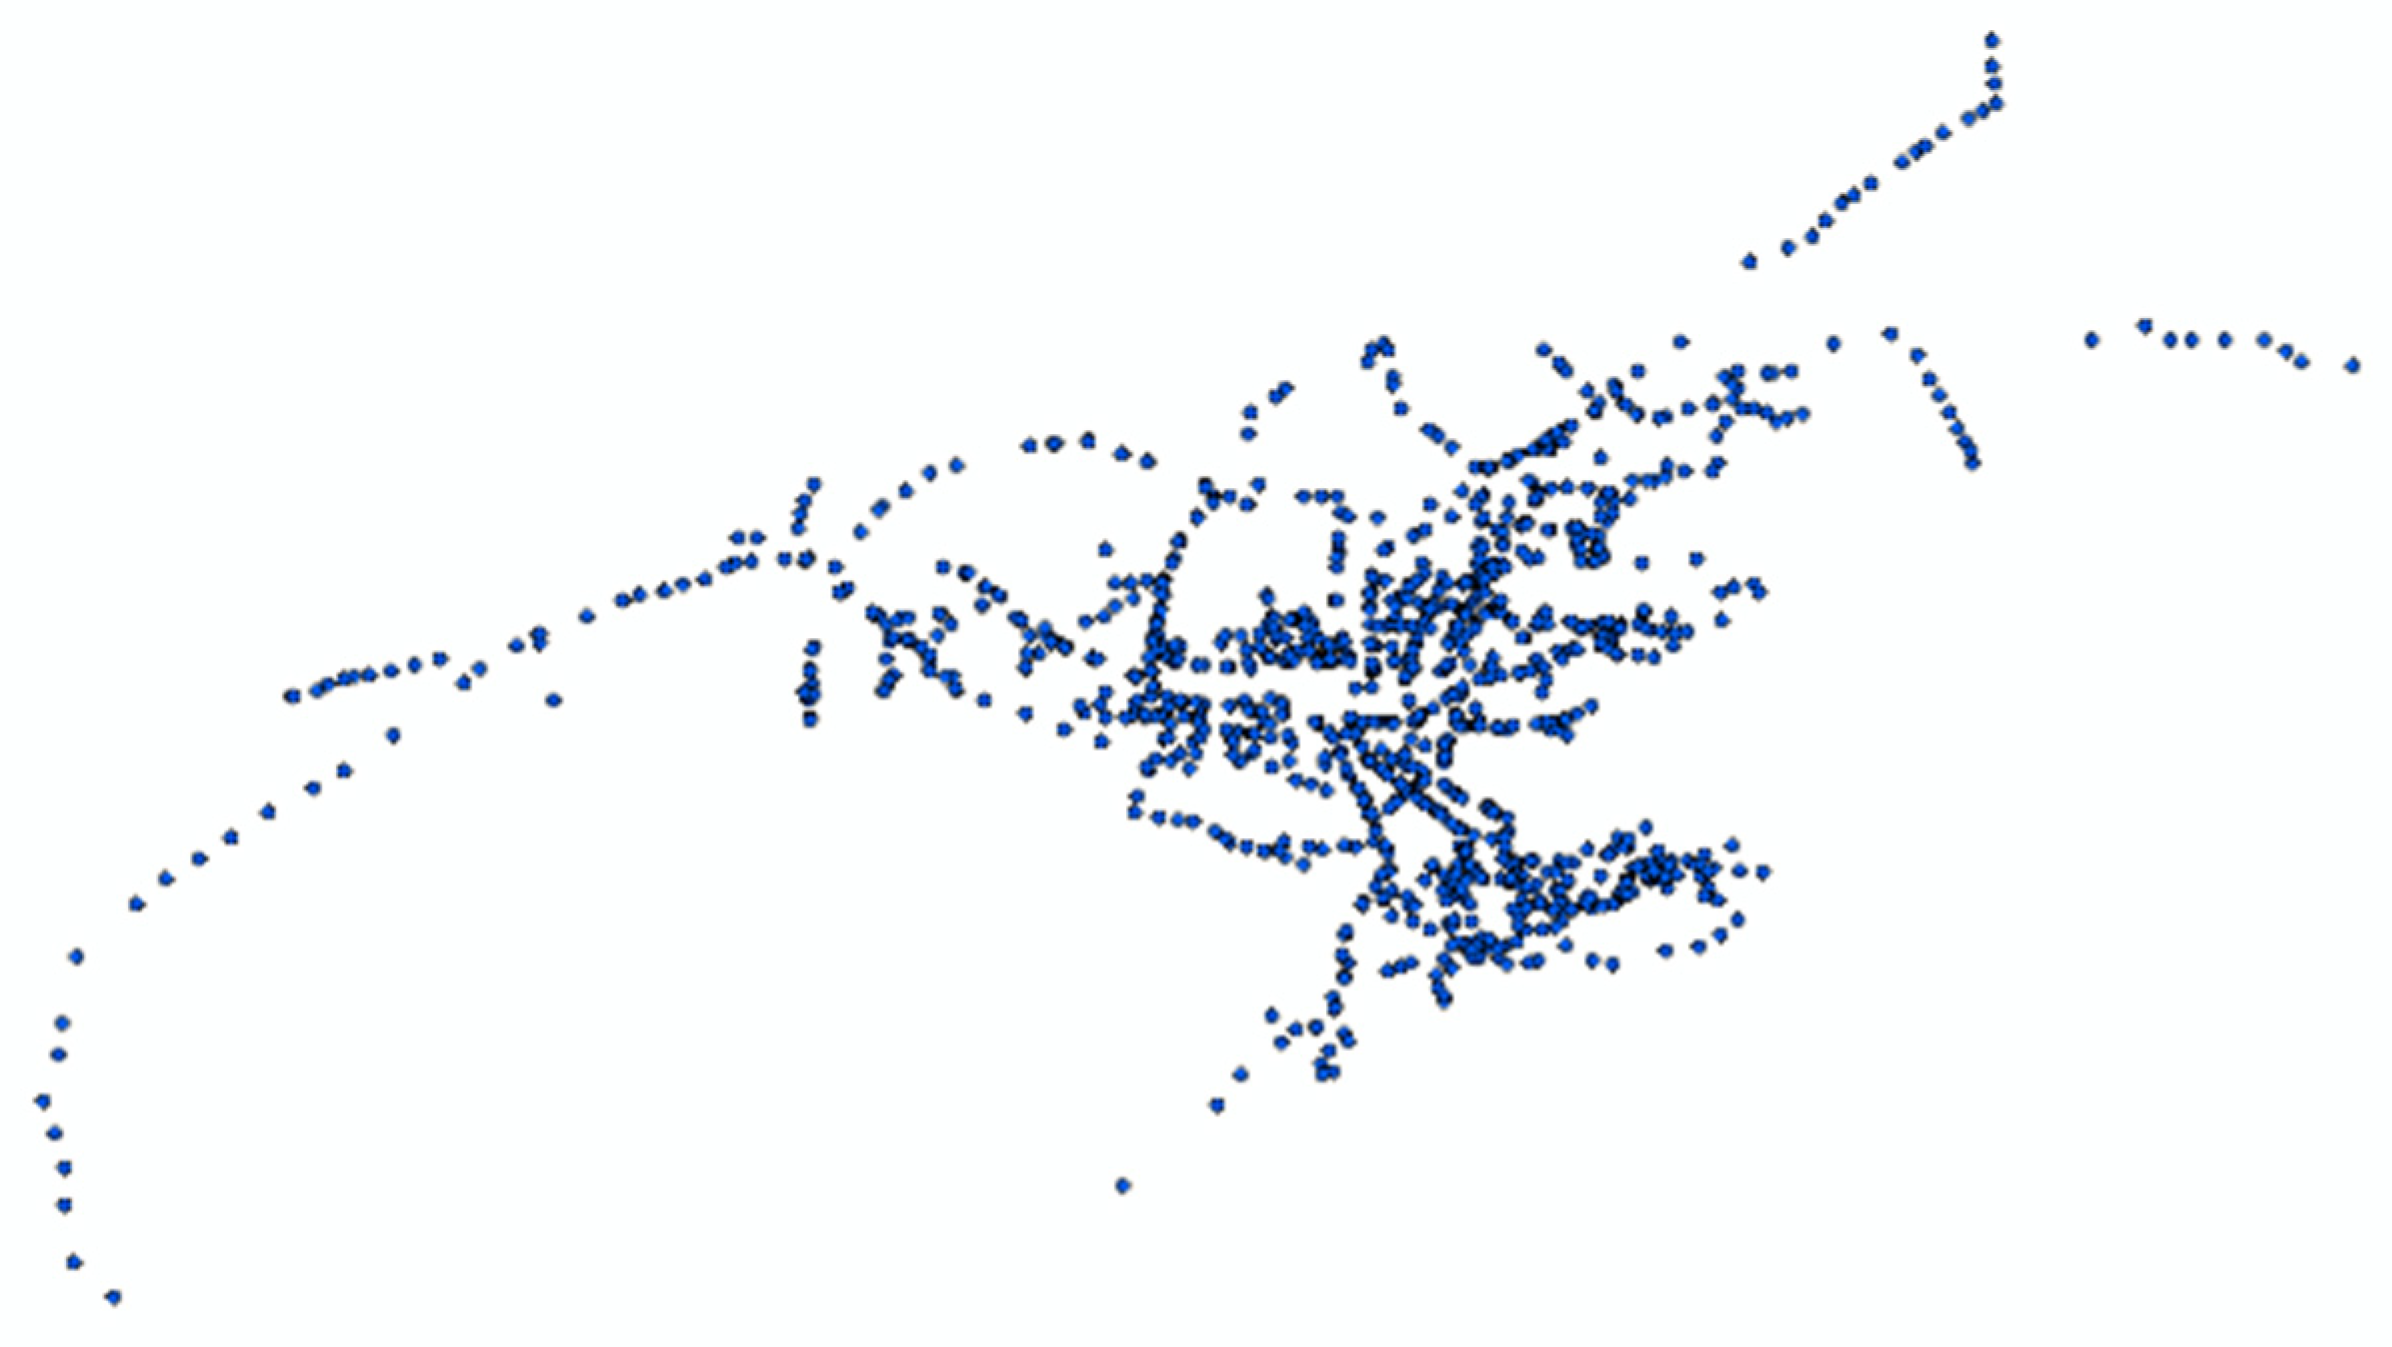
  • Import basic data: The road network information related to the research scope were obtained from Gaode map, and the road network layer was drawn using ArcGIS.
  • Check basic data: Using the ArcGIS topology check function to check the potential errors in the road network data, and reverify the topology after the initial verification to generate a complete and reliable road network topology.
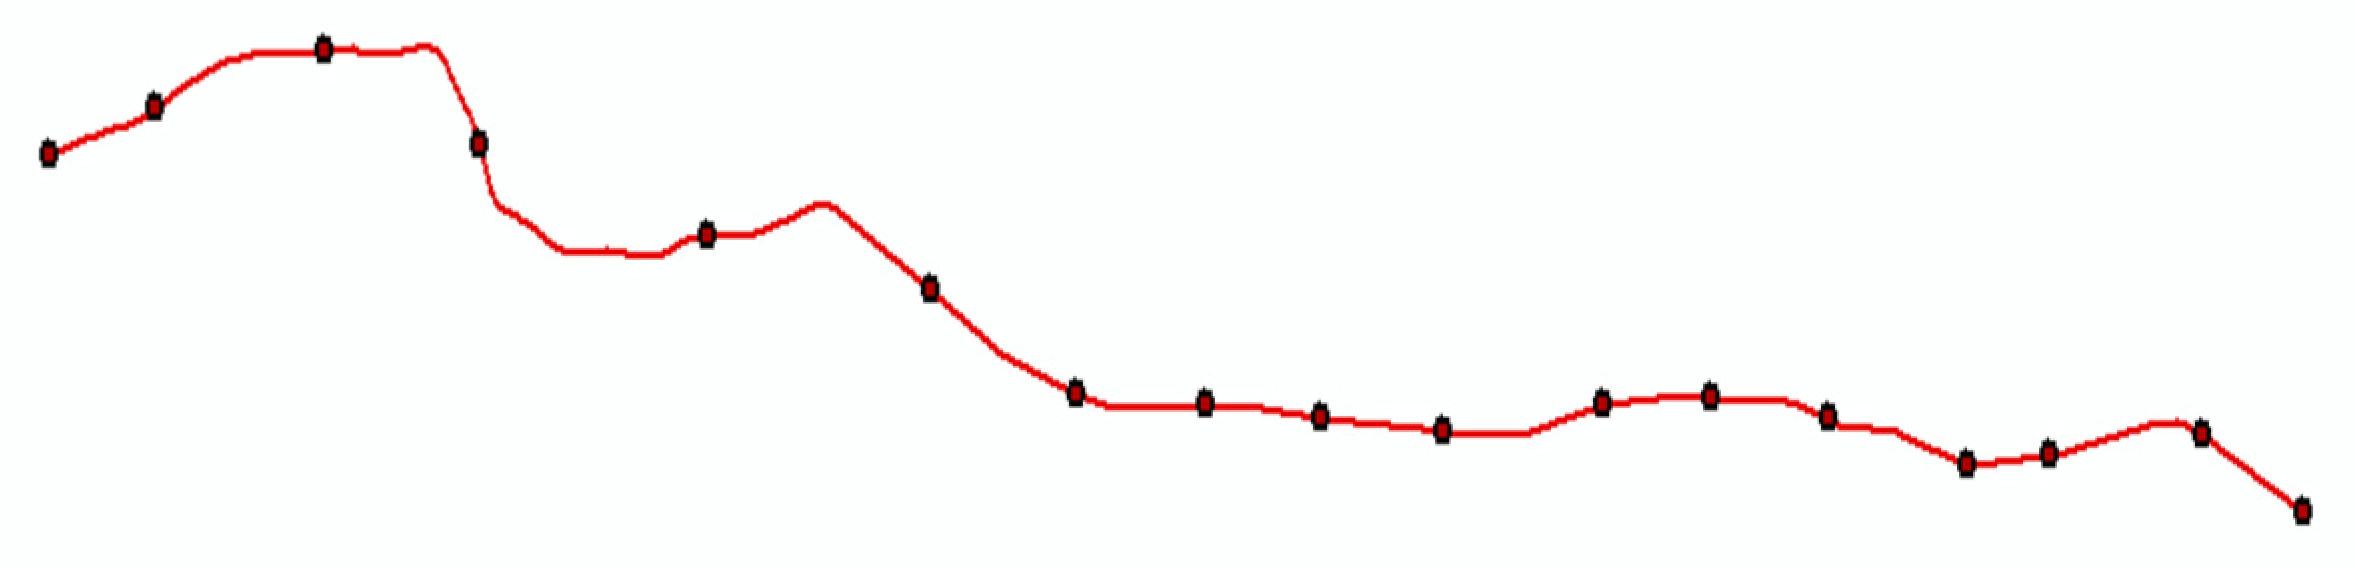
  • According to the road grade for running conventional buses, select the road network that is suitable for bus operation, including urban arterials, secondary roads, and minor roads.

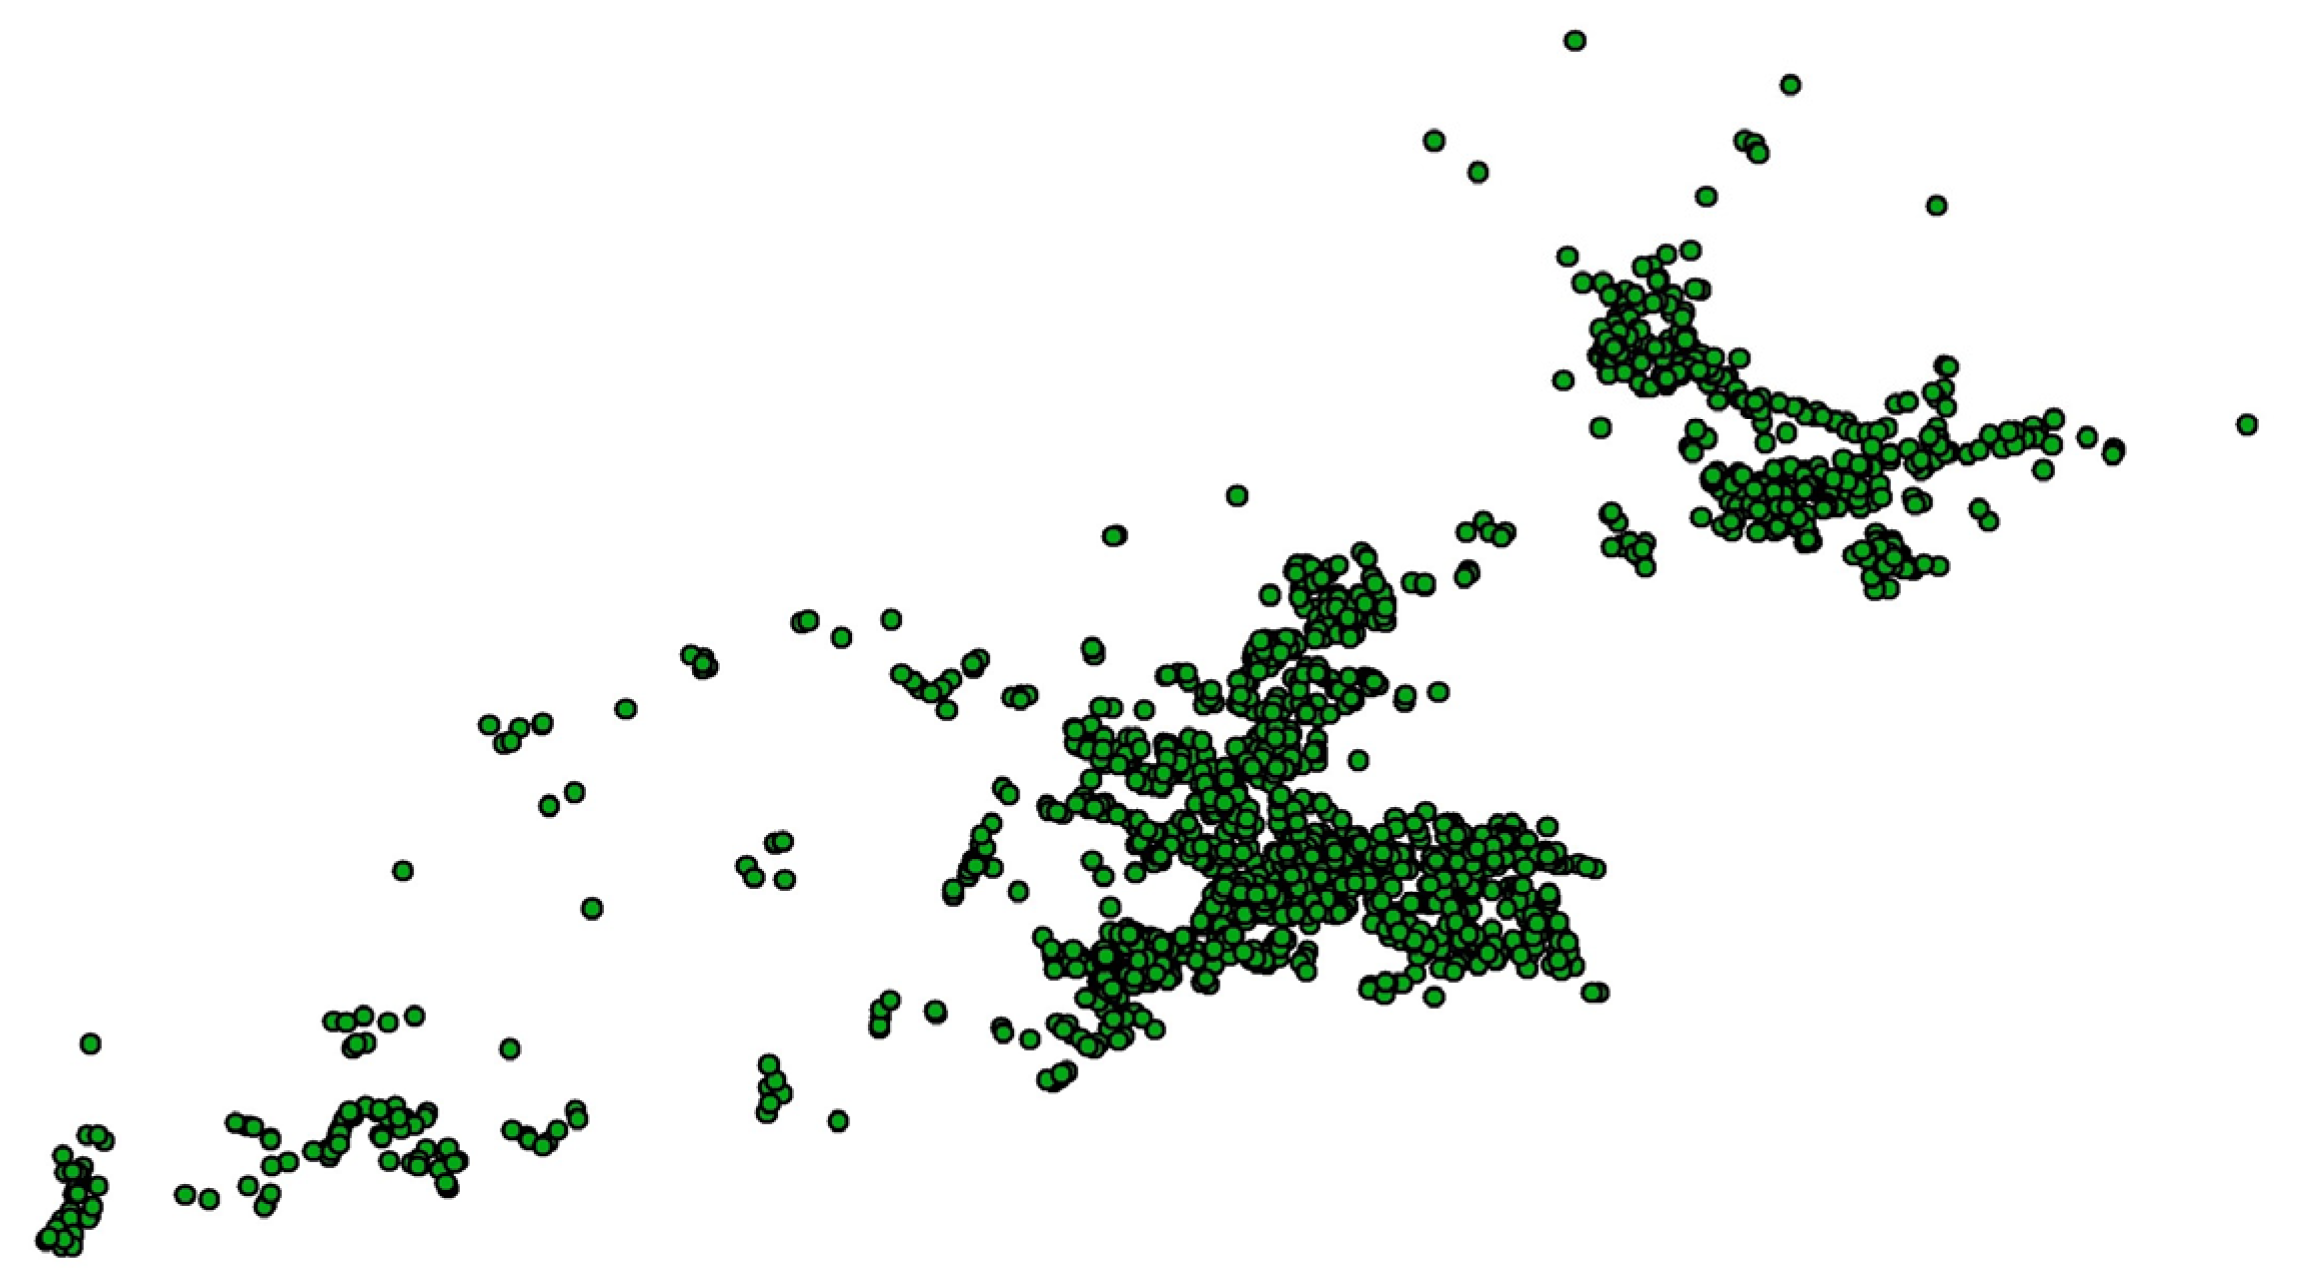
3.3. Extract Valid Data

Due to the defects in the data acquisition process, the obtained bus stops in the study area may be overlapped. Therefore, all bus stops in the study area were extracted and manually verified to achieve valid bus stop data.

4. Discussion

This paper employed the subway line X in Dalian as an example for analysis. The total length of the line is 23.0 km and contains 17 stations. It services the east-west direction passenger transportation in north Dalian and provides an effective connection between the east and west of the core area in north Dalian.

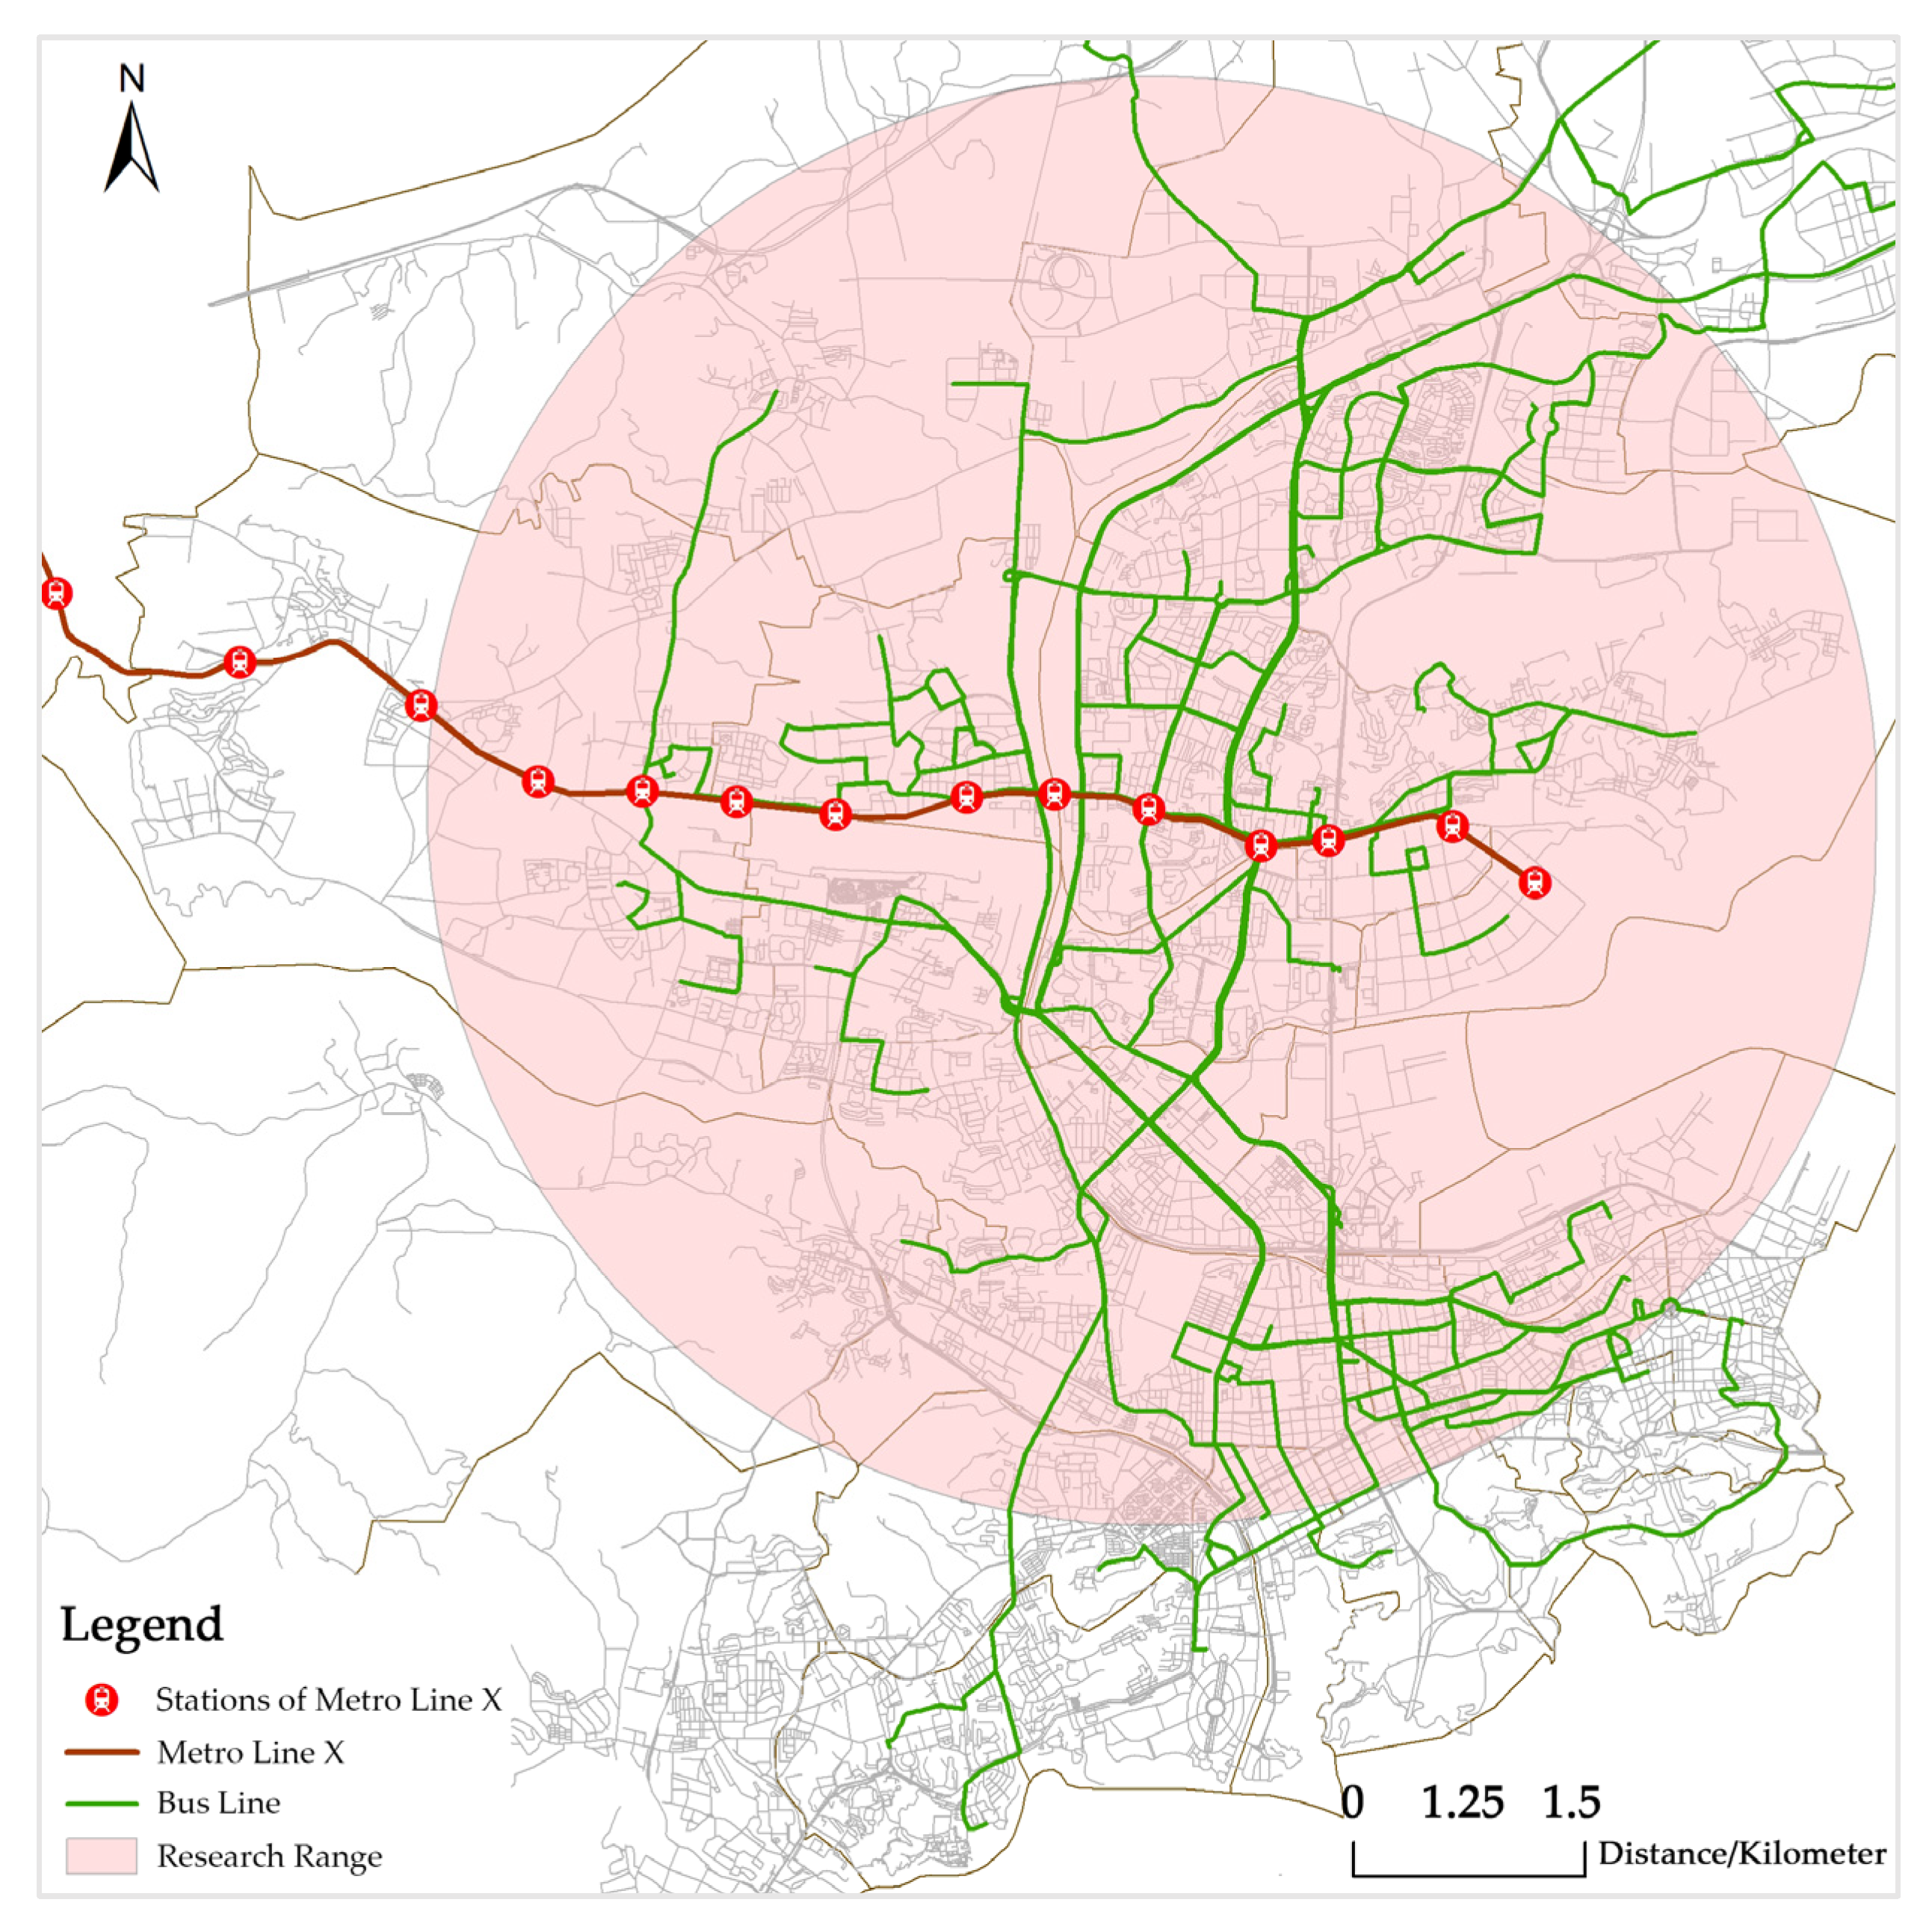
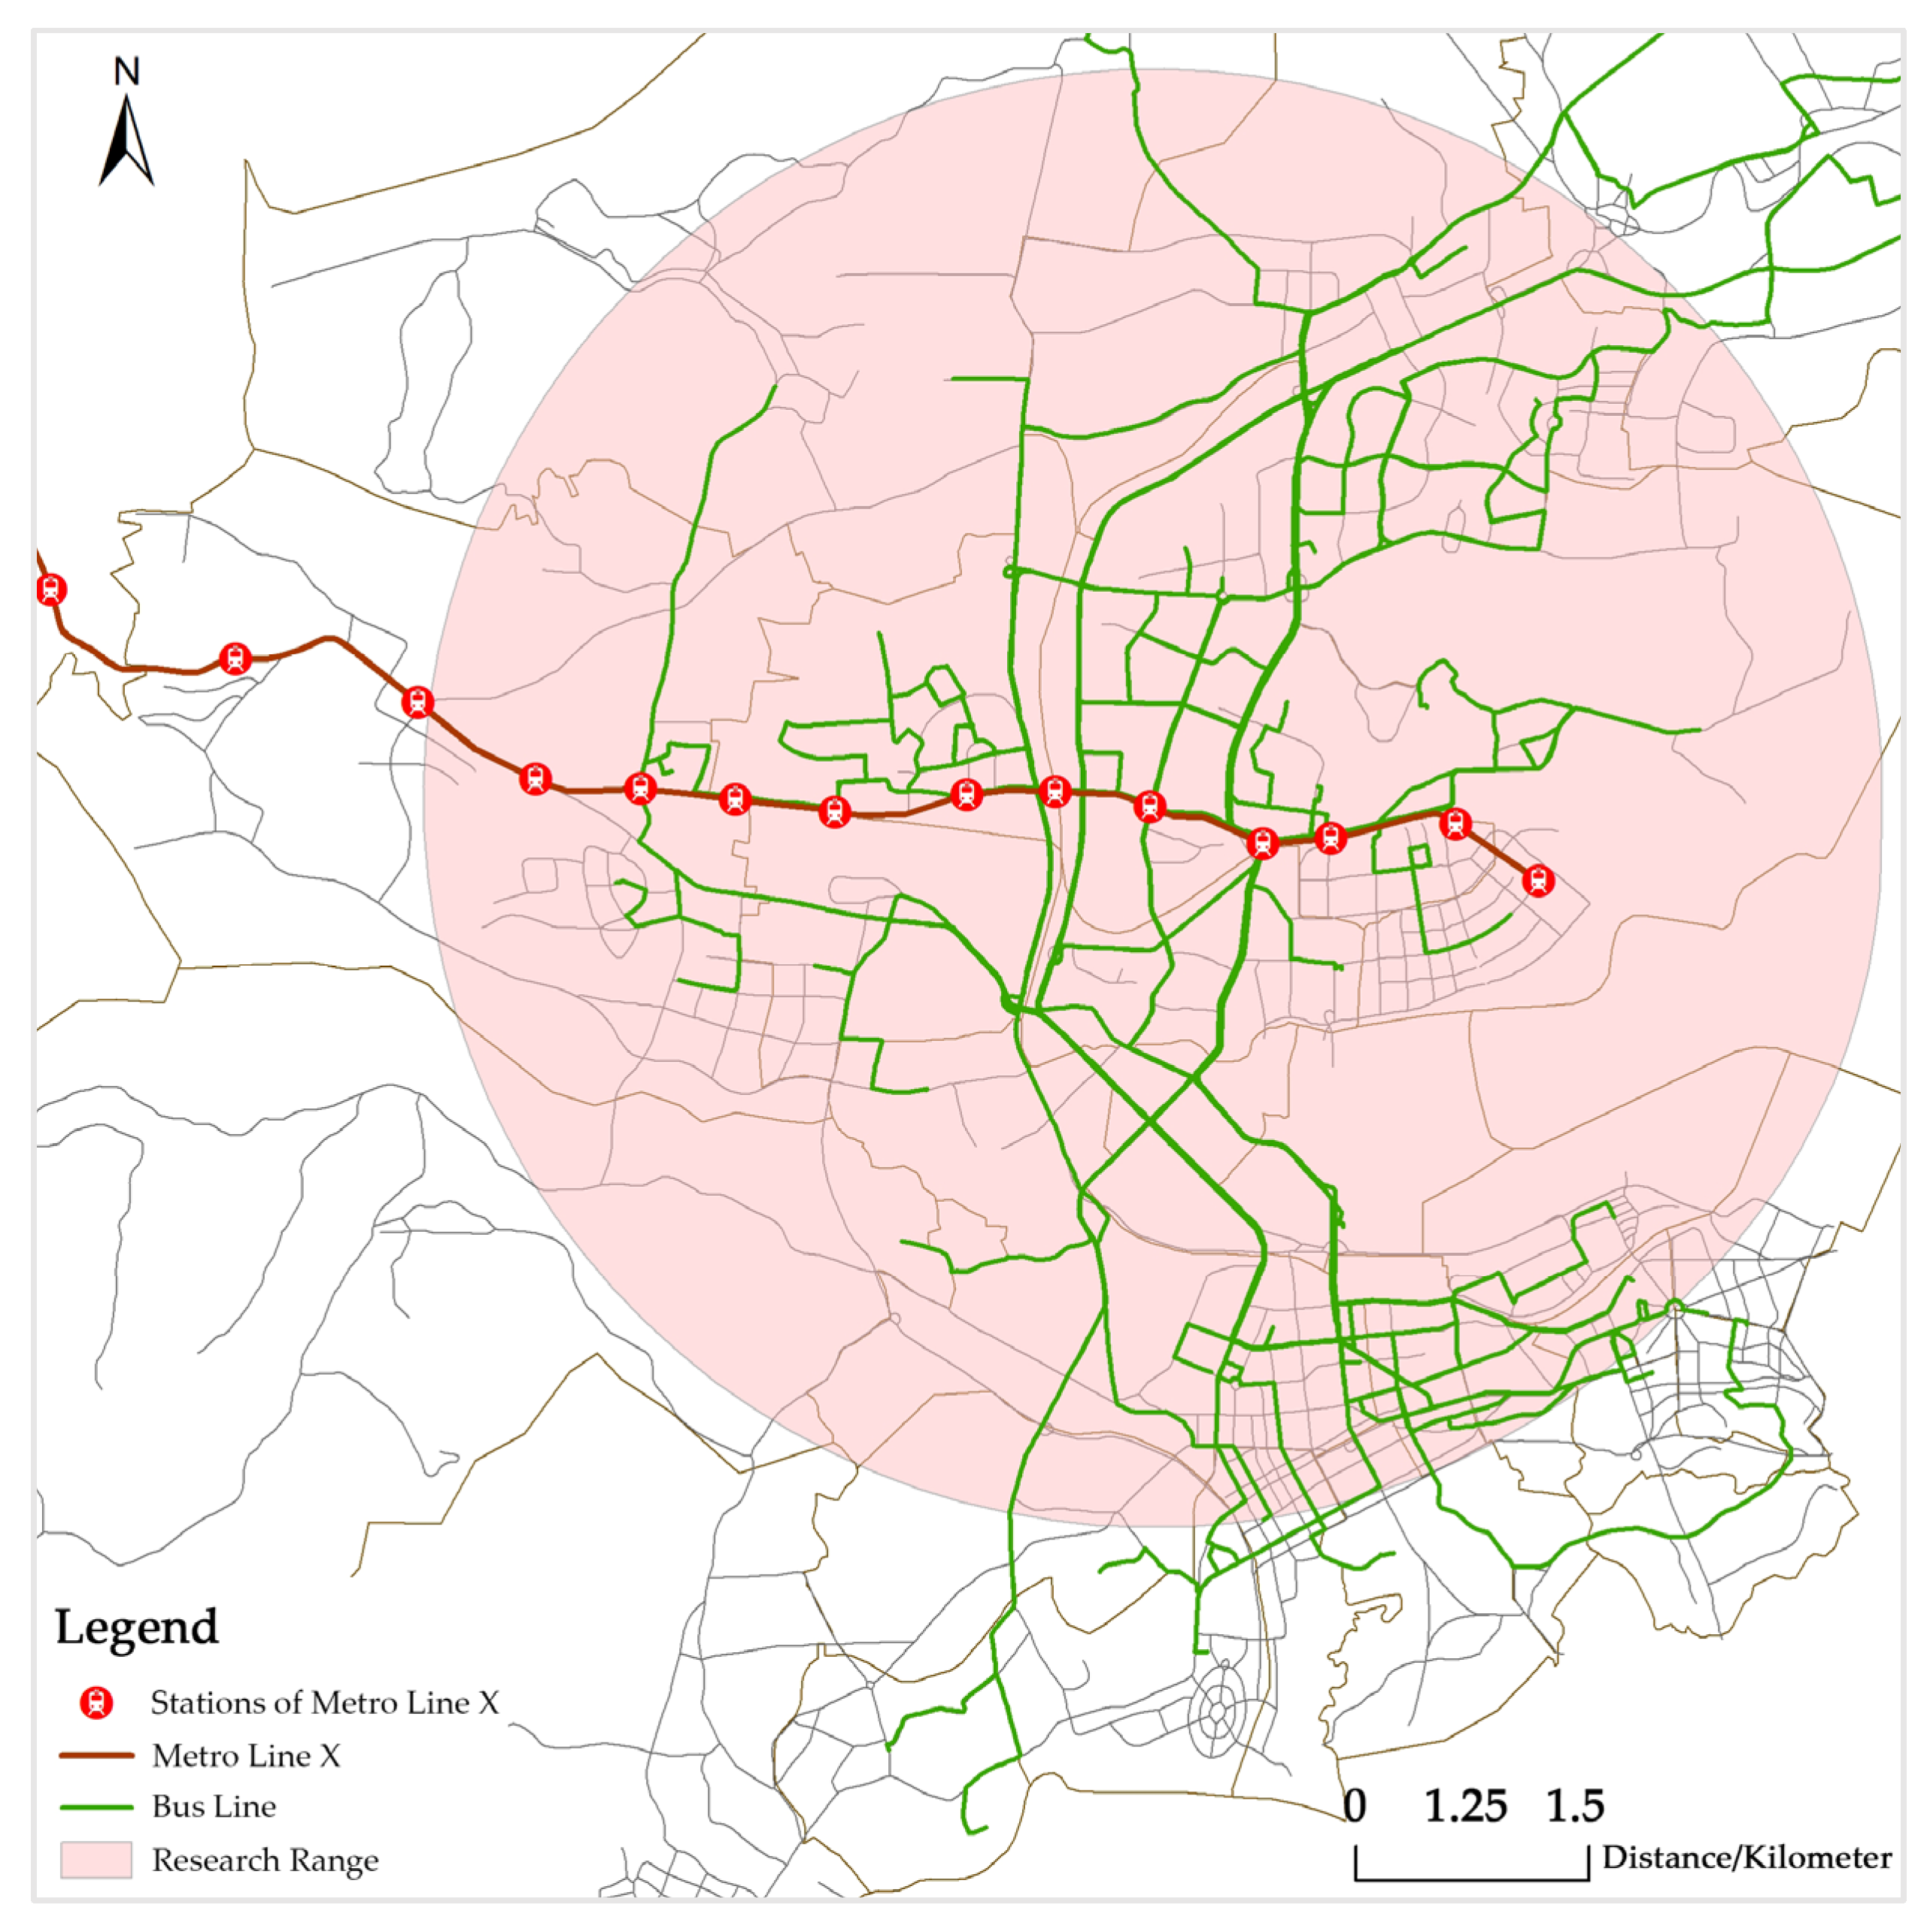
4.1. Subway Attraction Area

In this paper, the direct attraction area of a subway station was assumed as an adjustment attraction area of existing conventional bus stops, which is a belt-share area centered to the subway line with a radius of 0.8 km. In addition, the indirect influence range of the subway was assumed as the entire service range of the conventional bus network. In terms of the indirect influence range of each individual subway stations, since the station type and land-use characteristics of the traffic communities vary, this research determined the indirect attraction area of subway stations by station type, which was estimated based on the aggregation effects of the regional land-use characteristics [28], as shown in Table 1.
Due to the complexity of the network and dense stations, it is not practical to optimize all existing bus stops. Therefore, this research, based on the historical traffic operational data of the subway, selected three subway stations with large daily traffic volumes and high complexity of the connecting road network (i.e., Xibei Road Station, Songjiang Road Station, and Jinsanjiao Station) for optimization analysis, to illustrate the feasibility of the proposed model. Daily passenger volumes of the selected stations are shown in Figure 9. There are 57 bus lines within the selected three subway stations’ direct attraction area, as illustrated in Figure 10 and Figure 11.
A total of 360 valid bus stops and 394 residents’ demand points were extracted within the study area, as shown in Figure 12 and Figure 13.

4.2. Accessibility Analysis

The accessibility of existing bus stops in the study area is the basis for further optimization. The accessibility of residents’ demand points could, to some extent, reflect the reasonable distribution of current bus stops, and it is a quantitative index of the difficulty of residents’ demand points to bus stops. This paper analyzes the spatial accessibility of bus stops in the study area based on the aforementioned improved potential model.

4.2.1. Determination of Friction Coefficient β

The value of β varies with the characteristics of station type, travel mode, crowd characteristics, etc. The expressions include linear expression, exponential expression, etc. In current practice, the value of β was typically set as 1 or 2. This research tested the sensitivity of using β = 1 and β = 2 ; statistical testing results show that there was no significant difference between the accessibility of residents’ demand points A i at β = 1 and β = 2 . Eventually, the friction coefficient β = 2 was selected by combining the difference between the maximum and minimum values, as well as the variance and standard deviation.

4.2.2. Implementation of Improved Potential Model in ArcGIS

The field calculator and summary tools in ArcGIS were used to calculate the improved potential model; the detailed implementation process is shown in Figure 14:

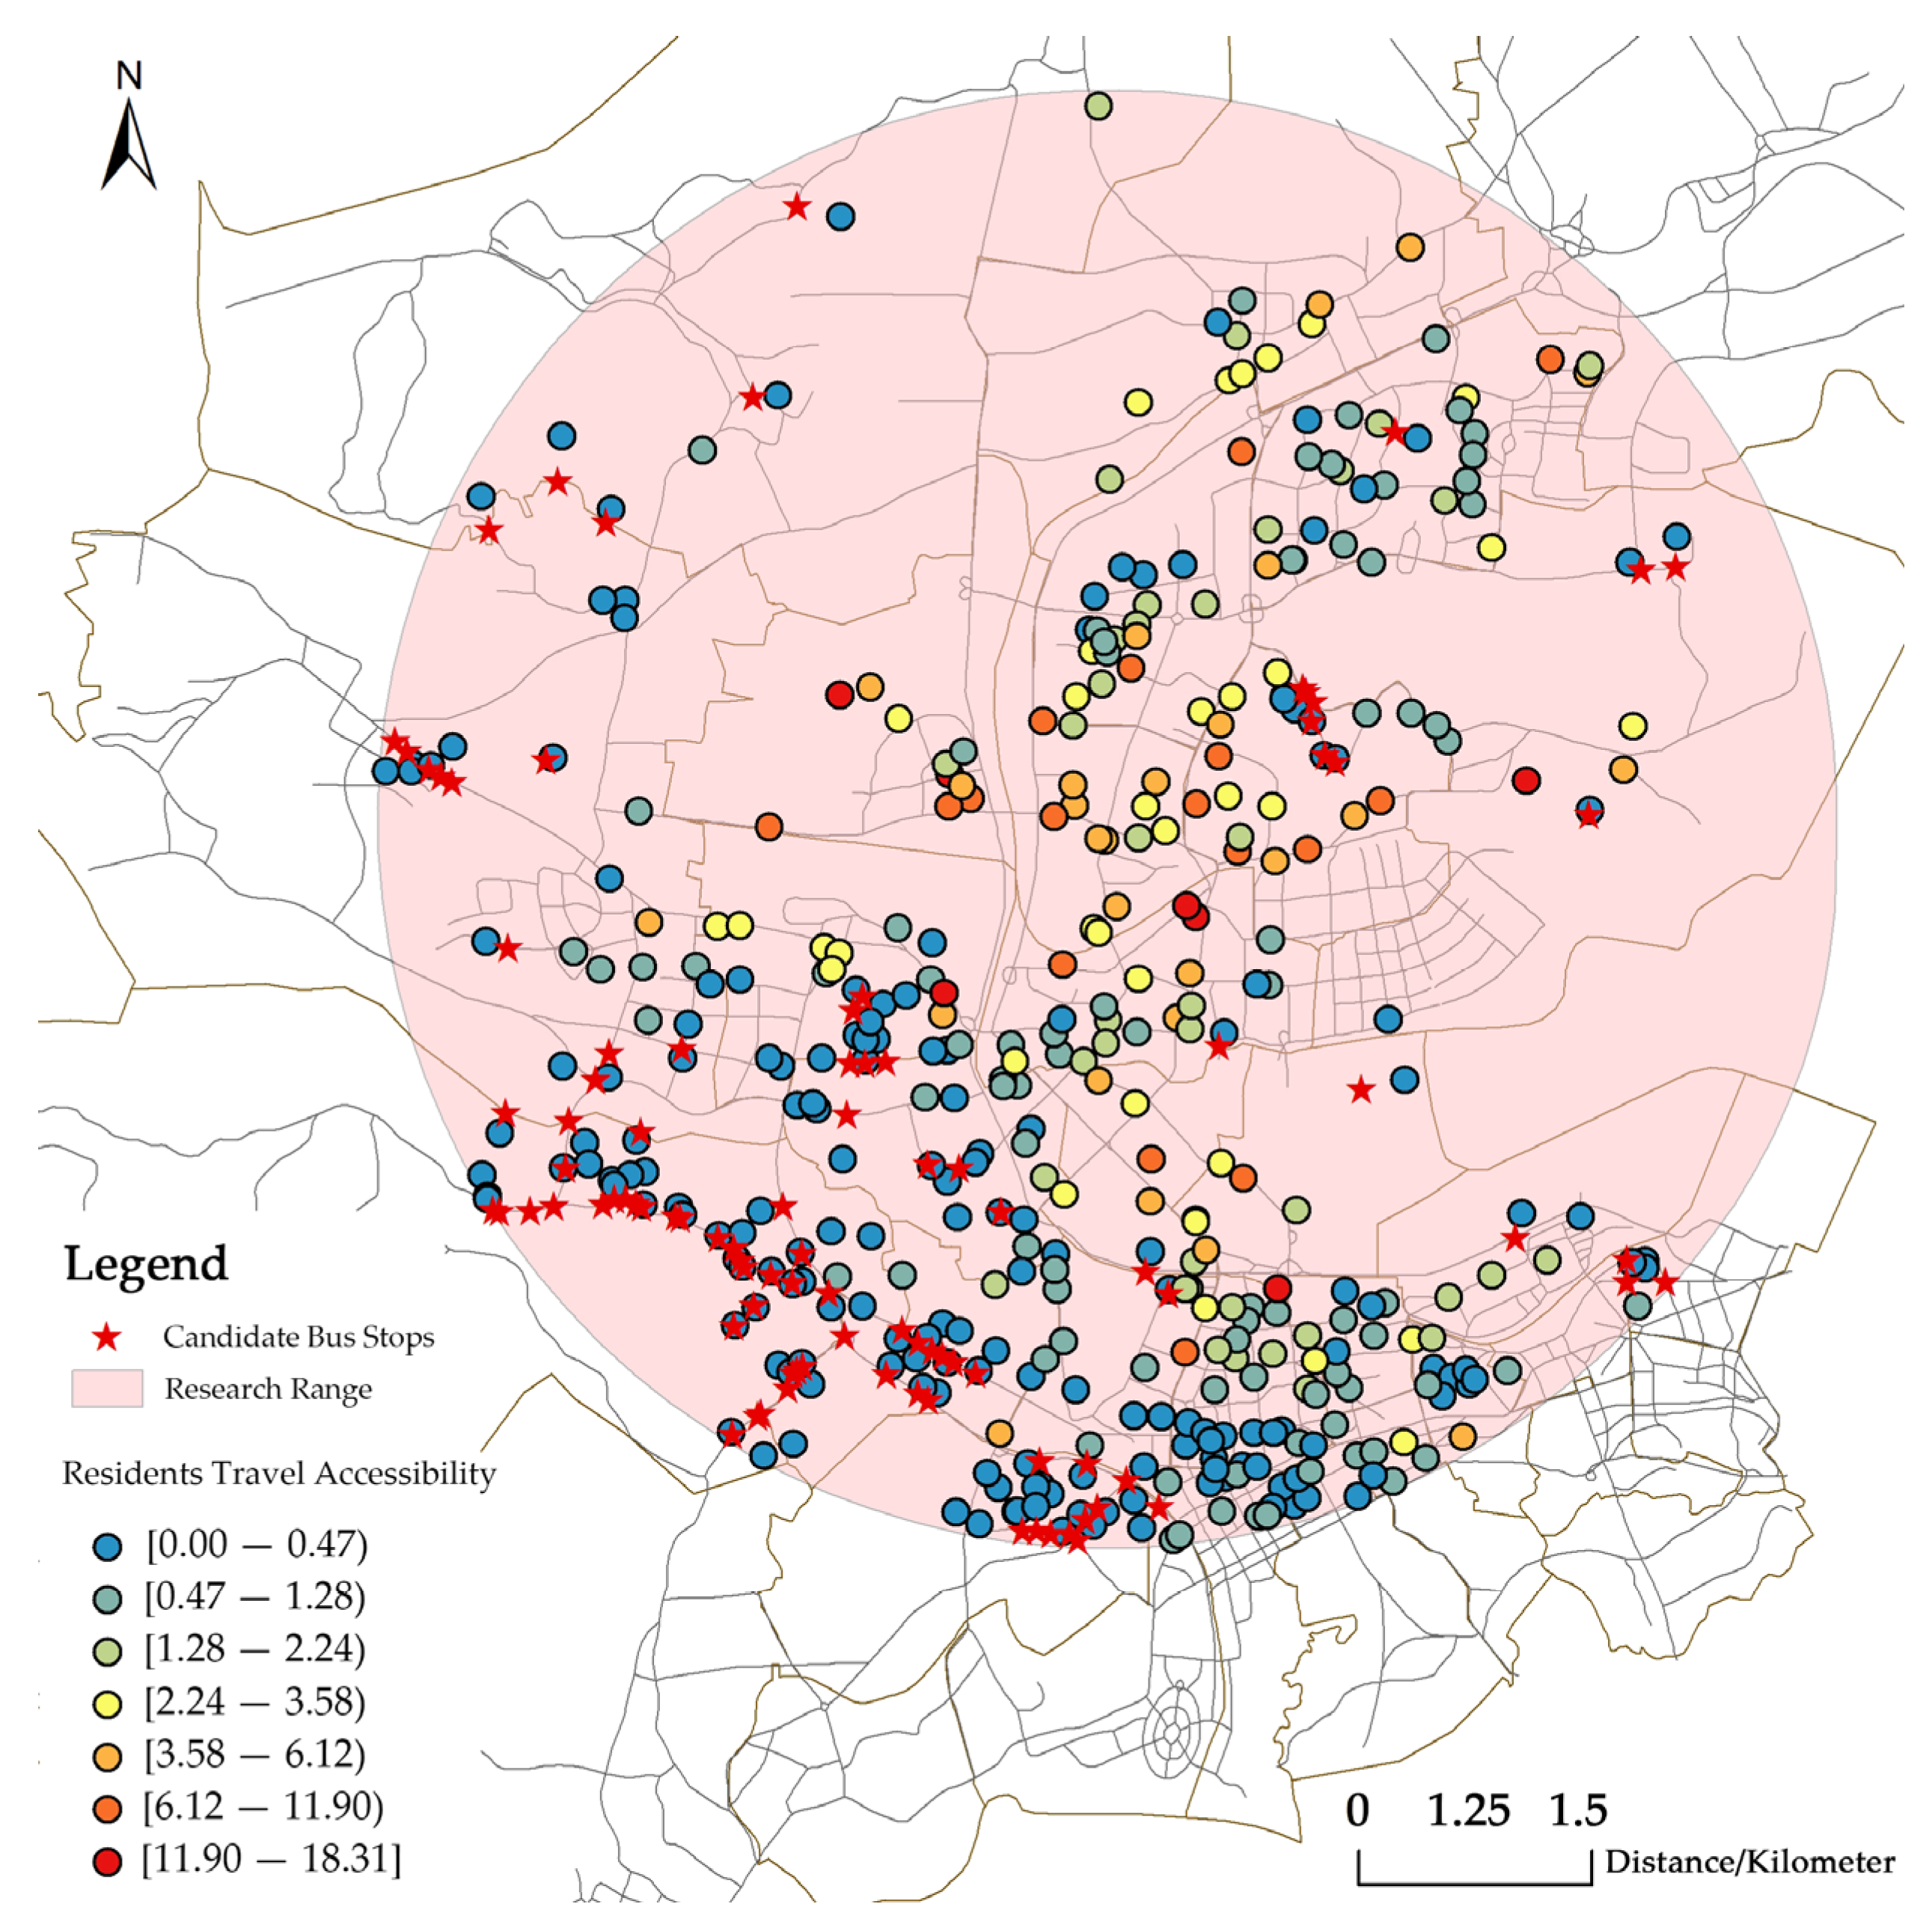
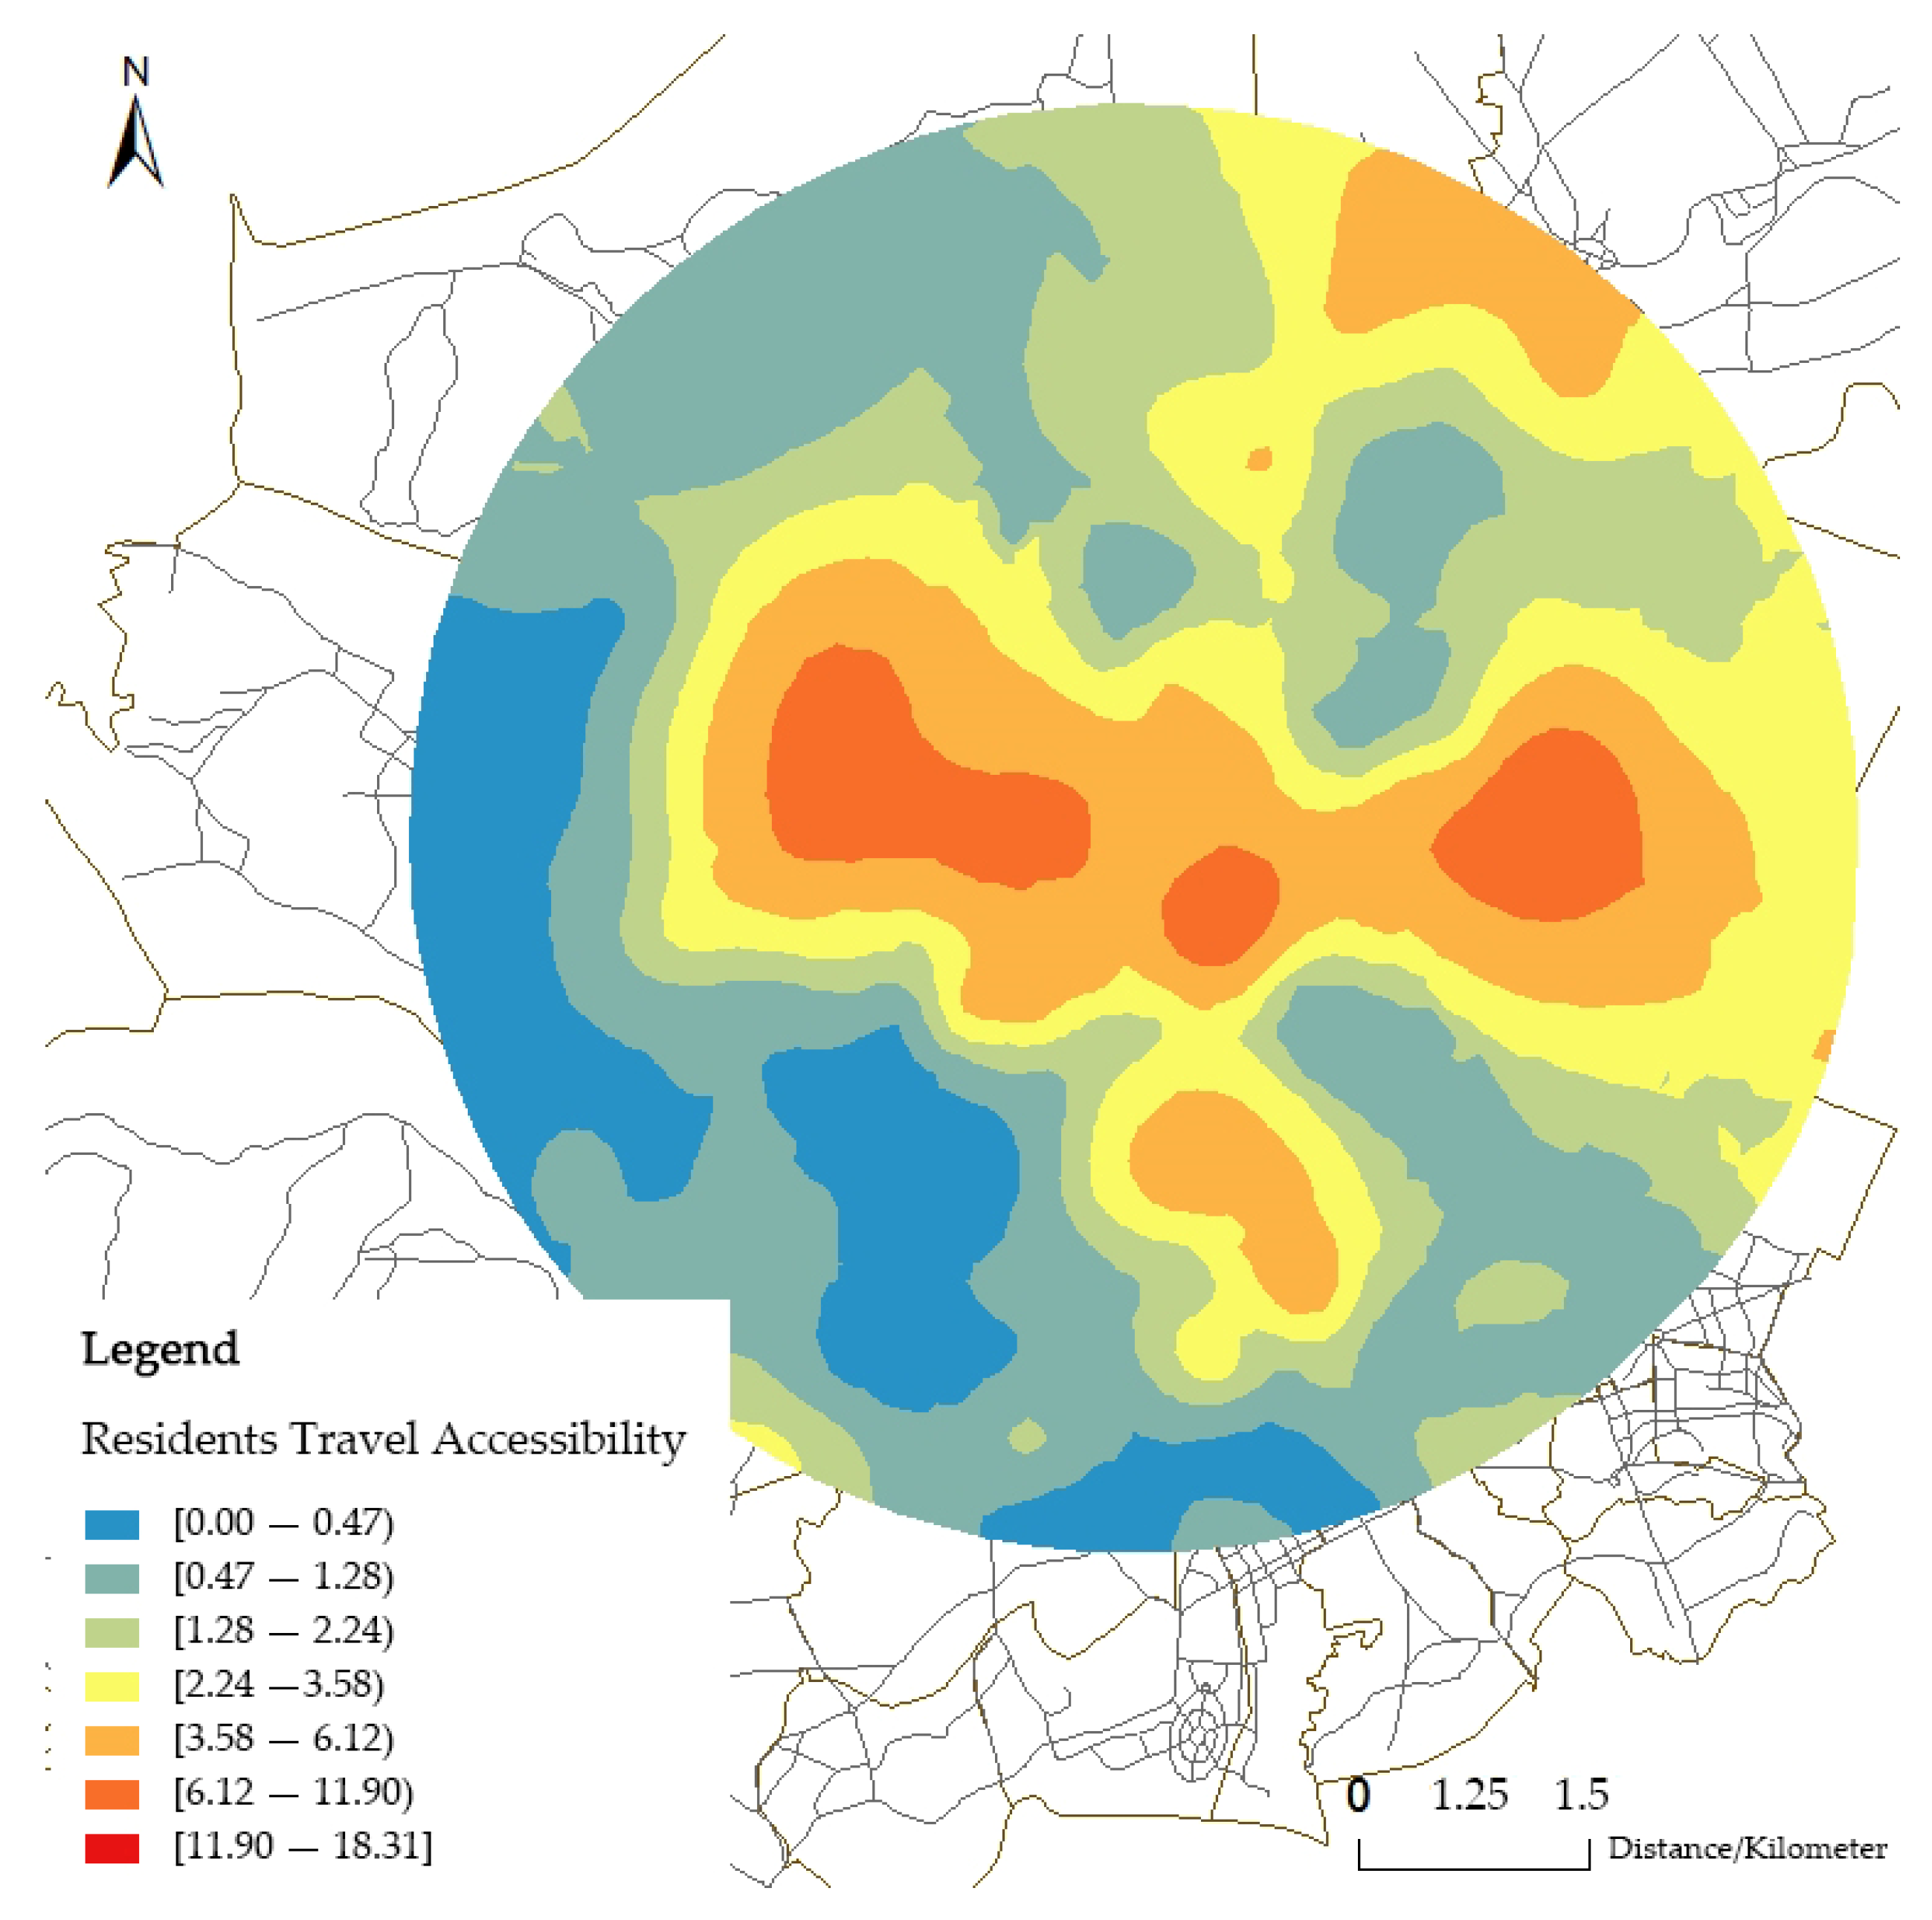
4.2.3. Analysis of Accessibility Results

ArcGIS was used to analyze the accessibility of the residents’ demand point layer that stores the residents’ demand point travel accessibility, and develop the accessibility thematic map (note that the accessibility classification in the figure adopted the natural discontinuity classification method), as shown in Figure 15. Moreover, the Kriging interpolation analysis tool was used to visualize the accessibilities, as shown in Figure 16.
As shown in Figure 16, within the attraction area of the subway, the spatial accessibilities from residents’ demand points to bus stops is unbalanced, which displays a pattern of “Dense in the center, space in the periphery” and “dense in the east and sparse in the west”.
Specifically, the overall spatial accessibility in the western region is low, especially in the southwestern region. The accessibility in the eastern region is slightly higher than the western region, but it is generally lower than the central area. The average spatial accessibility from residents’ demand points to bus stops is 1.81. Among the 394 valid demand points, 96 of them have no spatial accessibility bus stops, which account for 24.6% of the total number of residents’ demand points.
Therefore, it is necessary to add some bus stops to improve the accessibility of the overall spatial accessibility in these communities.
In this regard, this paper research set α to 0, for developing new bus stops for the 96 residents’ demand points with no accessibility. These new bus stops were exported as a separate layer in ArcGIS to prepare for the subsequent optimization.

4.3. Preliminary Layout

Based on the accessibility analysis results, and in accordance with the bus stop selection criteria, ArcGIS was used for generating the preliminary layout. The preliminary layout criteria adopted in this paper are described as follows:
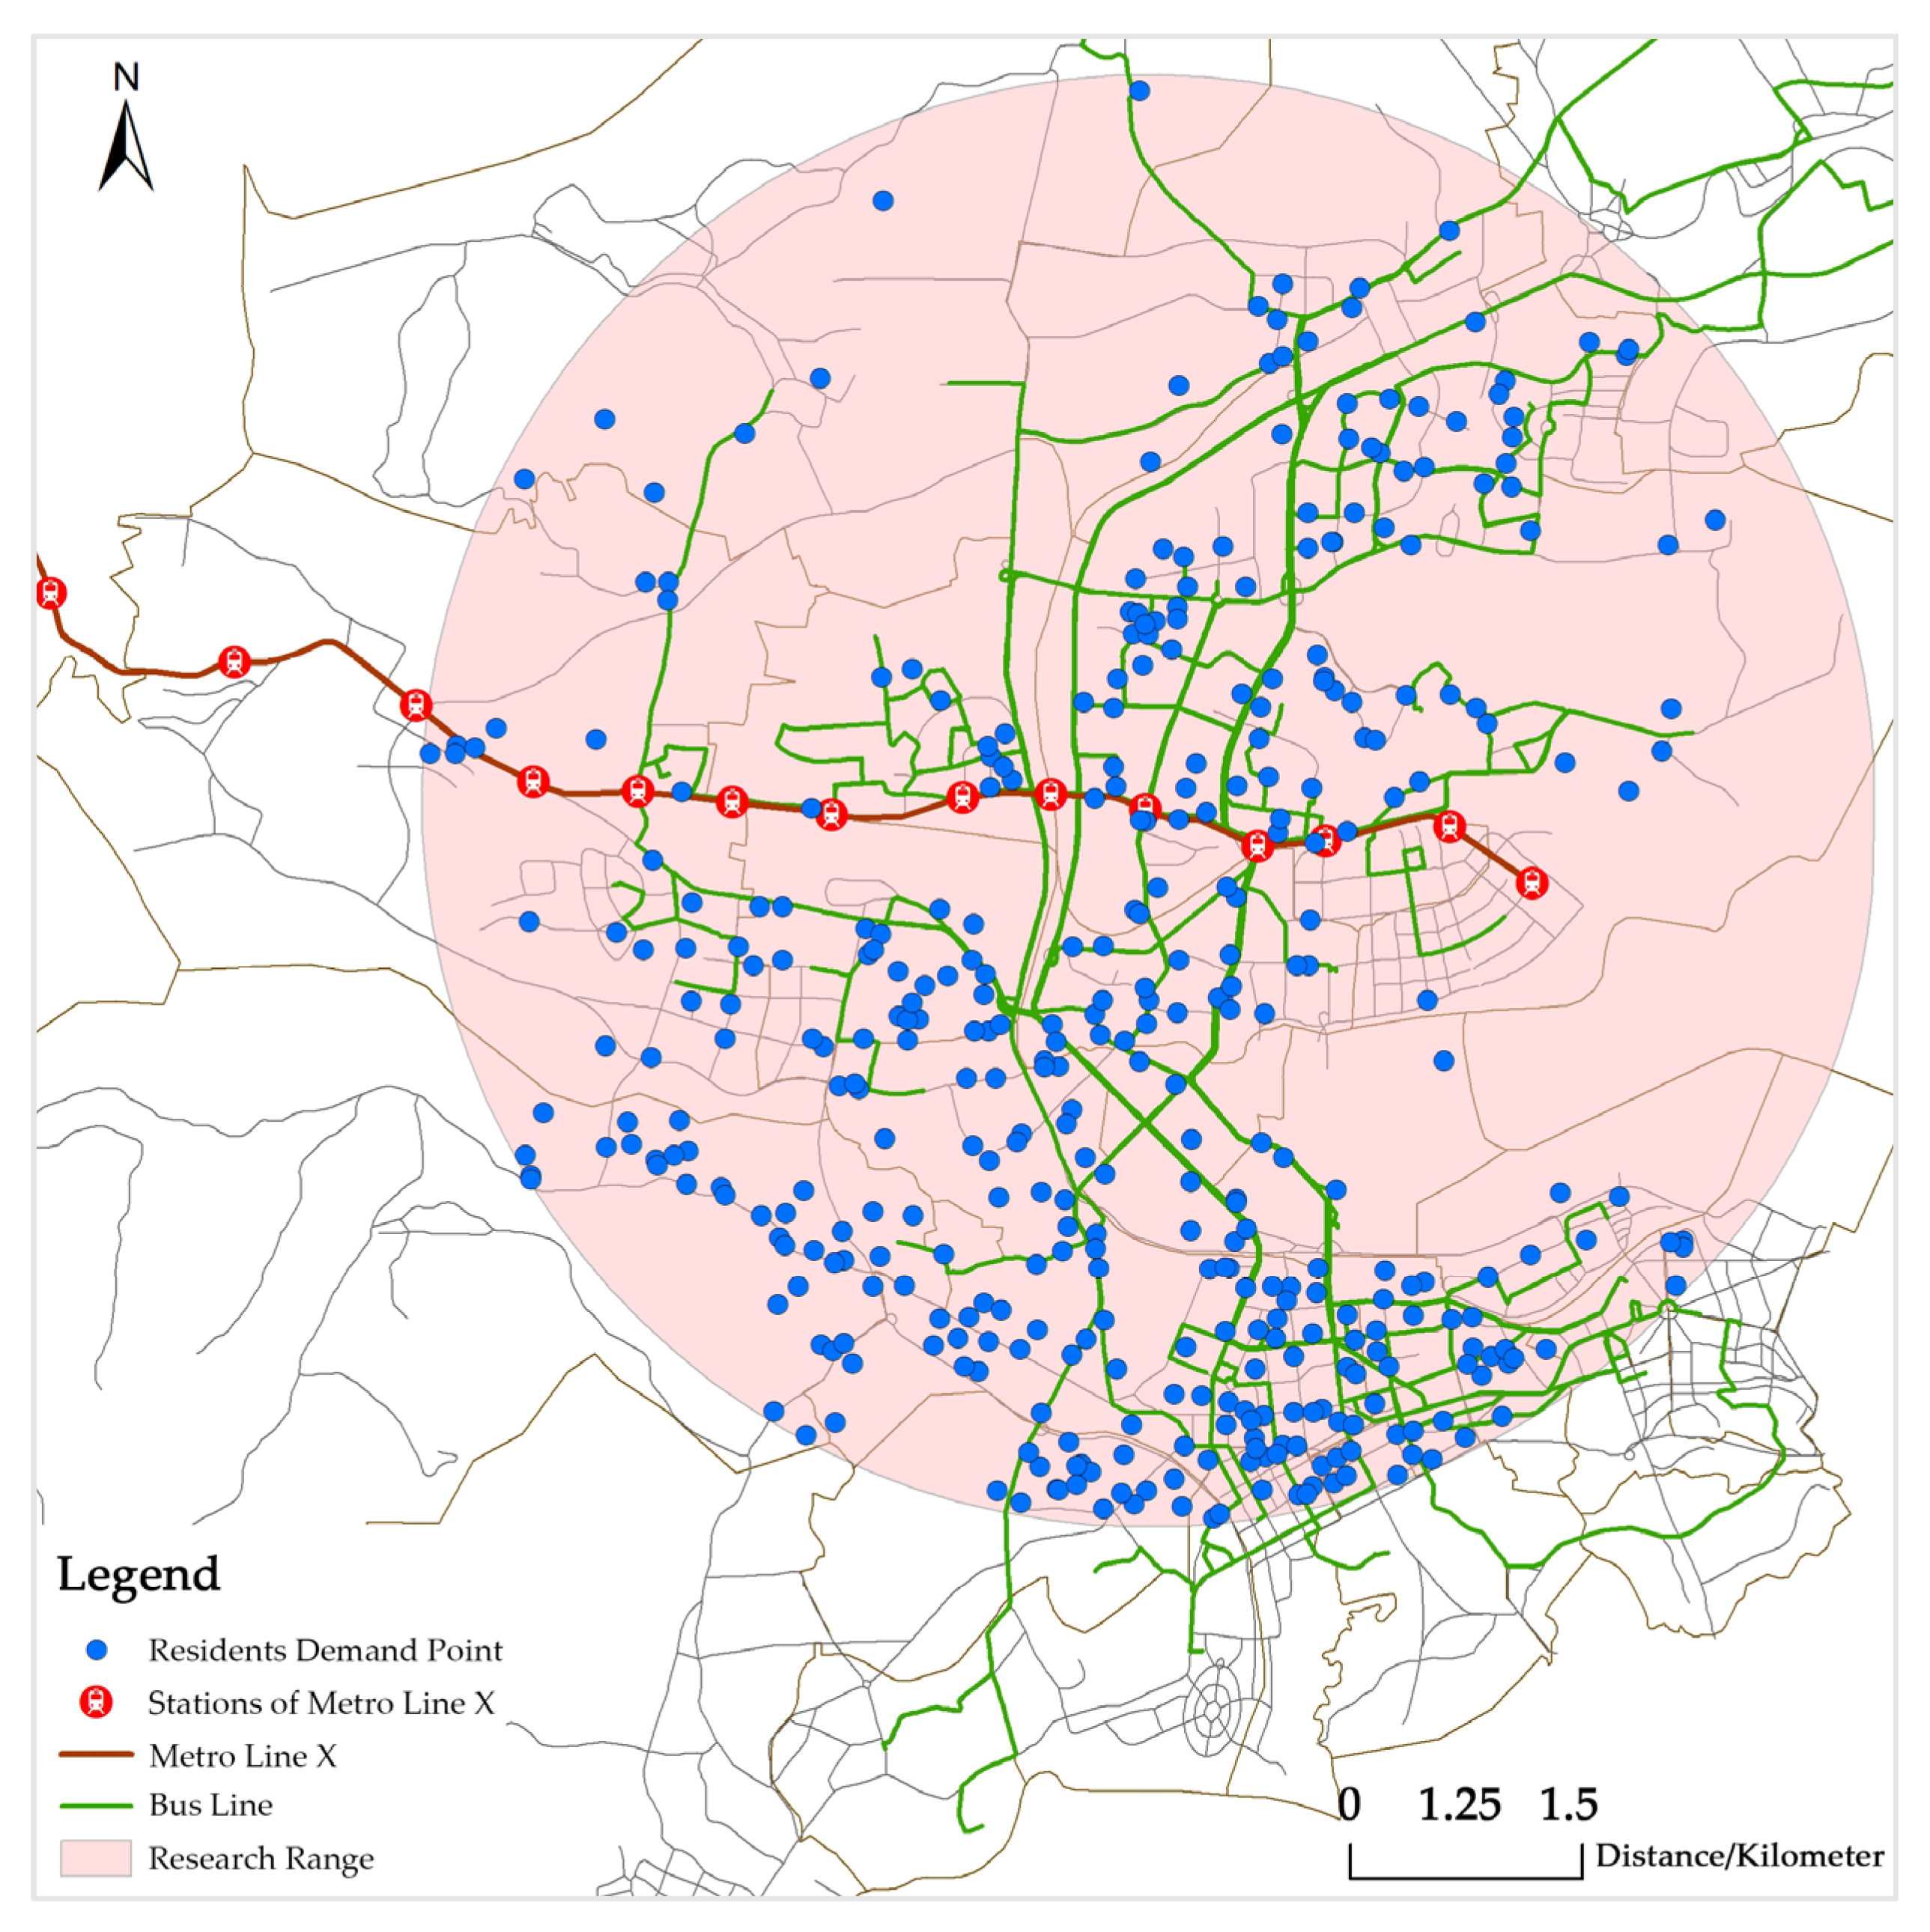
  • Within the attraction area of subway, the premise for residents to transfer to the subway from conventional bus is that the transfer distance from the bus stop to a subway station is shorter than the maximum acceptable walking distance. Therefore, it is necessary to add bus stops for the residential district with no accessibility to bus stops.
  • The service radius of a bus stop is 500 m, which is the maximum acceptable walking distance for residents to take the bus.
  • No more bus stops will be developed at other residents’ demand points.
For the 96 residents’ demand points with no accessibility, a new layer was created in ArcGIS. As the bus stops need to be developed along the road, the buffer analysis tool of ArcGIS was used to analyze the residents’ demand points with a walking distance of 500 m. Usually, a bus stop can be located in the vicinity of an intersection (upstream or downstream the intersection) or in the middle of the road section. Previous research on the impacts of bus stops on road capacity indicated that bus stops located in the vicinity of an intersection could more effectively converge and disperse passenger flow from all directions [29,30]. In this regard, when locating the bus stops in the buffer zone of residents’ demand points, they are primarily located near the intersection according to the actual road conditions and the surrounding environment. If there is no intersection or the actual conditions are not suitable for deploying bus stops, they are deployed in the middle of the road section. The preliminary layout of the 96 candidate bus stops is shown in Figure 17.

4.4. Algorithm Solution

The bus stop location optimization model was processed based on the aforementioned NSGA-II algorithm. The following modeling parameters were employed: Crossover probability was 0.8, mutation probability was 0.8, the initial population was 100, and the number of iterations was 500. Eventually, a group of 32 equilibrium solutions were obtained, and the Pareto frontier curve was plotted as shown in Figure 18.
The entropy weight TOPSIS evaluation model was used to determine the weights of the two objective functions in the bus stop location optimization model, where residents’ travel costs account for 39% and the construction costs account for 61%. Figure 19 presents the optimal bus stop locations determined after final evaluation and sorting.
The optimal scheme added 51 new bus stops to the subway attraction area, and the accessibility of residents to bus stops after bus stop location optimization was analyzed by Kriging interpolation, as shown in Figure 20. After optimization, the average accessibility of residents to bus stops is 1.97, which is significantly higher than before optimization. At the same time, combined with the results of accessibility interpolation before and after optimization, it can also be clearly seen that the residents’ overall accessibility after optimization is improved, and the distribution is more balanced, indicating that the full coverage of bus stops within 500 m of walking distance is also achieved.

5. Conclusions

To effectively operate an integrated subway and conventional bus transportation system, it is crucial to ensure that travelers have a good accessibility to bus stops. This paper analyzed residents’ accessibilities to existing conventional bus stops located within the attraction area of a subway and identified traffic districts with no accessibility to bus stops. Then, based on NSGA-II and entropy weight TOPSIS models, this paper proposed the addition of 51 new bus stops to the study area, and the optimization of the layout of the bus stops for residents’ demand points with an accessibility of less than or equal to α . Through a comparative analysis of accessibility before and after optimization, it was found that the average accessibility after optimization increased by 0.16, indicating that the proposed model has the potential of improving the spatial accessibility and realizing the full coverage of bus stops within 500 m of all residents’ demand points in the study area. It provides a foundation for the subsequent optimization of subway and conventional bus operations and provides insights for the locating bus stops in other cities.
This paper used ArcGIS software to calculate and analyze the accessibility of residents using an improved potential model and visualized the bus stop locating problem in a clear and institutive manner. A real-world case study was conducted, where the locations of bus stops well represent the actual road network conditions, and it is applicable to analyzing large-scale road networks with a large number of bus stops.
In addition, since this research employs two conflicting objective functions aiming at minimizing both residents’ travel costs and infrastructure deployment costs in the optimization model, it is challenging to obtain an optimal solution to accommodate both objectives simultaneously. Therefore, the NSGA-II and entropy weight TOPSIS models were adopted to solve the optimal solution that can balance the tradeoffs between the two objective functions. This method was proven as a simple and valid solution for the conflicting multi-objective optimization problems.

Author Contributions

Conceptualization, S.W. and Z.Z.; data curation, S.W. and Y.L.; funding acquisition, Z.Z.; investigation, S.W.; methodology, S.W. and Z.Z.; software, S.W.; validation, S.W.; writing—original draft, S.W.; writing—review and editing, S.W. and Z.Z. All authors have read and agreed to the published version of the manuscript.

Funding

This research was funded by the Liaoning Province Science and Technology Plan Project Soft Science Research Plan, Grant No. 2021JH4/10100061.

Institutional Review Board Statement

Not applicable.

Informed Consent Statement

Not applicable.

Data Availability Statement

Not applicable.

Acknowledgments

The authors appreciate the urban conventional bus data provided by the Gaode Data Open Platform, the rail transit passenger flow data provided by the Dalian Metro Group, and the population data provided by the digital observation data platform.

Conflicts of Interest

The authors declare no conflict of interest.

References

  1. Maria, V.C.; Nicola, F. A Methodology to Evaluate Accessibility to Bus Stops as a Contribution to Improve Sustainability in Urban Mobility. Sustainability 2019, 11, 803. [Google Scholar]
  2. Li, J.Z.; Xia, T.; Zhu, M. Multi-source data visual analysis method for bus station optimization. Mini-Micro Syst. 2022, 43, 1350–1355. [Google Scholar]
  3. Cheng, Y.Y.; Guo, J.H.; Jiang, H.X. Matter element analysis and evaluation of bus station layout rationality based on interest point data. Traffic Inf. Saf. 2020, 38, 63–72. [Google Scholar]
  4. Duan, G.L.; Ma, X.; Wang, J.R.; Wang, Z.S.; Wang, Y. Optimization of Urban Bus Stops Setting Based on Data Mining. Int. J. Pattern Recognit. Artif. Intell. 2021, 35, 2159028. [Google Scholar] [CrossRef]
  5. Yue, Z.H. Design and Implementation of Bus Station Location Visualization System Based on Multi-Mode Analysis. Ph.D. Thesis, Zhejiang University of Technology, Hangzhou, China, 2020. [Google Scholar]
  6. Garg, N.; Ramadurai, G.; Ranu, S. Mining bus stops from raw GPS data of bus trajectories. In Proceedings of the 2018 10th International Conference on Communication Systems & Networks (COMSNETS), Bengaluru, India, 3–7 January 2018; pp. 583–588. [Google Scholar]
  7. Zhu, G.Y.; Zhang, W.X.; Wei, J.; Zhang, P. Research on a bus station location model based on Voronoi diagram. Transp. Res. 2015, 1, 25–30+36. [Google Scholar]
  8. Ge, B.; Cai, L.; Wang, F. Layout optimization of conventional bus stations based on Thiessen polygon service partition. J. Wuhan Eng. Univ. 2018, 40, 668–672. [Google Scholar]
  9. Wang, F.; Ye, M.Q.; Zhu, H.B.; Gu, D.J. Optimization Method for Conventional Bus Stop Placement and the Bus Line Network Based on the Voronoi Diagram. Sustainability 2022, 14, 7918. [Google Scholar] [CrossRef]
  10. Zhao, C. Site location optimization based on GIS-Taking bus No.2 in Xinluo District of Longyan City as an example. Inf. Comput. 2018, 6, 3–5. Available online: http://www.cqvip.com/qk/95974a/201806/7000624859.html (accessed on 28 February 2023).
  11. Bai, Y.; Liu, W. Research on the optimization of bus station layout based on GIS location allocation model-Taking Nanhu District of Wuhan as an example. Urban Public Traffic 2017, 26–31. Available online: https://www.researchgate.net/publication/336141264_jiyu_GIS_weizhifenpeimoxingdegongjiaozhandianbujuyouhuayanjiu_--yiwuhanshinanhupianquweili_baiyang_liuwen_Research_on_bus_station_layout_optimization_based_on_GIS_location_allocation_model_--A_case_st (accessed on 28 February 2023).
  12. Xie, H.; Du, J.K. Bus station planning method based on optimization theory and GIS spatial analysis technology. J. Wuhan Univ. Technol. 2004, 6, 907–910. [Google Scholar]
  13. Shatnawi, N.; Al-Omari, A.A.; Al-Qudah, H. Optimization of Bus Stops Locations Using GIS Techniques and Artificial Intelligence. Procedia Manuf. 2020, 44, 52–59. [Google Scholar] [CrossRef]
  14. Delmelle, E.M.; Li, S.; Murray, A.T. Identifying bus stop redundancy: A gis-based spatial optimization approach. Comput. Environ. Urban Syst. 2012, 36, 445–455. [Google Scholar] [CrossRef]
  15. Huang, Z.F.; Zhao, L.J.; Lu, L.L. Bus station layout based on station selection behavior feedback and accessibility requirements. J. Chang. Univ. 2015, 120–123+139. [Google Scholar]
  16. Otto, B.; Boysen, N. A dynamic programming based heuristic for locating stops in public transportation networks. Comput. Ind. Eng. 2014, 78, 163–174. [Google Scholar] [CrossRef]
  17. Ibeas, Á.; dell’Olio, L.; Alonso, B.; Sainz, O. Optimizing bus stop spacing in urban areas. Transp. Res. Part E Logist. Transp. Rev. 2010, 46, 446–458. [Google Scholar] [CrossRef]
  18. Tang, C.J. Research on Conventional Bus Station Location Method Considering Function Type. Ph.D. Thesis, Chongqing Jiaotong University, Chongqing, China, 2021. [Google Scholar]
  19. Zamanian, M.H.; Peiravian, F. Multi-Step Heuristic Method for Bus Terminal Location Problem. Transp. Res. Rec. J. Transp. Res. Board 2019, 2673, 361–369. [Google Scholar] [CrossRef]
  20. Cipriani, E.; Gori, S.; Petrelli, M. Transit network design: A procedure and an application to a large urban area. Transp. Res. Part C 2010, 20, 3–14. [Google Scholar] [CrossRef]
  21. Nikolic, M.; Teodorovic, D. Transit network design by Bee Colony Optimization. Expert Syst. Appl. 2013, 40, 5945–5955. [Google Scholar] [CrossRef]
  22. Li, Y. Optimal Setting of Bus Stops Near Intersections. Ph.D. Thesis, Chang’an University, Xi’an, China, 2020. [Google Scholar]
  23. Alonso, B.; Moura, J.L.; Ibeas, A.; dell’Olio, L. Analytical model for calibrating delay at congested bus stops. Transp. Plan. Technol. 2013, 36, 520–528. [Google Scholar] [CrossRef]
  24. Luigi, D.; Luis, M.J.; Angel, I. Bi-Level Mathematical Programming Model for Locating Bus Stops and Optimizing Frequencies. Transp. Res. Rec. J. Transp. Res. Board 2006, 1971, 23–31. [Google Scholar]
  25. Anthony, A.S. Model for Determining Optimum Bus-Stop Spacingin Urban Areas. J. Transp. Eng. 2001, 127, 195–199. [Google Scholar]
  26. Zhao, S.A.; Zuo, Z.Y. Research on regional accessibility based on urban public transport. J. Dalian Jiaotong Univ. 2017, 38, 6–10. [Google Scholar]
  27. Tang, P.F.; Xiang, J.J.; Luo, J.; Chen, G.L. Research on spatial accessibility of county primary schools based on improved potential model-Taking Xiantao City, Hubei Province as an example. Adv. Geogr. Sci. 2017, 36, 697–708. [Google Scholar]
  28. Wang, J.; Hu, L.G. The attraction range of urban rail transit stations to conventional bus passenger flow. Syst. Eng. 2010, 28, 14–18. [Google Scholar]
  29. Tian, C.C. Research on Optimal Setting of Conventional Bus Stops. Ph.D. Thesis, Central South University, Changsha, China, 2009. [Google Scholar]
  30. Wong, S.C.; Yang, H.; Yeung, W.S.A.; Cheuk, S.L.; Lo, M.K. Delay at Signal-Controlled Intersection with Bus Stop Upstream. J. Trans. Eng. 1998, 124, 229–234. [Google Scholar] [CrossRef]
Figure 1. Research status of optimizing the location of bus stops.
Sustainability 15 04517 g001
Figure 2. Research framework.
Sustainability 15 04517 g002
Figure 3. Traffic community layer.
Sustainability 15 04517 g003
Figure 4. Urban road network layer.
Sustainability 15 04517 g004
Figure 5. Bus stops layer.
Sustainability 15 04517 g005
Figure 6. Bus lines layer.
Sustainability 15 04517 g006
Figure 7. Subway route and station layer.
Sustainability 15 04517 g007
Figure 8. Residential demand points layer.
Sustainability 15 04517 g008
Figure 9. Daily traffic volume of subway line X station.
Sustainability 15 04517 g009
Figure 10. Adjustment direct attraction area.
Sustainability 15 04517 g010
Figure 11. Adjustment direct attraction area of the selected stations.
Sustainability 15 04517 g011
Figure 12. Bus stops within the study area.
Sustainability 15 04517 g012
Figure 13. Resident demand points within the study area.
Sustainability 15 04517 g013
Figure 14. The calculation process in ArcGIS to realize the improved potential model.
Sustainability 15 04517 g014
Figure 15. Results of accessibility of residents’ demand points.
Sustainability 15 04517 g015
Figure 16. Kriging interpolation results of residents’ demand point accessibility.
Sustainability 15 04517 g016
Figure 17. Schematic diagram of candidate bus stops.
Sustainability 15 04517 g017
Figure 18. Pareto frontier curve.
Sustainability 15 04517 g018
Figure 19. Optimal bus stop locations.
Sustainability 15 04517 g019
Figure 20. Kriging interpolation results of accessibility under optimal location scheme.
Sustainability 15 04517 g020
Table 1. The indirect influence scope by station type.
Station TypeRadius of Attraction Area (km)Scope of Attraction Area (km2)Station Name
Transfer Station7.82190.62Songjiang Road Station, Xinzhaizi Station, Jinjia Street Station, and Suoyuwan Station
Central Business Area Station6.00111.62Xinda Street Station, Zelong Lake Station, and University of Technology Station
Suburban Station11.92444.87Xinping Street Station, Yinxing Avenue Station, Zhoujiagou Station, Dongnanshan Station, Qianmu Station, Xingfu Village Station, and Yingchengzi Station
Regular Residential Area Station6.62136.15Dongfang Road Station, Jinsanjiao Station, and Xibei Road Station
Disclaimer/Publisher’s Note: The statements, opinions and data contained in all publications are solely those of the individual author(s) and contributor(s) and not of MDPI and/or the editor(s). MDPI and/or the editor(s) disclaim responsibility for any injury to people or property resulting from any ideas, methods, instructions or products referred to in the content.

