Article

Mechanical Properties of the Combination of Surrounding Rock and Primary Support under Impacting Load

1
School of Resource & Environment and Safety Engineering, Hunan University of Science and Technology, Xiangtan 411201, China
2
South Coal Mine Gas and Roof Disaster Prevention and Control Safety Production Key Laboratory, Xiangtan 411201, China
*
Author to whom correspondence should be addressed.
Sustainability 2023, 15(5), 4410; https://doi.org/10.3390/su15054410
Submission received: 17 December 2022 / Revised: 22 February 2023 / Accepted: 28 February 2023 / Published: 1 March 2023
(This article belongs to the Special Issue The Development of Underground Projects in Urban Areas)

Abstract

:
The SHPB experimental device was adopted to carry out the uniaxial impact tests in studying the failure characteristics of the combination of surrounding rocks and primary support for the tunnel, so as to explore the key factors affecting its dynamic strength and deforming properties. To simplify the practice model of the tunnel construction, the specimens combined by the surrounding rock and primary support were simulated by the concentric annular sandstone and cement mortar in this paper. The results indicate that the thickness of the primary support, the thickness of the surrounding rock and the proportion of the thickness of the primary support are the key factors affecting the dynamic strength of the combination of the surrounding rock and the primary support. The influence of dynamic loads on tunnel construction can be weakened by adjusting the above three factors, so that to improve the supporting capacity. The research has a significant reference for the designing of tunnel engineering under complex loads.

1. Introduction

Since the 1990s, the field of tunnel construction engineering in China has developed rapidly. The drill-blasting method has been widely used in tunnel construction engineering in recent years, and most of the tunnel constructions have been initially sprayed after excavation, forming a certain primary spraying layer with 20–50 cm thickness to support and maintain the stability of surrounding rock. The surrounding rock should be reinforced generally by cement supporting structure to prevent collapse during working. The supporting structure is mainly composed of the unsupported section, the primary support section and the lining section, which are successively distributed from the working face to the excavated end. The vibration loadings with certain intensity at the working face are generated by the explosion in the blasting bore, and this kind of vibration loadings will be transmitted to the primary support and the surrounding rock. As a temporary support frame, the strength of the primary support is seriously affected by the blasting vibration loadings. Therefore, it is necessary to figure out the strength and deforming properties of the combination of surrounding rock and primary support, and clarify the characteristics of energy consumption and the failure mode of it under vibration loadings, so that to optimize the tunnel support.
The mechanical properties and the failure characteristics of the combination of the surrounding rock and primary support under different kinds of loads are the basis for the designing of tunnel construction engineering. A series of analyzing models about the primary support construction were put forward by domestic and foreign researchers, such as the coupling elastic–plastic softening model of primary support and surrounding rock considering the aging characteristic of sprayed concrete [1], the surrounding rock mechanical model regarding the acting force of rock bolt as the physical force in surrounding rock reinforcement under creep condition based on the unified strength theory [2], to study the elastic–plastic relationship of the deep-buried circular tunnels based on the uncorrelated flow law and the dynamic interaction feature between the primary support and surrounding rock in each section at different distances from the excavation surface during the tunnel excavation process. As two of the main factors, the distances between the tunnel face and primary support and the confining pressure formed by the surrounding rock under geostress between the contact surface can do a great effect on the strength and mechanical characteristics of the combination structures. By means of the numerical simulation [3,4] method, indoor experimental study [5,6] and field testing [7,8], the researcher analyzed the basic characteristics of the combination structure under different loadings, such as the displacement of surrounding rock [9], the contact forms between each component [10,11], the action law of surrounding rock pressure in soft rock tunnel construction [12,13] and the dynamic damage under the action of blasting loads [14,15,16]. This kind of vibration loading mentioned above may lead to the primary support being subjected to the action of impact loads. Liu et al. [17] studied the influence of blasting vibration load on the primary support and obtained the stress distribution law of the tunnel primary support affected by dynamic load under small clear-distance tunnel blasting. Zhu et al. [18] analyzed the supporting time of karst cave under different stress release factors, and optimized it in the stress release process. WU et al. [19,20] carried out a group of monotonic unconfined compression tests to study the failure mechanism of ring-like materials using hollow cylindrical sandstone, and revealed the discrepancies in ring-shaped granite specimens with inclusion and those without inclusion.
By establishing a mathematical model or adopting the numerical or physical experimental methods, the above research discussed and analyzed the strength and failure characteristics of the combination structure of the tunnel construction in different kinds of external loads or boundary conditions. However, there are few papers or reports published about the effect of the concrete spray thickness of primary support on the strength and deforming feature of the combination structure under impact loads. Based on this, the failure characteristics of the combination of the surrounding rock and primary support for tunnel construction were studied under impact loads in this paper, and the key factors affecting its dynamic strength and deforming properties were analyzed according to the physical tests utilizing the uniaxial SHPB system. The research has a significant reference for the designing of tunnel engineering under complex loads.

2. Methodology

2.1. Structure of the Testing Specimen

The practical tunnel construction, on the whole, can be simplified to be illustrated in Figure 1. In order to study the dynamic response characteristics of the primary support structure, the practical tunnel construction was simplified to be the combination of the surrounding rock and primary support, which was a two-layer structure, simulated by the concentric annular sandstone and cement mortar in this paper. The surrounding rock layer was made of sandstone with good integrity and relatively uniform materials. The internal primary support layer was represented by cement mortar, the particle size of which less than 1 mm. The two layers were bonded by cement, whose strength was 42.5 MPa (P.O 42.5 ordinary Portland cement). According to the industrial standard of the People’s Republic of China [21], the proportion of cement: sand: water = 1:1.66:0.41. The whole process of producing the specimen was carried out by the pouring method, and the testing specimens after pouring were positioned in the place with the curing humidity ≥95% and the temperature was maintained at 20 °C in the environment for 28 d. The manufacturing process of the testing specimen is shown in Figure 2. There were five kinds of testing specimens distinguished by the dimensions after forming, the designing parameters of which are shown in Table 1.

2.2. Physical Properties

The thickness of the primary support layer and the surrounding rock layer varies accordingly to the external and internal radius. To obtain the basic mechanical parameters of the testing specimens, two kinds of conventional tests, uniaxial compression tests and Brazilian splitting tests, were carried out. The standard specimens with a diameter of 50 mm and a height of 100 mm in the compression tests and a diameter of 50 mm and a height of 25 mm in the tensile tests were made of two materials, respectively, in light of the requirements of the experimental equipment. The testing results of the basic mechanical parameters are delivered in Table 2.

2.3. Experimental Apparatus

The indoor experiments of the dynamic response of the combination of the primary support and the surrounding rock were carried out with the self-developed variable diameter split Hopkinson pressure bar (SHPB) system, shown in Figure 3. The special SHPB system is mainly composed of the air chamber, impact head, incident bar, transmit bar, absorber bar, dynamic strain test device, oscilloscope and data-collection center, etc. The material of the bars is consistent with those of conventional SHPB devices, which is made of 40 Cr alloy steel with a density of 7810 kg/m3, elastic modulus of 210 GPa and longitudinal wave velocity of 5410 m/s [22]. The incident bar of the system is a variable cross-section cylindrical bar, so as to adapt to the specimens with different diameters, which has been proven to conform to the one-dimensional stress wave theory [23,24]. The biggest diameter of the incident bar is 200 mm with a length of 1000 mm, the length of the reducing part is 150 mm and the minimum diameter is designed to be 50 mm with the length of 50 mm to accommodate the size of the impact head. The frame of the system, positioned on the test bench, is welded to the base plate to support the variable diameter bar, so that the bar is convenient for coaxial calibration. The bottom plate is equipped with a pulley, which can move in the axial direction. During the tests, the dynamic strain signals, caused by the impact load of the impact head, in all bars can be detected by each strain gauge stuck on the corresponding bar, and amplified and displayed by the dynamic strain test devices and Oscilloscope, which can be used to calculate the dynamic stress and strain of the testing specimen.

2.4. Experimental Scheme

The displacement analysis was carried out under the external loading condition of the primary support and surrounding rock of the tunnel construction through the thick-walled cylinder theory and superposition principle, and the mechanical properties of the combination of the primary support and surrounding rock were analyzed based on the theoretical of impact dynamics of rock materials. In order to figure out the key factors affecting the failure process of the combination structures, the kind of indoor experiments controlling a single variable were carried out according to each group of testing specimens. The main factors considered in this paper include the radial size of the primary support and the surrounding rock, the ratio of the radial size of the primary support and the radial size of the specimen. Consequently, the experimental scheme in this paper was designed to be three groups. In the first group of the tests, the radial size of the primary support was controlled as the variable, whose values were designed to be 10 mm, 15 mm, 20 mm, 25 mm and 30 mm, respectively. Keeping the radial size of the surrounding rock unchanged with a dimension of 40 mm, and then changing the radial size of the specimen from 160 mm to 200 mm with an interval of 10 mm. The testing scheme taking the thickness of the primary support into consideration is listed in Table 3.
The loading strain rate caused by the external impact loads acting on the specimen affects the strength of the combination structure by changing the duration of the failure process and the propagation state, tension, or compression, of the stress wave inside the specimen. The main considerations in this paper are the relative thickness of the primary support and the surrounding rock, whose effects on the mechanical properties of the combination structure of tunnel engineering are explored. Therefore, it is worth mentioning that the gas pressure during impact in these uniaxial SHPB tests was set to be 1.8 MPa without any static load acting on the specimen (Same as below), and keep the gas pressure unchanged in all groups of tests to ensure the same impact load and loading strain rate acted on the specimen.
In the second group of the tests, the radial size of the primary support was controlled to be 20 mm, and the radial size of the surrounding rock was designed to be 30 mm to 50 mm with an interval of 5 mm, respectively. The total size of the specimens was regarded as the variable with values of 160 to 200 mm just like the first groups. The testing scheme considered the thickness of the surrounding rock was illustrated in Table 4.
In the third testing group, the thickness between the primary support and the surrounding rock was set to be 30 mm with a different radial size of each component, and the ratio of the radial size of the primary support and the total size of the specimen were selected to 2/12, 3/12, 4/12, 5/12 and 6/12, respectively. The diameter of the specimens in this group of tests was set to be 180 mm and remains unchanged. The detailed testing scheme can be found in Table 5.

3. Results

3.1. Stress-Time Curves

The stress–time history curves of the first group of specimens are shown in Figure 4, the dynamic strength of each specimen are quite different from each other, but the curves change with a uniform law. There is a simple rule that these stress curves are almost similar to saddle shapes with two different peak values. According to the following failure diagrams of the specimens, the specimens were damaged to different degrees under the same impact load, which indicates that the change ofin cement mortar thickness is related to the stability of the specimen.
Identically, Figure 5 and Figure 6 illustrate the stress–time history curves of the specimens in the second and third groups of specimens, respectively, which are almost similar to that of the first group. The failure mode of the specimens became less obvious when the stress wave peak value rose gradually. It shows that the dynamic strength of the specimen increases under the influence of variables. The results show a certain guiding significance to the actual tunnel construction.

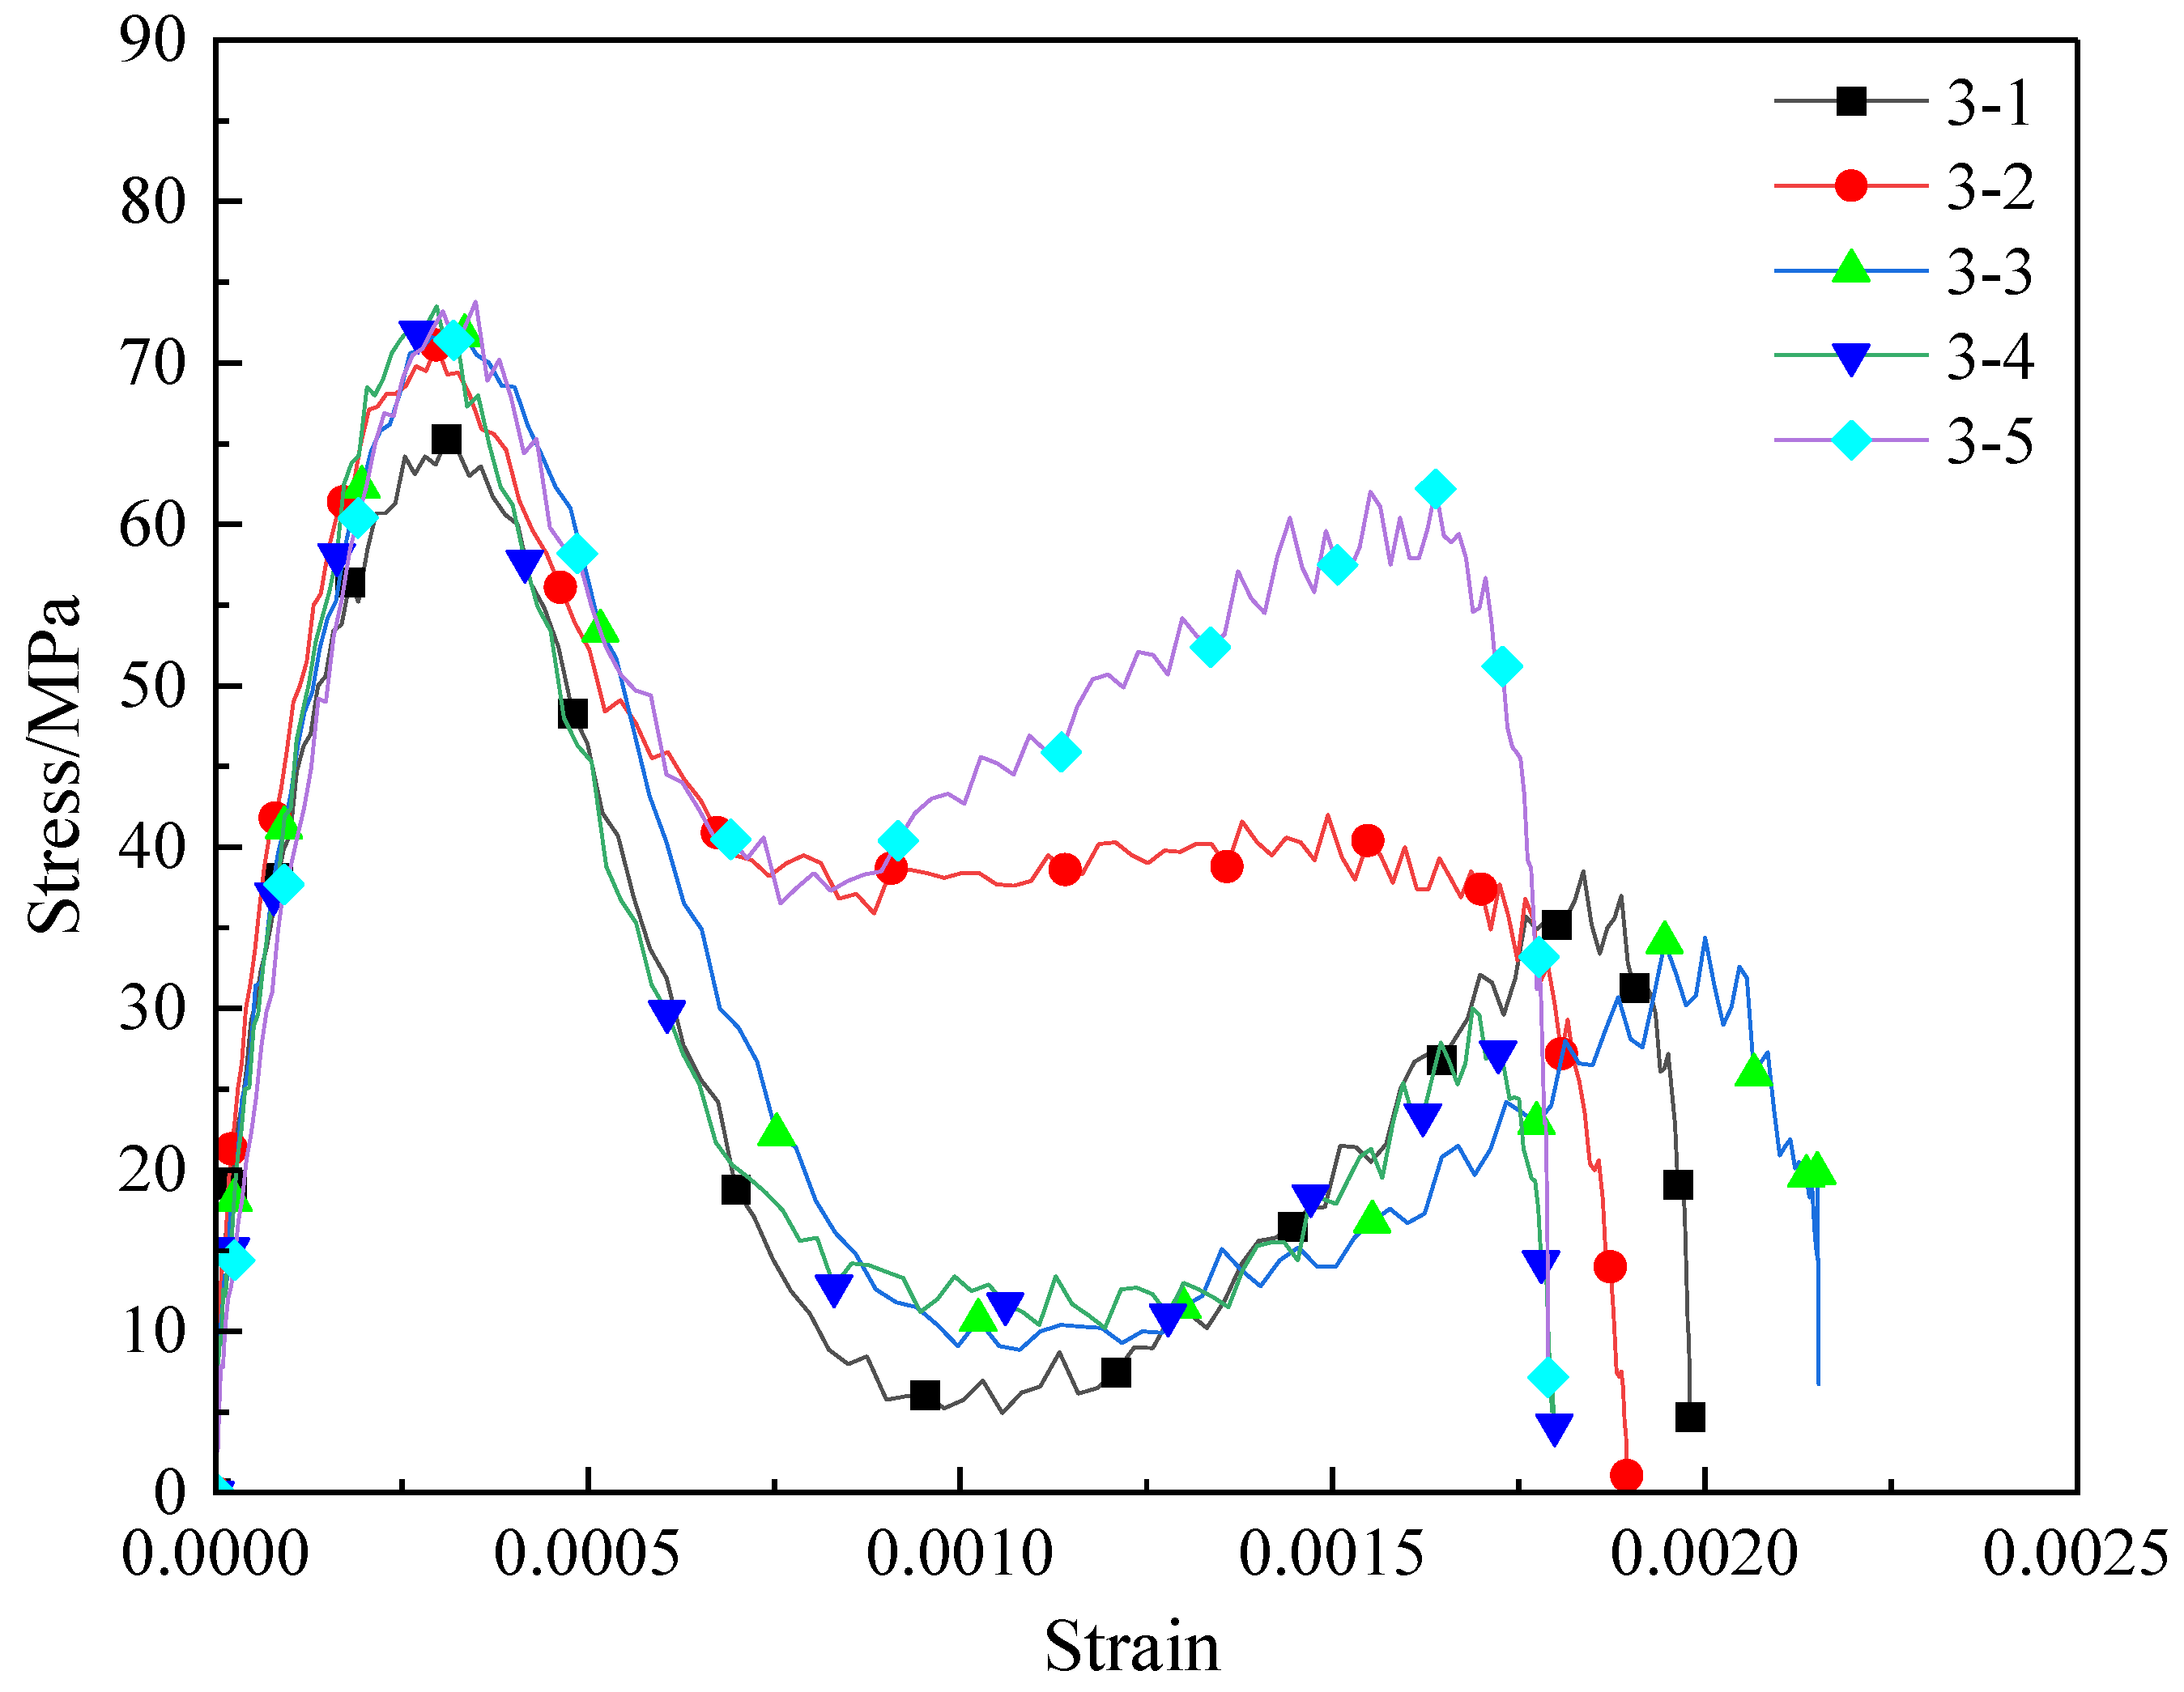
3.2. Stress–Strain Curves

According to the dynamic strain signals recorded in each bar during the tests, the dynamic stress and dynamic strain of the specimen can be calculated based on the three waves method or two waves method [23,24]. Then, the stress–strain curves of the three corresponding groups of the specimens in this paper were obtained and shown in Figure 7, Figure 8 and Figure 9.
It can be seen from Figure 7, Figure 8 and Figure 9 that the stress–strain curves of the three groups of specimens are basically the same in its shape. However, the curves show differences in detail due to the different thickness proportions of the two materials, sandstone and cement mortar. When the dynamic strain of the specimen is greater than 0.025%, the stress–strain curve drops sharply, which indicates that the impact load has exceeded the overall ultimate strength of the testing specimens at this time, and the plastic deformation stage formed to generate irreversible cracks inner the specimen, causing serious damage to the combination of the primary support and surrounding rock. The peak values of the curves are different for all incomplete failure specimens of the three groups, which indicates that the maximum dynamic strength of the combination of surrounding rock and the primary support is affected by the support size.

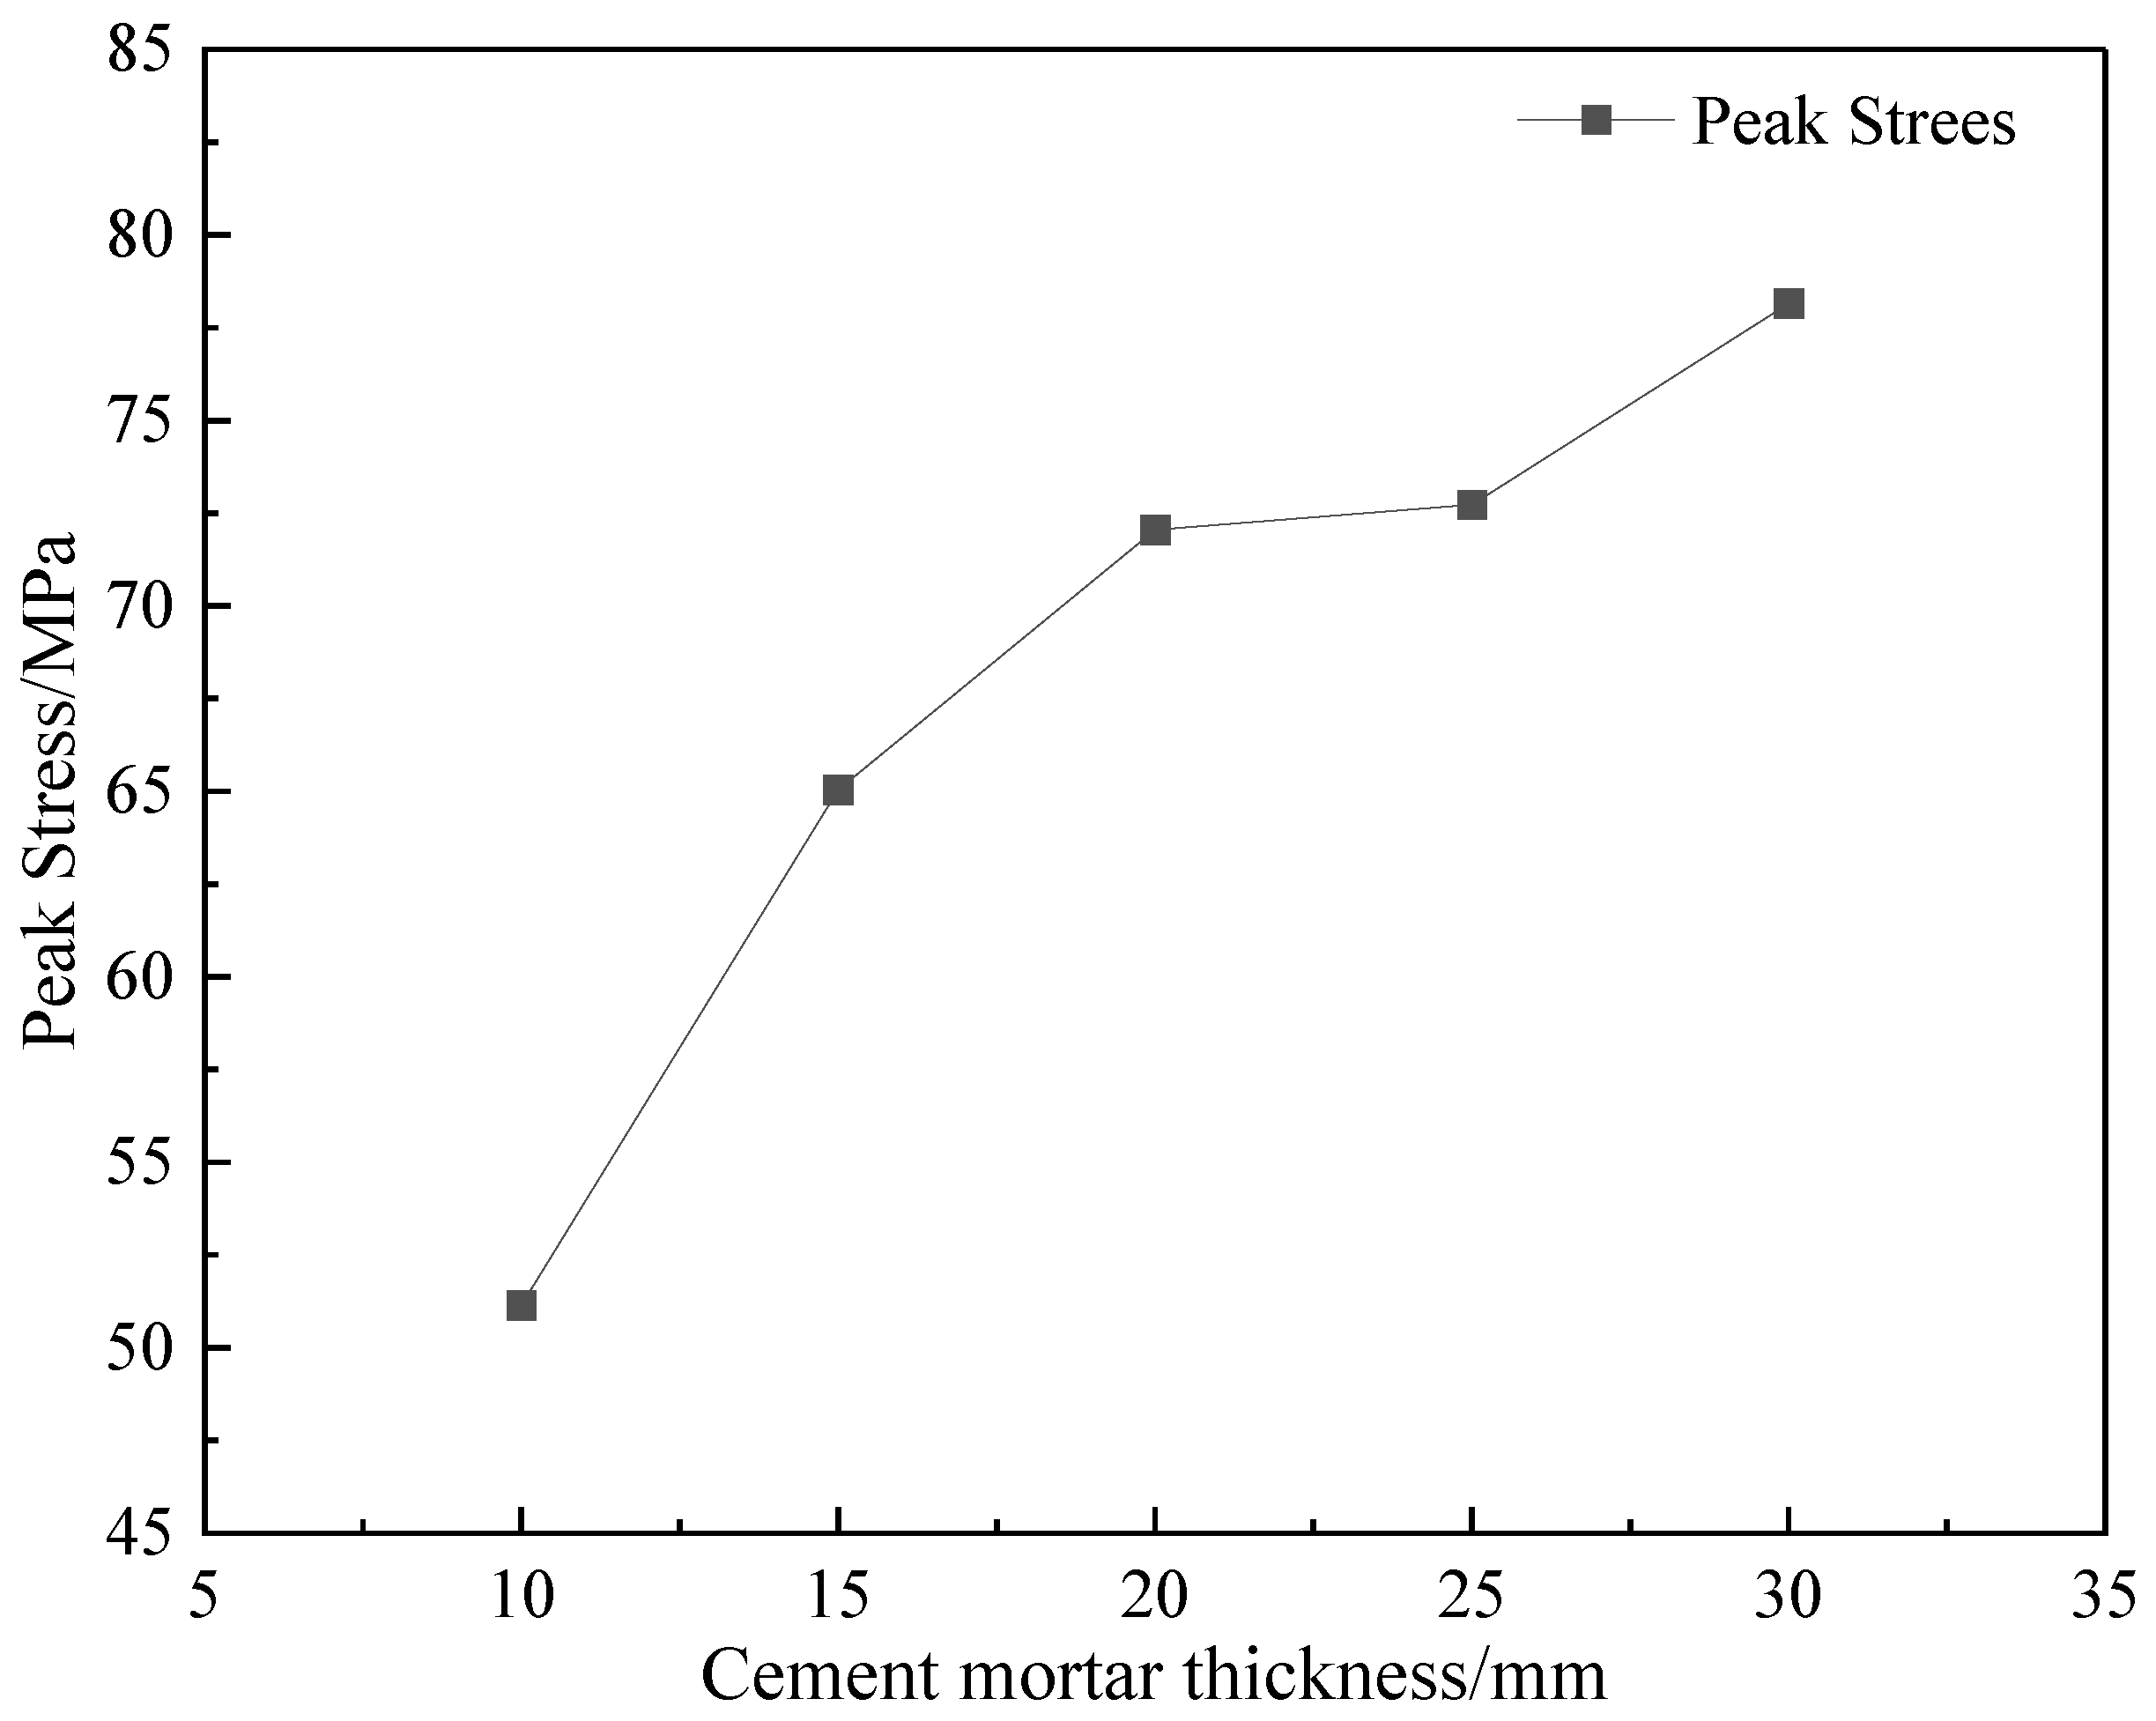
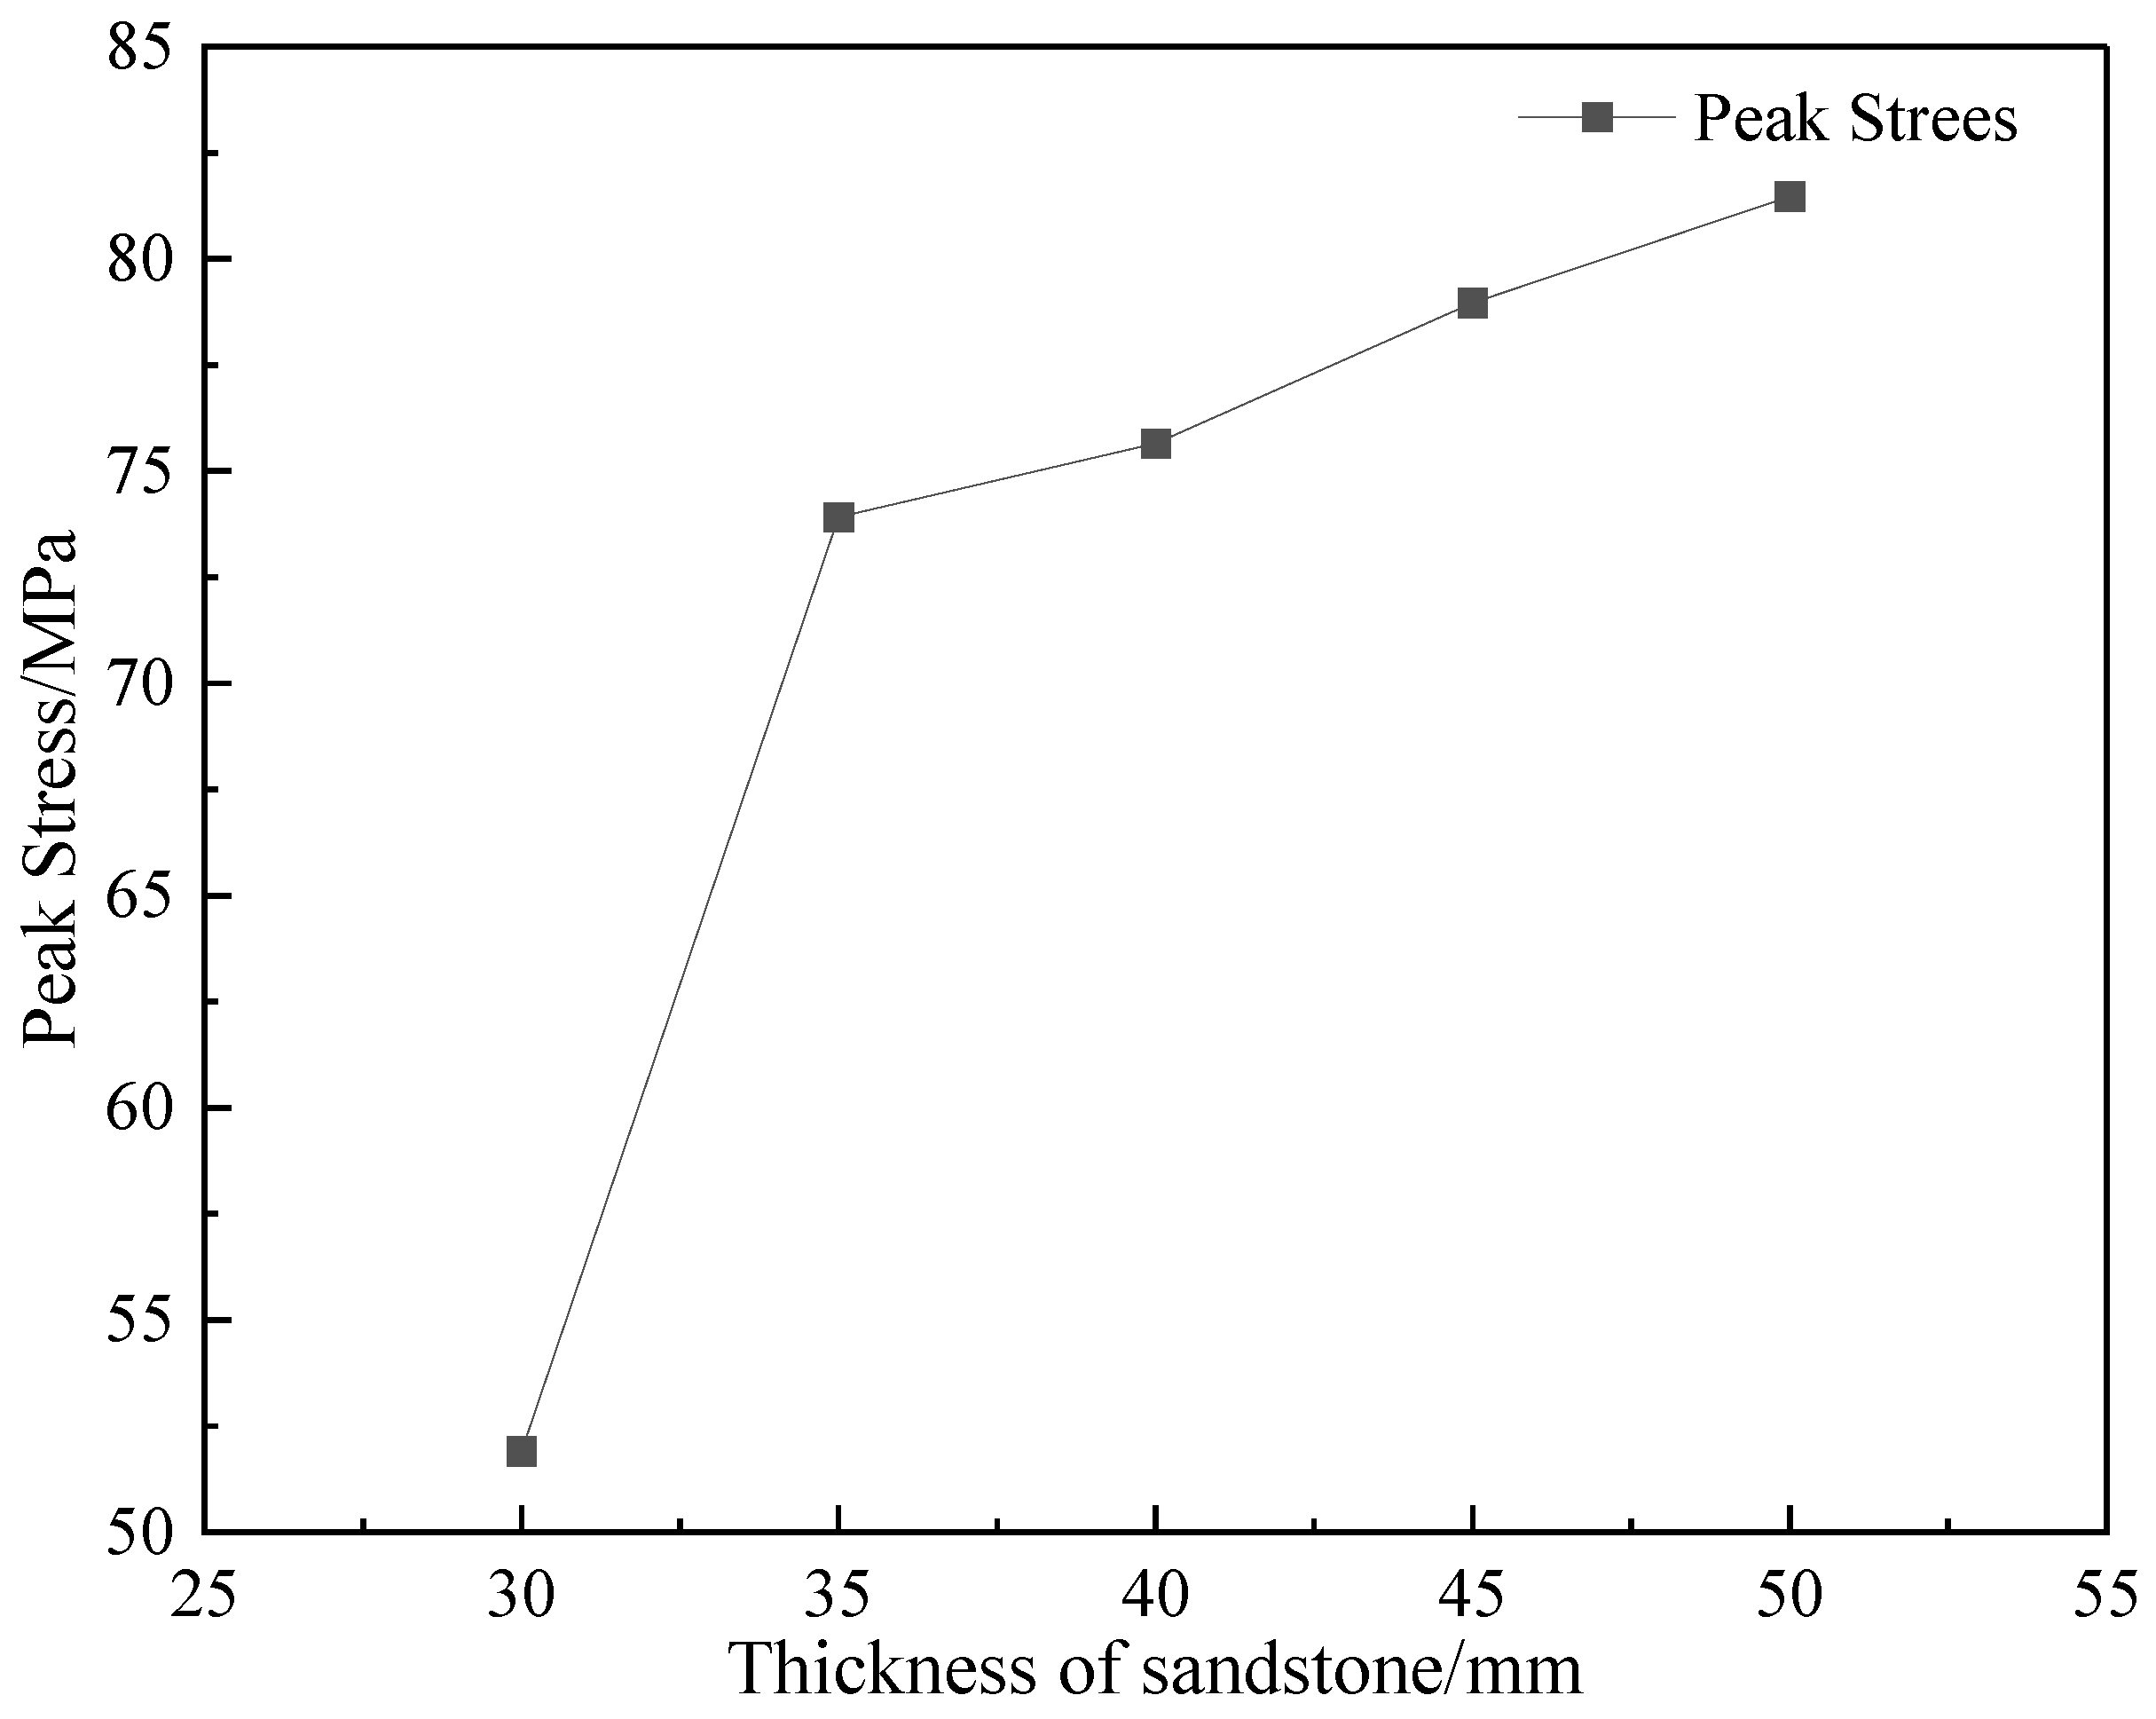
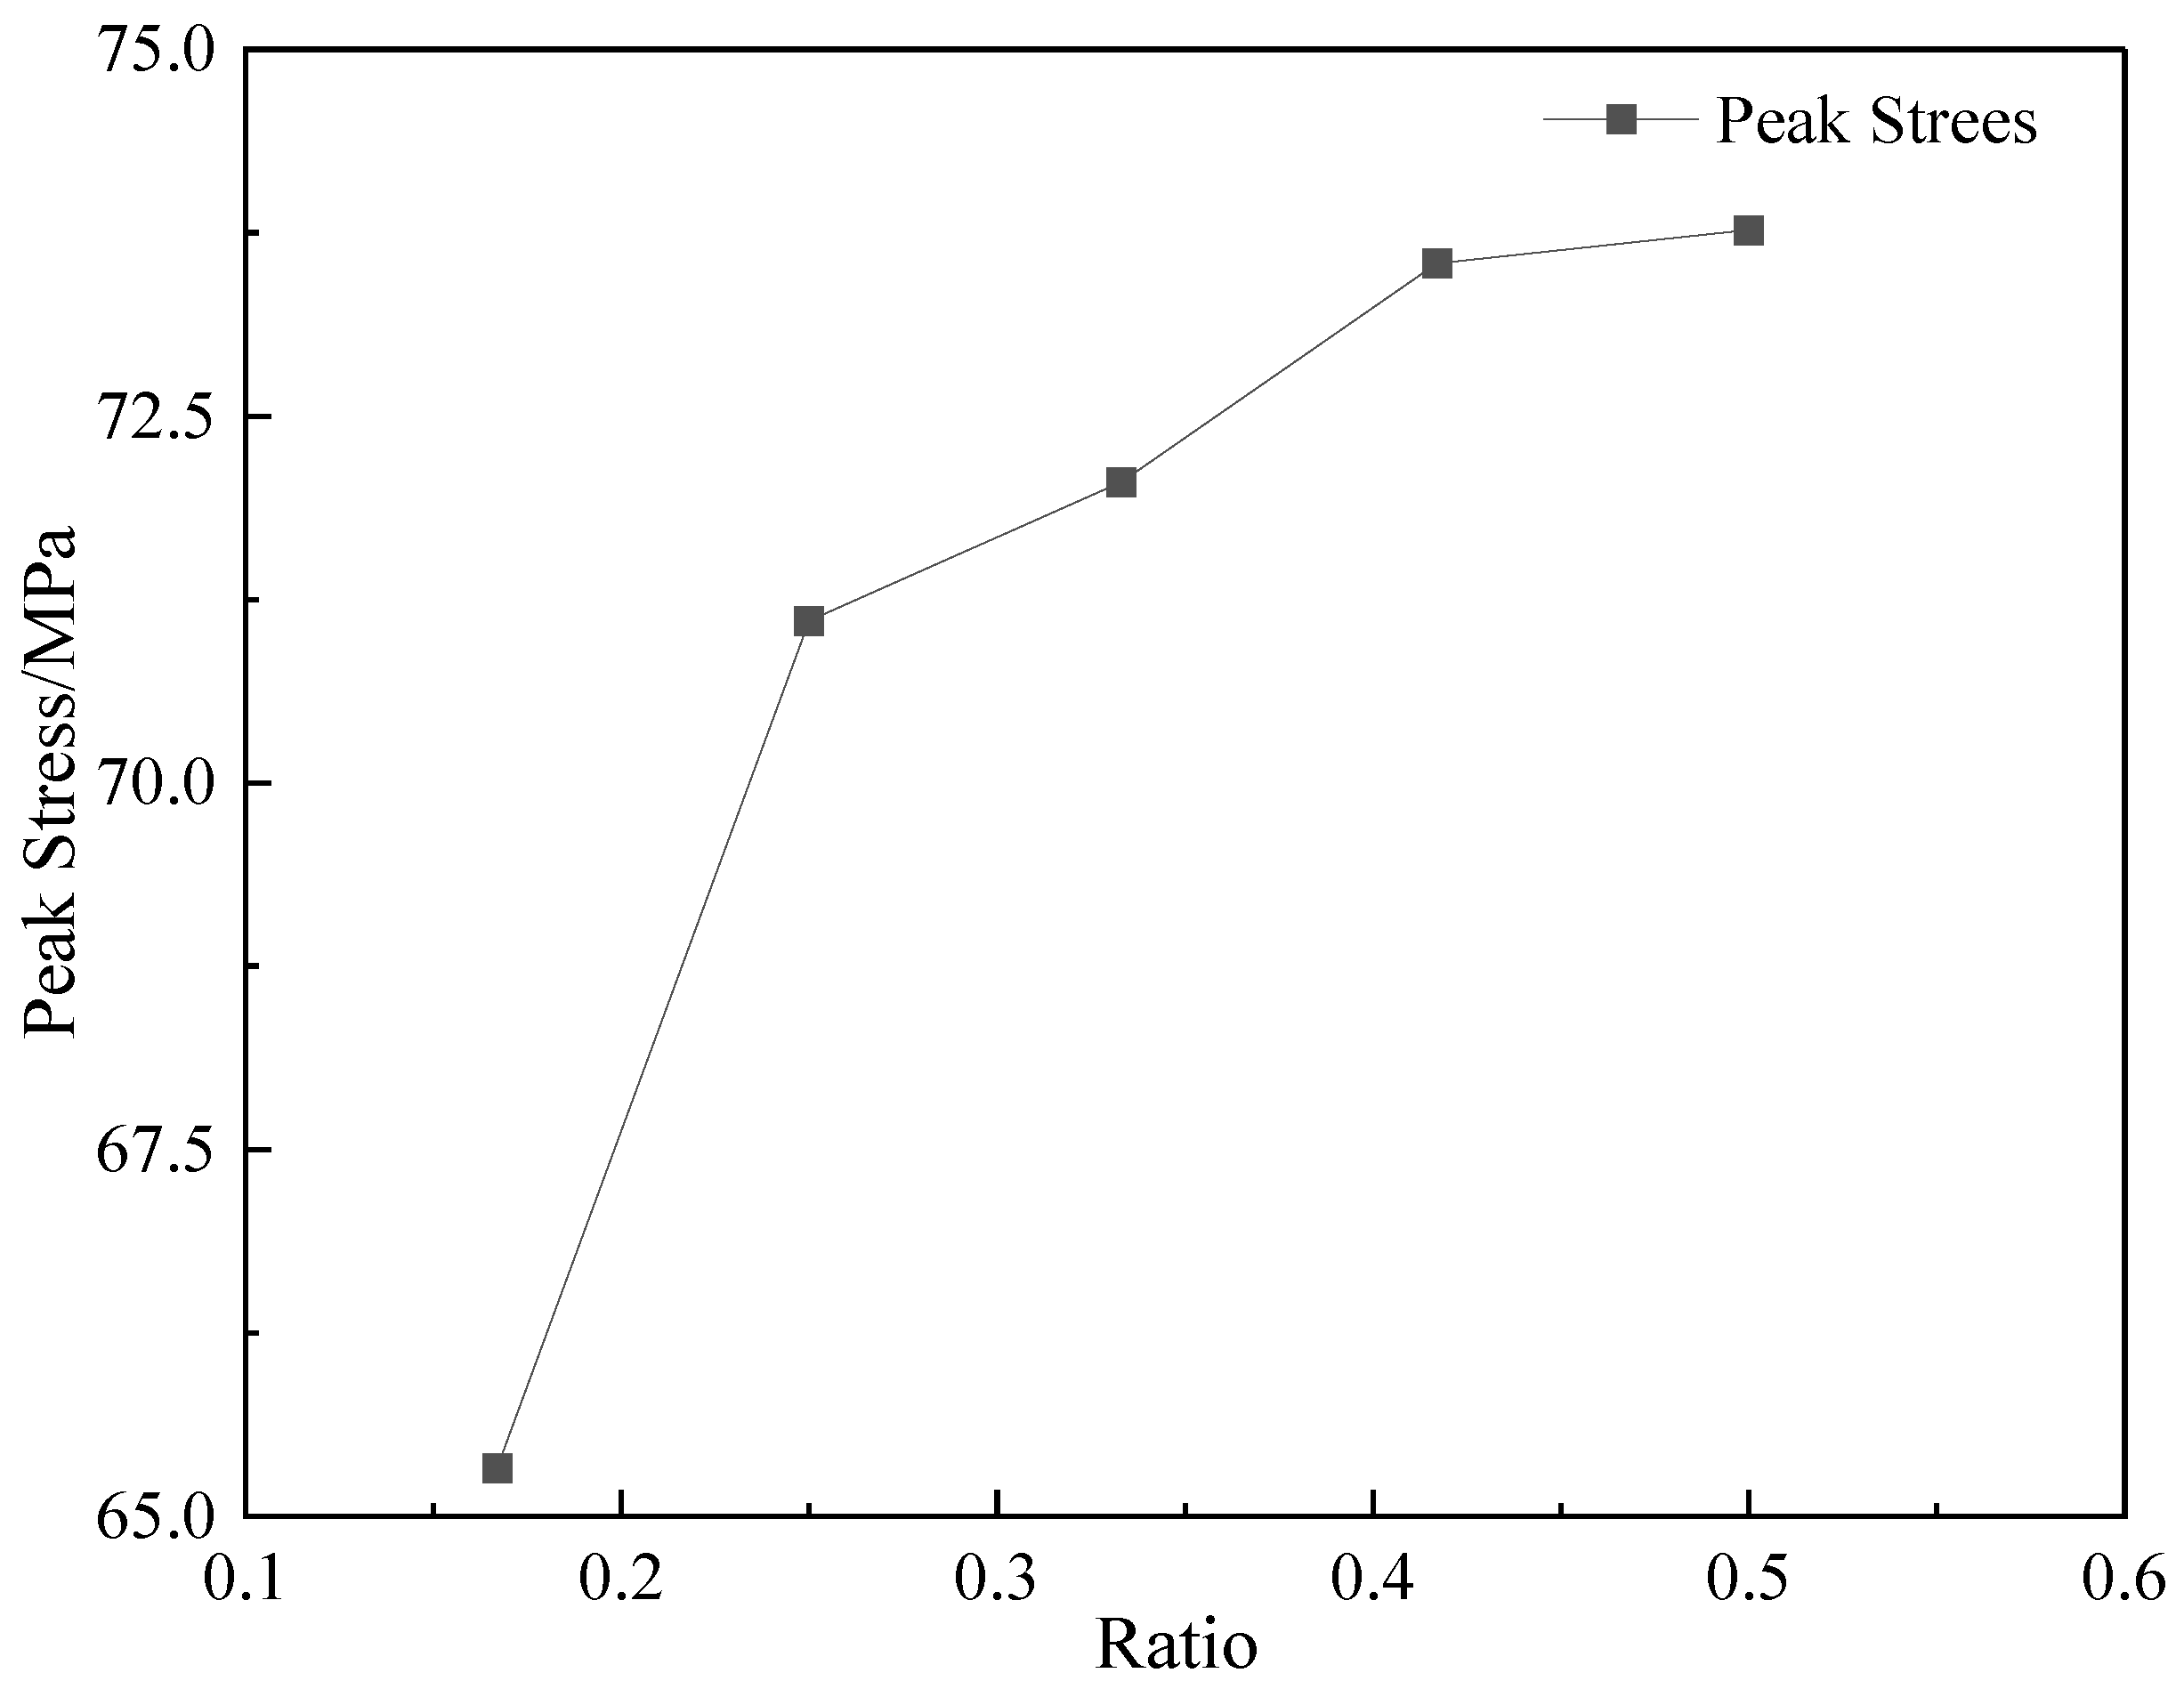
3.3. Dynamic Strength

On account of the analyzing results of the stress–strain curves above, the dynamic strength of each group of specimens was obtained, and the relationship between the dynamic strength and the corresponding variable is illustrated in Figure 10, Figure 11 and Figure 12. It can be seen from the Figures that the dynamic strength of the combination of the primary support and surrounding rock of each group show an increasing tendency with their variables.

4. Discussion

4.1. Energy Consumption

In order to study the relationship between energy consumption and rock fragmentation, the energy consumption of the typical specimen under different impact loads was analyzed. The variation law of the energy monitored in each bar in the testing process of the composite specimen is shown in Figure 13, from which it can be seen that the incident energy and the absorbed energy increase the fastest. The toroidal combination specimen is made of two parts, the primary support simulated by the pure concrete ring and the surrounding rock simulated by the sandstone ring. The inner diameter and outer diameter of the toroidal cement ring are 60 mm and 80 mm, respectively, and that of the sandstone ring are 80 mm and 160 mm. Four kinds of energy ratios increase along with the loading time, and the transmitted energy ratio has minimal growth, as shown in Figure 14. The testing results at several key points at the energy curves were selected to analyze the energy consumption characteristics of the combination of the primary support and the surrounding rock. The selected points include the start point, 50% of the first stress peak, the first stress peak, the middle of the first stress peak, the lowest point between the first stress peak and the second stress peak, the lowest point between the first stress peak and the second stress peak, the middle of the lowest point between the first stress peak and the second stress peak and the second stress peak, the second stress peak, 50% of the second stress peak after the second stress peak and the endpoint. The corresponding testing times to the above points are 0 μs, 13 μs, 38 μs, 51 μs, 71 μs, 93 μs, 114 μs, 131 μs and 140 μs. The ratio of reflected energy to incident energy, the ratio of transmitted energy to incident energy and the ratio of absorbed energy to incident energy, corresponding to all the key points are illustrated in Figure 14. The ratio of reflected energy to incident energy decreases first and then increases, while the ratio of transmitted energy to incident energy and the ratio of absorbed energy to incident energy change opposite to the first one, and similar to each other. Consequently, we can draw a conclusion that all kinds of energy change during the failure process of the combination structure and so as the energy ratios. The variation laws of energy consumption are similar during the course of failure of other composite specimens of surrounding rock and the primary support.
The energy variation curves of the composite specimens under different radial thicknesses of the concrete ring can be found in Figure 15. The ratio of reflected energy to incident energy and the ratio of absorbed energy to incident energy increase first and decrease later, while the ratio of transmitted energy to incident energy does not change significantly. The energy variation curves of the composite specimens under different radial thicknesses of the sandstone ring are shown in Figure 16. The ratio of reflected energy to incident energy first decreases, and then increases and decreases later, the change in the ratio of transmitted energy to incident energy is not obvious, and the ratio of absorbed energy to incident energy firstly increases, then decreases and increases later. The energy variation curves of the composite specimens under different ratios of the radial thicknesses of the concrete ring to the whole specimen’s radial thickness can be seen in Figure 17.

4.2. Failure Mode

The testing specimens are composed of three groups according to the three kinds of variables, the radial thickness of the concrete ring, the radial thickness of the sandstone ring and the ratio of the radial size of the primary support to the whole size of the specimen. The radial thickness of the concrete ring was changed in the first group of testing specimens and the physical failure states of the specimens after the impact loads acted are shown in Figure 18. The primary support of the specimen marked 1-1 was damaged, and some of the circumferential cracks were generated on the surrounding rock. Radial cracks were produced in the primary support and surrounding rock of the specimens marked 1-2 and 1-3, and that also appeared in the specimens marked 1-4 and 1-5 but were almost not destroyed. It can be found that the radial cracks are produced in the concrete layer firstly, and then spread to the outer layer and the surrounding rock. It can be concluded that the combination will not be damaged before the primary support failure to the tunnel construction.
The radial thickness of the sandstone ring was changed in the second group of testing specimens and the physical failure states of the specimens after the impact loads acted can be found in Figure 19. The first three specimens were destroyed seriously and the latter two specimens were damaged slightly. The ratio of the radial size of the primary support to the whole size of the specimen was changed in the third group of the testing specimen and the physical failure states of the specimens are delivered in Figure 20. There are a great number of radial cracks and circumferential cracks produced in the first two specimens, and there are only radial cracks produced in the latter three specimens. According to the failure states of the above specimens, it can be seen that there are a radial failure and circumferential failure for the specimen under impact loads acted, which is consistent with the characteristics of rock blasting failure. It mainly manifested as shear cracks and tensile cracks, corresponding to shear failure and tensile failure as for the specimen.

4.3. Contacting Force

The main purpose of this paper is to study the mechanical behaviors of the combination structures of the surrounding rock and the primary support under impact loads, and figure out the action mechanism of the main factors on its mechanical properties. However, in the designing process of general tunnel engineering at present, the action of the seismic load is usually considered by adopting static mechanical methods [25], the correlation coefficient between horizontal seismic force and the impact load was mainly determined according to the actual situation of the local earthquake before calculation, which is usually lack of accuracy. The seismic force can be calculated based on the following formula:
F i h E = η A g m i
  • FihE—The horizontal seismic force in the calculated mass point, kN;
  • η—The correction coefficient considering the horizontal seismic force, generally 0.20 for rock foundation and 0.25 for non-rock foundation;
  • Ag—Acceleration in the seismic peak, m/s2;
  • mi—Mass of the combination construction in the calculated point, ton.
Although the strength of the primary support checked and calculated by the horizontal seismic force was designed from the static method, it still showed some research references in the study of the deformation and dynamic response law of support under dynamic load. In order to explore the effect of the seismic force of surrounding rock and primary support under impact load, the physical tests of the combination structure were conducted and analyzed in this paper by means of the uniaxial SHPB device, expecting to acquire the basic law of its dynamic strength and deformation characteristics. The research in this paper has certain guiding significance for the designing of the construction in tunnel engineering.

5. Conclusions

It is concluded from the impact tests that the dynamic strength of the composite specimen increases while rising the radial thickness of the primary support or the surrounding rock, and it increases rapidly in the early stage and slows down in the later stage with the increase in the proportion of radial thickness of the primary support.
Under the action of axial impact load, there are a great number of radial cracks produced mainly in the composite specimens of the combination of the primary support and the surrounding rock, resulting in tensile failure formed. The cracks are firstly generated from the primary support, and finally expanded to the surrounding rock. As for the thick surrounding rock, it may produce circumferential cracks.
The incident energy, the reflected energy, the transmitted energy and the absorbed energy increase and the proportions of various energies change during the failure process of the composite specimens of primary support and surrounding rock.
The dynamic strength of the composite specimen is directly related to the thickness of the cement mortar and sandstone, and the ratio of the two materials. The thicker the primary support and surrounding rock, the higher the proportion of the primary support and the greater the dynamic strength of the combination structure. It can be reasonably speculated that optimizing the above three factors can weaken the influence of impact load on the tunnel construction to improve its stability.

Author Contributions

Conceptualization, Z.Y. and L.Z.; methodology, Z.Z.; software, K.P.; validation, X.L.; formal analysis, L.Z.; investigation, W.L.; resources, Z.Y.; data curation, K.P.; writing—original draft preparation, Z.Y.; writing—review and editing, L.Z.; visualization, L.Z.; supervision, W.L.; project administration, Q.W.; funding acquisition, Z.Y. All authors have read and agreed to the published version of the manuscript.

Funding

The work of this study is funded by the National Natural Science Foundation of China (Grant No. 51904101), Research Foundation of Education Bureau of Hunan Province, China (Grant No. 2021JJ30268), Key project of Hunan Provincial Department of Education, China (Grant No. 20A180).

Institutional Review Board Statement

Not applicable.

Informed Consent Statement

Not applicable.

Data Availability Statement

The data in this article are raw data.

Conflicts of Interest

The authors declare no conflict of interest.

References

  1. Sun, Z.; Zhang, D.; Fang, Q. Taiwan Qimin, Yu Fucai Temporal and spatial evolution characteristics of interaction between tunnel initial support and surrounding rock. J. Rock Mech. Eng. 2017, 36 (Suppl. S2), 3943–3956. [Google Scholar]
  2. Gu, S.; Huang, R.; Su, P. Stress law of composite lining considering creep of tunnel surrounding rock. J. Transp. Eng. 2018, 18, 53–60. [Google Scholar]
  3. Sunam, Y.; Lv, G.; Fan, K. Research on the impact of tunnel blasting construction on the initial shotcrete layer. J. Undergr. Space Eng. 2019, 15 (Suppl. S1), 327–332. [Google Scholar]
  4. Nie, H.; Zhang, J.; Ren, W. Study on the reasonable distance between the initial support and the face of tunnel damaged by blasting. Subgrade Eng. 2018, 199, 166–172. [Google Scholar]
  5. Wang, Z.Z.; Jiang, Y.J.; Zhu, C.A.; Sun, T.C. Shaking table tests of tunnel linings in progressive states of damage. Tunn. Undergr. Space Technol. 2015, 50, 109–117. [Google Scholar] [CrossRef]
  6. Liang, P.; Gao, Y.; Zhou, Y.; Deng, D. The method for determining the reasonable supporting time of tunnel initial support and its engineering application. J. Eng. Sci. 2022, 24, 265–276. [Google Scholar]
  7. Qiu, W.; Li, B.; Tian, M.; Li, S.; Huang, H. Analysis of stress mode of initial tunnel support based on field measurement. Tunn. Constr. 2017, 37, 1508–1517. [Google Scholar]
  8. Zhang, D.; Chen, F.; Fang, Q. Research on mechanical characteristics and applicability of initial tunnel support structure. Eng. Mech. 2014, 31, 78–84. [Google Scholar]
  9. Sun, M.; Ma, T.; Shen, Z.; Wu, X.; Wang, M. Research on the proportion of lining sharing surrounding rock pressure in composite lining structure. Geotech. Mech. 2018, 39 (Suppl. S1), 437–445. [Google Scholar]
  10. Xin, C.L.; Wang, Z.Z.; Gao, B. Shaking table tests on seismic response and damage mode of tunnel linings in diverse tunnel-void interaction states. Tunn. Undergr. Space Technol. 2018, 77, 295–304. [Google Scholar] [CrossRef]
  11. Li, P.; Zhang, D.; Zhao, Y.; Zhou, Y.; Fang, Q.; Zhang, X. Study on mechanical properties of secondary lining of large section loess tunnel. J. Rock Mech. Eng. 2010, 29, 1690–1696. [Google Scholar]
  12. Tian, P. Study on surrounding rock pressure and secondary lining stress characteristics of high ground stress soft rock tunnel. Railw. Stand. Des. 2016, 60, 108–112. [Google Scholar]
  13. Han, C.; Zhang, T.; Xu, C.; Xia, C. Research on deformation characteristics of large section soft rock tunnel and control of initial support of multiple layers. Highway 2021, 1, 335–339. [Google Scholar]
  14. Peng, Y.; Shan, R.; Song, Y.; Huang, Z.; Tan, J.; Kang, X.; Fan, X. Study on the cumulative damage of spray concrete caused by tunnel blasting. Concrete 2020, 370, 61–66. [Google Scholar]
  15. Wang, H.; Li, S.; Zhao, Y. Research on blasting damage law of initial concrete support under cumulative effect. Eng. Blasting 2021, 27, 29–34. [Google Scholar]
  16. Tang, X.; Xia, D.; Li, D.; Wang, Y. Analysis of the influence of tunnel blasting construction on initial concrete. J. Railw. Eng. Soc. 2022, 280, 73–79. [Google Scholar]
  17. Liu, M.; Liu, Y.; Zhang, W.; Xu, K.; Li, M. Impact of blasting vibration on stability of initial support structure of small clear distance tunnel group. Sci. Technol. Eng. 2019, 19, 322–327. [Google Scholar]
  18. Zhu, Z.; Sheng, Q.; Liu, J.; Zhu, F. Study on reasonable timing of initial support of hard surrounding rock. J. Undergr. Space Eng. 2010, 6, 1240–1246. [Google Scholar]
  19. Wu, Q.; Weng, L.; Zhao, Y.-L.; Feng, F. Influence of infilling stiffness on mechanical and fracturing responses of hollow cylindrical sandstone under uniaxial compression tests. J. Cent. South Univ. 2021, 28, 2485–2498. [Google Scholar] [CrossRef]
  20. Wu, Q.-H.; Weng, L.; Zhao, Y.-L.; Zhao, F.-J.; Zhang, S.-P. Deformation and cracking characteristics of ring-shaped granite with inclusion under diametrical compression. Arab. J. Geosci. 2020, 13, 681. [Google Scholar] [CrossRef]
  21. JGJ/T 98-2010; Specification for Mix Proportion Design of Masonry Mortar. Chinese Standard: Beijing, China, 2010.
  22. Ye, Z.; Zhao, F.; Zhou, Z. Mechanical characteristics of unloading rock under coupled dynamic and static loads. Chin. J. Geotech. Eng. 2013, 35, 454–459. [Google Scholar]
  23. Liu, X.; Hu, S. Propagation characteristics of stress pulse in tapered SHPB rod with variable cross section. Explos. Shock Waves 2000, 2, 110–114. [Google Scholar]
  24. Liu, X.; Hu, S. 2d numerical analysis of dispersion effect of large diameter SHPB. J. Exp. Mech. 2000, 4, 371–376. [Google Scholar]
  25. Hou, G.; Li, X.; Liang, H.; Liang, J.; Zhang, G.; Jin, H. Specimens (thick-walled cylinder) simulating roadway excavation. J. China Coal Soc. 2018, 43, 616–625. [Google Scholar]
Figure 1. Supporting types during the tunnel construction.
Sustainability 15 04410 g001
Figure 2. Sample of the combination of surrounding rock and the primary support.
Sustainability 15 04410 g002
Figure 3. Structure of the variable diameter impact test bed.
Sustainability 15 04410 g003
Figure 4. The stress–time history curves of the first group of testing specimens.
Sustainability 15 04410 g004
Figure 5. The stress–time history curves of the second group of testing specimens.
Sustainability 15 04410 g005
Figure 6. The stress–time history curves of the third group of testing specimens.
Sustainability 15 04410 g006
Figure 7. Stress–strain curves of the first group of specimens.
Sustainability 15 04410 g007
Figure 8. Stress–strain curves of the second group of specimens.
Sustainability 15 04410 g008
Figure 9. Stress–strain curves of the third group of specimens.
Sustainability 15 04410 g009
Figure 10. The relationship between cement mortar thickness and strength.
Sustainability 15 04410 g010
Figure 11. The relationship between sandstone thickness and strength.
Sustainability 15 04410 g011
Figure 12. The relationship between the thickness ratio and the strength of the cement mortar.
Sustainability 15 04410 g012
Figure 13. The relationship between different energies and time.
Sustainability 15 04410 g013
Figure 14. The relationship between different energy ratios and time.
Sustainability 15 04410 g014
Figure 15. The relation between different energy ratios and cement mortar thickness.
Sustainability 15 04410 g015
Figure 16. The relation between different energy ratios and sandstone thickness.
Sustainability 15 04410 g016
Figure 17. The relation between different energy ratios and specimens’ ratios cement mortar thickness.
Sustainability 15 04410 g017
Figure 18. The failure forms of the first group.
Sustainability 15 04410 g018
Figure 19. The failure forms of the second group.
Sustainability 15 04410 g019
Figure 20. The failure forms of the third group.
Sustainability 15 04410 g020
Table 1. Overall dimensions of the parameter group formed test pieces.
ParameterGroup
12345
External radius R/mm160170180190200
Internal radius r0/mm6060606060
Height h/mm5050505050
Table 2. Basic mechanical parameters of cement mortar and sandstone.
Parameter NamePoisson’s RatioUniaxial Compressive Strength/MPaTensile Strength/MPaElastic Modulus/GPa
Cement mortar0.2243.383.728.17
Sandstone0.230.262.675.43
Table 3. Specimens’ size of cement mortar thickness change group.
No.Hollow Ring Diameter/mmThickness of Cement Mortar/mmThickness of Sandstone/mmDiameter of Specimens/mm
1-1601040160
1-2601540170
1-3602040180
1-4602540190
1-5603040200
Table 4. Specimens’ size of sandstone thickness change group.
No.Hollow Ring Diameter/mmThickness of Cement Mortar/mmThickness of Sandstone/mmDiameter of Specimens/mm
2-1602030160
2-2602035170
2-3602040180
2-4602045190
2-5602050200
Table 5. Size of test pieces in the change group of total material proportion of cement mortar.
No.Hollow Ring Diameter/mmThickness of Cement Mortar/mmThickness of Sandstone/mmDiameter of Specimens/mm
3-1601050180
3-2601545180
3-3602040180
3-4602535180
3-5603030180
Disclaimer/Publisher’s Note: The statements, opinions and data contained in all publications are solely those of the individual author(s) and contributor(s) and not of MDPI and/or the editor(s). MDPI and/or the editor(s) disclaim responsibility for any injury to people or property resulting from any ideas, methods, instructions or products referred to in the content.

