Article

A Multi-Source Intelligent Fusion Assessment Method for Dynamic Construction Risk of Subway Deep Foundation Pit: A Case Study

1
School of Civil and Architectural Engineering, East China University of Technology, Nanchang 330013, China
2
College of Civil Engineering and Architecture, Guangxi University, Nanning 530004, China
3
China Railway Beijing Engineering Group Co., Ltd., Beijing 100097, China
4
Jinan Rail Transit Group Co., Ltd., Jinan 250014, China
*
Author to whom correspondence should be addressed.
Sustainability 2023, 15(13), 10162; https://doi.org/10.3390/su151310162
Submission received: 27 April 2023 / Revised: 7 June 2023 / Accepted: 14 June 2023 / Published: 27 June 2023
(This article belongs to the Special Issue The Development of Underground Projects in Urban Areas)

Abstract

:
The construction of a subway deep foundation pit is complex and risky, thus multiple safety risk factors bring great challenges to evaluating the safety status accurately. Advanced monitoring technology equipment could obtain a large number of monitoring data, and how integrating complex and diversified monitoring data to assess the safety risk of foundation pits has become a new problem. Therefore, an intelligent multi-source fusion assessment model is proposed. This model is mainly used for solving risk probability distribution, deep learning, and intelligent prediction of monitoring indicators, and then evaluating safety status by fusing various parameters of multiple indicators. Thus, based on the data of deep learning and the measured multivariate data, the dynamic risk during foundation pit construction can be obtained. Moreover, a typical case study was performed through monitoring and carrying out the risk assessment which is located at the Martyrs’ Lingyuan Station of Jinnan Metro Line R2, China. In this case, the PSO-SVM and LSTM models are used to predict the deformation trend, and the monitoring data is reliable with high precision. After multi-index fusion model calculation, the results show that the foundation pit structure is in a safe state, and the evaluation situation is basically consistent with the site. Consequently, the prediction of the new multi-source intelligent fusion risk assessment method is convincing.

1. Introduction

The construction of subway deep foundation pit is characterized by complex operation processes, strict geological conditions, many uncertain factors, and great construction difficulty [1]. These typical characteristics are easy to cause large deformation and collapse accidents, and even serious economic losses and casualties [2,3].
Therefore, it is significant to conduct the prediction of deformation and collapse, perform the safety risk assessment, and take effective risk management measures to reduce the incidence [4] of foundation pit collapse accidents.
Many scholars have carried out a lot of research in the field of deep foundation pit projects [5]. Ye et al. [6] simulated the whole process of foundation excavation with PALXIS 3D software and thus optimized the foundation structure to effectively suppress deformation. Sun and Xiao [7] studied the deformation characteristics of the foundation pit through field observation and centrifugal model tests. The above is the classical method to study foundation excavation safety from the construction mechanics’ perspective. With the development of artificial intelligence, machine learning has been developed rapidly, such as the backpropagation neural network [8], regression analysis [9], and the Random forests [10]. However, these methods are static modeling and have poor applicability to highly nonlinear data. The pit monitoring data has nonlinear characteristics and good adaptability, so an algorithm model that considers time effects is needed. The long short-term memory neural network (LSTM) has unique advantages for nonlinear data and time series. Zhang and Tian [11] used the LSTM model to predict the horizontal deformation displacement of an underground wall, and the error was controlled within a certain range, which confirmed the stability of the method. Such methods not only require a large amount of data for training and validation but also are prone to overfitting in small sample prediction. Song et al. [12] predicted the deformation of surrounding rock by particle swarm optimization support vector machine (PSO-SVM) and verified that the model has high prediction accuracy when the sample data is small.
However, a single monitoring index prediction makes it difficult to objectively judge the risk status of the whole pit and verify the accuracy of the classical assessment method. Scholars have proposed a multi-information fusion approach. Wang et al. [13] proposed a multi-source information fusion model based on a T-S neural network to analyze the type of pit prediction alerts. Zhang and Li [14] extracted structural features with the projection tracking method, while dealing with the complexity and uncertainty of foundation pit construction by the SPA methods. Guo and Zhang [15] proposed a hybrid method of BIM and the D-S evidence theory to achieve risk assessment as well as visualization of the tunnel. Zhou et al. [16] proposes a novel risk analysis method combining complex networks and association rule mining, and the proposed method reduces the likelihood of risk occurrence in anomaly monitoring portfolios. Pan et al. [17] proposes an information fusion model with multiple classifiers, which employs support vector machines and Dempster-Shafer evidence theory to assess the health risk of subway structures under uncertainty. It is demonstrated that the fusion model has good robustness. Xia et al. [18] uses LSTM combined with monitoring data and risk evaluation techniques to evaluate the overall safety status of the foundation pit.
Among the above information fusion methods, the D-S evidence theory is a common approach in the field of information fusion, which is especially advantageous in distinguishing uncertain or ambiguous decisions. However, the traditional D-S evidence theory ignores the problem of conflicting evidence in the fusion process [19] and is not suitable for dealing with highly conflicting information.
This study intends to take the deep foundation pit of the Martyrs’ Cemetery Station of Jinan Metro Line R2 as a case study. In response to the deficiencies in the research of foundation pit deformation prediction methods, the PSO-SVM model is introduced as a regression algorithm to predict the horizontal deformation of the foundation pit enclosure structure on a rolling basis. The PSO-SVM prediction results are also compared with the LSTM results to better verify the accuracy of the PSO-SVM model. Then, starting from the analysis of the safety risk factors of the deep foundation pit enclosure structure of the subway, a multi-indicator intelligent fusion dynamic assessment model of deep foundation pit construction safety is constructed. The model is based on the predicted trend of foundation pit deformation obtained from the PSO-SVM model with coupled analysis of risk factors, and then improved D-S theory fusion. Finally, the dynamic evaluation results of the safety risk of the foundation pit case are obtained. The results can provide a feasible theoretical and methodological basis for foundation pit construction safety and engineering disaster prevention and mitigation.

2. Multi-Indicator Fusion Dynamic Assessment Method

The multi-indicator fusion dynamic assessment method introduces the PSO-SVM and the LSTM models to predict the horizontal displacement of the pile. According to the error size comparison, a more suitable algorithm model is selected. According to the prediction results, the CM is used to obtain the risk probability distribution, and the D-S evidence theory is fused to get the risk level finally. If it is in a safe state, a rolling forecast is made for the next change period to update the construction state of the pit. Figure 1 shows the flow chart of the assessment method.

2.1. Prediction of the Horizontal Displacement of the Pile

Artificial neural networks [20] are the most widely used prediction methods, but they suffer from phenomena such as overfitting [21] when there is less training data. Therefore, PSO-SVM and LSTM models are used to predict the horizontal displacement of piles in this paper.

2.1.1. Theory of the LSTM Model

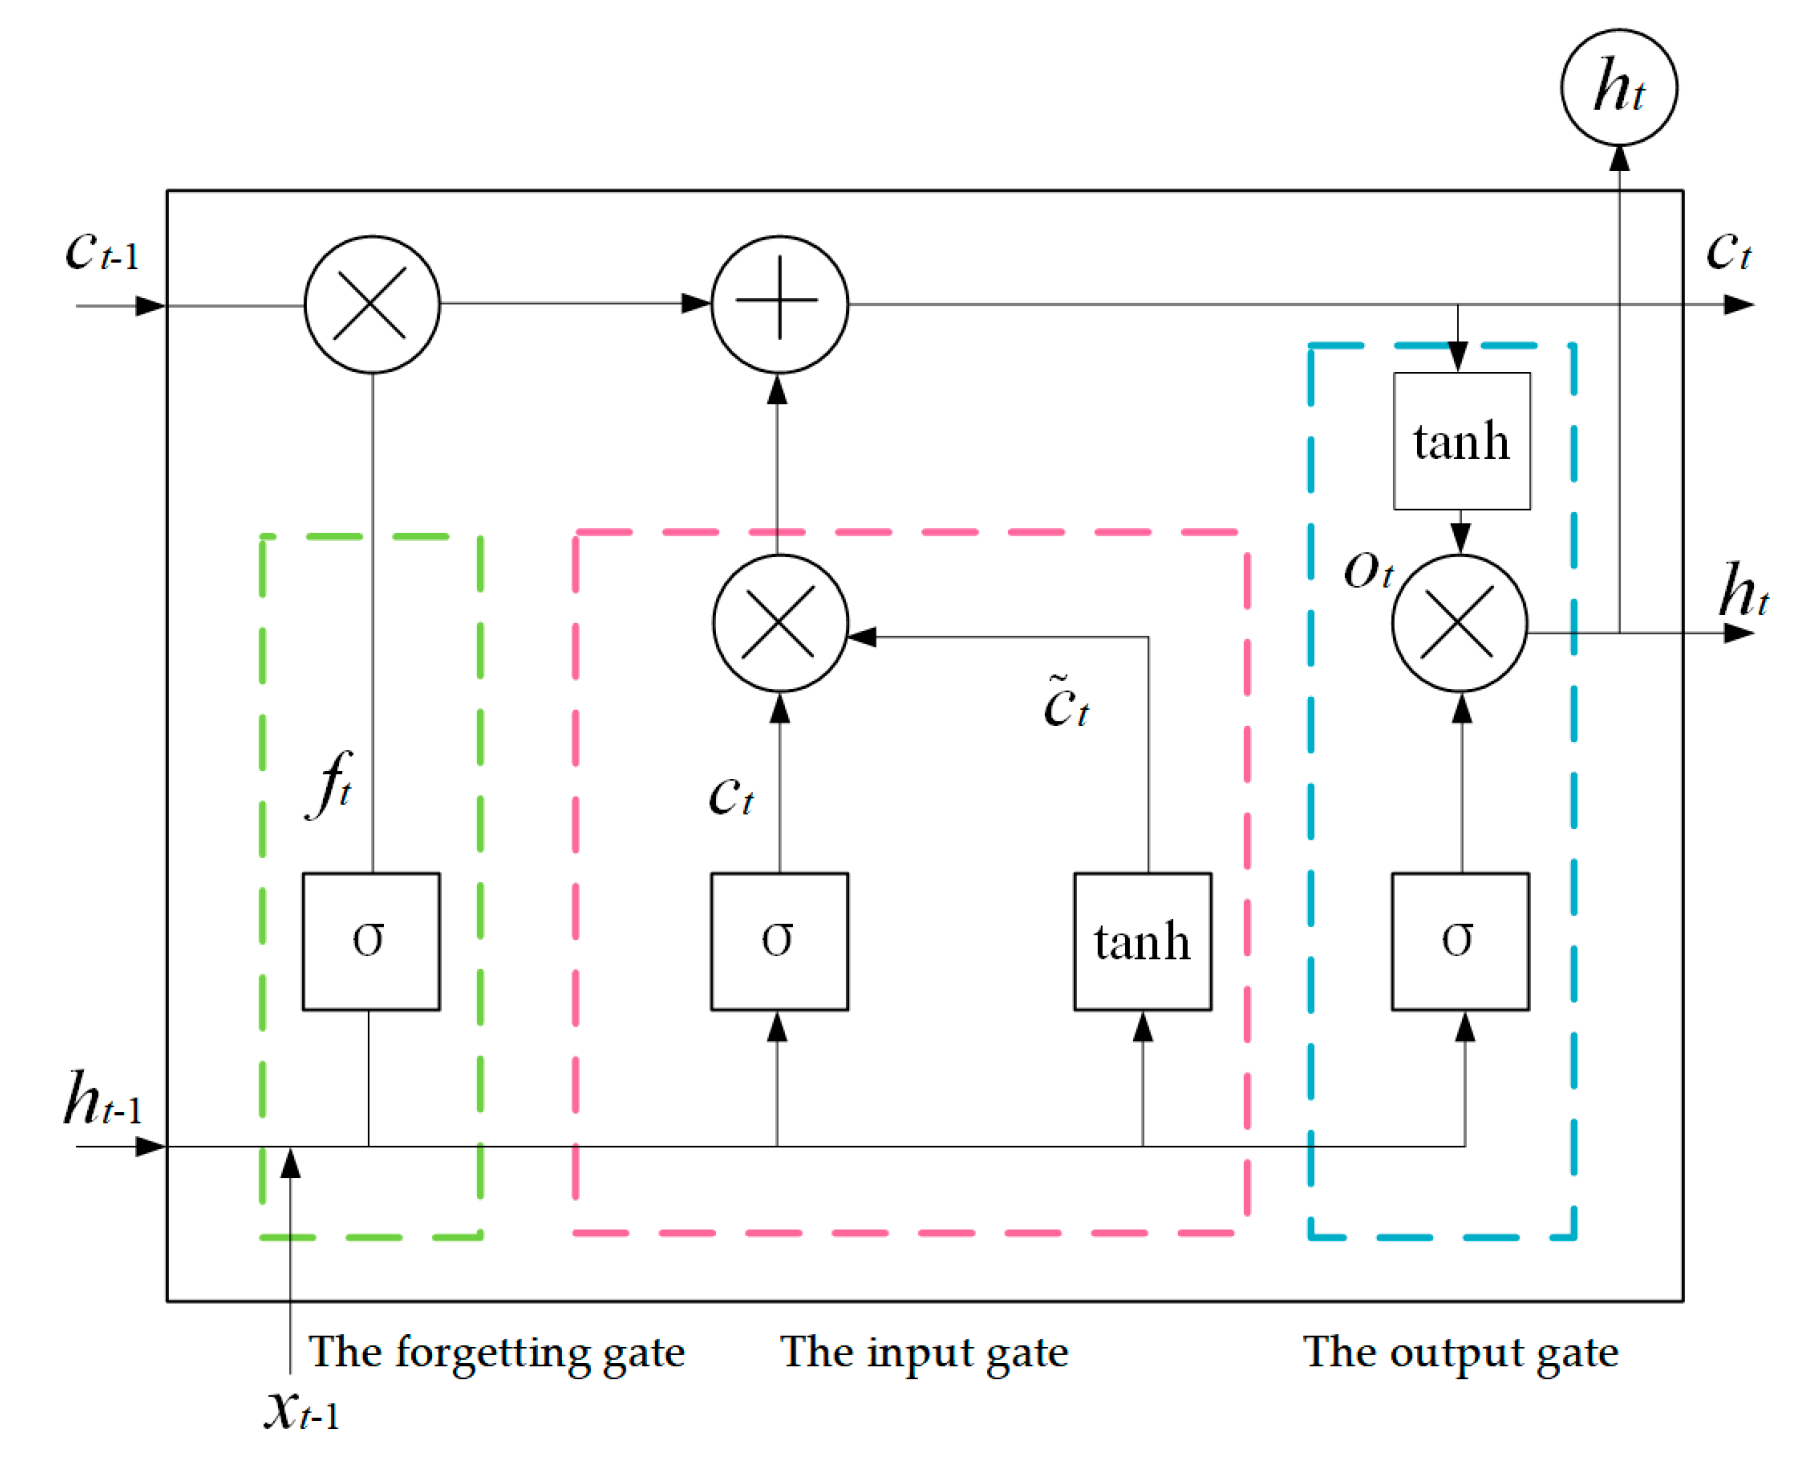
An LSTM model is a special kind of recurrent neural network designed to solve the long-term dependence problem of general recurrent neural networks. This model can not only handle time series data but also implement error correction by backpropagation and gradient descent algorithms. The core of the LSTM model is to design cell states and various gates. The gates are used to add or remove information to the cell state, continuously transmitting the relevant information through a sequence chain for prediction [22]. Its transmission is divided into two processes: (1) forward propagation of the input signal and (2) backward propagation of the error signal. The detailed process is as follows. The basic unit structure of LSTM is shown in Figure 2. The basic unit includes the forgetting gate, the input gate, and the output gate. indicates the increased information, indicates the reduced information.
The input gate i t filters from input x t [23] while acquiring new knowledge and creating alternative values for updating the state c ˜ t .
i t = σ ( W i [ h t 1 , x t ] + b i )
c ˜ t = tanh ( W c [ h t 1 , x t ] + b c )
The forgetting gate f t is responsible for retaining the unit’s state at the previous moment and discarding non-essential information.
f t = σ ( W f [ h t 1 , x t ] + b f )
The old cell state c t 1 changes the new cell state c t by removing unnecessary information.
c t = f t c t 1 + i t c ˜ t
The output gate o t filters the update status c t and calculates the final output based on the latest status c t .
o t = σ ( W o [ h t 1 , x t ] + b o )
h t = o t tanh ( c t )
where, W c , W f , W o represent the weights; b i , b c , b f , b o represent the corresponding deviation vector; σ and tanh are the S-shaped function and Hyperbolic tangent function.
This study is based on Python language with PyTorch framework to build LSTM containing three layers of network: Layer 1 is the input layer, containing 11 input units and 32 output units; Layer 2 has 32 input units and three output units; Layer 3 contains three input units and one output unit. Among them, the 11 input units of the first layer represent the monitoring data using the past 11; that is, the time step is 11. The other units are cell units in the hidden layer.

2.1.2. Theory of the PSO-SVM Model

The support vector machine (SVM) is a machine learning method based on Vapnik-Chervonenkis theory and the principle of structural risk minimization. This method implements the transformation from an optimization problem to a quadratic programming problem. The estimation function in the prediction process can be expressed as:
y ( x ) = n = 1 N w n k ( x , x n ) + w 0
where w n is the weight of the model, k ( x , x n ) is a kernel function, and w 0 is the initial weight.
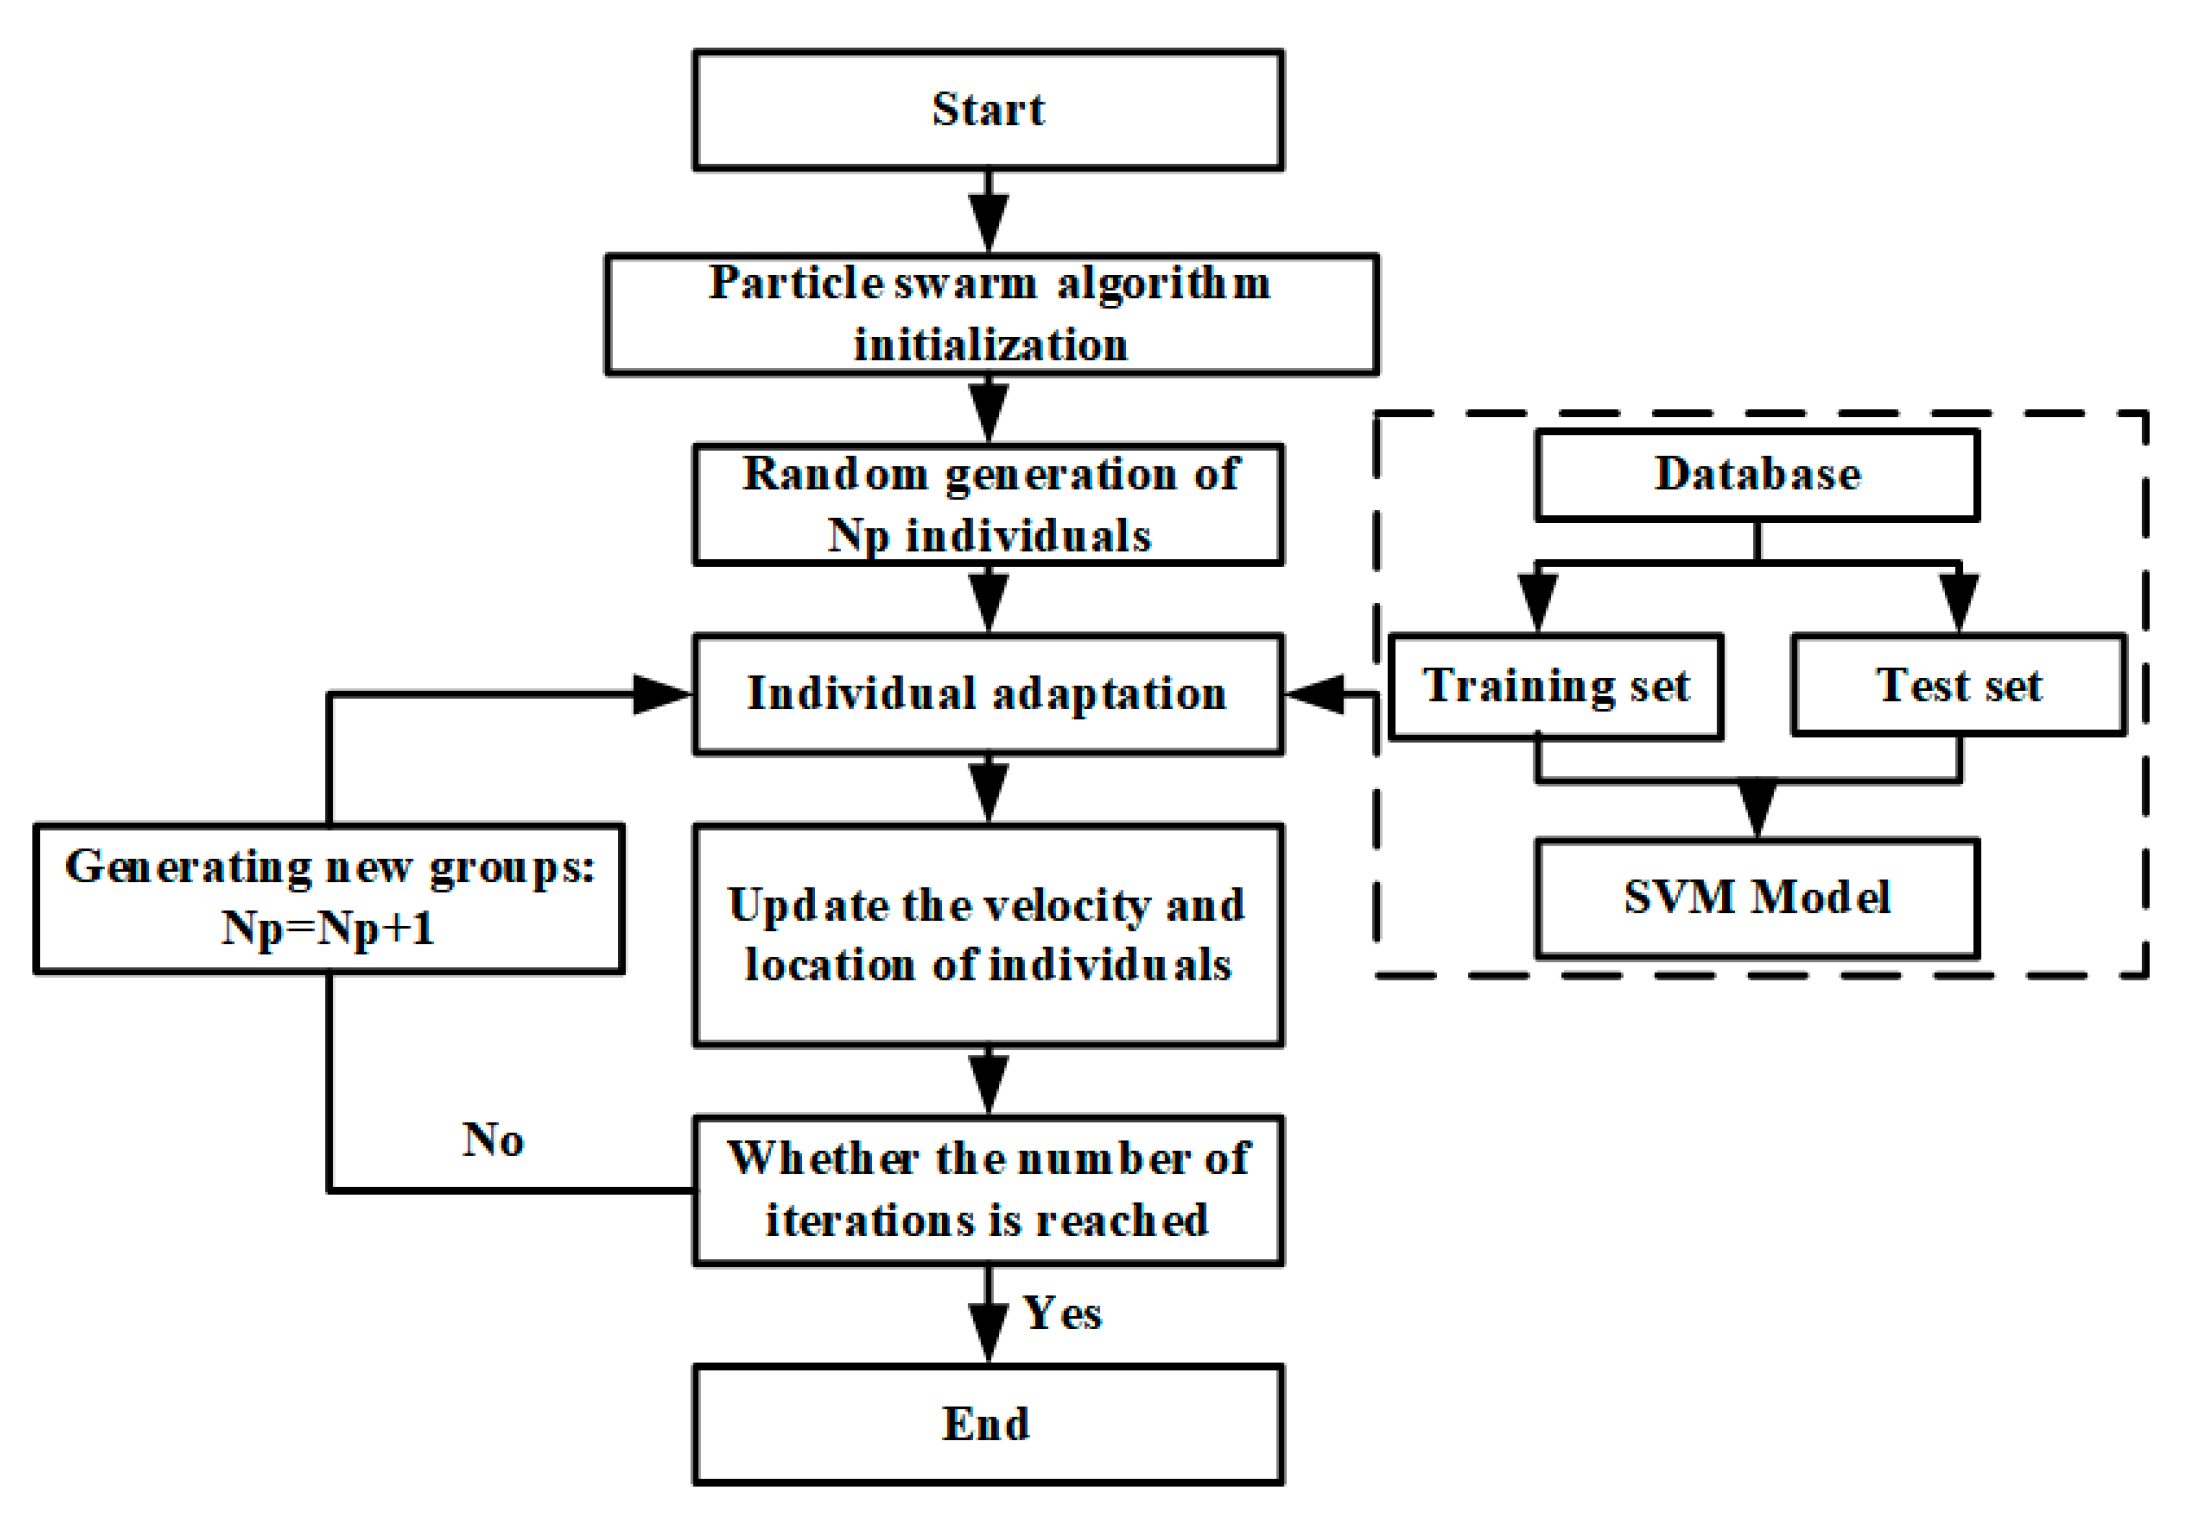
An SVM model has two critical parameters, c, and g. The c is the penalty coefficient or penalty factor, which shows the tolerance of the model to errors. The g indirectly affects the data. Compared with the traditional method, the PSO algorithm has better global search ability which cannot easily fall into local optimum. Therefore, the PSO algorithm is used to optimize the SVM model to determine the optimal hyperparameters c and g. As shown in Figure 3, the computational procedure of the PSO-SVM model is as follows.
Step (1) Train SVM models.
Step (2) Initialize the population and randomly generate Np individuals [24].
Step (3) Calculate each SVM model value’s fitness value with the PSO algorithm’s fitness function.
Step (4) Update the speed and position of the individuals.
Step (5) Reach the set number and terminate the calculation.

2.1.3. Rolling Prediction Algorithm

The rolling prediction method is used to predict the foundation pit displacement in this paper.
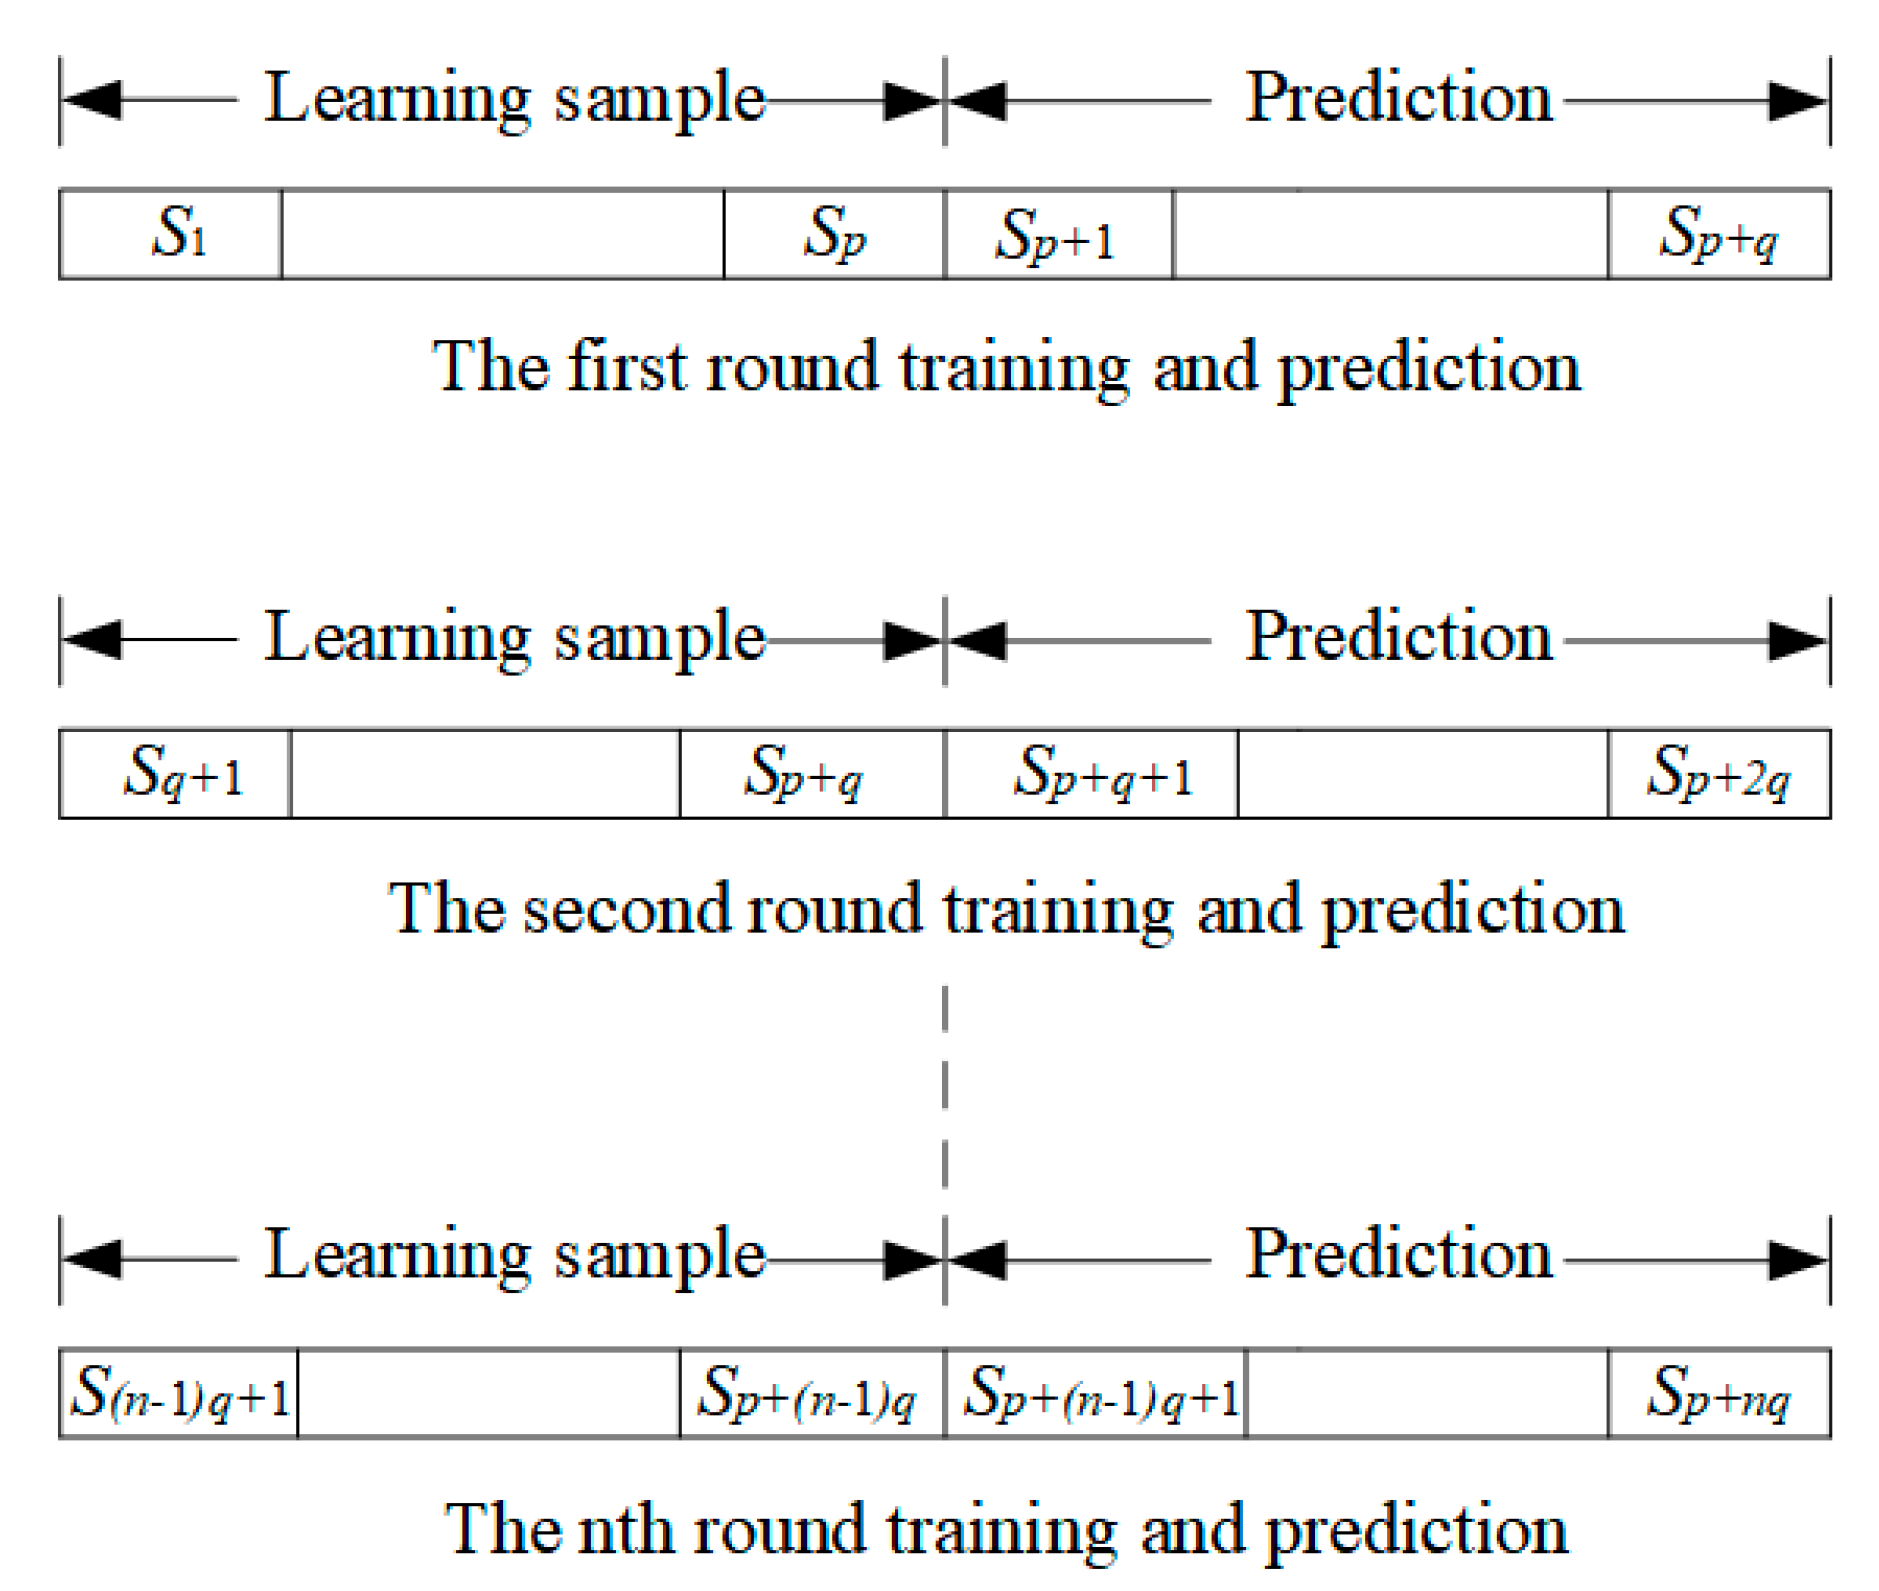
Suppose S is the data set, the number of training samples p and the number of test samples q . The detailed analysis is as follows. The schematic diagram is shown in Figure 4.
(1)
For the first round of prediction, the time series S = { S 1 , , S p } is used as the training sample to predict the surrounding rock displacement S = { S p + 1 , , S p + q } for the next q days.
(2)
For the second round of prediction, the time series S = { S q + 1 , , S p + q } is used as the training sample to predict the surrounding rock displacement S = { S p + q + 1 , , S p + 2 q } for the next q days.
(3)
For the second round of prediction, the time series S = { S ( n 1 ) q + 1 , , S p + ( n 1 ) q } is used as the training sample to predict the surrounding rock displacement S = { S p + ( n 1 ) q + 1 , , S p + n q } for the next q days.

2.2. Basic Probability Distribution of the CM

The normal CM is a new uncertainty cognitive model proposed by academician Li et al. [25]. The model not only has a weakly constrained generalized normal cloud distribution but also can avoid the defects of fuzzy sets. The normal cloud model can determine ( E x , E n , E n ) by numerical characteristics. Ex is the expectation of cloud droplets and is a typical sample of a qualitative concept. En is the entropy of Ex, which represents the uncertainty measurement of a qualitative concept. He is the hyper-entropy.
Supposing there is a set X if A is a qualitative concept related to X , (1) x X , (2) x is a random instance of concept A , (3) x satisfies x ~ N ( E x , E n 2 ) E n ~ N ( E n , H e 2 ) , x is the grade of a certain degree of belonging to concept A satisfies the formula:
μ ( x ) = e ( x E x ) 2 2 ( E n ) 2
Deformation risk factors of the foundation pit A i enclosure structure are analyzed in the decision-making process. Each risk factor should be further classified into different risk states A i j ( i = 1 , 2 , , M ;   j = 1 , 2 , , N ) to explore helpful information. Each risk state can correspond to a specific double limit interval, written as [ b i j ( L ) , b i j ( R ) ] . The conversion from the double limit interval [ b i j ( L ) , b i j ( R ) ] to the standard cloud model ( E x i j , E n i j , E n i j ) can be achieved by Equation (9).
The values of E x , E n and H e are shown below.
E x i j = b i j ( L ) + b i j ( R ) 2 E n i j = b i j ( R ) b i j ( L ) 6 , ( i = 1 , 2 , , M ; j = 1 , 2 , , N ) H e i j = h
The range of the constant “h” is taken as 0.01 [26].
In the framework of CM, the correlation measures the affiliation between the observations of the factor B i and the CM for a particular risk state B i j . Equation (10) yields the basic probability distribution (BPA) of the influencing factors under various risk situations.
m i ( B j ) = exp ( ( x i E x i j ) 2 2 ( E n i j ) 2 ) m i ( Φ ) = 1 j = 1 N m i ( A j ) , ( i = 1 , 2 , , M ; j = 1 , 2 , , N )
where m i ( B j ) is the belief measure; E n represents a random number that satisfies E n ~ N ( E n , H e 2 ) , and m i ( Φ ) represent the BPAs value in uncertain situations; that is, the focus element cannot be determined under the indicator B i .

2.3. Improved D-S Evidence Theory Information Fusion

In this paper, the D-S evidence theory is used to combine the information of each monitoring index to obtain the risk level of the enclosure structure. Dempster’s combinational rule for multiple evidence is calculated with Equation (11).
m ( B ) = 1 1 k B i B j B k = B m 1 ( B i ) m 2 ( B j ) m l ( B k ) , B Θ , B Ø 0 , B = Ø K = B i B j B k = Ø m 1 ( B i ) m 2 ( B j ) m l ( B k ) < 1
where the conflict factor K is defined as the normalization factor, I is the number of evidence in the combination process, and i, j, k denotes the ith, the jth, and the kth, respectively.
When the value of K is close to 1, a considerable conflict will arise, and the evidence aggregation rule of D-S will be invalid. For high-conflict evidence processing, the weighted average rule and the D-S rule are combined to use a threshold ζ to indicate high-conflict evidence. When K is greater than ζ, there is a high conflict of evidence, and the weighted average rule will replace the D-S evidence theory, as shown in Equation (12). Based on the reference [27], the threshold ζ was set at 0.91 in this research.
d = j = 1 j = l K = 1 K = L ( m i ( B k ) m j ( B k ) ) 2 w i = d i i = 1 i = l d i m i * ( B k ) = w i m i ( B k ) m i ( Θ ) = 1 k = 1 L m i * ( B k )
where l and L are the numbers of evidence, and the number of hypotheses, respectively, and k is the kth hypothesis.

3. A Case Study

3.1. Project Profile

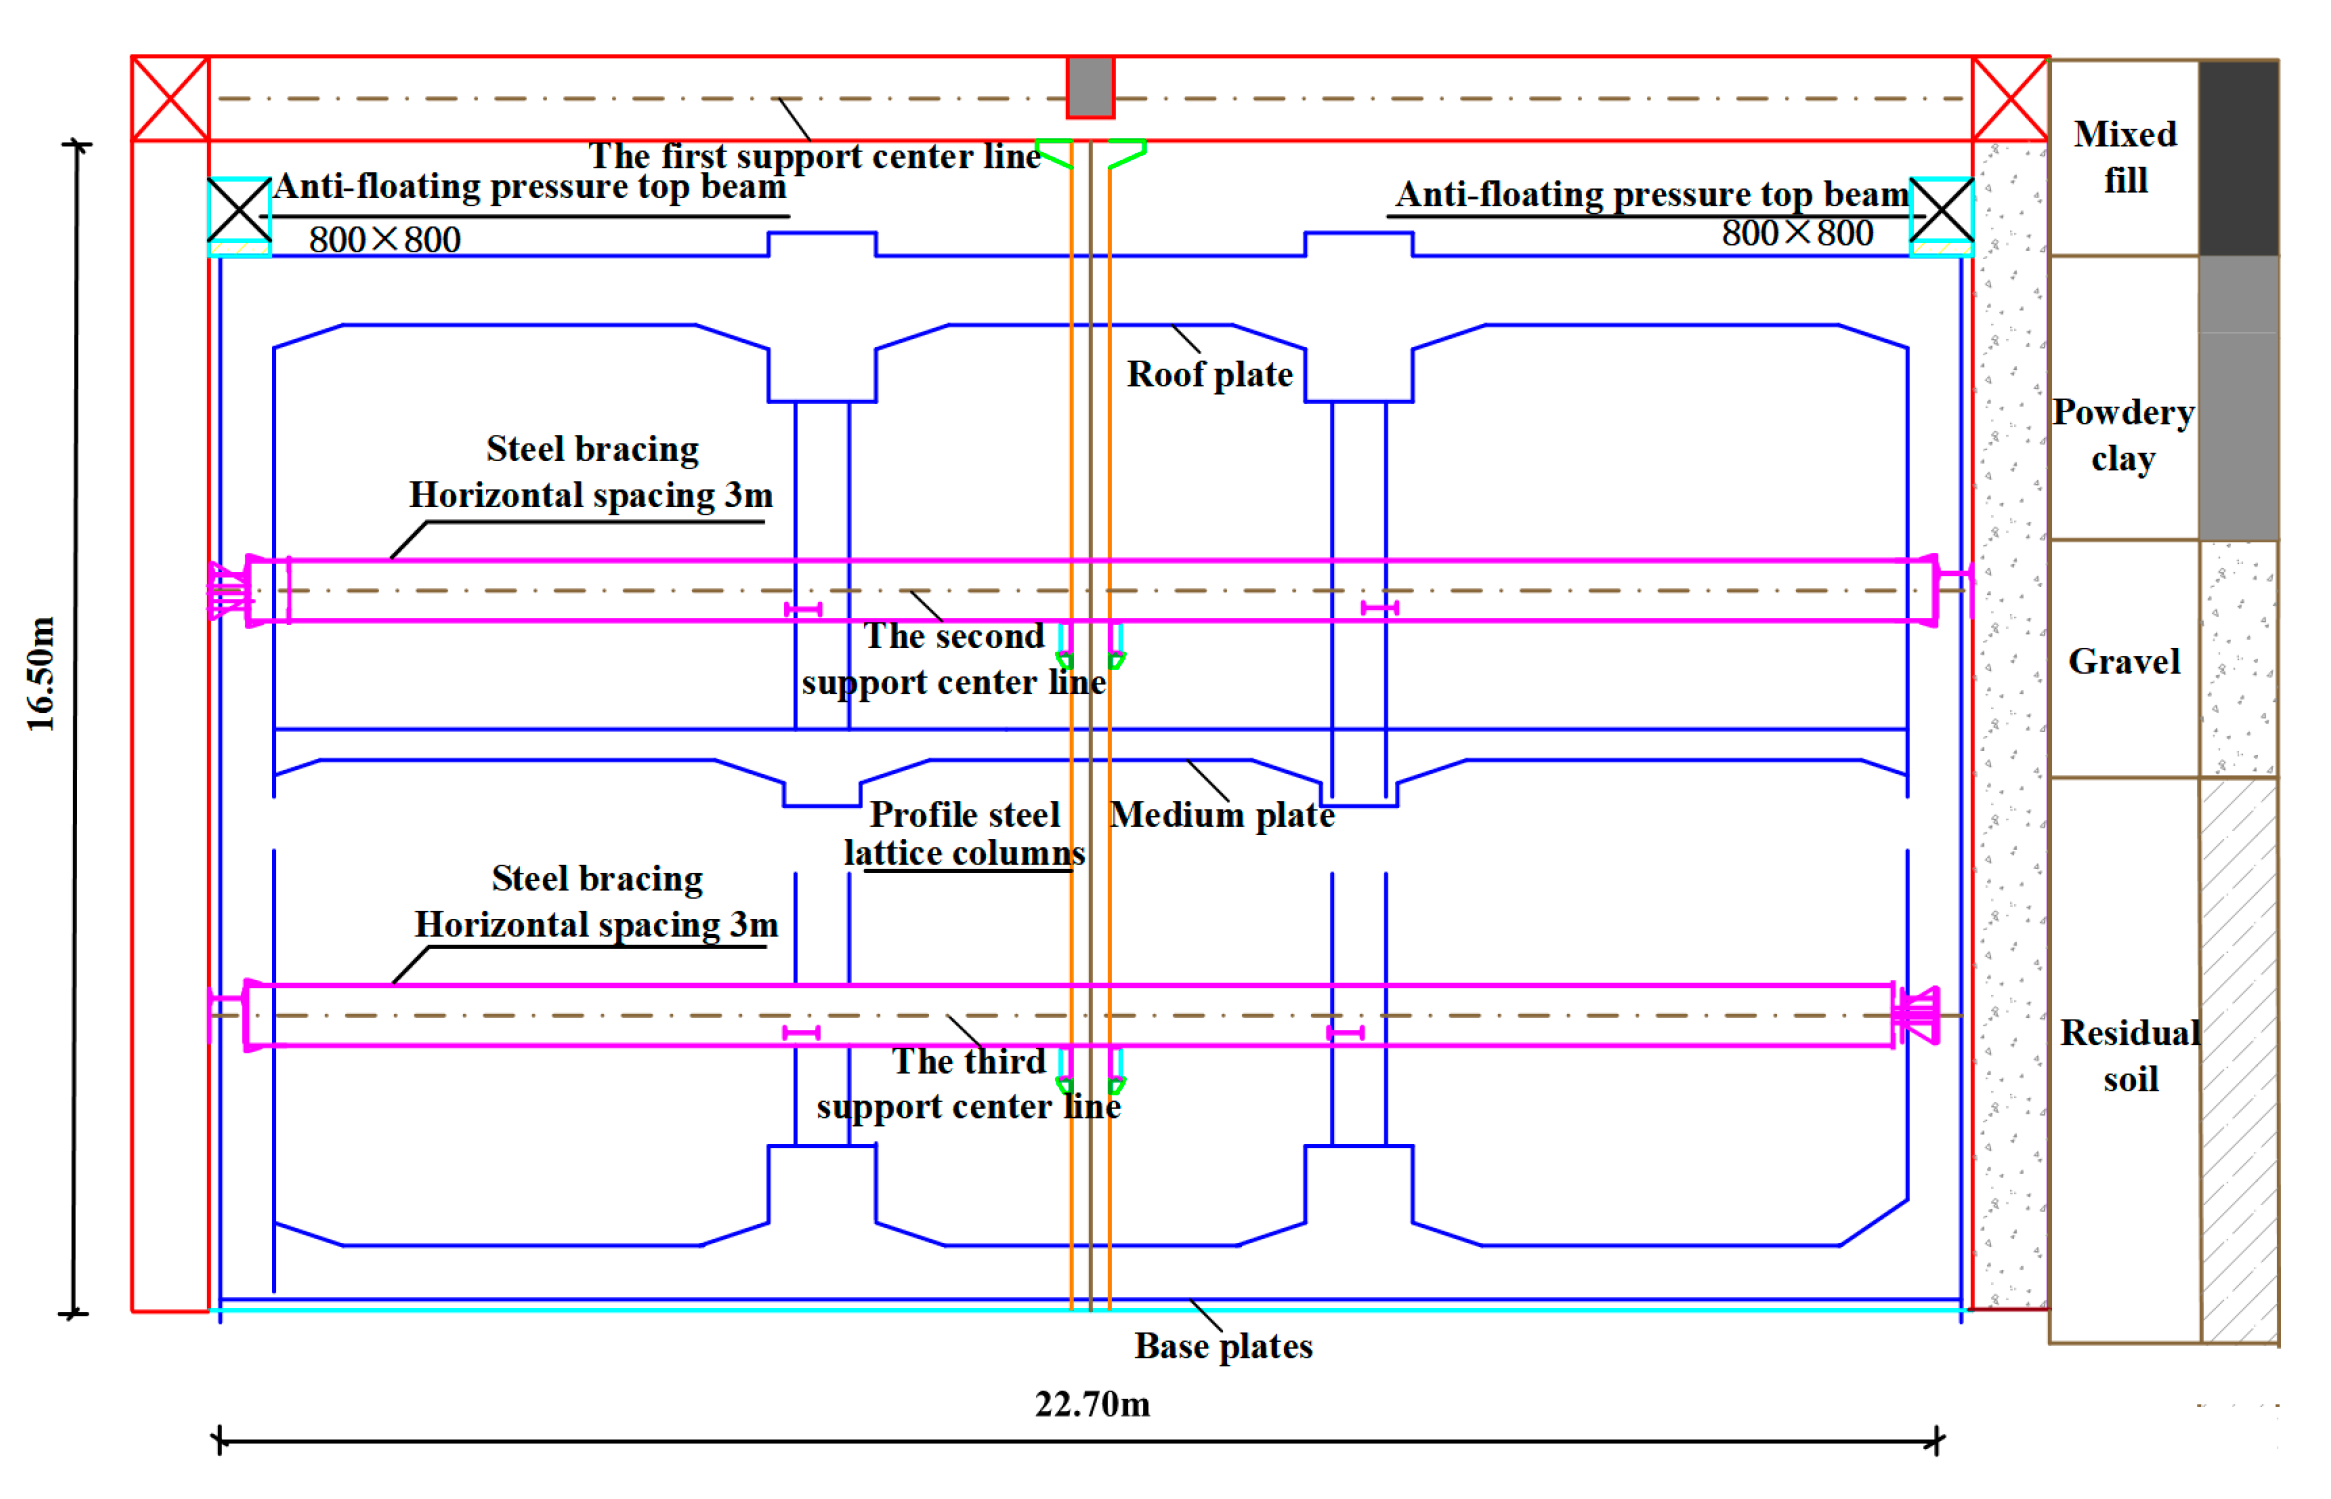
The Martyrs’ Lingyuan Station of Jinnan Metro Line R2 is a two-story underground island station with a reinforced concrete box-type structure. The station platform width is 14 m, and the effective platform length is 120 m. The standard section of the station has a net width of 21.3 m, while the expanded section has a net width of about 24.0~30.6 m. The total outsourced length of the main structure of the station is 331.55 m. The roof cover of the station is about 4.0~6.0 m. The burial depths of the footings of the different sections of the station are as follows: standard section, 18.92~19.64 m; small mileage shield shaft section, 20.6 m; large mileage shield shaft section, 19.94 m; interchange nodes, 25.47 m. The station’s geomorphological unit is a mountain plain with relatively flat terrain. The steel supports are arranged continuously along the longitudinal direction of the pit using double-split I-beams. The geology within the construction area of the station is mainly miscellaneous fill, loess, pulverized clay, gravel, and residual soil. The structure and geological section of the station are shown in Figure 5.

3.2. Prediction of the Horizontal Displacement of the Pile

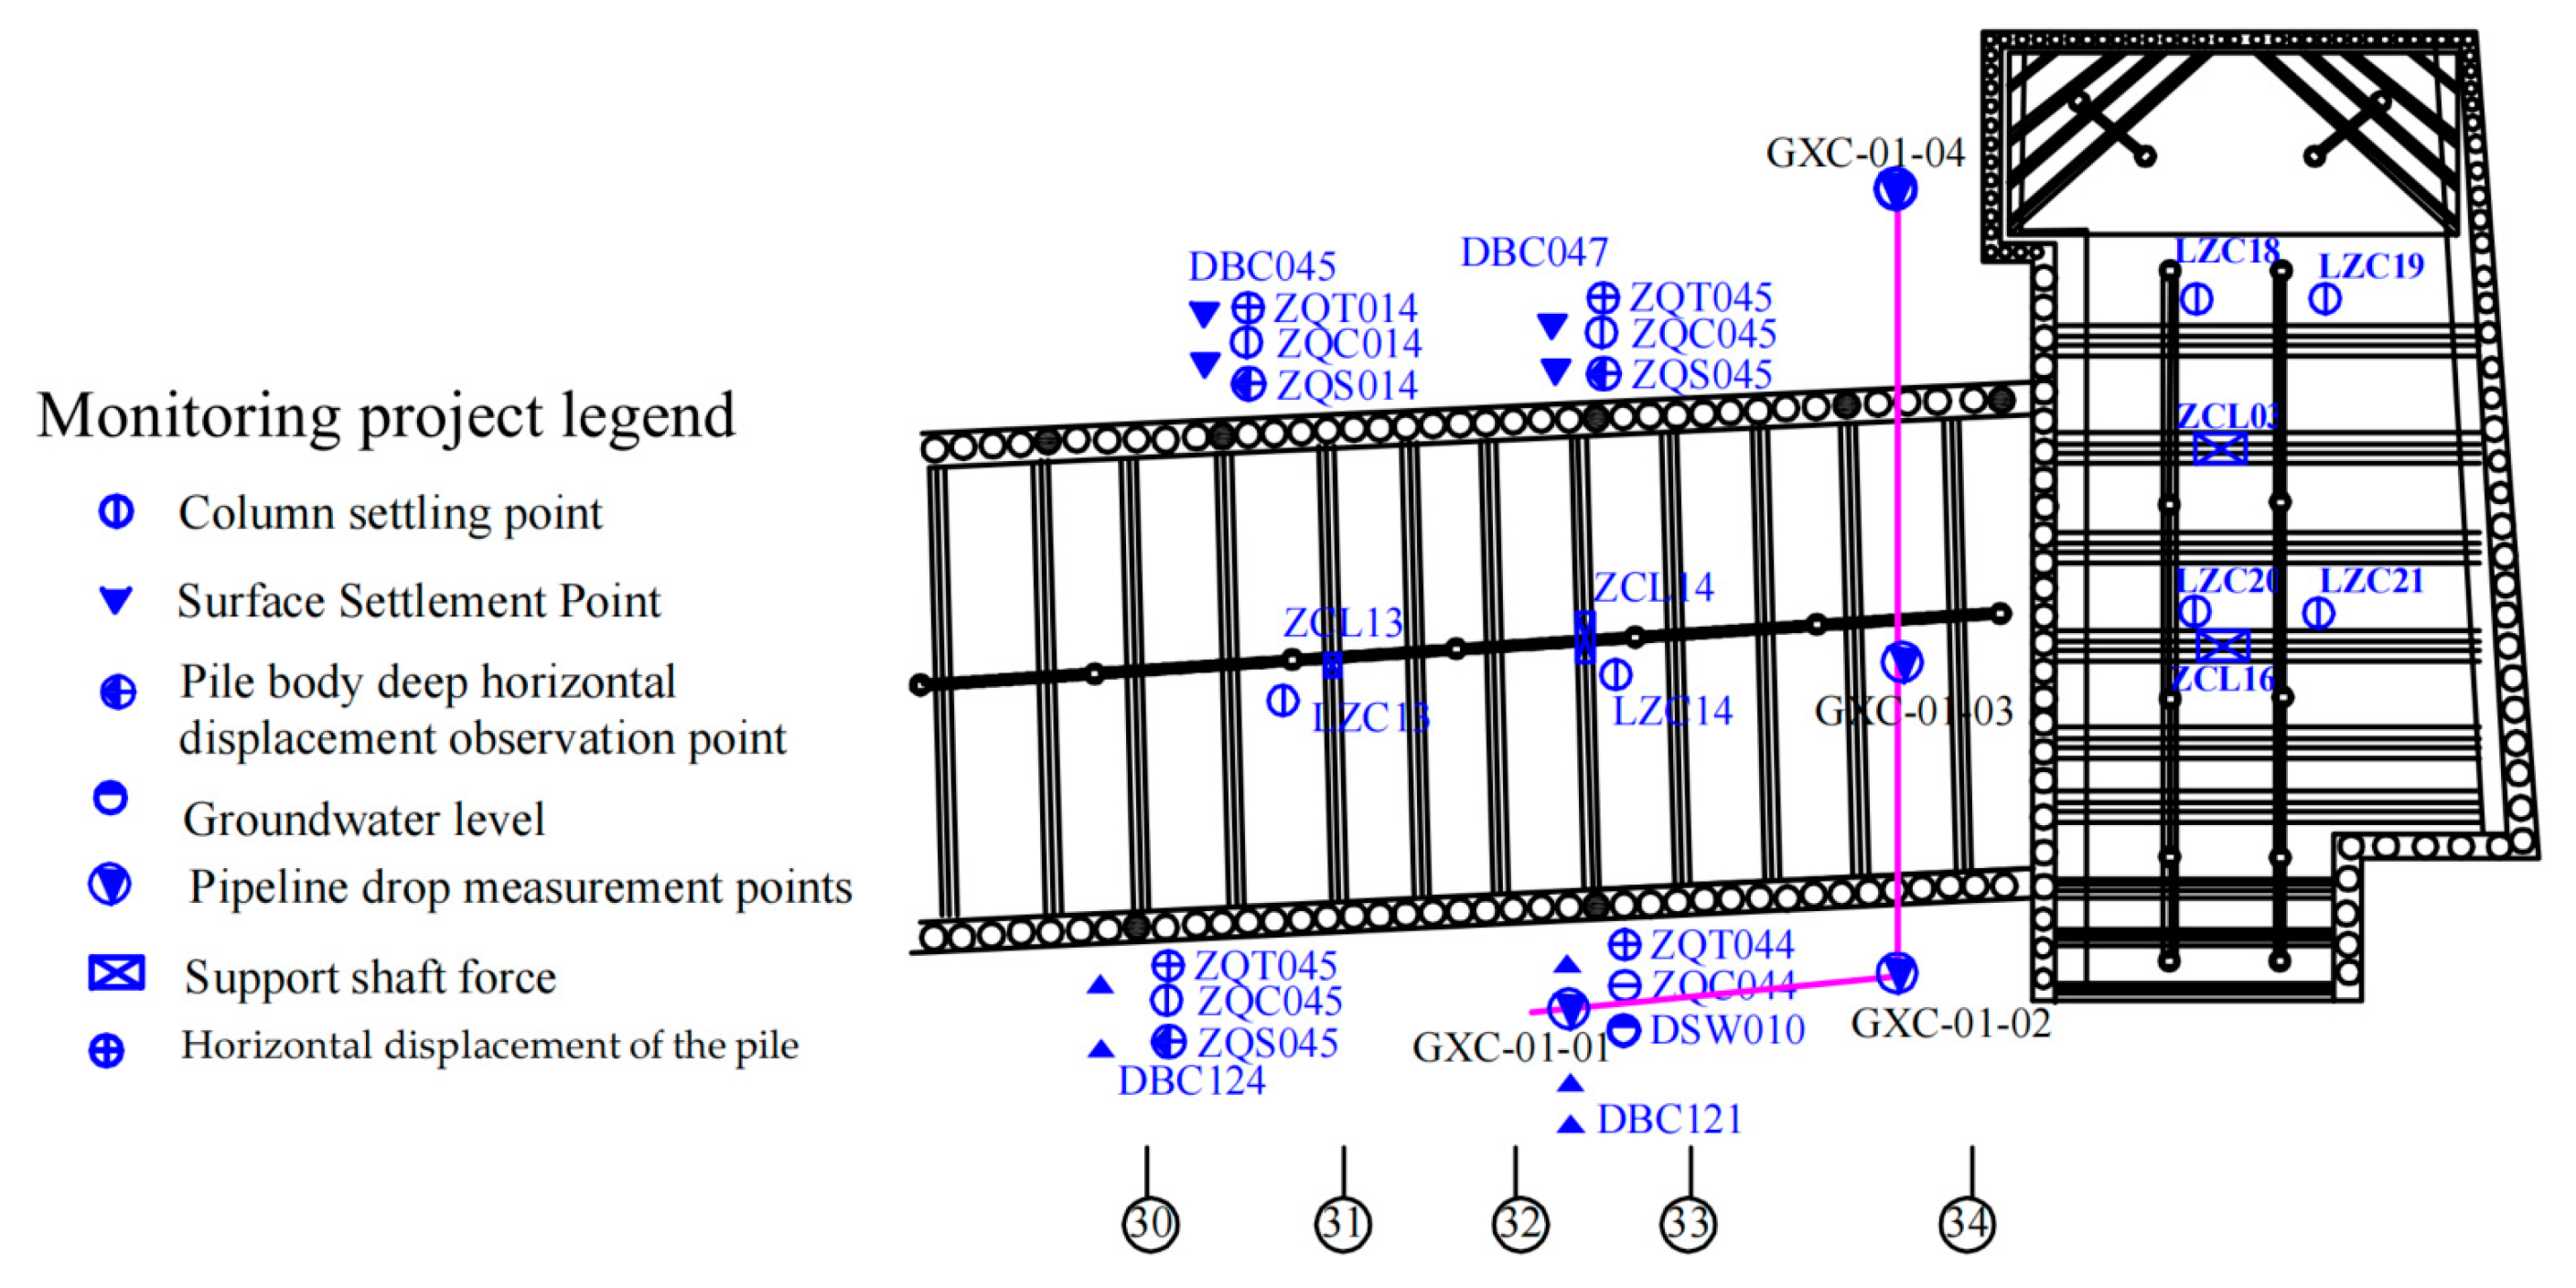
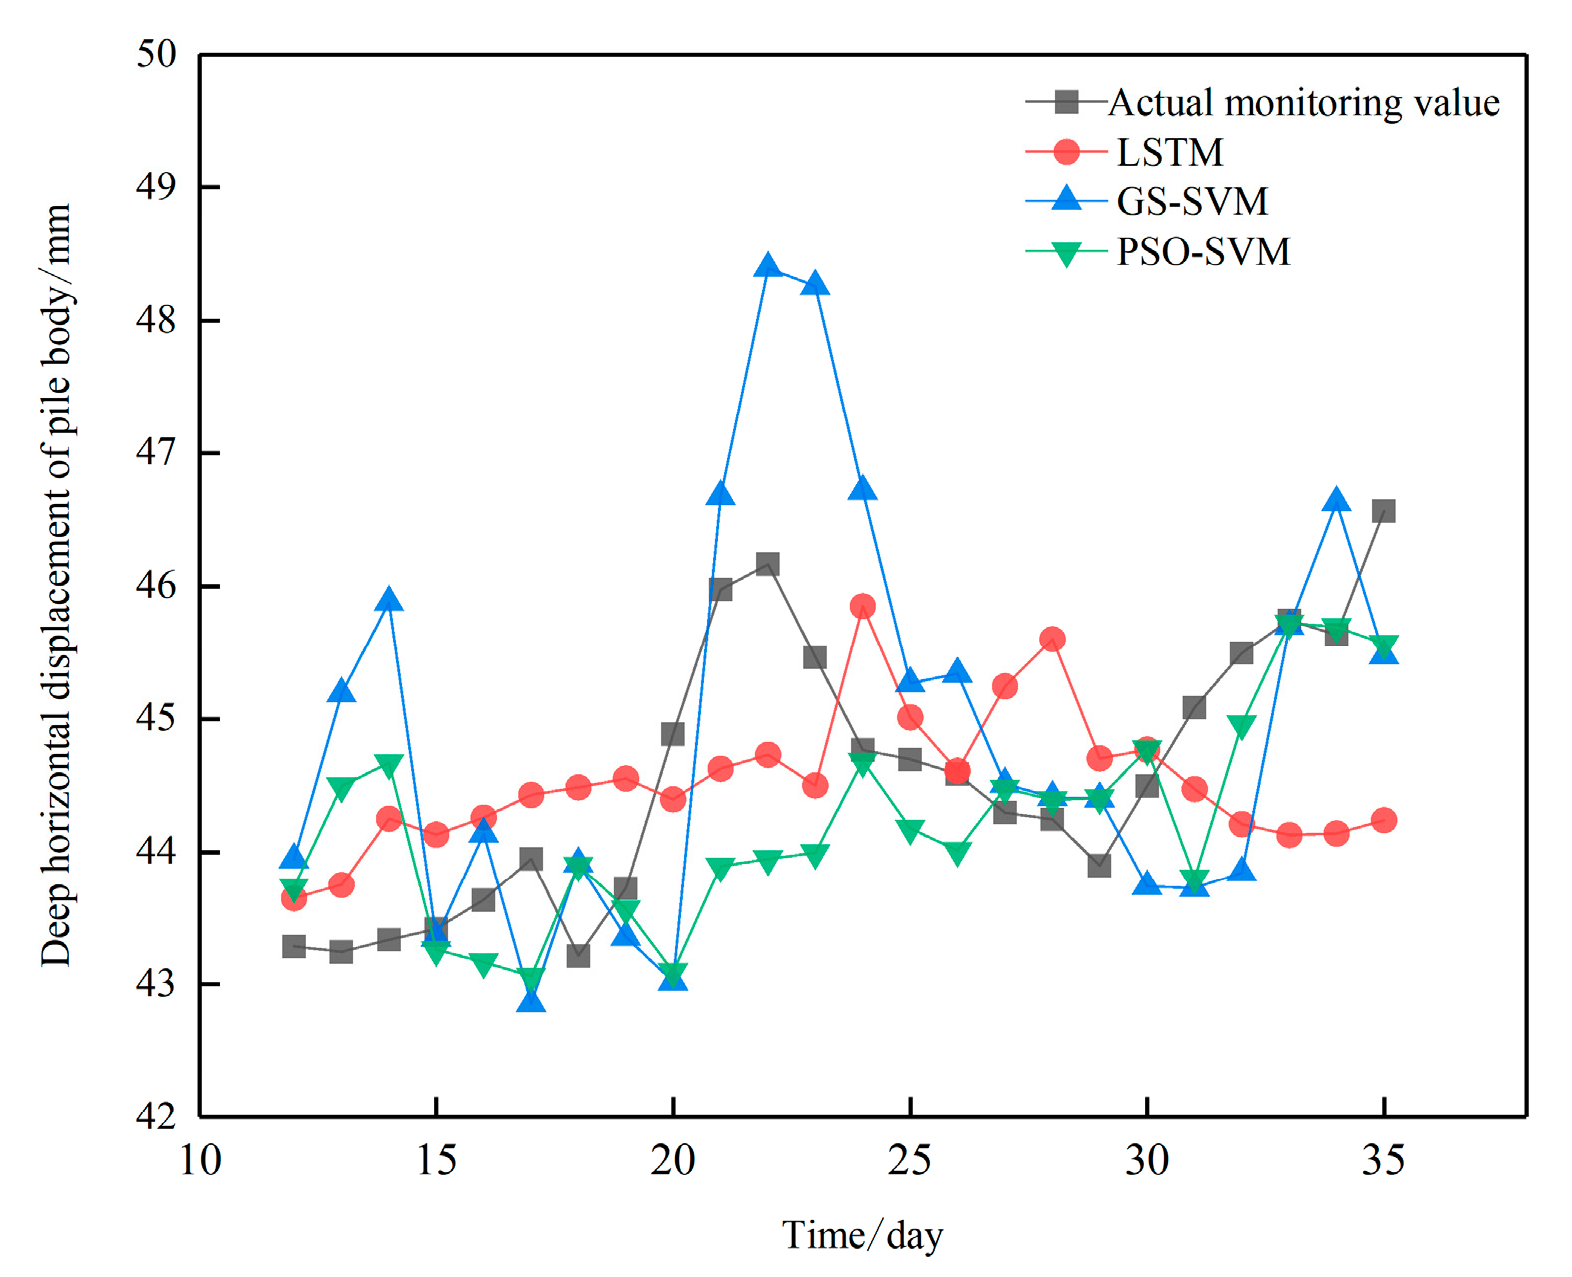
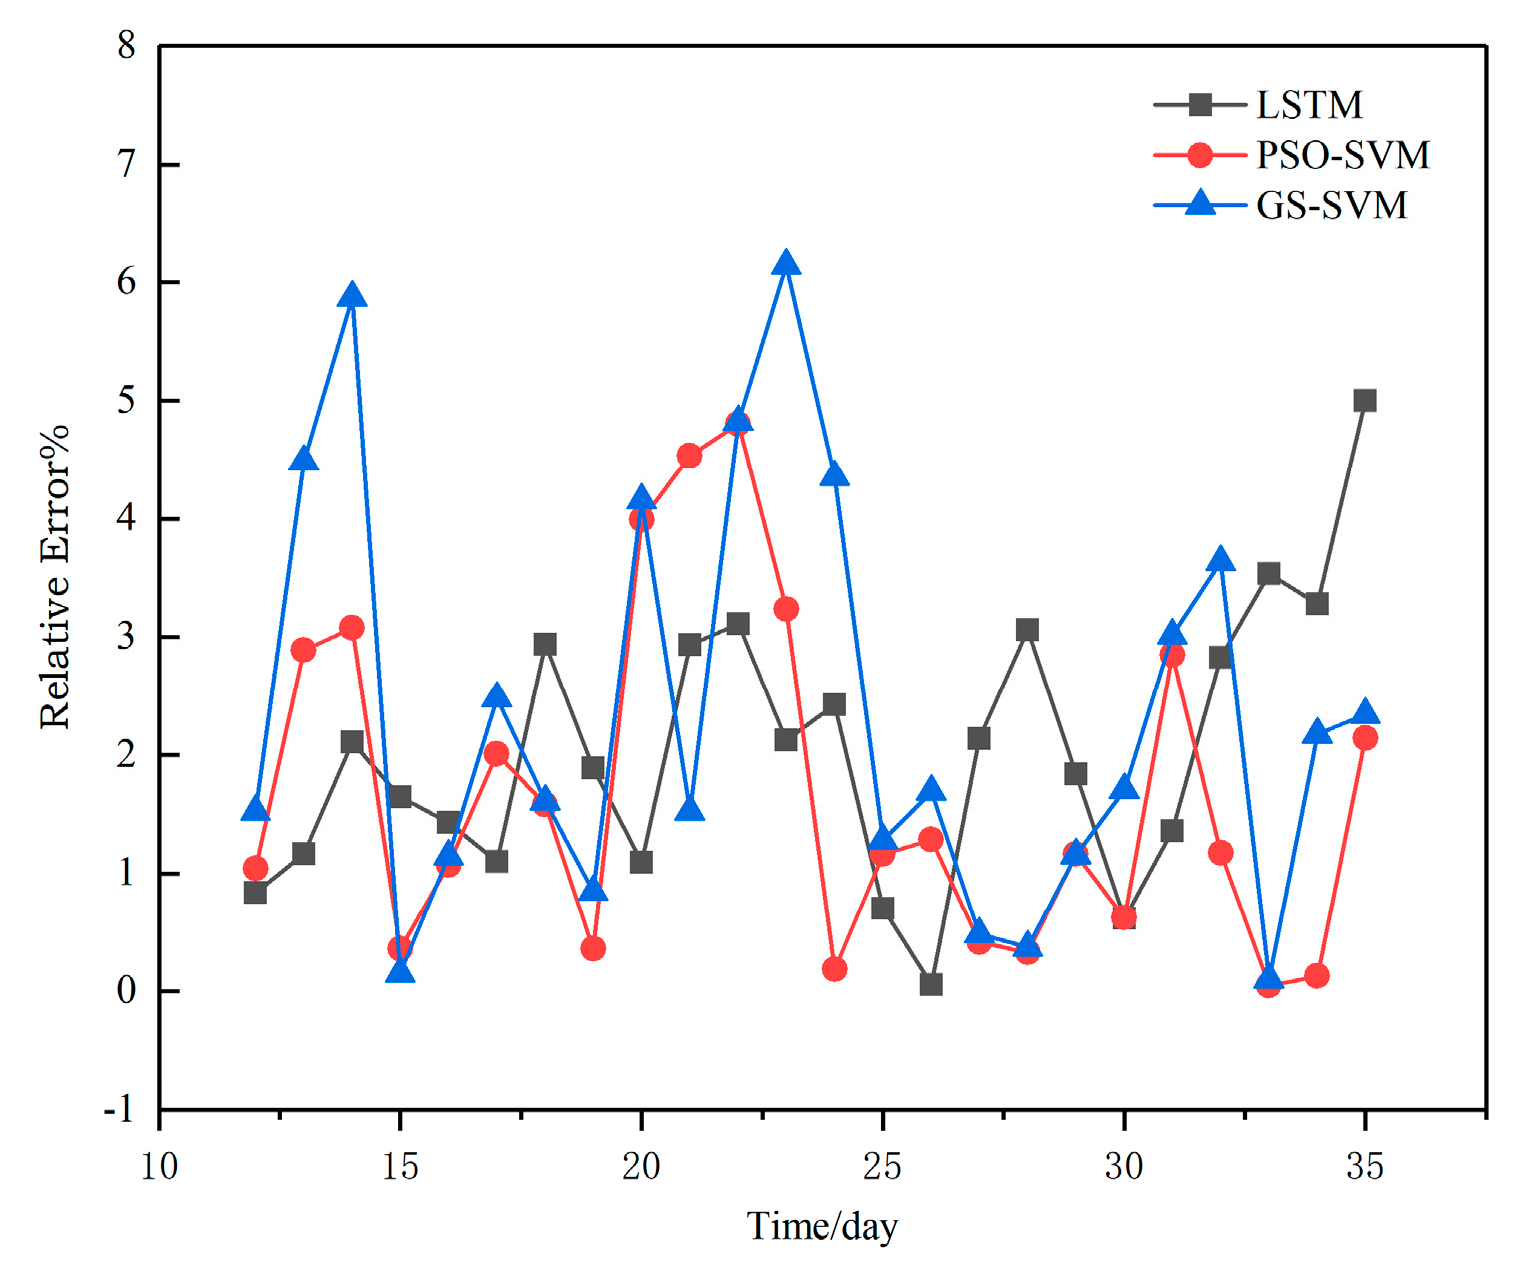
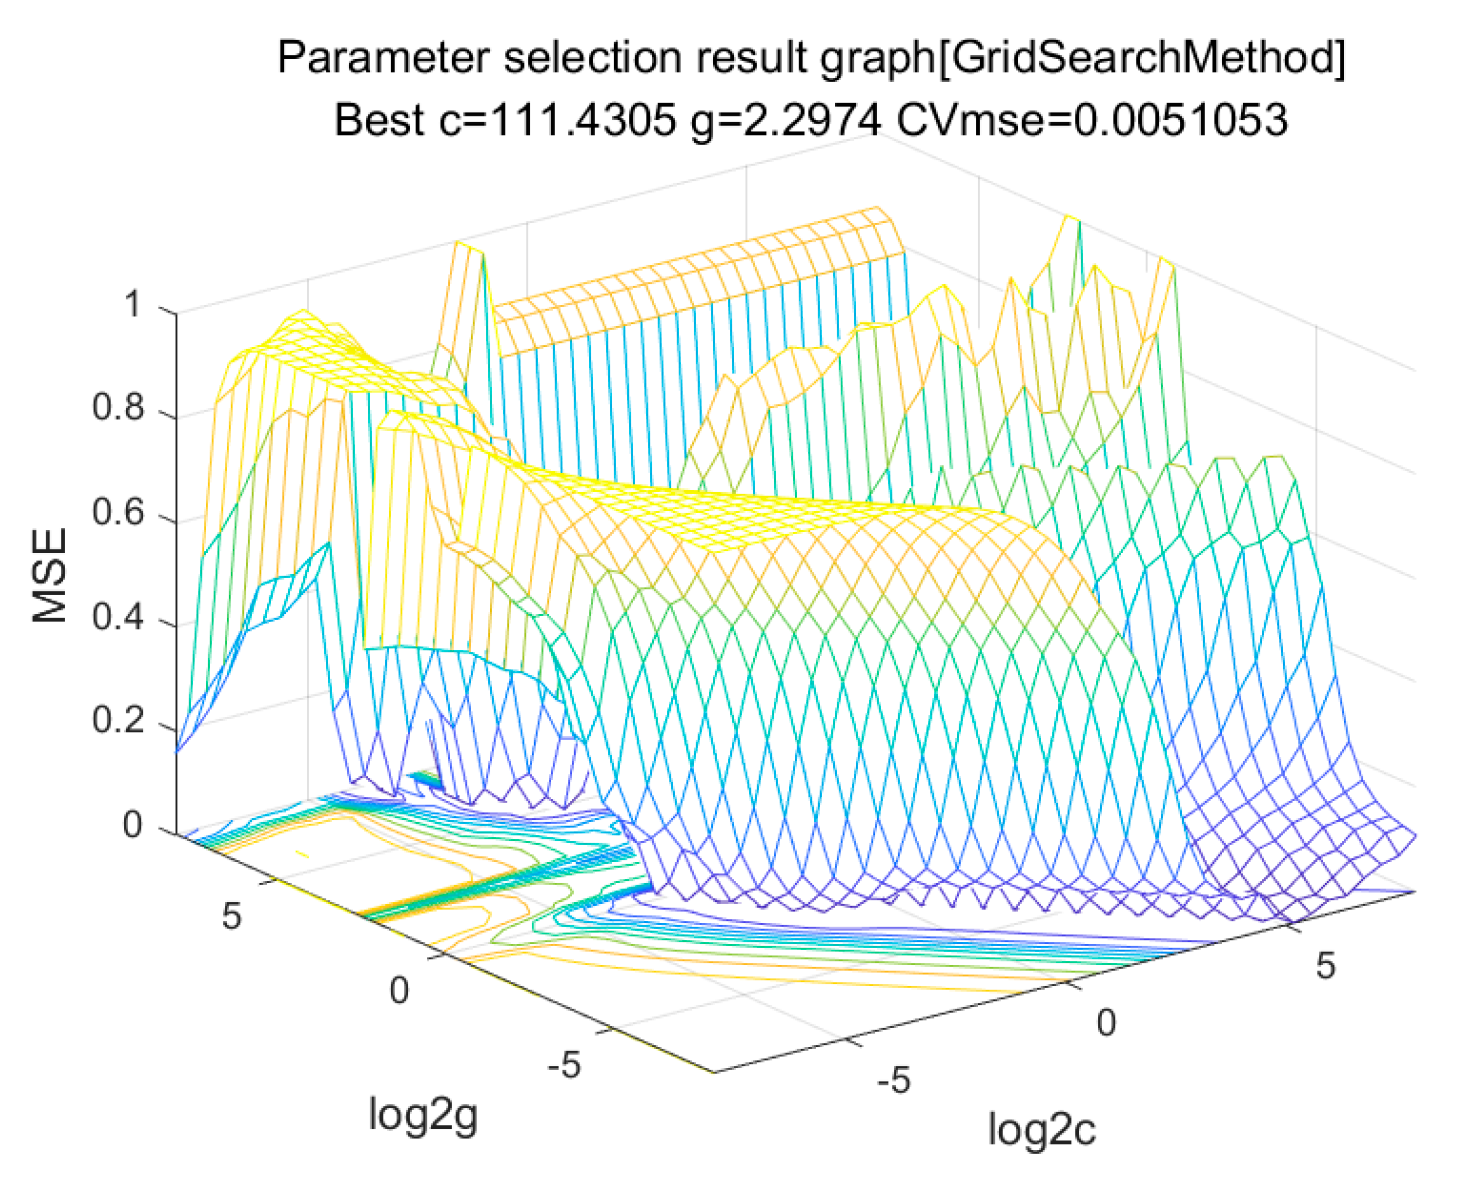
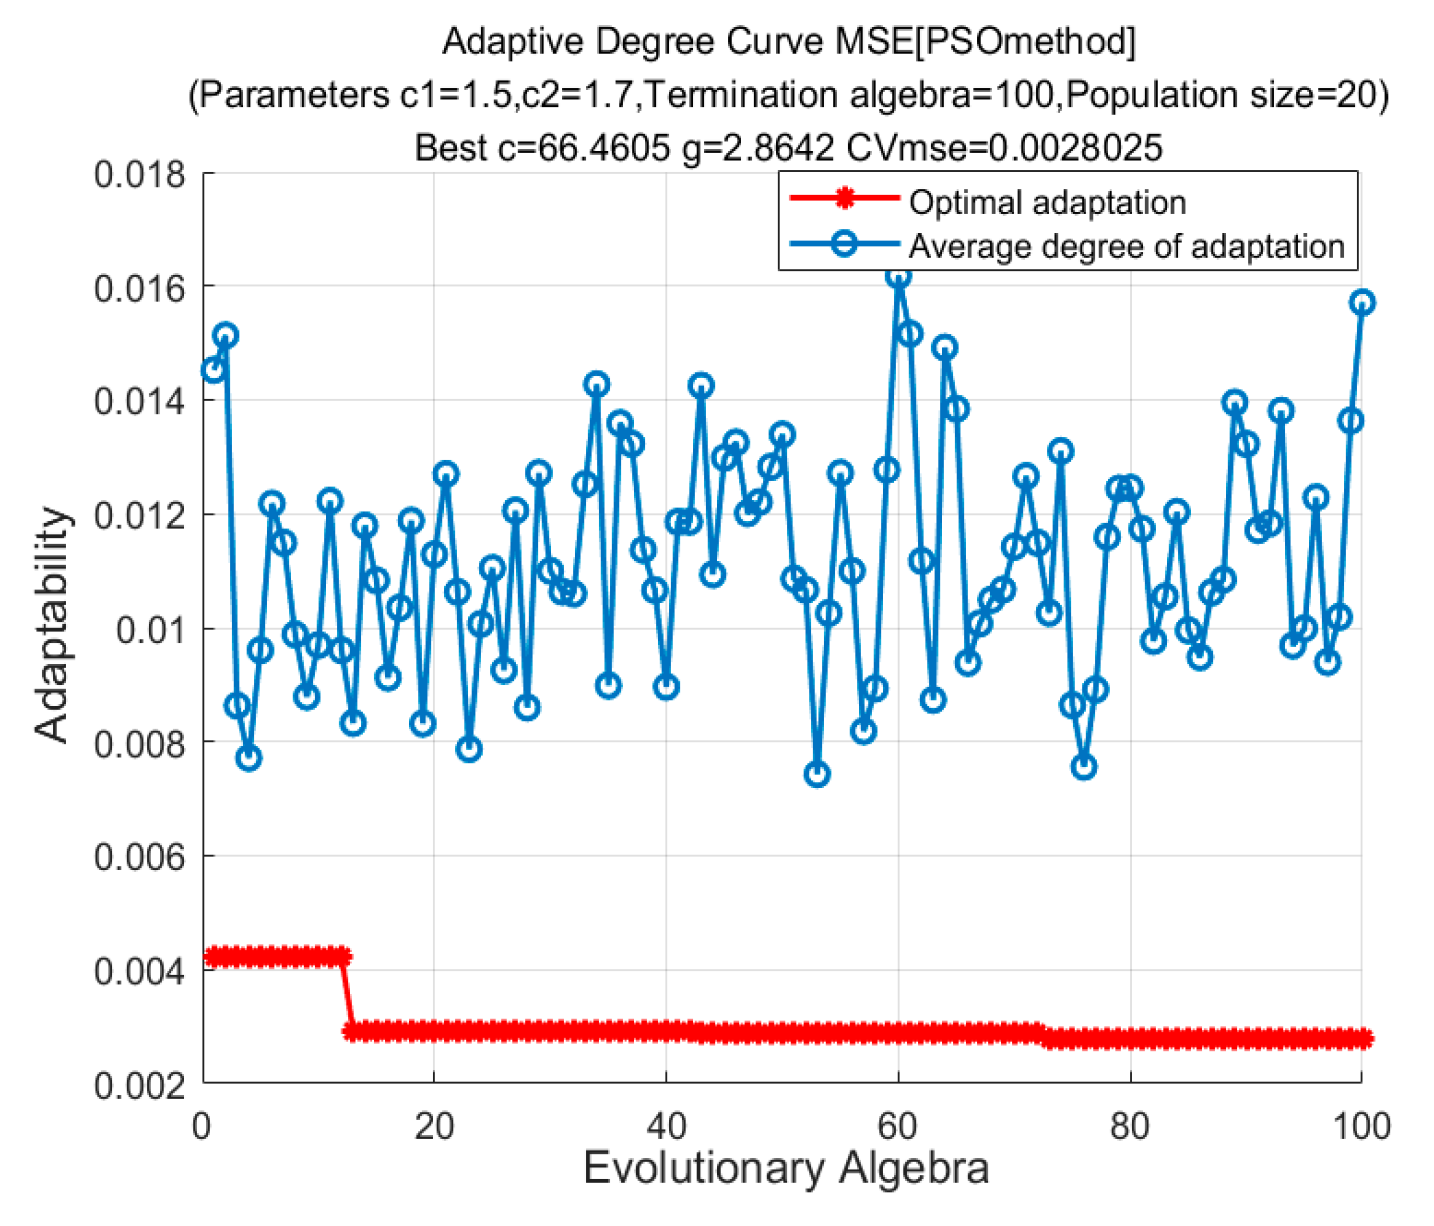
The layout of the field monitoring data is shown in Figure 6. The monitoring data of the deep horizontal displacement of pile ZQT045 at 5 m from the measured inclination point of axis 30~34 of the foundation pit is selected as the training sample. To verify the applicability of the PSO algorithm, the grid search-support vector machine (GS-SVM) is added to this study for its prediction. According to the principle of the rolling forecast method in Section 2.1.3, assuming p = 11, q = 3, the predicted values of the horizontal displacement of the pile are obtained, as shown in Table 1. The predicted values of GS-SVM, PSO-SVM, and LSTM algorithms and the error comparison are shown in Figure 7 and Figure 8. According to Equation (13), the mean absolute error can be obtained to compare the model accuracy. The GS-SVM model utilizes a grid search approach to find the optimal search range [2−8, 28]. The optimal values of c = 111.4305 and g = 3.3532 are determined, as shown in Figure 9. The PSO-SVM model parameter settings: acceleration c1 = 1.5, c2 = 1.7; velocity v = 3; factor k = 0.6; population size n = 20. After continuously updating the positions of the particle swarm x, the optimal values of the SVM parameters c = 66.4605 and g = 2.8642 are obtained, and the optimal adaptation curve is shown in Figure 10. The LSTM algorithm optimizes the parameters through the Adam optimizer to determine the initial learning rate lr = 0.01, and the training effect is best after 200 epochs. In epoch: 126 loss: 0.00884; epoch: 151 loss: 0.001; epoch: 176, loss: 0.0006; epoch: 199 loss: 0.005 loss function loss reaches the minimum, stop training. From Table 1, the average errors of GS-SVM, PSO-SVM, and LSTM algorithms are 2.37%, 1.68%, and 2.04%, respectively. The maximum relative errors of the GS-SVM algorithm, PSO-SVM algorithm, and LSTM algorithm are 4.8%, 4.82%, and 4.48%, respectively.
M A E = 1 n ( x 1 x 2 1 ) 100
where, x 1 —predicted value, x 2 —true value, and n is the number of samples.
According to the prediction results, the PSO-SVM algorithm outperforms the LSTM algorithm, which provides algorithm support for the prediction of the horizontal displacement of the pile change below.
Table 1. Prediction results of the horizontal displacement of the pile.
Monitoring Time/DayMeasured Value/mmGS-SVMRelative Error %PSO-SVMRelative Error %LSTMRelative Error %
1243.28643.6480.83643.7371.04143.9451.523
1343.24643.7501.16544.4952.88945.1864.487
1443.33644.2502.10944.6703.07845.8805.871
1543.41644.1301.64543.2610.35843.3500.152
1643.63644.2601.43043.1681.07444.1361.146
1743.94644.4291.09943.0622.01142.8572.478
1843.21644.4852.93643.8981.57943.9121.611
1943.72644.5511.88743.5690.35843.3560.847
2044.88644.3951.09443.0953.99043.0224.153
2145.97644.6272.93443.8924.53446.6761.522
2246.16644.7303.11143.9464.80848.3934.823
2345.46644.5002.12543.9943.23748.2596.142
2444.76645.8502.42144.6840.18446.7144.352
2544.69645.0100.70344.1771.16145.2671.278
2644.58644.6100.05444.0131.28545.3391.688
2744.29645.2432.13844.4800.41544.5100.482
2844.24645.6013.06244.3910.32744.4110.372
2943.89644.7021.83644.4061.16244.4021.154
3044.49644.7690.61444.7720.62143.7381.704
3145.08644.4731.36043.8022.84943.7263.017
3245.49644.2102.82744.9621.17443.8423.635
3345.74644.1293.53545.7250.04745.7000.101
3445.63644.1403.27845.6950.12946.6292.176
3546.56644.2384.99945.5682.14445.4762.341
mean absolute error 2.05 1.686 2.377

3.3. Combining Displacement Prediction with Multi-Metric Fusion Dynamic Risk Assessment

3.3.1. Monitoring Indicators

The project location of the monitoring program at Jinan Metro Line R2 Martyrs’ Cemetery Station is shown in Figure 6, including the deep horizontal displacement of the piles, surface settlement, column settlement, etc. These monitoring indicators can directly reflect the safety status of the foundation pit enclosure [28,29]. Therefore, the three monitoring indexes of pile horizontal displacement, surface settlement, and column settlement are used to analyze the safety state of the foundation pit retaining structure in this paper. According to the norms [30,31,32], the daily accumulated deformation and the rate of change in the monitoring data are selected as the judgment indicators, as shown in Table 2. Referring to the control value of the foundation pit supporting structure and the early warning management system in the open excavation method monitoring scheme of Martyrs’ Lingyuan Station of Jinnan Railway Line R2, the determination index is divided into four levels, as shown in Table 3.

3.3.2. Risk Probability Distribution Level

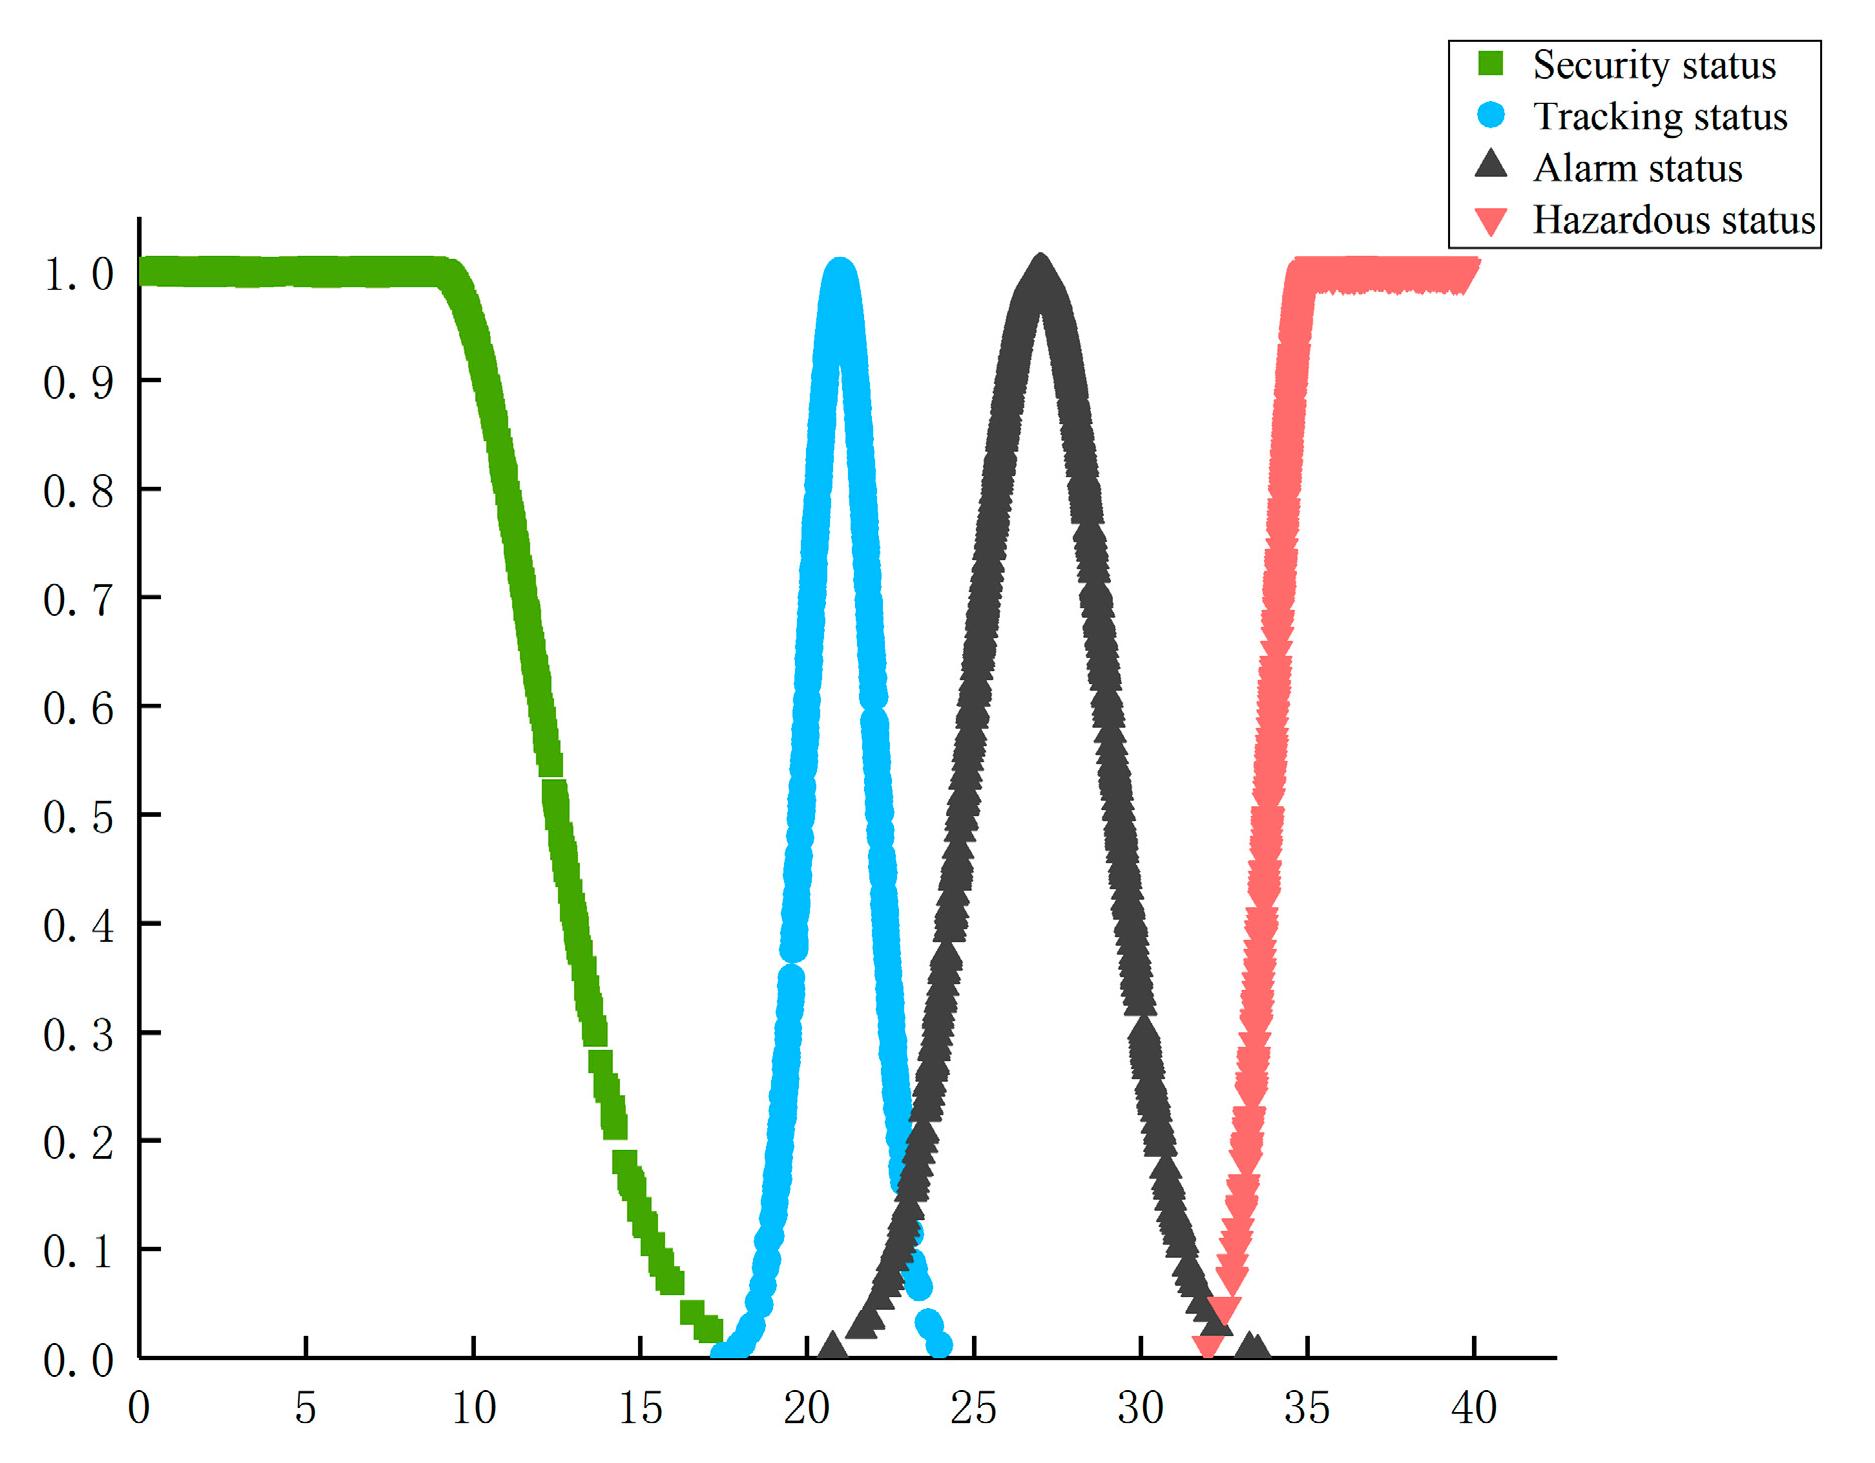
The double limit interval state of the risk index is determined according to the safety level standard in Table 3 and then converted into a standard cloud model according to Equation (9) to obtain the parameter value ( E x , E n , E n ) , as shown in Table 4. In the conversion process from the middle layer to the cloud model, the beginning of specific factors and the end of the cloud model should be specially processed. Taking the cumulative value of the deep horizontal displacement of the pile as an example, if its cumulative value is lower, the index risk level is lower.
When the cumulative value is lower than 9 mm (or higher than 35 mm), the pile-deep horizontal displacement cumulative value affiliation in the CM is defined as 1, as shown in Figure 11 [27].

3.3.3. Multi-Indicator Fusion Analysis

(1)
Indicator Forecast
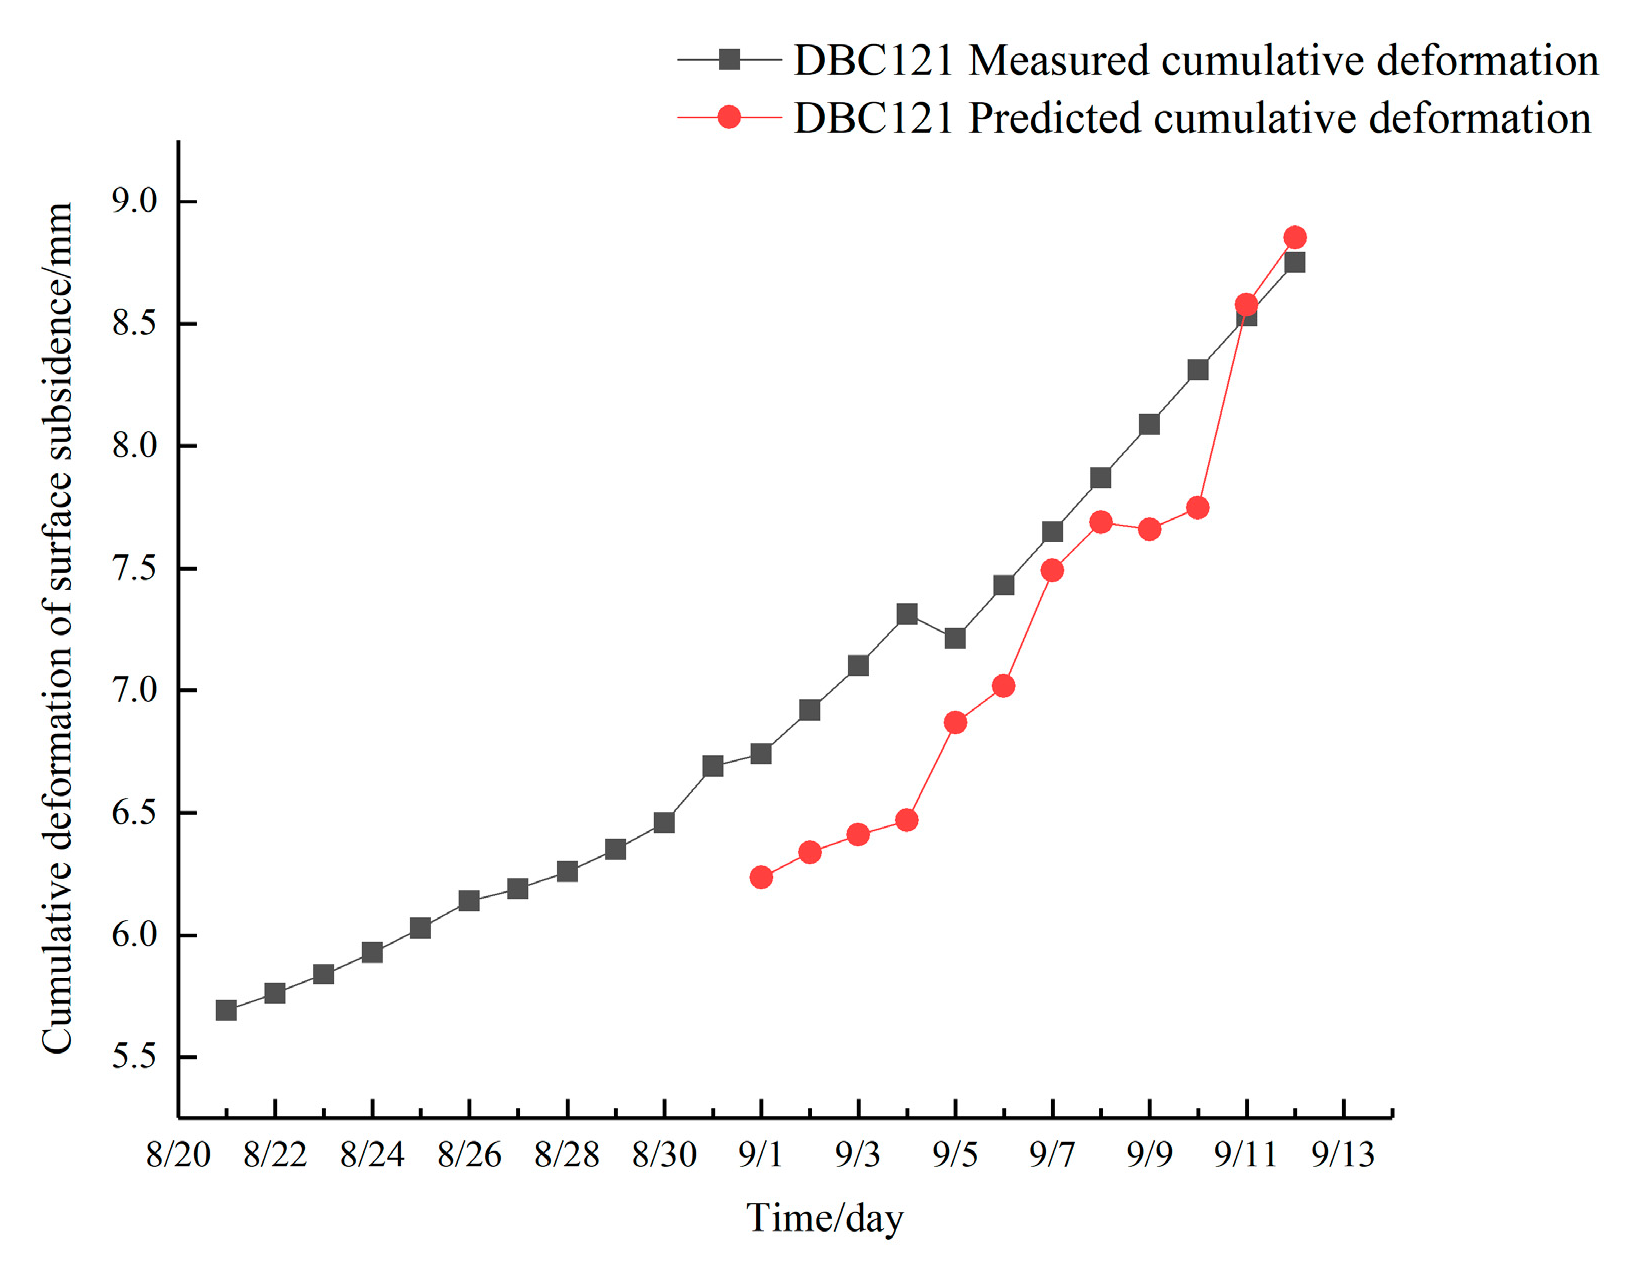
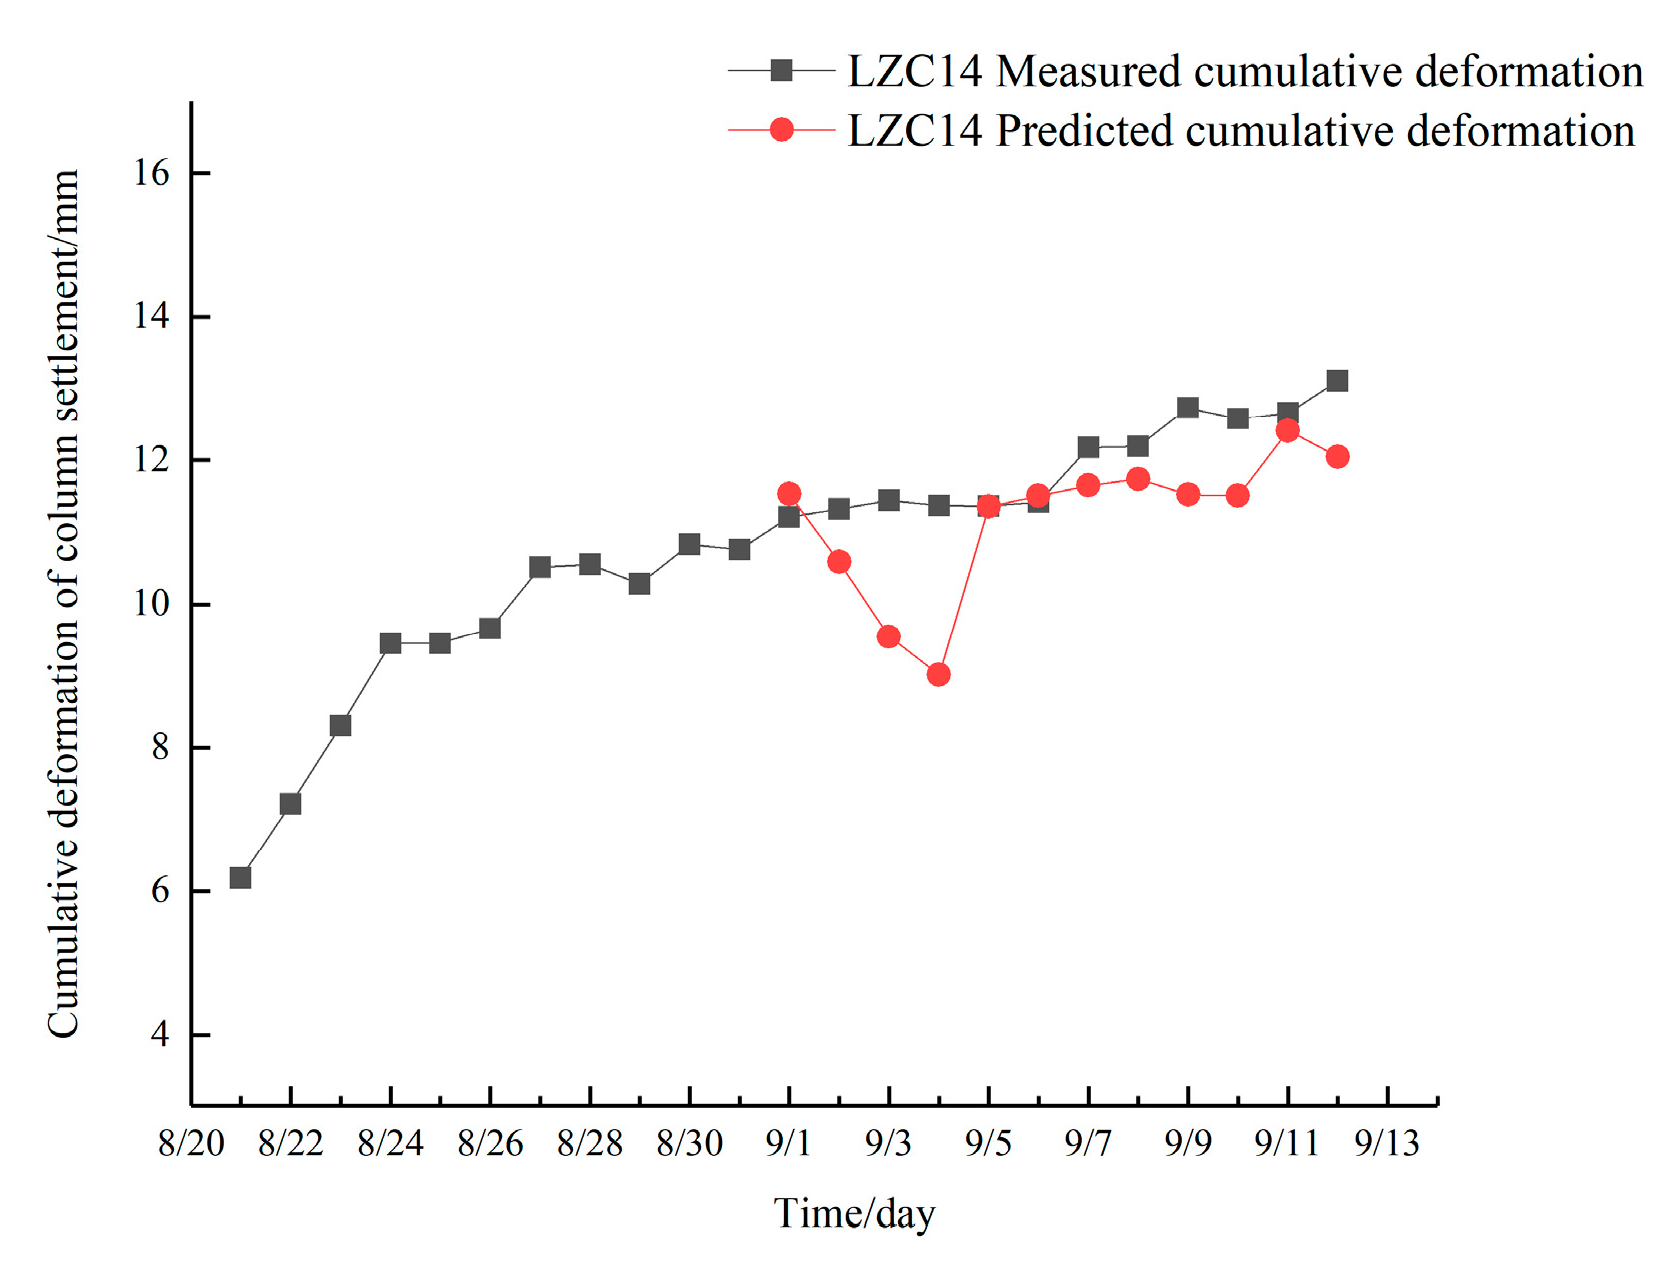
The 30~34 axis of the foundation pit is the layout project of the Martyrs Cemetery Station of Jinan Metro Line R2 in Figure 4. The cumulative deformation of different monitoring indicators is projected, including surface settlement displacement (DBC121), deep horizontal displacement of piles (ZQT044), and column settlement (LZC14). The projected cumulative horizontal deformation of ZQT044 at depths of 12 m, 12.5 m, and 13 m is depicted in Figure 12a–c. According to actual daily monitoring data, ZQT044 is safe from 21 August to 9 September. The rolling prediction was performed, and it was discovered that the cumulative deformation predicted by ZQT044 over the next three days at a depth of 13 m is nearing the control value. The cumulative deformation forecast for surface settlement DBC121 and column settlement LZC14 is not anomalous, as illustrated in Figure 13 and Figure 14.
(2)
CM + D-S Evidence Theory
The predicted displacement values and deformation rates of each risk monitoring index obtained on September 9 are taken as normal clouds and substituted into Equation (10) to calculate the BPA values, as shown in Table 5. The conflict factor K is calculated according to Equation (11) for the cumulative value of each index and the deformation rate BPA value: K1 = 0.99; K2 = 0.342; K3 = 0.03. The K1 tends to 1, highly conflicting, and the weighted fusion using Equation (12) yields d = [0.3; 0.3] and w = [0.5; 0.5]; K2, K3 < δ, can be fused by Dempster rule to obtain probability values for individual monitoring indicators. It can be seen from Table 6 that the evaluation results of a single information source are different. The K = 1 is greater than ε, highly conflicting, and d1 = 0.2. d2 = 0.1; d3 = 0.1; w1 = 0.2; w2 = 0.4; w3 = 0.4; the probability of deformation risk level of the final envelope structure is obtained. The state of the foundation pit is determined by the safety criterion table, as shown in Table 7.

3.4. Discussion

3.4.1. Forecasting Results

According to the inclinometer point ZQT044, the deformation is increasing due to the excavation stage. The average relative errors of the horizontal displacement of the pile are 9.65%, 10.55%, and 10.19%, respectively. The predicted results of the surface settlement and column settlement displacement are consistent with the measured values. The prediction results of the algorithm are no more than 15%, and the error is small. Obviously, in the case of less monitoring sample data, the PSO-SVM model has a good prediction effect.

3.4.2. Evaluation Analysis

As shown in Table 6, the deep horizontal displacement of the pile is in grade III (Alarm). The surface subsidence displacement is in grade I (Security). The settlement displacement of the column is in grade I (Security). The improved D-S theory is used to integrate all types of information, including conflict information, and the foundation pit enclosure structure is shown as level I (Security).
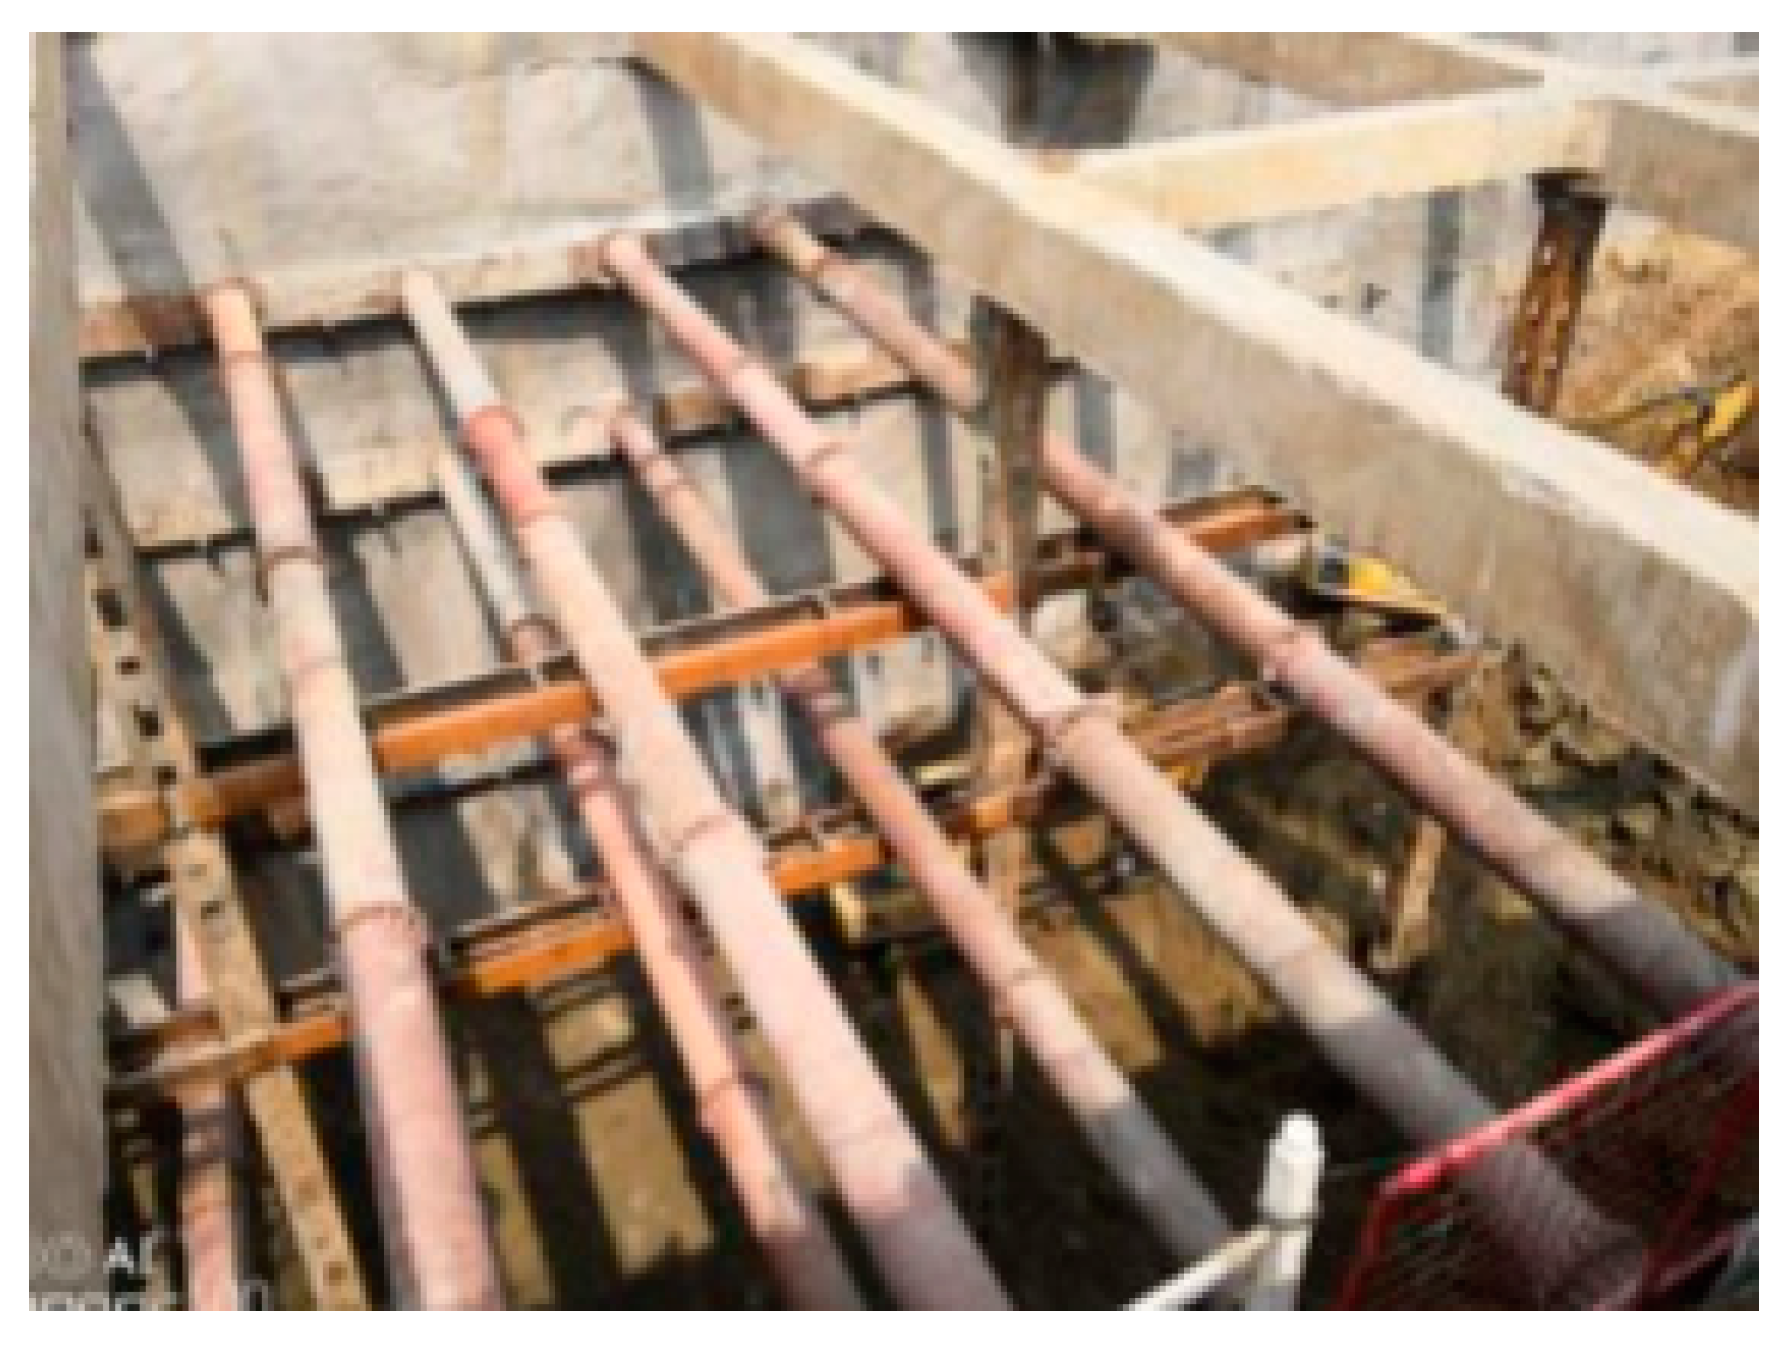
According to the construction log record on September 9, the site personnel set the risk level status of the enclosure structure as Class I safety status, there was no abnormality at the site, and the workers continued to erect the steel support. As shown in Figure 15. This assessment result status is consistent with the multi-indicator fusion result. The accumulated value of horizontal displacement of the pile body is close to the control value alone, which is prone to bias and cannot objectively and accurately determine the comprehensive risk level of the enclosure structure.
A single monitoring indicator does not reflect the status of the process. A multi-indicator monitoring approach allows for the integrated consideration of changes in multiple key indicators, as well as representational information (including conflicting information) for all monitored indicators. This provides a comprehensive understanding of the construction and reduces the cost and saves the decision-making time of the decision-makers on-site. Meanwhile, when three single information sources are evaluated differently, the improved D-S theory fully considers the credibility of the model when merging highly conflicting information sources. By correcting the weights and weakening the conflicting information, the calculated results are more representative of the actual situation.

4. Results

The factors affecting the safety of deep foundation pit construction are multiple and complex. Therefore, a new multi-information fusion intelligent safety assessment method is proposed to evaluate the safety of foundation pit construction. A typical case study is conducted for the application and validation of the new method.
(1)
Artificial intelligence algorithms are introduced into the case to predict envelope deformation. The cloud model and D-S theory are used to fuse multiple indicators. The intelligent multi-indicator fusion assessment model for the dynamic safety of deep foundation pit construction is constructed by coupling and analyzing the deformation prediction results with the risk index information.
(2)
The PSO-SVM model outperforms the LSTM model in the case of less on-site construction monitoring data. The comparison with the actual results validates the prediction method. This dynamic assessment of safety integrates information on the characteristics of the monitored items and provides a more in-depth analysis of the risk of envelope deformation, thus improving the accuracy and robustness of the assessment results. This method is also applicable to other metro station cases when monitoring sample data are small.
(3)
During the excavation of foundation pits, the risk changes dynamically, which is difficult for a single indicator to reflect the deformation of the site envelope. Therefore, it is significant to build the multi-indicator information model to improve accuracy. This method uses different monitoring indicators as the information source to obtain the risk level prediction. This method of dynamically assessing the extent of deformation can provide early warning signals for decision-makers.
(4)
Due to the complexity and uncertainty of the deep foundation pit project, the artificial intelligence model used at present is more applied to the prediction of trend terms and has not been able to consider the situation of unexpected events and contingencies. It also fails to realize the intelligent integration of the dynamic assessment of the whole process of construction, which needs more practice in optimization and improvement.

Author Contributions

Conceptualization, B.W.; Formal analysis, S.X.; Funding acquisition, B.W.; Methodology, S.X.; Software, Y.W.; Validation, Y.W.; Writing—original draft, Y.W. and S.X.; Writing—review & editing, C.Z., Y.L. and K.Z. All authors have read and agreed to the published version of the manuscript.

Funding

This research was funded by the National Natural Science Foundation of China (No.52278397, No. 52168055), and the Natural Science Foundation of Jiangxi Province (20212ACB204001), and the ‘Double Thousand Plan’ Innovation Leading Talent Project of Jiangxi Province (jxsq2020101001).

Institutional Review Board Statement

Not applicable.

Informed Consent Statement

Not applicable.

Data Availability Statement

The data presented in this study are available on request from the corresponding author.

Conflicts of Interest

The authors declare no conflict of interest.

References

  1. Fu, L.; Wang, X.; Zhao, H.; Li, M. Interactions among safety risks in metro deep foundation pit projects: An association rule mining-based modeling framework. Reliab. Eng. Syst. Saf. 2022, 221, 108381. [Google Scholar] [CrossRef]
  2. Lin, Y.X.; Lai, Z.S.; Ma, J.J.; Huang, L.C.; Lei, M.F. A FDEM approach to study mechanical and fracturing responses of geo-materials with high inclusion contents using a novel reconstruction strategy. Eng. Fract. Mech. 2023, 282, 109171. [Google Scholar] [CrossRef]
  3. Lin, Y.X.; Yin, Z.; Wang, X.; Huang, L. A systematic 3D simulation method for geomaterials with block inclusions from image recognition to fracturing modelling. Theor. Appl. Fract. Mech. 2021, 117, 103194. [Google Scholar] [CrossRef]
  4. Yang, W.; Hu, Y.; Hu, C.; Yang, M. An Agent-Based Simulation of Deep Foundation Pit Emergency Evacuation Modeling in the Presence of Collapse Disaster. Symmetry 2018, 10, 581. [Google Scholar] [CrossRef] [Green Version]
  5. Li, Z.; Zhao, G.-F.; Deng, X.; Zhu, J.; Zhang, Q. Further development of distinct lattice spring model for stability and collapse analysis of deep foundation pit excavation. Comput. Geotech. 2022, 144, 104619. [Google Scholar] [CrossRef]
  6. Ye, S.; Zhao, Z.; Wang, D. Deformation analysis and safety assessment of existing metro tunnels affected by excavation of a foundation pit. Undergr. Space 2021, 6, 421–431. [Google Scholar] [CrossRef]
  7. Sun, Y.; Xiao, H. Wall Displacement and Ground-Surface Settlement Caused by Pit-in-Pit Foundation Pit in Soft Clays. KSCE J. Civ. Eng. 2021, 25, 1262–1275. [Google Scholar] [CrossRef]
  8. Luo, J.; Ren, R.; Guo, K. The deformation monitoring of foundation pit by back propagation neural network and genetic algorithm and its application in geotechnical engineering. PLoS ONE 2020, 15, e0233398. [Google Scholar] [CrossRef]
  9. Bao, Z.; Wang, C. A multi-agent knowledge integration process for enterprise management innovation from the perspective of neural network. Inf. Process. Manag. 2022, 59, 102873. [Google Scholar] [CrossRef]
  10. Zhou, Y.; Li, S.; Zhou, C.; Luo, H. Intelligent Approach Based on Random Forest for Safety Risk Prediction of Deep Foundation Pit in Subway Stations. J. Comput. Civ. Eng. 2019, 33, 796. [Google Scholar] [CrossRef]
  11. Zhang, S.J.; Tan, Y. Foundation pit deformation prediction based on LSTM algorithm. Tunn. Constr. 2022, 42, 113–120. [Google Scholar]
  12. Song, Z.; Liu, S.; Jiang, M.; Yao, S. Research on the Settlement Prediction Model of Foundation Pit Based on the Improved PSO-SVM Model. Sci. Program. 2022, 2022, 1921378. [Google Scholar] [CrossRef]
  13. Wang, Q.; Xia, T.; Yang, D. Safety early warning of subway deep foundation pit based on T-S fuzzy neural network. Chin. J. Saf. Sci. 2018, 28, 161–167. (In Chinese) [Google Scholar]
  14. Zhang, L.; Li, H. Construction Risk Assessment of Deep Foundation Pit Projects Based on the Projection Pursuit Method and Improved Set Pair Analysis. Appl. Sci. 2022, 12, 1922. [Google Scholar] [CrossRef]
  15. Guo, K.; Zhang, L. Multi-source information fusion for safety risk assessment in underground tunnels. Knowl.-Based Syst. 2021, 227, 107210. [Google Scholar] [CrossRef]
  16. Zhou, Y.; Li, C.; Ding, L. Combining association rules mining with complex networks to monitor coupled risks. Reliab. Eng. Syst. Saf. 2019, 186, 194–208. [Google Scholar] [CrossRef]
  17. Pan, Y.; Zhang, L.; Wu, X. Multi-classifier information fusion in risk analysis. Inf. Fusion 2020, 60, 121–136. [Google Scholar] [CrossRef]
  18. Xia, T.; Cheng, C.; Pang, Q.Z. Deep Foundation Pit Deformation Safety Risk Warning Based on Long and Short Term Memory Network. Earth Sci. 2022, 1–8. Available online: https://kns-cnki-net.webvpn.ecut.edu.cn/kcms/detail/42.1874.P.20211228.1117.016.html (accessed on 26 April 2023).
  19. Zhao, Y.; Mi, J.-S.; Liu, X.; Sun, X.-Y. Reconstructing images corrupted by noise based on D–S evidence theory. Int. J. Mach. Learn. Cybern. 2017, 8, 611–618. [Google Scholar] [CrossRef]
  20. Babikir, A.; Mwambi, H. Factor Augmented Artificial Neural Network Model. Neural Process. Lett. 2016, 45, 507–521. [Google Scholar] [CrossRef]
  21. Pan, Y.; Zhang, L. Roles of Artificial Intelligence in Construction Engineering and Management: A Critical Review and Future Trends. Autom. Constr. 2021, 122, 103517. [Google Scholar] [CrossRef]
  22. Shen, S.L.; Njock, P.G.A.; Zhou, A.; Lyu, H.M. Dynamic prediction of jet grouted column diameter in soft soil using Bi-LSTM deep learning. Acta Geotech. 2021, 16, 303–315. [Google Scholar] [CrossRef]
  23. Hu, X.; Liu, T.; Hao, X.; Lin, C. Attention-based Conv-LSTM and Bi-LSTM networks for large-scale traffic speed prediction. J. Supercomput. 2022, 78, 12686–12709. [Google Scholar] [CrossRef]
  24. Wu, B.; Qiu, W.; Huang, W.; Meng, G.; Nong, Y.; Huang, J. A Multi-Source Information Fusion Evaluation Method for the Tunneling Collapse Disaster Based on the Artificial Intelligence Deformation Prediction. Arab. J. Sci. Eng. 2022, 47, 5053–5071. [Google Scholar] [CrossRef]
  25. Li, D.; Liu, C.; Gan, W. A new cognitive model: Cloud model. Int. J. Intell. Syst. 2009, 24, 357–375. [Google Scholar] [CrossRef]
  26. Huang, Y. Advances in Artificial Neural Networks-Methodological Development and Application. Algorithms 2009, 2, 973–1007. [Google Scholar] [CrossRef] [Green Version]
  27. Zhang, L.; Wu, X.; Zhu, H.; AbouRizk, S.M. Perceiving safety risk of buildings adjacent to tunneling excavation: An information fusion approach. Autom. Constr. 2017, 73, 88–101. [Google Scholar] [CrossRef]
  28. Liu, J. Research on Dynamic Risk Assessment and Intelligent Early Warning Method of Subway Deep Foundation Pit Construction. Master’s Thesis, Guangxi University, Nanning, China, 2022. [Google Scholar]
  29. Lin, Y.X.; Wang, X.; Ma, J.; Huang, L. A finite-discrete element based appoach for modelling the hydraulic fracturing of rocks with irregular inclusions. Eng. Fract. Mech. 2022, 261, 108209. [Google Scholar] [CrossRef]
  30. Wu, B. Research and Practice of Tunnel Construction Safety Risk Management; China Railway Press: Beijing, China, 2010; pp. 60–62. [Google Scholar]
  31. Ministry of Housing and Urban Rural Development of the People’s Republic of China. 2014. Available online: https://max.book118.com/html/2022/0127/7015010006004064.shtm (accessed on 16 April 2023).
  32. Huang, L.C.; Ma, J.J.; Lei, M.F.; Liu, L.H.; Lin, Y.X.; Zhang, Z.Y. Soil-water inrush induced shield tunnel lining damage and its stabilization: A case study. Tunn. Undergr. Space Technol. 2020, 97, 103290. [Google Scholar] [CrossRef]
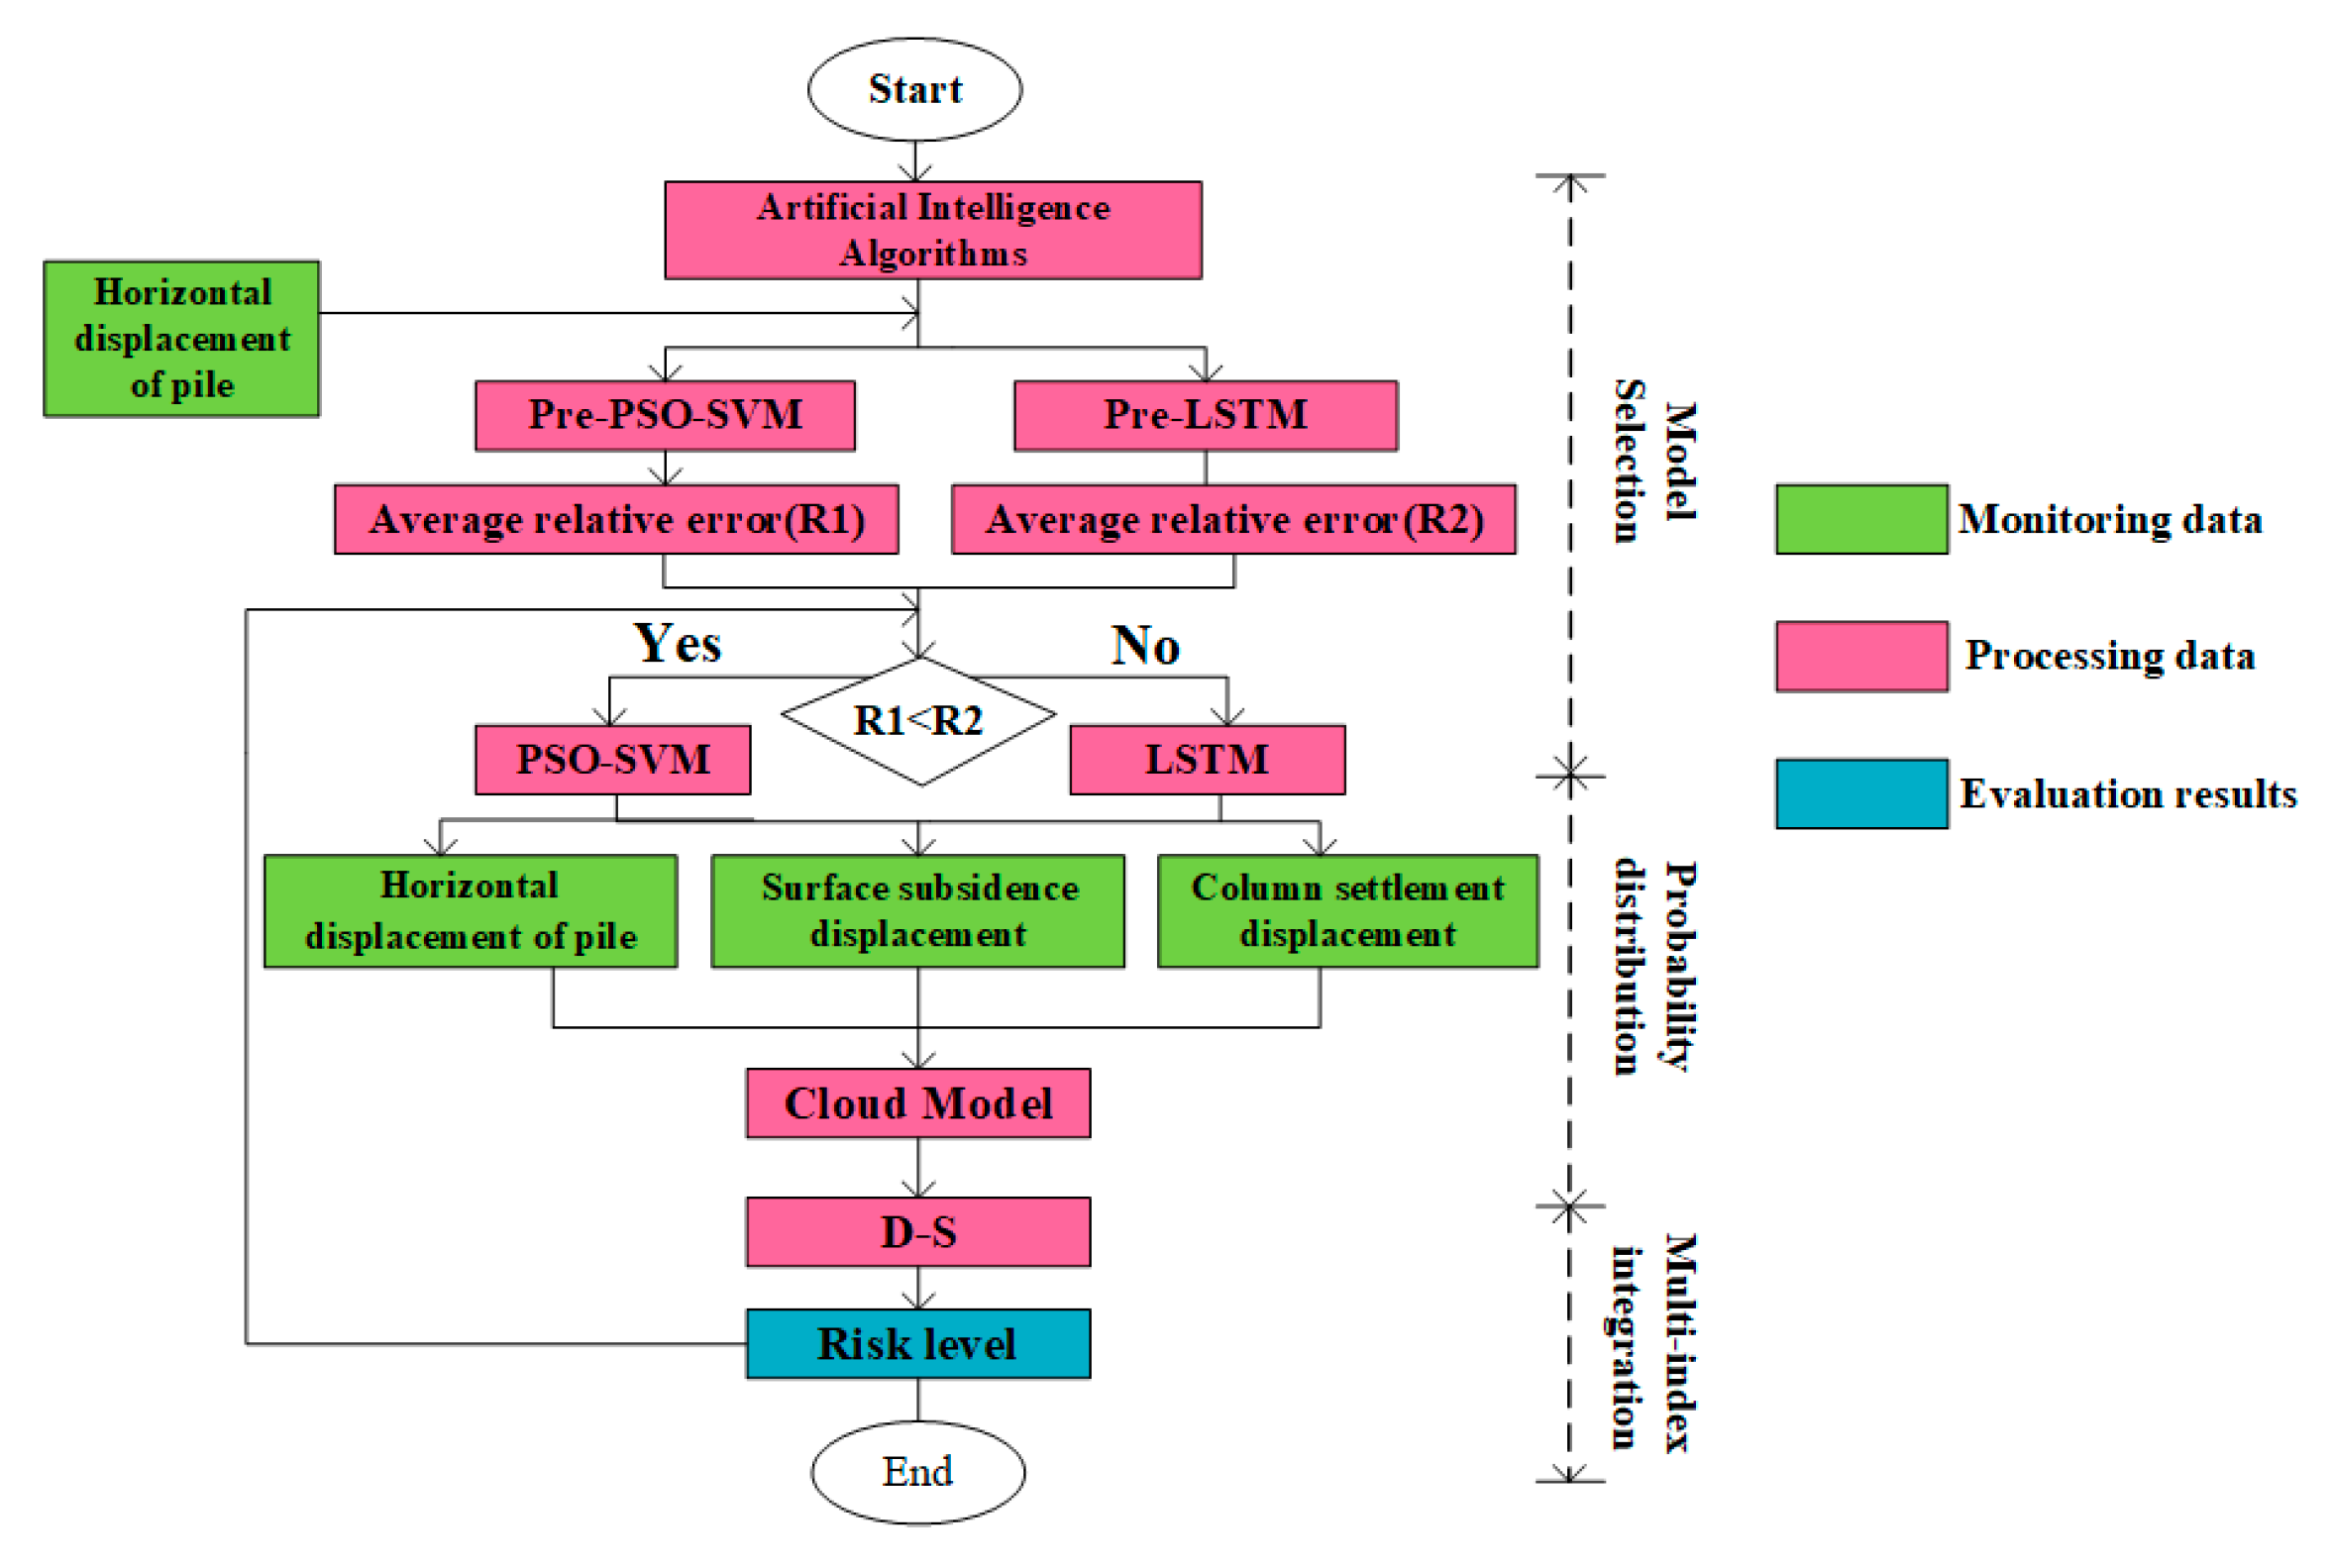
Figure 1. Flow Chart of Assessment Method.
Sustainability 15 10162 g001
Figure 2. LSTM basic cell structure.
Sustainability 15 10162 g002
Figure 3. PSO-SVM model flow chart.
Sustainability 15 10162 g003
Figure 4. The rolling forecast schematic.
Sustainability 15 10162 g004
Figure 5. Structural and geological profile of the station.
Sustainability 15 10162 g005
Figure 6. Site Monitoring Data Layout.
Sustainability 15 10162 g006
Figure 7. Monitoring Values and Predictive Values of SVM, PSO-SVM, and LSTM.
Sustainability 15 10162 g007
Figure 8. Error of GS-SVM, PSO-SVR, and LSTM.
Sustainability 15 10162 g008
Figure 9. GS-SVM parameter optimization diagram.
Sustainability 15 10162 g009
Figure 10. Optimal fitness curve.
Sustainability 15 10162 g010
Figure 11. CM distribution of accumulated values of deep horizontal displacement of pile body.
Sustainability 15 10162 g011
Figure 12. ZQT044 Deformation prediction and monitoring results. (a) 12 m; (b) 12.5 m; (c) 13 m.
Sustainability 15 10162 g012
Figure 13. DBC121 Displacement prediction and monitoring results.
Sustainability 15 10162 g013
Figure 14. LZC14 Displacement prediction and monitoring results.
Sustainability 15 10162 g014
Figure 15. Steel support erection.
Sustainability 15 10162 g015
Table 2. Safety Classification Standards.
The Risk Level of Envelope DeformationSecurity Status ITracking Status IIAlarm Status IIIHazardous Status IV
Cumulative variation/control value < 0.6 0.6 x < 0.8 0.8 x < 1.0 > 1.0
Change rate/control value < 0.6 0.6 x < 0.8 0.8 x < 1.0 > 1.0
Table 3. Safety Classification of Monitoring Indicators.
Monitoring ProjectsMonitoring IndicatorsSecurity Status ITracking Status IIAlarm Status IIIHazardous Status IV
Horizontal displacement of the pile bodyCumulative value (mm) < 18 18 x < 24 24 x < 30 > 30
Speed (mm/d) < 1.0 1.8 x < 2.4 2.4 x < 3 > 3.0
Surface SettlementCumulative value (mm) < 10 10 x < 20 20 x < 30 > 30
Speed (mm/d) < 1.2 1.2 x < 1.6 1.6 x < 2.0 > 2.0
Column SettlementCumulative value (mm) < 12 12 x < 16 16 x < 20 > 20
Speed (mm/d) < 1.8 1.8 x < 2.4 2.4 x < 3.0 > 3.0
Table 4. CM Parameter Values of Risk Monitoring Indicators.
IndicatorsIIIIIIIV
ExEnHeExEnHeExEnHeExEnHe
Hhorizontal displacement of the pile Cumulative value930.012110.012710.013510.01
Deformation rate0.50.20.012.10.10.012.70.10.013.50.10.01
Surface SettlementCumulative value530.011510.012510.013510.01
Deformation rate0.60.20.011.40.10.011.80.10.012.50.10.01
Column SettlementCumulative value620.01140.70.01180.70.01220.70.01
Deformation rate0.90.30.012.10.10.012.70.10.013.50.10.01
Table 5. Multi-indicator Fusion Results.
IndicatorsMonitoring ValuesThe Risk Level of Envelope Deformation
m (I)m (II)m (III)m (IV)
Horizontal displacement of the pile Cumulative value/mm26.49000.9980
Deformation rate/mm·d−1−0.4500.90270.0090.092
Surface SettlementCumulative value/mm7.740.6580.3400
Deformation rate/mm·d−10.081000
Column SettlementCumulative value/mm11.500.97560.0230.0020
Deformation rate /mm·d−1−0.240.9920.00800
Table 6. Improved D-S fusion.
Basic Probability Assignmentm (I)m (II)m (III)m (IV)
Horizontal displacement of the pile m (A)00.450.510.05
Surface Settlement m (B)1000
Column Settlement m (c)0.990.0100
d = [0.2; 0.1; 0.2]; w = [0.2; 0.4; 0.4];
Improved D-S0.80.10.10.01
Table 7. Safety criteria table.
Foundation Pit GradeIIIIIIIV
State of foundation pitSecurityTrackingAlarmHazardous
Disclaimer/Publisher’s Note: The statements, opinions and data contained in all publications are solely those of the individual author(s) and contributor(s) and not of MDPI and/or the editor(s). MDPI and/or the editor(s) disclaim responsibility for any injury to people or property resulting from any ideas, methods, instructions or products referred to in the content.