Article

Intelligent Parametric Optimization of Building Atrium Design: A Case Study for a Sustainable and Comfortable Environment

1
School of Architecture, Southeast University, Nanjing 210096, China
2
Center for the Built Environment, University of California, Berkeley, CA 94720, USA
3
College of Environmental Design, University of California, Berkeley, CA 94720, USA
4
College of Civil Engineering, Hunan University, Changsha 410082, China
*
Author to whom correspondence should be addressed.
Sustainability 2023, 15(5), 4362; https://doi.org/10.3390/su15054362
Submission received: 8 February 2023 / Revised: 25 February 2023 / Accepted: 27 February 2023 / Published: 28 February 2023
(This article belongs to the Special Issue Green Buildings in Urban Areas)

Abstract

:
Building atrium design is crucial to maintaining a sustainable built environment and providing thermal comfort to occupants. This study proposes a parametric framework to optimize the atrium’s geometry for environmental performance and thermal comfort improvement. It integrates the parametric design, performance simulation, and multi-objective optimization in the Rhino and Grasshopper platform to realize automatic optimization. The atrium’s well index, shape ratio, volume ratio, position index, and inner interface window-to-wall ratio were set as optimized factors. For the optimization objectives, useful daylight illuminance (UDI), energy use intensity (EUI), and the discomfort time percentage (DTP) were chosen as metrics for the measurement of daylighting, energy use efficiency, and thermal comfort, respectively. Moreover, a geometry mapping method is developed; it can turn atrium shape into rectangular profiles. Thus, the framework can apply to general buildings. To validate the effectiveness of the proposed framework, an atrium optimization case study is conducted for a villa in Poland. According to the optimization results, the performance of the compared three objectives are improved by 43.20%, 15.52%, and 3.89%, respectively. The running time for the optimization is about 36 s per solution, which greatly reduce the human and time cost compared to the traditional working method.

1. Introduction

1.1. Performance-Based Atrium Design

As the central space of public buildings, the atrium is a living space that has the characteristics of publicity, artistic expression [1], and environment adaptability [2,3]. With the advent of green building design, the atrium design has become a key component to maintaining a sustainable built environment and providing thermal comfort for occupants. Atrium plays an important role for a building, such as the source of natural ventilation, which can help improve thermal comfort, a buffer space to reduce energy consumption by introducing daylight into the core space of the building [4]. Architects began utilizing the atrium for environmental benefits in the conceptual design stage. However, due to the lack of multi-disciplinary collaboration and relevant operable tools, the atrium design still primarily relies on architect’s design experience, which cannot maximize its environmental performance. Since the atrium plays a significant role in the geometric design of a building, it is crucial to ensure that its design is sufficiently guided from an environmental performance perspective, as earlier decisions related to the building’s geometry can significantly reduce the remaining design space, and determine the environmental improvement potential [5].
Performance-based atrium design requires integrated comprehensive simulation and optimization of various quantifiable performances of atriums [6]. Compared with the conventional design method, which mainly focuses on the atrium’s space and function [7], the performance-based design focuses more on environmental effects at the early stage. Atrium designs are modeled, analyzed, using numerical methods, and ultimately introduced through passive design strategies to better respond to environmental conditions. The most common way for architects to optimize atrium designs is to manually adjust the forms and simulate them iteratively, which is time-consuming and labor-intensive. Moreover, manual adjustments rarely meet the requirements of comprehensive building environment improvement; they are hard to reach the best solution, as they rarely cover all the deformation possibilities of the building design in the conceptual design stage. Therefore, an intelligent and automatic method which can integrate multiple performance simulation and optimization is urgently needed to guide the atrium design for environmental performance improvement.

1.2. Parametric Design for Atrium Performance Optimization

To get rid of the disadvantage of manual adjustment, many studies combine the parametric design methods with building performance optimization, which can effectively locate the optimal design solutions by iterating the performance simulation and getting feedback from simulation results. Through parametric design, atrium geometry can be defined by specific variables and related geometric calculation deformation methods [8]. It can automatically obtain new variants as the variables change during the optimization process. An optimization process involves iterating these variables and following particular constraints to find the minimum or maximum value of certain optimization objectives [9]. As indicated by existing studies, the most important geometric elements which affect environmental performance are (1) atrium roof shape and its fenestration [10], (2) characteristics of atrium size and shape [11], (3) atrium façade design walls [12], and (4) window-to-wall ratio (WWR) of the atrium [12]. To conclude, the atrium’s type, size, shape, and WWR are the most critical factors in terms of geometric perspectives that directly influence environmental performance, including daylight and wind, as well as thermal comfort [13]. Despite parametric design’s ability to automate atrium remodeling and optimization, most research objects are still related to atrium prototypes, usually rectangular blocks. Some studies have also been conducted for specific cases, usually defining the limitations and methodology based on the current building’s atrium characteristics. A parametric method that can construct the geometry system of the building atrium in different buildings is still absent in the current academia.
For the objectives of the atrium performance optimization, daylighting has attracted the most research attention among the multiple environmental performances. Ghasemi et al. [8] determined the appropriate geometrical sizes for vertical top-lit atriums by examining the impact of atrium width and clerestory height on daylighting environment. Li et al. [14] used an annual dynamic simulation method and metrics to study the impact of building height on daylight performance in atrium buildings. Energy consumption is also considered as one of the most important purposes for performance-based atrium design [5]. Jaberansari et al. assessed the impact of the ratio of the atrium to the total building area on the energy-saving performance in a semiarid climate [15]. Ding et al. investigated the influence of the spatial geometric parameters of glazed atrium on building energy consumption [16]. In addition, the atrium temperature can be too high in summer and too low in winter, so it is necessary to ensure the thermal environment [17,18]. Wu et al. [19] examined the temperature environment of various shapes and geometries of atriums in buildings under various conditions. A summary of the main design variables, objectives, and methods found in recent studies is given in Table 1.
The scientific gap of the state-of-art research mainly lies in three aspects:
  • Most of these studies focus on the effects of atrium design on daylighting environments and energy consumption, while occupant’s thermal comfort is rarely integrated. The interactions between multiple objectives are neglected in the building atrium design exploration process [22]. The traditional manual optimization method is often time-consuming and labor-extensive, and is unable to balance different building performances. Thus, a multi-objective optimization approach should be applied, integrating multiple simulation engines and optimization methods to evaluate and optimize the atrium design for comprehensive environmental performance benefits and thermal comfort.
  • Although parametric performance optimization adopts flexible modeling methods which overcome the advantages of manual optimization method, most of these parametric researches only optimize several design parameters due to the difficulty in defining the complex geometry calculation method. These parameters are often in fragmentation and can hardly fully build the parameter system that covers the most important geometric characteristics of the atrium. Hence, a complete and effective parameter system should be developed to fully express the geometric features of the atrium, thus making the results of the atrium design exploration more diverse and valuable.
  • Current parametric performance optimization researches are primarily conducted using ideal atrium prototypes, where the buildings are assumed to be orthogonal cubes. However, the building and the atrium may have more complex and irregular shapes in the actual design practice. Those research methods based on ideal rectangle prototypes or specific cases are tailor-made, and thus cannot be generalized and applied to various building atriums. The above-stated problem is the reason why performance optimization is rarely used in building geometry design. Therefore, it is impactful to develop and integrate more geometry calculations and geometry adaptive methods in the atrium performance optimization, making them applicable to general buildings, and achieving a high level of automation and intelligence.

1.3. Aim and Work of This Research

Based on the scientific gaps stated above, the aim of this study are listed below:
  • Integrate multiple simulation engines to include daylighting, energy consumption, and thermal comfort in an automatic multi-objective optimization process of atrium design for a comprehensive sustainable and comfortable built environment.
  • Construct a complete geometric parameter system that can fully represent atrium characteristics, and develop the corresponding parametric geometry calculation and geometry adaptive method, which can be applied to different buildings. Thus, the research framework can be widely applicable in various actual design occasions.
  • Investigate the interaction relationship between daylighting performance, energy consumption, and thermal comfort in the atrium design. Furthermore, extract the relevant atrium design rules, and explore the relationship of different geometric parameters to environmental performance.
In addition to achieving comprehensive cross-platform simulations and optimizations based on these three objectives, this study also stands out due to its parametric modeling method for geometry systems, which can be applied to general buildings, even with complex and irregular shapes, to efficiently search for the optimal design solutions during optimization process. It also has high generalization capability in dealing with the related atrium performance optimization problems.
We connect the building performance simulation, parametric design, and multi-objective optimization under the Rhinoceros [23] and Grasshopper [24] visual programming environment, and validate and analyze the result through a case study in Poland. For the sake of studying the effects of geometric characteristics of the building atrium, the building atrium discussed in this study is open on the top, so the impact of the related skylight design is not be included. This paper is organized as follows. Section 2 demonstrates the methods in detail. A case study is carried out in Section 3, especially targeting the complex and irregular building atriums in actual practice, to validate the applicability and optimization efficacy of the proposed framework. Section 4 and Section 5 are the discussion and conclusion parts, respectively.

2. Materials and Methods

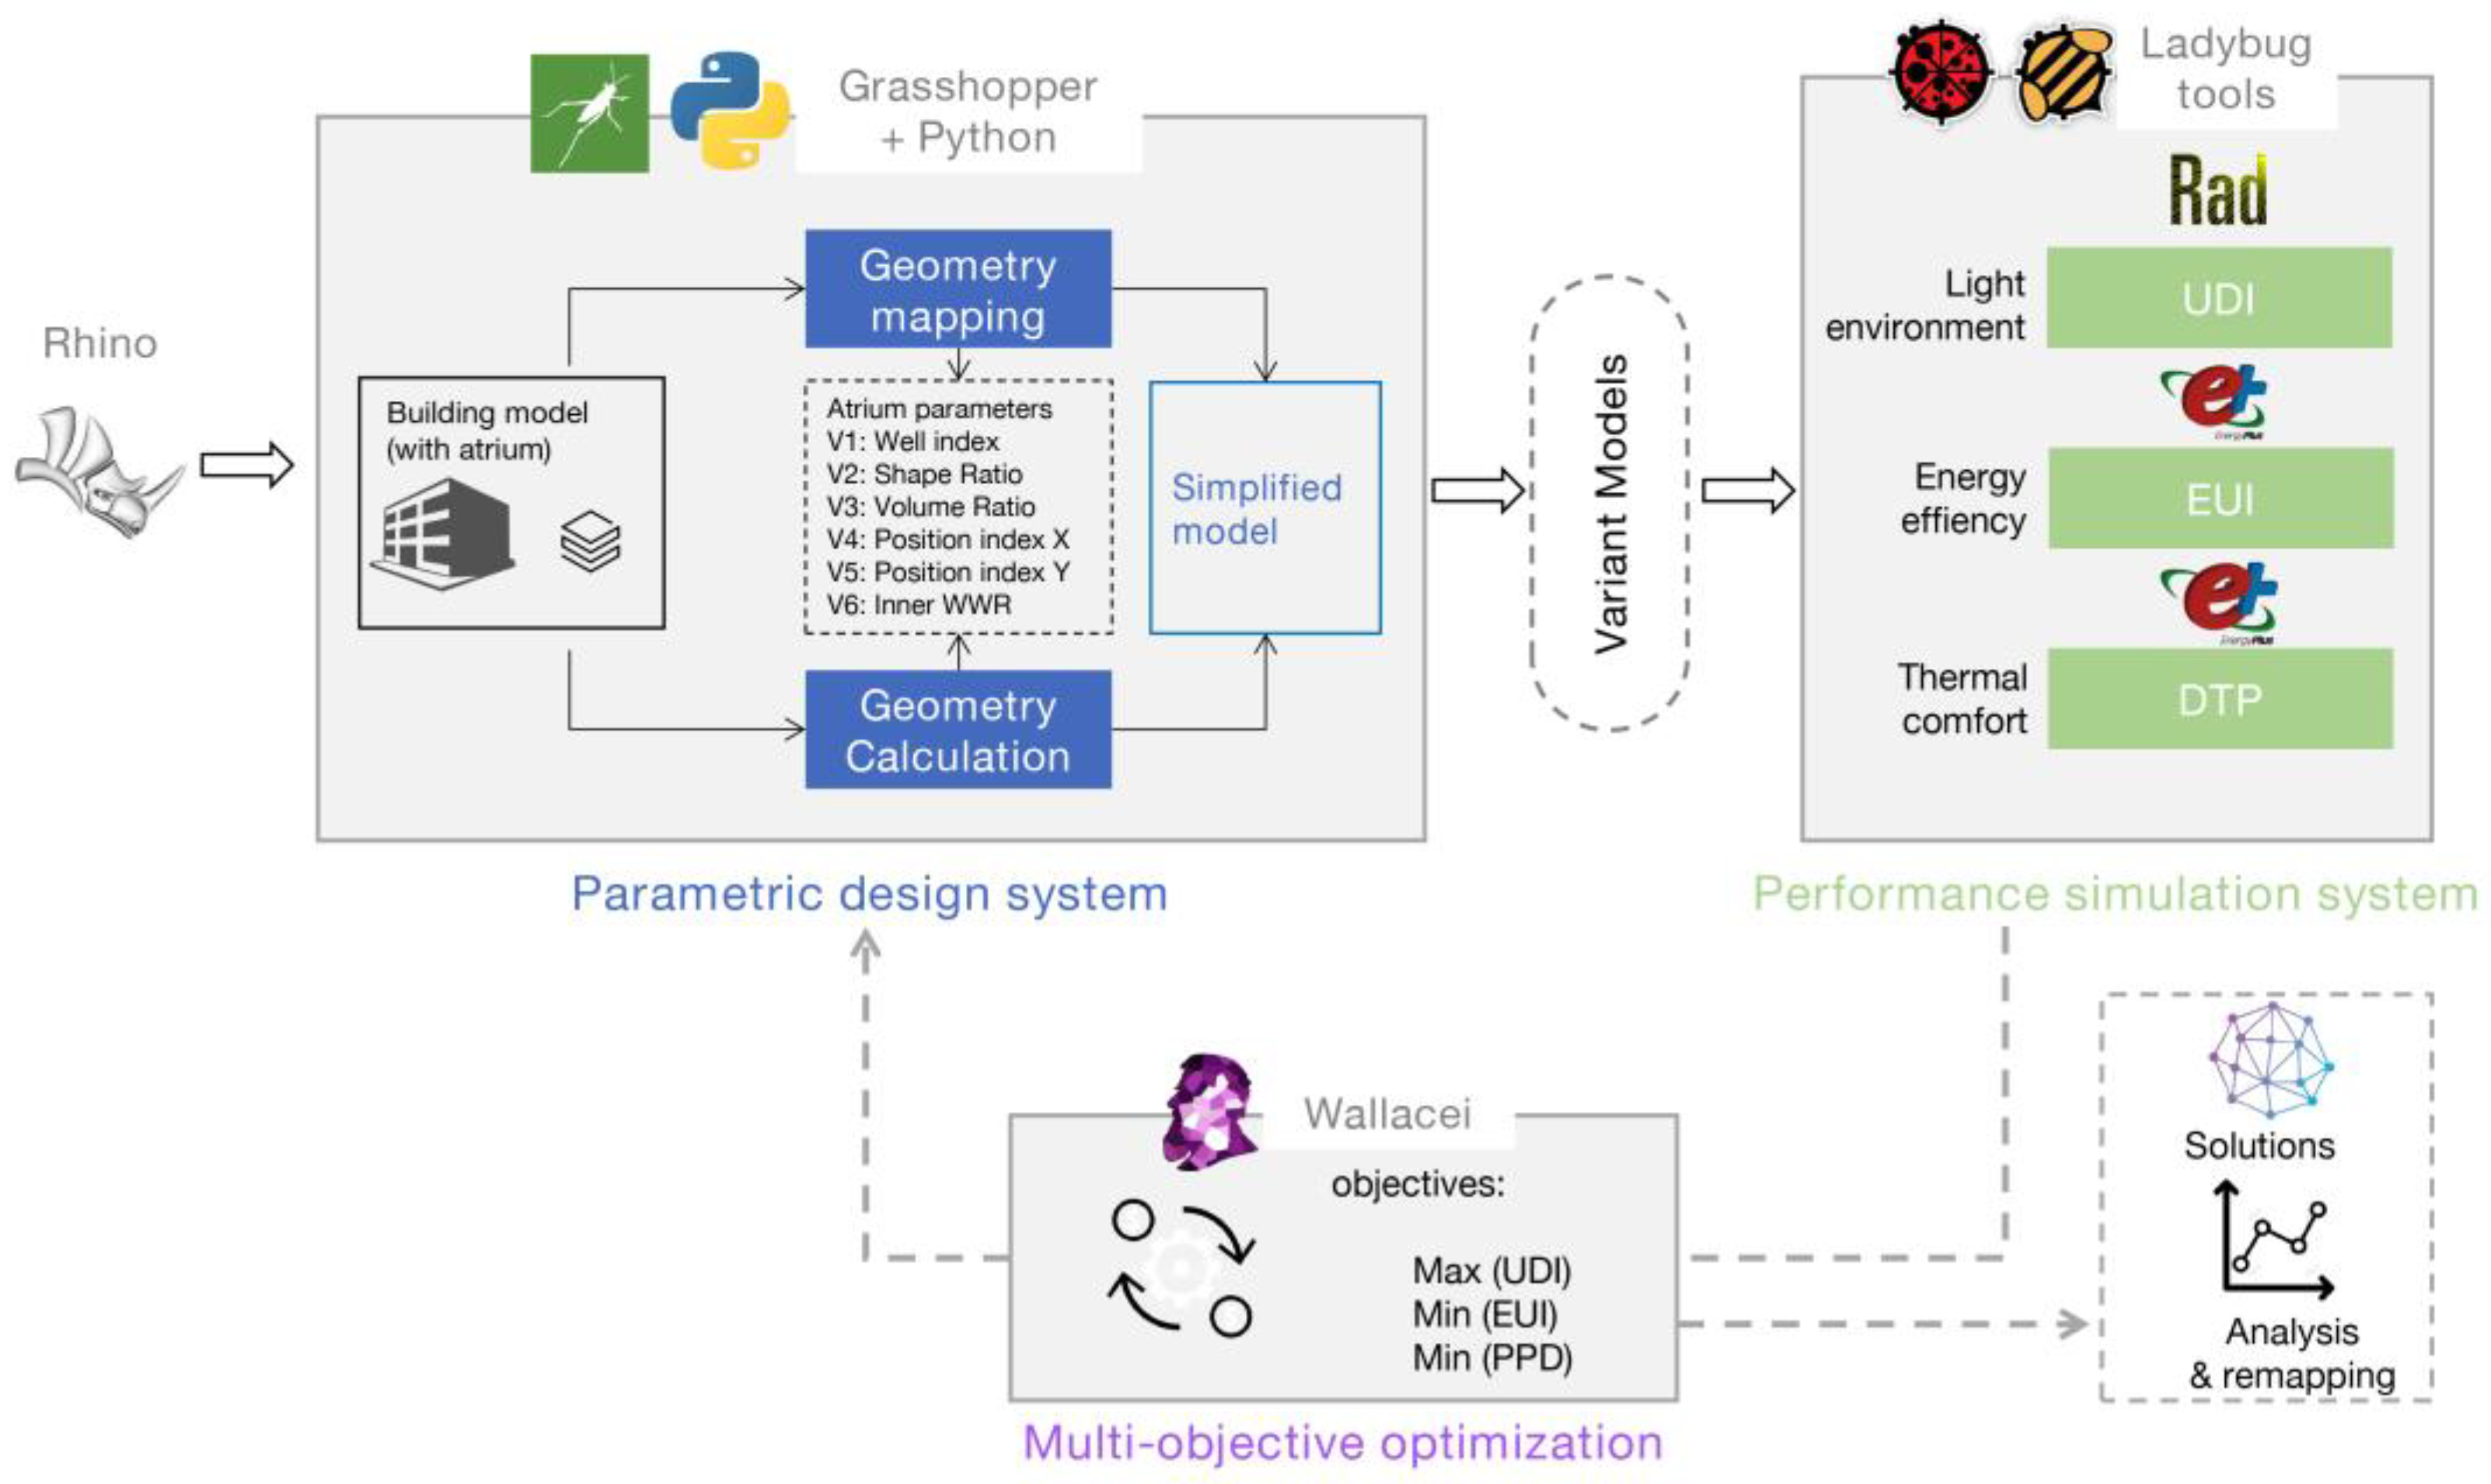
2.1. Overall Workflow

The overall workflow is identified in Figure 1, which mainly consisted of three parts. Firstly, the parametric design system, in this part, the origin building was loaded in the Rhinoceros platform and pre-processed by Grasshopper and Python programming. The defined geometry mapping and calculation methods turned the atrium into a rectangular shape. A simplified model was obtained with the changed atrium profile. The related atrium geometric parameters, such as the well index, shape ratio, volume ratio, position index, and inner interface window-to wall ratio were be calculated according to the simplified model. They were used as the optimized parameters in the following optimization step. Secondly, the simplified model was used for multiple simulations regarding lighting, energy efficiency, and thermal comfort by using Radiance [25] and EnergyPlus [26], which was called by the Ladybug tools (Ladybug and Honeybee) [27]. For the performance objectives, Useful Daylight Illuminance (UDI) was selected to represent the daylighting condition; Energy Use Intensity (EUI) was used to indicate the overall energy efficiency; Discomfort Time Percentage (DTP) was set for occupant’s thermal comfort evaluation. In the third step of multi-objective optimization, we adopted the genetic algorithm, which is activated via calling the Wallacei [28] to realize. The atrium geometric parameters were set into optimization genes, the simulation results (performance metrics) were set as optimization objectives, and iteratively searched for the best combination of the atrium geometric parameters to obtain the optimal solutions. Lastly, once all optimization generation was completed, the optimized solutions were selected and analyzed. To verify the optimization effectiveness, the optimized solution was remapped to its original shape and compared with the original buildings by re-simulation results. Section 2.2, Section 2.3 and Section 2.4 demonstrate these three parts in detail.

2.2. Parametric Framework of Atrium Design

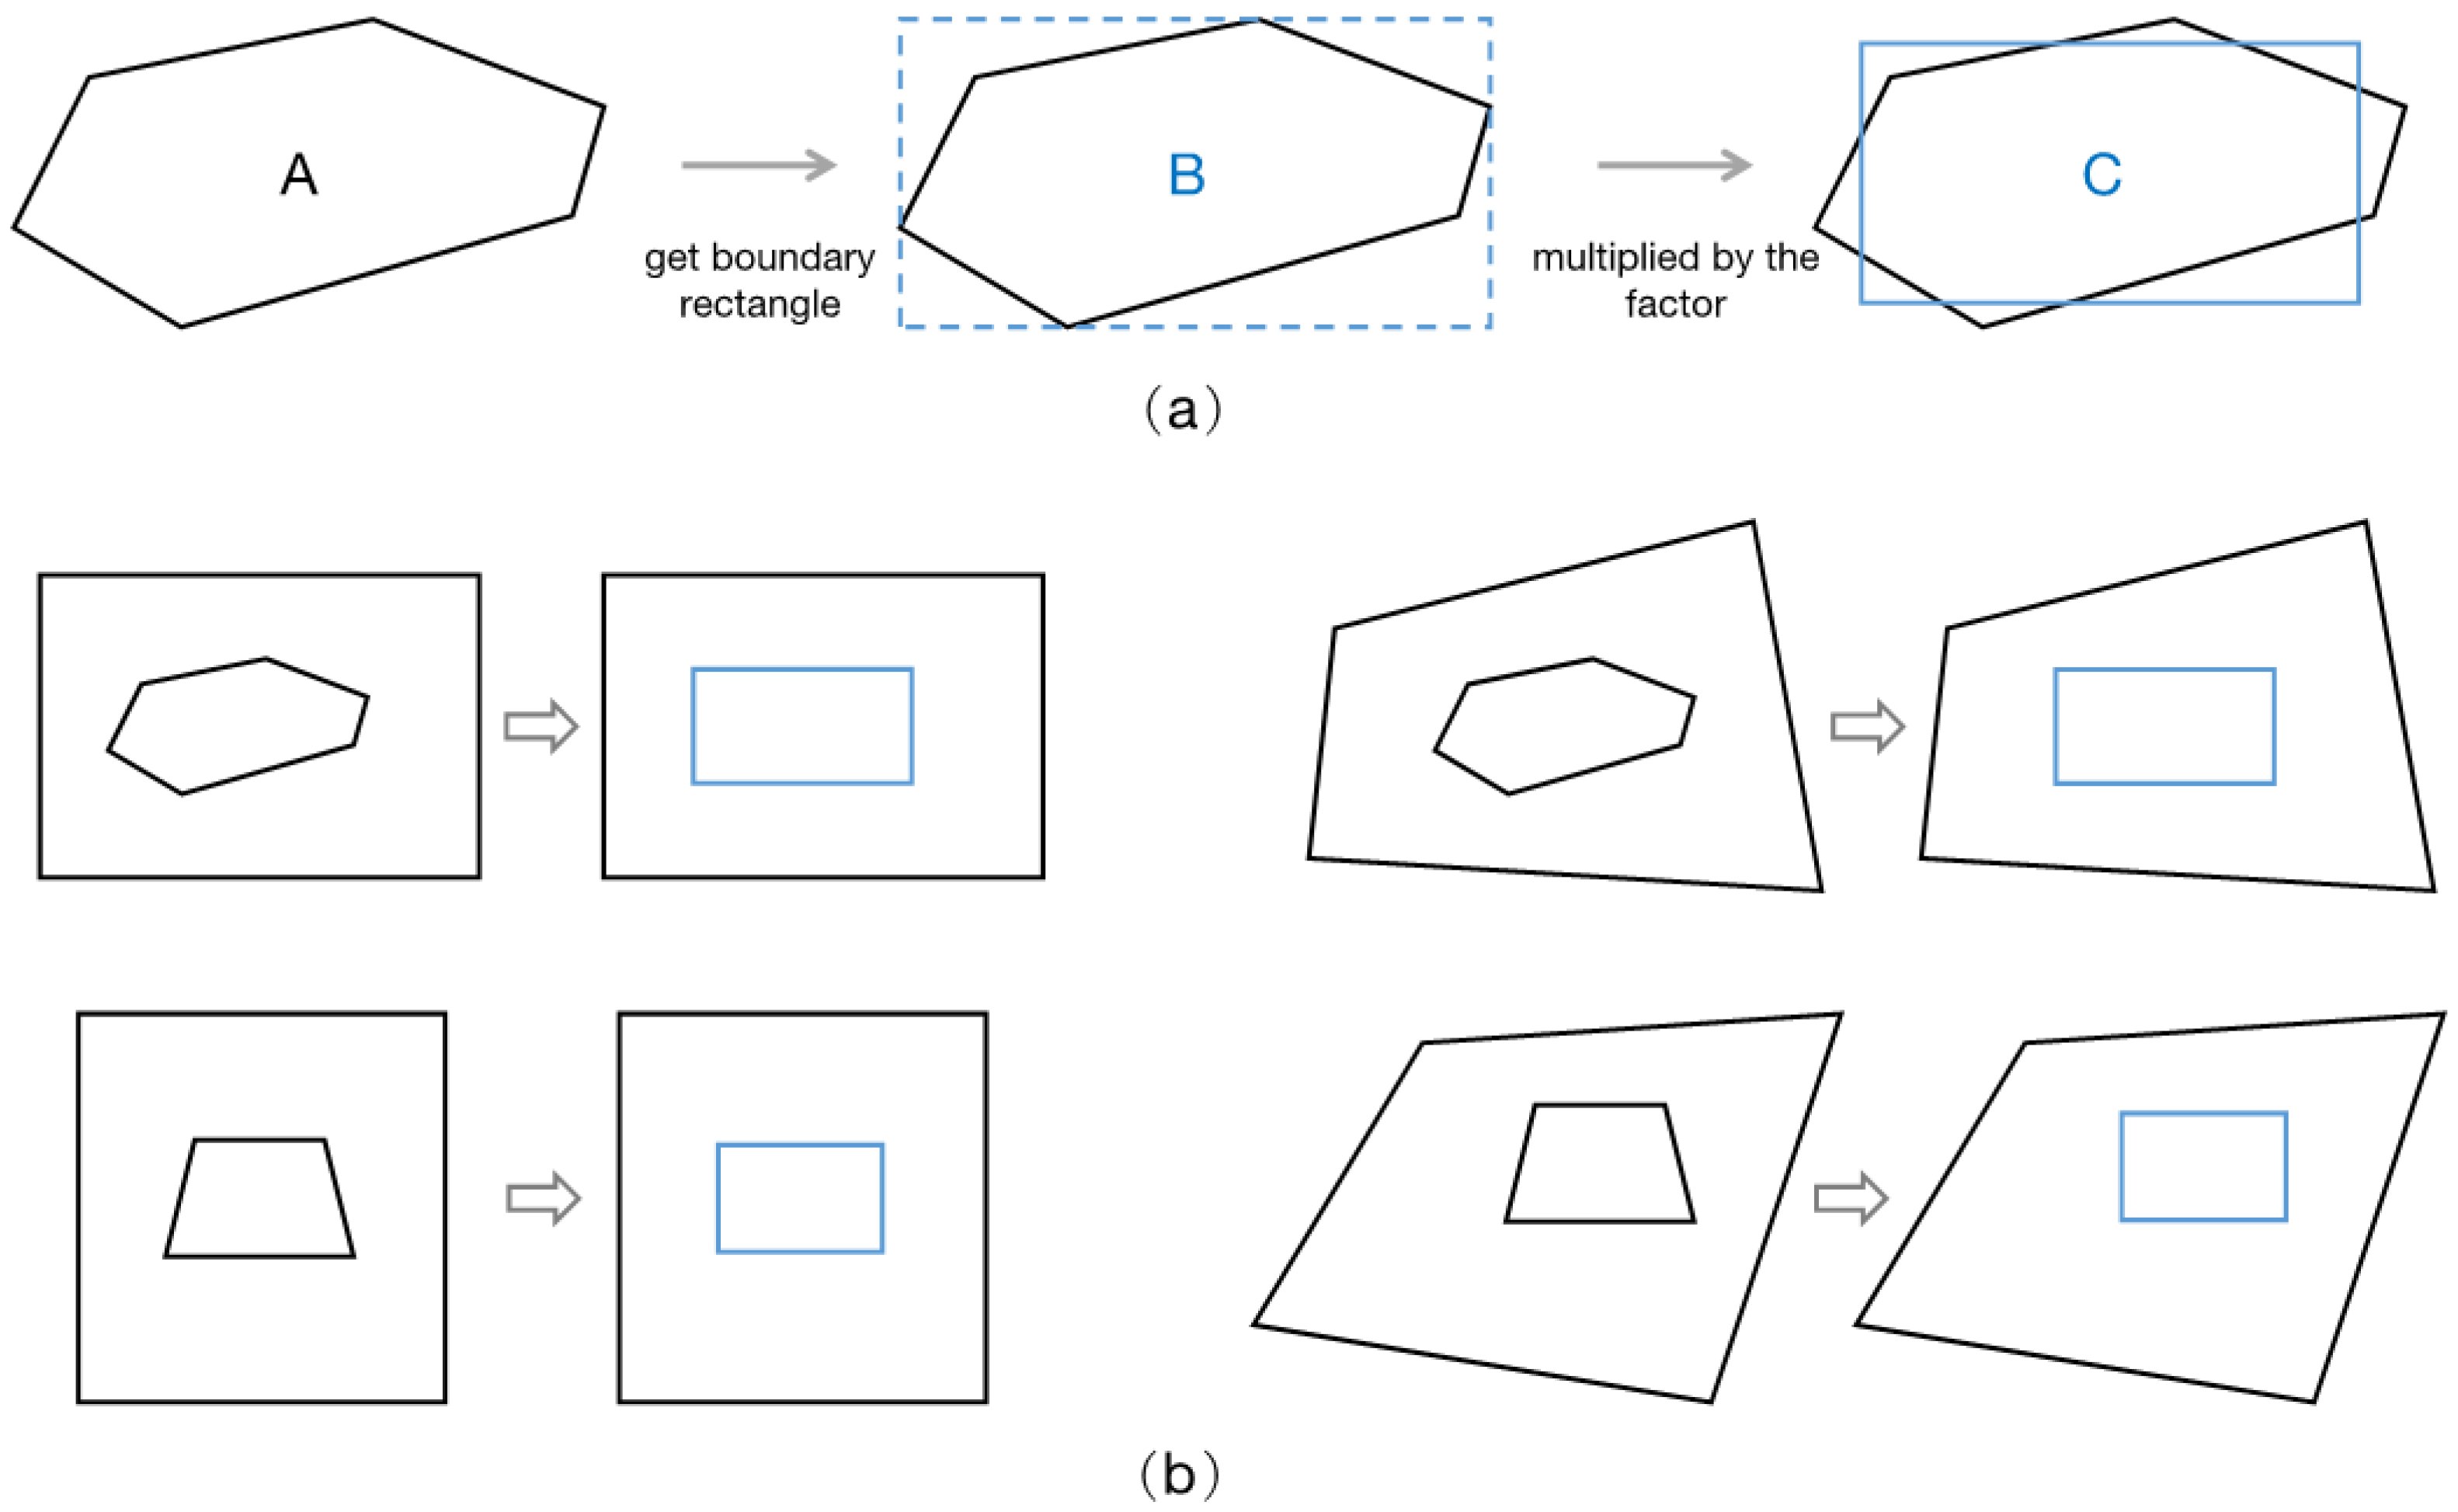
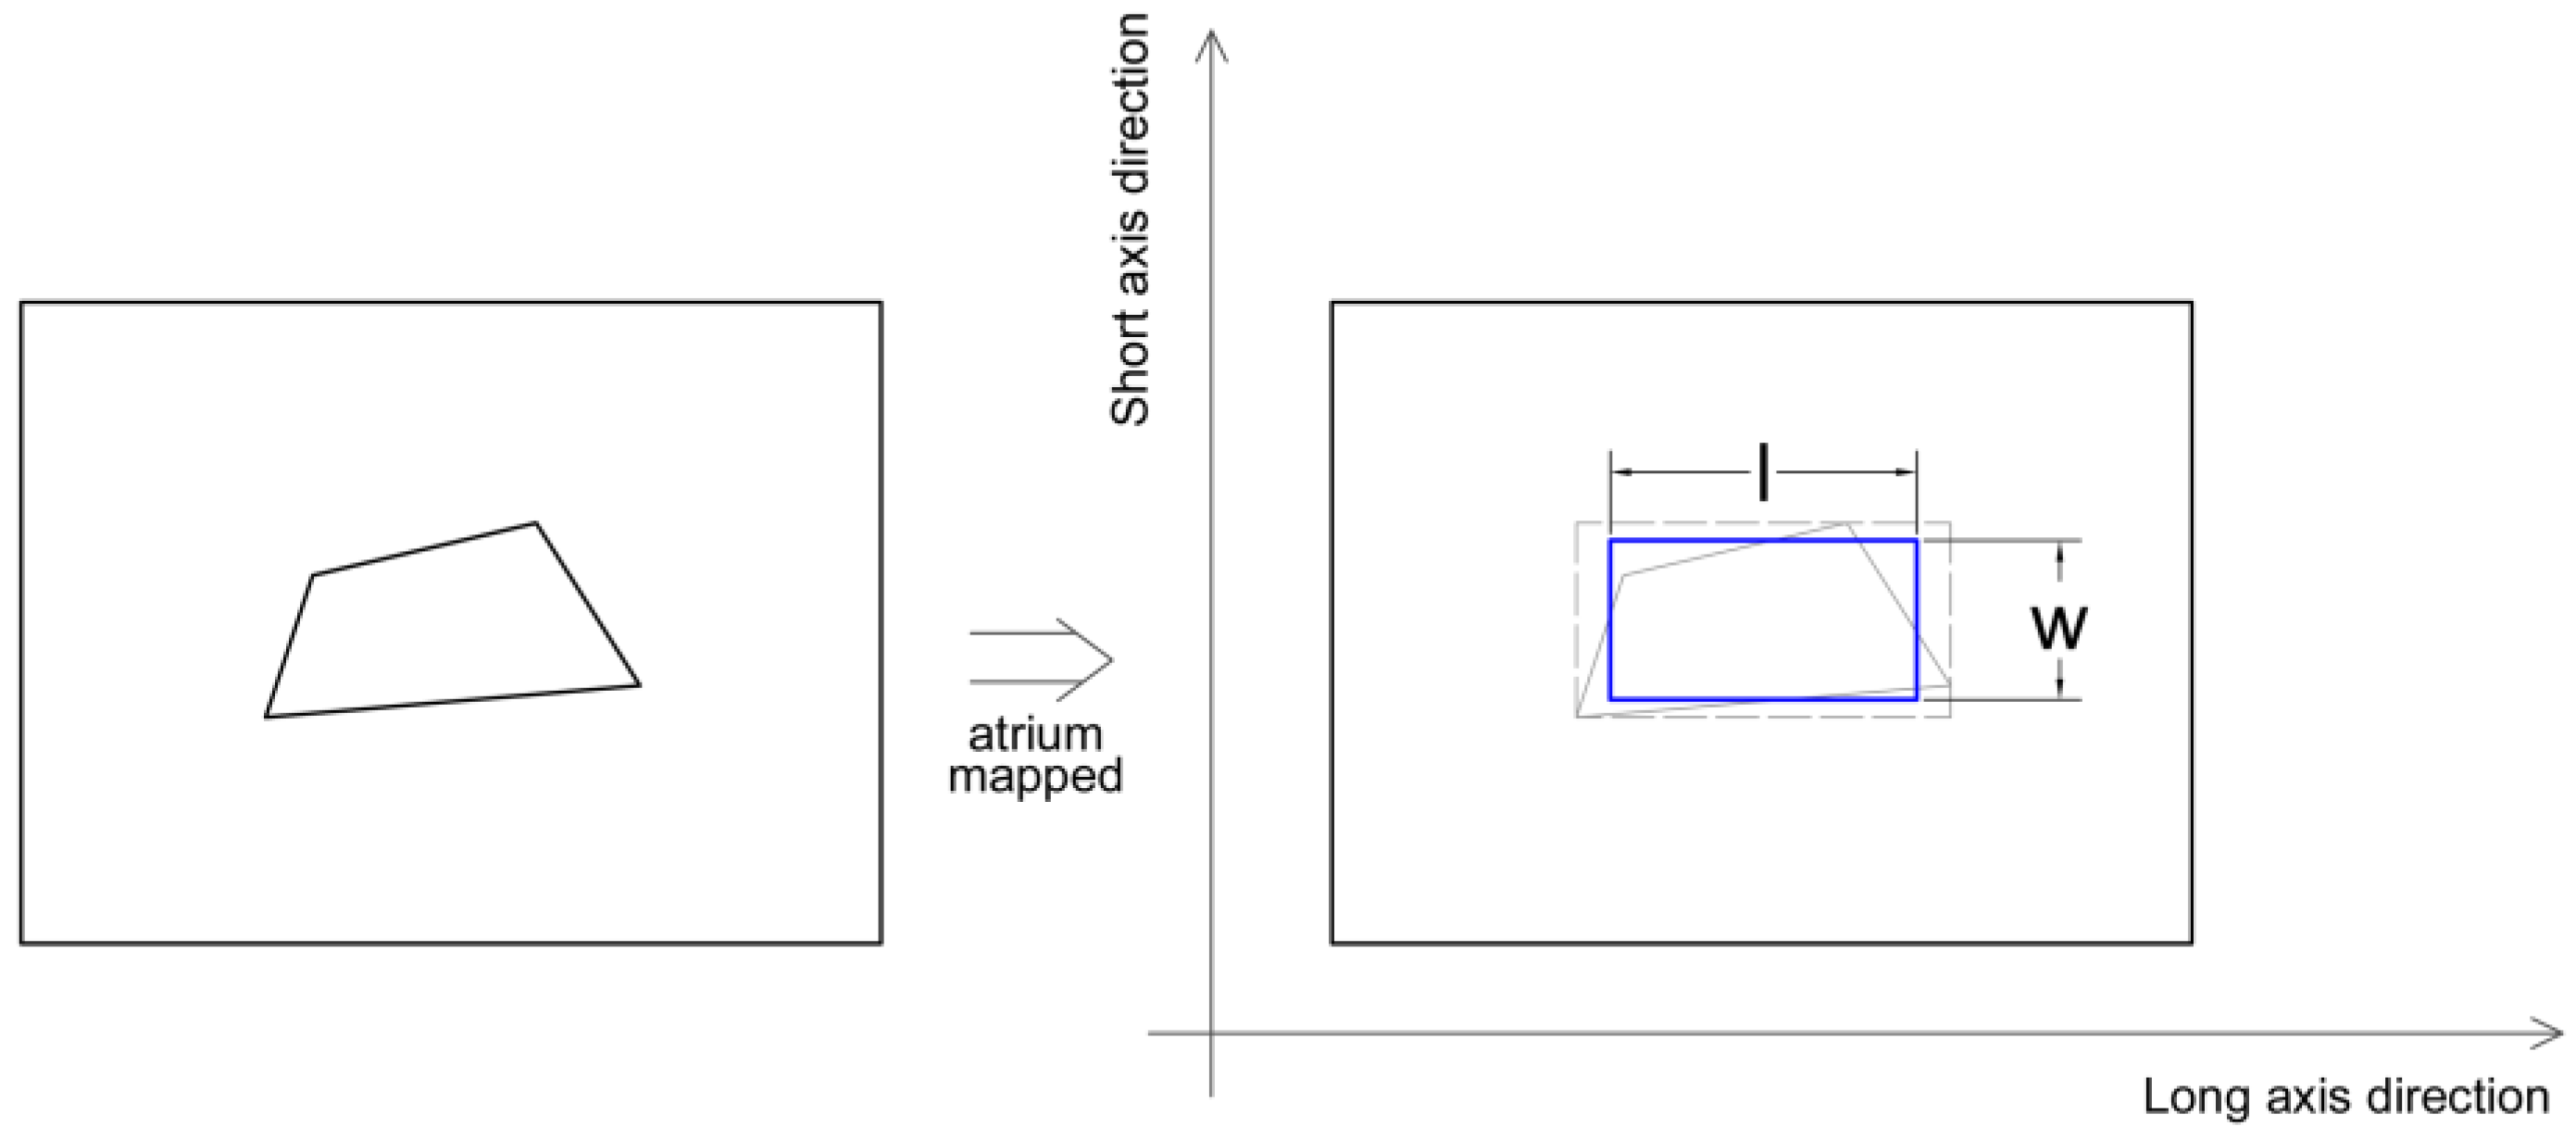
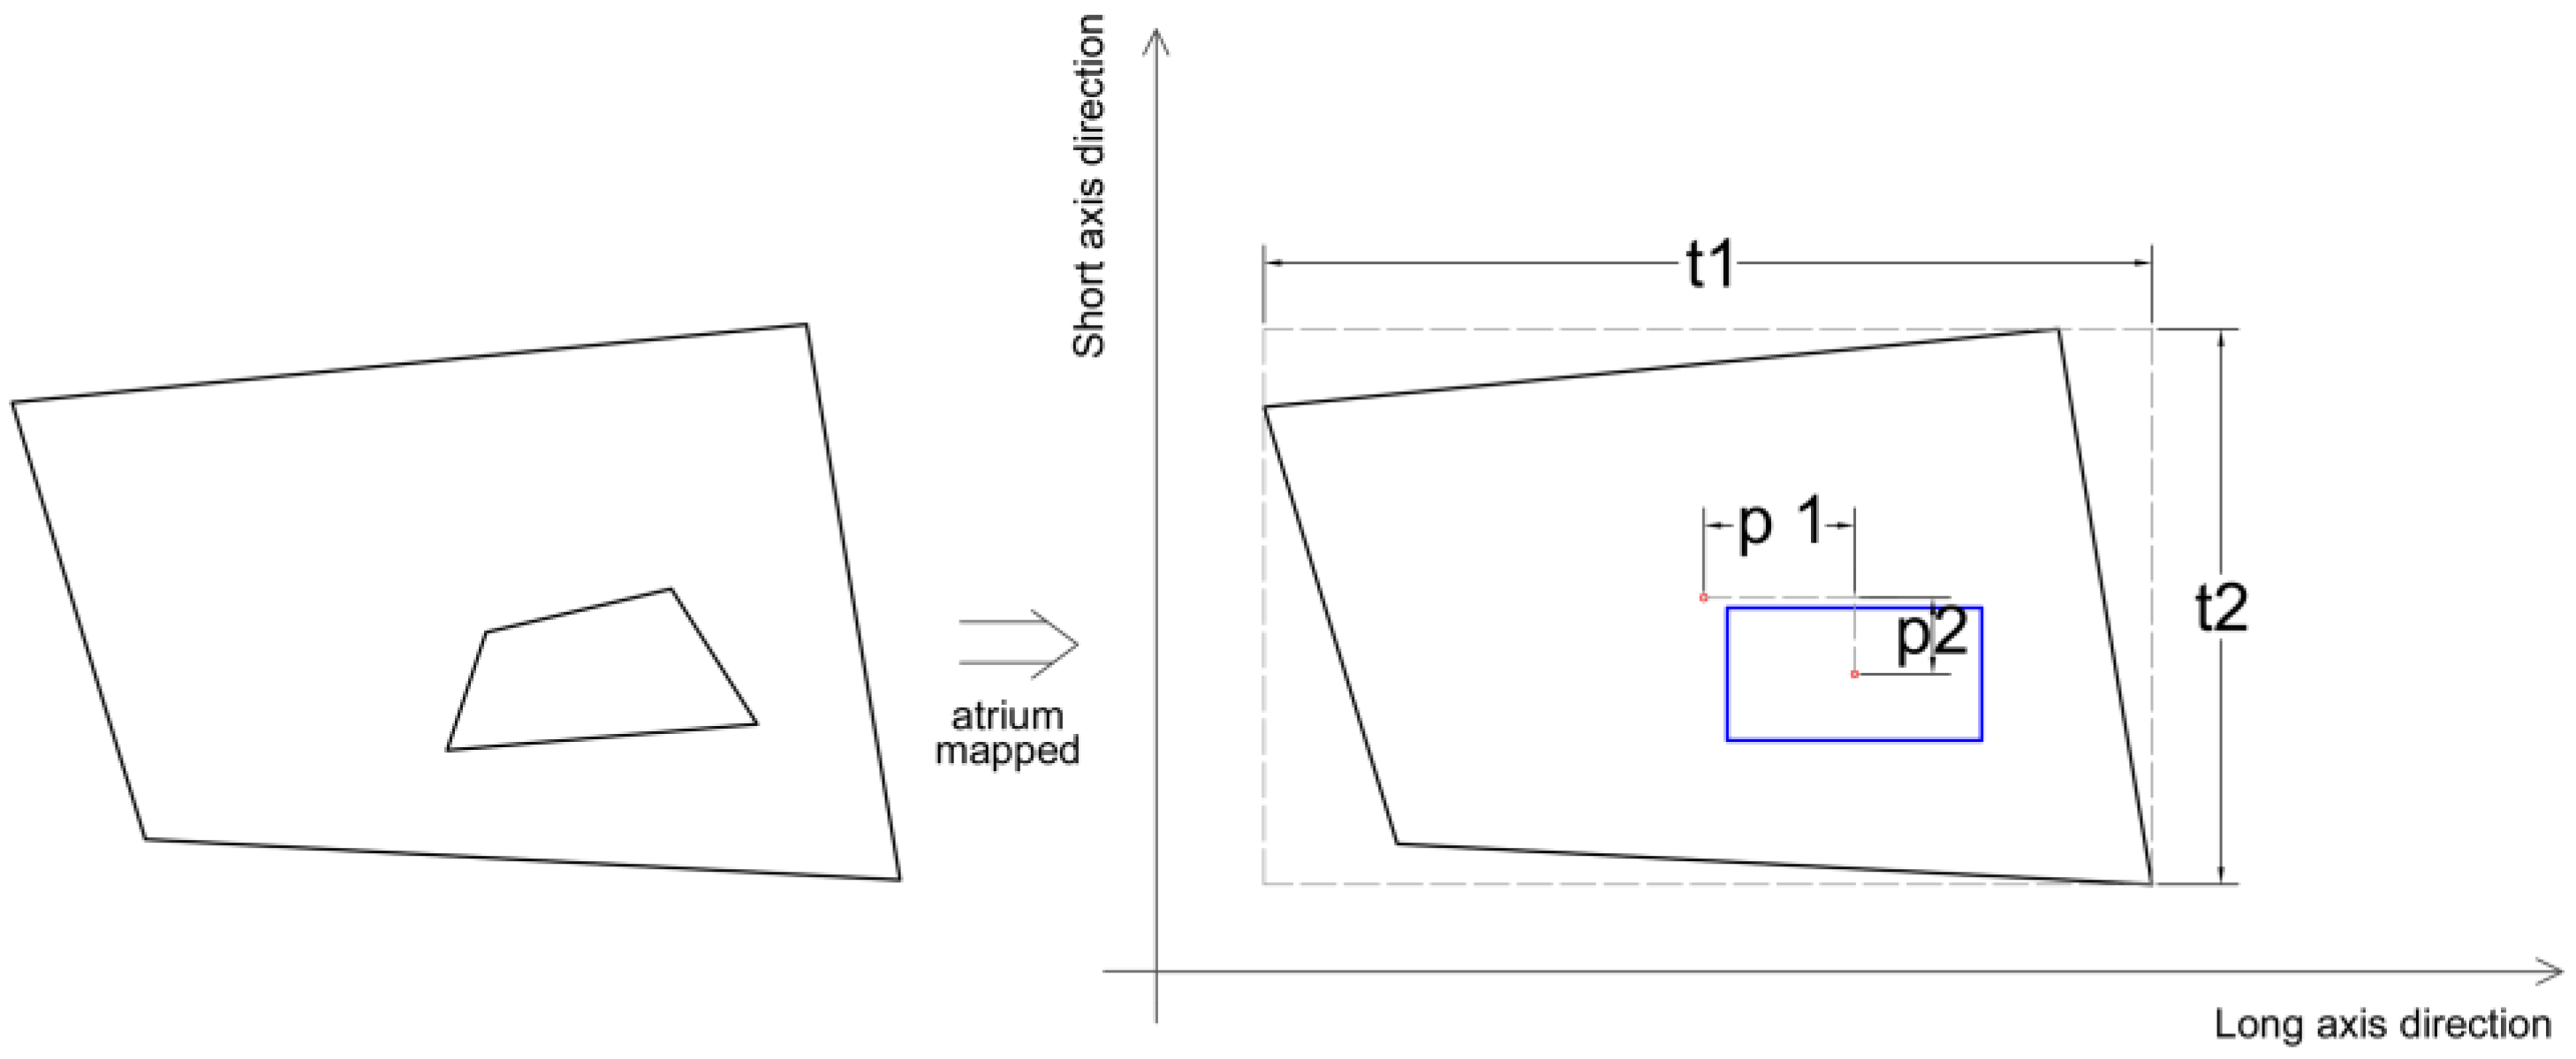
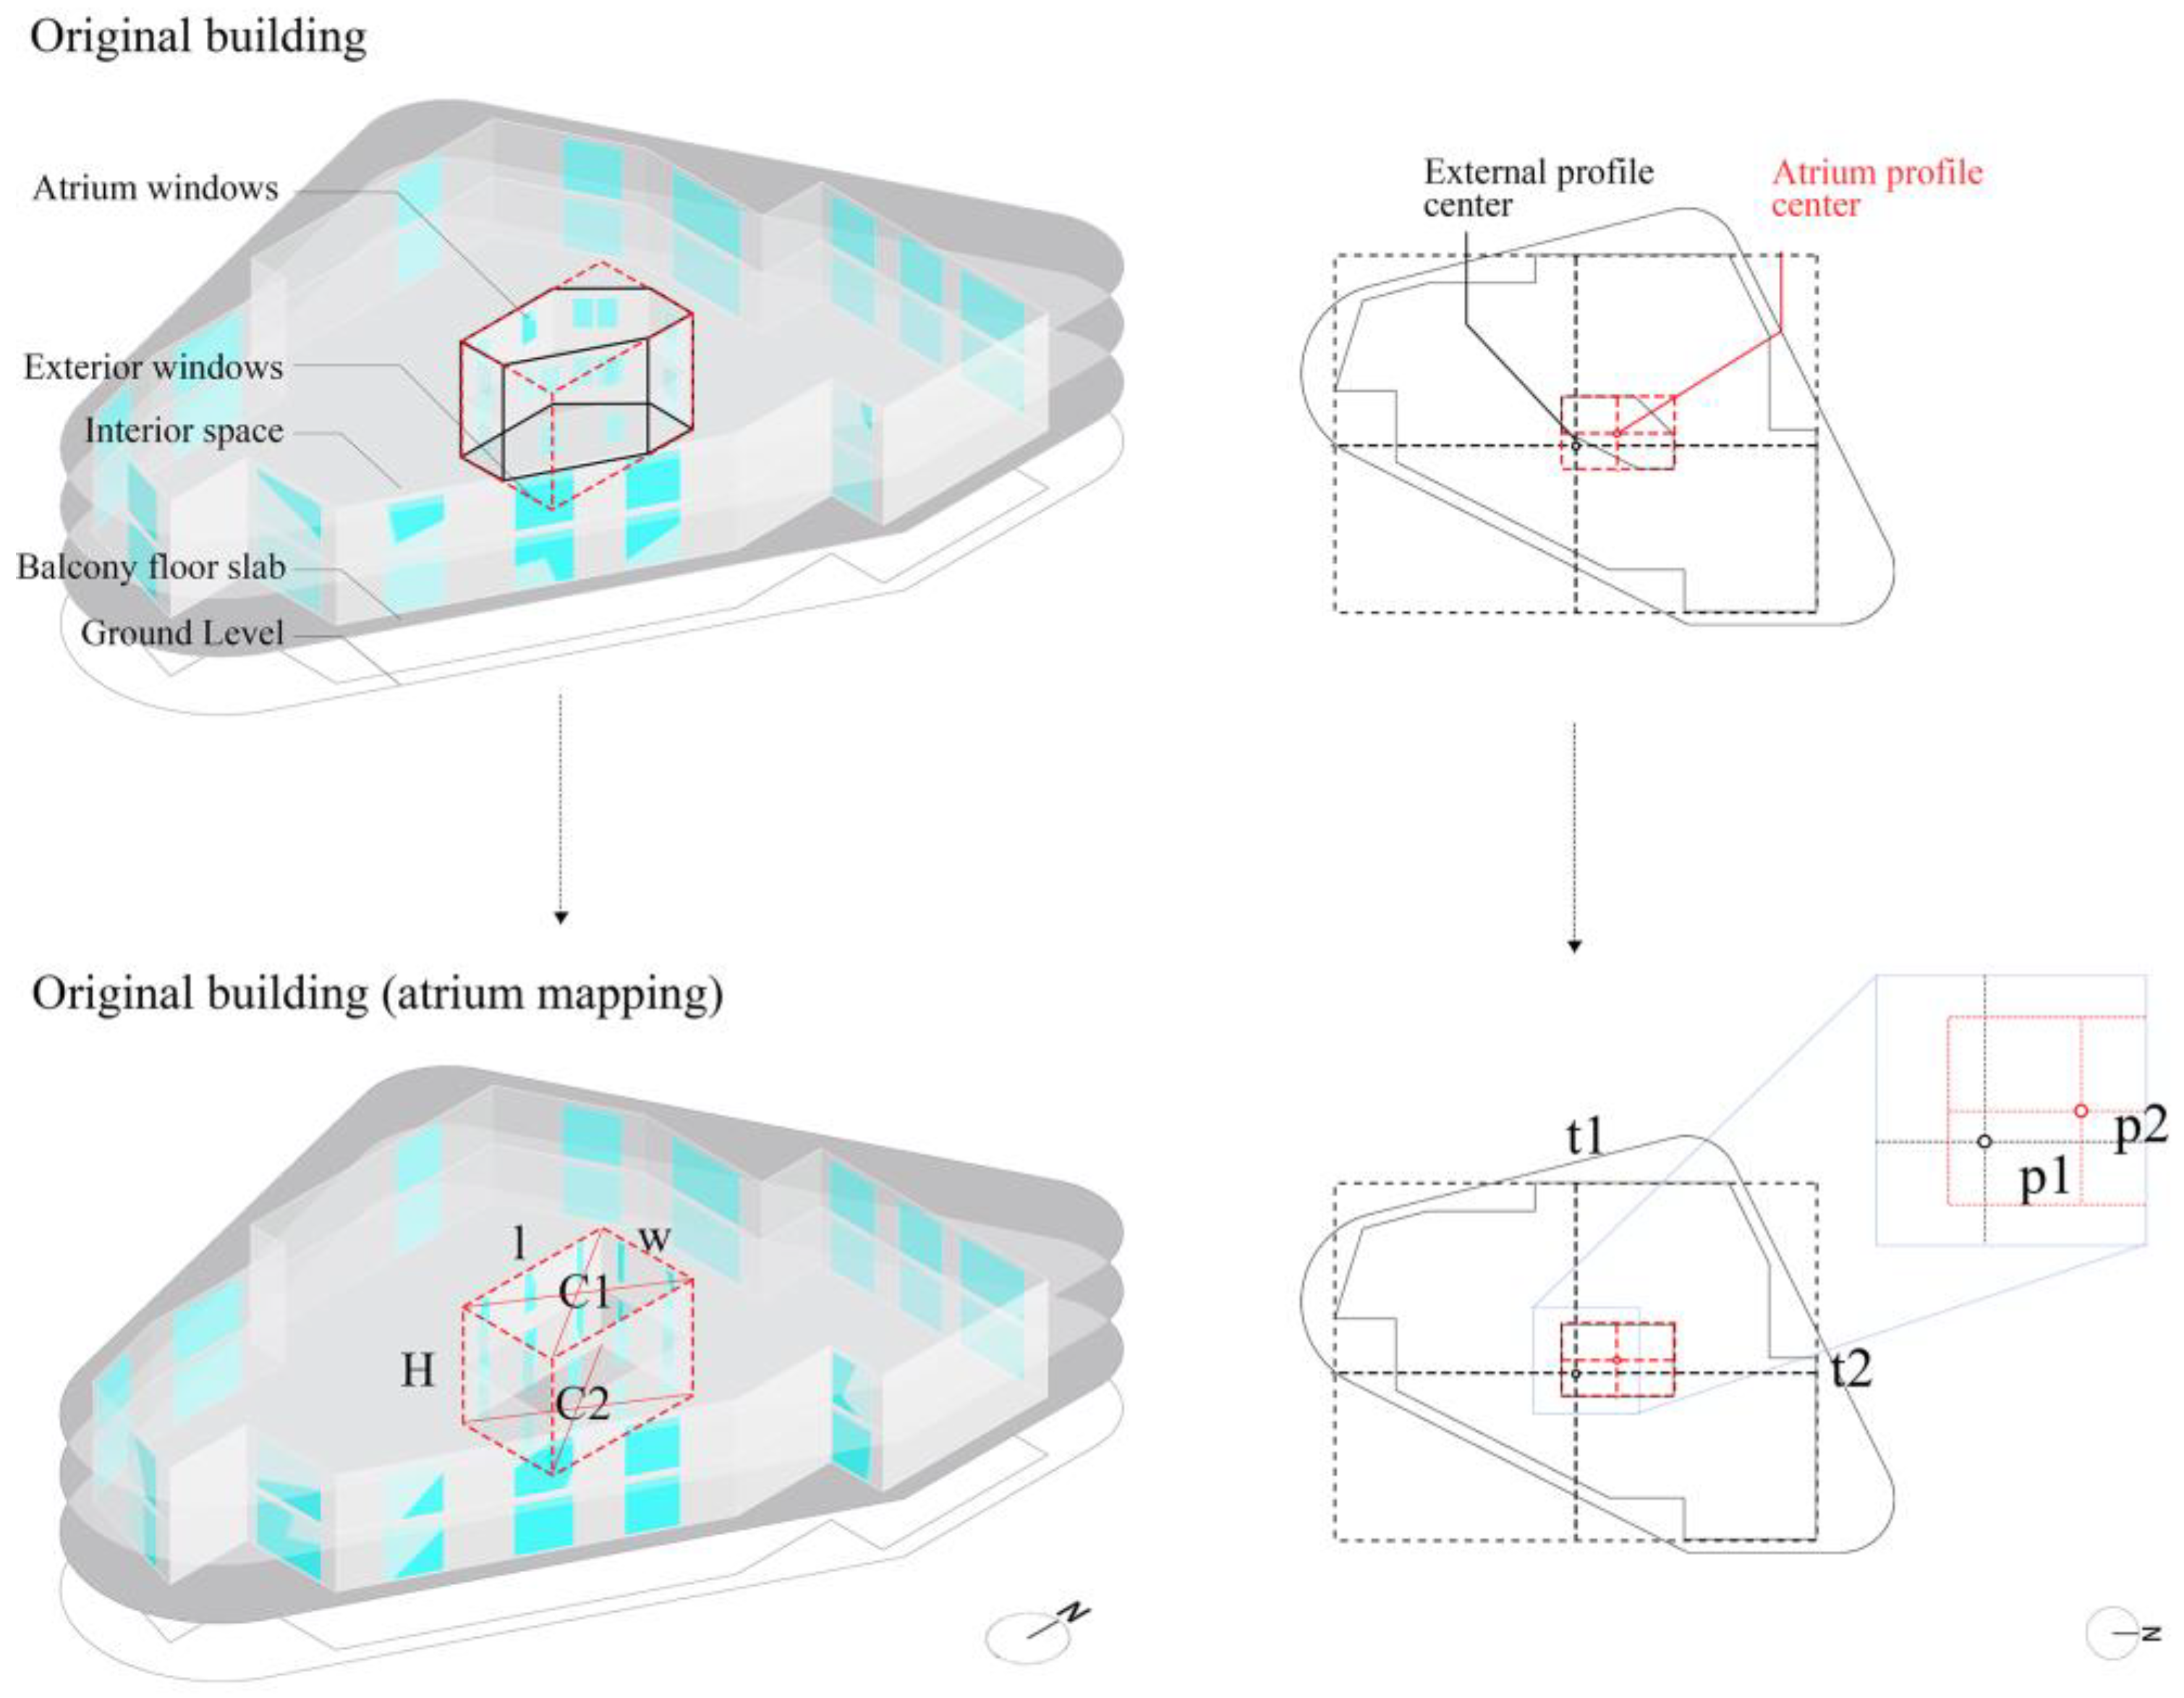
2.2.1. Geometry Mapping Method

In order to analyze the geometric characteristics of the atrium design on multiple environmental performances, atriums with a rectangular profile are ideal for representing their size, shape, and position in a clear and efficient way. Many existing studies adopt the same assumption. Nonetheless, as many atriums in practice often have various shapes. The mapping method is needed to be developed to convert any atrium profile into a rectangular shape, thus we only need to study the rectangular atrium’s effect in the following research. With the above-stated mapping method, the optimization method can be used for different buildings.
The boundary rectangle is used to solve the problem of finding a proper rectangle for any profile. As shown in Figure 2a, A represents the origin atrium profile. By traversing all its vertices, to obtain the maximum and minimum values of x and y coordinates, which can be recorded as Xmin, Xmax, Ymin, and Ymax. The coordinates of the boundary rectangle are then obtained by (Xmin, Ymin), (Xmin, Ymax), (Xmax, Ymax), and (Xmax, Ymin). The boundary rectangle is set as B in Figure 2a. Moreover, to make the conversion consistent in size, a scale operation is taken. Using the area(A)/area(B) scale ratio, rectangle B will be scaled by this ratio, keeping the center in the same position, resulting in the map result C. This mapping method is also applicable to the building floor plane. In Section 2.2.2, the position indexes need to be calculated after mapping the atrium plane and the building floor plane.
With this mapping method, any atrium profile can be represented as a rectangle, which reserves the size and position characteristics of the original one, but will make the following geometry optimization work easier. Figure 2b shows the building plans converted after the atrium mapping operation. The optimized atrium can be re-mapped to its original shape characteristics once the optimization is complete.

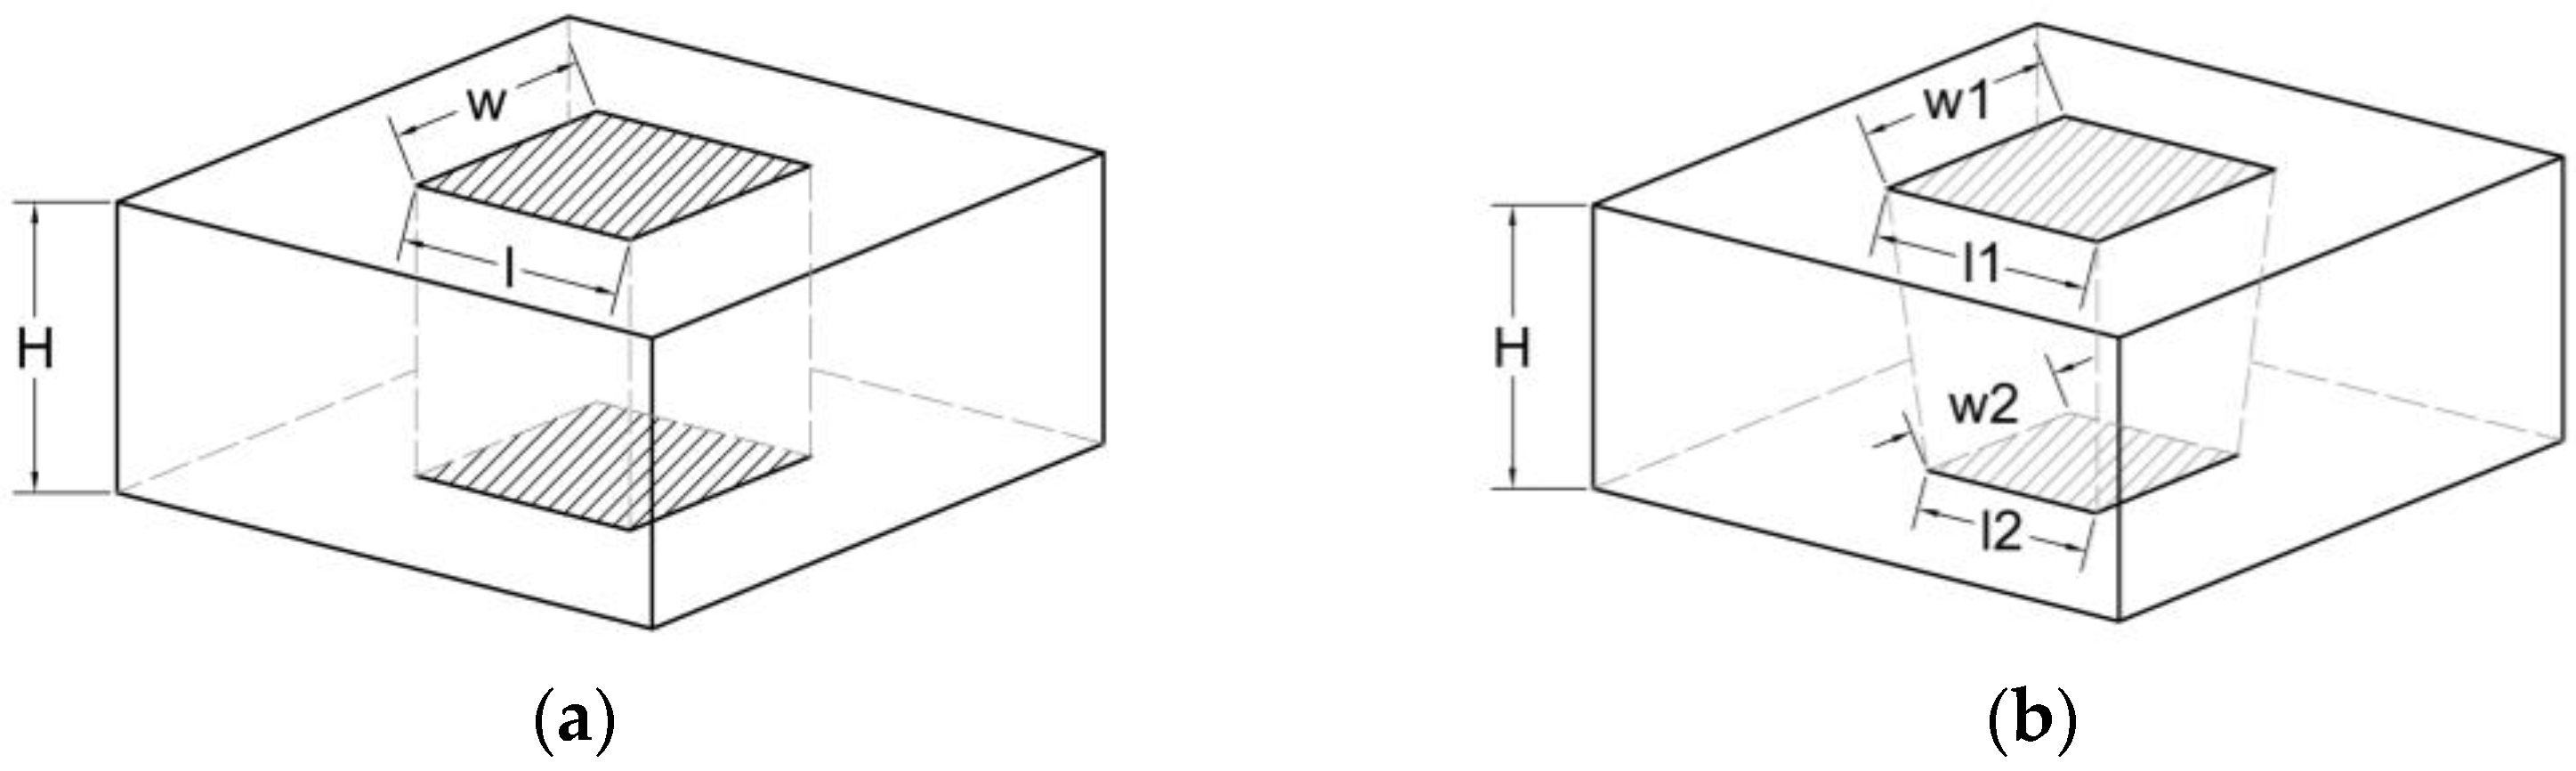
2.2.2. Optimized Factors

Based on the map result, the atrium has a new rectangular profile. In order to optimize its geometry design and search for the optimal shape for better environmental performance. Several parametric factors will be extracted from the atrium geometry, including the well index, shape ratio, volume ratio, and position index. These factors fully cover the main characteristics of the atrium geometry in the conceptual stage of building design. They are set as the optimized parameters in the following optimization stage. Different combinations of these factors will result in different geometry variants.
  • Well index
Architects usually plan the atrium according to its function and other design goals, and the atrium size can become an important feature to distinguish it. The size of the atrium may lead to huge differences in the thermal and daylighting environment. The well index (WI) demonstrates the relationship of the atrium size to the building height, which is widely used in related research. The WI can be calculated by the height (H), the length (l), and the width (w) of the atrium. The atrium after geometry mapping with rectangular profiles are used to calculate the WI value by using Equation (1) (Figure 3a). As the atriums’ volume shape is also considered in this research, the calculation method needs to be adapted when the top and bottom planes of the atrium are different. The average values of ‘w’ and ‘l’ are used in the formula, as shown in Equation (2) and Figure 3b.
WI = H   × ( w + l ) 2 × w × l
WI = H × ( w 1 + l 1 + w 2 + l 2 ) ( w 1 + l 1 ) × ( w 2 + l 2 )
The WI is selected as the optimized factor to represent the atrium’s main characteristics. If the WI is higher, it shows the narrower and deeper atrium space, and its result is less daylight in lower floors. A lower WI indicates that the atrium is wider and shorter in its dimension related to the height, and the daylight is annoying.
  • Shape ratio
As many researches have addressed, the atrium’s shape will influence its environmental performance in a significant way. Guan et al. [21] came out with Atrium width-to-depth ratio (FDR), and others list the atrium type as the optimized parameters [13,14,15,20]. We select the shape ratio to determine the atrium’s shape characteristics in the 2D plan, defined by the mapped rectangle profile, namely the ratio of its length to width, recorded as SR in the abbreviation. The definition method is shown in Figure 4. The length parallel to the long axis direction is set as ‘l’, while the length parallel to the short axis direction is set as ‘w’.
SR = w/l
  • Volume ratio
Aside from the atrium’s geometric characteristics in the 2D plan, the atrium volume also significantly affects the built environment. Commonly, the atrium will have different sizes of the top and bottom planes, which sometimes introduce more daylight into the building, or reduce energy loss. We set the volume ratio as the circumference of the atrium top plane compared to the circumference of the bottom plane, recorded as VR in the abbreviation. As atrium volume changes may result in changes to the building floor planes, additional geometry calculation methods need to be involved when the VR changes.
VR = (w1 + l1)/(w2 + l2)
  • Position index
The position of the atrium plane relative to the building plan is also essential to the built environment, especially affecting the distribution of light and thermal. Various studies reflect that the different positions of the long building atrium may also lead to different energy consumption [16,29]. With the method described in Section 2.1, we set the position index by comparing the relative positions of the rectangle obtained after mapping the atrium with that of the rectangle obtained after mapping the building plane. Calculate the proportion of the difference between the relative positions of the center points of the two rectangles, and record them as Position-index-X (PX) and Position-index-Y (PY), respectively. The definition method is shown in Figure 5. The lengths ‘p1’ and ‘p2’ marked in the figure do not represent the absolute length but have positive and negative values. The same direction as the long axis and short axis is positive, and the opposite is negative. Since the calculated rectangles may not be the same shape as the original ones, PX and PY ranges should be set according to the situation, in case the atrium will be outside the building boundary during the search process.
PX = 2 × p1/t1
PY = 2 × p2/t2
  • Inner interface window-to-wall ratio
As the atrium discussed in this study has an opening on the top, the inner facade of the atrium is the main interface for the atrium, which contacts the outdoor environment [16]. The windows on the atrium’s inner facade will significantly affect the lighting transmission and heat conductivity. Therefore, the Inner interface window-to-wall ratio was selected as the optimized factor, recorded as IWWR in the abbreviation.

2.3. Simulation Metrics

  • Useful Daylight Illuminance (UDI)
UDI, proposed by Mardaljevic in 2005 [30], is used to measure a building’s inside lighting environment. The metric indicated the percentage of time during the occupancy hours based on three illuminance ranges, 0–100 lux, 100–2000 lux, and over 2000 lux. The middle range can be viewed, as the indoor lighting environment is neither too dark nor too bright. The higher the UDI100–2000, the more sustainable the lighting environment is, and the less the electrical illuminance cost will be. Simulation results over the whole year are calculated using Radiance, and we use the average UDI100–2000 value to evaluate the overall effects.
To invalidate the optimized factors’ effects on the UDI100–2000 simulation result, Table 2 takes the position index as an example and shows a set of simulation results with different PX and PY factors for a rectangular block building with an atrium, which only has one side of lighting. The position of the atrium may affect the daylighting distribution, thus leading to the difference in UDI100–2000. The lighting sensor points are located on the working plane, at a height of 0.75 m. With the different values of PX and PY, the UDI100–2000 simulation result shows somewhat different in Table 2.
  • Energy Use Intensity (EUI)
The daylighting environment may be improved by having more open space. To some extent, it may increase the energy loads for maintaining a pleasant indoor environment. Thus, energy efficiency must be considered to balance the built environment and its sustainability. For evaluating the energy efficiency of the built environment affected by atrium design, EUI (kWh/m2) is used. It is mostly calculated by adding the energy load of heating, cooling, and electric lighting, and then divided by the total building area [31]. In this study, the EUI is calculated by calling the EnergyPlus engine, and the ideal loads air system was set as the HVAC system. For buildings in different climate zones, the EUI calculation period can be selected according to its heating and cooling season, and then use the average value to represent the energy efficiency of the period.
Table 3 takes the WI as an example to reflect the effects of the optimized factors on the EUI results. The result shows a significant influence of the WI on the whole year’s average EUI objective.
  • Discomfort Time Percentage (DTP)
In this study, for the thermal comfort simulation, a static comfortable model is adopted [32]. The Predicted Percentage Dissatisfied (PPD) index is chosen as the reference, which provides information on thermal discomfort or thermal dissatisfaction by predicting the percentage of people likely to feel too warm or too cool in a given environment [33,34]. The PPD metric is calculated based on the energy simulation result of the air temperature, mean radiant temperature (MRT), and relative humidity. The room air velocity is set as 0.1 m/s in the calculation. Due to the individual differences of the occupants, the recommended value for PPD is less than 20% for interior space, which is regarded as generally meeting the occupants’ thermal comfort needs [35,36]. To better describe the thermal comfort condition, we record the percentage that the PPD value is larger than 20% as the discomfort time percentage (DTP) as the simulation metric.
Table 4 takes the IWWR as an example to reflect the effects of the optimized factors on the DTP results. The result shows significant difference in the DTP when the IWWR varies.
Although these three above-mentioned simulation metrics can evaluate the comprehensive environmental performance of the atrium to some extent, including daylighting, energy efficiency, and thermal comfort, the simulation period and settings can be modified according to the climate conditions and research focus.

2.4. Multi-Objective Optimization Configuration

As part of the prototype, the genetic algorithm (GA) was selected as the core optimization algorithm. Because of its unique data form and structure, the GA has strong adaptability and more significant efficiency advantages when dealing with large-scale data. Besides, GA has been widely used in architectural multi-objective optimization research due to its high efficiency and accuracy [37]. The optimization in this study will be solved by a Wallacei plug-in. It is a genetic optimization engine that allows users to run evolutionary simulations in Grasshopper.
The parametric factors (WI, SR, VR, PX, PY, and IWWR) are imported as genes, and the simulation metrics are set as the objectives. Since Wallacei uses NSGA-2 [37] to automatically control the design variables and constantly find the minimum of the three objectives, the objective to be maximized (UDI) needs to be multiplied by -1. The objective can be concluded as:
ƒUDI(x) = Min (−1 × UDI)
ƒEUI(x) = Min (EUI)
ƒDTP(x) = Min (DTP)
where, UDI is the annual average value of UDI100–2000; EUI is the average value of EUI in heating season; DTP is the average value of the DTP in non-heating season.

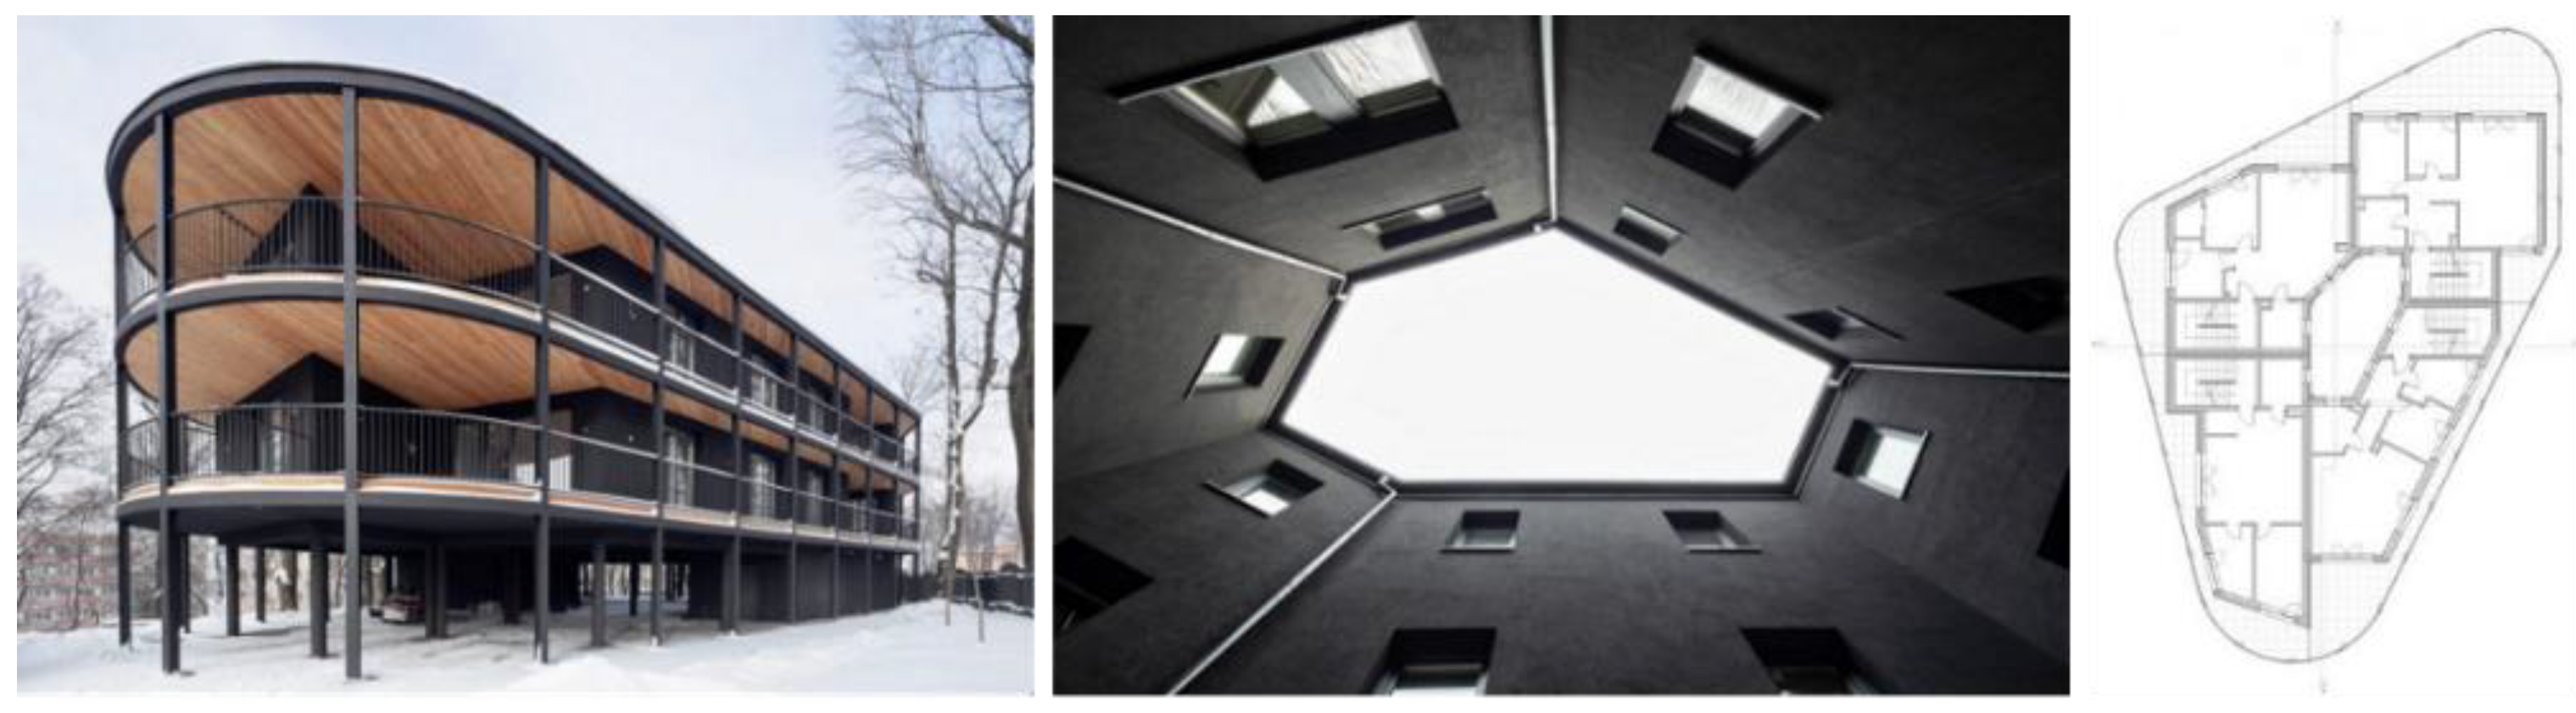
3. Case Study: Villa Reden in Katowice, Poland

3.1. Overview

The case study selected is a three-story residential building named Villa Reden located in Katowice, Poland. With a temperate, ocean-moderated humid continental climate (Köppen classification: Dfb/Cfb), Katowice has an average temperature of 8.2 °C, with a low of −2.0 °C in January and a high of 17.9 °C in July [38]. This climate usually has a frost-free period of 3–7 months, with hot weather that rarely lasts more than a week and long, cold winters [39]. The heating season is from October to April. Heating energy consumption is an important part of building energy consumption, and it is also the focus of various energy saving studies in this area. Due to the particularity of this weather, the thermal comfort of the occupants has also become a point worthy of attention. Therefore, the design of the building atrium in this area requires careful coordination of the need for good daylighting, comfortable indoor environment, and energy efficiency.
The building has an external profile along the shape of the plot, and a polygonal profile within it (Figure 6). The design of the atrium, including its shape, location, and cross-section, is primarily tailored to the layout of the residential units, and was not generated through simulation and optimization with a focus on optimizing the building’s performance. Therefore, the design of the atrium in this building has the potential to be optimized for more sustainable and comfortable environment.

3.2. Optimized Parameters

In preparation for the simulation and optimization, the main external shape features of the building were retained, focusing mainly on the parameters that determine the design of the atrium. The original shape and position of the windows on the exterior of the building were fully preserved (Figure 7). Since the first floor of the building is an elevated floor without living units, the first floor of the building was not considered in the model building, performance simulation, and optimization.
As outlined in the study’s method, the shape of the atrium in the plan was mapped as an external rectangle, and based on this, the form and position of the atrium were controlled by six design variables, including WI, SR, VR, PX, PY, and IWWR. The calculation method, initial values are shown in Table 5.

3.3. Simulation Settings

The daylighting and energy model used ‘MidriseApartment’ program based on this building’s function. The number of people per area was set as 0.025 ppl/m2. For the daylighting simulation, the testing grid size was 2 m × 2 m, and the lighting sensor was placed on the plane 0.75 m above the floor. The lighting schedule was set as ‘MidriseApartment Lighting’, and the supplementary artificial lighting required to achieve the target illuminance (300 lux) was exported.
In the energy simulation, we mainly considered the lighting, heating, and cooling energy consumption in this study. The lighting schedule of the energy simulation model is replaced by the result of the daylight simulation, so the reduction in the energy consumption by using natural daylighting is taken into consideration. As Poland has long and cold winter, occupants’ thermal comfort is much more affected by the climate control system being used in the winter. To better evaluate the energy efficiency and thermal comfort result of the atrium design, we divided the energy simulation period as the heating season with the HVAC system turns on and the non-heating season without running the HVAC system. The heating season for Poland starts from October to April. On this basis, the EUI is calculated based the heating season’s energy consumption. The average value of the EUI of this period is set as the optimization objective and recorded as the winter EUI (wEUI). The air-conditioner set points for the heating season are 20 °C (heating) and 25 °C (cooling). Meanwhile, the DTP is calculated with the energy simulation result for the non-heating season. The average value of the DTP of this non-heating period is set as the optimization objective, recorded as the summer DTP (sDTP). The indoor air speed is set as 0.1 m/s. The clothing level is set as 0.7 col, and the metabolic rate is set as 1.1 met for the thermal comfort simulation
All the preset conditions, simulation configuration and material properties are shown in Table 6.

3.4. Multi-Objective Optimization Settings

This case study used Wallacei as a MOO simulation tool, which provides an intuitive interface to set optimization parameters prior to the MOO simulation. For population parameters, Generation Size and Generation Count were set to 100 and 30, respectively, to ensure the coverage of Search Space and enough simulation generations. As for the algorithm parameter, the Crossover Probability was set to 0.9, the Mutation Probability was set to 0.1, the Crossover Distribution Index and Mutation Distribution Index were both 20, and the Random Seed was 1. The range and steps of the genes are shown in Table 7. The range of variables was set as large as possible to obtain a more extensive search space, while consideration was also given to avoid errors due to the atrium exceeding the building outline. With these six input genes, they will have 78 values, while the total size of incidental search space is 3.0 × 10⁶.
For the three optimization objectives in the case study, UDI, wEUI, and sDTP, three corresponding simulations were performed before each MOO simulation to ensure that the matching Gene and objective were used. In the Wallacei settings panel synchronized with the simulation, Standard Deviation Graphs, Parallel Coordinate Plots, and Objective Space were provided to help observe the progress of the MOO simulation and the effect on different optimization targets. This allows for the earlier detection of potential issues in MOO simulations.
The experiments were conducted in the case study section on a desktop computer with an Intel Core i9 10,900 K, 64 GB of RAM, and an NVIDIA GeForce RTX 3070 graphics card.

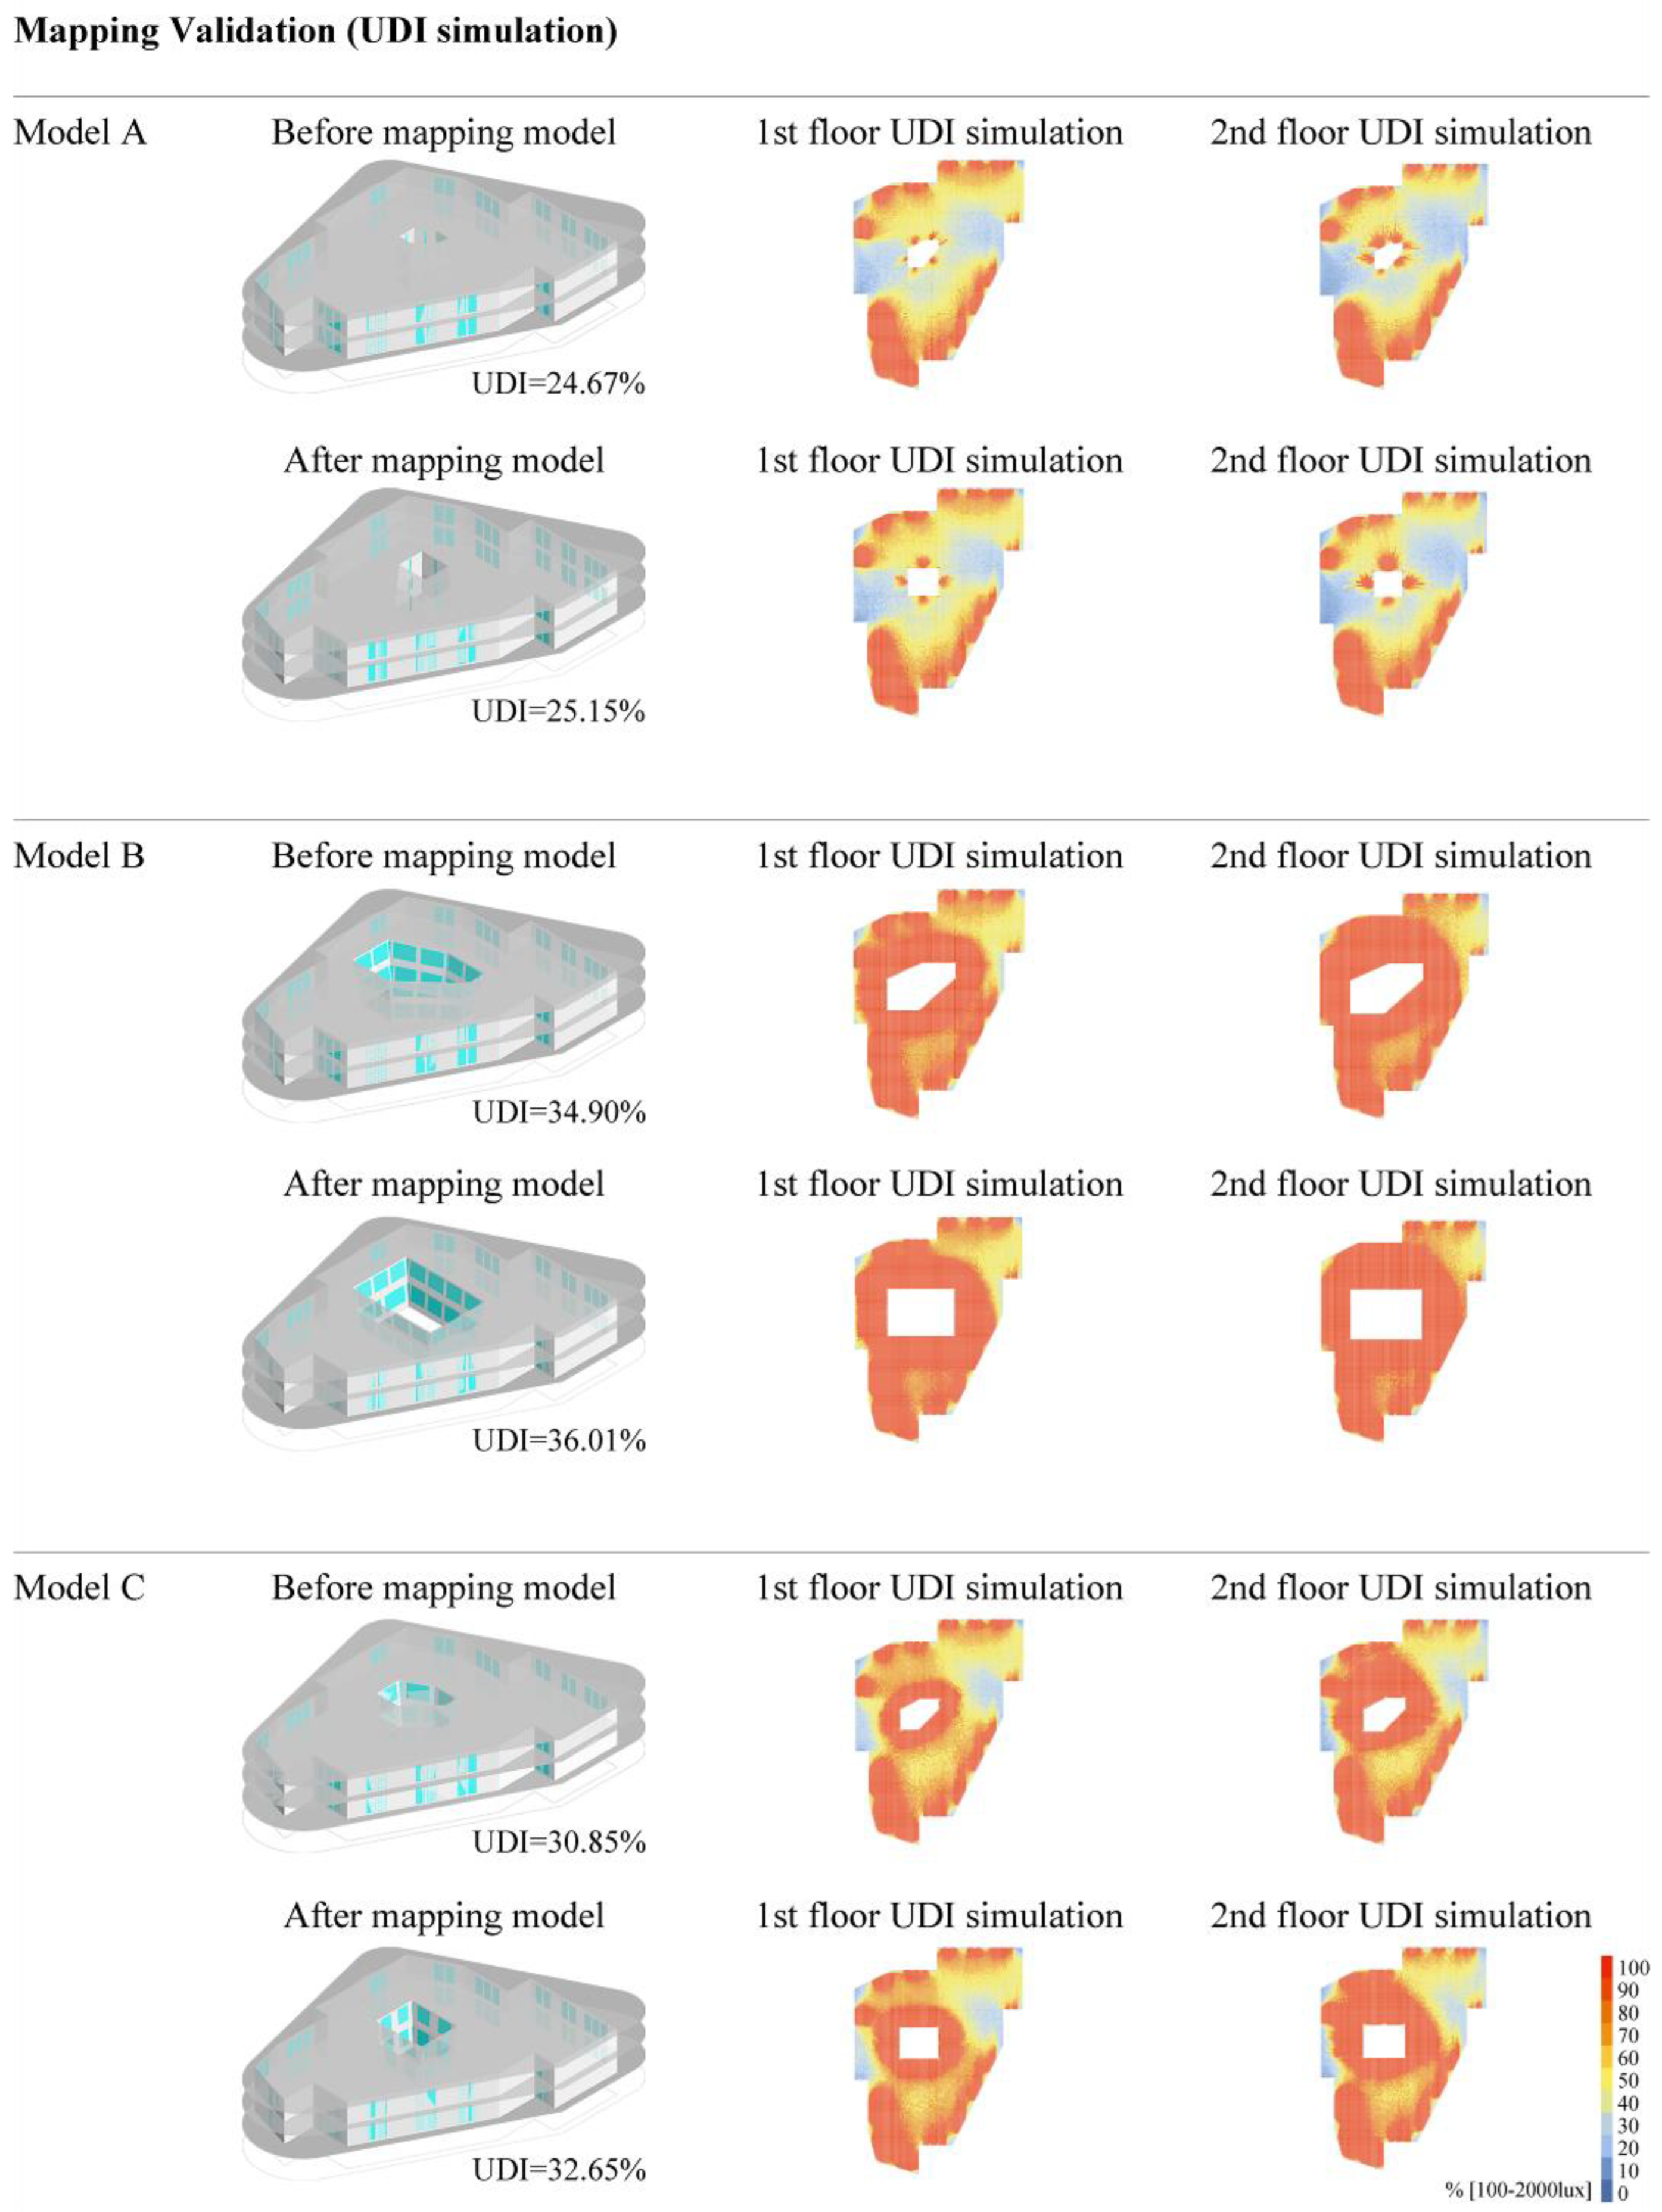
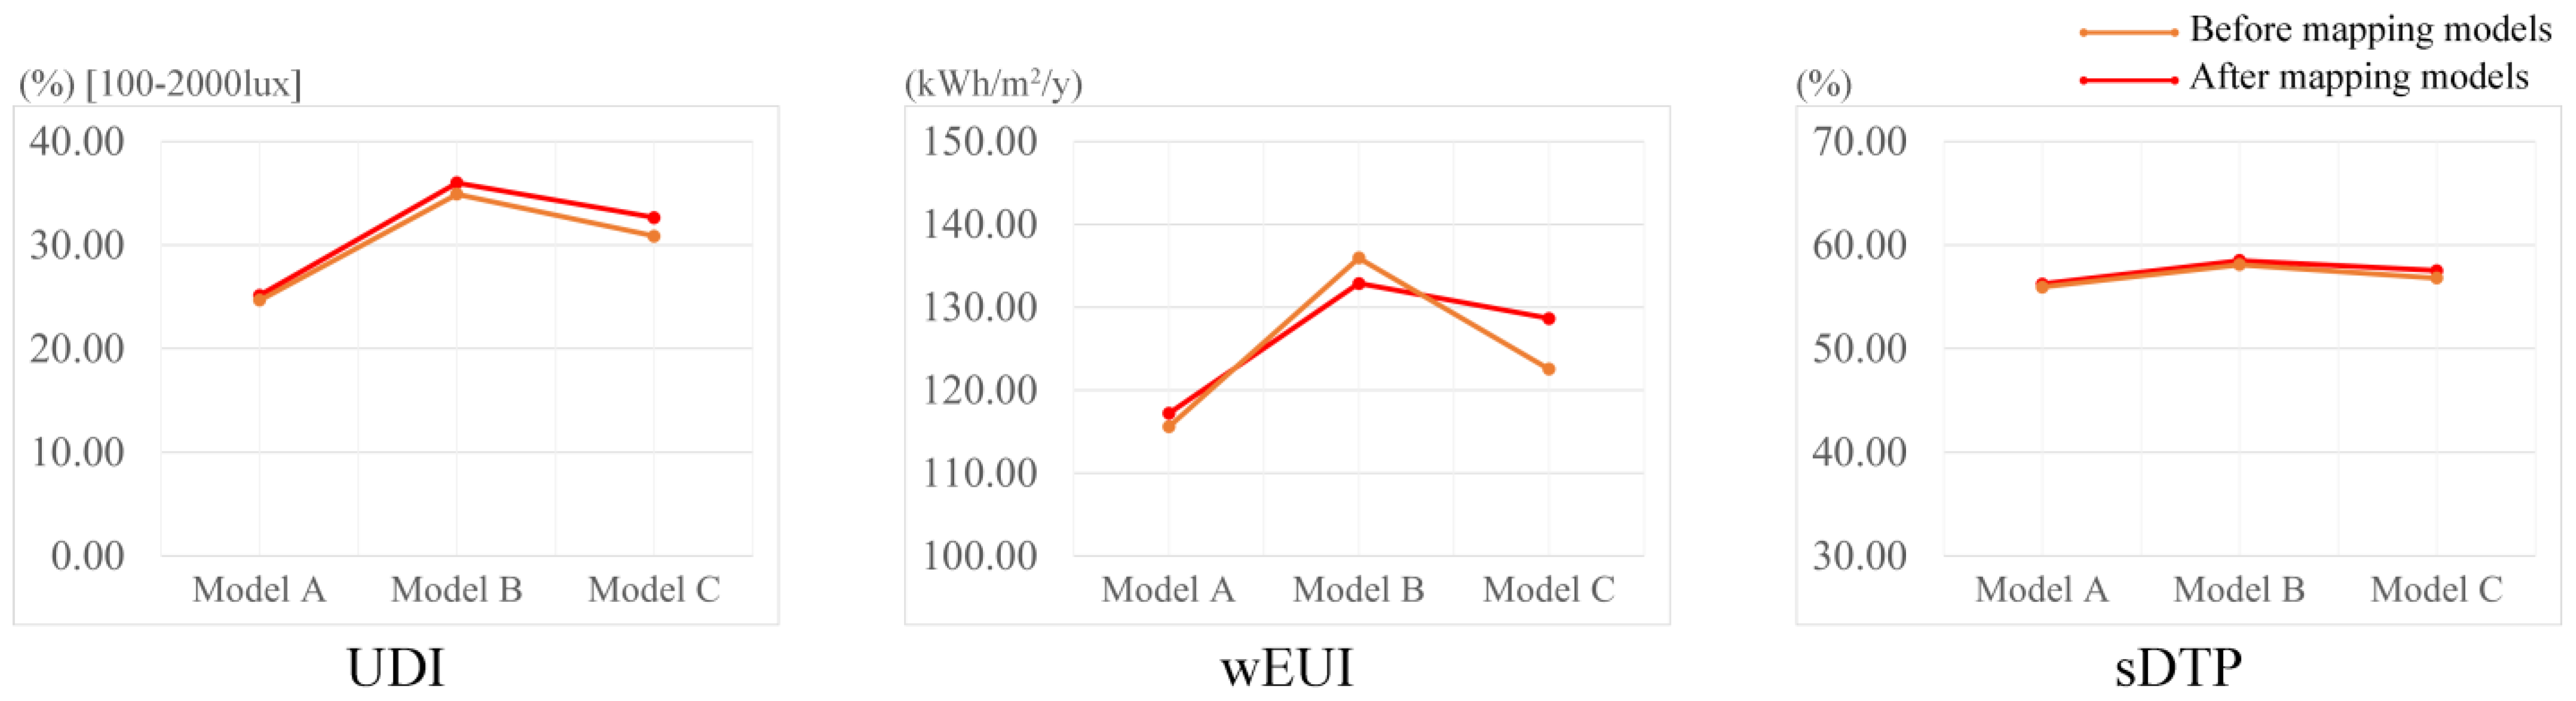
3.5. Mapping Validation for the Tested Building

To apply the atrium mapping approach in this case study, the feasibility of this mapping approach on this case needs to be verified. Therefore, several representative solutions were selected, and rhino models before and after mapping were built to validate the mapping method through simulation.
Figure 8 displays the ‘before’ and ‘after’ mapping models of Model A, Model B, and Model C, and their corresponding daylighting simulations were conducted to obtain the average UDI values for two floors of the building. The similar results of the UDI performance of the ‘before’ and ‘after’ mapping models, suggesting that the ‘after-mapping model’ is representative of the ‘before-mapping model’ in terms of daylighting performance.
Furthermore, the two columns on the right side of each row in Figure 6 show the UDI simulation maps corresponding to the first floor and second floor, respectively. It can be noted that the ‘after-mapping model’ reflects the UDI performance of the ‘before-mapping model’, as well as its distribution, which further illustrates the feasibility and rationality of using this atrium mapping method.
As shown in Figure 9, to further verify the feasibility and rationality of the mapping method, simulations of the UDI, wEUI, and sDTP were performed for Model A, Model B, and Model C, respectively. Overall, the ‘after-mapping model’ and the ‘before-mapping model’ behave similarly in these three simulations. Among them, for UDI and sDTP, the ‘after-mapping model’ is more representative of the ‘before-mapping model’ than they are of the wEUI.
To more accurately quantify the degree of fit between the ‘before-mapping model’ and the ‘after-mapping model’, R2 will be calculated for each of the three simulations (considering Model A, Model B, and Model C). These calculations will provide a more precise measure of the correlation between the two models for each simulation, further strengthening our analysis and evaluation of the effectiveness of the atrium mapping method. The formula for R2 is shown in Equation (10). For the UDI, wEUI, and sDTP, the R2 are 0.991, 0.818, and 0.960, respectively, which justifies the use of ‘after-mapping model’ instead of ‘before-mapping model’ for the above simulations. The above results indicate that the ‘after-mapping model’ is a reliable substitute for the ‘before-mapping model’. Although the correlation for the wEUI was slightly lower, the use of the ‘after-mapping model’ is still justified based on the results of the R2 calculation.
R 2 = 1 i = 1 N ( a f t e r i b e f o r e i ) 2 i = 1 N ( a f t e r i b e f o r e ¯ ) 2

3.6. Optimization Results for the Tested Building

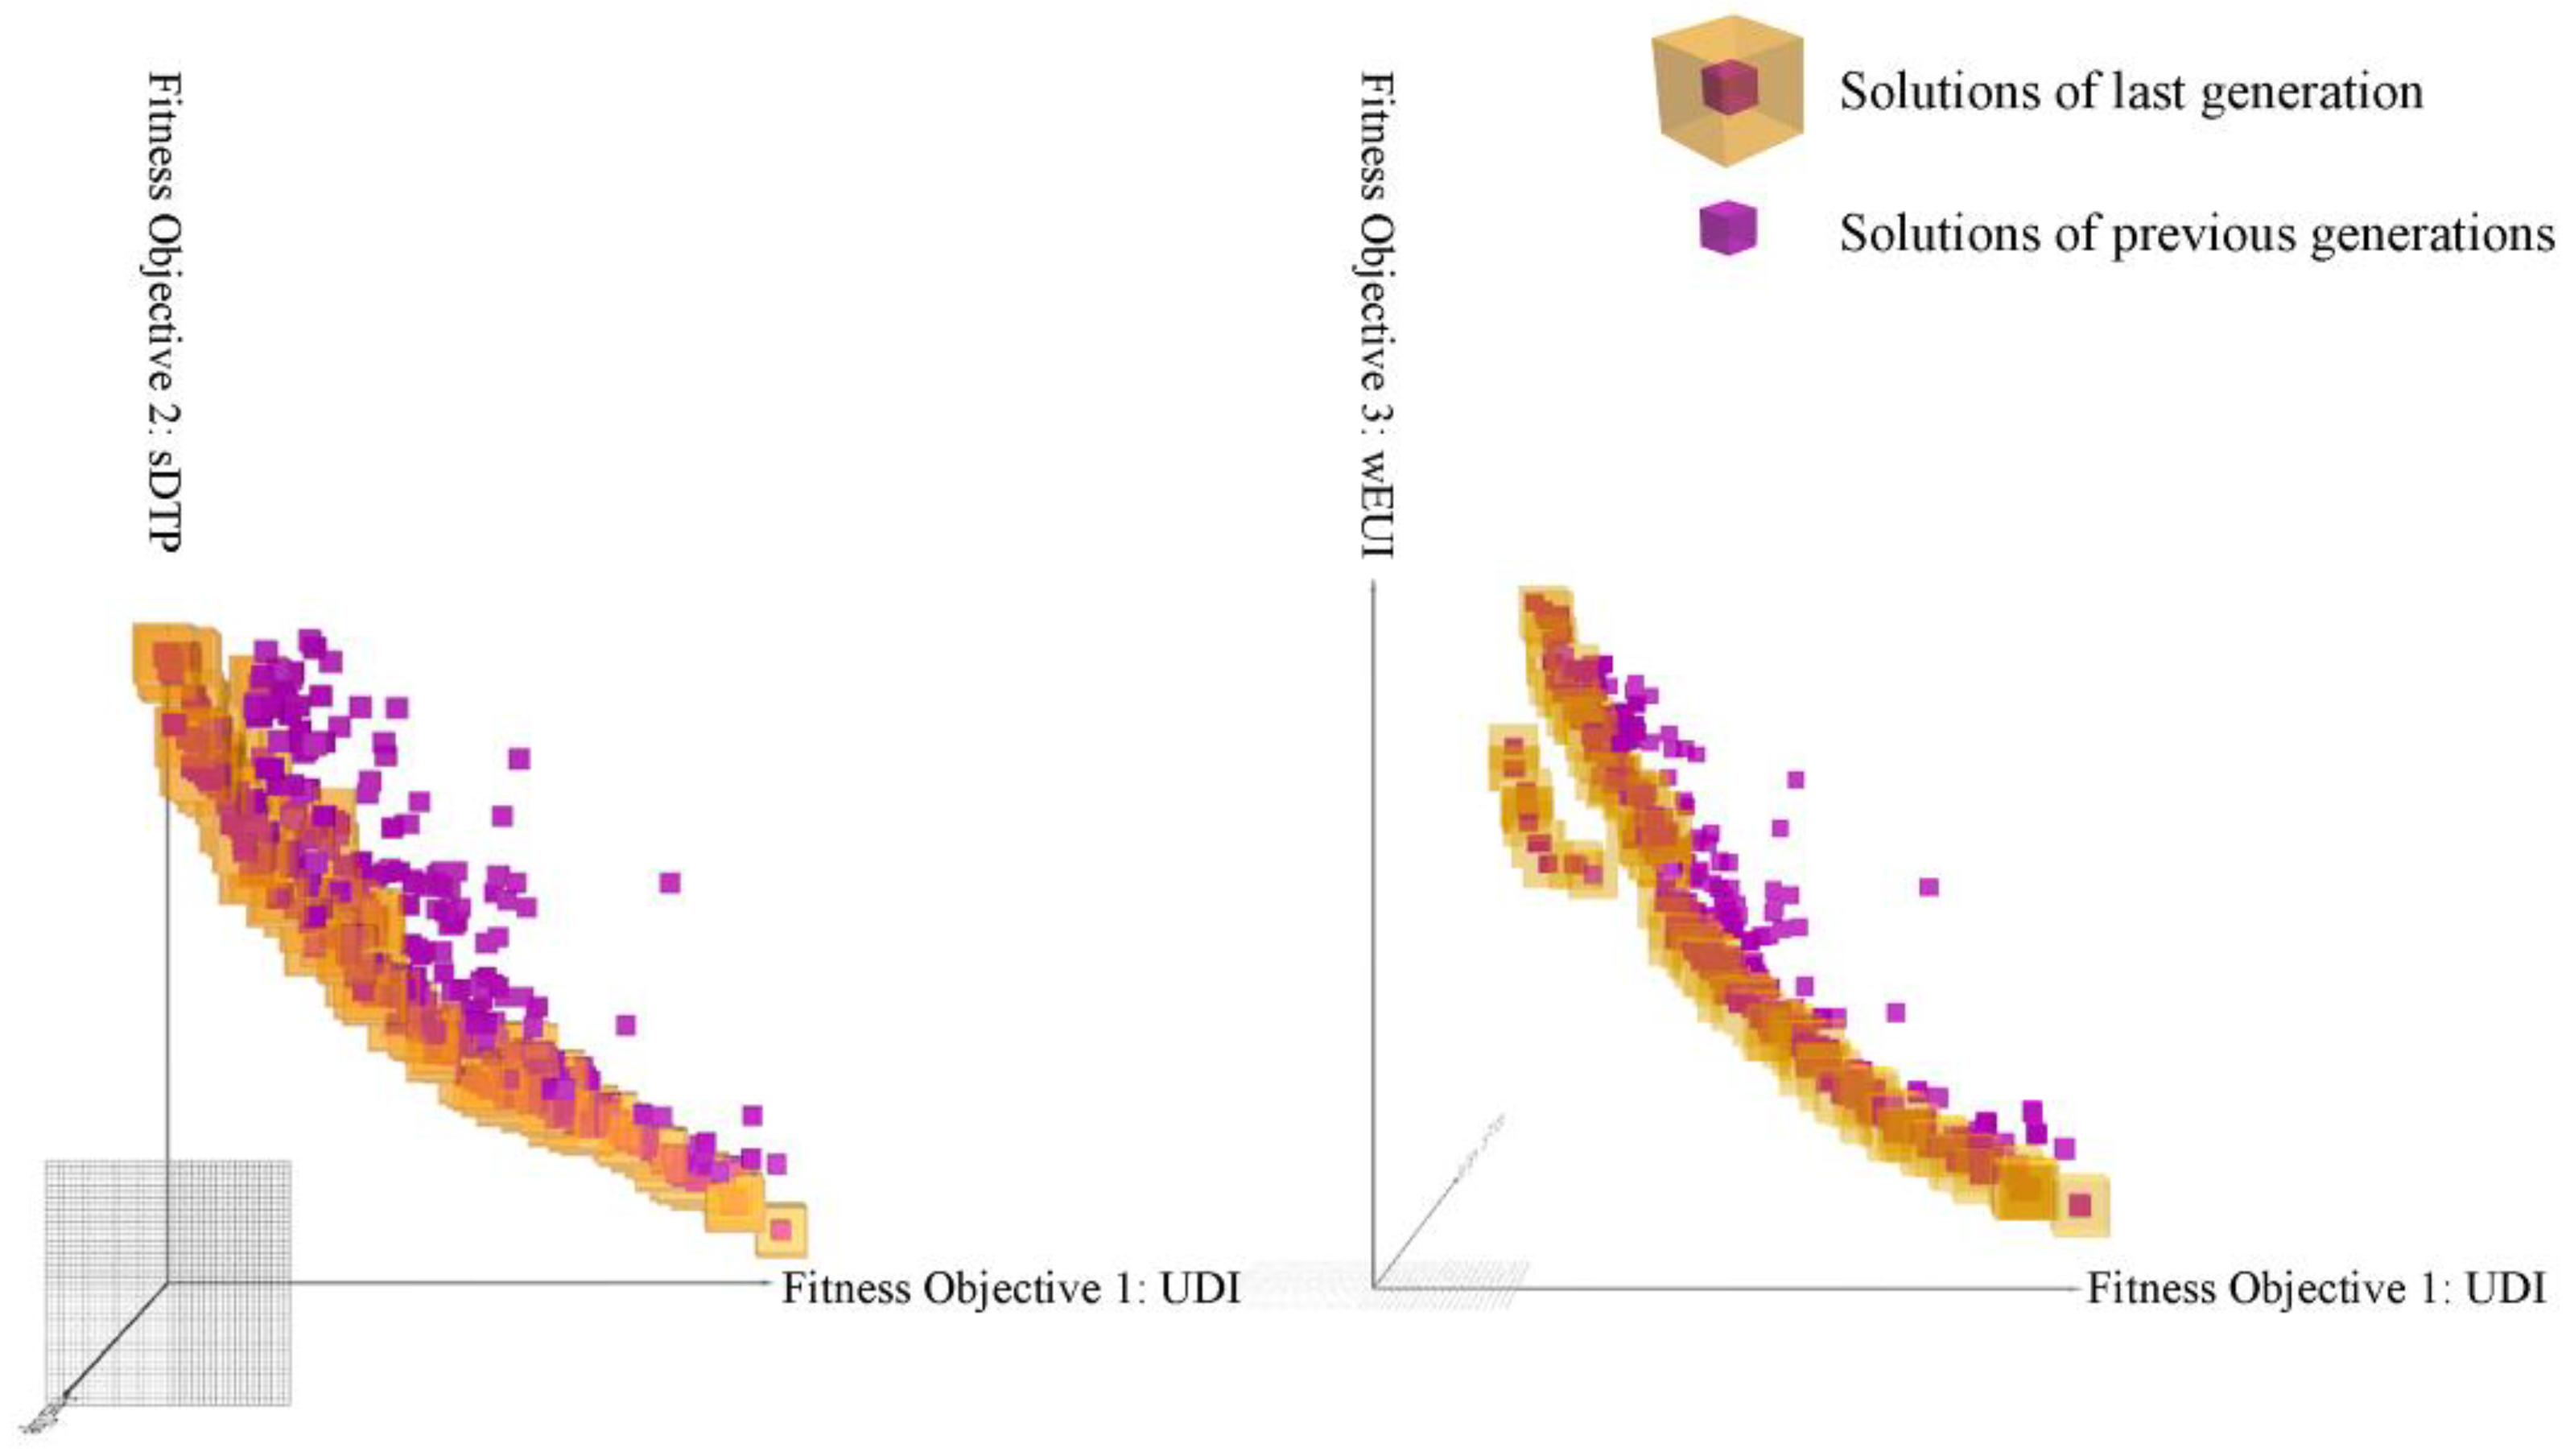
3.6.1. Overview of MOO Simulation

For the case study, the MOO simulation with 30 generations, 50 solutions per generation, and a total of 1500 simulations took 15 h, 8 min, and 42 s, with an average of 36 s per simulation for one solution.
Figure 10 shows all solutions in the last generation and in the previous generations, while the lower part shows the scatter plots for the UDI, wEUI, and sDTP. In the target space for all generations of solutions, as the MOO simulation proceeds, each generation of solutions is moving closer to the origin of the axis, which implies an improvement in performance for all three objectives.

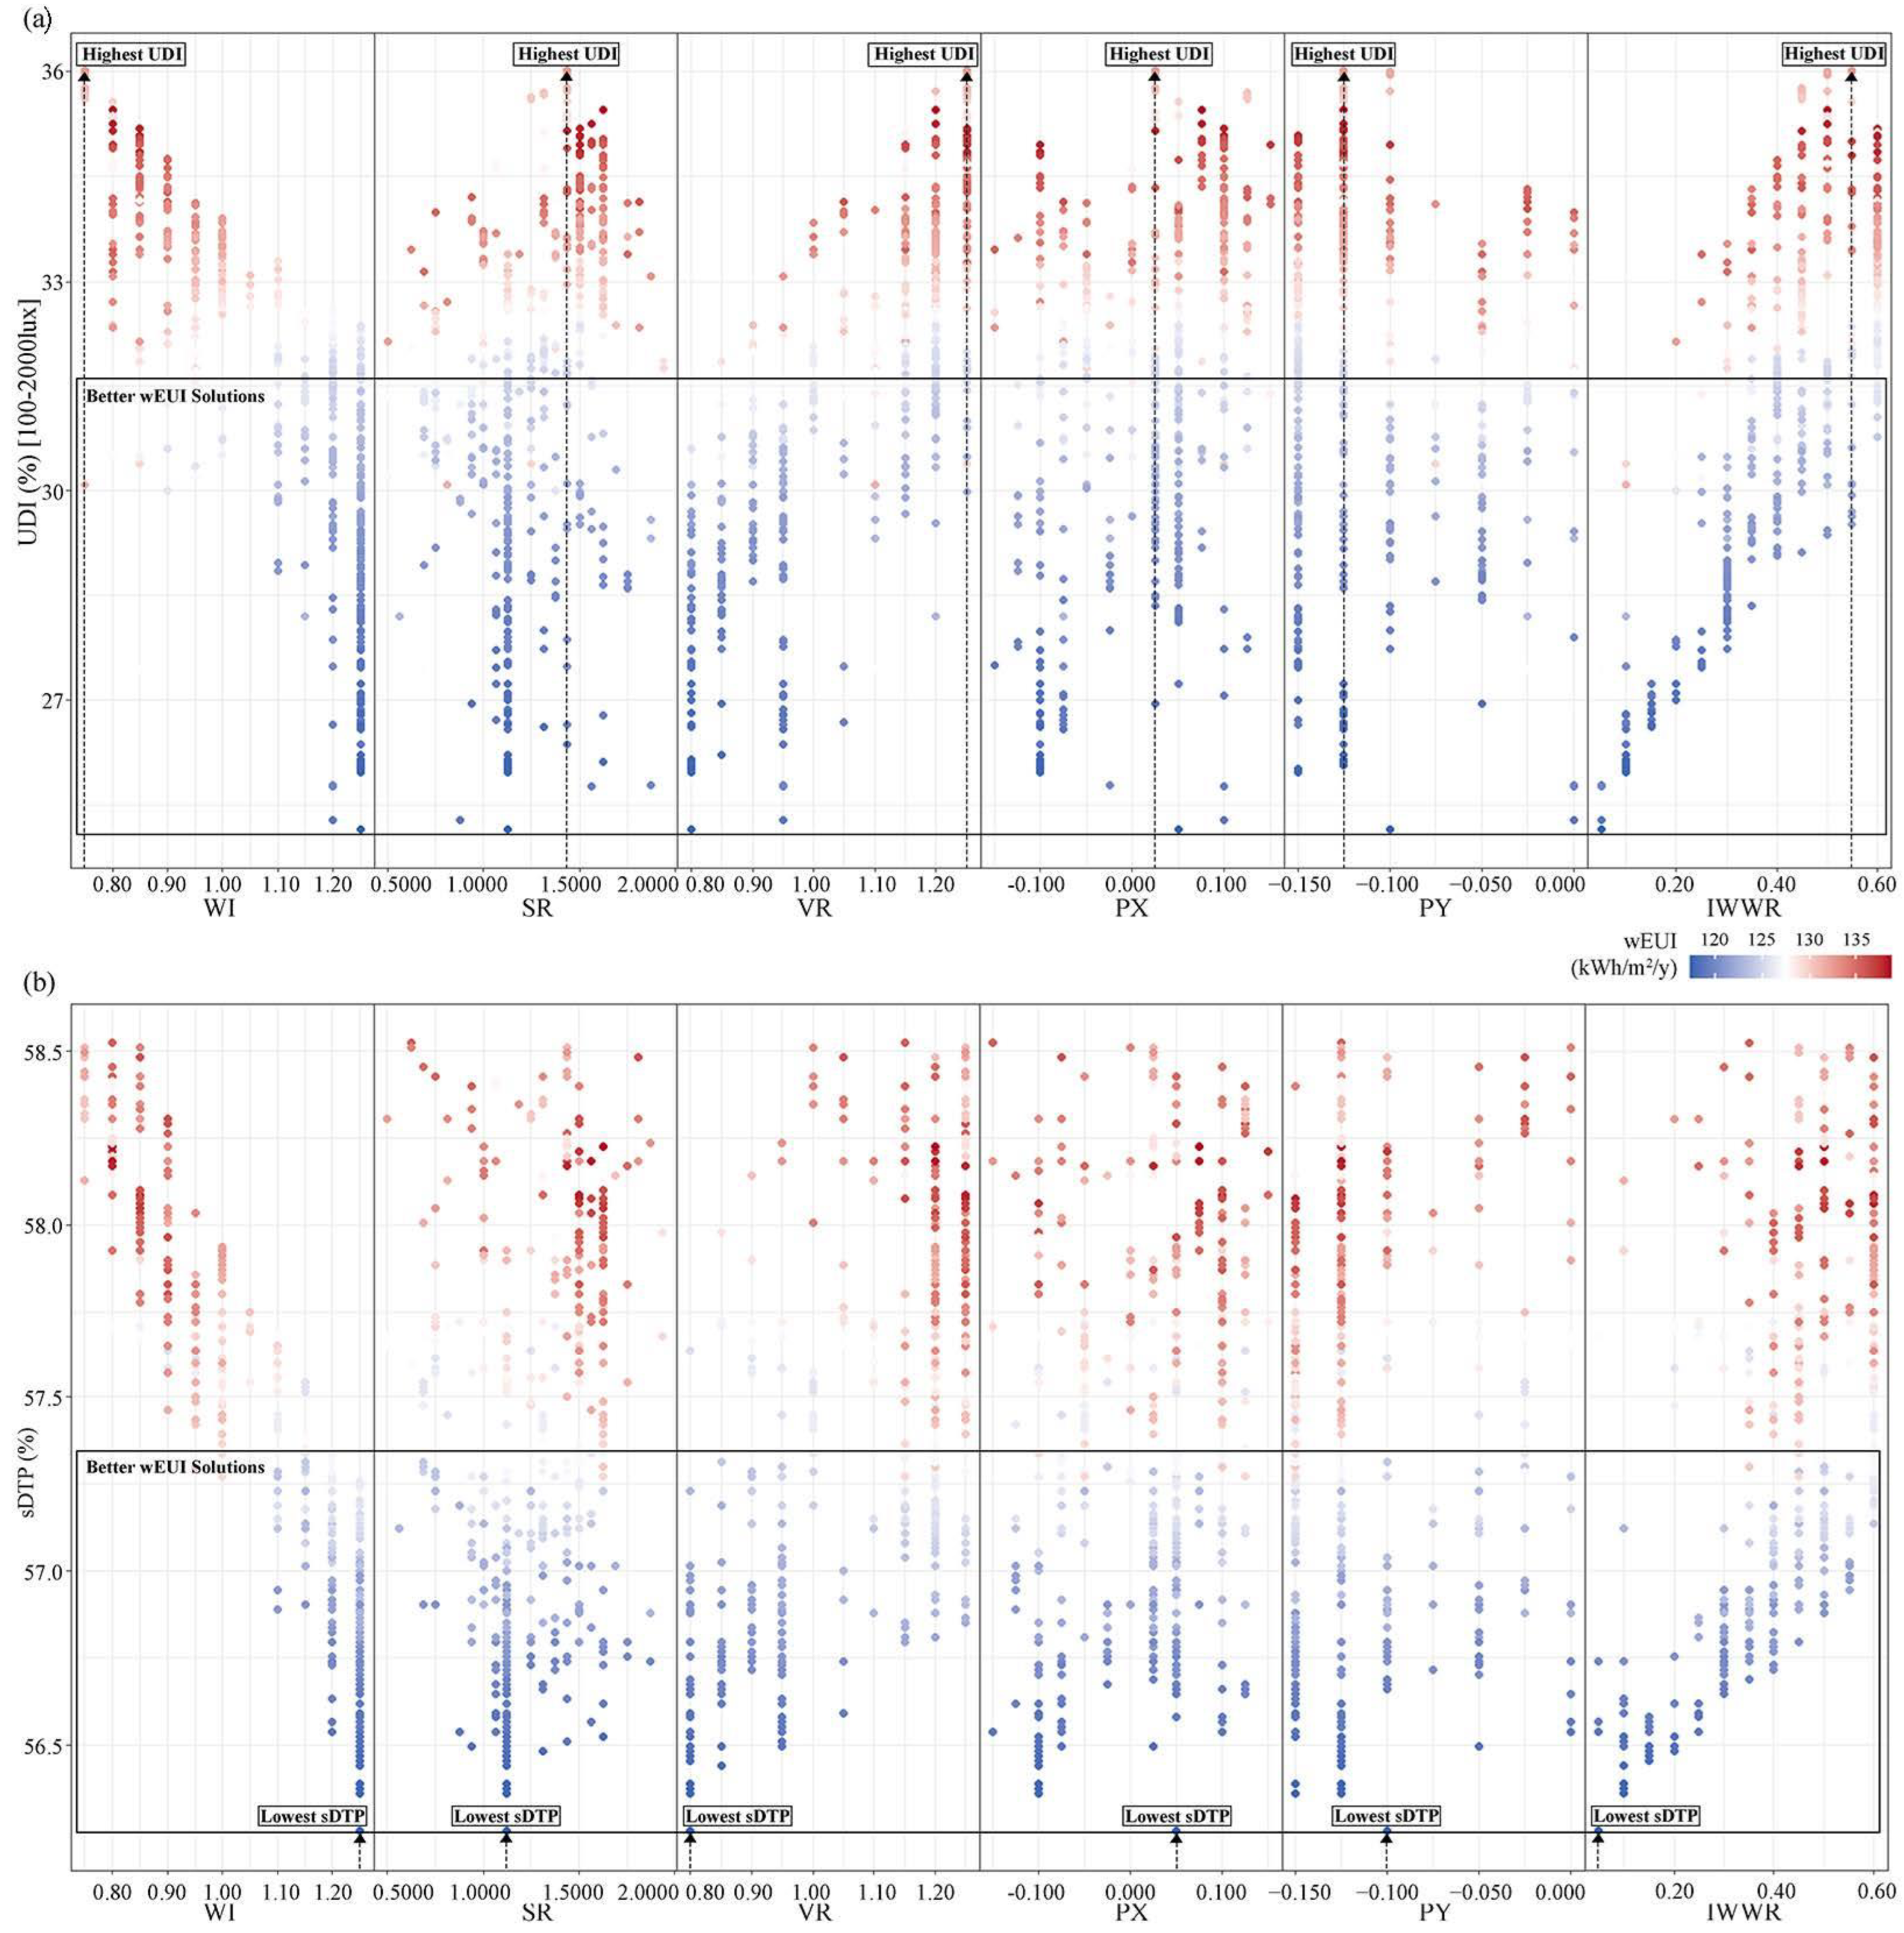
3.6.2. Analysis of Objectives against Design Variables

Based on the data set of 1500 simulations, correlations between design variables and objectives can be observed in scatter plots. Each point in these plots represents a design solution for a building atrium.
Figure 11a shows the results of the UDI and wEUI for all design variables. In general, scatter plots with clear trends can show the interactions between variables, while scatter plots with weak interdependencies between variables cannot. Scatter plots can also show the distribution areas of the best-performing design variables. Figure 11a shows that the UDI value reaches its peak when the WI is less than 0.80, and decreases progressively as the WI increases. This is due to the fact that the WI directly influences the size of the atrium (a higher WI results in a smaller atrium area), and increasing the atrium area within a certain range improves the time when the indoor light environment is in the appropriate range. The highest UDI occurs when the SR is around 1.4000, and the UDI decreases when the SR is below or above this value. For VR, the maximum UDI occurs when the VR is around 1.25, and decreases as the VR decreases within the range of the case study. Choosing a suitable SR or increasing VR within a certain range has the potential to improve the average UDI of the building. Regarding the relationship between the location index and the average UDI, the average UDI reaches its highest value when the location PX is close to 0.025, and the location PY is close to −0.125. This may be caused by the uneven distribution of the original building volume, the shading of the surrounding environment, and the dominant direction and angle of sunlight. Finally, as the IWWR rises, the UDI increases, consistent with the common sense that a larger atrium window-to-wall ratio improves lighting conditions within a certain range. It is worth noting that solutions achieving higher average UDI tend to have higher wEUI, highlighting the paradoxical nature of the atrium providing a well-lit environment while reducing energy consumption in this case study. These results demonstrate the feasibility of using MOO to optimize the atrium form.
Figure 11b shows the results of the sDTP and EUI for all design variables. The sDTP is lowest when the WI is around 1.25, which is close to the interval where the better wEUI solution is located. In addition, it can be noted that as the WI increases, the sDTP decreases. In addition, the sDTP is lowest when the SR is close to 1.1000 and the VR is close to 0.80. For PX and PY, in connection with Figure 7a, the PX and PY values that reach the lowest sDTP are similar to those that reach the highest UDI (PX close to −0.100 while PY close to 0.005). This indicates that the center point of the atrium can bring a better performance of both the UDI and sDTP to the building when it is in a certain position range. As for the IWWR, the sDTP decreases as the IWWR decreases and reaches its lowest when the IWWR is close to 0.05. This indicates that, for this case study, a lower atrium window-to-wall ratio leads to better summer thermal comfort performance.

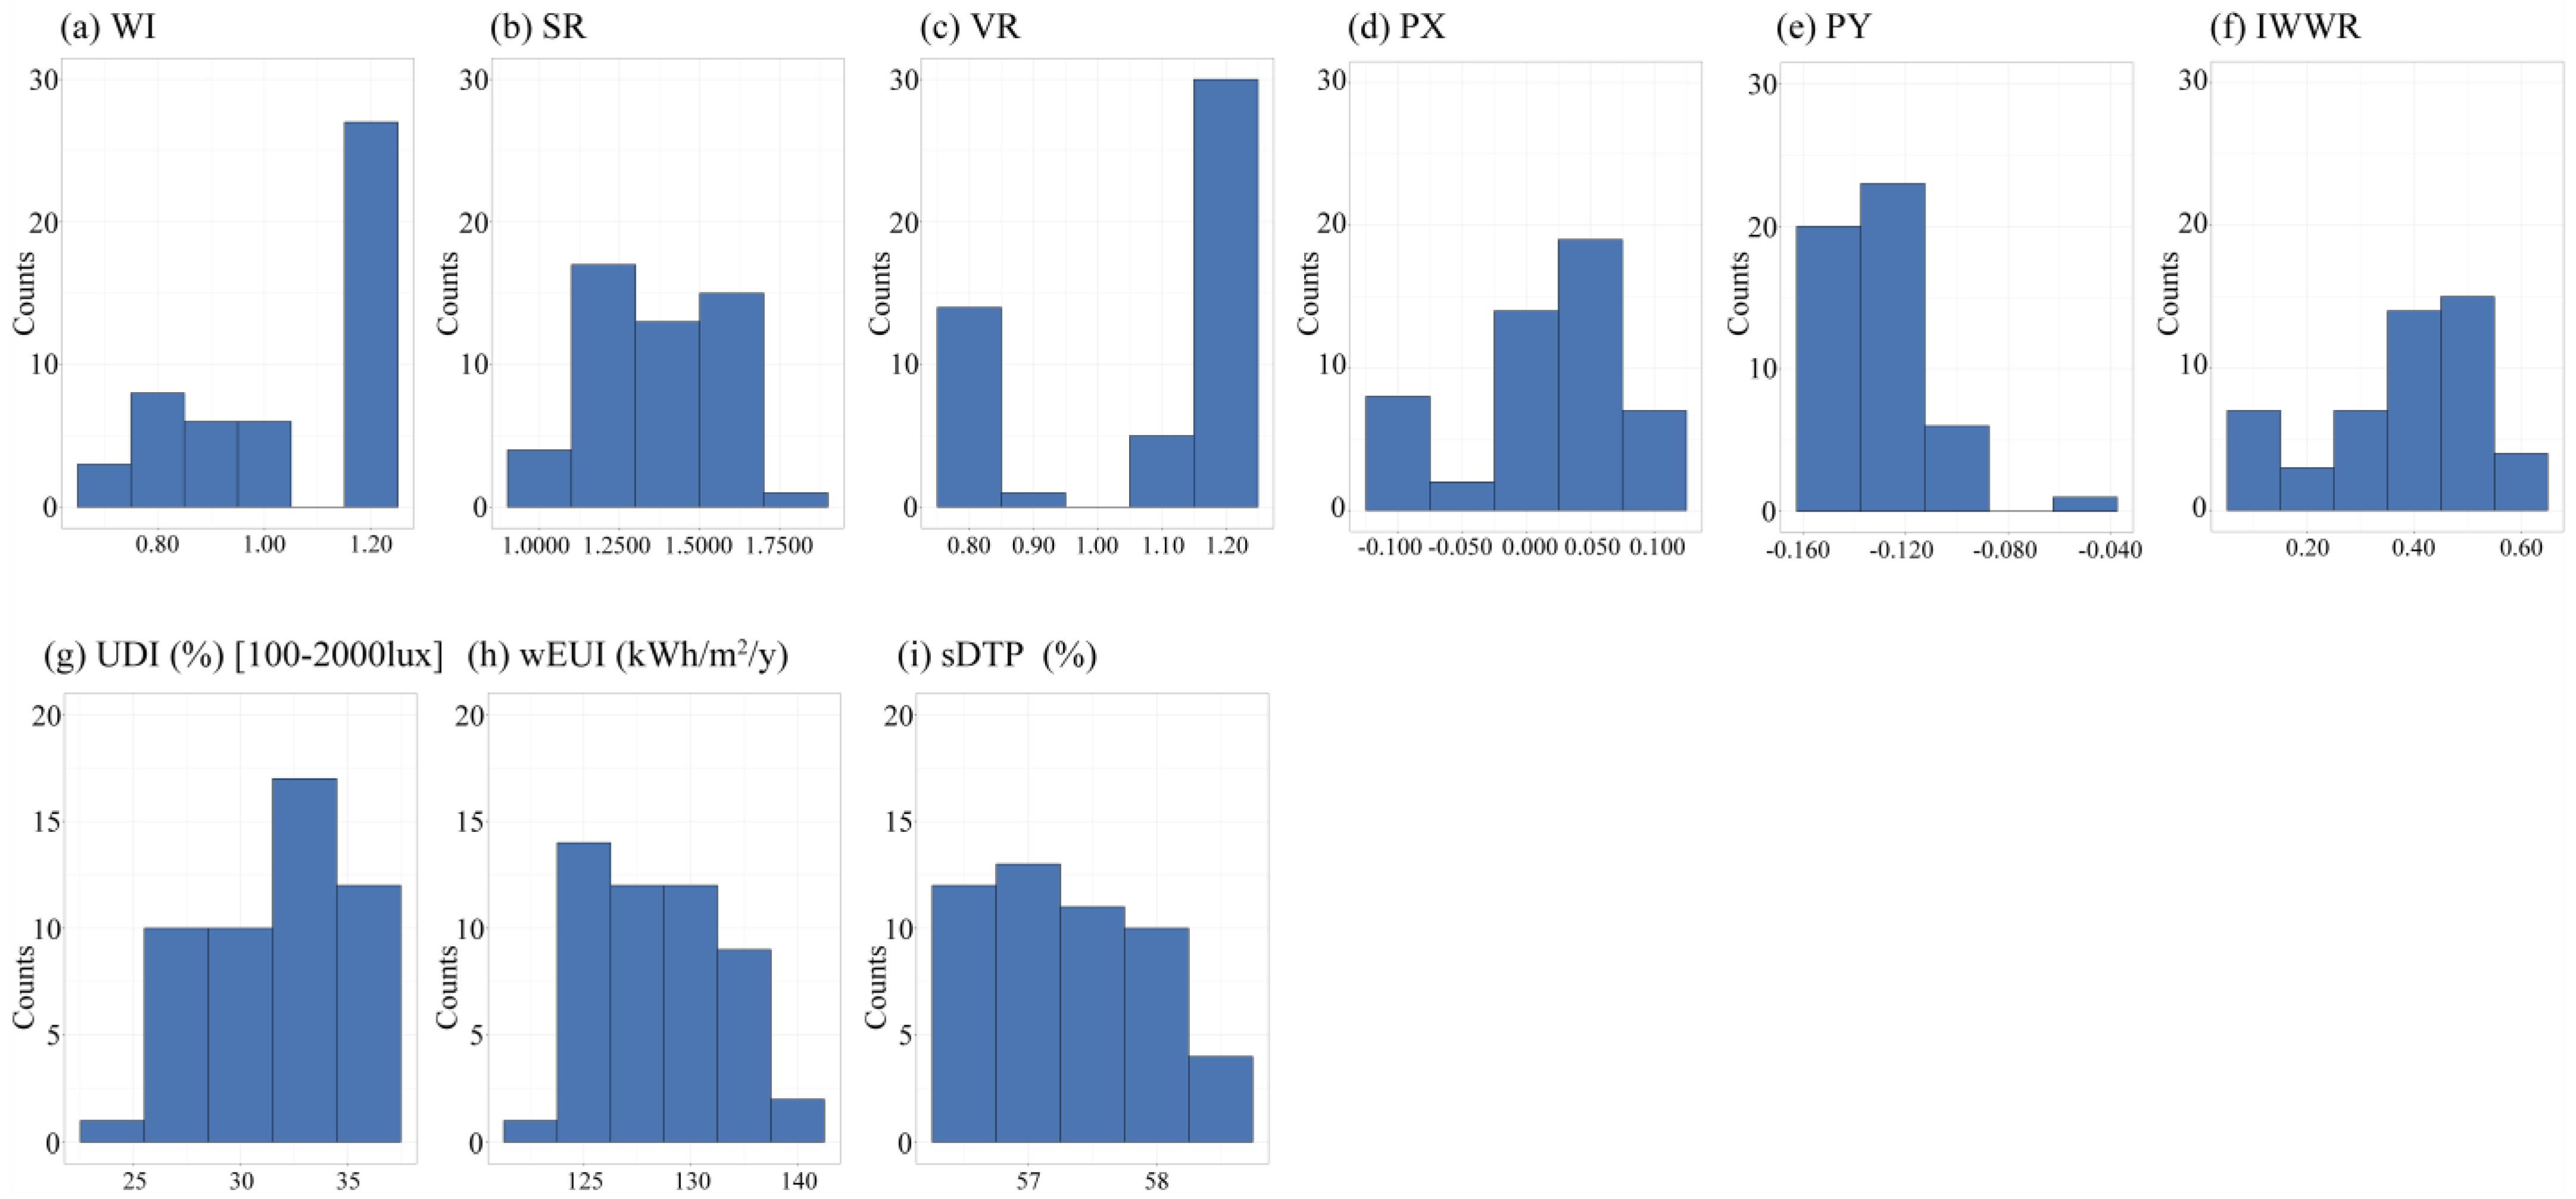
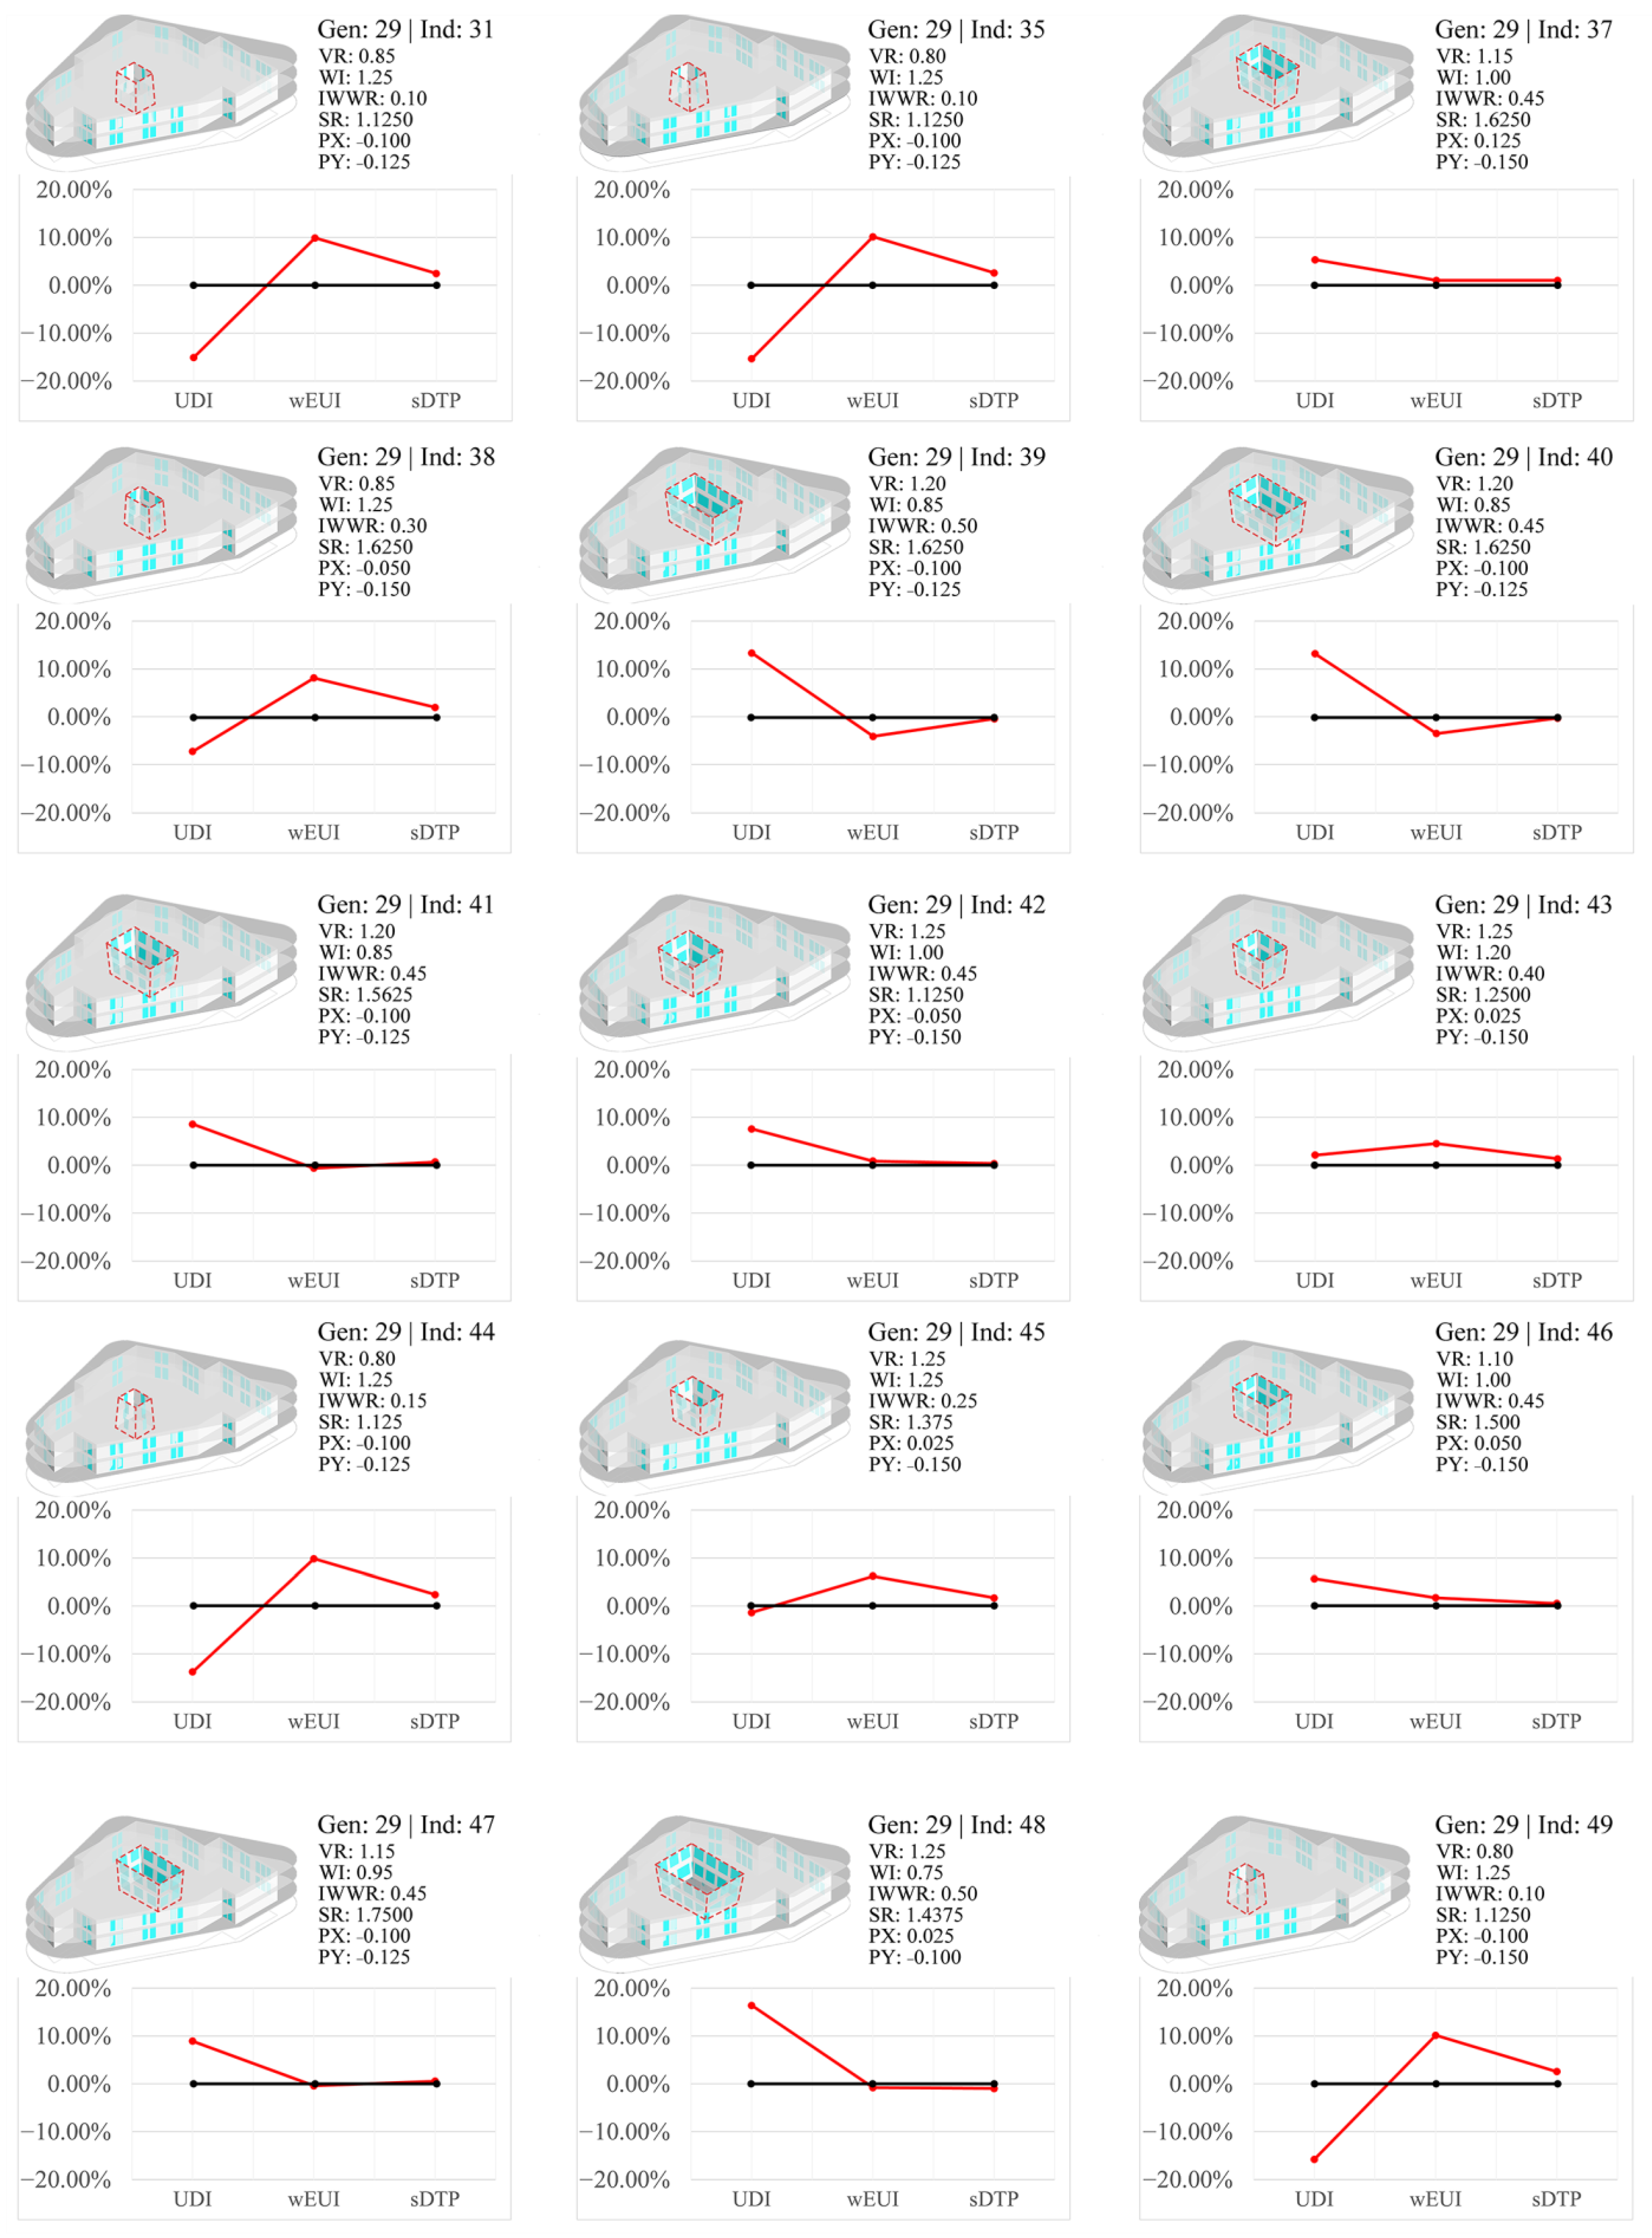
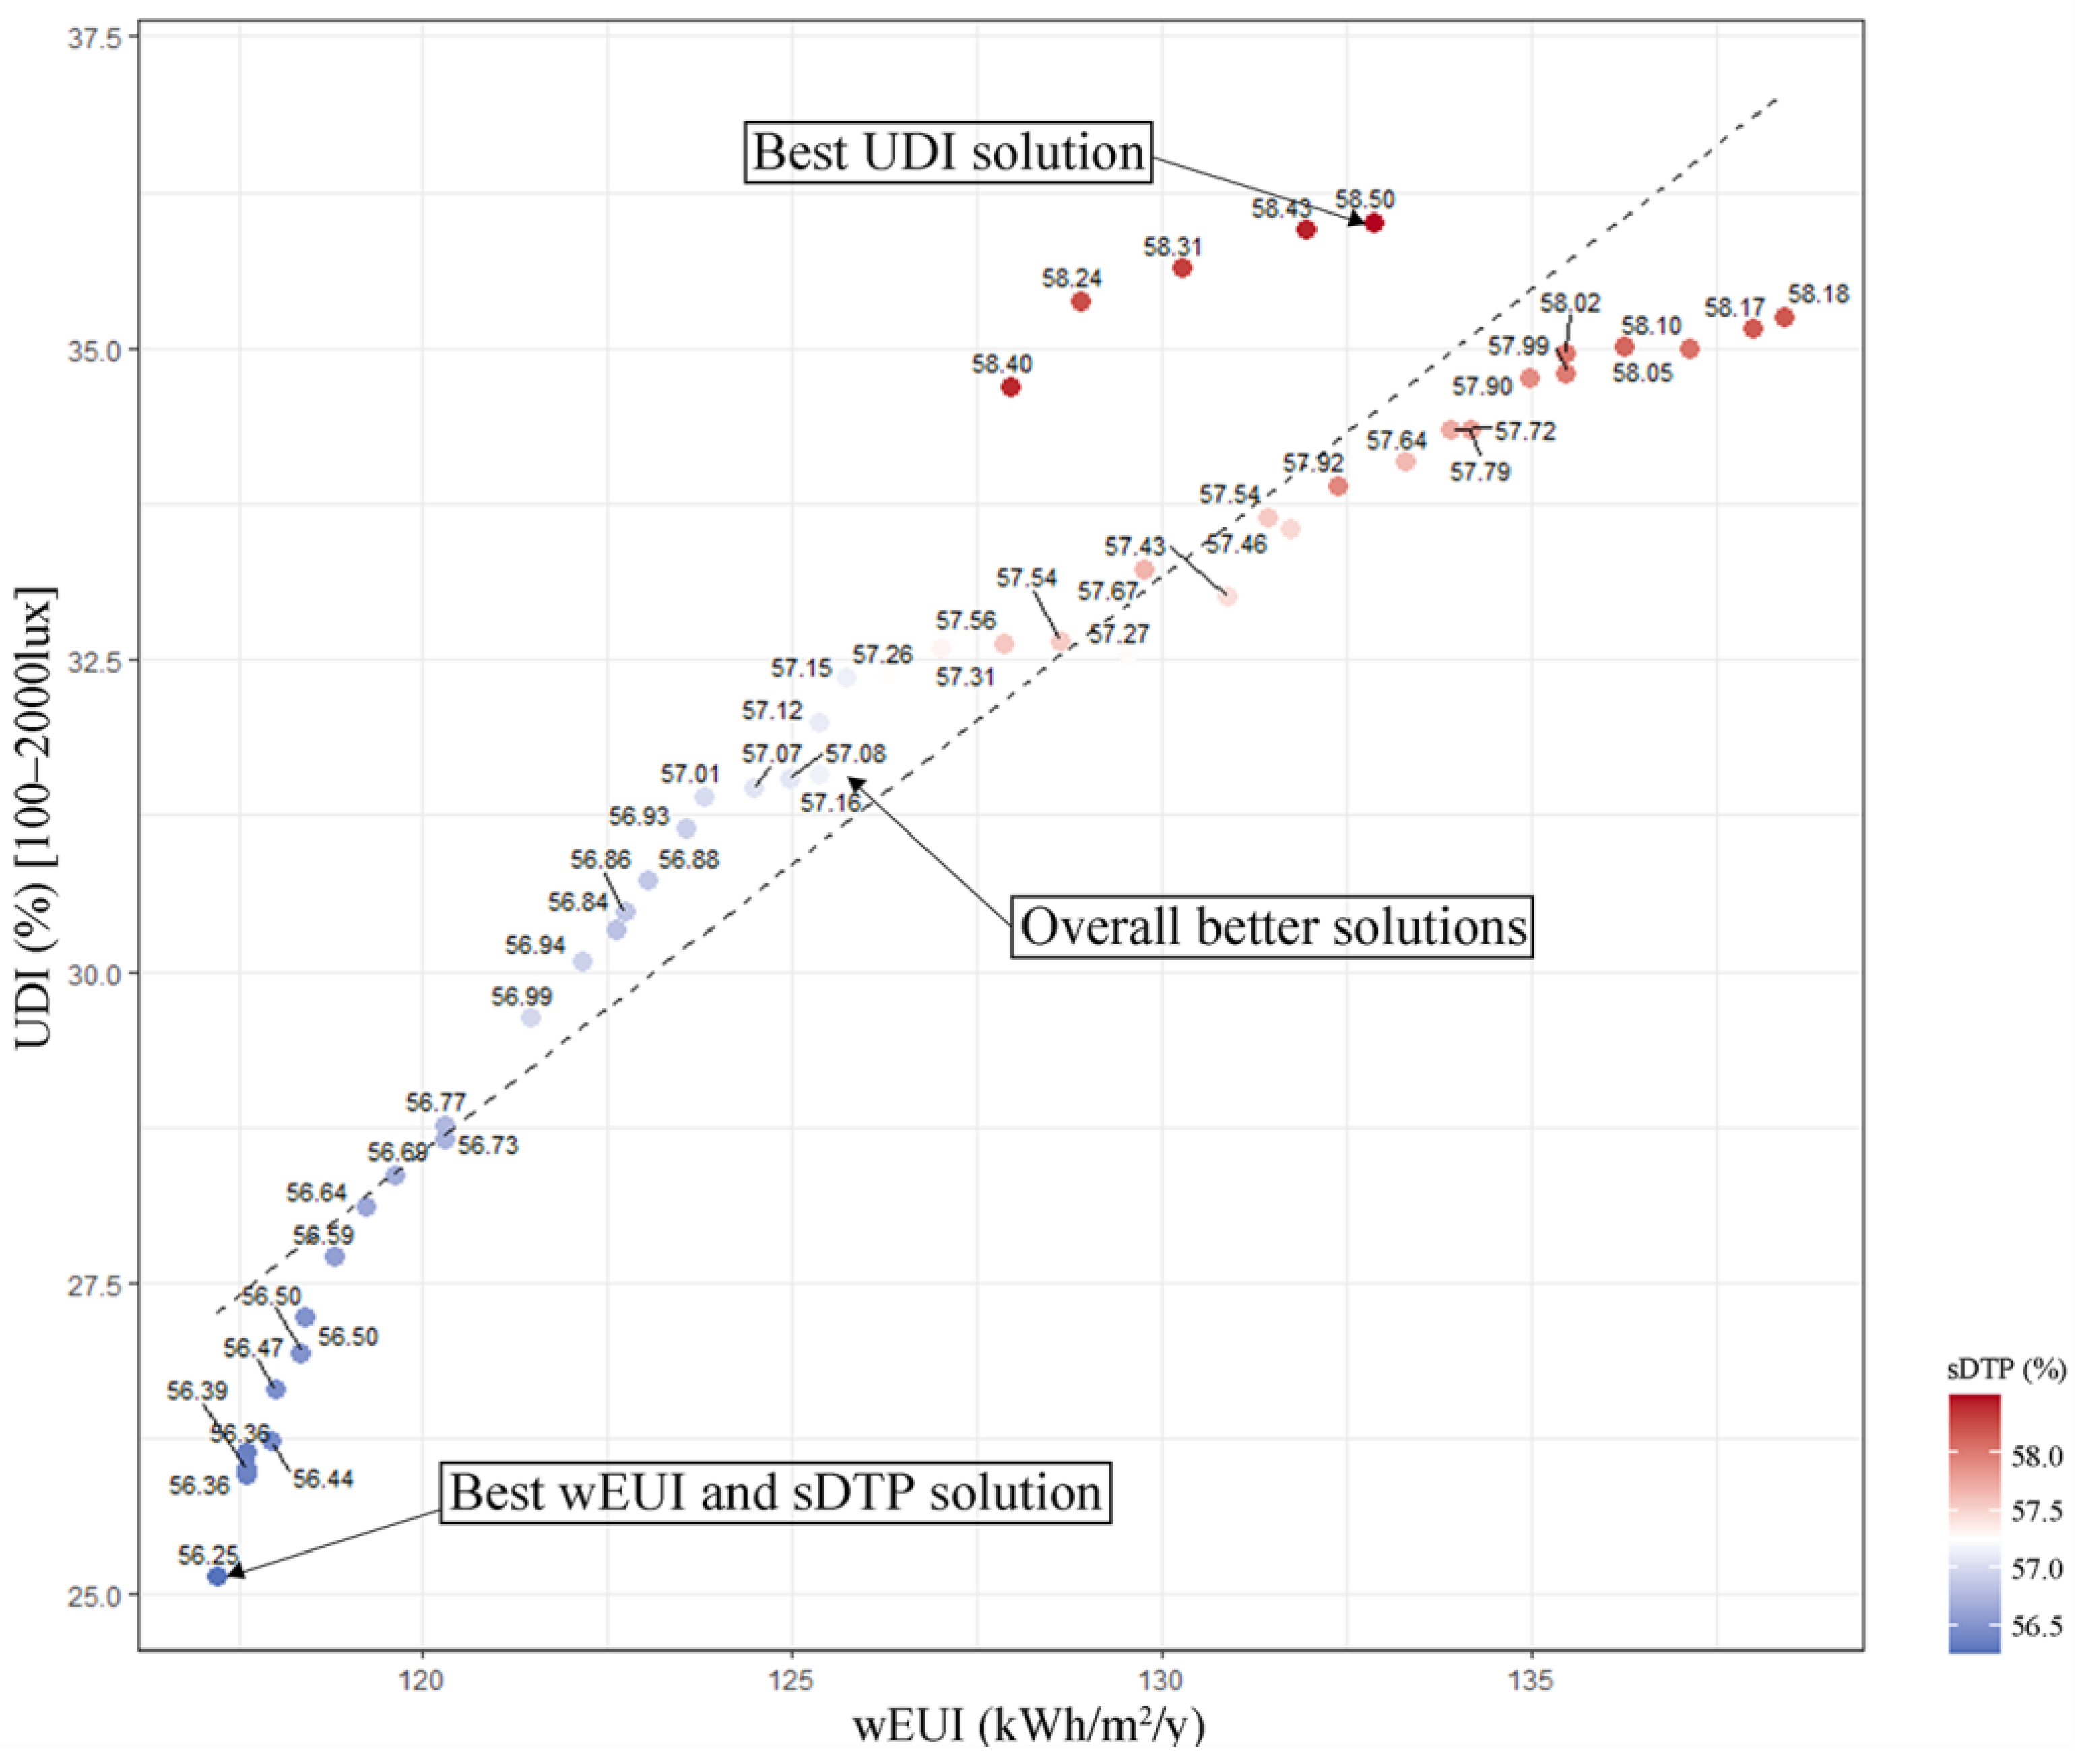
3.6.3. The Optimal Solutions Analysis

Figure 12 illustrates the value distribution of the last generation atrium design variables. The x-axis indicates a more precise range in which the optimal variable is located since the optimizer can select any value within the given variable range. The frequency of each variable in the Pareto-optimal solution set is indicated by the y-axis. For the variables of Pareto front solution, WI has the highest count around 1.20, SR has the highest count in the 1.25–1.50 range, VR tends to be larger (close to 1.20), Position Index-X tends to be close to 0.050, and Position Index-Y tends to be closer to −0.120. Additionally, the IWWR has the highest counts near 0.4. These indicate that the optimized atrium is smaller in size, slightly longer in east-west than in north-south length, larger in volume at the top and smaller at the bottom, more centered to the west and north, and has a larger atrium window-to-wall ratio. For the design objectives, most solutions have a UDI larger than 25%. In addition, the wEUI of Pareto front solutions lies in the range of 125–130 kWh/m2 at most. At the same time, the highest count of the sDTP of the solution is around 57–58%.
Figure 13 shows 15 solutions of the last generation, along with their model images, variables, and the percentage of optimization of the objectives (red line) compared to the original building (black line). In general, the different solutions have different magnitudes of optimization for different objectives compared to the simulated values of the original building. Among these solutions, Ind: 31, Ind: 35, Ind: 38, Ind: 44, Ind: 45, and Ind: 49 all showed significant improvements in the wEUI, which ranged from about 5% to 10%, compared to the wEUI of the original building. Ind: 37, Ind: 39, Ind: 40, Ind: 41, Ind: 42, Ind: 46, Ind: 47, and Ind: 48 have more significant improvements in UDI, which is about 5% to 15% compared to the original building. The optimization of these solutions for the sDTP is smaller, which may be because, in the climatic region where the case studies are located, their sDTP is more influenced by external climatic conditions. We can also note that some solutions have improvements in all three objectives, such as Ind: 37, Ind: 42, Ind: 43, and Ind: 46, which have improvements between 0% and 8% in all three objectives.
In the Pareto front scatter plot of Figure 14, the distribution of the simulation results of the last generation with the three objectives can be observed precisely. In these solutions, their sDTP is close to 57.25%, while the UDI and wEUI are about 25.0–36.0% [100–2000 lux] and 117.2–140 kWh/m2, respectively. The best UDI solution gains 36.01% for UDI; however, its wEUI and sDTP are relatively high to compensate for the side effects of adequate daylighting performance. The best wEUI and sDTP solution is the same in this Pareto front, which indicates that the atrium design optimization can achieve energy efficiency and comfort at the same time. The lowest wEUI can reach 117.20 kWh/m2, and the lowest sDTP can obtain 56.25%, while the UDI is 25.15%.
By observing the performance of these non-dominated solutions, architects can select the optimal solution based on design requirements and the score of each solution for different objectives. The solutions in the middle of the objective space are usually more balanced for the three objectives. In contrast, the solutions closer to the origin in each axis direction are considered to perform better on the corresponding objective. We develop specific trade-off strategies to select the solution that best meets the needs of the project. The overall best solution can be calculated by the Equation (11).
O A b e s t = Min ( ( ( U D I i U D I m a x ) U D I m a x ) 2 + ( ( w E U I i w E U I m i n ) w E U I m i n ) 2 + ( ( s D T P i s D T P m i n ) s D T P m i n ) 2 )
The overall best solution is turn out to have a UDI of 35.14%, wEUI of 128.12 kWh/m2, and sDTP of 58.14%. Its VR value is 1.15, WI value is 0.80, IWWR is 0.60, SR is 1.3125, and the PX and PY values are −0.125 and 0.025, respectively. The summary of the reference case and 4 characteristic non-dominated solutions are listed in Table 8.

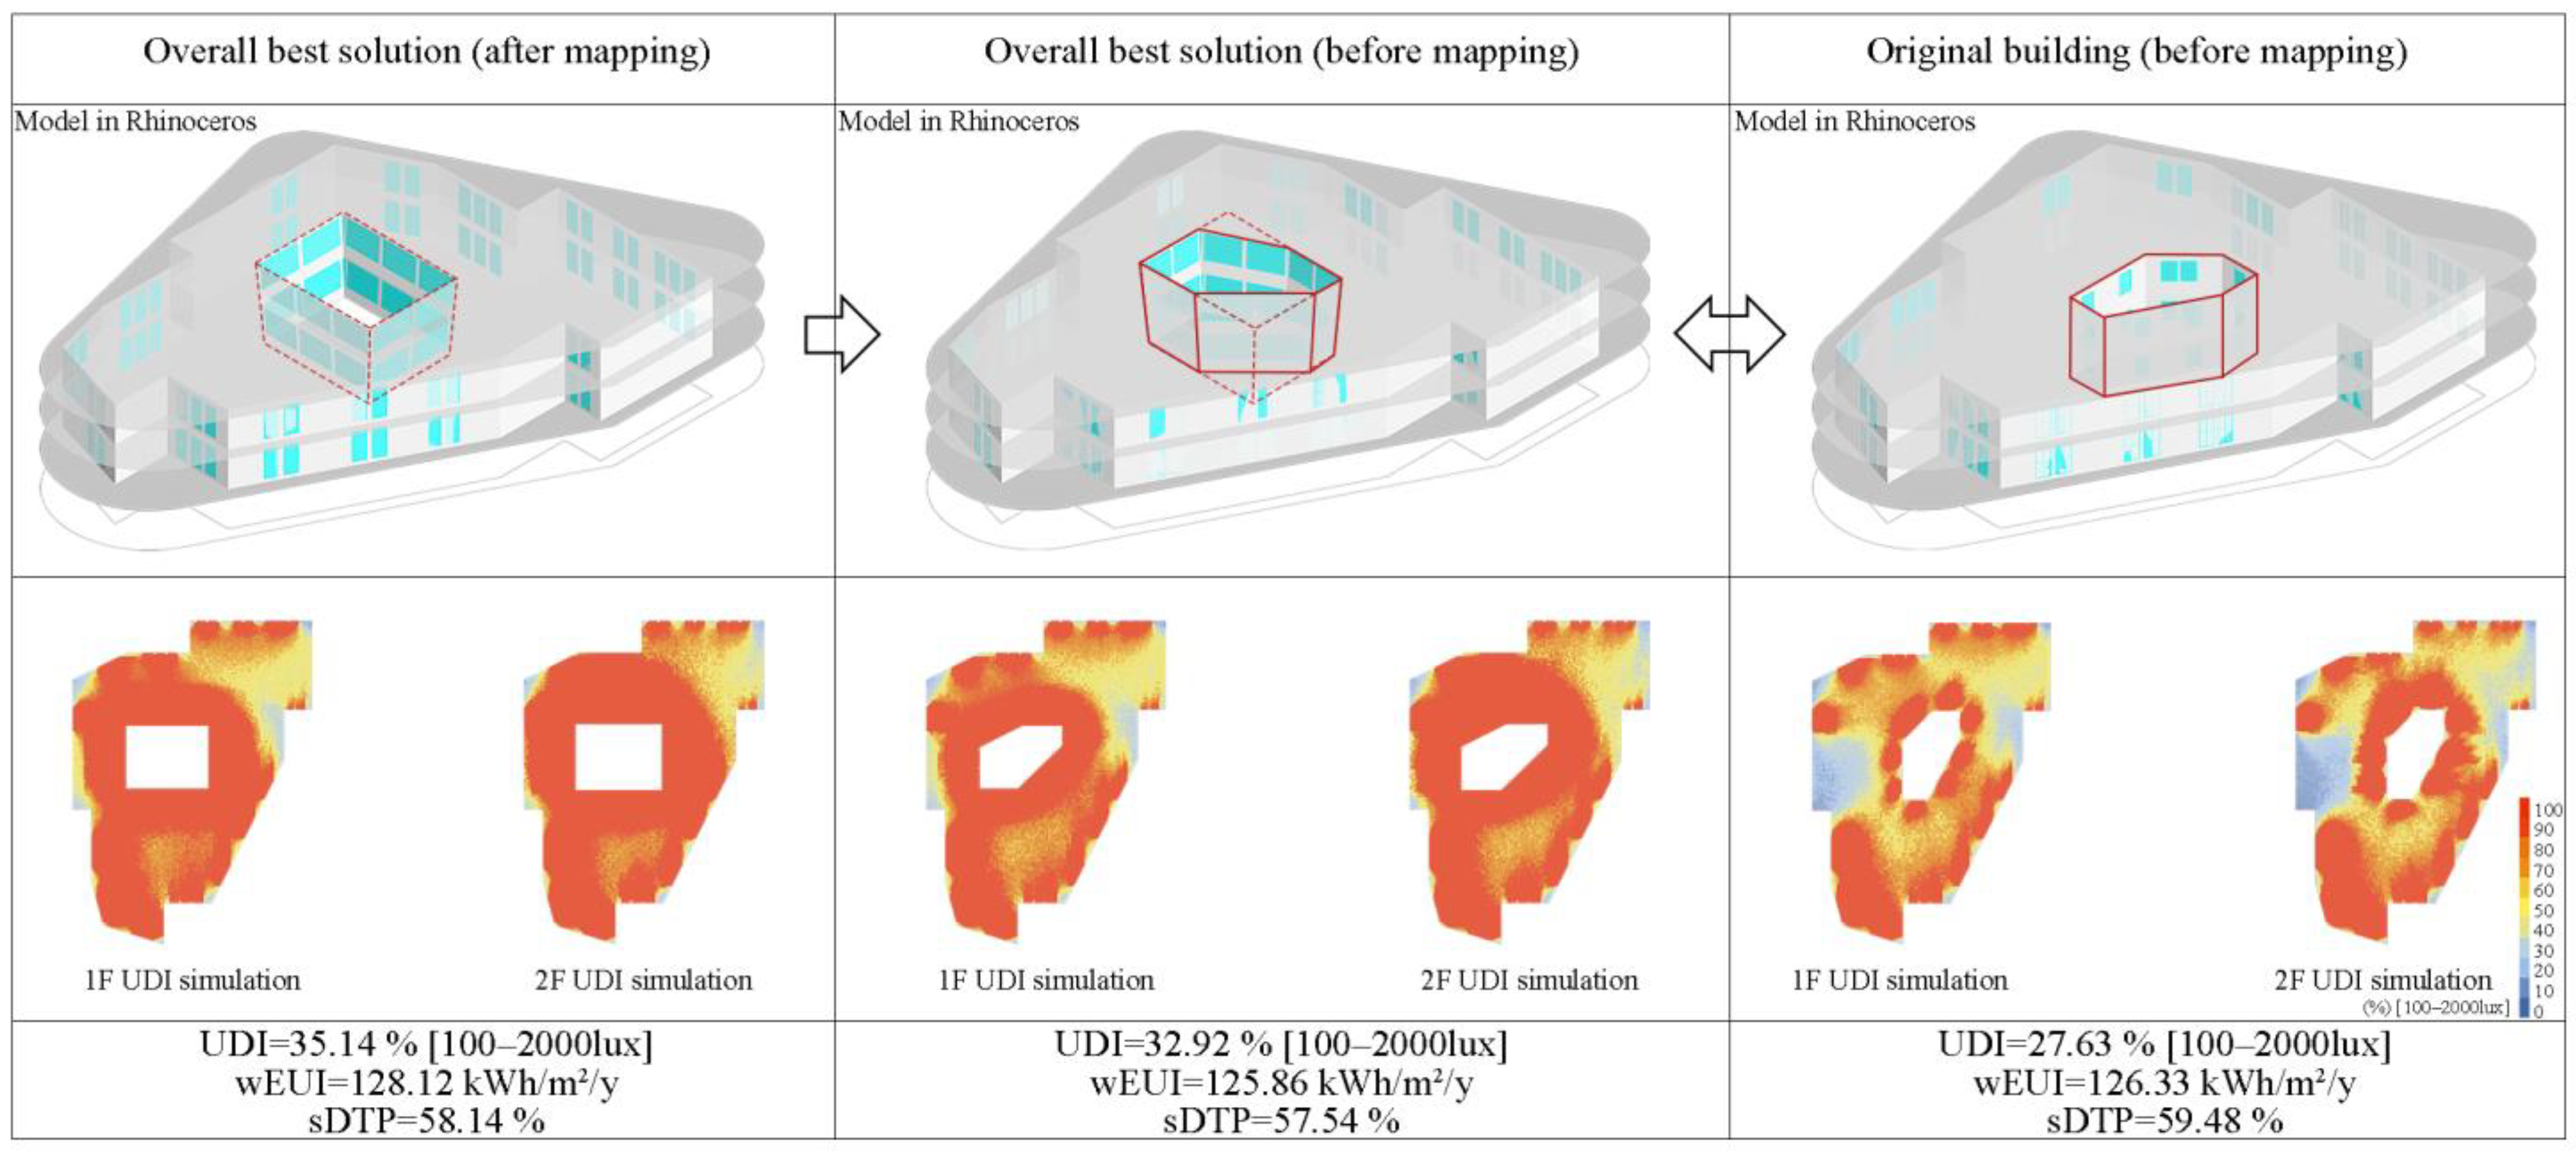
3.6.4. Comparison of Overall Best Solution with the Original Building

To further validation the result of the optimization, we identified the overall best solution’s result for restoring the building to its ‘before-mapping model’, comparing its simulation results to the original building. Subsequently, we conducted UDI, wEUI, and sDTP simulations for three scenarios: the overall best solution after mapping, the overall best solution before mapping, and the original building before mapping.
As shown in Figure 15, based on the variables of the overall best solution, the corresponding ‘after-mapping model’ can be generated and used to recover the ‘before-mapping model’ for simulation and comparison with the original building. When comparing the two models before and after mapping of the overall best solution, the ‘before -mapping model’ retains the performance characteristics of the ‘after-mapping model’. When comparing the overall best solution (before mapping) with the original building (before mapping), it can be noted that there is significant improvement in all three objectives. The improvement in the UDI, wEUI, and sDTP are 19.15%, 0.37%, and 3.26%, respectively. The improvement of the UDI is much larger than those of the wEUI and sDTP, which indicates that the overall best solution can significantly improve the UDI performance of the building, while maintaining the wEUI basically unchanged and the sDTP slightly better.
By looking at the UDI map in Figure 15, it can be noticed that the overall solution uses a different atrium shape in the long axis direction to avoid two poorly lighted areas on the east and west sides of the original building, which provides more even and abundant lighting conditions for the interior space. At the same time, the overall best solution uses a larger IWWR (larger courtyard window area), but did not increase the wEUI and sDTP of the building, which may be related to the optimization of the atrium shape and location.

4. Discussion

4.1. Results for the Tested Building

This research proposed a parametric optimization framework for the atrium design in the conceptual design towards a sustainable and comfortable built environment. Compared with other existing frameworks, it has three critical advantages:
  • Integrating daylighting environment, energy use efficiency, and thermal comfort as the purposes for atrium design in the conceptual stage, and then coming up with the UDI, EUI, and DTP as the optimization metric to measure the complex built environment and occupant’s comfort. Multiple simulations and optimization based on atrium design parameters reveal the interaction between different environmental performances and the influence of atrium design parameters. Additionally, through the analysis of the optimization results, specific design rules are obtained for the multiple environments improvement, especially discussing the correlation between these design parameters, providing new insight into building atrium design.
  • Combining the parametric design into the atrium performance optimization, and developing the geometry deformation method makes it possible to automatically search for the optimal atrium geometry design, significantly reducing the time cost. Although some other related researches also conduct automatic optimizations, however, for the limitation in developing the geometry deformation method, they often choose to optimize other configuration or material-related parameters rather than the atrium geometry-related parameters, and thus cannot fully release the potential of the atrium design’s influence on environmental performance.
  • The well index, shape ratio, volume ratio, and position index, inner WWR come up in the parametric system of this framework, fully representing the characteristic of the atrium geometry design, so that the optimization of these parameters can search for all possibilities for the atrium geometry design. At the time, multi-objective performance optimization can also be achieved more effectively with these abundant valuable searching variants.
  • With the novel geometry mapping method and geometry calculation method defined in the parametric system, this framework can be applied to general buildings, which are rarely addressed in similar research, since they mainly focus on ideal rectangular blocks or specific cases to discuss the problem. The generally applicable framework will be able to deal with different cases and achieve an extremely higher level of automation.

4.2. Limitations

Although the above-mentioned advantages make this parametric atrium design framework significantly improve the sustainable and comfortable built environment on various occasions, it still has some limitations, especially in the following parts.
  • The mapping method allows irregular atrium shapes to be transformed into rectangular ones, making the framework applicable to any atrium shape. However, the mapping method may lead to deviation in simulation. Limiting the deviation through a precise mapping method must be studied further.
  • Some parameters may have little effect on the specific performance objectives, affecting the optimization effectiveness. Sensitivity analysis needs to be introduced to evaluate the influence of the parameters on the specific optimization objectives. This way, the optimized parameters can be set based on the sensitivity analysis results, and accelerate the optimization.

5. Conclusions

This study proposed a parametric intelligent adaptive performance optimization framework for atrium design to optimize its geometry for a sustainable and comfortable environment, and to balance the effects of the daylighting environment, energy use intensity, and occupant’s thermal comfort. A complete parametric geometry system is built to facilitate the building atrium design exploration in the optimization period, which combines the parameters of well index, shape ratio, volume ratio, position index, and inner WWR as the optimized factors. These adequate design variables can significantly represent the building atrium’s geometric characteristics, thus making the geometry optimization results more valuable in practice. Furthermore, the geometry mapping method makes the parametric system generalizable and applicable to other types of buildings, thus filling the gap in previous research that only considered rectangular block buildings. The Useful Daylight illuminance, Energy Use Intensity, and Discomfort Time Percentage are used as the simulation metrics for the multi-objective optimization to comprehensively demonstrate the atrium’s environmental impact on daylighting, energy efficiency, and occupants’ thermal comfort, respectively.
A case study in Poland is carried out based on the framework. Due to the climate characteristics of Poland, the simulation metrics here are further restricted to the EUI in the heating season and the DTP in the non-heating season. The following conclusions can be drawn from the case study results.
  • The geometry mapping method proposed in the framework proved to be effective and feasible. Through the validation mapping experiment, the coefficient of determination (R2) is 0.991, 0.818, and 0.960 for the UDI, wEUI, and sDTP, respectively. The mapping method basically controls the simulation deviation within a constant range, so it will not affect the overall optimization.
  • The optimization improvement of the UDI is higher than those of the wEUI and sDTP, which can reach 43.20% in this case study, while the wEUI and sDTP are 15.52% and 3.89%, respectively. The significant optimization results show the potential of this framework in environmental performance and thermal comfort improvement, which may even bring more impactful benefits in other regions with different climates.
  • For places in the moderate climate zone such as Poland, the UDI and EUI can hardly be equally improved. Generally, the increase in UDI will enlarge the EUI to become larger. The increased UDI associated with a larger atrium or a higher IWWR may directly lead to higher energy consumption, overriding the benefits from better daylighting. In addition, the building atrium design has a relatively smaller impact on the DTP in moderate climates, since occupants’ thermal comfort depends more on the HVAC system.
  • From the analysis of the case study, PX and PY values that reach the lowest sDTP are like those that reach the highest UDI. The SR around a specific value will also result in better UDI and wEUI results. These results indicate that the specific location and shape can improve environmental performance, especially for buildings with irregular shapes and position angles. It also reveals the significance and effectiveness of introducing multiple geometry factors into optimization schemes, such as shape ratios and position indexes, etc.
  • The Pareto solutions present diverse result characteristics, thus the framework can effectively provide architects with various performance optimization solutions compared with manual adjustment.
  • In the optimization experiment, 1500 solutions were completed in about 15 h, and the average time for one solution was about 36 s. Assuming it takes 20 min to manually adjust a building model and perform multiple simulations and comparisons, the efficiency is increased by 33.33 times. Therefore, this automatic framework has strong application value in practice. As it can be applied to general buildings, this advantage of saving labor and time can be even more significant.
This framework proposed a parametric method to automatically optimize the atrium’s design in the conceptual design stage. As a result, it has proven to be highly effective in optimizing results, as well as saving time and resources. In the future, it can also define new parametric methods according to design requirements to achieve more specific optimization functions. It fully embodies the potential of parametric optimization methods in the field of performance research.

Author Contributions

Conceptualization, T.Z. and Y.J.; methodology, Y.J. and Y.H.; software, Y.J. and M.X.; validation, Y.J. and M.X.; formal analysis, Y.J. and M.X.; investigation, Y.J.; resources, Y.J.; data curation, M.X.; writing—original draft preparation, Y.J. and M.X.; writing—review and editing, Y.J. and M.X. and Y.H.; visualization, M.X.; supervision, Y.H.; project administration, T.Z. All authors have read and agreed to the published version of the manuscript.

Funding

This research was funded by the Center for the Built Environment, University of California, Berkeley (Number: 59297 24003 44) and the Fundamental Research Funds for the Central Universities, China.

Institutional Review Board Statement

Not applicable.

Informed Consent Statement

Not applicable.

Data Availability Statement

Not applicable.

Conflicts of Interest

The authors declare no conflict of interest.

Nomenclature

UDIUseful Daylight Illuminance
EUIEnergy Use Intensity
DTPDiscomfort Time Percentage
WWRWindow-to-wall ratio
WIWell index
WIDWell index depth
DFvVertical daylight factor
ADFAverage daylight factor
sDASpatial daylight autonomy
DAmaxIlluminance equals to ten times the target illuminance
DADaylight autonomy
MOOMulti-objective optimization
SRShape ratio
VRVolume ratio
PXPosition-index-X
PYPosition-index-Y
IWWRInner interface window-to-wall ratio
PPDPredicted percentage dissatisfied
MRTMean radiant temperature
wEUIWinter energy use intensity
sDTPSummer discomfort time percentage
NSGA-2Non-dominated-and-crowding sorting genetic algorithm II

References

  1. Yan, L. Discussion on Humanistic Design Method of Atrium Space in Modern Architecture. In Proceedings of the 2nd International Conference on Education, Language, Art and Intercultural Communication (ICELAIC), Kaifeng, China, 7–8 November 2015. [Google Scholar]
  2. Tse, J.M.Y.; Jones, P. Evaluation of thermal comfort in building transitional spaces—Field studies in Cardiff, UK. Build. Environ. 2019, 156, 191–202. [Google Scholar] [CrossRef] [Green Version]
  3. Ju, S.R.; Oh, J.E. Design Elements in Apartments for Adapting to Climate: A Comparison between Korea and Singapore. Sustainability 2020, 12, 3244. [Google Scholar] [CrossRef] [Green Version]
  4. Erlendsson, Ö. Daylight Optimization: A Parametric Study of Atrium Design. Master’s Thesis, School of Architecture and the Built Environment, Stockholm, Sweden, 2014. [Google Scholar]
  5. Shi, X.; Yang, W. Performance-driven architectural design and optimization technique from a perspective of architects. Autom. Constr. 2013, 32, 125–135. [Google Scholar] [CrossRef]
  6. Shi, X. Performance-based and performance-driven architectural design and optimization. Front. Archit. Civ. Eng. China 2010, 4, 512–518. [Google Scholar] [CrossRef]
  7. Ghasemi, M.; Noroozi, M.; Kazemzadeh, M.; Roshan, M. The influence of well geometry on the daylight performance of atrium adjoining spaces: A parametric study. J. Build. Eng. 2015, 3, 39–47. [Google Scholar] [CrossRef]
  8. Machairas, V.; Tsangrassoulis, A.; Axarli, K. Algorithms for optimization of building design: A review. Renew. Sustain. Energy Rev. 2014, 31, 101–112. [Google Scholar] [CrossRef]
  9. Ahmad, M.H.; Rasdi, M. Design Principles of Atrium Buildings for the Tropics; UTM Press: Skudai, Malaysia, 2000. [Google Scholar]
  10. Ghasemi, M.; Kandar, M.Z.; Noroozi, M.; Taghizadeh, A.; Namazian, S. Review the effective factors on daylight performance in the atrium buildings. In Proceedings of the 4th International Graduate Conference on Engineering Science & Humanity (IGCESH), UTM, Johor Bahru, Malaysia, 2013. [Google Scholar]
  11. Samant, S. Atrium and its adjoining spaces: A study of the influence of atrium façade design. Archit. Sci. Rev. 2011, 54, 316–328. [Google Scholar] [CrossRef]
  12. Du, J.; Sharples, S. Computational simulations for predicting vertical daylight levels in atrium buildings. In Proceedings of the Eleventh International IBPSA Conference on Building Simulation, Glasgow, UK, 27–30 July 2009. [Google Scholar]
  13. Li, J.; Ban, Q.; Chen, X.; Yao, J. Glazing sizing in large atrium buildings: A perspective of balancing daylight quantity and visual comfort. Energies 2019, 12, 701. [Google Scholar] [CrossRef] [Green Version]
  14. Kunwar, N.; Cetin, K.S.; Passe, U. Calibration of energy simulation using optimization for buildings with dynamic shading systems. Energy Build. 2021, 236, 110787. [Google Scholar] [CrossRef]
  15. Jaberansari, M.; Elkadi, H.A. Influence of different atria types on energy efficiency and thermal comfort of square plan highrise buildings in semi-arid climate. In Proceedings of the International Conference on Energy, Environment, and Economics, Edinburgh, UK, 16–18 August 2016. [Google Scholar]
  16. Ding, J.; Xiang, K. Glazed-atrium on office building energy consumption in the hot summer-warm winter region of China. In PROJECTIONS, Proceedings of the 26th International Conference of the Association for Computer-Aided Architectural Design Research in Asia (CAADRIA) 2021, Hong Kong, 29 March–1 April 2021; Association for Computer-Aided Architectural Design Research in Asia (CAADRIA): Hong Kong, 2021. [Google Scholar]
  17. Baker, N.; Steemers, K. Energy and Environment in Architecture: A Technical Design Guide, 1st ed.; Taylor & Francis: Cambridge, UK, 2000. [Google Scholar]
  18. Ge, J.; Zhao, Y.J.; Zhao, K. Impact of a non-enclosed atrium on the surrounding thermal environment in shopping malls. J. Build. Eng. 2021, 35, 101981. [Google Scholar] [CrossRef]
  19. Wu, P.; Zhou, J.; Li, N. Influences of atrium geometry on the lighting and thermal environments in summer: CFD simulation based on-site measurements for validation. Build. Environ. 2021, 197, 107853. [Google Scholar] [CrossRef]
  20. Rastegari, M.; Pournaseri, S.; Sanaieian, H. Daylight optimization through architectural aspects in an office building atrium in Tehran. J. Build. Eng. 2021, 33, 101718. [Google Scholar] [CrossRef]
  21. Guan, Z.; Xu, X.; Xue, Y.; Wang, C. Multi-Objective Optimization Design of Geometric Parameters of Atrium in nZEB Based on Energy Consumption, Carbon Emission and Cost. Sustainability 2022, 15, 147. [Google Scholar] [CrossRef]
  22. Wu, H.; Zhang, T. Multi-objective optimization of energy, visual, and thermal performance for building envelopes in China’s hot summer and cold winter climate zone. J. Build. Eng. 2022, 59, 105034. [Google Scholar] [CrossRef]
  23. Rhino 3D. Available online: https://www.rhino3d.com/ (accessed on 31 January 2023).
  24. Grasshopper 3D. Available online: https://www.grasshopper3d.com/ (accessed on 31 January 2023).
  25. Radiace-Radsite. Available online: https://www.radiance-online.org/ (accessed on 31 January 2023).
  26. EnergyPlus. Available online: https://energyplus.net/ (accessed on 31 January 2023).
  27. Ladybug Tools | Home Page. Available online: https://www.ladybug.tools/ (accessed on 31 January 2023).
  28. Evolution Engine for Grasshopper3D | Wallacei. Available online: https://www.wallacei.com/ (accessed on 31 January 2023).
  29. Zhu, L.; Wang, B.; Sun, Y. Multi-objective optimization for energy consumption, daylighting and thermal comfort performance of rural tourism buildings in north China. Build. Environ. 2020, 176, 106841. [Google Scholar] [CrossRef]
  30. Nabil, A.; Mardaljevic, J. Useful daylight illuminance: A new paradigm for assessing daylight in buildings. Light. Res. Technol. 2005, 37, 41–57. [Google Scholar] [CrossRef]
  31. Energy Star. Energy Use Intensity (EUI); Energy Star: Washington, DC, USA, 2014.
  32. Yang, L.; Yan, H.; Lam, J.C. Thermal comfort and building energy consumption implications—A review. Appl. Energy 2014, 115, 164–173. [Google Scholar] [CrossRef]
  33. EN ISO 7730-2005; Ergonomics of the Thermal Environment—Analytical Determination and Interpretation of Thermal Comfort Using Calculation of the PMV and PPD Indices and Local Thermal Comfort Criteria. International Organization for Standardization: Geneva, Switzerland, 2005.
  34. Hamed, B.E.; Dehghan, M.R. Multi-objective optimization of setpoint temperature of thermostats in residential buildings. Energy Build. 2022, 261, 111955. [Google Scholar]
  35. Nasrollah, N. Comprehensive building envelope optimization: Improving energy, daylight, and thermal comfort performance of the dwelling unit. J. Build. Eng. 2021, 44, 103418. [Google Scholar] [CrossRef]
  36. ANSI/ASHRAE Standard 55-2013; Thermal Environmental Conditions for Human Occupancy. American National Standards Institute: Washington, DC, USA; American Society of Heating, Refrigerating and Air-Conditioning Engineers: Peachtree Corners, GA, USA, 2013.
  37. Ciardiello, A.; Rosso, F.; Dell’Olmo, J.; Ciancio, V.; Ferrero, M.; Salata, F. Multi-objective approach to the optimization of shape and envelope in building energy design. Appl. Energy 2020, 280, 115984. [Google Scholar] [CrossRef]
  38. Katowice. Available online: https://web.archive.org/web/20170316205329/http://wiki.ifmsa.org/scope/index.php?title=Katowice#Climate (accessed on 31 January 2023).
  39. Sowa, J.; Mijakowski, M. Humidity-Sensitive, Demand-Controlled Ventilation Applied to Multiunit Residential Building—Performance and Energy Consumption in Dfb Continental Climate. Energies 2020, 13, 6669. [Google Scholar] [CrossRef]
Figure 1. Workflow of the whole research framework.
Sustainability 15 04362 g001
Figure 2. (a) The atrium mapping process; (b) the building plan converted after the atrium mapping operation.
Sustainability 15 04362 g002
Figure 3. Definition of WI: (a) the top and bottom planes of the atrium are the same; (b) the top and bottom planes of the atrium are different.
Sustainability 15 04362 g003
Figure 4. Definition of Shape ratio.
Sustainability 15 04362 g004
Figure 5. Definition of Position index.
Sustainability 15 04362 g005
Figure 6. Current state of Villa Reden, atrium, and second-floor plan.
Sustainability 15 04362 g006
Figure 7. Simulation model mapping and parameter variables.
Sustainability 15 04362 g007
Figure 8. Validation of the atrium mapping method through UDI simulation.
Sustainability 15 04362 g008
Figure 9. Validation of the atrium mapping method using UDI, wEUI and sDTP simulation.
Sustainability 15 04362 g009
Figure 10. The objective space of all generation solutions.
Sustainability 15 04362 g010
Figure 11. The 2D scatter plots of design variables against objectives: (a) scatter plots of all design variables against UDI and wEUI; (b) scatter plots of all design variables against sDTP and wEUI.
Sustainability 15 04362 g011
Figure 12. The value distribution of the atrium design variables and objectives in the Pareto-optimal solutions of the last generation (sub-figures: (a) WI, (b) SR, (c) VR, (d) PX, (e) PY, (f) IWWR, (g) UDI, (h) wEUI, (i) sDTP).
Sustainability 15 04362 g012
Figure 13. Model images, variables, and the objectives optimization proportions compared to the original building.
Sustainability 15 04362 g013
Figure 14. The scatter plot of the last generation (n.b. the number next to every point represents sDTP).
Sustainability 15 04362 g014
Figure 15. Simulation of the overall best solution (after mapping), overall best solution (before mapping), and original building (before mapping).
Sustainability 15 04362 g015
Table 1. Recent studies on the building atrium optimization.
ResearcherDesign Variables
(Geometry-Related)
Research ObjectGeometry Modeling MethodPerformance
Objectives
Optimization MethodTools
Du et al. [13]Well index (WI);
Well index depth (WID)
Ideal prototypeManual modelingVertical daylight factor (DFv)Step-by-step manually adjustRadiance
Ghasemi et al. [8]Width of atrium;
Height of the clerestory window
Ideal prototypeManual modelingAverage daylight factor (ADF)Step-by-step manually adjustRadiance
Li et al. [14]Atrium type;
Roof glazing area;
Atrium height
Ideal prototypeManual modelingSpatial daylight autonomy (sDA);
Illuminance equals to ten times the target illuminance (DAmax)
Step-by-step manually adjustRadiance + Diva
Jaberansari et al. [15]Atrium type;
Atrium Area ratio
Ideal prototypeManual modelingEnergy consumptionStep-by-step manually adjustDesign Builder
Ding et al. [16]Atrium plane orientation;
Plane aspect ratio;
Skylight-roof ratio;
Floor height;
Section shape;
Inner interface window-wall ratio
Ideal prototypeManual modelingEnergy consumptionStep-by-step manually adjustEnergyplus
Wu et al. [19]Area ratio;
Section aspect ratio
Ideal prototypeManual modelingOutdoor natural light illuminance;
Air temperature;
Vertical temperature difference;
Surface temperature
Step-by-step manually adjustEcotect
Rastegari et al. [20]WI;
Atrium Size
 
Specific caseManual modelingDaylight autonomy (DA);
Useful daylight illuminance (UDI)
Step-by-step manually adjustGrasshopper + Ladybug tools
Guan et al. [21]Height-span ratio of the atrium;
Atrium building volume ratio;
Skylight area ratio;
Atrium width-to-depth ratio
Ideal prototypeGeometric calculation modelingCarbon emission;
Heating and cooling energy consumption
 
Multi-objective optimization (MOO)Grasshopper + Ladybug tools
Table 2. Use daylight illuminance simulation results for different position indexes (the window-to-wall ratio for the model’s left side is 0.1, and the other side is 0; IWWR is 0.5; WI is 0.9; SR is 1.0: VR is 1.0; the location is set at Boston, MA, USA).
FactorPX = 0 PY = 0PX = 0 PY = −0.4PX = −0.5 PY = −0.4PX = 0.3 PY = −0.4
Simulation Visualization resultSustainability 15 04362 i001Sustainability 15 04362 i002Sustainability 15 04362 i003Sustainability 15 04362 i004
UDI100–200049.7547.0833.9051.37
Table 3. Energy use intensity for different WI (the window-to-wall ratio for the model is 0.1; IWWRis 0.15; SR is 1.0; VR is 1.0; PX is 0.0; PY is 0.0; the location is set at Boston, MA, USA).
FactorWI = 0.6WI = 0.8 WI = 1.0WI = 1.2
Simulation Visualization resultSustainability 15 04362 i005Sustainability 15 04362 i006Sustainability 15 04362 i007Sustainability 15 04362 i008
EUI166.41 kWh/m2146.69 kWh/m2138.09 kWh/m2133.28 kWh/m2
Table 4. Discomfort time percentage for different IWWR (the window-to-wall ratio for the model is 0.1; WI is 1.0; SR is 1.0; VR is 1.0; PX is 0.0; PY is 0.0; the location is set at Boston, MA, USA).
FactorIWWR = 0.1IWWR = 0.25IWWR = 0.4IWWR = 0.55
Simulation Visualization result
DTP
64.6063.0461.5460.26
Table 5. Building atrium design variables.
VariablesCalculation MethodInitial Value
V1: WIH × (w + l)/(2 × w × l)0.77
V2: SRw/l0.64
V3: VRC1/C21
V4: PX2 × p1/t10.08
V5: PY 2 × p2/t20.04
V6: IWWR/0.16
Table 6. Preset condition and simulation configuration of the building.
ComponentUnitTypeInitial Value
Wall construction conductivityW/mKGypsum board0.16
Wall construction densitykg/m3Gypsum board800.00
Roof construction Metal roof surface
U-value wallW/(m2K) 0.25
U-value roofW/(m2K) 0.20
U-value windowW/(m2K)Simple glazing2.04
Window to wall ratio% 0.50
Atrium window to wall ratio% 0.16
Number of people per areappl/m2 0.025
HVAC system Ideal air loads system (winter)
None (summer)
Heating setpoint °C 20
Cooling setpoint °C 25
Illuminance setpointlux 300
Room air speedm/s 0.10
Clothing levelcol 0.7
Metabolic ratemet 1.1
Table 7. Range and steps of the genes.
GenesRangeSteps
WI[0.75, 1.25]0.05
SR[0.50, 2.00]0.0625
VR[0.80, 1.25]0.05
PX[−0.15, 0]0.0625
PY[−0.15, 0.15]0.0625
IWWR[0.05, 0.6]0.05
Table 8. Summary of the reference case and 4 characteristic non-dominated solutions.
VRWIIWWRSRPXPYUDI (%) [100–2000 lux]wEUI (kWh/m2)sDTP (%)
Reference1.000.770.160.64000.0400.08030.89130.9257.87
Maximum UDI1.250.750.551.4375−0.1250.02536.01132.8758.50
Minimum wEUI and
sDTP
0.801.250.051.125−0.1000.05025.15117.2056.25
Overall best1.150.800.601.3125−0.1250.02535.14128.1258.14
Disclaimer/Publisher’s Note: The statements, opinions and data contained in all publications are solely those of the individual author(s) and contributor(s) and not of MDPI and/or the editor(s). MDPI and/or the editor(s) disclaim responsibility for any injury to people or property resulting from any ideas, methods, instructions or products referred to in the content.

