Article

The Influence of the Evolution of the Innovative Network on Technical Innovation from the Perspective of Energy Transformation: Based on Analysis of the New Energy Vehicle Industry in China

College of Management, Xi’an University of Architecture and Technology, Xi’an 710055, China
*
Authors to whom correspondence should be addressed.
Sustainability 2023, 15(5), 4237; https://doi.org/10.3390/su15054237
Submission received: 31 January 2023 / Revised: 20 February 2023 / Accepted: 22 February 2023 / Published: 27 February 2023
(This article belongs to the Special Issue New Challenges to Energy Transition and Sustainable Development)

Abstract

:
Under the dual pressure of energy transformation and environmental protection, how to use the innovative network and enhance technical innovation (TI) are significant problems for new energy vehicle (NEV) enterprises in China. Based on the patent data of China’s NEV industry from 2001 to 2022, combined with the logical framework of “Patent Analysis—Network Evolution—Empirical research”, this study deeply discusses the influence of enterprises’ innovative network on TI. It is shown that there is an inverse U-relationship between the cooperation breadth of the enterprises, and that the appropriate cooperation breadth favors TI. At the same time, structural holes, knowledge diversity and technical value have a significant positive impact on TI. In addition, the study performs a series of robustness tests and heterogeneity checks. The conclusions are conducive to further improving the study of the relationship between innovative networks and TI, which is important both theoretically and practically for promoting the energy transformation of automotive enterprises.

1. Introduction

With the aggravation of global environmental pollution, oil crisis and other problems, the NEV industry with low dependence on oil and low pollution is highly valued by the governments of all countries [1]. Currently, more than 20 percent of global carbon emissions come from the world’s transport industry. In China, where oil consumption in the transportation sector accounts for 70 percent of total domestic consumption, the issue of energy security is becoming more prominent. Different from the traditional automobile industry, NEVs mainly use batteries as power to replace the traditional internal-combustion engine, so as to reduce emissions and greatly relieve the dependence on oil [2]. The NEV industry has not only become the core of the energy transformation and upgrading of the global automobile industry, but also has a close relationship with energy reform and the promotion of sustainable development [3]. At the 75th Session of the United Nations General Assembly, Xi Jinping declared China’s goal of “peak carbon dioxide emission and carbon neutrality” to the international community. As the world’s largest automobile production and consumer, China is in the process of moving from “Made in China” to “Intelligent Manufacturing in China”. Therefore, nurturing and developing the NEV industry is a strategic option to alleviate the dual pressure of energy and the environment, and achieve sustainable development. This is of great significance to promoting China’s energy transformation and realizing the goal of “carbon peaking and carbon neutrality”.
As a material part of the global energy transformation, it is both an opportunity and challenge for China to realize the sustainable development of NEVs [4]. To conform to the development trend of the automobile industry, the Chinese government actively promotes the application, infrastructure construction and research of NEVs [1]. As Build Your Dream (BYD), Shanghai Automotive Industry Corporation (SAIC) and other traditional automobile enterprises have begun to transform to the production and research of NEVs, this industry has entered a new stage of rapid development. The annual production and sales scale of automobiles and number of power lithium battery assemblies ranks first in the world [5]. However, there is still a gap between the “three power system” and leading international level. It is difficult to break through the core technical barriers [6], low return rate of R&D investment, and narrowing of the profit space of enterprises, which are still the critical factors restricting industrial development. Facing an increasingly volatile market environment, TI has become a significant means for enterprises to participate in the market competition [7,8,9].
As a typical technology-intensive industry [10], NEVs are characterized by technical complexity and market uncertainty [11,12], and it is difficult for enterprises to complete technical upgrading and progress alone [6,13]. At this time, the innovative network of resource sharing and risk dispersion has become efficient alongside the development of innovative organization forms for the industry of NEV to reduce the cost of technology development, overcome the core technical difficulties, and narrow the gap with developed countries [11,14,15]. It is also a crucial means to realize the complementary advantages of enterprises, enhance industrial competitiveness, and achieve extraordinary development. With the gradual maturity of industry technologies, the market type of industry has gradually shifted from “policy-oriented” to “market-oriented”, and the challenges facing enterprises are more severe. How to make better use of the innovative network, transform the external knowledge into core advantages [16,17], and realize leapfrog development of the industry are significant issues faced by NEV enterprises.
At present, research using patent data for TI has become a mature analysis method [14,18]. The research in the field of NEV, especially the evolution of the innovative network and influence on the TI of the enterprise is still inadequate [19]. First, there are the limitations of the data studied. Most of the existing studies focus on the joint patent application between a certain enterprise or single type of institutions, with limited data evidence and research objects [20]. In this way, the characteristics of innovative networks cannot be explored from the perspective of enterprises and universities. Second, the inadequacy of the systematic research perspective. Existing studies only analyze a particular technique or type of vehicle, and less analysis is done on the overall patent situation of the industry. The conclusions are not highly applicable to the industry as a whole. Third, the deficiency of the methodology of the study. Most of the existing studies focus on the macro comparison of patent data between countries and statistical analysis of industry development [21]. These research methods are limited to descriptive statistics based on patents, and there are few systematic mechanistic studies through social networks and empirical analysis methods. For technology-intensive industries, however, macro-level analysis is far from sufficient. It is necessary to focus on the enterprises and study the evolution of innovative networks and the influence of NEVs.
Based on the above theoretical and realistic background, this study follows the logical framework of “Patent analysis—Network evolution—Empirical research”, and attempts to make beneficial explorations in the following three aspects: (1) Expansion of research data: This study obtains technical high-frequency words in this field based on the LDA model; and determines a patent search formula combined with IPC to obtain the patent data of China’s NEVs from 2001 to 2022. Additionally, by systematically cleaning the data, the joint patent application data of this field is obtained; and the patent situation of this industry is visually displayed. (2) Innovation of research perspective: Different from the previous single macro comparison and statistical analysis of patent data, this study applied the theory of industrial life-cycle to divide the development of China’s NEV industry into three stages. Moreover; the innovative networks of multi-type participants of NEVs are constructed separately. We systematically analyze the characteristics and evolution of innovative networks from the three aspects of network structure, key participants, and network content [22]. (3) Innovation of research methods: This study breaks the fixed paradigm of “structure—effect” in the field of network and integrates network structure and network content into an analytical framework. The impact of the enterprise innovative network on TI is analyzed through social networks and empirical analysis. Additionally, we also conduct heterogeneity checks based on the differences in ownership, type, and region of the enterprise to improve the research of the relationship between the innovative networks and TI of NEV enterprises. These conclusions provide theoretical and practical guidance for the NEV enterprises to improve their TI and achieve technological catch-up on the curve, overtaking competition by leveraging innovative networks.
The composition of this study is as follows. Section 2 is devoted to the analysis of the network evolution. Section 3 and Section 4 introduce the assumptions and study design. Section 5 contains the empirical research, robustness tests, and heterogeneity checks. Section 6 discusses the research conclusions, reveals theoretical and practical implications, and presents limitations and future research.

2. Network Evolution Analysis

2.1. Data Source

2.1.1. Data Collection

In 2021, eight Chinese companies, led by BYD, accounted for 38% of global sales of NEVs (see Figure 1). Chinese enterprises play a pivotal role in the global NEV industry. Therefore, the analysis of the development of the NEV industry in China is of prominent reference for the global industry.
Referring to the common practice of scholars, this study uses patent data to build the innovative networks [23,24]. Considering that SAIC, Geely and other companies are traditional automobile companies, the data collected may include patents related to traditional automobile manufacturing. This study uses the LDA model, divides the title, IPC, abstract and other text content of the patent data, statistics the high-frequency words closely related to the technology, and excavates the technical hot-spots in the field of NEV (see Figure 2). Through the comparison of IPC, the number of patents of battery (H01M,H02J), the electric drive (B60L,B60K) and electronic control (H02P) account for more than 70%, which are pivotal technologies to promote the development of NEV. Therefore, this study combines the technical hot-spots and IPC to determine the patent retrieval formula, expand the data scope [12], and ensure the integrity of the samples.
As early as 1991, the technical development of NEVs and key components were launched by the Chinese government. However, due to technical barriers and backward consumer concepts, the industry has been in the embryonic stage of technology and less patent data is available. The NEV industry has been growing rapidly since 2001, as the concept of energy transformation and environmental protection has deepened. As a result, this study has collected 357,000 patent applications for the Chinese NEV industry from 2001 to 2022, including Publication Number, Title, Application Date, IPC, Current Assignee, Inventor, Patent Value and other vital fields. Technology research is an activity with a low success rate. Using only licensed patents to build the network, while ignoring partnerships in failed innovations, the innovative partnerships of each subject cannot be fully characterized. Therefore, patent applications, rather than licensed patents, were used in the construction and analysis of the network. Patent data were included in the State Intellectual Property Office of China [25].

2.1.2. Data Cleaning

To ensure the integrity of the conclusions of the study, the patent data were cleaned. First, exclude the appearance of design patents. Considering that NEV is a technology-intensive industry, the technical value of the appearance design is low. The patents of appearance design are not included in our study. Second, patents unrelated to NEV are removed. The raw data obtained from keyword retrieval inevitably contain some errors. In this study, the accuracy of the data is guaranteed by manual screening. Third, the screening of joint patent application data. To build an innovative network, it is necessary to remove the patents in which the applicant is an independent participant. Therefore, patents applied jointly by two or more applicants are screened out.
According to the above principles, the data are systematically cleaned and noise-reduced. This study finally obtained 9852 joint patent application data in the field of NEV. The essence is an interactive and innovative process in which organizations are embedded in social networks and carry out knowledge flow and resource integration [26]. It can reflect the sharing and transfer of knowledge across organizations.

2.2. Network Construction and Evolutionary Analysis

2.2.1. Division of Network Stages

As can be seen in Figure 3, China’s NEV production rose from 13,000 in 2012 to 7.058 million in 2022, showing the characteristic of distinct phases. Based on the theory of product life cycle and the development indicators [27], we divide the development of China’s industry of NEV into three stages.
Phase I: Technology import. Output and the number of joint patent applications grew slowly,
Phase II: Technology growth. Output and the number of joint patent applications increased at an increasing rate,
Phase III: Technology maturity. Output and the number of joint patent applications is exploding.

2.2.2. Network Construction

To further analyze the characteristics and evolution process of the network, this study visually shows the three stages of the innovative network in the NEV industry (see Figure 4).
The first step is to extract the patent applicant. The same patent may involve multiple patent applicants, so we separately extract the major participants in TI of the three phases.
The second step is to obtain the adjacency matrix. Through joint patent applications, the cooperative relationship between the participants is extracted and the 0–1 relationship matrix is constructed.
The third step is to draw up the innovative networks. The adjacency matrix is imported into the Ucinet to map the innovative networks in the three phases of NEV in the Chinese industry, and then their network characteristics are calculated. Ucinet can only compute up to 32,767 nodes. When the amount of data is large, it needs to use Python (NetworkX and pyecharts) (see Table 1).

2.2.3. Network Evolution

Overall, the innovative network is in an active phase, with new participants joining in all three periods, and the number of new participants and relationships is larger than the number of major participants and disappearing relations. It shows that the industry has entered a phase of rapid development as the Chinese government’s policies and industrial layout continue to be adjusted. Enterprises pay great attention to external knowledge acquisition and innovative collaboration. Specifically, this study analyzes the evolution characteristics of the network from the three perspectives of network structure, key participants, and network content [28].
First of all, from the perspective of network structure: the scale of the innovative network is increasing [29]. There is a clear trend of increasing cooperation between key participants in TI, cooperation relations and the number of collaborations. With the addition of a large number of the key participants, the expansion of the network scale dilutes the overall partnership, resulting in a decrease in the network density. The network structure changes from “loose” in the technical import period to “core-periphery”. In the technology maturity period, the “core-periphery” still exists. The “core—periphery—multicore” structure has been formed, the core organization is gradually highlighted, and a group of more closely connected small groups appears in the network periphery. At this point, a large-scale network can accelerate the flow of resources within the industry [30], and the emergence of small peripheral groups provides a rich organizational basis for achieving breakthrough TI.
Secondly, the NEV industry shows the characteristics of multi-participant integration and innovation, including state-owned enterprises, joint ventures, private enterprises, research institutes, universities and individuals. As can be seen from Figure 5, the dominant position of enterprises in TI is continuously strengthened as the industry continues to develop. At the same time, 403 universities, including Tsinghua University, Chongqing University and other scientific research institutions, as the major participants in technological research, occupy the advantage of structural holes in the innovative network. They can provide a path for enterprises with large gaps in innovative ability to exchange knowledge, reduce the search costs of peripheral enterprises and play major roles in the innovative network of the NEV industry.
Finally, this study focuses on network content (see Figure 6). Among them, the proportion of battery technology increased from 4.34% to 17.32%, and is the fastest growing technology; vehicle power system and control system accounted for the largest proportion (25%), becoming the best-developing technology at this stage. Among them, three electric technologies (battery, motor, electric control) are still experiencing technical difficulty in the industry, and they urgently need to achieve technical breakthroughs.

3. Research Hypothesis

Based on the visual display and evolutionary analysis of the innovative network, this study constructs a theoretical model to improve the influence of the innovative network on enterprise TI in the NEV industry.

3.1. Network Structure and TI

Unlike the traditional automotive industry, NEV is a technology-intensive industry. It is difficult for enterprises to complete technology upgrade and progress independently [31]. To analyze the effect of network structure, this study focuses on the breadth of cooperation and structural holes.
First of all, the high cooperation breadth means that this enterprise has a large number of partners, so it can obtain more heterogeneous knowledge and resources in the communication with partners [32]. It will help enterprises break the organizational inertia formed in previous R&D activities, stimulate the thought collision within the network, and help enterprises more effectively carry out transfer of information and integration of resources [33]. At this time, enterprises have abundant resources for innovation at their disposal as information-gathering points in the network. To a certain extent, they can obtain the support of R&D funds and human resources [12], transform external resources into competitive advantages [34], and promote their own TI.
However, if the breadth of cooperation is large, it will bring some harm to the enterprise. For example, when the enterprise has more partners, it may lead to excessive relationship embedding, which can easily lead to hitchhiking behavior [35]. When the enterprise has more partners, it may lead to excessive relationship embedding, easily leading to hitchhiking behavior [1]. Enterprises will fall into the “relationship trap” in the process of partner identification, leading to the prevalence of opportunism and hindering the process of enterprise innovation. At the same time, when the breadth of enterprise collaboration is large, it leads to internal information redundancy, which affects the way knowledge is exchanged within the network. Enterprises need to invest more energy and time in the management and supervision of their partners, as adding them aggravates the burden of information screening and relationship maintenance. Correspondingly, we propose the following hypothesis.
H1. 
The cooperation breadth of enterprise with TI is an inverted U-shape relationship.
When two nodes in the network are connected to an intermediate node at the same time, but there is no connection relation between them, the intermediate node becomes a “bridge” for the information transmission [36], also known as the “structural hole” (see Figure 7). Compared with other members of the network, more innovative resources and opportunities for cooperation can be obtained by enterprises with structural holes [37].
On the one hand, as a strategic emerging industry, the distribution of knowledge, technology and other resources within the innovative network of NEV enterprises is stochastic. The enterprise occupying the structural hole could provide a path for different types and different geographical network members to exchange technology and knowledge [38], and inject updated knowledge elements into the innovative network [39]. At this time, abundant and heterogeneous information and resources can improve the ability of enterprises to identify and screen effective information [40]. It will help enterprises to grasp more heterogeneous knowledge, and reduce information lag and uncertainty risks such as knowledge homogeneity faced by enterprises in their innovation, and stimulate the innovative vitality of enterprises.
On the other hand, enterprises occupying the position of the structural hole play their control advantages in the process of information transmission, use the critical information and resources in the network to serve themselves, accelerate the flow and dissemination of effective information [41], and give enterprises the possibility of innovation through existing resources [42]. This effectively reduces the dependence of enterprises on other enterprises in terms of resources and technology [43]. It can help NEV enterprises to obtain industry information in a timely manner and improve the accuracy and effectiveness of innovative decisions. Finally, the structural holes have a positive impact on the TI of NEV enterprises. Based on the above analysis, the following hypothesis is proposed:
H2. 
Structural holes occupied by enterprises have a significant positive effect on TI.

3.2. Network Content and TI

The essence of cooperation between enterprises is a process of knowledge transfer and resource integration through joint patent application and patent transfer [44]. The innovative network can reflect the sharing and flow of network content (technology, knowledge, and other resources) among organizations [45]. Therefore, the article further pays more attention to the function of network content (see Figure 8).
The more diverse the knowledge of the enterprise, the more knowledge can be used. It could avoid enterprises from falling into the dilemma of rigid technology development, improve the flexibility and compatibility of enterprises in using knowledge [45], and enhance the efficiency of innovation. At the same time, having additional knowledge can help enterprises to identify the technologies with potential value. Once the demands of the market change, enterprises can quickly identify fresh opportunities and vital knowledge in different fields of the technologies [46], adjust the direction of innovations, timely deploy the R&D resources, and process information more efficiently, so as to obtain more novel ideas and methods [47]. This knowledge and these technologies provide sufficient opportunities for enterprises to perform R&D activities in neoteric knowledge fields [48], help enterprises to gain greater competitive advantage, and further promote their TI.
In addition, the diversity of knowledge provides opportunities for enterprises to search for knowledge, broadens the channels for considerable information exchange [49], and helps enterprises to effectively identify and obtain valuable information [37]. The greater the diversity of knowledge, the more knowledge an enterprise can share with network members. Both parties can bypass technical barriers to access confidential and innovative information and help companies access advanced technology in the industry. At this time, enterprises have the opportunity to access cutting-edge knowledge and high-tech talent in the industry, which can reduce the R&D cost and share the risk of TI [50]. Finally, the internal members of the network are based on their R&D advantages, relying on the innovative network of resource integration to carry out the division of labor and cooperation, to achieve TI [51]. Based on this, the following hypothesis is made in this study.
H3. 
Knowledge diversity of enterprises has a significant positive effect on TI.
The rapid development of the modern manufacturing industry benefits from innovative cooperation among organizations [14]. As the primary vehicle for the transformation of scientific and technical achievements, patents can measure whether a company has sustained competitive advantage and innovation capability during the process of innovative collaboration. The industry of NEV involves complex and diverse technical links and the high cost of innovation [37]. To reduce R&D costs and alleviate product risks, more and more enterprises are cautious when choosing partners, and they are more inclined to cooperate with enterprises with strong financial strength and innovative ability [52].
The reason for this phenomenon is that the development of “technology—patent—product” is a long and uncertain process. It is difficult to observe the expected profit level of enterprises only through the number of patents. The relatively large value of patents held by enterprises can reduce the complexity and uncertainty of TI, and enterprises can expect more product benefits. With the dual insurance of “leading technology + large revenue”, enterprises with large technology value can expand financing channels to ensure the smooth transformation of their innovative achievements. At the same time, these advantages can attract more partners to join, strengthen the knowledge exchange and cooperation efficiency of the members within the network, and promote their TI. Therefore, this study proposed the following hypothesis:
H4. 
The technical value of the enterprise has a significant positive effect on TI.
The theoretical model used for this study is shown in Figure 9.

4. Research Design

4.1. Sample Collection

To explore the impact of innovative networks on the TI of NEV enterprises, it is necessary to screen 3561 key participants of innovative networks. First, the repeated participants from the three stages were removed to obtain the labels of 2957 key participants. Second, universities, research institutions, individuals, and enterprises with serious data losses were excluded. Thirdly, considering the availability of various indicators in the empirical analysis and representability of the sample, the conditions for sample screening are limited. In the end, the sample of this study is 1706 NEV enterprises.

4.2. Variable Construction

4.2.1. Dependent Variables

Technical innovation (TI): A patent is a carefully examined and certified achievement, with both innovative and application value. It can be a good measure of the TI of enterprises [53]. To avoid the data homology and prevent the endogenous problems due to reverse causality, in this study, we choose to measure the number of licensed patents in the t-year of the NEV enterprise i. The greater the number of licensed patents, the stronger the TI of the enterprise.

4.2.2. Independent Variables

1. Cooperation breadth (GD): Measured by the number of partners in the enterprise’s egocentric network (the number of edges in the network). The larger this value, the greater the breadth of enterprise collaboration and the richer the resources available for innovation.
GD i = j = 1 g a ( i , j )
In particular, a(i,j) is the binary variable. If i and j are connected, a(i,j) = 1. And g represents the number of nodes in the innovative network.
2. Structural hole (SH): This study uses the constraint to measure the number of structural holes. The more structural holes the enterprise occupies, the stronger the information and control advantage it can obtain. The calculation formulas are as follows:
p i j = a i j + a j i k ( a i k + a k i )
C i = 2 j ( p i j + q , q i , q j p i q p q i ) 2
In particular, j represents all collaborators connected to i, while q is the third participant except i and j. And aij is the weight of edges between two points i, j and pij the strength of i, j. The piq represents the proportion of enterprise i invested into q.
3. Knowledge diversity (KS): It is measured by the total number of IPC subcategories applied for in the t-year of enterprise i. The greater the knowledge diversity, the more knowledge available to the key participants in TI.
4. Technical value (TV): The technical value is measured by the total patent value in the t-year of the enterprise i. The greater the technical value, the greater the economic benefits expected to be obtained, and the stronger the sustainable competitiveness. To reduce the gap between orders of magnitude, the variables are treated logarithmically.

4.2.3. Control Variables

In addition to observing the independent variables, this study also controls for the factors that may affect the TI of enterprises to ensure the robustness of the results [50]. The names and definitions of the variables are listed in Table 2.

4.3. Inspection Methods

In this study, the model is tested by the negative binomial regression model [54]. The reason is that the dependent variable is a non-negative count variable, which is excessively discrete and does not satisfy the condition that the mean is equal to the variance, so that the Poisson model cannot be used for fitting. The negative binomial regression model allows one to establish a more flexible relationship between the mean and variance, essentially introducing an independent random effect into the conditional mean to explain the part of the conditional variance over the conditional mean [55]. At the same time, since the samples in this study are NEV enterprises, the dependent variables will not be zero and the null expansion problem for the independent variables need not be considered.
I P i t = e x p ( β 1 C o n t r o l s + β 2 G D i t + β 3 G D i t 2 + β 4 S H i t + β 5 K S i t + β 6 T V i t + μ i t )
Among them, i represents the enterprise; t represents the year;   I P i t represents the number of enterprise i in t year;   C o n t r o l s represent the control variable; GDit means the cooperation breadth of enterprise i; SHit represents the structural hole of enterprise i; KSit represents the knowledge diversity of enterprise i; T V i t represents the technical value of enterprise i; β1β6 is the regression coefficient; μ i t is the random error.

5. Empirical Research

5.1. Descriptive Evidence

Table 3 shows the basic description of the variables and the correlation coefficients for which the variables are reasonable. Meanwhile, the variables were tested for the variance inflation factor and the maximum VIF was 4.81, indicating that there was no multivariate linearity among the variables. The empirical tests in this study were analyzed using Sata17.0.

5.2. Testing Hypotheses

The regression results are shown in Table 4. Model 1 is the reference model with control variables added. Model 2 is added to the cooperation breadth and its square term on the basis of Model 1. According to Model 2, the coefficient of the cooperation breadth is significantly positive and the coefficient of the quadratic term is significantly negative. Therefore, there is an inverted U-shaped relationship between the cooperation breadth of enterprises and TI, which has been verified in H1. Model 3 is added to the structural hole on the basis of Model 1. As can be seen from model 3 (p < 0.01, β = 3.852), the structural holes occupied by enterprises have a significant positive impact on TI, and H2 is verified. Meanwhile, Model 4 and Model 5 are added to the knowledge diversity and technical value on the basis of Model 1, and H3 (p < 0.01, β = 0.044) and H4 (p < 0.01, β = 0.304) are verified. The results show that the knowledge diversity and technical value of enterprises play a positive role in promoting TI. Model 6 is a complete model, that is, all variables are included.

5.3. Robustness Tests

To further validate the regression results, the key variables are replaced. The TI of NEV enterprises in China is measured from multiple perspectives.
First, to avoid endogenous problems due to measurement errors, the number of licensed patents is replaced by the number of cited patents. The regression results are shown in Table 5, and the conclusions further support the robustness of the article. Second, because the patents from the application to the authorization also need to go through acceptance, preliminary examination, public, actual trial, and other processes. Generally speaking, it is announced 18 months from acceptance, and about 3 years to obtain authorization (or even longer) [24].To avoid the influence of the network hysteresis in this study, the number of patent applications is delayed for two cycles. Subsequently, the lagged variables are put into the model for re-estimation, effectively avoiding the endogeneity problem. The results show that the regression results are still significant. These conclusions further verify that the study does not suffer from the network problem caused by reverse causality.

5.4. Heterogeneity Checks

With the empirical analysis presented above, we have fully tested the null hypothesis. A more material question, however, is which companies are better promoted by innovative networks. Heterogeneity analyses are required to identify the sources of heterogeneity in our findings.

5.4.1. Heterogeneity in Ownership

At present, there are two developmental patterns for the innovative cooperation of NEV in China: private enterprises as the core and state-owned enterprises as the core [56]. Although these automobile enterprises entered the industry relatively late, they have developed at a fast pace, relying on abundant capital and policy support. On the contrary, private enterprises, which are sensitive to the market and flexible in their strategic adjustments, also have certain advantages in terms of TI. Therefore, we distinguished two sub-samples of state (21.86%) and non-state enterprises (78.14%) to examine the impacts of innovative networks on different ownership enterprises.
Table 6 shows that the results are in general agreement with the conclusions of the original model, but the coefficient of regression for non-state-owned enterprises is larger and more significant than that for state-owned enterprises. This suggests that the influence of innovative networks on the technical innovation of non-state-owned enterprises is more significant. The reason is that: compared with state-owned enterprises, non-state-owned enterprises face greater market competition. They are in urgent need of sharing the risks of technical innovation with their partners and improving technical innovation through the innovative network.

5.4.2. Heterogeneity in Type

The type of enterprise is further subdivided. Some are traditional automobile manufacturers, such as: BYD, Geely, and others. These enterprises have long-term technical experience, occupy certain automobile markets, and can update their product lines in a timely manner according to the market demand. There is also a new breed of emerging automotive companies, represented by NIO, Ideal, and others. Businesses in this category have updated their offerings with an Internet-minded focus on smart control experiences. Its products and services are popular with younger customers. Therefore, according to the division of the development stage of NEV, this study takes 2015 as the time point to distinguish the two types of NEV enterprises, and divides the sample into traditional (53.87%) and emerging automobile enterprises (46.13%), to investigate the impact of the innovative network on different types of enterprises.
As can be seen from Table 7, the function of innovative network characteristics is more prominent for emerging automobile companies. The reason is: traditional automobile enterprises have strong industrial foundations and technical reserves, and mastered relatively mature R&D resources. They have competitive advantages such as market drive and technology leadership in the transformation from traditional (fuel vehicles) to NEV. Otherwise, emerging enterprises, as new entrants to the industry, need to continuously enhance technical cooperation and academic drive. They need to rely on innovative networks to realize the transfer and sharing of critical technologies and core resources within the industry, improve the efficiency of R&D and the quality of innovative products, and seize market opportunities. Finally, they can find novel growth points and secure a place in the fast-growing industry competition.

5.4.3. Heterogeneity in Region

According to the data disclosed by the China Association of Automobile Manufacturers, there are more NEV enterprises in Guangdong, Zhejiang, and Jiangsu provinces. The reasons are as follows: (1) The development level and policy implementation effect of enterprises in different geographical locations are different. For example: Guangdong province, on China’s southeast coast, is adjacent to Hong Kong and Macao. As its representative city, Shenzhen is the central city of the “Guangdong-Hong Kong-Macao Greater Bay Area” and also the gateway city of China’s opening to the outside world. BYD, Waltmal, and other well-known enterprises in the field of NEV are located here. Therefore, the region has location, policy, and technical advantages that can contribute to the R&D and product renewal. (2) Due to technical limitations, the performance of power batteries in a low temperature environment will decrease significantly. This reduces the capacity of the battery, which in turn reduces the range of the car. If air conditioners are frequently used in low-temperature environments, the loss rate will be higher. To a large extent, it leads to the situation of “hot in the south and cold in the north” in the use of NEVs in China.
Therefore, according to the degree of economic development in each region, this study divides the enterprises into three sub-samples: the eastern region (77.91%), central region (13.77%) and western region (8.32%). An analysis of heterogeneity based on differences in enterprise location shows that the breadth of cooperation plays the most significant role in TI in the eastern and western regions (see Table 8).
The reason is: (1) the eastern region has a relatively developed economy. The Pearl River Delta region and the Yangtze River Delta region have gathered more than 100 industrial parks with an annual industrial output value of more than 10 billion yuan, with good industrial foundations and technical reserves. At the same time, thousands of large enterprises such as SAIC and Geely are located here, making it an industrial hub for NEV. Therefore, the eastern region has a strong clustering effect, which can give full play to the dominance position of enterprises in TI. Compared with the status of the central and western regions, the industrial cooperation in the eastern region is relatively close, and the role of the breadth of cooperation is more significant. (2) the number of structural holes, knowledge diversity, and technical value play a more significant role in promoting the western region. In terms of financial support and technical assistance, the policies of Chongqing, Sichuan, Guangxi, and Shaanxi provinces support the development of the western region. Meanwhile, the regions also have famous domestic universities such as Xi’an Jiao Tong University and Chongqing University. To a certain extent, each participant can innovate and disseminate knowledge through the innovative network to realize complementary resources and transform scientific and technical achievements. In general, the eastern region has unique technical advantages, while the western region has strong policy support. In contrast to the central region, the innovative networks play a more pronounced role in TI in the eastern and western regions.

5.5. Discussion

According to the different joint applicants of patents, this study divides the cooperation types into three categories: “external cooperation, internal cooperation and industry-university-research cooperation” (see Figure 10). Among them, the cooperation between enterprises and research institutions (include: universities and research institutions) accounts for a large proportion (43.73%), and there is no competitive relationship between the research institutions and enterprises. For enterprises, in the development process of frontier technology, research institutions are the most reliable cooperative partner [57,58]. Therefore, this study introduces the virtual variable “cooperation type”. If the enterprise has cooperation with a research institution, it is recorded as 1; otherwise, it is recorded as 0. According to the results, the industry-university-research cooperation plays a major role in promoting the TI of enterprises.
The reason is as follows: As a major location for knowledge innovation, research institutions have an advanced base of knowledge and innovative talent. In particular, the structural holes of Tsinghua University, Zhejiang University, Sun Yat-sen University, and other famous universities are at the forefront of the key participants in TI. It means that universities, as the “broker” of the network, can connect other different participants, and provide a path for the technology and knowledge exchange between participants with a large gap in innovative ability. They play a significant role in promoting innovative cooperation. Therefore, enterprises should strengthen cooperation with research institutions. With the support of the innovative network, each participant should realize complementary resources to rapidly improve TI.
At the same time, compared with external cooperation, internal cooperation is more common in the industry of NEV. The reason for this phenomenon is that: compared with the industry of traditional automobile manufacturing, the NEV industry, as an emerging technology, has the characteristics of “winner-takes-all”. A few enterprises occupy a core position in the network, and they have mastered all kinds of resources and knowledge needed for technical development to guide the direction of technical development. To maintain the core competitiveness of their own technologies, the behavior of the technical monopoly is relatively common. Most of the leading technologies are developed independently by these companies, and they do not collaborate with other companies.

6. Conclusions

6.1. Theoretical Contribution

According to the logical framework of “Patent Analysis—Network Evolution—Empirical Inspection”, this study extracts the keywords of technical hot-spot in the field of NEV through the LDA model, obtains the patent data of China’s NEV from 2001 to 2022, and visually shows the indicators of joint innovation within the industry and overall patent situation in this field. Furthermore, based on the perspective of multiple types of participants such as enterprises and research institutions, combined with the product life cycle theory, the development stage of the NEV enterprise is divided and identified, and the innovative network of the three stages under the integration of multiple participants of NEV is completely depicted. Subsequently, the evolution trends and characteristics of the innovative network of the NEV industry are systematically analyzed from three aspects: network structure, the key participants, and network content. The conclusion is that there are large differences in the network structure at different evolutionary stages. The position of core organizations is becoming increasingly prominent; the network presents diversified cooperation and development; and the joint patent applications among different types of organizations are becoming more and more significant. By virtue of their central position in the network, enterprises facilitate the flow and distribution of innovative elements such as knowledge, information and technology among nodes, and play a leading and organizational role in the agglomeration of industrial innovation. These conclusions could deepen the understanding of innovative networks in the management of NEV domains.
Most of the previous studies on NEV remained at the level of statistical analysis of patent data. They lack systematic and quantitative research of the NEV innovative network from a network perspective, which does not accurately characterize the impact of the innovative network. In this study, the characteristics of innovative networks are introduced into the discussion of TI. Based on the data of 1706 NEV enterprises, the influence of network characteristics on the TI of enterprises is deeply analyzed from the two dimensions of network structure and network content. The research found that: (1) Moderate cooperation breadth can significantly promote TI. However, when the cooperation breadth is too large, enterprises easily to fall into the relationship trap, which is not conducive to the benign development of TI. (2) The structural holes occupied by enterprises have a significant positive effect on TI. Enterprises in the structural hole position benefit from the differences in knowledge and technology held by different partners. By controlling the allocation of information and resources in the network, they can obtain innovative information earlier than other colleagues, and enhance the ability to acquire resources in the innovative network. (3) The knowledge diversity of NEV enterprises has a significant positive effect on TI, which can avoid enterprises from falling into the dilemma of rigid technical development, promote the knowledge flow and transfer within the network, and improve the efficiency of innovation. (4) The technical value of NEV enterprises has a significant positive effect on TI. The greater the patent value, the more likely the enterprise has the double insurance of “leading technology + expected profit”, which can reduce the complexity and uncertainty in the innovative process, attract more participants to join in, and promote its own TI. (5) Finally, this study deeply analyzes the results of the potential heterogeneity of different regions and enterprise types. The results show that, first, compared with state-owned enterprises, the innovative network plays a prominent role in the TI of non-state-owned enterprises. Second, the characteristics of innovative networks have a more prominent role for emerging automobile enterprises. Third, innovation networks have a more significant impact on the eastern and western regions due to the regional difference. To some extent, our research has enriched and improved the theory of technical innovation and social networks, broadened the research perspective of the industry of NEV, and provided theoretical inspiration for exploring the influence of innovative networks on enterprise TI.

6.2. Practical Implications

Based on the conclusions of the study, this study presents proposals from both government and enterprises.
From the perspective of government policy formulation and industrial layout: The global automobile industry is accelerating its integration with energy, transportation, information, and communications. The NEV industry will have greater development opportunities and wider scope for development. The government should encourage both horizontal and vertical cooperation. On the one hand, the horizontal cooperation refers to the cooperation between NEV enterprises. For industrial development, enhancing the size and strength of the innovation networks and strengthening the division of labor and cooperation among different participants are of significance to reduce TI and promote industrial cluster development. The government should provide innovative resources to enterprises, promote cross-linkage and cross-field cooperation among enterprises, and strengthen the construction of the innovative consortium and innovative consortiums for the NEV industry. On the other hand, vertical cooperation means cooperation between universities, research institutions, and NEV enterprises. As the main position of knowledge output and scientific and technical personnel training, universities have an advantage in absorbing and integrating the knowledge of different types of participants. The government should give full play to the advantages of scientific resources in universities and research institutes. Through the establishment of an innovative ecosystem with deep integration of industry, university, and research, the industry will carry out basic R&D, the transformation of achievements and scientific research personnel training, to help the high-quality development of the industry of NEV. Finally, the global NEV industry will be increasingly competitive as subsidies in China decline and the global industrial landscape changes. The Chinese government should give full play to the leading role of enterprises in the integrated innovation of industrial chains, make breakthroughs in generic industrial technologies and key technologies, and promote the upgrading of traditional industries. At the same time, we will explore cutting-edge technologies and develop future industries to seize a leading role in the commanding heights of global future industries.
The conclusions have significant theoretical and practical implications for promoting the growth and development of enterprises. The transformation of the traditional automobile industry into NEVs has become an unstoppable development trend due to non-renewable oil, the continuous deterioration of the environment and growing environmental awareness. Enterprises should strengthen cooperation with external organizations and maintain the openness of innovative networks. The choice of partners should not only be limited to within the group or in competition, but should also be moderate, with partnerships with research institutions, universities, and upstream and downstream enterprises in the industrial chain to lead and drive the industry’s integrated innovation and rapid development. At the same time, the enterprise should not only give full play to the “relationship advantage”, absorb the knowledge and resources needed for innovation, enhance its own information and control advantage, improve the transformation of the innovative achievements; but also avoid the “trap of relationships”, moderately expand the patent innovative network, avoid the homogenization of knowledge in the enterprise, and maintain its heterogeneous advantages.

6.3. Limitations and Future Research

Our study has the following limitations: (1) This study analyzes the influence of network characteristics on TI based on the network perspective. However, what factors affect the internal driving force of enterprise innovative cooperation, and how the internal and external factors affect the embedded behavior of enterprises, and then affect the role of network characteristics are all issues worthy of further discussion. (2) Patent data is used in our article. Although the TI of an enterprise can be reliably measured based on patent data to some extent, not all technical knowledge can be translated into patents. This study does not have access to external patent and innovation data other than the patent database. Thus, there are some limitations to the conclusions. (3) The TI of enterprises is closely related to the external environment. Under different economic environments and political systems, innovative networks will evolve in different ways and have differential impacts. However, the research perspective of this study is limited to the NEV industry in China, and a comparative analysis of samples from different countries is lacking.
Combined with the limitations of this study, key future work is presented as follows: On the one hand, enrich the research perspective. In the future work, we will further extend the research perspective to the global NEV industry, including special samples such as multinational companies and joint ventures in the research framework of the article. At the same time, based on the perspective of knowledge spillover and knowledge flow, this study will deepen the research and enlightenment on the development of the global NEV industry [26]. On the other hand, the data sources are expanded. To better describe the sharing and flow of technology, knowledge, and other resources among organizations, in the subsequent research, we can obtain the cooperative relationship of participants through the combination of patent data, literature, annual reports, and other information of enterprises, and then confirm each other and enrich the research conclusions of the article.

Author Contributions

Conceptualization, C.W. and T.F.; methodology, Z.W.; software, Y.W.; validation, Z.W.; formal analysis, Z.W.; data curation, Z.W.; writing—original draft preparation, Z.W.; writing—review and editing, Z.W. and Y.W.; visualization, T.F.; supervision, C.W. All authors have read and agreed to the published version of the manuscript.

Funding

This research was funded by: (1) [National Natural Science Foundation of China] grant number [71872141]; (2) [National Natural Science Foundation of China] grant number [72072140]; (3) [Natural Science Foundation of Shaanxi Province of China] grant number [2021JQ-520].

Institutional Review Board Statement

Not applicable.

Informed Consent Statement

Not applicable.

Data Availability Statement

The data that support the findings of this study are available from the corresponding authors (Z.W.).

Acknowledgments

First of all, we acknowledge support from the Research Program at the NSFC. Furthermore, the authors would like to express special gratitude to the SIPO for processing and providing valuable survey data for this study. Additionally, the researchers would like to express their gratitude to the anonymous reviewers for their efforts to improve the quality of this study.

Conflicts of Interest

The authors declare no conflict of interest.

References

  1. Luo, E.X.; Guo, H.W. Research on the interactive effect of dual network and enterprise innovation—Based on the investigation of new energy automobile enterprises in China. J. Ind. Technol. Econ. 2021, 40, 35–41. (In Chinese) [Google Scholar]
  2. Zapata, C.; Nieuwenhuis, P. Exploring innovation in the automotive industry: New technologies for cleaner cars. J. Clean. Prod. 2010, 18, 14–20. [Google Scholar] [CrossRef]
  3. Lee, J.; Veloso, F.M.; Hounshell, D.A.; Rubin, E.S. Forcing technological change: A case of automobile emissions control technology development in the US. Technovation 2010, 30, 249–264. [Google Scholar] [CrossRef]
  4. Sovacool, B.K.; Newell, P.; Carley, S.; Fanzo, J. Equity, technological innovation and sustainable behaviour in a low-carbon future. Nat. Hum. Behav. 2022, 6, 326–337. [Google Scholar] [CrossRef] [PubMed]
  5. He, Y.; Le, W.; Guo, B.H. Research on the Policy Synergy of Central and Local Government on New Energy Vehicle lndustry under the Perspective of Policy Field and Time Dimension. Chin. J. Manag. Sci. 2021, 29, 12. (In Chinese) [Google Scholar]
  6. Park, Y.; Nakaoka, I.; Chen., Y. The R&D Strategy of Automobile Companies in Radical Innovation. J. Robot. Netw. Artif. Life 2020, 7, 184–189. [Google Scholar]
  7. Aytekin, A.; Ecer, F.; Korucuk, S.; Karamaşa, Ç. Global innovation efficiency assessment of EU member and candidate countries via DEA-EATWIOS multi-criteria methodology. Technol. Soc. 2022, 68, 101896. [Google Scholar] [CrossRef]
  8. Qing, L.; Chun, D.; Ock, Y.S.; Dagestani, A.A.; Ma, X. What myths about green technology innovation and financial performance’s relationship? A bibliometric analysis review. Economies 2022, 10, 92. [Google Scholar] [CrossRef]
  9. Yang, T.; Xing, C.; Li, X. Evaluation and analysis of new-energy vehicle industry policies in the context of technical innovation in China. J. Clean. Prod. 2021, 281, 125–126. [Google Scholar] [CrossRef]
  10. Grant, R.M. Toward a knowledge-based theory of the firm. Strateg. Manag. J. 1996, 17, 109–122. [Google Scholar] [CrossRef]
  11. Chen, W.J.; Zeng, D.M.; Zou, S.M. A study of the evolutionary path of collaborative innovation network for low—carbon vehicle technology. Sci. Res. Manag. 2016, 37, 9. (In Chinese) [Google Scholar]
  12. Wang, D.D.; Le, W.; Yang, Y.W.; Guo, B.H. Research on the technological innovation network evolution of China’s new energy vehicle industry from the perspective of embeddedness risk. Chin. J. Manag. Sci. 2023, 1–14. [Google Scholar] [CrossRef]
  13. Sehnem, S.; de Queiroz, A.A.F.S.; Pereira, S.C.F.; dos Santos Correia, G.; Kuzma, E. Circular economy and innovation: A look from the perspective of organizational capabilities. Bus. Strategy Environ. 2022, 31, 236–250. [Google Scholar] [CrossRef]
  14. Zhang, Q.; Li, C.; Wu, Y. Analysis of Research and Development Trend of the Battery Technology in Electric Vehicle with the Perspective of Patent. Energy Procedia 2017, 105, 4274–4280. [Google Scholar] [CrossRef]
  15. Plechero, M.; Kulkarni, M.; Chaminade, C.; Parthasarathy, B. Explaining the past, predicting the future: The influence of regional trajectories on innovation networks of new industries in emerging economies. Ind. Innov. 2021, 28, 932–954. [Google Scholar] [CrossRef]
  16. Peng, M.W.; Luo, Y. Managerial Ties and Firm Performance in a Transition Economy: The Nature of a Micro-Macro Link. Acad. Manag. J. 2000, 43, 486–501. [Google Scholar] [CrossRef]
  17. Sparrowe, R.T.; Liden, R.C.; Wayne, S.J.; Kraimer, M.L. Social networks and the performance of individuals and groups. Acad. Manag. J. 2001, 44, 316–325. [Google Scholar] [CrossRef]
  18. Wang, B.; Liu, Y.; Zhou, Y.; Wen, Z. Emerging nanogenerator technology in China: A review and forecast using integrating bibliometrics, patent analysis and technology roadmapping methods. Nano Energy 2018, 46, 322–330. [Google Scholar] [CrossRef]
  19. Lacasa, I.D.; Shubbak, M.H. Drifting towards innovation: The co-evolution of patent networks, policy, and institutions in China’s solar photovoltaics industry. Energy Res. Soc. Sci. 2018, 38, 87–101. [Google Scholar] [CrossRef]
  20. Cao, X.; Li, C.Y.; Lin, C.R. An research on the evolution of patent cooperation networks based on new energy vehicles. Sci. Res. Manag. 2019, 40, 179–187. (In Chinese) [Google Scholar]
  21. Li, Y.; Song, J.; Yang, J. A review on structure model and energy system design of lithium-ion battery in renewable energy vehicle. Renew. Sustain. Energy Rev. 2014, 37, 627–633. [Google Scholar] [CrossRef]
  22. Jiang, Y.J.; Guo, T.; Wang, S.K.; Yasumoto, M. How to achieve breakthrough innovation in emerging countries—A study based on the comparative analysis of V2X patent data between China and the US. Stud. Sci. Sci. 2021, 39, 1882–1896. (In Chinese) [Google Scholar]
  23. Sun, H.; Geng, Y.; Hu, L.; Shi, L.; Xu, T. Measuring China’s new energy vehicle patents: A social network analysis approach. Energy 2018, 153, 685–693. [Google Scholar] [CrossRef]
  24. Xu, X.R.; Tian, S.W.; Wang, J.P. Analysis on the evolution of global new energy vehicle technology innovation cooperation network. J. Ind. Technol. Econ. 2020, 39, 9. (In Chinese) [Google Scholar]
  25. Xi, L.S.; Zhao, H. The influence mechanism and data test of enterprise esg performance on earnings sustainability. Manag. Rev. 2022, 34, 313–326. (In Chinese) [Google Scholar]
  26. Liu, W.; Tao, Y.; Bi, K. Capturing information on global knowledge flows from patent transfers: An empirical study using USPTO patents. Res. Policy 2022, 51, 104509. [Google Scholar] [CrossRef]
  27. Mullor-Sebastian, A. The Product Life Cycle Theory: Empirical Evidence. J. Int. Bus. Stud. 1983, 14, 95–105. [Google Scholar] [CrossRef]
  28. Zhou, C.; Zeng, G.; Xiaorui, X.; Mi, Z. The Dynamics of China’s electronic information industry innovation networks: An empirical research based on SAO model. Econ. Geogr. 2018, 38, 116–122. (In Chinese) [Google Scholar]
  29. Quinn, R.W.; Baker, W. Positive Emotions, Instrumental Resources, and Organizational Network Evolution: Theorizing via Simulation Research. Social Networks. Soc. Netw. 2021, 64, 212–224. [Google Scholar] [CrossRef]
  30. Jacobsen, D.H.; Stea, D.; Soda, G. Intra-Organizational Network Dynamics: Past Progress, Current Challenges, and New Frontiers. Acad. Manag. Ann. 2022, 16, 853–897. [Google Scholar] [CrossRef]
  31. Li, N.; Lin, R.H.; Xie, Z.Y. Research on the influence mechanism of enterprise exploratory innovation under multiple network embedding. Sci. Res. 2020, 38, 11. (In Chinese) [Google Scholar]
  32. Powell, W.W.; White, D.R.; Koput, K.W.; Owensmith, J. Network dynamics and field evolution. Am. J. Sociol. 2015, 110, 1132–1205. [Google Scholar] [CrossRef] [Green Version]
  33. Trippl, M.; Maier, G. Knowledge spillover agents and regional development. Adv. Spat. Sci. 2011, 91–111. Available online: https://link.springer.com/chapter/10.1007/978-3-642-14965-8_5 (accessed on 4 June 2022).
  34. Chen, Y.; Zhang, H.X.; Wang, Q. An empirical research on the relationship between knowledge resources and enterprise innovation. Sci. Res. Manag. 2018, 39, 8. (In Chinese) [Google Scholar]
  35. Briscoe, F.; Tsai, W. Overcoming Relational Inertia: How Organizational Members Respond to Acquisition Events in a Law Firm. Adm. Sci. Q. 2011, 56, 408–440. [Google Scholar] [CrossRef]
  36. Burt, R.S. Structural holes and good ideas. Am. J. Sociol. 2004, 110, 349–399. [Google Scholar] [CrossRef]
  37. Stea, D.; Pedersen, T.; Soda, G. Keep or drop? The origin and evolution of knowledge relationships in organizations. Br. J. Manag. 2022, 33, 1517–1534. [Google Scholar] [CrossRef]
  38. Burt, R.S.; Reagans, R.E.; Volvovsky, H.C. Network brokerage and the perception of leadership. Soc. Netw. 2021, 65, 33–50. [Google Scholar] [CrossRef]
  39. Gargiulo, M.; Benassi, M. Trapped in Your Own Net? Network Cohesion, Structural Holes, and the Adaptation of Social Capital. Organ. Sci. 2000, 11, 183–196. [Google Scholar] [CrossRef]
  40. Perry-Smith, J.E.; Mannucci, P.V. From Creativity to Innovation: The Social Network Drivers of the Four Phases of the Idea Journey. Acad. Manag. 2017, 42, 53–79. [Google Scholar] [CrossRef]
  41. Giese, H.; Stok, F.M.; Renner, B. Early social exposure and later affiliation processes within an evolving social network. Soc. Netw. 2020, 62, 80–84. [Google Scholar] [CrossRef]
  42. Capaldo, A. Network structure and innovation: The leveraging of a dual network as a distinctive relational capability. Strateg. Manag. J. 2007, 28, 585–608. [Google Scholar] [CrossRef] [Green Version]
  43. Ter Wal, A.L.; Alexy, O.; Block, J.; Sandner, P.G. The best of both worlds: The benefits of open-specialized and closed-diverse syndication networks for new ventures’ success. Adm. Sci. Q. 2016, 61, 393–432. [Google Scholar] [CrossRef] [PubMed] [Green Version]
  44. Zhao, S.; Jiang, Y.; Peng, X.; Hong, J. Knowledge sharing direction and innovation performance in organizations: Do absorptive capacity and individual creativity matter? Eur. J. Innov. Manag. 2021, 24, 371–394. [Google Scholar] [CrossRef]
  45. Wang, M.C.; Chen, P.C.; Fang, S.C. A critical view of knowledge networks and innovation performance: The mediation role of firms’ knowledge integration capability. J. Bus. Res. 2018, 88, 222–233. [Google Scholar] [CrossRef]
  46. Xu, S. Balancing the Two Knowledge Dimensions in Innovation Efforts: An Empirical Examination among Pharmaceutical Firms. J. Prod. Innov. Manag. 2015, 32, 610–621. [Google Scholar] [CrossRef]
  47. Wu, J.; Shanley, M.T. Knowledge stock, exploration, and innovation: Research on the United States electromedical device industry. J. Bus. Res. 2009, 62, 474–483. [Google Scholar] [CrossRef]
  48. Luo, Z.Q. Research on the development of organizational technological Innovation ability based on knowledge Attribute. Mod. Manag. Sci. 2019, 1, 53–55. (In Chinese) [Google Scholar]
  49. Mannucci, P.V.; Yong, K. The Differential Impact of Knowledge Depth and Knowledge Breadth on Creativity over Individual Careers. Acad. Manag. 2018, 61, 1741–1763. [Google Scholar] [CrossRef]
  50. Thakur-Wernz, P.; Samant, S. Relationship between international experience and innovation performance: The importance of organizational learning for EMNEs. Glob. Strategy J. 2019, 9, 378–404. [Google Scholar] [CrossRef]
  51. Soda, G.; Usai, A.; Zaheer, A. Network memory: The influence of past and current networks on performance. Acad. Manag. J. 2004, 47, 893–906. [Google Scholar] [CrossRef]
  52. Garcia-Vega, M. Does technological diversification promote innovation?: An empirical analysis for European firms. Res. Policy 2006, 35, 230–246. [Google Scholar] [CrossRef]
  53. Yu, J.; Gilbert, B.A.; Oviatt, B.M. Effects of alliances, time, and network cohesion on the initiation of foreign sales by new ventures. Strateg. Manag. J. 2011, 32, 424–446. [Google Scholar] [CrossRef] [Green Version]
  54. Cameron, A.C.; Trivedi, P.K. Econometric models based on count data: Comparisons and applications of some estimators and tests. J. Appl. Econom. 1985, 1, 29–53. [Google Scholar] [CrossRef]
  55. Cincera, M. Patents, R&D, and technological spillovers at the firm level: Some evidence from econometric count models for panel date. J. Appl. Econom. 1996, 12, 265–280. [Google Scholar]
  56. Feng, S.; Zhang, R.; Li, G. Environmental decentralization, digital finance and green technology innovation. Struct. Change Econ. Dyn. 2022, 61, 70–83. [Google Scholar] [CrossRef]
  57. He, Y.B.; Zhang, Y.C. A study on the impact of network embeddedness on industry- university—Research institute knowledge collaboration performance. Stud. Sci. Sci. 2017, 35, 1396–1408. (In Chinese) [Google Scholar]
  58. Xie, F.; Chen, X.J.; Dou, T.F. Publication collaboration and research impact: Evidence from universities in China. Stud. Sci. Sci. 2021, 39, 777. (In Chinese) [Google Scholar]
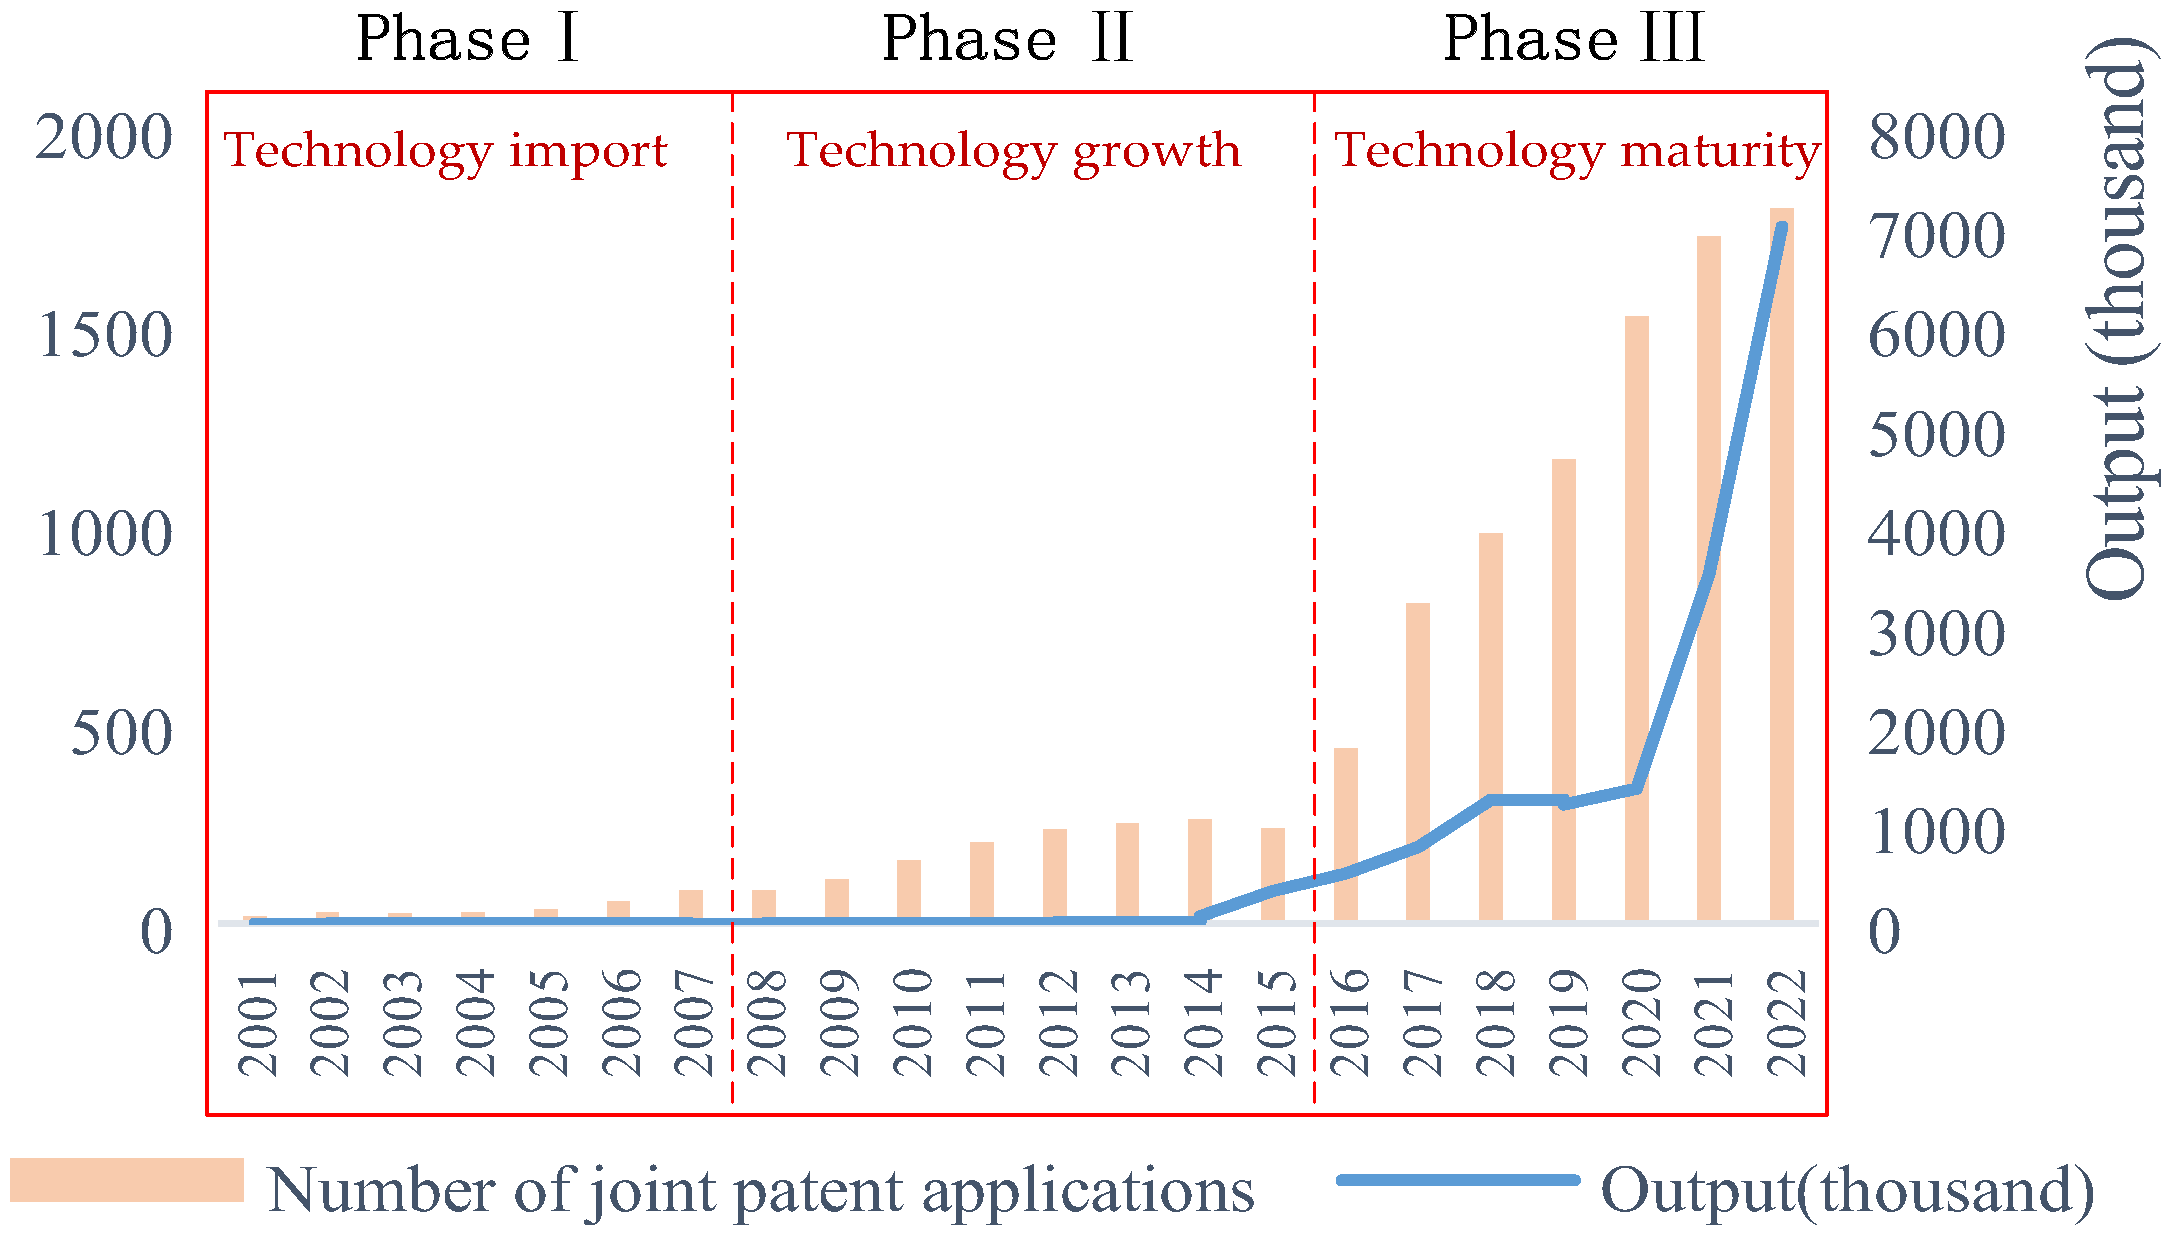
Figure 1. Top 20 global sales of NEV in 2021. Data source: Clean Technical.
Sustainability 15 04237 g001
Figure 2. Keyword extraction based on LDA model.
Sustainability 15 04237 g002
Figure 3. The development trend of China’s NEV industry. Data sources: China Association of Automobile Manufacturers, State Intellectual Property Office of the People’s Republic of China.
Sustainability 15 04237 g003
Figure 4. The construction process of the innovative network (schematic diagram).
Sustainability 15 04237 g004
Figure 5. The number and proportion of various types of the key participants in TI.
Sustainability 15 04237 g005
Figure 6. The proportion of various technologies in the three stages.
Sustainability 15 04237 g006
Figure 7. The schematic diagram of the structural hole.
Sustainability 15 04237 g007
Figure 8. The schematic diagram of network structure and network content.
Sustainability 15 04237 g008
Figure 9. The theoretical model.
Sustainability 15 04237 g009
Figure 10. Cooperation types of NEV of the key participants in TI.
Sustainability 15 04237 g010
Table 1. Innovative network and network indicators.
PhaseTechnical ImportTechnology GrowthTechnical Maturity
Year2001–20082009–20152016–2022
The evolution of the networkSustainability 15 04237 i001
The number of nodes464073108
The number of edges256156008
The number of connections9415729115
Density0.0250.0020.001
SD Distance 0.3420.7490.602
Degree Centralization0.0440.1540.018
Table 2. Variables definitions and descriptions.
VariableMeasurement
Dependent Variable Technical innovation (TI)The number of patents granted in the t-year of NEV enterprise i.
Independent Variable Cooperation breadth (GD)The number of partners in the enterprise’s egocentric network.
Structural hole (SH)The number of structural holes measured using the constraint.
Technology diversity (KS)The total number of IPC sub-categories applied for in the t-year of enterprise i.
Technical value (TV)The logarithm of the total patent value in the t-year of enterprise i.
Control VariableAgeMeasured over the period from the company’s inception to 2022.
SizeMeasured as the total number of inventors owned in the t-year of enterprise i.
R&DThe proportion of the enterprise’s R & D investment in operating income.
SalesMeasured by the logarithm of operating income.
PropertyThe enterprise is a listed enterprise, denoted as 1; Non-listed enterprise, denoted as 0.
YearThe dummy variables of 22 years are generated.
AreaThe dummy variables of 27 provinces are generated.
Table 3. Descriptive statistics and correlation analysis.
VariableMeanSD(1)(2)(3)(4)(5)(6)(7)(8)(9)(10)VIF
(1)TI221.381643.9401 -
(2)GD4.2706.6430.1961 1.21
(3)SH1.6730.1420.4430.2151 3.39
(4)KS22.31725.0930.7740.1500.5761 3.41
(5)TV13.7042.3220.5340.1360.5560.6351 1.93
(6)Age11.67810.0400.1730.0060.2210.2960.2991 1.29
(7)Size170.641376.0900.8620.3290.4960.7840.5630.2691 3.70
(8)R&D0.7172.2230.2870.0610.1860.2630.2070.2310.3001 1.15
(9)Sales23.8520.5530.6910.2020.8120.7050.5820.2110.7020.2911 4.81
(10)Property0.1380.3450.150-0.0060.1220.1920.0930.3450.2360.1320.15811.19
Table 4. Regression analysis.
TI
Mode 1Mode 2Mode 3Mode 4Mode 5Mode 6
Control
Variable
Age0.014 ***0.014 ***0.011 **0.008 **0.002−0.001
(0.005)(0.005)(0.005)(0.004)(0.004)(0.003)
Size0.002 ***0.002 ***0.002 ***−0.000 ***0.001 ***−0.000
(0.000)(0.000)(0.000)(0.000)(0.000)(0.000)
R&D−0.016−0.015−0.010−0.013−0.011−0.001
(0.016)(0.016)(0.017)(0.015)(0.014)(0.019)
Sales1.139 ***1.119 ***0.252 *0.874 ***0.823 ***0.075
(0.103)(0.099)(0.143)(0.088)(0.088)(0.096)
Property−0.389 ***−0.440 ***−0.258 *−0.374 ***−0.226 **−0.241 ***
(0.142)(0.137)(0.137)(0.102)(0.115)(0.079)
YearYESYESYESYESYESYES
AreaYESYESYESYESYESYES
Independent
Variable
GD 0.064 *** 0.017 **
(0.012) (0.007)
GD2 −0.002 *** −0.000
(0.001) (0.000)
SH 3.852 *** 2.485 ***
(0.482) (0.325)
KS 0.044 *** 0.033 ***
(0.003) (0.002)
TV 0.304 ***0.202 ***
(0.021)(0.016)
Constant−23.226 ***−22.950 ***−8.593 ***−17.551 ***−19.636 ***−5.233 ***
(2.443)(2.352)(2.798)(2.079)(2.056)(1.896)
N170617061706170617061706
R20.11880.12400.13040.16980.15480.2164
Robust standard errors in parentheses. *** p < 0.01, ** p < 0.05, * p < 0.1.
Table 5. Robustness tests.
The Number of Cited PatentsThe Number of Patent Applications is Delayed in Two Cycles
Mode 1Mode 2Mode 3Mode 4Mode 5Mode 6Mode 7Mode 8Mode 9Mode 10
GD0.061 *** 0.0160.013 *** 0.010
(0.018) (0.014)(0.004) (0.075)
GD2−0.002 *** −0.000−0.001 ** −0.001 *
(0.000) (0.000)(0.000) (0.001)
SH 3.077 *** 0.986 * 4.370 *** 4.345 ***
(0.696) (0.593) (0.143) (0.147)
KS 0.034 *** 0.016 *** 0.003 *** −0.001
(0.005) (0.004) (0.001) (0.002)
TV 0.397 ***0.356 *** 0.047 ***0.008
(0.023)(0.024) (0.009)(0.005)
ControlsYESYESYESYESYESYESYESYESYESYES
YearYESYESYESYESYESYESYESYESYESYES
AreaYESYESYESYESYESYESYESYESYESYES
Constant−15.812 ***−4.780−15.721 ***−13.203 ***−7.822 **−47.178 ***−33.076 ***−46.493 ***−46.299 ***−32.845 ***
(3.529)(4.287)(3.579)(2.864)(3.517)(1.013)(0.544)(1.045)(0.980)(0.549)
N1706170617061706170617061706170617061706
R20.08480.08610.09290.12060.12640.28370.42850.28380.28840.4309
Robust standard errors in parentheses. *** p < 0.01, ** p < 0.05, * p < 0.1.
Table 6. Heterogeneity check: State-owned enterprises and non-state-owned enterprises.
State-Owned EnterprisesNon-State-Owned Enterprises
Mode 1Mode 2Mode 3Mode 4Mode 5Mode 1Mode 2Mode 3Mode 4Mode 5
GD0.065 0.0120.083 *** 0.020 **
(0.044) (0.028)(0.014) (0.008)
GD2−0.002 −0.000−0.002 *** −0.000
(0.001) (0.000)(0.000) (0.000)
SH 3.067 ** 0.788 4.263 *** 2.696 ***
(1.449) (0.916) (0.513) (0.343)
KS 0.044 *** 0.036 *** 0.046 *** 0.033 ***
(0.006) (0.004) (0.003) (0.002)
TV 0.373 ***0.261 *** 0.397 ***0.187 ***
(0.059)(0.045) (0.030)(0.017)
ControlsYESYESYESYESYESYESYESYESYESYES
Constant−29.402 ***−16.966 **−10.052 **−25.201 ***−5.850−22.416 ***−7.152 **−20.504 ***−18.550 ***−6.485 ***
(5.022)(6.711)(3.976)(3.821)(4.490)(2.974)(3.313)(2.496)(2.619)(2.234)
N37337337337337313331333133313331333
R20.12530.12700.17330.15420.20790.12780.13520.17230.15620.2229
Robust standard errors in parentheses. *** p < 0.01, ** p < 0.05.
Table 7. Heterogeneity check: Traditional automobile enterprises and emerging automobile companies.
Traditional Automobile EnterprisesEmerging Automobile Companies
Mode 1Mode 2Mode 3Mode 4Mode 5Mode 1Mode 2Mode 3Mode 4Mode 5
GD0.051 *** 0.0150.079 *** 0.035 **
(0.017) (0.010)(0.026) (0.018)
GD2−0.001 *** −0.000−0.003 *** −0.001 *
(0.000) (0.000)(0.001) (0.001)
SH 2.941 *** 1.770 *** 4.017 *** 2.768 ***
(0.720) (0.444) (0.682) (0.511)
KS 0.039 *** 0.030 *** 0.049 *** 0.035 ***
(0.003) (0.002) (0.006) (0.005)
TV 0.371 ***0.252 *** 0.255 ***0.175 ***
(0.030)(0.023) (0.032)(0.026)
ControlsYESYESYESYESYESYESYESYESYESYES
YearYESYESYESYESYESYESYESYESYESYES
AreaYESYESYESYESYESYESYESYESYESYES
Constant−19.799 ***−11.093 ***−16.914 ***−17.545 ***−6.666 ***−27.343 ***−2.146−19.311 ***−23.563 ***−3.197
(2.762)(3.524)(2.418)(2.296)(2.152)(5.440)(6.503)(4.507)(4.598)(4.503)
N919919919919919787787787787787
R20.11510.11610.16260.15410.21430.11320.12410.14390.13820.1867
Robust standard errors in parentheses. *** p < 0.01, ** p < 0.05, * p < 0.1.
Table 8. Heterogeneity check: Regional heterogeneity.
Eastern RegionsMiddle RegionsWestern Regions
Mode 1Mode 2Mode 3Mode 4Mode 1Mode 2Mode 3Mode 4Mode 1Mode 2Mode 3Mode 4
GD0.062 *** 0.119 0.070
(0.013) (0.097) (0.066)
GD2−0.002 *** −0.006 −0.002
(0.000) (0.007) (0.002)
SH 4.650 *** 3.956 *** 5.395 **
(0.522) (1.008) (2.251)
KS 0.044 *** 0.044 *** 0.070 ***
(0.003) (0.009) (0.014)
TV 0.296 *** 0.211 *** 0.318 ***
(0.023) (0.055) (0.072)
ControlsYESYESYESYESYESYESYESYESYESYESYESYES
YearYESYESYESYESYESYESYESYESYESYESYESYES
AreaYESYESYESYESYESYESYESYESYESYESYESYES
Constant−25.830 ***−11.822 ***−17.299 ***−21.124 ***−15.790 ***3.599−16.895 ***−16.285 ***−55.041 ***−27.995 **−4.747−33.427 ***
(2.905)(3.120)(2.354)(2.459)(5.211)(6.628)(4.581)(4.774)(10.163)(13.524)(11.169)(8.292)
N1329132913291329235235235235142142142142
R20.12480.13640.16460.15480.18320.19840.21070.19680.15420.16560.20030.1908
Robust standard errors in parentheses. *** p < 0.01, ** p < 0.05.
Disclaimer/Publisher’s Note: The statements, opinions and data contained in all publications are solely those of the individual author(s) and contributor(s) and not of MDPI and/or the editor(s). MDPI and/or the editor(s) disclaim responsibility for any injury to people or property resulting from any ideas, methods, instructions or products referred to in the content.

