Article

Perlite and Rice Husk Ash Re-Use As Fine Aggregates in Lightweight Aggregate Structural Concrete—Durability Assessment

by
Maria C. Stratoura
1,2,
Gerasimina-Ersi D. Lazari
2,
Efstratios G. Badogiannis
2,* and
Vagelis G. Papadakis
1,3
1
Department of Environmental Engineering, University of Patras, GR30100 Patras, Greece
2
School of Civil Engineering, National Technical University of Athens, GR15773 Athens, Greece
3
Department of Civil Engineering, University of Patras, GR26500 Patras, Greece
*
Author to whom correspondence should be addressed.
Sustainability 2023, 15(5), 4217; https://doi.org/10.3390/su15054217
Submission received: 3 January 2023 / Revised: 10 February 2023 / Accepted: 22 February 2023 / Published: 26 February 2023
(This article belongs to the Special Issue Sustainability in Construction Materials)

Abstract

:
In this paper, perlite mining and rice production by-products, namely run-of-mine perlite and rice husk ash, are used as fine aggregates in combination with pumice and calcareous aggregates to produce lightweight concrete. Their use is evaluated mainly in terms of the durability of the concrete, by comparing four optimized lightweight concrete mixtures of similar density and strength with a reference one of normal weight. The sorptivity due to capillary sorption, open porosity, chloride migration, penetration resistance, and freeze and thaw response were studied to evaluate the durability of the lightweight concrete. According to the experimental results, the examined mixtures developed an adequate strength in order to be classified into strength classes greater than LC25/28 and, therefore, be used in structural applications. The durability of the mixtures was also sufficient, especially as far as the chlorides’ penetration resistance is concerned, which was found to be up to 39% lower compared to the reference mixture. The sorptivity and open porosity of the LWC mixtures increased due to the porous nature of the lightweight aggregates, and the mixtures were also found to be susceptible to freeze and thaw cycles. Exceptionally, the lightweight concrete mixtures comprising pumice and perlite exhibited a lower sorptivity and resistance to chloride penetration than the standard concrete and a promising tolerance to freezing and thawing. Thus, the optimized combination of pumice and perlite is a sustainable recommendation for structural lightweight concrete production and use, promoting the wider exploitation of natural aggregates with an acceptable compromise on strength and durability.

1. Introduction

The impact on the environment stemming from the construction and operation of buildings is significant, accounting for 1/3 of greenhouse gas emissions and for 40% of the global energy consumption [1]. Parliaments have adopted specific structural codes [2], taking into account the technical and functional requirements of a building. The Zero Energy Building (ZEB) concept, a model building established by Belussi et al., 2019 [3] in which the functional needs and self-sufficiency of a building under certain functional conditions are ideally balanced, could be used as a reference in order to reach the objectives for energy efficiency in buildings.
It is, therefore, necessary that buildings must be designed to have a minimal impact on the natural environment [4]. The sustainable design of structures can substantially decrease the life-cycle, economic and environmental losses [5], and enhance the energy efficiency of buildings by using high-performance, durable, sustainable and thermally insulating construction materials [6].
In 2018, approximately 0.25 billion m3 of sand was used in the production of concrete [7], one of the major sources of raw material use [8]. Despite the efforts of the industrial sector globally to ameliorate its manufacturing processes, the need for raw materials is expected to double by 2060 [9]. It is, therefore, paramount to reduce the consumption of primary raw materials, propose the use of alternatives, such as lightweight aggregates from recycled materials, and, therefore, contribute to a reduction in our carbon footprint and fight climate change.
Lightweight concrete (LWC) is a type of concrete that can offer both technological and environmental benefits. Specifically, structural LWC offers flexibility in design and is cost effective due to the decreased inert load, enhanced seismic behaviour, wider openings, improved fire resistance, finer sections, lower storey height, lighter structural members, fewer steel reinforcements, superior durability and lower foundation costs [10,11]. Since the 1950s, structural LWC has been successfully introduced into the concrete industry for high-rise frames and floors, long-span bridges, off-shore infrastructures and prestressed or precast modules of all types [12]. However, making use of industrial by-products as aggregates for the production of LWC (e.g., rice husk ash and run-of-mine perlite), could reduce the environmental impact of the concrete industry, proving LWC to be a highly sustainable material.
Rice husk ash (R) is an agro-industrial residue deriving from the incineration of rice husk, and since it comprises 1/4 of the weight of rice, for every 1000 kg of husk burnt, approximately 250 kg of R is manufactured [13]. Roughly 35 million tonnes of R per year accumulates globally from the production of rice alone [14]. Specifically, in Greece, approximately 240,000 tonnes of rice is produced annually and there is a potential annual accumulation of 12,000 tonnes of R [15]. The bulk density of R is very low, while its content of silica is high [16]. It can, therefore, provide supplementary CSH and other pozzolanic products for the concrete matrix [17,18]; together with the massive quantities of R found globally, this makes it a promising and highly environmentally friendly material to be used as an aggregate in the production of concrete. However, there is a limited number of studies in the literature [19,20] that explore the potential use of coarser R as a fine aggregate in LWC and so additional research is required.
The fine aggregates in concrete could also be substituted by run-of-mine perlite (Pe), a raw perlite stream with a size of 0–2 mm or 0–4 mm and discarded as waste prior to the expansion process of perlite. The rejected amounts depend on the design of each mine’s production line and can reach up to 10% by weight of the feeding perlite. In Greece, the annual perlite production capacity approaches approximately 700,000 tonnes [21], and considering an average rejection level of 5%, approximately 35,000 tonnes of run-of-mine perlite are rejected annually, which astonishingly remain unused. A few studies have focused on the use of ultra-fine expanded [22] or raw [23] perlite as an effective supplementary cementitious material, and have shown potential. Additionally, waste-expanded perlite has been studied as a replacement for quartz sand in the production of autoclaved aerated concrete [24] and as a partial or complete substitution for feldspar in the production of ceramic tiles [25]. Preliminary studies on using finer-than-4 mm perlite as a fine aggregate in LWC have shown positive results in terms of durability and strength [20]; however, further research is necessary.
Pumice, a natural volcanic material derived from the release of gas during the solidification of lava, has also been used in many countries around the world as an aggregate of LWC [26]. Greece has a notable pumice mining capacity, with a capacity of 1 Mt in 2020 [21], yet the local production of pumice LWC is rather limited. Pumice usage as either an aggregate or a mineral addition to concrete is a sustainable solution for the production of durable concrete [27]. Other studies have also demonstrated that the addition of ground pumice improves the mechanical properties and durability of LWC [28,29].
The present study examines how the combination of pumice with Industrial by-products, such as perlite mining fines and rice husk ash, could deliver durable LWC mixtures for structural use. The suggested by-products, as well as the LWC, are both materials of current interest and their proposed exploitation promotes a circular economy, as the produced concrete could be considered a material of increased sustainability.

2. Materials’ Mix Design and Experimental Methods
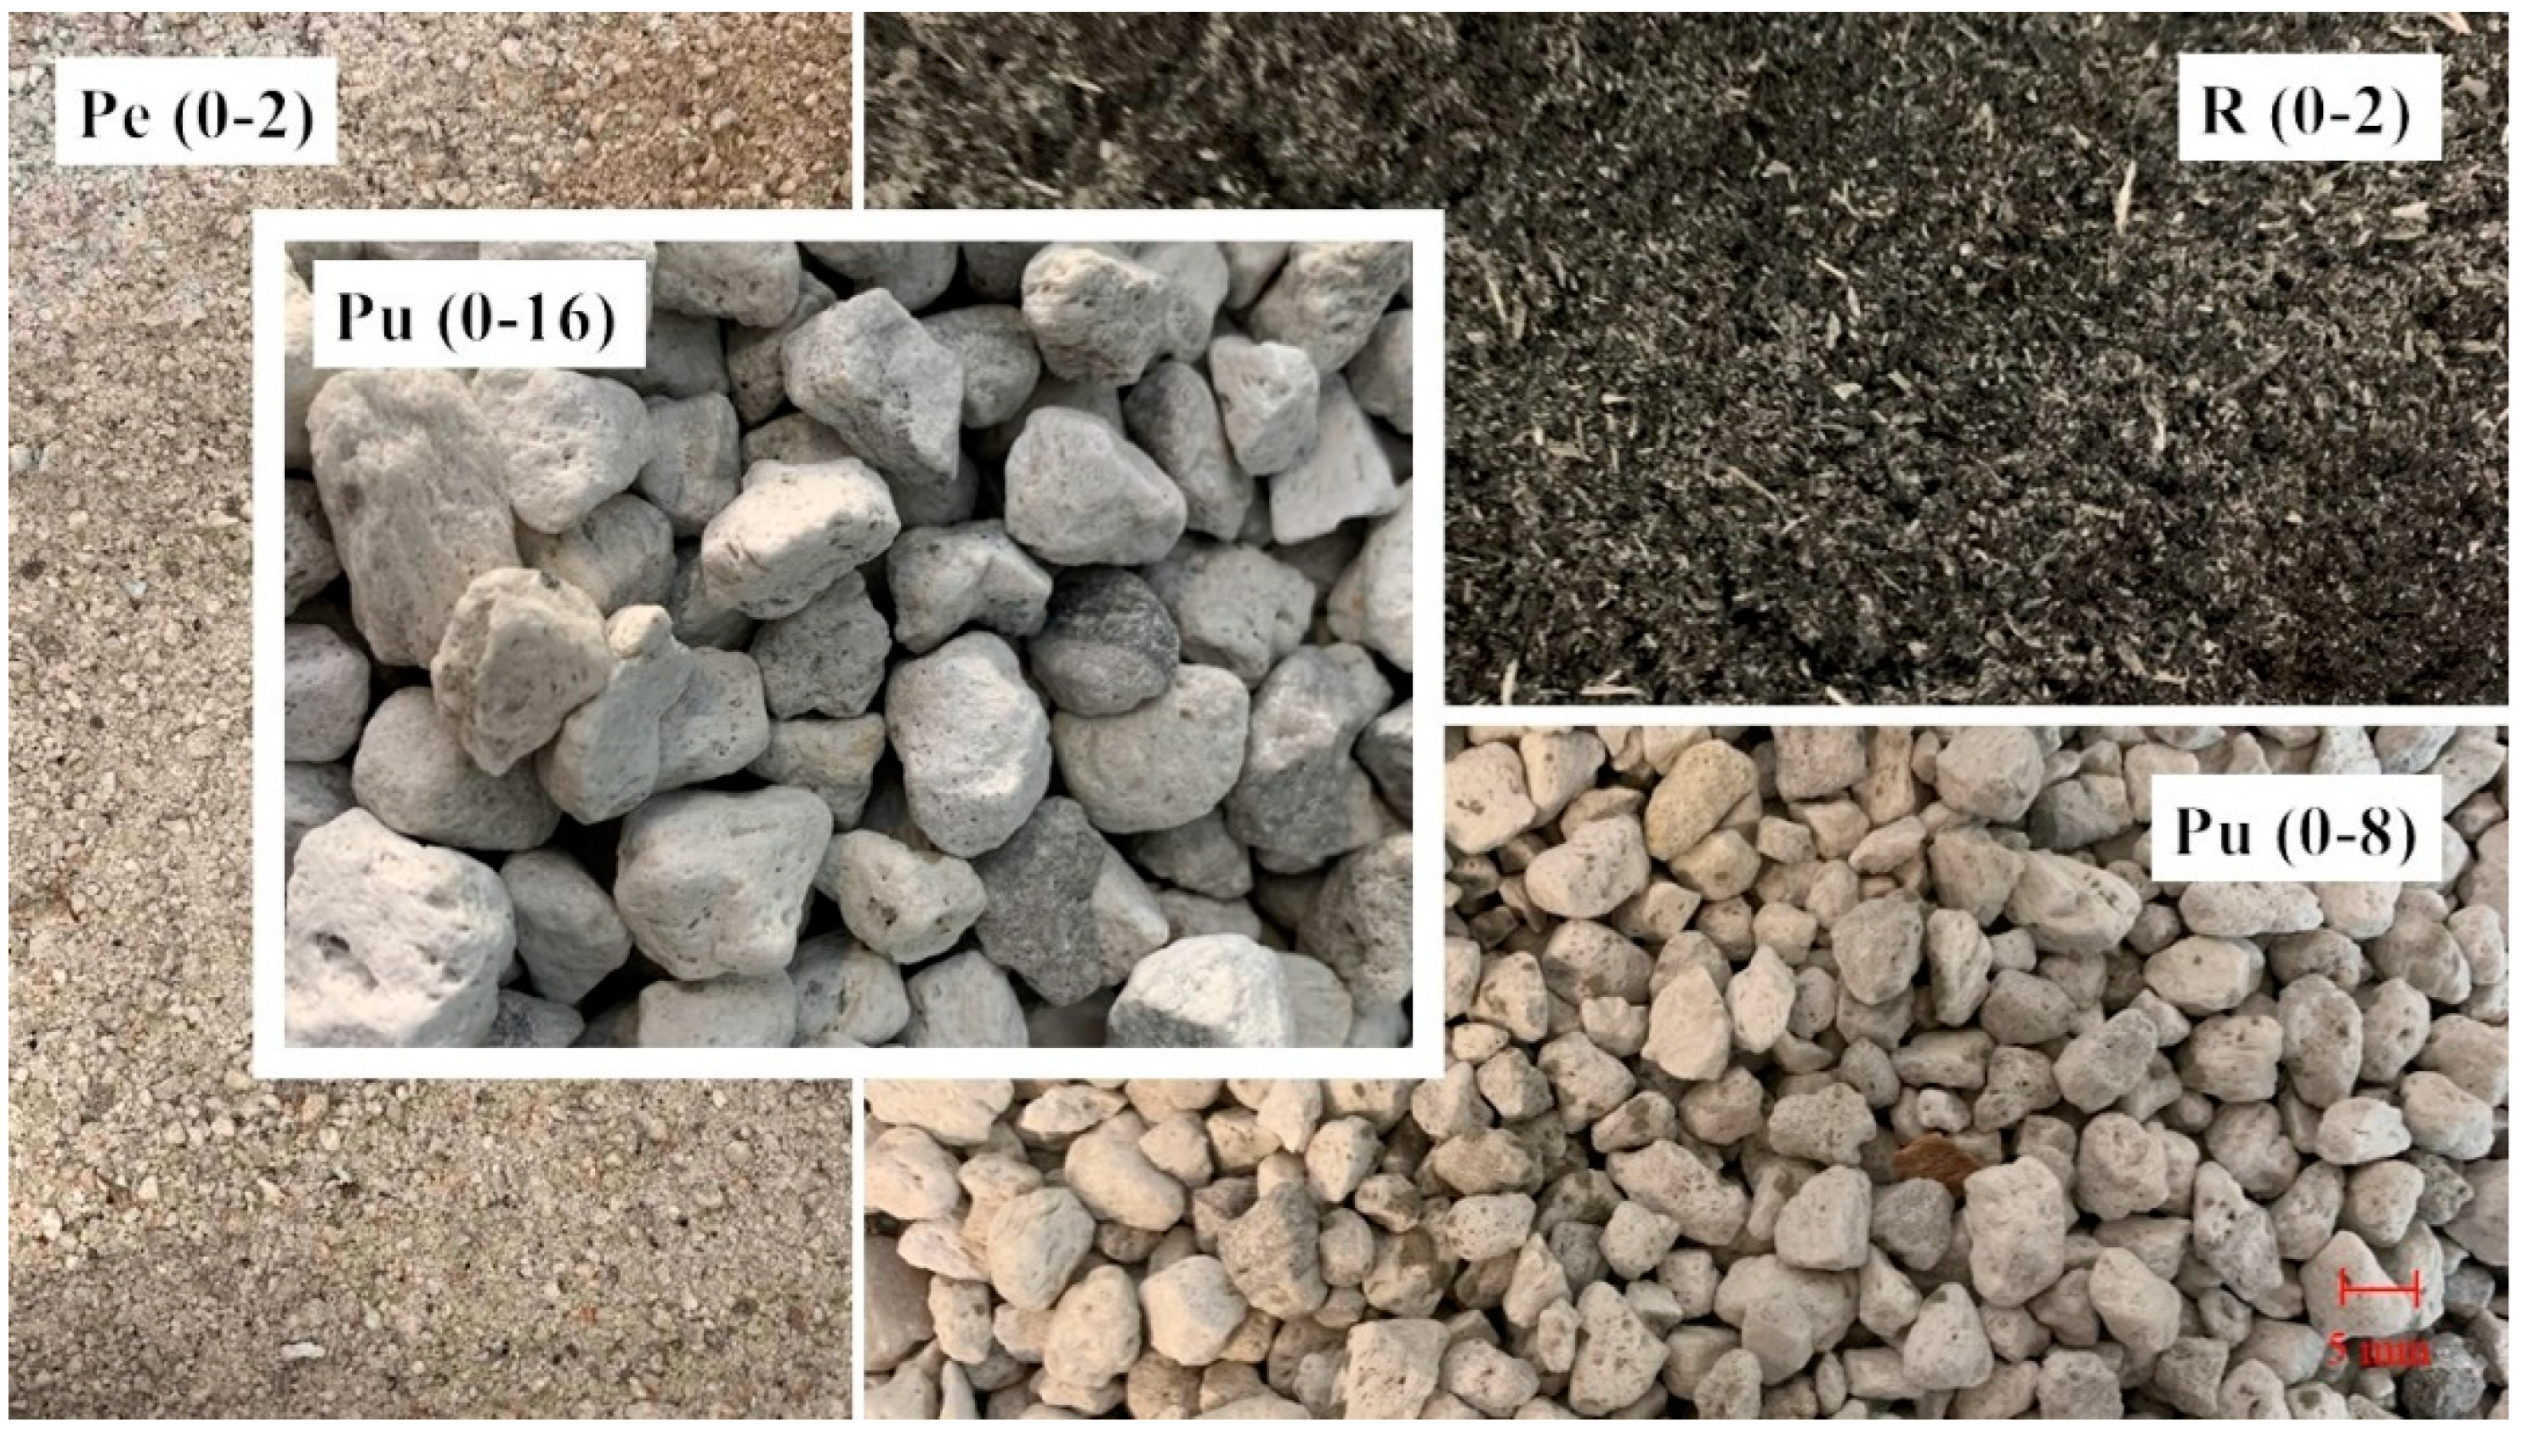
2.1. Materials

Ordinary Portland cement (CEM I 42.5R) denoted as C, was added in all mixtures. Three different types of lightweight aggregates (LWAs) were examined in this study: pumice (Pu), Run-of Mine-perlite (Pe) and rice husk ash (R) with a (nominal) grading of 0–8 mm and 0–16 mm, 0–2 mm and 0–4 mm, and 0–2 mm, respectively. Three locally available crushed calcareous limestone aggregates (Ca) of 0–4, 0–8 and 0–16 mm gradings were also used. Photos of the LWAs are shown in Figure 1, Table 1 presents the chemical composition of the aggregates and the cement used in this study, while their physical properties (apparent density, ρa and water absorption) are presented in Table 2. Finally, commercial super plasticizer (SP) and plasticizer (PL) were also used.

2.2. Mix Design

For the purposes of this study, four LWC mixtures (PeCaPu, PuCa, PePu, RPePu) containing different types of LWAs were compared to a concrete mixture of normal weight with limestone aggregates (REF). A batch of 25 l was produced for each composition and tested according to the experimental program described in the following section. Table 3 presents the proportions of each concrete mixture, designed according to the previous experimental work of Stratoura et al., 2018 [29]. The produced mixtures have a similar density (<D1.6) and are expected to develop a sufficient compressive strength to be classified in a strength class above LC25/28, as specified in EN206-1 [30]. The Fuller theory was followed for the aggregate blending, delivering continuous curves of aggregate blends, as shown in Figure 2, and producing concrete mixtures with densities similar to the target density class. It should be mentioned that there are differences in the crushing indices of the produced LWC mixtures. Similar mixtures were produced in a preliminary study [20], albeit under different mixing conditions, and developed similar compressive strengths and highly comparable results, indicating that the effect of the different crushing indices is negligible.
In all mixtures, both the cement content and the effective w/c were kept constant, considering the significant absorption potential of the LWAs (Table 2) that affects both the rheology of fresh concrete and the effective water for cement hydration. Specifically, the absorption capacity of the aggregates was estimated, and the corresponding water was pre-mixed with the aggregates as a pre-conditioning water (prW), 20 min before the final mixing of each LWC mixture. Table 3 presents analytically the pre-conditioning and effective water amounts. The total water shown in Table 3 is the sum of all the added water. The rheology of all the LWC mixtures was controlled by using appropriate amounts of SP and PL.

2.3. Test Procedures

Table 4 summarizes the test parameters with respect to the measured properties and their units, the specimen types and sizes, the testing age and the adopted standards.

2.3.1. Fresh Concrete and Strength Tests

The workability of the fresh concrete was evaluated by using the slump test, according to EN 12350-2 [31]. Fresh density and air content tests were also carried out following the specifications of EN 12350-6 [32] and EN 12350-7 [33], respectively. The compressive strength of the concrete was measured at 28 and 90 days, in accordance with EN 12390-3 [34]. Three specimens per batch were tested at each age and the average of the three values is reported hereinafter.

2.3.2. Open Porosity and Sorptivity Coefficient

The open porosity (OP) was evaluated according to ASTM C642 [35], by weighting in air and in water, and using a fully saturated ∅100 × 30 mm disc. The specimen was oven dried at 105 °C until a constant mass was achieved, whereas the duration of drying varied between 4 and 7 days. The OP(%) was calculated using the three weighted masses of two specimens (∅100 × 30 mm discs) from each mixture at the age of 28, 90 and 180 days. The sorptivity, a fundamental parameter in controlling liquid transport in concrete and thus its durability, was measured according to ASTM C1585 [36]. The test was performed on similar dried concrete specimens (∅100 × 30 mm discs, two from each mixture) after their dry mass stabilized. The specimens were peripherally sealed and rested on rods to allow free access to no more than 3 mm height tap water, only from one circular surface. The change of each specimen’s weight due to the uniaxial water uptake (capillary absorption was recorded to calculate the sorptivity, S (mm/min0.5). Specimens from each mixture were tested at the age of 28 days.

2.3.3. Chloride Migration and Penetration Tests

The chloride penetration coefficient, D n s s m ( × 10 - 12 m 2 / s ) was measured by performing a non-steady-state Rapid Chloride Migration Test (RCMT), in accordance with the NT Build 492 method [37]. A segment of 50 mm was extracted from the middle zone of a cylindrical specimen (∅100 × 200 mm) and was sustained for 24 h under a stable current difference, between a cathode solution of 10% sodium chloride (NaCl) by mass and an anode solution of sodium hydroxide (NaOH), 0.3 N. A total of six specimens were tested for each mixture, two for each test age of 28, 90 and 180 days. The specimens were kept in a calcium hydroxide solution until they were tested. After the completion of each test, the chloride migration depth was determined using the colorimetric method. Specifically, the specimen was split axially into two pieces and one of the two fractured surfaces was sprayed with a 0.1 M silver nitrate (AgNO3) solution. The average depth of chloride penetration was determined from the change in colour in the area where the presence of chlorides chemically led to the formation of white silver chloride (AgCl). The classification of the chloride ion ingress resistance according to the aforementioned, was proposed by Nilsson et al. [38], as presented in Table 5.
The electrical indication of the concrete’s capability to resist chloride ion penetration, measured in Coulombs (C), was also evaluated by carrying out a Rapid Chlorides Penetration Test (RCPT). As described in ASTM C1202 [39], concrete cylinders of 100 mm in diameter and 50 mm in height from each mixture at the age of 90 days were placed in a hermetically sealed cell, which contained a sodium chloride solution (3.0% NaCl) at the negative pole, and a sodium hydroxide solution (0.3 N NaOH) at the positive pole. A current of 60 V DC was applied and a charge flow passed from the negative to the positive pole through the specimen. A computer software reported the electrical charge that passed in 6 h. The resulting charge values were used for the classification of the samples, according to the scale offered by the standard [39], also shown in Table 5.

2.3.4. Freeze and Thaw Test

For each mixture, three cubic specimens with dimensions of 70 × 70 × 70 mm3 were used for the evaluation of the resistance of concrete to rapid freezing and thawing, according to ASTM C666 [40]. The standard describes rapid freezing and thawing in water, and the minimum and maximum target temperatures were set to −18 ± 2 °C and +4 ± 2 °C, respectively. Each cycle took 4 h to be completed. Every five cycles, the unit weight, length change and ultrasonic pulse velocity (UPV) were recorded, while the compressive strength, water absorption and sorptivity coefficient were measured after 75 cycles. The results of every measurement were compared to the control samples of each mixture, which were cured in water for the same duration. The average values of three samples were used for the evaluation of each property.

3. Results and Discussion

3.1. Fresh Concrete Properties and Strength

The properties of fresh and hardened concrete for all concrete mixtures are presented in Table 6. According to the slump test results, all the mixtures are classified above the S2 slump class. Noticeable results are reported for the mixtures PuCa and PePu, which exhibited a very high slump (S4), higher than normal concrete, even though less superplasticizer was added. Certainly, the pre-wetting process of the aggregates had a detrimental role in both the enhancement of workability and the reduction in the slump settlement of the mixtures. The saturated aggregates prevented the mixtures from an initial or a delayed water absorption that would result in a looser slump. In addition, the higher percentages of air trapped in these mixtures improved the workability of the concrete [41].
A respective increase in the percentage of entrained air was noticed in the mixture RPePu, however, a slump settlement reduction of up to 48.5% was reported compared to the reference mixtures. Other studies have also reported similar observations, occurring from the replacement of LWAs with R in LWC mixtures [42]. This behaviour is attributed to the irregular shape of rice husk ash particles, as well as their highly microporous cellular structure, which both lead to an increase in the friction and water demand of the mixture [13].
As mentioned earlier, the values of air content in the LWC mixtures increased (4.8–6.2%) compared to the normal-weight concrete (3.1%). An increase in the air content is expected when LWAs are used in the concrete mixtures, since their porous structure traps air in the concrete matrix. Another fact explaining the increase in the air content is the addition of more superplasticizers, which are known for trapping air between the particles to reduce friction [42].
Finally, LWC mixtures achieved density values of 1526–1682 kg/m3, which reduced up to 36% when compared to the REF mixture. All the mixtures satisfied the initial density goal of the mix design classified in the density classes below D1.6, according to EN206-1 [30].
The average compressive strength after 28 and 90 days (fc,28d, fc,90d) of curing for the LWC mixtures are presented in Table 6, and are compared to the compressive strength values of normal weight concrete. By blending aggregate mixtures with LWAs, the compressive strength of the LWC decreased, as a result of the weak nature of the LWAs. Specifically, at 28 days, the strength of the LWC ranged from 26.0 MPa to 35.3 MPa, which corresponds to less than half the strength of REF. PeCaPu could be, therefore, classified in the strength class LC30/33, whereas the mixtures PuCa, PePu and RPePu are classified in LC25/28. Therefore, all LWC mixtures could be used safely at various structural applications.
Among the LWC mixtures, PeCaPu exhibited the highest strength after 28 days (35.3 MPa). In terms of the strength of the mixtures, perlite satisfactorily replaced the calcareous sand in the aggregate blend. The PePu and RPePu mixtures developed an almost identical strength with PuCa, which confirms the use of Pe as an alternative fine aggregate material. Additionally, as shown on Table 6, the compressive strength of the LWC increased at the end of curing from 11 to 28%, which is significantly higher compared to the increase in REF (0.3%). The two mixtures with the highest percentages of pumice, PuCa and PePu, showed the greatest increase in compressive strength from 28 to 90 days. Particularly, the compressive strength of PuCa and PePu increased by 20% and 28%, respectively; and by increasing the volume of Pu and Pe in the aggregate blend, the strength increased further after curing. It is known from the literature that pumice significantly improves the compressive strength in the long term, due to its pozzolanic reactivity [20,43]. Moreover, the reactive silica content of pumice provides better Si-O-Si bonding between the paste and the aggregates, as fresh cement paste penetrates into the open large pores of the LWA [44]. Additionally, the internal curing provided by the LWA has a positive effect on the development of the material’s strength. Water released from the LWA hydrates the unhydrated cement particles, compensating for the strength development in the later hydration course [45]. On the other hand, the expected positive effect of R on the strength after the age of 28 days, which is reported in the literature to be in some cases even above 50% [46], was not observed in this study. Only a 12% strength increase in the 28-day compressive strength of RPePu was reported at the age of 90 days, which was lower in comparison with the other LWC mixtures, indicating low pozzolanic efficiency for the specific grading of R. The results are consistent with those of similar research [47] on normal weight concrete, where the reported strength increase from 28 and 90 days was close to 10%, when R replaces aggregates at a level of 20% by cement mass (here 25%). The same study [47] also presented the role of the fineness of R on its pozzolanic reactivity. Madani et al., 2012 [48] studied the effect of the coarseness of R when used as an aggregate. Coarse R is unable to produce a uniform distribution in the mixture of the fine particles, which act as a nucleation site for the pozzolanic reactions. The reported limited increase in the compressive strength stems from the reactive silica contained in R, as well as the internal curing provided by the reserved water in the porous skeleton of LWA [49].

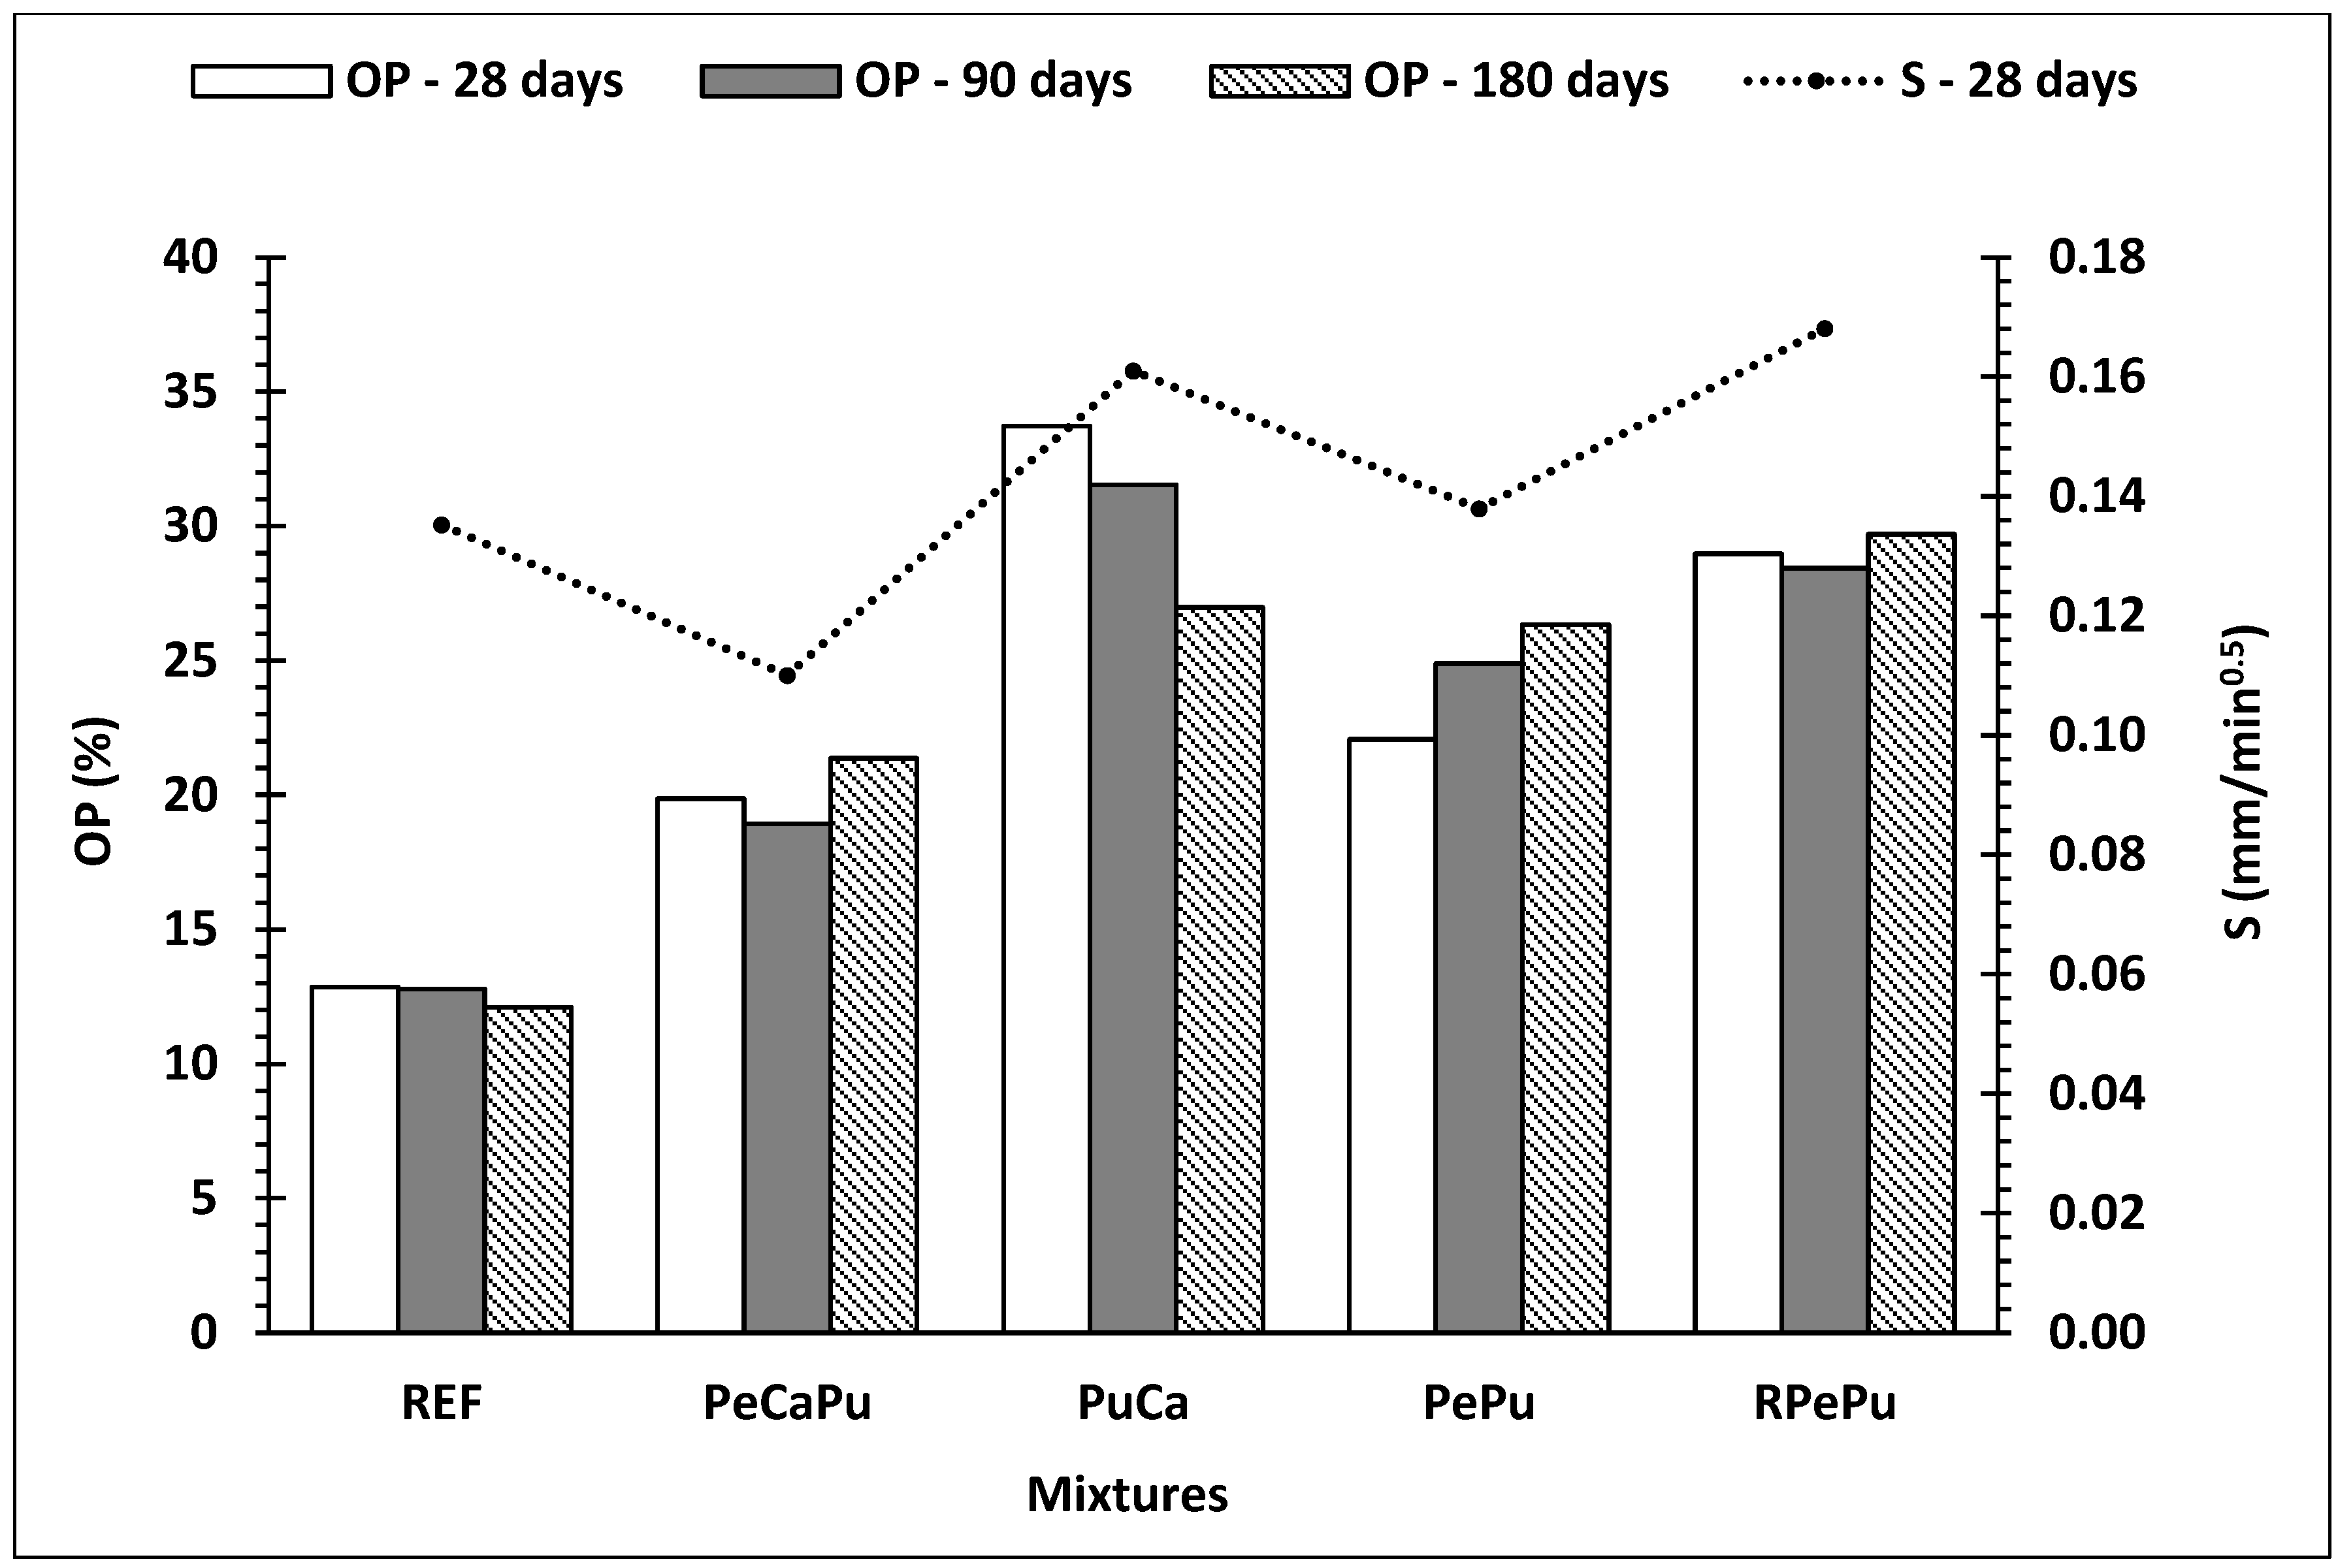
3.2. Porosity and Sorptivity

The experimental results related to the open porosity measured different ages (28, 90 and 180 days) of concrete samples are presented in Figure 3, where the concrete mixtures are illustrated from left to right with descending density. The values obtained for the open porosity coefficient, after the 28th day, range from 20% to 34%, significantly higher compared to REF (13%). These results are in agreement with findings in the literature [20,29,50], indicating that the replacement of natural aggregates by LWA increases the water absorption of the LWC.
Nevertheless, the combination of Pe (0–2) with Pu in the LWA blend reduced the open porosity, which also occurred in the concrete mixtures PeCaPu and PePu at all ages compared to the other LWC mixtures. As mentioned earlier, fine particles of Pe (0–2) functioned as filling particles for the paste’s microstructure and provided a denser interfacial transition zone. Consequently, a reduced water absorption rate and lower open porosity values are measured.
In contrast, the observed increased porosity of the RPePu can be attributed to the highly porous structure of rice husk ash. Öz, 2012 [50], reported that unground R particles are largely irregular, vesicular, layered in appearance and exhibit a porous structure affecting negatively the concrete’s homogeneity. Due to all the reasons mentioned, an increase (125%) in the RPePu’s porosity is reported at the age of 28 days compared to conventional concrete.
Finally, in concrete specimens of older age (90 and 180 days), the measured values of open porosity seem to have improved slightly. For instance, the PuCa mixture shows a 20% reduction in the value of open porosity after 180 days. This mixture showed an improvement in the compressive strength in the long-term (see Section 3.1) as well.
In the same figure (Figure 3), the sorptivity, S (mm/min0.5), test results of the LWC specimens at the age of 28 days are presented. Throughout the test, the capillary water absorption of all the specimens increased and the coefficient of correlation (R2) values were near 1, satisfying the high degree of linearity (0.98) that the standard [35] suggests. The obtained values for the coefficient of sorptivity ranged from 0.11 mm/min0.5 to 0.17 mm/min0.5. Between all the LWC mixtures, the sorptivity coefficient values varied with a very similar trend to that of the open porosity values, as both these phenomena are strongly related to the porous structure of concrete. A lower rate of capillary water absorption was reported for the PeCaPu mixture, even lower than that of conventional concrete (by 19%). Again, the fine grains of Pe (0–2) acted possibly as fillers and densified the interfacial zone.
At the same time, PuCa and RPePu mixtures exhibited higher sorptivity rates (0.16 mm/min0.5 and 0.17 mm/min0.5, respectively) than the conventional concrete (0.13 mm/min0.5). Sorption increases with the increase in the amount of coarser pumice in the mixture, such as Pu (0–16) and Pu (0–8), because of its higher porosity. Interestingly, in the case of RPePu, the addition of Pe (0–2) did not exhibit the influence of the rice husk ash on the capillary pore system. These results are in agreement with those found in the literature, where a 2.5 times greater capillary water absorption value is reported when coarse pumice aggregates replace normal weight aggregates [51].

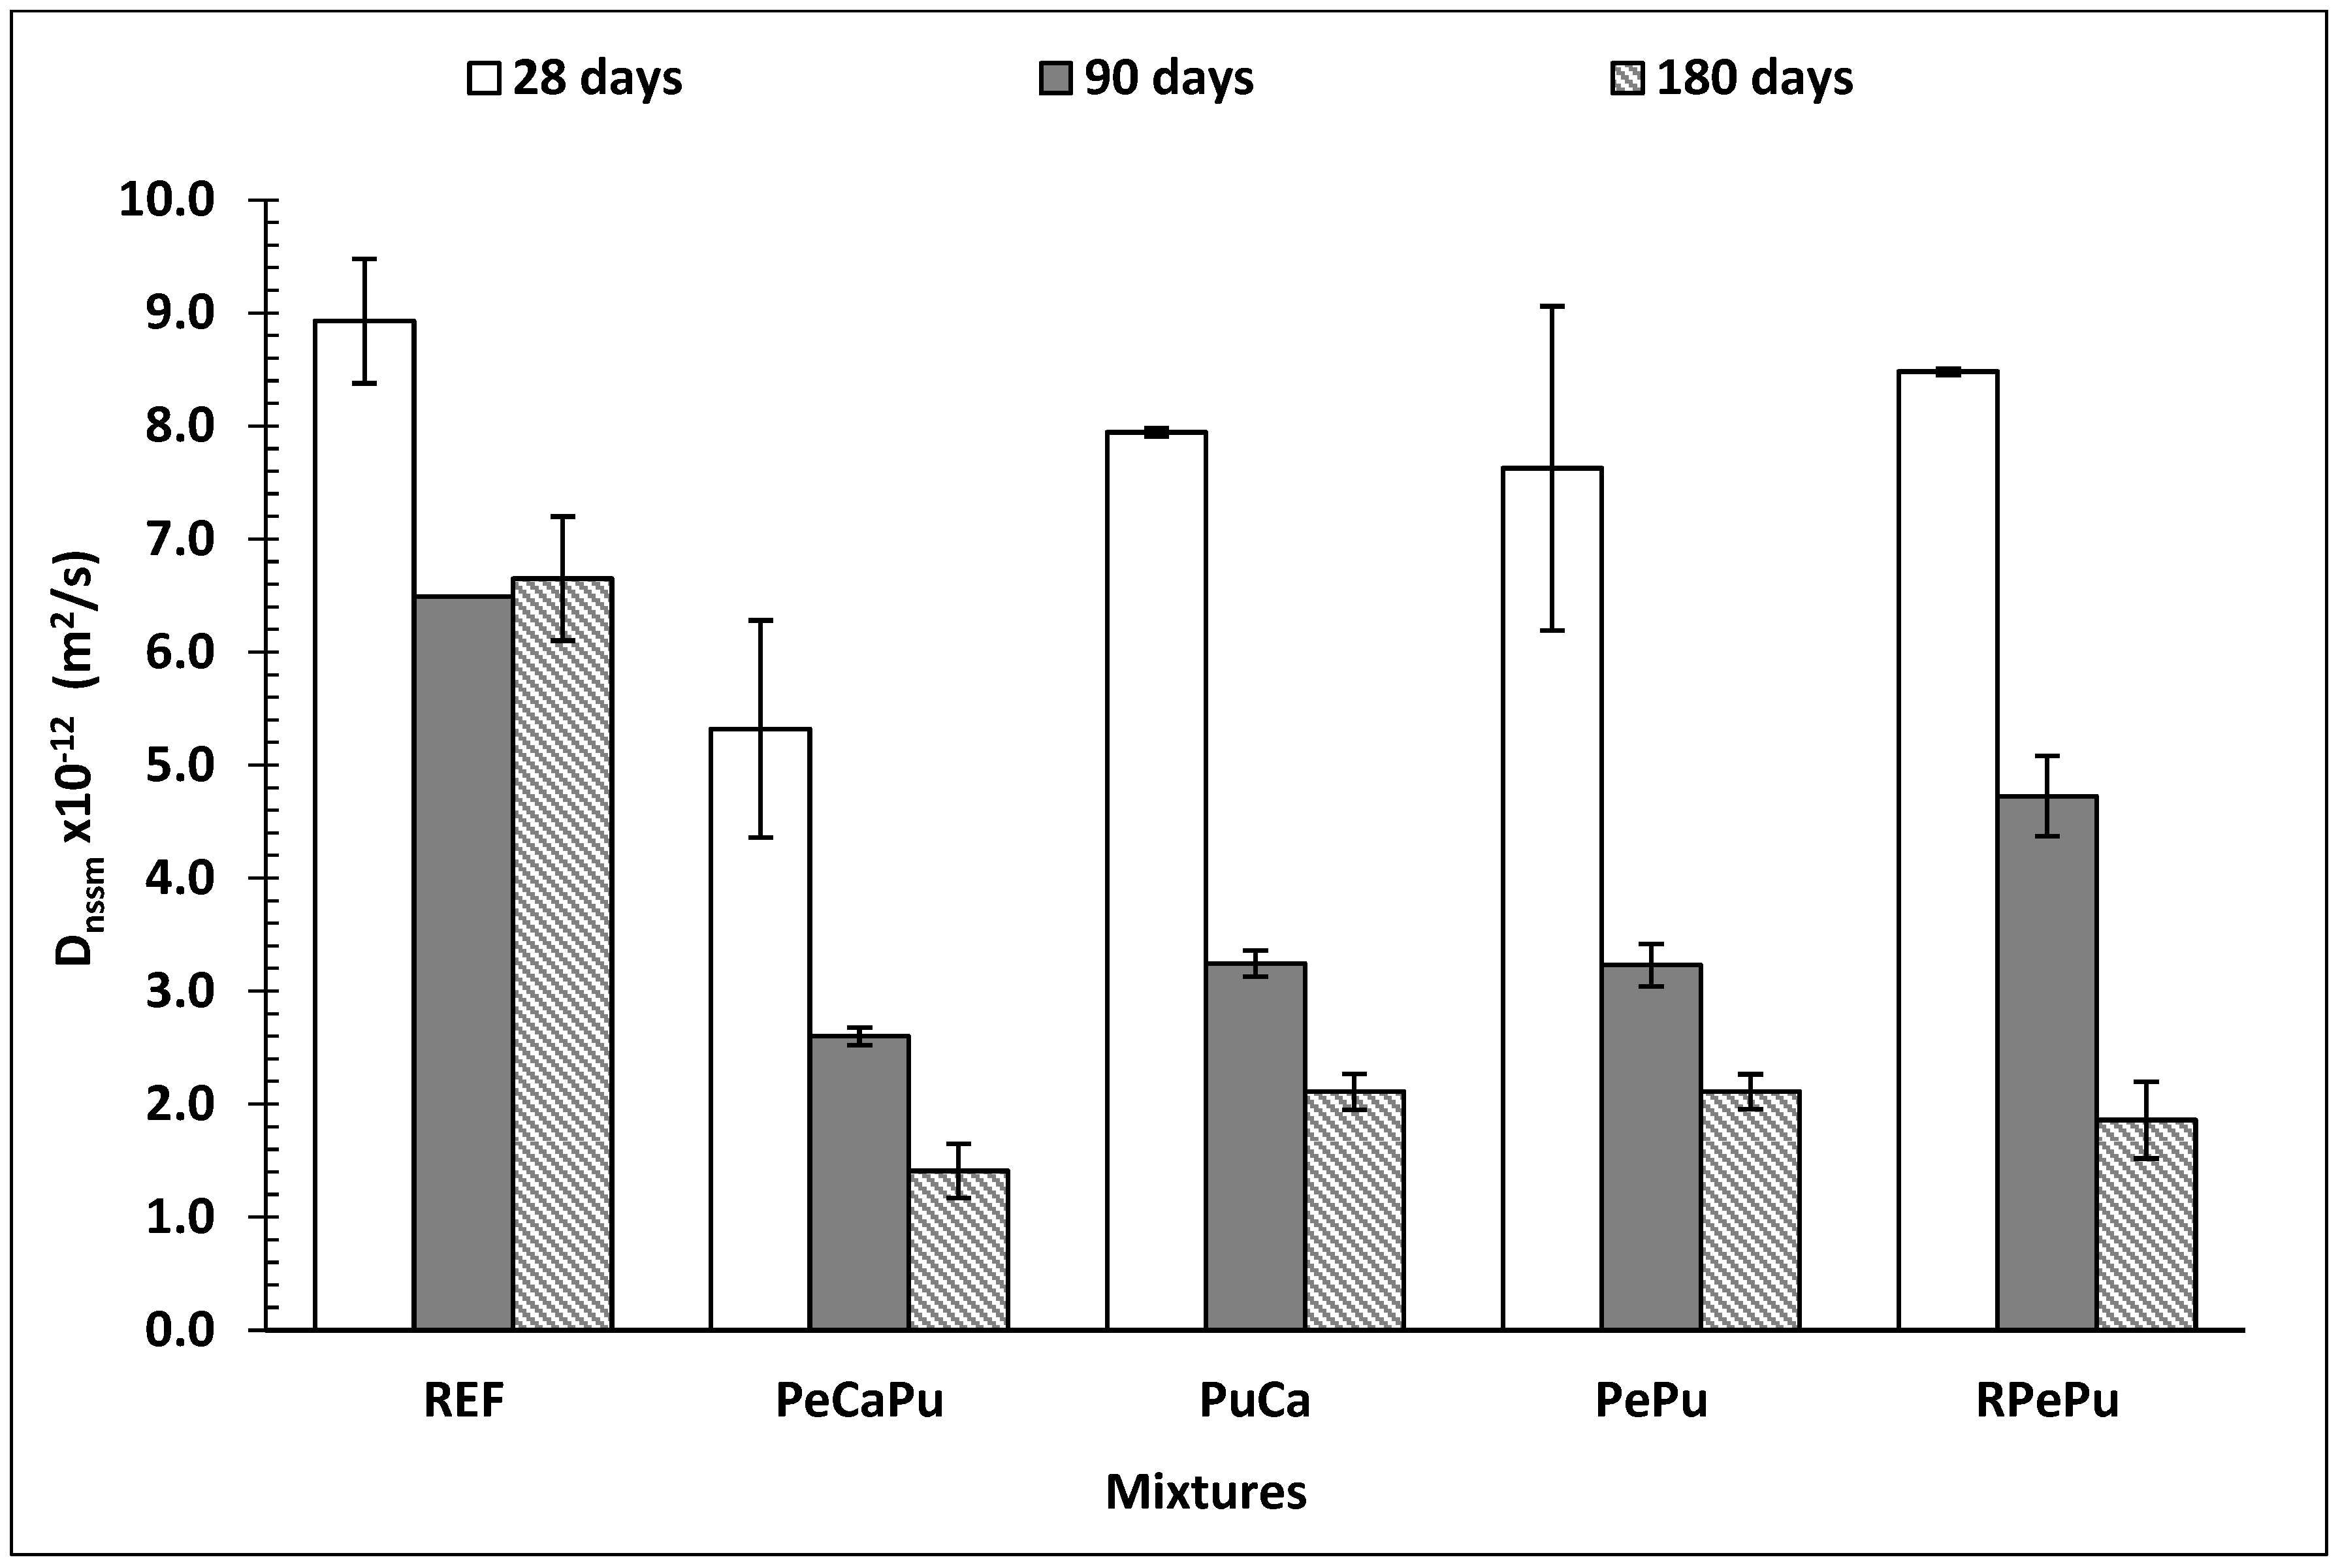
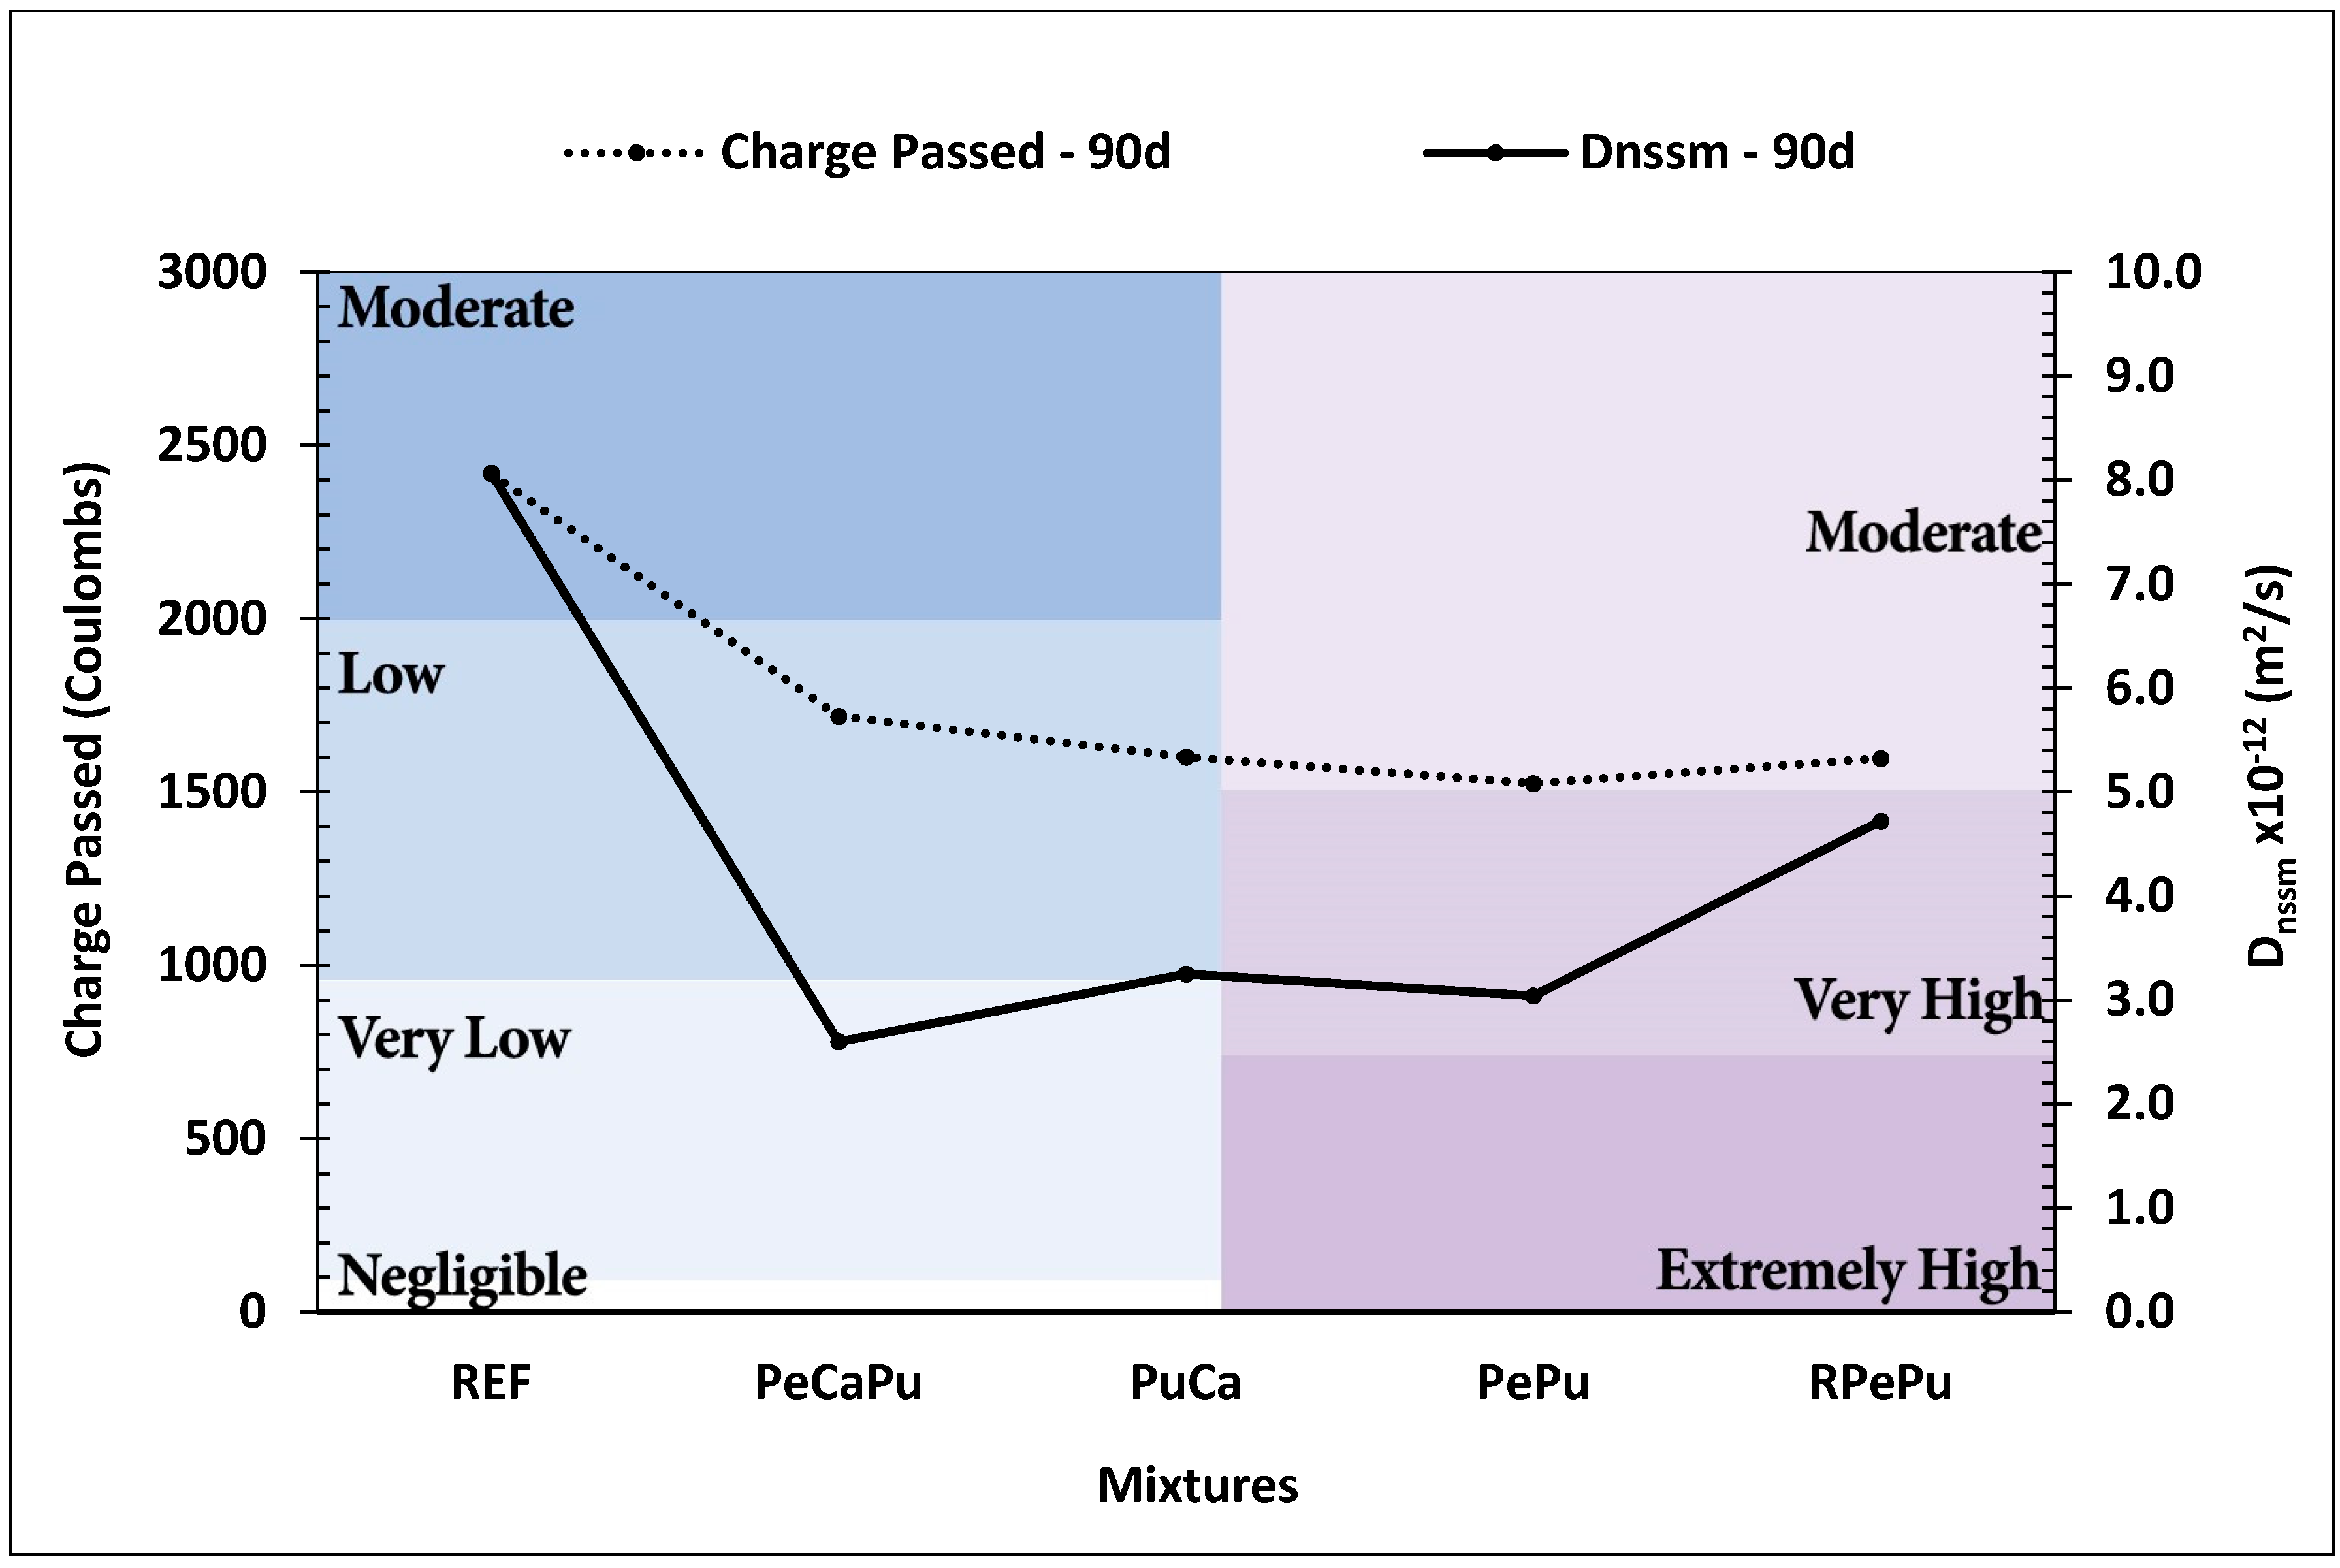
3.3. Chloride Penetration and Migration Tests

Chloride migration (RCMT) coefficients and penetration (RCPT) resistance were evaluated according to the relative standards, [37] and [39], respectively. Concrete mixtures were evaluated by the RCMT at the ages of 28, 90 and 180 days, while RCPT was conducted only at the age of 90 days.
The values obtained from the RCMT are presented in Figure 4. The chloride migration coefficient, D n s s m , values of the concrete samples at the age of 28 days ranged from 5.5 to 8.5 m2/s; this was lower in most cases when compared to REF (9.0 m2/s). The addition of Pu, Pe and R significantly improved the chloride resistance, evident even only after 28 days, although it increased further over time, contrary to the REF that did not show any significant improvement after 90 days of curing. The PeCaPu mixture had the best chloride penetration resistance response at all ages, with the lowest D n s s m being 1.4 m2/s measured at 180 days. PePu and PuCa showed the highest improvement (approx. 60%) of D n s s m between 28 and 90 days, which is consistent with the improvements in strength and porosity of the same mixtures. Although the RPePu mixture did not show the highest chloride penetration resistance, and despite the fact it had the second highest D n s s m after REF at the age of 28 days, at the age of 180 days, it demonstrated an impressive 74% increase in the D n s s m . The D n s s m typically decreases with the exposure period independently of the type of aggregates used as a result of the pozzolanic reactivity, the binding capacity and the chloride pore-blocking effect of the LWA [52]. It is also well-established in the literature that the time-dependent improvement in the permeability of LWC is attributed to the so called “internal curing effect”, due to the delayed hydration of the cementitious materials caused by the available water in the LWA pores [45]. The internal curing effect and mostly the blocking effect of the LWA could also justify why, despite the higher open and capillary porosity of all the LWA concrete samples, and, therefore, their expected high penetrability, low values of D n s s m are reported.
The electrical charge measured by the RCPT for the concrete mixtures at 90 days is presented in Figure 5. These results are also directly compared to their counterparts obtained by the NT Build 492 [37] test, aiming to classify the concrete mixtures according to both classifications given by the ASTM C1202 standard [39] and Nilsson et al., 1998 [38]. As far as the chloride penetration resistance of the LWC mixtures is concerned, according to the ASTM C1202 standard [39], the electrical charge varied from 1525 to 1718 C. In comparison with the REF mixture, the incorporation of LWA reduced the penetrability of the chlorides into the LWC, by an average of 33.5%. Specifically, comparing the LWA mixtures, chloride penetrability was the lowest in RPePu (1597 C), while the highest one was recorded for PeCaPu (1718 C).
Table 5 shows a general correspondence between the results that can be obtained by the two different tests (RCMT and RCPT), which was also evident in the measurements of the chloride-ion penetrability on all LWCs at the age of 90 days; these were classified as of high (RCPT) to very high (RCMT) resistance.
Although the two methods differ in the specimen’s initial condition (saturated and not saturated in Ca(OH)2) and the testing parameters (solutions concentration, voltage and testing time), the results were found to be qualitatively similar. Conclusively, both methods certify that all the LWA mixtures exhibit excellent chloride penetration resistance after 90 days of curing, without any significant variation among the different mixtures.

3.4. Freeze and Thaw Test

Ultrasonic pulse velocity (UPV) and freeze-thaw (FT) test results are presented and discussed in terms of total mass and total length change (% with respect to the initial mass and length of the specimen). In addition, the effect of 75 FT cycles on the open porosity (OP), sorptivity (S) and compressive strength (fc) of the concrete is discussed.

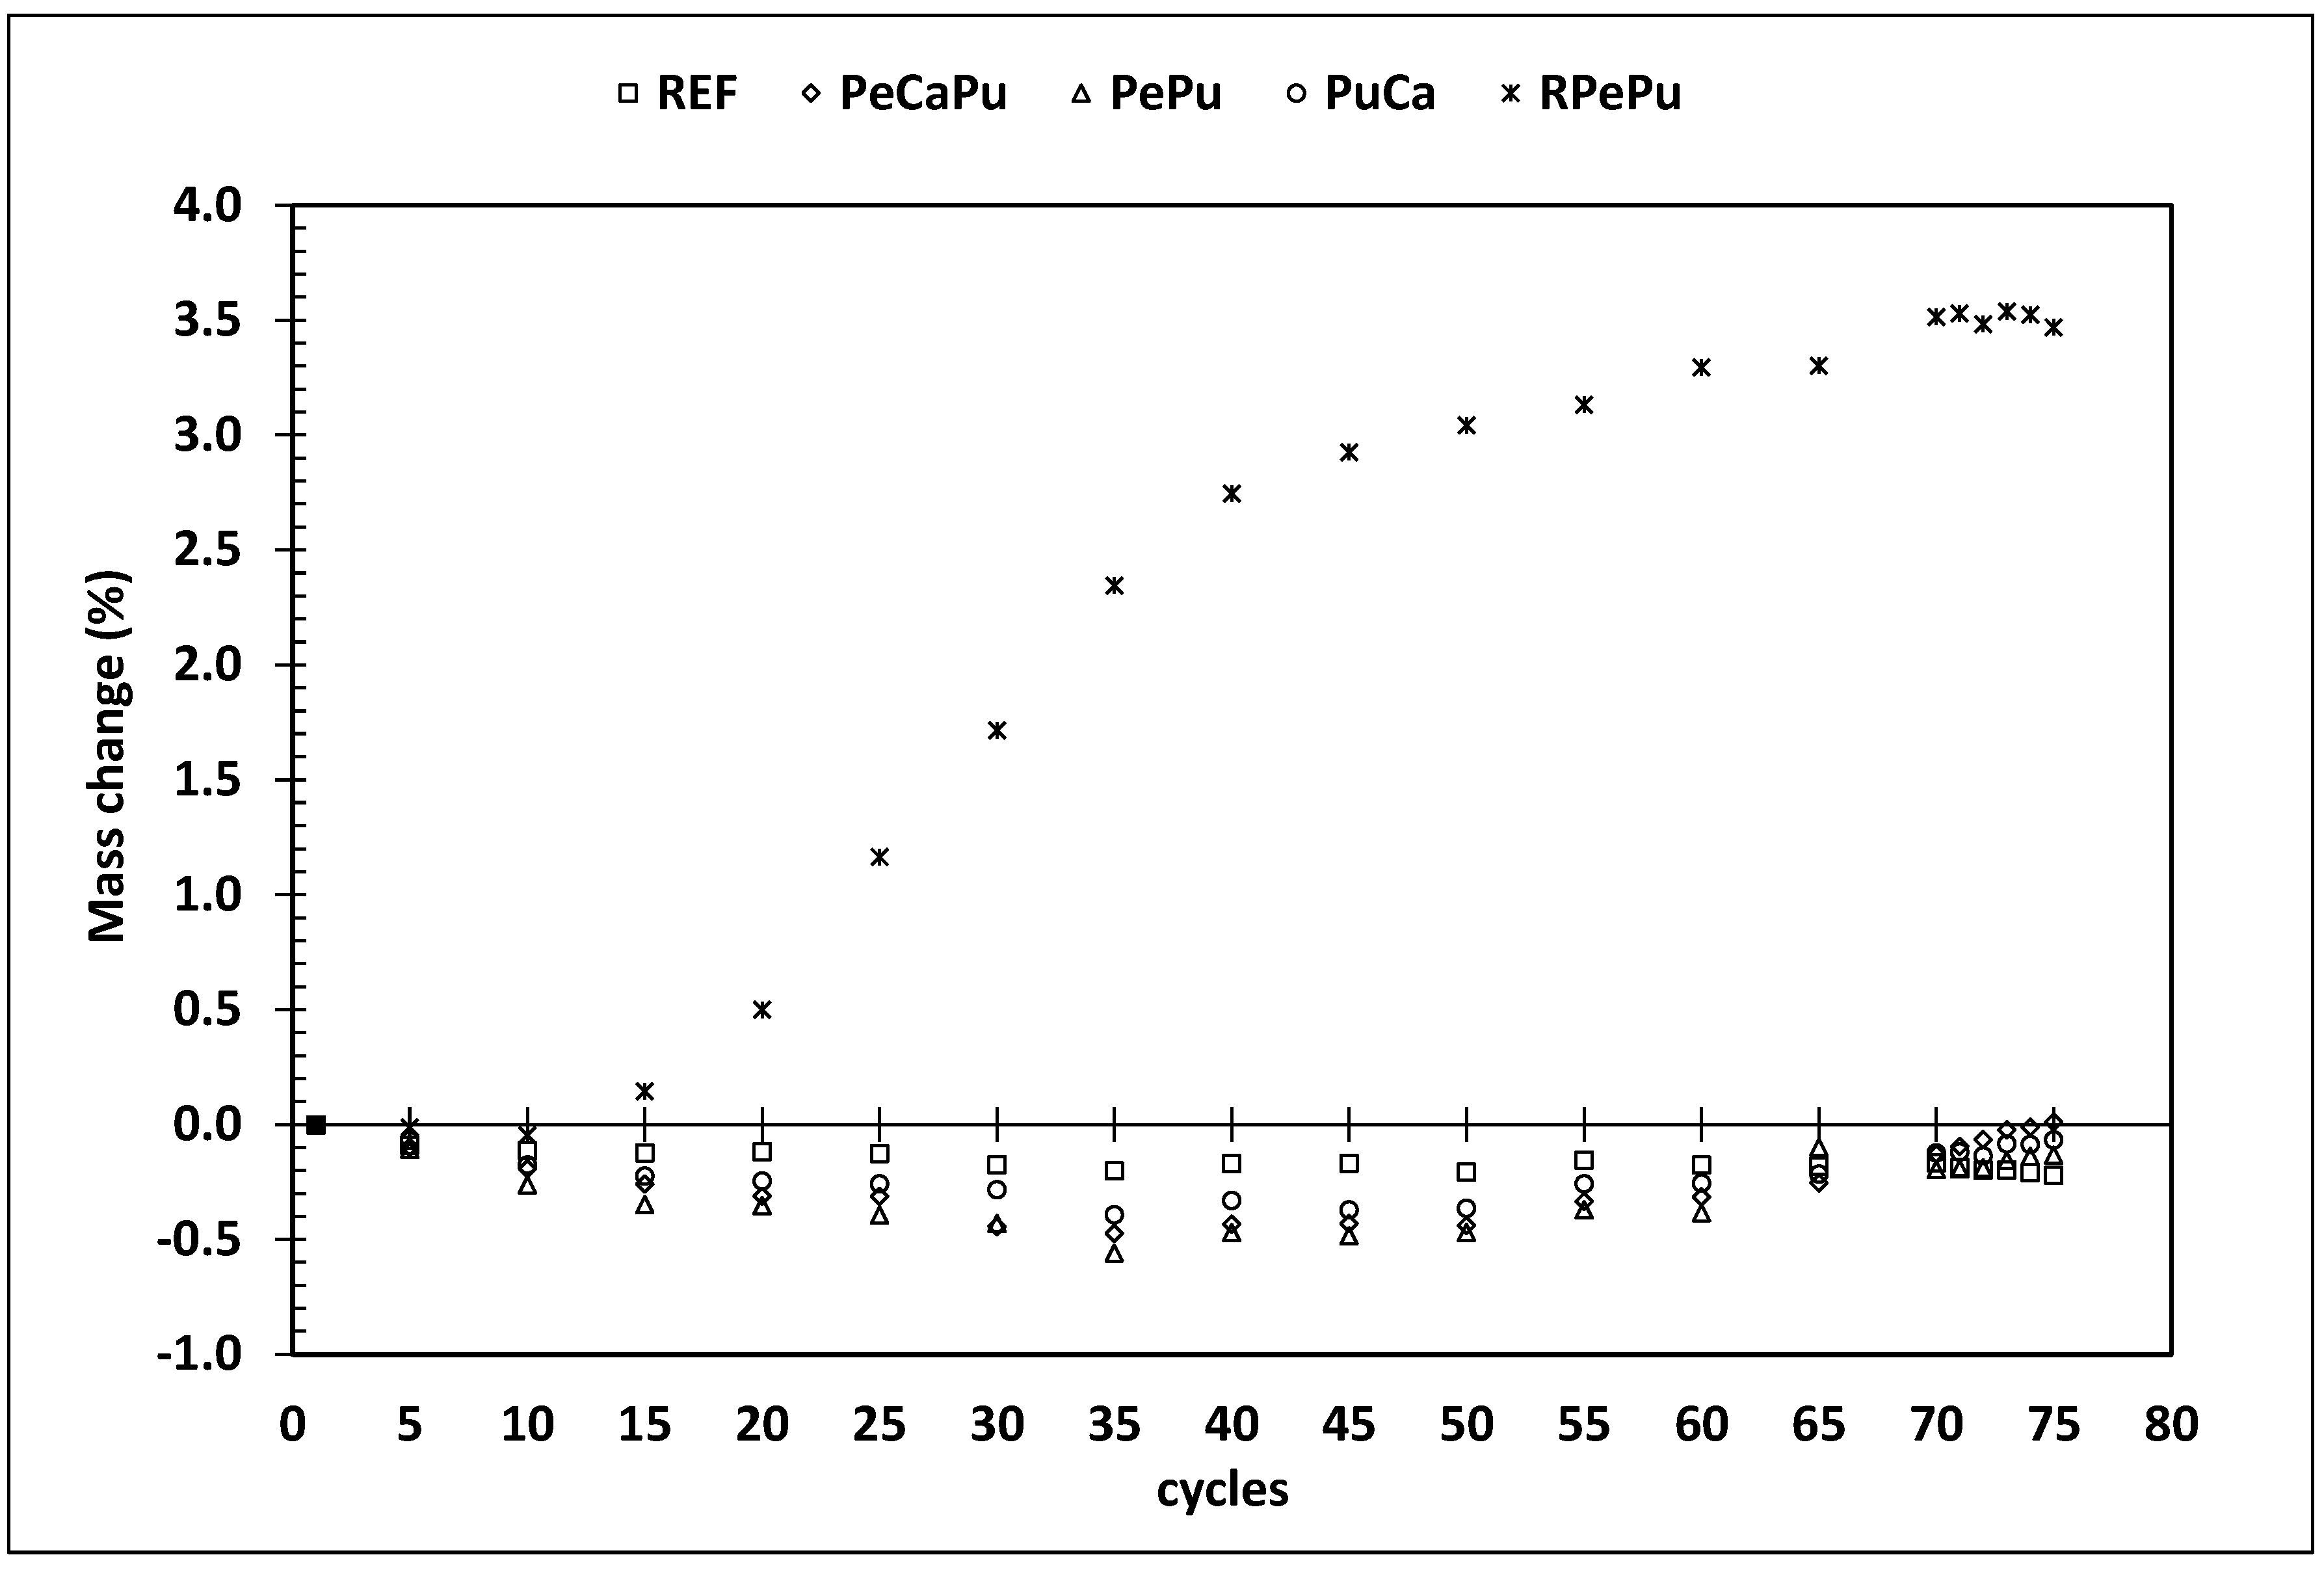
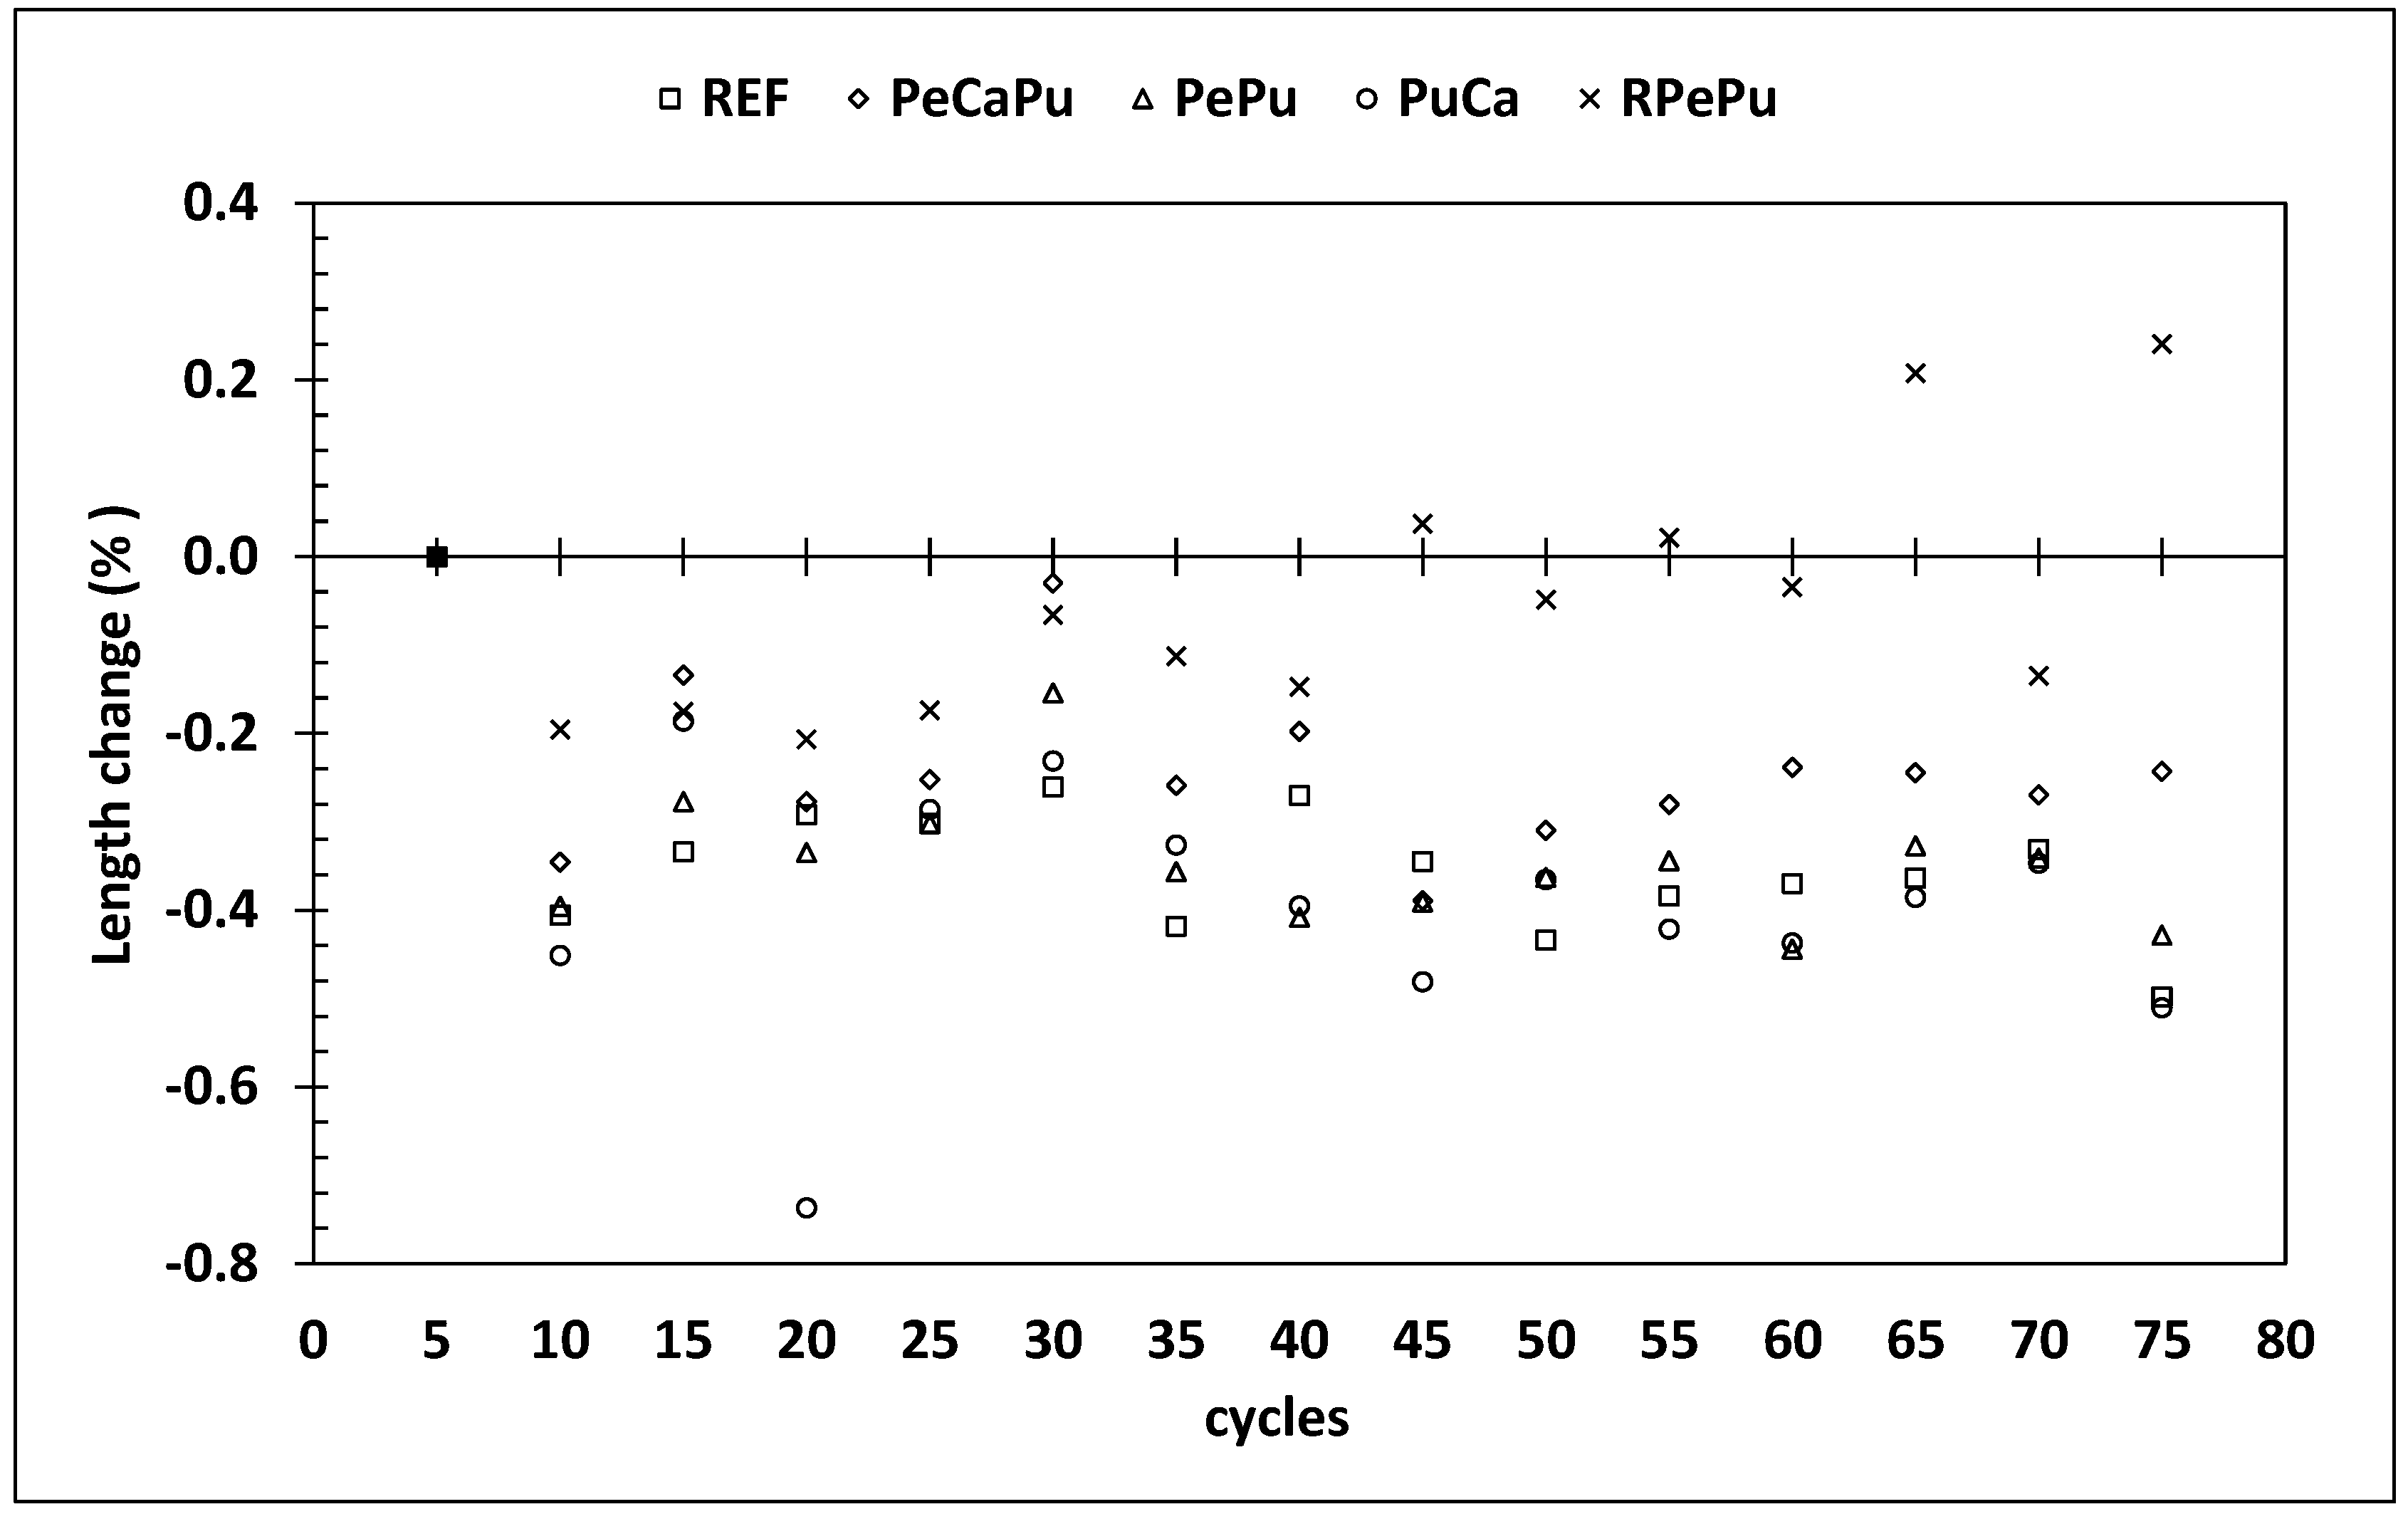
3.4.1. Mass and Length Change

The weight change in the LWC mixtures after the FT cycles is presented in Figure 6. In comparison to REF, the effect of the FT cycles on the specimens’ mass was negligible apart from the RPePu mixture.
As shown in Figure 6, a negative mass change (%) occurred after the first FT cycles as expected, since the measurements are taken after the freeze cycle when the water in the specimens was frozen. The negative mass change (%) is consistent across all mixtures until the 75th cycle; this is except for the RPePu mixture, in which a positive mass change (%) was reported after the 10th cycle, which was kept increasing over time. After running 75 cycles of FT, the mass of the RPePu specimens increased by approximately 3.5%. It is clear that the addition of R has a negative impact on the response of the LWC specimens during repeated cycles of FT. The mass change of PeCaPu also reached a positive value once it completed the 75th cycle, a fact that signifies the initiation of the degradation of its structure.
Figure 7 presents the change in length (%) of the LWC mixtures during the FT test that was calculated by subtracting the length of the samples in a thawed condition from their initial one. All the mixtures, except RPePu, presented a similar trend in length change. The RPePu mixture showed an increase in the length over the limit of 0.1%, at the 65th cycle and onwards. According to the ASTM C666 [40], length changes greater than 0.1% reveal a structural degradation.
By observing the measured length change values across all mixtures, PeCaPu appears to have the largest resistance to the expansion effect of the FT cycles. In terms of mixture ingredients, PeCaPu contains a fine grade of perlite aggregate, Pe (0–2), which seems to have contributed positively to its endurance. In contrast, the results showed that by increasing the percentage of pumice in PePu and PuCa, the resistance of the LWC structures against the FT cycles was not affected positively, a finding also highlighted in other studies [53]. LWAs demand large amounts of water during mixing and, therefore, absorb large quantities of water due to their porous nature. The water surplus contained in the pore system of the concrete promotes the FT degradation and, as the cement paste is susceptible to the water content, expansion is evident as a result of the ettringite and other hydrates [54]. However, until the 75th cycle, an insignificant length change (<0.1%) was reported in all concrete mixtures, except in RPePu.

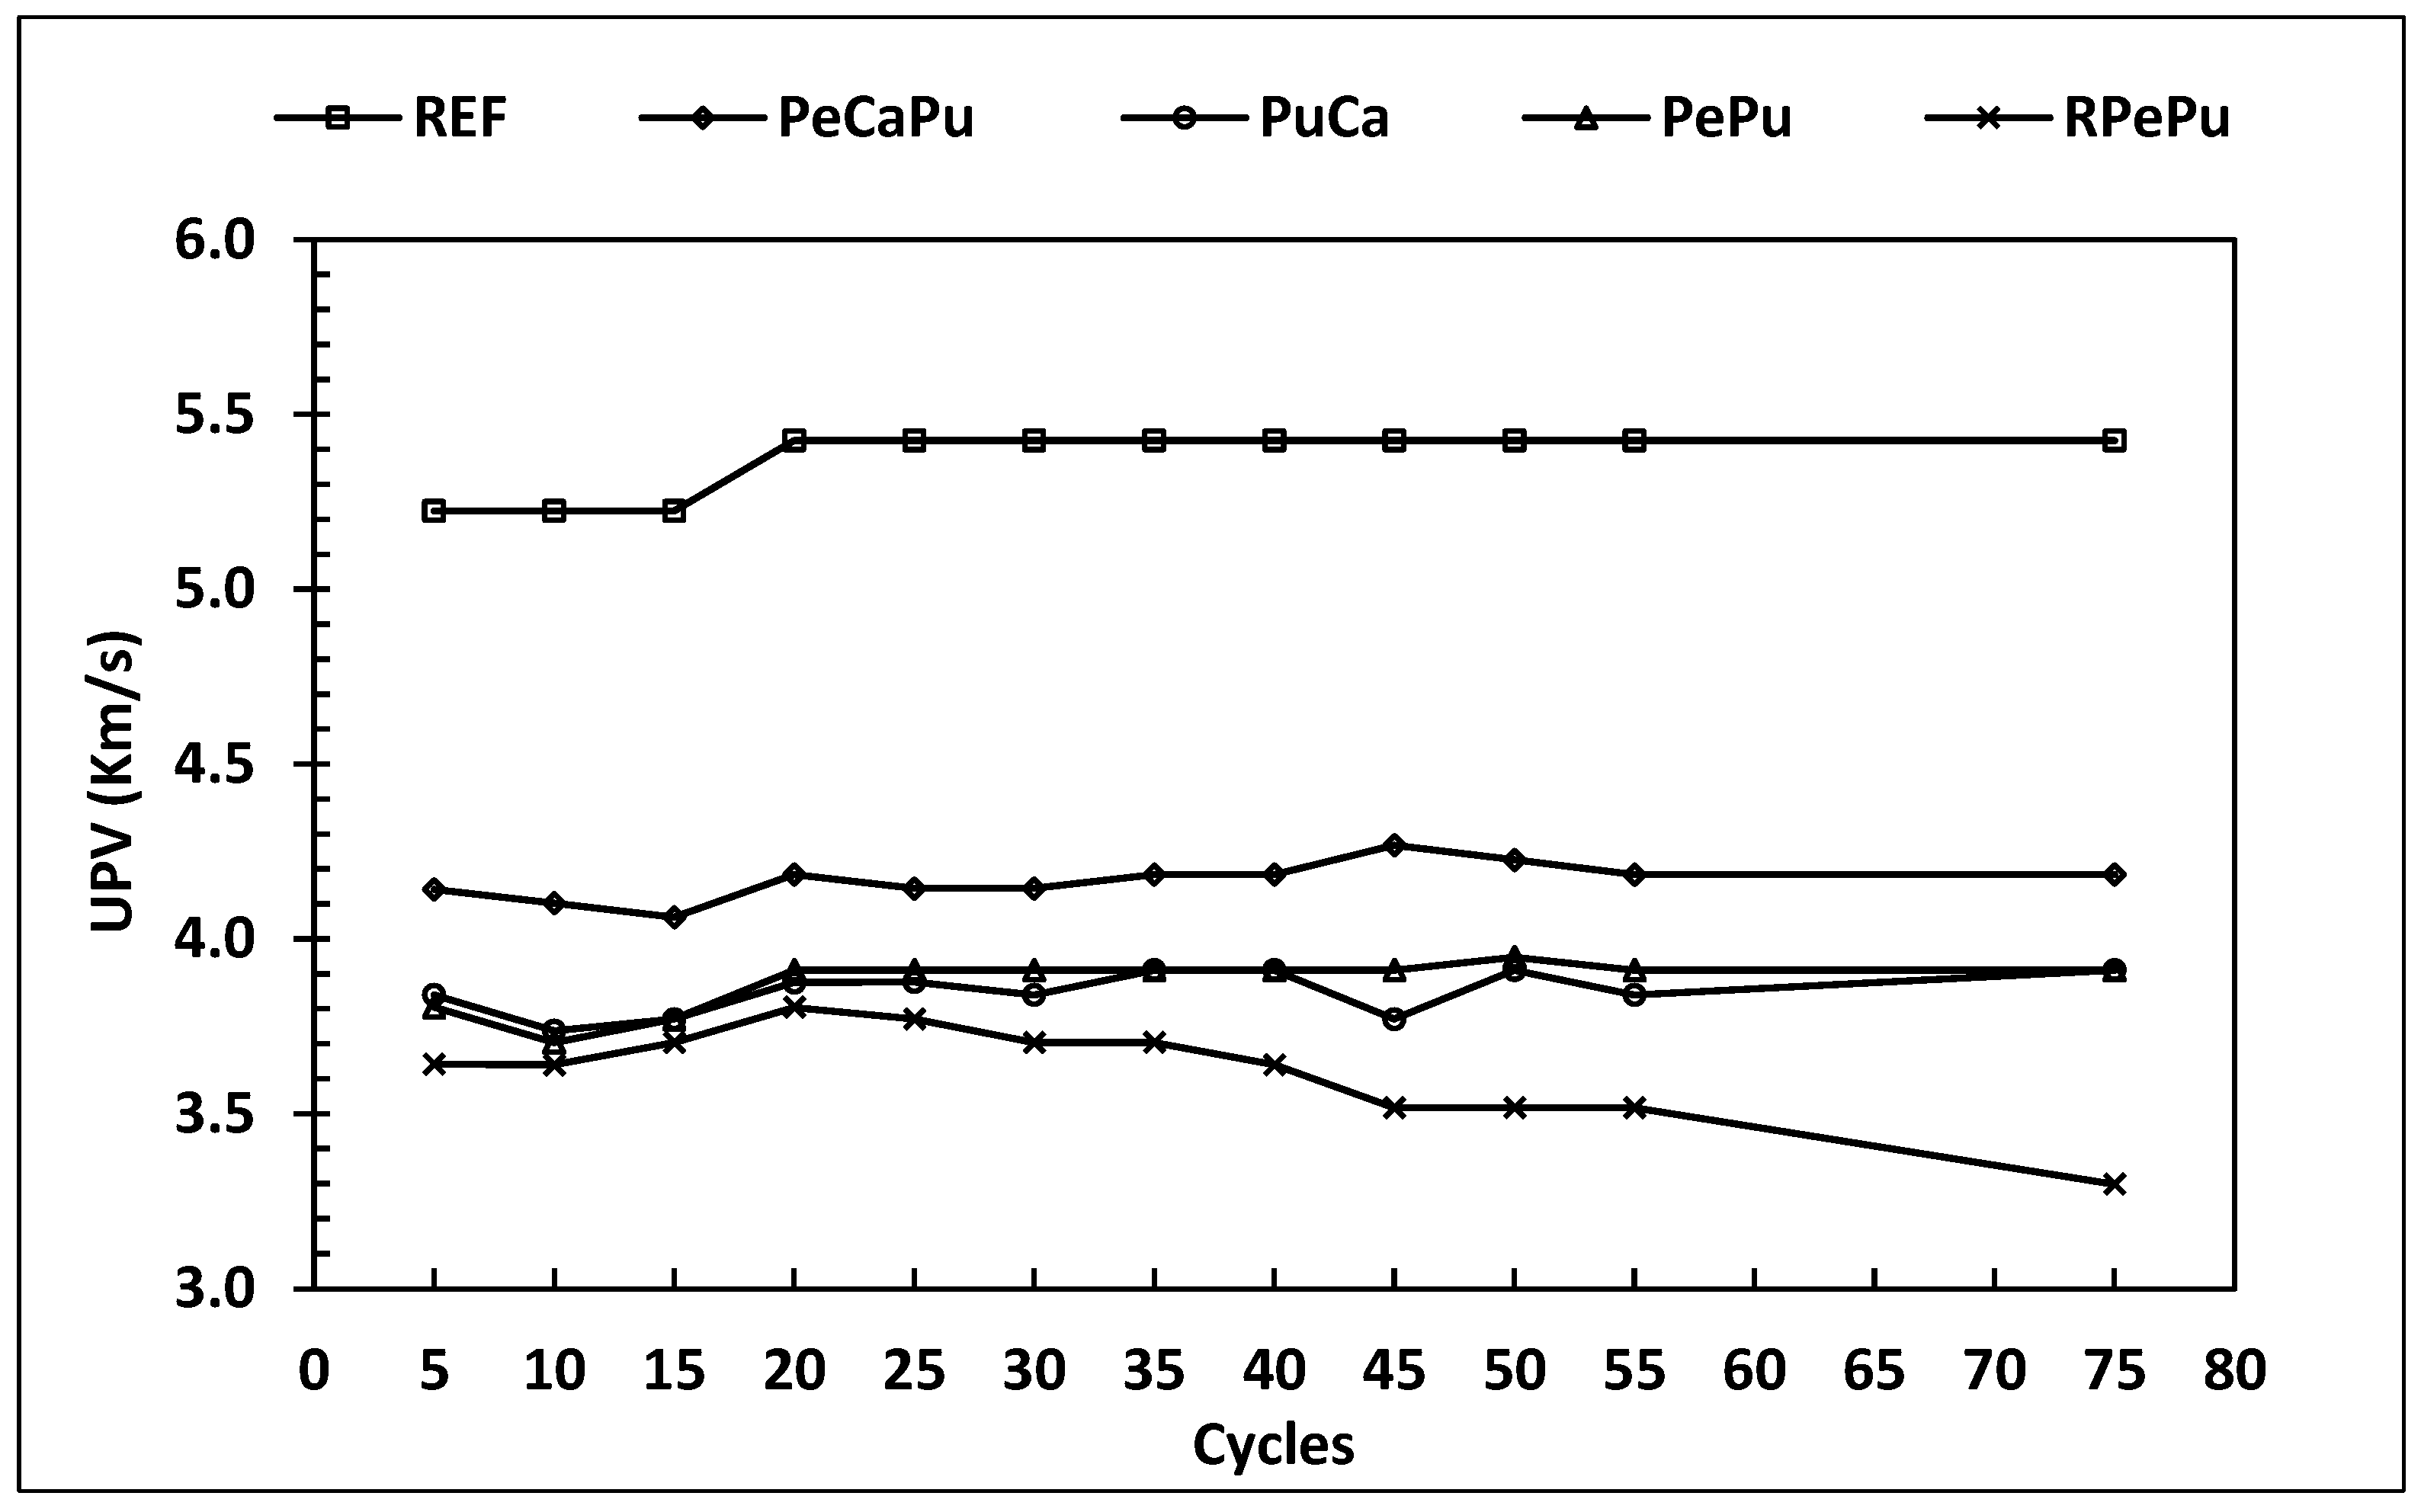
3.4.2. Ultrasonic Pulse Velocity

The UPV (Km/s) values of concrete samples after each FT cycle are presented in Figure 8. The concrete mixtures showed UPV values inversely proportional to the densities of the mixtures. The REF mixture recorded the highest UPV value, whereas among the LWC mixtures, PeCaPu and RPePu registered the highest and lowest values, respectively. At the same time, the mixtures PuCa and PePu showed almost identical UPV values for most FT cycles.
Based on the experimental results, no significant change in the UPV values was recorded after running 75 FT cycles, and all mixtures exhibited a rather neutral trend of UPV change. The UPV values were expected to reduce, however, considering the structural degradation of the concrete skeleton due to the FT testing. It seems that the combination of pumice and perlite Pe (0–2) contributed positively to maintaining the quality of LWC mixtures during the FT test, although, according to the literature, the UPV values should decrease with increasing pumice replacement [55]. Only the RPePu mixture showed a constant reduction in the UPV values after the 20th cycle. Thus, the UPV values could not reveal the internal damage captured, however, by the compressive strength measurements, as will be discussed in the next Section 3.4.3.
It should be mentioned that the higher UPV values measured during the first FT cycles for most mixtures are attributed to frost formation, which is known to increase the UPV values of concrete [56].

3.4.3. Water Absorption and Compressive Strength

Changes occurring after the FT test with respect to the measured values at the beginning of the FT test for the compressive strength (fc,FT), open porosity (OPFT) and sorptivity (SFT) are used as degradation indexes. Table 7 presents this change (%) for all concrete mixtures. The strength is reported to be affected mainly after the FT test; therefore, fc,FT, has a primary role in the ranking of concrete mixtures as far as their resistance against FT is concerned. The PePu mixture performed the best in three indexes, compared not only to the other LWC mixtures, but also to REF. Based on these findings, the combination of pumice and perlite could improve the resistance against FT degradation mechanisms.
Since the compressive strength is a major index for the evaluation of the frost resistance of LWC, its variations are discussed further. The strengths of PuCa, PeCaPu and RPePu after 75 FT cycles dropped by 19%, 25% and 26%, respectively, compared to measurements taken at the beginning of the FT test for corresponding samples. According to the results, the combination of Pu, Pe and R decreased the resistance of LWC, indicating a reduction in durability.
As far as porosity is concerned, PeCaPu showed a change of +24% at the 75th cycle. In contrast, a maximum reduction (26%) of porosity was measured in the case of PePu at the end of the test, justifying the higher compressive strength that was recorded for the PePu mixture.
The same absorption behaviour was recorded for the PePu mixture during the sorptivity test, where the results showed an 8% reduction. As discussed above, the combination of Pu and Pe (0–2) demonstrates a greater effect on the LWC structure than the other LWAs due to the filler effect of Pe (0–2).
The sorption change (approx. +212%) of RPePu was the highest among the LWC mixtures, demonstrating the internal degradation of the specimen. According to standard [40], the experimental program should be terminated at the 65th cycle for the RPePu mixture. Consequently, the additional strain of the RPePu mixture during the last 10 FT cycles could be the cause of the high degradation of the capillary pores of the sample.
In general, the PePu mixture was the only one that exhibited endurance during the FT test. As discussed, the filler action of Pe (0–2) in the mixture led to a refinement of the pore system, a reduction in the permeability and a restriction of the entrapment of water that expands during the freezing cycle.
To conclude, all the LWC mixtures, excluding PePu, presented degradation after the FT test, corresponding to the adopted indexes. When the concrete is exposed to FT cycles, the ice forming in the capillary pores generates an expansive stress [57], which leads to the degradation of the concrete, as shown in the analysis of the results of the FT tests. Moreover, the FT cycles cause new cracks to form, which connect with existing ones, as well as the existing pore network of the concrete matrix. This results in an increase in the water absorption during thawing, which promotes the development and migration of frost [58]. The type of LWA can significantly influence the FT resistance of the LWC and the physical properties of the used LWA, with size and porosity being the most important factors.

4. Conclusions

In this study, LWC mixtures were designed to combine pumice and two industrial and agricultural by-products, specifically, run-of-mine perlite or rice husk ash, respectively. Four LWC mixtures were optimized with respect to the achieved density and strength, and were evaluated in terms of durability. The main conclusions are presented in the following:
  • The workability of lightweight concrete is influenced by both the physical characteristics of the alternative aggregates used and the pre-wetting procedure. Specifically, the combination of perlite fines with coarse pumice favoured the concrete’s workability. The water trapped in the LWA pores during the pre-wetting, together with the sealing of the larger pores of the LWA by the slurry of Pe or Pu, favour and also maintain workability.
  • All LWC mixtures, despite their ranking in low density classes (D1.6–1.8), developed an appropriate strength for structural use. Particularly, the incorporation of pumice and run-of-mine fine perlite yielded higher compressive strengths. Reaching a significant structural efficiency is vital, as it enhances and promotes the viability of the designed green concrete mixtures. A development of higher strength over time was also witnessed in all LWC mixtures containing Pe and Pu, relative to their content in the aggregate blend, as a result of their pozzolanic potential.
  • Both sorptivity and open porosity values of the LWC mixtures increased, due to the porous nature of the used lightweight aggregates. However, the sorptivity of the mixture of perlite, coarse aggregate and pumice did not worsen significantly with respect to the REF, due to the relatively higher density of the mixture and the physical action of the fine grains of perlite. It seems that fine particles of perlite acted as filling agents and densified the microstructure and the interfacial zone of the concrete. An improvement in open porosity over time was also observed in the LWC mixtures that contained pumice, in agreement with their increase in strength.
  • An excellent performance in terms of the resistance against chloride penetration was reported in all the LWC mixtures, which exhibited a further improvement with additional curing independent of the aggregate type. This fact can be accredited to the extended hydration and pozzolanic reactions, the binding capacity and the chloride pore-blocking effect. Moreover, all LWC mixtures at 90 days were classified correspondingly by both employed methods [37,39] with respect to their resistance against chloride penetration.
  • In comparison to a conventional concrete mixture (REF), the LWC mixtures were susceptive to the FT cycles. The mixture of rice husk ash, perlite and pumice had the least favourable response after a few FT cycles, in relation to all the used FT indicators. The LWC mixtures with pumice also exhibited a low resistance against FT, although the combination of Pu with Pe exhibited a promising behaviour. Additional research, however, on the FT resistance of the optimized LWC mixtures is necessary.
From the experimental investigation carried out in this work, it was found that the examined LWC mixtures developed adequate strength and durability for structural use, with a remarkable resistance to chloride penetration. The optimized combination of pumice with perlite residues appears to be a sustainable proposal for LWC production and use, as it contributes to the preservation of natural resources whilst satisfying structural performance. This new type of LWC is in accordance with current regulations, and promotes recycling in the construction industry.

Author Contributions

Conceptualization, E.G.B. and V.G.P.; Formal analysis, M.C.S. and G.-E.D.L.; Investigation, M.C.S. and G.-E.D.L.; Methodology, M.C.S., G.-E.D.L., E.G.B. and V.G.P.; Project administration, M.C.S., E.G.B. and V.G.P.; Resources, E.G.B. and V.G.P.; Supervision, E.G.B.; Validation, M.C.S. and E.G.B.; Visualization, M.C.S., E.G.B. and V.G.P.; Writing—Original Draft, M.C.S.; Writing—Review and Editing, E.G.B. All authors have read and agreed to the published version of the manuscript.

Funding

This research received no external funding.

Informed Consent Statement

Not applicable.

Data Availability Statement

Data is contained within the article.

Acknowledgments

The authors gratefully acknowledge HERACLES, Group of Companies, Hellenic Concrete Technology Center (HCTC) for providing materials and laboratory when needed and the IMERYS INDUSTRIAL MINERALS GREECE S.A and EV.GE. Pistiolas S.A. for providing perlite and rice husk ash, respectively.

Conflicts of Interest

The authors declare no conflict of interest.

Nomenclature

CCement
CaCalcareous limestone aggregates
DnssmChloride penetration coefficient
fcCompressive strength
FTFreeze-thaw
LWALightweight aggregates
LWCLightweight concrete
OPOpen Porosity
PeRun-of-Mine Perlite
PLSika® Plastiment 20R
prWWater pre-conditioning
PuPumice
RRice Husk Ash
RCMTRapid Chloride Migration Test
RCPTRapid Chloride Penetration Test
SSorptivity
SPSika® Viscocrete® Ultra-420
UPVUltrasonic pulse velocity

References

  1. Official Journal of the European Union. Energy Performance of Buildings: Directive 2010/31/EU; OJEU: Aberdeen, UK, 2010. [Google Scholar]
  2. International Federation for Structural Concrete. Fib Model Code for Concrete Structures; FIB: Lausanne, Switzerland, 2010; pp. 1–284. [Google Scholar]
  3. Belussi, L.; Barozzi, B.; Bellazzi, A.; Danza, L.; Devitofrancesco, A.; Fanciulli, C.; Ghellere, M.; Guazzi, G.; Meroni, I.; Salamone, F.; et al. A review of performance of zero energy buildings and energy efficiency solutions. J. Build. Eng. 2019, 25, 100772. [Google Scholar] [CrossRef]
  4. Akadiri, P.O.; Chinyio, E.A.; Olomolaiye, P.O. Design of a sustainable building: A conceptual framework for implementing sustainability in the building sector. Buildings 2012, 2, 126–152. [Google Scholar] [CrossRef] [Green Version]
  5. Choi, S.W.; Oh, B.K.; Park, J.S.; Park, H.S. Sustainable design model to reduce environmental impact of building construction with composite structures. J. Clean. Prod. 2016, 137, 823–832. [Google Scholar] [CrossRef]
  6. Tapali, J.G.; Demis, S.; Papadakis, V.G. Sustainable concrete mix design for a target strength and service life. Comput. Concr. 2013, 12, 755–774. [Google Scholar] [CrossRef]
  7. European Ready Mixed Concrete Organisation. 2019. Ready-Mixed Concrete Industry Statistics. 2018. Available online: https://ermco.eu/statistics-previous-years/ (accessed on 24 December 2022).
  8. Tiwari, A.; Singh, S.; Nagar, R. Feasibility assessment for partial replacement of fine aggregate to attain cleaner production perspective in concrete: A review. J. Clean. Prod. 2016, 135, 490–507. [Google Scholar] [CrossRef]
  9. Organisation for Economic Co-operation and Development. Global Material Resources Outlook to 2060: Economic Drivers and Environmental Consequences; OECD: Paris, France, 2019. [Google Scholar] [CrossRef]
  10. Badogiannis, E.G.; Kotsovos, M.D. Monotonic and cyclic flexural tests on lightweight aggregate concrete beams. Earthq. Struct. 2014, 6, 317–334. [Google Scholar] [CrossRef]
  11. Jafari, S.; Mahini, S.S. Lightweight concrete design using gene expression programing. Constr. Build. Mater. 2017, 139, 93–100. [Google Scholar] [CrossRef]
  12. Bogas, J.A.; Real, S.; Ferrer, B. Biphasic carbonation behaviour of structural lightweight aggregate concrete produced with different types of binder. Cem. Concr. Compos. 2016, 71, 110–121. [Google Scholar] [CrossRef]
  13. Singh, B. Rice husk ash, Waste and Supplementary Cementitious Materials in Concrete: Characterisation, Properties and Applications. Wood. Publ. Ser. Civ. Struct. Eng. 2018, 417–460. [Google Scholar] [CrossRef]
  14. Food and Agriculture Organization of the United Nations. Rice Market Monitor; FAO: Rome, Italy, 2018. [Google Scholar]
  15. Knoema. Greece—Rice, Paddy Production Quantity. 2021. Available online: https://knoema.com/atlas/Greece/topics/Agriculture/Crops-Production-Quantity-tonnes/Rice-paddy-production (accessed on 24 December 2022).
  16. Hasnain, H.M.; Javed, U.; Ali, A.; Zafar, M.S. Eco-friendly utilization of rice husk ash and bagasse ash blend as partial sand replacement in self-compacting concrete. Constr. Build. Mater. 2021, 273, 121753. [Google Scholar] [CrossRef]
  17. Shameem Banu, S.; Karthikeyan, J.; Jayabalan, P. Effect of agro-waste on strength and durability properties of concrete. Constr. Build. Mater. 2020, 258, 120322. [Google Scholar] [CrossRef]
  18. Papadakis, V.G. Effect of supplementary cementing materials on concrete resistance against carbonation and chloride ingress. Cem. Concr. Res. 2000, 30, 291–299. [Google Scholar] [CrossRef]
  19. Kartini, K. Rice husk ash—Pozzolanic material for sustainability. Int. J. Appl. Sci. Technol. 2012, 47, 208–213. [Google Scholar]
  20. Badogiannis, E.; Stratoura, M.; Aspiotis, K.; Chatzopoulos, A. Durability of Structural Lightweight Concrete Containing Different Types of Natural or Artificial Lightweight Aggregates. Corros. Mater. Degrad. 2021, 2, 554–567. [Google Scholar] [CrossRef]
  21. U.S. Geological Survey. Mineral Commodity Summaries 2021; USGS: Reston, VA, USA, 2021. [Google Scholar]
  22. Dedeloudis, C. S&B μ-SILICA–An engineered, mineral-based SCM for durable and sustainable concrete. In Proceedings of the 2nd Global CemTrader Conference & Exhibition 2013-Cement Clinker, Supplementary Cementitious Materials (SCMs), Coal & Petcoke and Logistics for the Global Cement Cement Industry, London, UK, 23–24 May 2013. [Google Scholar]
  23. Kotwica, Ł.; Pichór, W.; Kapeluszna, E.; Różycka, A. Utilization of waste expanded perlite as new effective supplementary cementitious material. J. Clean. Prod. 2017, 140, 1344–1352. [Google Scholar] [CrossRef]
  24. Kapeluszna, E.; Kotwica, Ł.; Pichór, W.; Nocuń-Wczelik, W. Cement-based composites with waste expanded perlite—Structure, mechanical properties and durability in chloride and sulphate environments. Sustain. Mater. Technol. 2020, 24, e00160. [Google Scholar] [CrossRef]
  25. Bozadgiev, L. Perlite and trass-containing porcelain bodies. Interceram 1995, 44, 146–149. [Google Scholar]
  26. Zeyad, A.M.; Tayeh, B.A.; Yusuf, M.O. Strength and transport characteristics of volcanic pumice powder based high strength concrete. Constr. Build. Mater. 2019, 216, 314–324. [Google Scholar] [CrossRef]
  27. Madani, H.; Norouzifar, M.N.; Rostami, J. The synergistic effect of pumice and silica fume on the durability and mechanical characteristics of eco-friendly concrete. Constr. Build. Mater. 2018, 174, 356–368. [Google Scholar] [CrossRef]
  28. Stratoura, M.; Iaz, D.R.; Badogiannis, E. Chloride Penetration in Lightweight Aggregate Mortars Incorporating Supplementary Cementing Materials. Adv. Civ. Eng. 2018, 2018, 59167. [Google Scholar] [CrossRef]
  29. Stratoura, M.; Zavras, T.-M.; Badogiannis, E.; Sideris, K.; Papadakis, V.G. Development of durable and structural lightweight concrete. In Proceeding of the 2nd International Conference on Sustainable Materials, Systems and Structures (SMSS 2019), Rovinj, Croatia, 20–22 March 2019; Baričević, A., Jelčić Rukavina, M., Damjanović, D., Guadagnini, M., Eds.; RILEM Publications SAR: Rovinj, Croatia, 2019; pp. 413–420. [Google Scholar]
  30. EN 206-1:2003; Concrete—Part 1: Specification, Performance, Production, and Conformity. European Committee for Standardization: Brussels, Belgium, 2003.
  31. EN 12350:2019; Testing Fresh Concrete—Part 2: Slump Test. European Committee for Standardization: Brussels, Belgium, 2019.
  32. EN 12350:2019; Testing Fresh Concrete—Part 6: Density. European Committee for Standardization: Brussels, Belgium, 2019.
  33. EN 12350:2019; Testing Fresh Concrete—Part 7: Air Content. European Committee for Standardization: Brussels, Belgium, 2019.
  34. EN 12390:2019; Testing Hardened Concrete—Part 3: Compressive Strength of Test Specimens. European Committee for Standardization: Brussels, Belgium, 2019.
  35. ASTM C642-13; Standard Test Method for Density, Absorption, and Voids in Hardened Concrete. American Society for Testing and Materials: West Conchohocken, PA, USA, 2013.
  36. ASTM C1585-20; Standard Test Method for Measurement of Rate of Absorption of Water by Hydraulic Cement Concretes. American Society for Testing and Materials: West Conchohocken, PA, USA, 2020.
  37. NT Build 492-99; Concrete, Mortar and Cement-Based Repair Materials: Chloride Migration Coefficient from Non-Steady-State Migration Experiments. NORDTEST: Oslo, Finland, 1999.
  38. Nilsson, L.-O.; Ngo, M.H.; Gjørv, O.E. High-performance repair materials for concrete structures in the port of Gothenburg. In Proceedings of the 2nd International Conference Concrete under Severe Conditions–Environment and Loading, Tromso, Norway, 21–28 June 1998; Gjørv, O.E., Sakai, K., Banthia, N., Eds.; CONSEC: Tromso, Norway, 1998; pp. 1193–1198. [Google Scholar]
  39. ASTM C1202-19; Standard Test Method for Electrical Indication of Concrete’s Ability to Resist Chloride Ion Penetration. American Society for Testing and Materials: West Conchohocken, PA, USA, 2019.
  40. ASTM C666/C666M-15; Standard Test Method for Resistance of Concrete to Rapid Freezing and Thawing. American Society for Testing and Materials: West Conchohocken, PA, USA, 2015.
  41. Kim, H.K.; Jeon, J.H.; Lee, H.K. Workability, and mechanical, acoustic and thermal properties of lightweight aggregate concrete with a high volume of entrained air. Constr. Build. Mater. 2012, 29, 193–200. [Google Scholar] [CrossRef]
  42. Padhi, R.S.; Patra, R.K.; Mukharjee, B.B.; Dey, T. Influence of incorporation of rice husk ash and coarse recycled concrete aggregates on properties of concrete. Constr. Build. Mater. 2018, 173, 289–297. [Google Scholar] [CrossRef]
  43. Samimi, K.; Kamali-Bernard, S.; Akbar Maghsoudi, A.; Maghsoudi, M.; Siad, H. Influence of pumice and zeolite on compressive strength, transport properties and resistance to chloride penetration of high strength self-compacting concretes. Constr. Build. Mater. 2017, 151, 292–311. [Google Scholar] [CrossRef]
  44. Koushkbaghi, M.; Kazemi, M.J.; Mosavi, H.; Mohseni, E. Acid resistance and durability properties of steel fiber-reinforced concrete incorporating rice husk ash and recycled aggregate. Constr. Build. Mater. 2019, 202, 266–275. [Google Scholar] [CrossRef]
  45. Liu, K.; Yu, R.; Shui, Z.; Li, X.; Guo, C.; Yu, B.; Wu, S. Optimization of autogenous shrinkage and microstructure for Ultra-High-Performance Concrete (UHPC) based on appropriate application of porous pumice. Constr. Build. Mater. 2019, 214, 369–381. [Google Scholar] [CrossRef]
  46. Diniz, H.A.A.; dos Anjos, M.A.S.; Rocha, A.K.A.; Ferreira, R.L.S. Effects of the use of agricultural ashes, metakaolin and hydrated-lime on the behavior of self-compacting concretes. Constr. Build. Mater. 2022, 319, 126087. [Google Scholar] [CrossRef]
  47. Antiohos, S.K.; Papadakis, V.G.; Tsimas, S. Rice husk ash (RHA) effectiveness in cement and concrete as a function of reactive silica and fineness. Cem. Concr. Res. 2014, 61–62, 20–27. [Google Scholar] [CrossRef]
  48. Madani, H.; Bagheri, A.; Parhizkar, T. The pozzolanic reactivity of monodispersed nanosilica hydrosols and their influence on the hydration characteristics of Portland cement. Cem. Concr. Res. 2012, 42, 1563–1570. [Google Scholar] [CrossRef]
  49. Sandhu, R.K.; Siddique, R. Influence of rice husk ash (RHA) on the properties of self-compacting concrete: A review. Constr. Build. Mater. 2017, 153, 751–764. [Google Scholar] [CrossRef]
  50. Öz, H.Ö. Properties of pervious concretes partially incorporating acidic pumice as coarse aggregate. Constr. Build. Mater. 2018, 166, 601–609. [Google Scholar] [CrossRef]
  51. Rashad, A.M. A short manual on natural pumice as a lightweight aggregate. J. Build. Eng. 2019, 25, 100802. [Google Scholar] [CrossRef]
  52. Real, S.; Bogas, J.A.; Pontes, J. Structural lightweight aggregate concrete exposed to marine environment for 5 years. Constr. Build. Mater. 2021, 275, 122161. [Google Scholar] [CrossRef]
  53. Türkmen, I.; Demirboǧa, R.; Gül, R. The effects of different cement dosages, slumps and pumice aggregate ratios on the freezing and thawing of concrete. Comput. Concr. 2006, 3, 163–175. [Google Scholar] [CrossRef]
  54. Chen, T.T.; Wang, W.C.; Wang, H.Y. Mechanical properties and ultrasonic velocity of lightweight aggregate concrete containing mineral powder materials. Const. Build. Mater. 2020, 258, 119550. [Google Scholar] [CrossRef]
  55. Karakoç, M.B.; Demirboa, R.; Türkmen, I. Modeling with ANN and effect of pumice aggregate and air entrainment on the freeze-thaw durabilities of HSC. Constr. Build. Mater. 2011, 25, 4241–4249. [Google Scholar] [CrossRef]
  56. Lencis, U.; Udris, A.; Korjakins, A. Frost influence on the ultrasonic pulse velocity in concrete at early phases of hydration process. Case Stud. Constr. Mater. 2021, 15, e00614. [Google Scholar] [CrossRef]
  57. Tavasoli, S.; Nili, M.; Serpoosh, B. Effect of GGBS on the frost resistance of self-consolidating concrete. Constr. Build. Mater. 2018, 165, 717–722. [Google Scholar] [CrossRef]
  58. Dong, W.; Shen, X.-D.; Xue, H.-J.; He, J.; Liu, Y. Research on the freeze-thaw cyclic test and damage model of Aeolian sand lightweight aggregate concrete. Constr. Build. Mater. 2016, 123, 792–799. [Google Scholar] [CrossRef]
Figure 1. Lightweight aggregates.
Sustainability 15 04217 g001
Figure 2. Grain size distribution of the aggregate blends used in each LWC mixture.
Sustainability 15 04217 g002
Figure 3. Effect of incorporating LWA on the open porosity and sorptivity at the ages of 28, 90 and 180 days, and 28 days, respectively.
Sustainability 15 04217 g003
Figure 4. NT Build 492 chloride migration coefficient of the concrete mixtures at different curing ages.
Sustainability 15 04217 g004
Figure 5. RCPT and RCMT results of the concrete mixtures at 90 days, according to the relative standards and their classification, as established by Nilsson et al. [38] and ASTM C1202 [39].
Sustainability 15 04217 g005
Figure 6. Mass change (%) of concrete specimens during freeze-thaw cycles.
Sustainability 15 04217 g006
Figure 7. Length change (%) of concrete specimens during freeze-thaw cycles.
Sustainability 15 04217 g007
Figure 8. Ultrasonic pulse velocity (Km/s) of concrete specimens during freeze-thaw cycles.
Sustainability 15 04217 g008
Table 1. Chemical analysis (% w/w) of the concrete constituents.
ConstituentSiO2Al2O3Fe2O3CaOMgOSO3K2ONa2OTiO2P2O5L.O.I.
C18.955.223.2762.512.203.630.510.380.340.092.90
Pu68.2111.831.154.090.44-4.002.760.120.037.37
Pe73.8112.971.001.400.25-3.494.49--2.59
R90.610.080.451.220.48-0.840.66--5.66
Table 2. Physical properties of aggregates.
PropertiesAggregates
Pu
(0–8)
Pu
(0–16)
Pe
(0–2)
Pe
(0–4)
R
(0–2)
Ca
(0–4)
Ca
(0–8)
Ca
(0–16)
Density, ρa (t/m3)1.611.132.202.151.792.672.672.61
Water absorption (%)19.217.04.03.413.72.10.90.9
Table 3. Syntheses of the designed concrete mixtures (kg/m3).
Constituent (Kg/m3)Mixtures
REFPeCaPuPuCaPePuRPePu
C400400400400400
Ca (0–4)946----
Ca (0–8)5685551--
Ca (0–16)370----
Pu (0–8) 607397402
Pu (0–16)-492354446402
Pe (0–2)-109-149-
Pe (0–4)-437--101
R----101
PL1.21.21.21.21.2
SP4.83.02.42.43.2
prW2998177158162
Effective water160160160160160
Total water189258337318322
w/c (effective)0.40.40.40.40.4
Table 4. Details on the test parameters.
Properties UnitSample Age (Days)No of Samples (per Age)Size of SpecimenStandard
Slump Testmm---EN 12350-2
Density k g / m 3 ---EN 12350-6
Air Content%---EN 12350-7
Compressive StrengthMPa28 and 903100 × 100 × 100 mmEN 12390-3
Open Porosity%28, 90 and 1802∅100 × 30 mm discs 1 ASTM C642
Sorptivity Coefficient m m / m i n 0.5 282∅100 × 30 mm discs1 ASTM C1585
Chloride migration test m 2 / s 28, 90 and 1802∅100 × 50 mm discs 1 NT Build 492
Chloride ion penetration testCoulomb903∅100 × 50 mm discs 1 ASTM C1202
Freeze and Thaw test->90370 × 70 × 70 mmASTM C666
1 ∅100 × 50 mm or 30 mm discs were cut from the ∅100 × 200 mm cylindrical specimens.
Table 5. Classification of the Chloride ion ingress resistance for RCMT [37] (left) and RCPT [39] (right).
NT Build 492ASTM C1202
Chloride   Migration   Coefficient   ( D n s s m ) × 10 −12 Class DescriptionCharge Passed (C)Class Description
>15L:Low>4000H:High
10–15M:Moderate2000–4000M:Moderate
5–10H:High1000–2000L:Low
2.5–5VH:Very High100–1000VL:Very Low
<2.5EH:Extremely High<100N:Negligible
Table 6. Test results of the optimized concrete mixtures in fresh and hardened state.
MixtureSlump
(mm)
Air Content
(%)
Density
(kg/m3)
Compressive Strength (MPa)
fc,28dstdevfc,90dstdev
Sustainability 15 04217 i001Sustainability 15 04217 i002Sustainability 15 04217 i003Sustainability 15 04217 i004Sustainability 15 04217 i005
REF1103.1237879.10.879.31.9
PeCaPu1704.8168235.31.639.02.3
PuCa2406.2152627.61.533.21.9
PePu2005.3152726.00.232.62.4
RPePu705.6155326.81.630.32.3
Table 7. Degradation indexes (%) after freeze-thaw cycles of concrete mixtures.
Mixturesfc,FTOPFTSFT
Sustainability 15 04217 i006Sustainability 15 04217 i007Sustainability 15 04217 i008
REF−9−1−46
PeCaPu−25245
PuCa−19−915
PePu7−26−8
RPePu−26−8212
Disclaimer/Publisher’s Note: The statements, opinions and data contained in all publications are solely those of the individual author(s) and contributor(s) and not of MDPI and/or the editor(s). MDPI and/or the editor(s) disclaim responsibility for any injury to people or property resulting from any ideas, methods, instructions or products referred to in the content.

