Abstract
The need for freshwater supplies is increasingly rising according to the increase in the inhabitants’ expansion and economic growth. Available water resources are reduced by pollution and overpumping. This research’s prime objective is to study changes in the water quality of the Pleistocene aquifer in Minia Governorate. Historical hydro-chemical data of the groundwater in two years 2009 and 2019 were used to study the changes in the groundwater quality of the Pleistocene aquifer under the impact of the recharge and discharge processes. The Nile River, and the Al-Ibrahimia and Bahr Youssef Canals are considered the main sources of aquifer recharge. Collected data from 53 groundwater wells in the Pleistocene aquifer were used to calculate the sodium adsorption ratio (SAR), sodium percentage (Na%), Kelly index (KI), Soluble Sodium Percentage (SSP), magnesium ratio (MR%), permeability index (PI) and chloro-alkaline index (CAI). These data were used to evaluate and detect the quality and changes in groundwater through the years 2009 and 2019 using spatial mapping in the geographic information system (GIS). The values of SAR, KI and Na% varied between 0.06–1.22, 0.02–0.57 meq/L and 3.7–37.63%, respectively, in the year 2009, but these values changed to 0.4–0.75, 0.16–0.28 meq/L and 15.07–23.44% in the year 2019. The calculated MR and PI values indicate that 100% of the groundwater samples were in the “suitable” category. The calculated SSP reflects no changes in groundwater alkalinity between the years 2009 and 2019. The hydro-chemical analysis of the studied groundwater (G.W.) samples shows high pollution levels caused by Pb and Fe in some parts of the study area. Pb was found to be >40 µg/L in the middle parts, whereas Fe was found with high levels in 27% of the studied groundwater samples. The localities of these samples were affected by pollution from the industrial wastewater from the sugar factory of Abou-Qarqas city (e.g., El-Moheet drain), the fertilizer leaching process and pesticides seeping into groundwater from soils and agricultural wastewater.
1. Introduction
Water quality is one of the critical factors directly concerned with the health of humans and other living beings [1]. It is governed by both natural processes and anthropogenetic effects [2]. For sustainable development, monitoring of water quality is an important means to provide critical data for water management [3] as it is a critical issue in many countries. Groundwater quality in a region is highly dependent on the quality and scope of the industrial, agricultural and other human-related activities [4].
Irrigation water quality is generally defined in terms of total dissolved solids, major anions and cations. However, whether water quality is good or bad is not merely reflected in terms of physical and chemical parameters [5].
Water quality for irrigation is defined by the concentration and type of dissolved solids and salts [6]. Irrigation water quality information holds critical importance for understanding the changes in product quality and the required modifications in water management [7].
Irrigation water quality should be continuously monitored for sustainable development in agricultural areas. Industrialization growth led to the release of hazardous industrial wastewater into the environment. Consequently, ground and surface water sources were affected. Therefore, it is necessary to evaluate water resources’ quality in terms of chemical and biological pollution [8,9,10]. In Egypt, the change in the Nile River’s water quality is the main problem and is a serious and continuous concern due to the expansion of agricultural and industrial activities in addition to the effect of agricultural return, and municipal, industrial and river ships’ wastewaters [11,12]. The continued water deficiency in Egypt and the probability of supplemental deficits in Nile River water, especially after the countries of the Nile Basin began to construct new dams, is directing the efforts of the Egyptian government to find solutions for this problem by identifying additional new water resources [13,14,15,16]. Responding to government endeavors, many huge projects have been launched to fill the gap between the lack of water resources and the rapidly increasing population. The most important of these projects at present is a new project for the reclamation of 1.5 million acres, recently launched by the Egyptian government. Minia Governorate can be considered a part of this huge project. The desert area to the west of Minia is the largest area to be subjected to reclamation during the past ten years depending mainly on groundwater extraction from the groundwater aquifer. In this research, groundwater quality estimation was introduced by using different parameters that define water quality. The Soluble Sodium Percentage (SSP), sodium adsorption ratio (SAR) and some quality indexes were primarily calculated to evaluate groundwater (G.W.) quality for irrigation purposes. Then change detection in the Quaternary aquifer’s water quality through the years 2009 and 2019 in Minia Governorate was calculated using historical hydro-chemical data and GIS spatial mapping.
The evaluation of water quality has a vital rule in the planning, design as well as operation of irrigation systems, especially in arid and semi-arid regions [17,18]. Water quality monitoring methods and degradation through different sources have been widely considered [19]. The monitoring procedure includes activities and programs that check the water resources’ quality and the performance of the system of pollution reduction [20]. As irrigation uses more than two-thirds of the available freshwater resources in the world, agriculture is considered the major consumer of water [21]. For sustainable development in agricultural areas, irrigation water quality should be continuously monitored. Some approaches have been applied for the evaluation of the irrigation water effect on soils and plants. Numerous researchers have used hydro-chemical indices such as SAR, Na%, KI, MR, PI and the Index of Base Change, the chloro-alkaline index (CAI) and the Hydro-chemical Facies Evolution Diagram [22,23,24,25,26,27]. Instead of using a single parameter, for better results, the combined use of the chemical analyses of all ions is expected to be a better solution [28]. Many uses of water quality data cannot be met with an index. An index is useful for purposes of comparative and general questions (what places have poor water quality?) [29,30].
In this research, SAR, KI, Na%, PI, MR and CAI were primarily calculated to evaluate surface water quality for irrigation purposes.
2. Study Area
Minia Governorate is a part of the Middle East and North Africa (MENA) region, one of the world’s most water scarce regions. In the last few years, some countries in this region have faced a crisis of water and there is an expectancy that the water situation will deteriorate from bad to worse [31]. In this regard, Minia Governorate has characteristics similar to most of the governorates in MENA region countries such as Morocco, Algeria, Tunisia, Libya, Mauritania, Sudan, Lebanon, Jordan, Iraq, Syria, Saudi Arabia, Kuwait, Bahrain, Qatar, the United Arab Emirates, Oman and Yemen, which suffer from water shortages [32,33]. Therefore, the methodology adopted in this study can be applied to similar areas in MENA regions. Furthermore, the methodology can be applied to Assiut, Suhag, Qena and other governorates in Egypt. It was chosen to represent several governorates in the MENA region and Egypt on the Nile River main valley and its Delta. The nature of water resources in Minia Governorate is characterized by the diversity of its water resources, including surface, groundwater and recycled agricultural drainage water [34]. Consequently, groundwater quality in the study area is negatively impacted as the aquifer is continuously renewed from the theses sources and mainly from the Nile waters [34,35,36].
Minia Governorate covers about 56,587 km2 and is in central Egypt, north of Upper Egypt, on the western bank of the Nile, Egypt. It extends between latitudes 27°35′32.39″ and 28°46′44.04″ N and longitudes 28°27′51.90″ and 32°34′0.31″ E and its boundaries are as follows: Bani Souef Governorate in the north, Assuit and Al-Wadi Al-Gadid Governorates in the south, Eastern desert in the east and Al-Giza Governorate in the West (Figure 1). The Governorate is divided administratively into nine cities: El-Edwa, Maghagha, Beni-Mazar, Matai, Samalut, El-Minia city, Abou-Qarqas, Mallawi, and Der Mawas, from north to south, respectively, as shown in Figure 1.
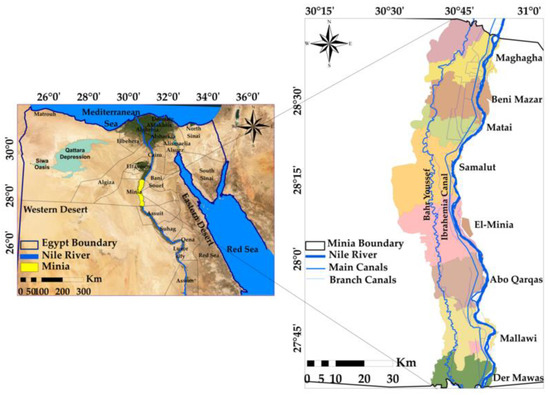
Figure 1.
Location map of the study area.
The study area location is a part of the Minia Governorate. It is located between latitudes 27°35′32.39″ N and 28°45′44.04″ N and longitudes 30°30′51.90″ E and 31°10′0.31″ E (Figure 1). The freshwater canals network in the study area has about 854 canals. Egypt depends by about 97% on Nile River water. The Nile River covers the entire length of the Minia Governorate (approximately 148 km), and the city is on its banks. The Governorate extends on the axis of the Nile River from Km. 612 to Km. 760 north. Assiut Barrages on the Nile are the controlling constructions of the waters of Minia Governorate and the governorates following it that are irrigated from Al-Ibrahimia canal and its branches [36]. The Governorate is fed the surface waters from the Nile River in front of Assiut Barrages through Al-Ibrahimia canal. Al-Ibrahimia canal carries water from the front of Assiut Barrages to Dairoot center in the north, from which Bahr Youssef branches out to feed the governorate from the west.
3. Geological and Hydrogeological Setting
An arid climate characterizes the study area. A maximum monthly mean temperature of 28.7 °C is recorded in July, while a minimum of 11.8 °C is recorded in January. The mean relative humidity in winter and at the end of autumn reaches 68.8%, while it drops to approximately 39.2% during summer [36,37,38]. The maximum evaporation rate is 14.85 mm/month during June, and the minimum reaches 3.54 mm/month through December [36,37]. Hydrogeologically, the Quaternary aquifer is the main aquifer in the area. It is a semi-confined aquifer that is composed of sands and gravel [32,38]. This aquifer lies directly above the Pliocene clay. This clay acts as the impermeable layer of the aquifer (aquiclude) and the fissured Eocene limestone (Figure 2a) [38,39,40,41,42] and the hydrogeological cross-section (A-A) (East–West) in Figure 2a is shown in Figure S1 in the Supplementary Materials.
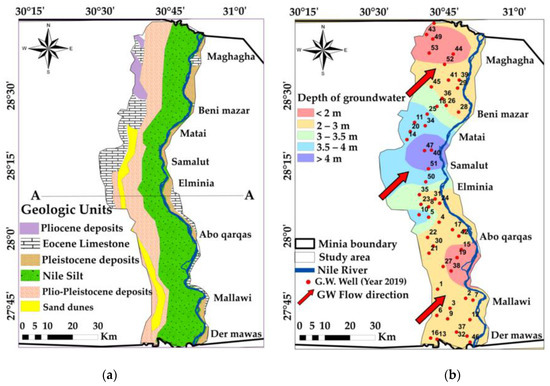
Figure 2.
(a) Geologic units of the study area, modified after Conoco Coral Egypt [42], (b) flow direction and groundwater depth, interpolated based on data available in [36].
It is covered by sedimentary rocks that range in age from the Middle Eocene to Pleistocene; the lithology of the study area formation consists of a thick sequence of Middle Eocene fossiliferous limestone. It has some layers of sandy, chalky and marly intercalation; Pliocene deposits are exposed in the northwestern part. Plio-Pleistocene deposits constitute the earliest types of deposits laid by the Nile and form pre-Nile terraces. Pleistocene deposits are composed of massive cross-bedded fluvial sand with gravel and clay interpolate that acts as the main water-bearing formation in the study area; more about the study area lithology is discussed in [35,38,40]. Generally, this aquifer thickness decreases in the direction of the Eocene plateau and is connected hydraulically “with the underlying aquifer (Eocene) through the faults” [15,43]. The Nile River and irrigation canals are the main sources of recharge to the Quaternary aquifer. The groundwater levels vary between 29.4 m and 43 m in the northern part and southern part of the study area, respectively, while the depth of the groundwater (water table) in the Quaternary aquifer varies between 0.9 m and 8 m [35,36,38]. Figure 2b indicates that the groundwater levels decline from the southwest to the northeast direction and have a variable hydraulic gradient.
Abdel Moneim [44] concluded that the total amount of the Quaternary aquifer abstraction is higher than the leakage from the Nile River and adjacent areas and the recharge water from irrigation. This led to an annual decrease in the groundwater storage in the study area. The ratio between the recharge rate and extraction rate concerning the Quaternary aquifer should be kept constant to sustain the aquifer’s performance. In fact, the hydraulic potentials of the surface water in the irrigation and drainage system affects the levels of the groundwater in the aquifer [44]. The main direction of the groundwater flow in the study area is in the same direction as the Nile water flow, from the southwest to the northeast [35,36,38].
4. Methodology
The locations of the canal network and groundwater well in the study area were spatially digitized in ArcGIS, 10.3 software [27] based on Google earth and Landsat images. We tracked the concentrations of the major cations (Na+, Ca+2, Mg+2, K+), major anions (HCO3−, Cl− and SO4−2) in addition to some of trace elements. The groundwater samples were taken by means of well pumps after a pumping period of at least 1.5 h. Prerinsed polypropylene bottles were filled with the samples, sealed tightly [38,45]. The reviewed parameters’ values in the study area were obtained and spatial thematic maps were constructed for the selected seven criteria by using GIS Kriging interpolation method [10] inside Spatial Analyst Tool [37,38]. The values of the parameters were interpolated from the studies listed in Table 1. in addition to the data collected from unpublished report and studies we get from Egyptian Ministry of Water Resources and Irrigation. These factors are important for determination of groundwater quality [17,18,37,46], the calculated statistics of groundwater quality parameters are shown in Table 2 and their classification according to FAO guidelines for interpretation of water quality for irrigation is shown in Table 3. The geodatabase for these samples was constructed and linked to the digital point data in Shapefile format. SAR, SSP%, KI, Na%, MR% PI and CAI were calculated, these indicators are of high importance in determining water quality for various uses of drinking, irrigation, etc. Therefore, they are considered critical indicators and were calculated to detect and observe pollution in inhabited places that directly impact water pollution [23,24,26,47,48]. Water quality estimation as well as the trace elements was thus introduced by using these different parameters that define water quality to determine and detect the suitability and changes in area’s groundwater quality for irrigation, then the indices were calculated statistically, Table 4 and Table 5. Water quality of the area was categorized in terms of SAR, KI, SSP%, Na%, MR, PI and CAI parameters as well as trace elements on the basis of the standard value intervals given in (Table 6 and Table 7) and previous irrigation water classifications [49,50,51,52,53]. The historical records of the hydro-chemical parameters for the years 2009 and 2019 [53] were used through the present work to detect the changes in water quality (Figure 3). Coordinates of the studied wells are shown in Table S1 in the Supplementary Materials. The overall flowchart of the used methodology is described in Figure 4.

Table 1.
The reviewed research for groundwater quality change detection for years 2009, 2019.
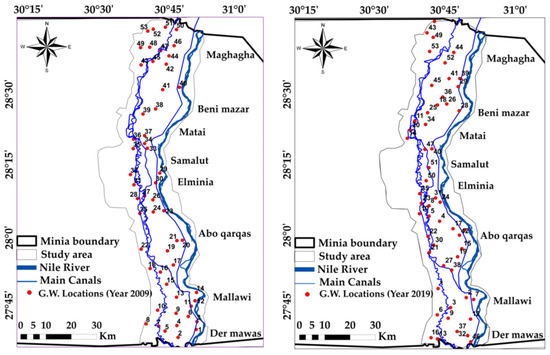
Figure 3.
Groundwater quality locations in years 2009 and 2019.
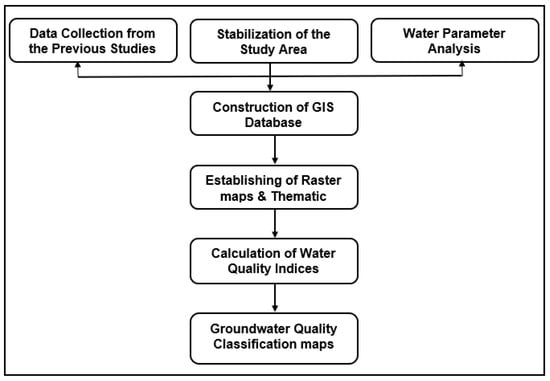
Figure 4.
Flowchart of the used methodology.
5. Results and Discussions
5.1. Groundwater Quality
By tracking the results of previous studies in the study area in the years 2009 and 2019, it was found that there was a change in groundwater quality, major cations (sodium Na+, potassium K+, magnesium Mg2+, calcium Ca2+) and major anions (chlorine Cl−, bicarbonate HCO3−, sulfate SO42−) in groundwater quality. From the calculated indices for groundwater quality in the study area, we found that the concentrations of major cations and major anions were mostly still within the accepted ranges through the studied years 2009 and 2019, which reflects the continuous connection and recharge from the Nile and surface water.
The average potassium in the groundwater in the region was found to be 0.07 meq/L in 2009, which rose in 2019 with an average value of 0.08 meq/L. The activities of agricultural may be the main reason for the increases in the content of potassium in groundwater [54,55]. In 2009, the average value of calcium ion was 1.81 meq/L with a maximum value of 2.8 meq/L that rose to 2.05 meq/L with a maximum value of 3.00 meq/L in 2019; this may be due to the weathering of limestone rocks as they are calcium-bearing rocks [38,56]. The average value of magnesium was 1.35 meq/L in 2009, which rose to the average value of 1.63 meq/L in 2019; excess calcium and magnesium may be produced by silicate weathering or gypsum, magnesium and chloride dissolution [18]. Bicarbonates represent the dominant anion in the study area followed by chloride and sulfates. The highest concentration of sulfates (0.33 meq/L) was observed in 2009 and rose to 0.42 meq/L in 2019. High sulfate content may be due to human activities, the breakdown of the organic substances of weathered soils, and fertilizer and sulfate leaching [57,58]. Sulfate is generally assumed to be the result of the “direct dissolution of gypsum (or anhydrite) or the neutralization of acid waters by limestone or dolomite” [18]. The values of sulfate were still within the desirable limits. Chloride content was within the permissible limits in both years, 2009 and 2019 (<250 mg/L). On the other hand, Ca was found to be the dominant cation in the study area followed by Mg, Na and then K; the table below shows the statistics of water quality parameters and their percent of change during the period from 2009 to 2019 in the study area, Table 2.

Table 2.
Calculated statistics of groundwater quality parameters for the years 2009 and 2019.
Table 2.
Calculated statistics of groundwater quality parameters for the years 2009 and 2019.
| Parameter | Year 2009 | Year 2019 | ||||||||||||
|---|---|---|---|---|---|---|---|---|---|---|---|---|---|---|
| Units in meq/L | Units in meq/L | |||||||||||||
| Na | K | Ca | Mg | Cl | HCO3 | SO4 | Na | K | Ca | Mg | Cl | HCO3 | SO4 | |
| Maximum (MAX) | 1.74 | 0.11 | 2.80 | 2.08 | 1.13 | 5.41 | 0.33 | 1.13 | 0.15 | 3.00 | 2.08 | 1.27 | 5.25 | 0.42 |
| Minimum | 0.78 | 0.04 | 1.00 | 0.17 | 0.39 | 1.78 | 0.04 | 0.43 | 0.06 | 1.35 | 1.00 | 0.45 | 2.62 | 0.00 |
| Average | 1.18 | 0.07 | 1.81 | 1.35 | 0.71 | 3.63 | 0.18 | 0.85 | 0.08 | 2.05 | 1.63 | 0.81 | 4.02 | 0.2 |
| Standard deviation | 0.25 | 0.02 | 0.48 | 0.49 | 0.21 | 0.95 | 0.06 | 0.13 | 0.02 | 0.34 | 0.27 | 0.15 | 0.53 | 0.07 |
| % of change in water quality parameters during the period from 2009 to 2019 | ||||||||||||||
| Parameter | Na | K | Ca | Mg | Cl | HCO3 | SO4 | |||||||
| % of change | −27.97% | 14.28% | 13.26% | 20.74% | 14.08% | 10.74% | 11.11% | |||||||
5.1.1. Total Dissolved Solids (TDS)
TDS is one of the vital water quality determination factors, for the purposes of both drinking and irrigation, in most irrigation situations. Salinity level is the primary water quality factor, where salts affect both the yield of crop and the soil structure [59,60]. In this study, maximum salinity values varied between 750 mg/L in 2009 and decreased to 580 mg/L in 2019, reflecting the recharging from surface water. The concentration of TDS is more than the desirable limit of 500 mg/L [61,62] in northwest and south groundwater samples. Abou Heleika et al. [39] and Ibrahem [63] concluded that TDS concentration ranged from 355.3 to 908.8 mg/L in 2018, which agrees to a large extent with the present TDS values. The spatial distribution map of TDS classifies the study area into five classes, and there is a change in the TDS range in the whole of the study area, Figure 5a.
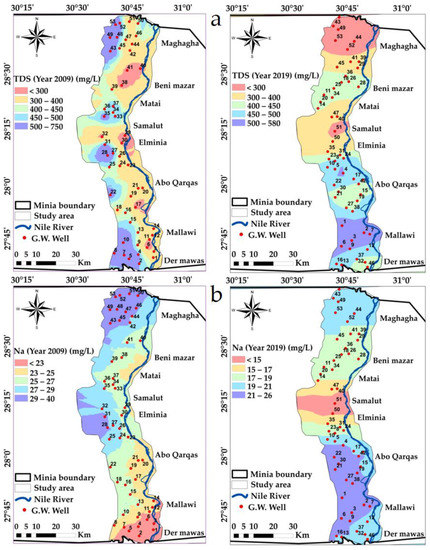
Figure 5.
Spatial distribution maps in years 2009 and 2019: (a) TDS, (b) Na variations in the study area.
5.1.2. Major Ions
Sodium concentration values were around 18 and 40 mg/L during the year 2009 (≈0.78 meqL−1 and 0.60 meqL−1, , where the largest concentration was 1.13 meqL−1 during year 2019. The spatial distribution map of Na classifies the study area into five classes from <15 and >31 mg/L, and there is a change in the Na range in the whole of the study area, Figure 5b.
Calcium (Ca) concentration values varied between 20 and 56 mg/L through 2009, where during 2019, the concentrations rose to vary between 27 and 60 mg/L. The loss of soil calcium might be due to the strategy of fertilization and gypsum application, which increases the concentration of calcium in the well’s water [64]. The spatial distribution map of Ca classifies the study area into five classes from <30 and >45 mg/L, and there is a change in the Ca range in the middle and southern parts of the study area Figure 6a.
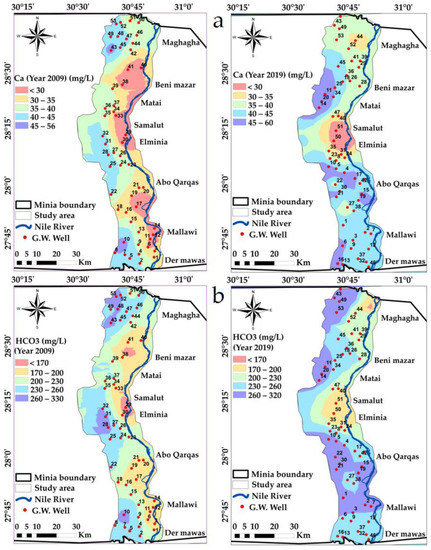
Figure 6.
Spatial distribution maps in years 2009 and 2019: (a) Ca, (b) HCO3 variations in the study area.
Bicarbonate ions’ concentration ranged between 1.87 and 5.41 meqL−1 in 2009 and changed to range between 2.62 and 5.25 meqL−1 in 2019. These values indicate that there is an increasing problem. However, the bicarbonate values of water show their ability to precipitate Ca2+ in the soil. The HCO3 concentrations in groundwater are mainly sourced from the dissolution of carbonic acid in the aquifers and carbonate weathering [37,65]. The spatial distribution map of HCO3 classifies the study area into five classes from <170 and >260 mg/L, and there is a change in the HCO3 range in the north and south parts of the study area, Figure 6b.
Magnesium ions’ concentration ranged from 0.17 to 2.08 meqL−1 in groundwater samples collected during 2009 and rose to range between 1.00 and 2.08 meqL−1 in 2019. The spatial distribution map of Mg classifies the study area into five classes from <12 and >21 ppm, and there is a change in the Mg range in the middle and southern parts of the study area, Figure 7a.
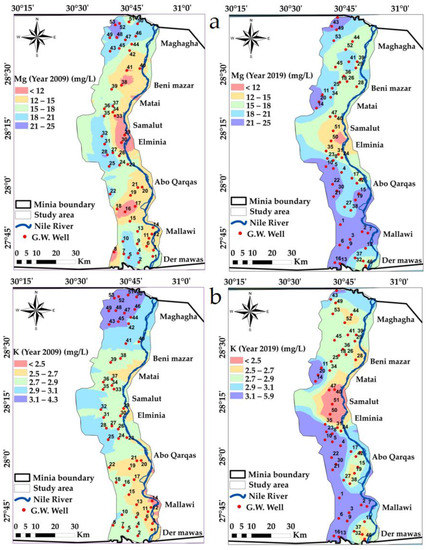
Figure 7.
Spatial distribution maps in the years 2009 and 2019: (a) Mg, (b) K variations in the study area.
Potassium concentration recorded maximum values of 0.11 meqL−1 in 2009 and these rose to 0.15 meqL−1 in 2019. Potassium may be subject to fixation by clay colloids in clayey soils and losses by the leaching of soils. The spatial distribution map of Ca classifies the study area into five classes from <2.5 and >3.1 ppm, and there is a change in the K range in the whole of the study area, Figure 7b.
Sulfate concentration had a maximum value of 0.33 meqL−1 in 2009 which rose to an average maximum of 0.42 meqL−1 in 2019. The SO42− concentrations in the current groundwater are presented in Table 2. The spatial distribution map of SO42− classifies the study area into five classes from <7 and >12 ppm, Figure 8a. According to Table 2, Ca+2 > SO4−2, indicating a calcite/dolomite source [18,66].
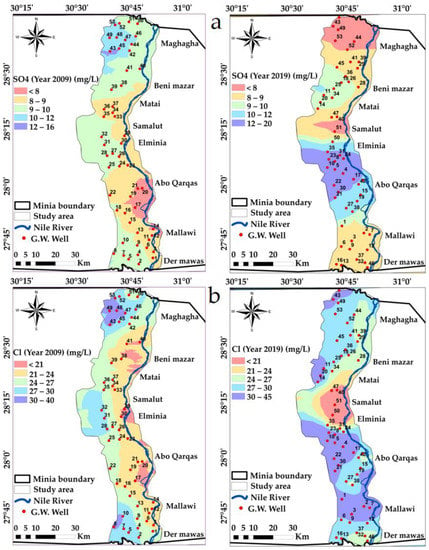
Figure 8.
Spatial distribution maps in the years 2009 and 2019: (a) SO4, (b) Cl variations in the study area.
Chloride concentration had a maximum value of 40 mg/L in 2009 which rose to a maximum of 45 mg/L in 2019. According to the water classification of [61,67], the chloride content in the current groundwater indicates the “No problem” class, which has values less than 4 as presented in Table 3. The spatial distribution map of Cl classifies the study area into five classes from <21 and >30 mg/L, Figure 8b.

Table 3.
The FAO guidelines for interpretation of water quality for irrigation according to [61].
Table 3.
The FAO guidelines for interpretation of water quality for irrigation according to [61].
| Irrigation Problems | Degree of Problem | ||
|---|---|---|---|
| No Problem | Increasing Problem | Severe Problem | |
| Specific ion toxicity (affects sensitive crops): | |||
| Chloride (meq/L) | <4 | 4–10 | >10 |
| Miscellaneous effects (affects susceptible crops): | |||
| HCO3 (meq/L) (overhead sprinkling) | <1.5 | 1.5–8.5 | <8.5 |
5.2. Sodicity Hazard (Sodium Percentage, Na%)
Sodium concentration is an important parameter used for the classification of irrigation water quality [68]. The level presence of sodium in water is important as it influences the minerals of clay and erosion and drainage problems as well as the potential for distributing structural stability. Water sodicity is usually described in terms of the relative proportion of sodium cation compared with the divalent cations (i.e., magnesium and calcium).
The amount of sodium in irrigation water is generally defined as Na%. Sodium concentration in water induces the exchange of Ca2+ and Mg2+ ions. In turn, this exchange process reduces permeability in soil, which causes poor internal drainage [69]. Consequently, sodium is regarded as an important ion, for its reactivity with soil, its classification of irrigation water and because it reduces permeability [70,71]. Na% is used to determine the quality of water for agricultural purposes. Irrigation water with high Na% causes growth retardation in plants [72]. The author of [73] proposed a classification based on sodium percentage, Na%, via the calculation of the relative proportion of all cations available in water (Equation (1)) [71].
where Na, K, Ca, and Mg are sodium, potassium, calcium and magnesium concentrations, respectively (all ionic concentrations expressed in meq/L). From [71], the calculations of Na% showed that their values varied between 3.7 and 37.63 meq/L during the year 2009, whereas they varied between 15.07 and 23.44 meq/L in the year 2019, Table 5 and Table 6, and Figure 9a. As indicated by the calculated Na% values in 2009, 96.23% of the samples received were in the “good” category, and 3.77% were in the “excellent” category, Table 6. On the other hand, through 2019, the calculated Na% values showed 37.7% of the samples were in the “excellent” category, and 62.3% of the samples were in the “good” category. Abou Heleika et al. [39] also came to a conclusion that approximated these values during 2018, where Na% ranged between 20 and 40, similar to our values.
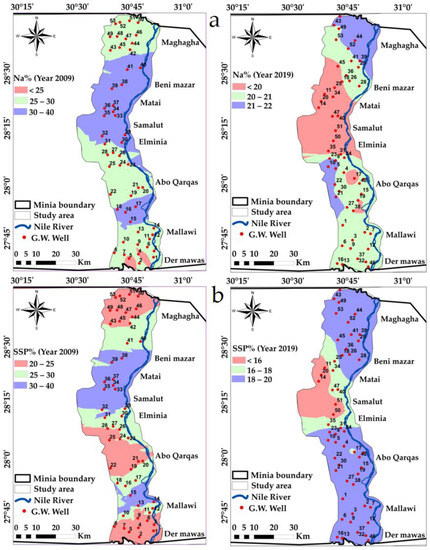
Figure 9.
Spatial distribution maps in the years 2009 and 2019: (a) Na%, (b) SSP% variations in the study area.
5.3. Soluble Sodium Percentage (SSP)
Sodium percent is a vital factor for studying sodium hazards. It is also used for judging the quality of water for purposes of agriculture. A high sodium percentage in water that is used for irrigation purposes might reduce the permeability of soil and affect the growth of plants. Todd and Mays [72] suggested a formula for calculating the Soluble Sodium Percentage (SSP) for groundwater and that is [74]:
where Na is the sodium and cations is the (Na+, Ca+2, Mg+2, K+) concentrations (all ionic concentrations expressed in meq/L). The calculated Soluble Sodium Percentage values of groundwater in the study area varied between 20.99% and 36.99% during the year 2009, whereas they varied between 13.52% and 19.97% during the year 2019, indicating that 100% of the groundwater in the two years was in the category “suitable”, Figure 9b and Table 5.
5.4. Sodium Adsorption Ratio (SAR)
This parameter was first proposed by [74,75,76], and it is used to evaluate the Na ions’ tendency for adsorption on soil, and the dissolved cation levels’ tendency to enter into cation exchange regions in soil. High sodium concentrations affect the permeability of the soil and directly affect the total salinity of water [77]. Such concentrations can have toxic effects on delicate products [78]. The detection of salinity hazards depends on electrical conductivity measurements. The concept of SAR is used to detect a probable sodium hazard [79,80]. SAR is calculated by using Equation (3) [76], and Figure 10a shows the variations in its values in the study area.
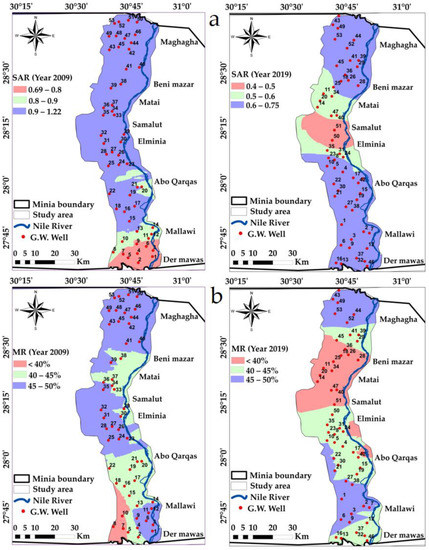
Figure 10.
Spatial distribution maps in the years 2009 and 2019: (a) SAR, (b) MR% variations in the study area.
If there is a high sodium (Na+) content in irrigation water, it can displace exchangeable Ca2+ and Mg2+ from the clay minerals of the soil, followed by the replacement of these cations by sodium. Sodium-saturated soil peptizes and misses their permeability, thus decreasing their fertility and suitability for cultivation [81,82], a situation that eventually damages the structure of soil, and leads to permeability, which ultimately affects the fertility status of the soil and crop yields are reduced [83].
Some methods have been proposed to express sodium hazard. SAR is the parameter that has come into wide use for the prediction of sodium hazard. It was proposed by [79], which classified irrigation water on the basis of SAR values into four classes (S1 < 10, S2 ranges between 10–18, S3 ranges between 18–26, S4 > 26). The SAR of water is calculated as follows [75,77]:
The sodium adsorption ratio of groundwater in this study was almost less than 10 and fell under the category of S1 indicating low alkali hazards according to [79]. Additionally, Sallam et al. [84] concluded that the same study area is in a low SAR hazard category.
According to [80]’s classification based on SAR values (Table 5), all calculated values of SAR in the study area were found to be in the category “Excellent” for irrigation during both years 2009 and 2019, and hence no alkali hazard is estimated for crops. The statistics of the calculated SAR are shown in the table below, Table 4, and Figure 10a.

Table 4.
Statistics of calculated indices for groundwater quality and their percent of change during the period from the year 2009 to the year 2019.
Table 4.
Statistics of calculated indices for groundwater quality and their percent of change during the period from the year 2009 to the year 2019.
| Parameter | Year 2009 | Year 2019 | ||||||||||
|---|---|---|---|---|---|---|---|---|---|---|---|---|
| Calculated Indices | Calculated Indices | |||||||||||
| SSP | SAR | KI | Na% | PI | MR | SSP | SAR | KI | Na% | PI | MR | |
| Maximum | 36.99 | 1.22 | 0.60 | 38.74 | 95.04 | 48.94 | 19.97 | 0.75 | 0.26 | 22.04 | 73.95 | 50.00 |
| Minimum | 20.99 | 0.69 | 0.27 | 22.35 | 61.22 | 6.62 | 13.52 | 0.40 | 0.16 | 15.07 | 53.00 | 36.84 |
| Average | 27.34 | 0.95 | 0.39 | 29.02 | 72.93 | 41.99 | 18.38 | 0.62 | 0.23 | 20.09 | 63.46 | 44.22 |
| Standard deviation | 3.51 | 0.11 | 0.07 | 3.70 | 9.47 | 6.58 | 1.46 | 0.07 | 0.02 | 1.52 | 4.60 | 3.35 |
| % of change in water quality indicators during the period from 2009 to 2019 | ||||||||||||
| Indicator | SSP | SAR | KI | Na% | PI | MR | ||||||
| % of change | −32.77% | −34.74% | −41.025% | −30.77% | −12.98% | 5.31% | ||||||
SSP and KI in meq/L; Na%, SAR and MR are ratio; and PI is unitless.
5.5. Magnesium Ratio (MR)
If the MR ratio is larger than 50%, water can be classified as suitable for the purpose of irrigation, based on the magnesium ratio [83]. It is expressed as the following:
In general, in most waters, Mg and Ca are present in equilibrium. The soil quality is affected adversely when the magnesium content is high in water, resulting in the soil’s alkaline nature and thus reducing crop yield [29,83]. Based on MR calculations, all the groundwater samples during both years were suitable, Table 6 and Figure 10b.
5.6. Kelly Index (KI)
Na, Mg and Ca concentrations in the water represent alkali hazards [83]. For calculation of the KI parameter, Na concentration is measured against Ca and Mg, and in most waters, Ca and Mg preserve their equilibrium state. KI is calculated using Equation (5) [85,86].
In 2009, the calculated KI values varied between 0.02 and 0.87 meq/L, and varied between 0.16 and 0.28 in 2019, Table 3. According to the calculated KI values, all samples were in the “suitable” class indicating no detected changes, Figure 11a and Table 6.
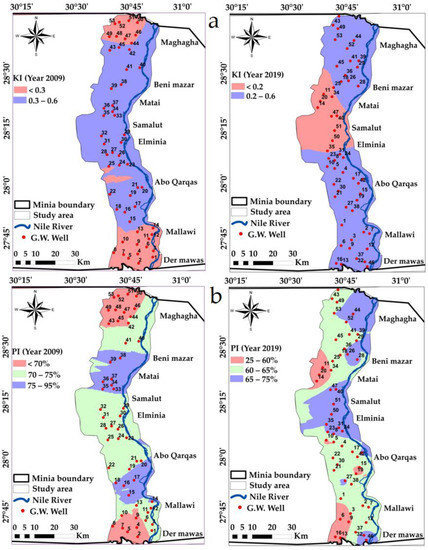
Figure 11.
Spatial distribution maps in the years 2009 and 2019: (a) KI, (b) PI variations in the study area.
5.7. Permeability Index (PI)
This index was developed by [82] to determine the suitability of water for irrigation and categorizes waters as Class 1 (PI > 75%), Class 2 (25% < PI < 75%) and Class 3 (PI < 25%). Class 1 and Class 2 waters are categorized as “good” and “suitable” with their higher maximum permeability [86]. The permeability of soil is affected by the amount of Na, Mg, Ca and HCO3 ions in soil. PI is calculated using Equation (6) [86]
5.8. Index of Base Exchange
During its travel to the subsurface, groundwater undergoes changes in the chemical composition, and ion exchange is one of the essential processes used to evaluate these changes [85,87]. Ion exchange that occurs between the groundwater and its host environment is indicated by the chloro-alkaline index, CAI, which was suggested by [88,89]. The ion exchange index is estimated by the following equation (Equation (7)):
When the index is positive, it means there is ion exchange of K+ and Na+ from the water with calcium and magnesium in the rock in this case; the exchange is known as “direct exchange”. If the index is found to be negative, it means a reverse exchange, and then the exchange is known as “indirect exchange”. The CAI was calculated for the two years and revealed that 100% of the calculated index indicated a negative ratio, and, consequently, the dominance of the reverse ion exchange, “indirect exchange”, as shown in Table 5.

Table 5.
Calculated indices for groundwater samples during the years 2009 and 2019.
Table 5.
Calculated indices for groundwater samples during the years 2009 and 2019.
| S. No. | Year 2009 | Year 2019 | ||||||||||||
|---|---|---|---|---|---|---|---|---|---|---|---|---|---|---|
| Calculated Indices | Calculated Indices | |||||||||||||
| SSP | SAR | KI | Na% | PI | MR | CAI | SSP | SAR | KI | Na% | PI | MR | CAI | |
| 1 | 25.20 | 0.85 | 0.34 | 26.75 | 69.68 | 43.96 | −0.64 | 19.40 | 0.70 | 0.25 | 21.09 | 61.26 | 47.13 | −0.21 |
| 2 | 24.03 | 0.84 | 0.32 | 25.56 | 67.43 | 42.08 | −0.58 | 18.91 | 0.67 | 0.24 | 20.58 | 61.30 | 47.72 | −0.16 |
| 3 | 22.27 | 0.71 | 0.29 | 23.59 | 68.62 | 44.69 | −0.26 | 19.03 | 0.68 | 0.24 | 20.76 | 61.16 | 46.03 | −0.09 |
| 4 | 23.65 | 0.91 | 0.32 | 25.05 | 63.46 | 44.35 | −0.58 | 17.84 | 0.62 | 0.22 | 19.63 | 61.30 | 42.55 | 0.15 |
| 5 | 22.54 | 0.06 | 0.02 | 3.70 | 50.70 | 45.45 | −0.54 | 19.25 | 0.70 | 0.24 | 21.42 | 59.50 | 44.90 | 0.06 |
| 6 | 36.99 | 0.41 | 0.22 | 19.74 | 82.39 | 41.67 | −1.38 | 18.38 | 0.68 | 0.23 | 20.03 | 57.28 | 45.98 | −0.33 |
| 7 | 23.19 | 0.65 | 0.25 | 20.95 | 63.47 | 44.81 | −0.58 | 18.72 | 0.66 | 0.24 | 20.40 | 62.49 | 47.21 | −0.10 |
| 8 | 33.42 | 1.16 | 0.52 | 35.52 | 87.43 | 6.62 | −0.41 | 19.43 | 0.66 | 0.25 | 21.43 | 65.52 | 47.39 | 0.00 |
| 9 | 28.89 | 1.04 | 0.42 | 30.60 | 73.34 | 42.55 | −0.96 | 18.33 | 0.65 | 0.23 | 20.03 | 60.32 | 46.03 | −0.26 |
| 10 | 24.55 | 1.01 | 0.33 | 26.33 | 61.90 | 41.97 | −0.61 | 19.27 | 0.75 | 0.25 | 21.85 | 58.60 | 45.45 | −0.01 |
| 11 | 25.21 | 0.75 | 0.34 | 26.77 | 77.66 | 41.67 | −0.83 | 15.04 | 0.55 | 0.18 | 16.58 | 56.27 | 40.00 | −0.04 |
| 12 | 28.49 | 1.00 | 0.41 | 30.17 | 72.41 | 44.69 | −0.91 | 18.57 | 0.65 | 0.23 | 19.98 | 60.94 | 46.61 | −0.25 |
| 13 | 27.57 | 1.01 | 0.39 | 29.19 | 70.28 | 44.78 | −0.75 | 19.03 | 0.69 | 0.24 | 20.69 | 58.38 | 46.00 | −0.43 |
| 14 | 29.83 | 0.85 | 0.43 | 31.40 | 85.28 | 39.47 | −0.93 | 13.52 | 0.50 | 0.16 | 15.07 | 53.92 | 38.98 | 0.09 |
| 15 | 25.40 | 0.88 | 0.35 | 26.61 | 69.29 | 43.37 | −0.62 | 19.11 | 0.71 | 0.24 | 20.33 | 58.93 | 45.98 | −0.41 |
| 16 | 32.76 | 1.14 | 0.50 | 34.69 | 84.21 | 19.23 | −0.75 | 19.00 | 0.71 | 0.24 | 20.78 | 57.26 | 45.98 | −0.45 |
| 17 | 30.03 | 0.88 | 0.44 | 32.07 | 85.39 | 46.61 | −1.20 | 17.01 | 0.60 | 0.21 | 18.47 | 59.04 | 40.00 | −0.05 |
| 18 | 30.14 | 0.90 | 0.45 | 32.34 | 83.91 | 48.78 | −0.93 | 18.16 | 0.61 | 0.23 | 19.74 | 62.58 | 41.10 | −0.14 |
| 19 | 28.64 | 0.93 | 0.41 | 30.47 | 77.07 | 42.76 | −0.79 | 18.37 | 0.66 | 0.23 | 19.65 | 59.54 | 43.82 | −0.21 |
| 20 | 28.50 | 0.90 | 0.41 | 30.18 | 79.46 | 40.82 | −1.09 | 14.17 | 0.53 | 0.17 | 15.67 | 53.00 | 38.98 | −0.01 |
| 21 | 27.08 | 0.89 | 0.38 | 29.07 | 74.48 | 39.63 | −0.81 | 19.97 | 0.73 | 0.26 | 21.84 | 63.61 | 44.90 | −0.19 |
| 22 | 22.20 | 0.84 | 0.29 | 23.70 | 61.86 | 43.82 | −0.40 | 19.92 | 0.67 | 0.25 | 21.74 | 67.52 | 48.78 | −0.30 |
| 23 | 20.99 | 0.69 | 0.27 | 22.35 | 67.22 | 44.04 | −0.64 | 19.56 | 0.66 | 0.25 | 22.04 | 67.66 | 48.08 | −0.02 |
| 24 | 25.84 | 0.95 | 0.36 | 27.26 | 67.01 | 42.25 | −1.05 | 19.42 | 0.60 | 0.25 | 21.17 | 69.39 | 41.67 | −0.02 |
| 25 | 25.31 | 0.95 | 0.35 | 26.90 | 66.67 | 44.25 | −0.97 | 17.78 | 0.60 | 0.22 | 19.27 | 62.29 | 40.00 | −0.14 |
| 26 | 26.43 | 0.95 | 0.37 | 27.99 | 70.23 | 42.71 | −0.83 | 19.68 | 0.64 | 0.25 | 21.39 | 67.08 | 45.45 | −0.18 |
| 27 | 25.84 | 0.96 | 0.36 | 27.36 | 67.45 | 45.45 | −0.75 | 19.92 | 0.67 | 0.25 | 21.74 | 67.52 | 48.78 | −0.30 |
| 28 | 25.71 | 0.99 | 0.35 | 27.32 | 66.37 | 46.61 | −0.64 | 19.24 | 0.63 | 0.24 | 20.80 | 65.49 | 44.12 | −0.22 |
| 29 | 34.72 | 0.98 | 0.55 | 36.77 | 91.18 | 36.84 | −1.34 | 19.23 | 0.63 | 0.24 | 20.84 | 64.99 | 44.12 | −0.18 |
| 30 | 35.44 | 1.04 | 0.57 | 37.63 | 95.04 | 34.65 | −1.40 | 17.41 | 0.64 | 0.22 | 19.32 | 58.89 | 46.99 | −0.26 |
| 31 | 29.35 | 1.22 | 0.43 | 31.08 | 68.40 | 44.90 | −1.18 | 17.78 | 0.52 | 0.22 | 19.66 | 72.03 | 45.45 | 0.00 |
| 32 | 23.28 | 0.90 | 0.31 | 24.74 | 62.01 | 45.45 | −0.41 | 18.86 | 0.61 | 0.24 | 20.47 | 67.75 | 37.88 | −0.16 |
| 33 | 31.24 | 0.88 | 0.47 | 33.18 | 88.81 | 37.74 | −1.22 | 19.07 | 0.61 | 0.24 | 20.82 | 66.50 | 38.46 | −0.17 |
| 34 | 30.80 | 0.89 | 0.46 | 32.71 | 85.71 | 39.47 | −1.05 | 17.77 | 0.60 | 0.22 | 19.32 | 62.29 | 40.00 | −0.23 |
| 35 | 24.45 | 0.96 | 0.33 | 25.89 | 63.35 | 45.45 | −0.45 | 16.61 | 0.53 | 0.20 | 18.44 | 63.10 | 41.46 | 0.02 |
| 36 | 23.29 | 0.77 | 0.31 | 24.92 | 69.17 | 43.24 | −0.58 | 18.81 | 0.62 | 0.24 | 20.32 | 64.47 | 42.86 | −0.13 |
| 37 | 26.84 | 1.11 | 0.38 | 28.51 | 64.25 | 45.45 | −0.68 | 18.10 | 0.61 | 0.23 | 19.67 | 62.99 | 45.45 | −0.18 |
| 38 | 31.90 | 0.92 | 0.48 | 33.97 | 87.89 | 41.67 | −1.05 | 17.49 | 0.57 | 0.22 | 19.13 | 63.48 | 41.46 | −0.10 |
| 39 | 27.25 | 1.00 | 0.38 | 28.97 | 70.24 | 44.12 | −0.89 | 19.22 | 0.63 | 0.24 | 20.89 | 64.28 | 44.12 | −0.27 |
| 40 | 29.89 | 0.87 | 0.44 | 31.83 | 85.45 | 42.02 | −1.19 | 17.26 | 0.53 | 0.21 | 18.82 | 66.23 | 46.20 | −0.26 |
| 41 | 31.25 | 0.97 | 0.47 | 33.33 | 82.13 | 39.06 | −1.52 | 19.23 | 0.63 | 0.24 | 20.84 | 64.99 | 44.12 | −0.14 |
| 42 | 28.25 | 1.03 | 0.40 | 29.97 | 71.82 | 41.24 | −0.89 | 19.15 | 0.63 | 0.24 | 20.81 | 66.22 | 41.46 | −0.23 |
| 43 | 25.86 | 1.11 | 0.36 | 27.39 | 61.38 | 42.66 | −0.63 | 19.70 | 0.69 | 0.25 | 21.39 | 63.71 | 50.22 | −0.12 |
| 44 | 25.89 | 0.88 | 0.36 | 27.35 | 70.91 | 40.98 | −0.77 | 19.86 | 0.68 | 0.28 | 23.44 | 72.23 | 48.57 | −0.06 |
| 45 | 27.60 | 0.99 | 0.39 | 29.23 | 70.79 | 41.24 | −0.69 | 17.97 | 0.61 | 0.22 | 19.53 | 62.08 | 40.54 | −0.10 |
| 46 | 25.56 | 0.96 | 0.35 | 27.17 | 66.30 | 44.84 | −0.64 | 19.50 | 0.62 | 0.25 | 21.10 | 68.98 | 36.84 | −0.25 |
| 47 | 25.21 | 0.98 | 0.34 | 26.93 | 64.00 | 45.45 | −0.47 | 18.05 | 0.54 | 0.22 | 19.75 | 69.33 | 43.10 | −0.27 |
| 48 | 24.73 | 1.00 | 0.34 | 26.40 | 62.24 | 45.45 | −0.47 | 19.91 | 0.70 | 0.25 | 21.61 | 63.11 | 50.88 | −0.15 |
| 49 | 25.89 | 0.88 | 0.36 | 27.35 | 70.91 | 40.98 | −0.77 | 18.63 | 0.64 | 0.23 | 20.01 | 61.08 | 49.11 | −0.18 |
| 50 | 26.97 | 1.06 | 0.38 | 28.56 | 64.62 | 48.94 | −1.06 | 15.30 | 0.40 | 0.19 | 17.29 | 73.95 | 42.55 | −0.03 |
| 51 | 29.16 | 0.81 | 0.42 | 31.07 | 87.48 | 40.54 | −1.11 | 15.29 | 0.40 | 0.19 | 17.36 | 73.77 | 42.55 | −0.10 |
| 52 | 27.27 | 1.08 | 0.38 | 28.92 | 67.32 | 48.32 | −1.05 | 18.87 | 0.63 | 0.24 | 20.45 | 63.04 | 45.45 | −0.14 |
| 53 | 26.07 | 1.09 | 0.36 | 27.69 | 62.77 | 45.45 | −0.68 | 19.22 | 0.63 | 0.24 | 20.89 | 65.49 | 44.12 | −0.10 |
SSP and KI in meq/L; Na%, SAR and MR are ratio; and CAI and PI are unitless.

Table 6.
Classification of groundwater of the study area for irrigation purposes.
Table 6.
Classification of groundwater of the study area for irrigation purposes.
| Parameters | Value Range | Water Classification | Number of Samples | |
| Year 2009 | Year 2019 | |||
| Alkalinity hazard SAR [78] | <10 | Excellent | 53 | 53 |
| 10–18 | Good | 0 | 0 | |
| 18–26 | Doubtful | 0 | 0 | |
| >26 | Unsuitable | 0 | 0 | |
| Kelly index KI [86] | <1 | suitable | 53 | 53 |
| >1 | Unsuitable | 0 | 0 | |
| Sodium percentage Na% [48] | <20 | Excellent | 2 | 20 |
| 20–40 | Good | 51 | 33 | |
| 40–60 | Permissible | 0 | 0 | |
| 60–80 | Doubtful | 0 | 0 | |
| >80 | Unsuitable | 0 | 0 | |
| Permeability index PI [89] | >5% | Good | 14 | 0 |
| 25–75% | Suitable | 39 | 53 | |
| <25% | Unsuitable | 0 | 0 | |
| Soluble Sodium Percent SSP [74] | <50% | Suitable | 53 | 53 |
| >50% | Unsuitable | 0 | 0 | |
| Magnesium ratio (MR) [83] | <50% | Suitable | 53 | 53 |
| >50% | Unsuitable | 0 | 0 | |
SSP and KI in meq/L; Na%, SAR and MR are ratio; and PI is unitless.
5.9. Heavy Metals
An additional very important indicator for water quality evaluation is the monitoring of heavy metals concentration. In this study, we reviewed twelve kinds of heavy metals in the groundwater in the study area, as they have harmful effects on human health if there are extra concentrations in irrigation from such water. For example, when receiving cadmium (Cd) and lead (Pb) amounts from the organism, most of them concentrate on liver and kidneys, in a low discharge. It has been evidenced that both elements may remain in the body for several years. Cd is cancer-causing if a high content of it is in the organism. The concentrations of these harmful substances in groundwater are affecting both human health and the quality of the environment. Moreover, if aluminum (Al) precipitates in the aquifer in a crystalline form (gibbsite), a problem can quickly occur when the drinking water’s acidity is increased, especially from acid rain. In this case, aluminum may penetrate the sources of drinking water and cause contamination [45].
The contamination from metallurgic industries related to heavy metals production such as cadmium, chrome, manganese and iron is a major problem because of their ability to accumulate in living tissues.
“Iron is the second most abundant metal in the earth’s crust [86]. Maximum and minimum values of iron” and other heavy metals in the study area are presented in Table 7. About 27% of the studied groundwater samples have values of iron concentration above 0.3 mg/L. It was found that the average value of arsenic concentration was 19.42 µg/L. The observed levels of arsenic in the study area may be according to its evaporative environment as the climate of this region is arid, which can lead to more water evaporation loss than its gain by rainfall [82]. The arsenic pollutant is also strongly related with high iron concentrations, phosphate, “ammonium ions, and anthropogenic activities such as excessive groundwater withdrawal for agricultural irrigation” [86]. Extreme use of arsenical pesticides on crops may be a basis for arsenic pollutants due to the fertilizer leaching process and pesticides seeping into groundwater from soils. The main source of metal pollutants in water is the use of pesticides in the form of lead arsenate, calcium arsenate, arsenic acid and sodium arsenate [86].
Generally, groundwater was considered within the limits recommended for “Lead” Pb (<0.01 mg/L) and mercury, but nickel had a maximum value of 0.095, and this value is outside of the desirable limit (<0.07). Aluminum values ranged between 12 and 460 µg/L, selenium values ranged between 2 and 98 µg/L, silicon dioxide had a maximum value of 7 mg/L with an average of 3.6 mg/L, whereas phosphate ion values ranged between 0 and 70 µg/L, Table 7.

Table 7.
Statistics of heavy metal values for groundwater in the study area.
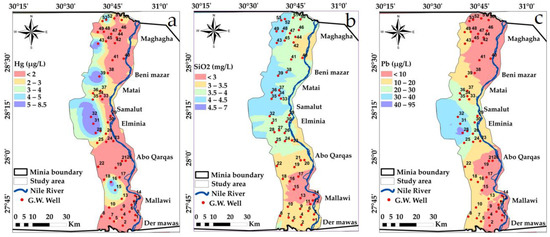
Figure 15.
Spatial distribution maps: (a) Hg (b) SiO2 (c) Pb variations in the study area in year, 2009.
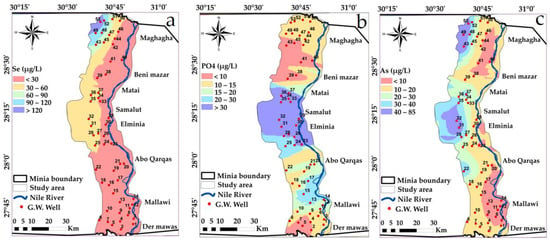
Figure 14.
Spatial distribution maps: (a) Se (b) PO4 (c) As variations in the study area in year, 2009.
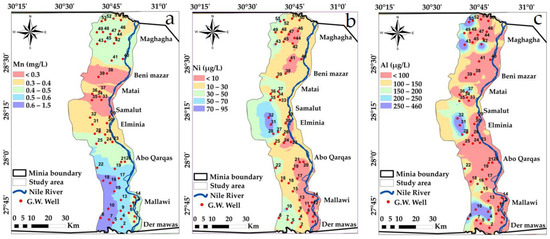
Figure 13.
Spatial distribution maps: (a) Mn (b) Ni (c) Al variations in the study area in year, 2009.
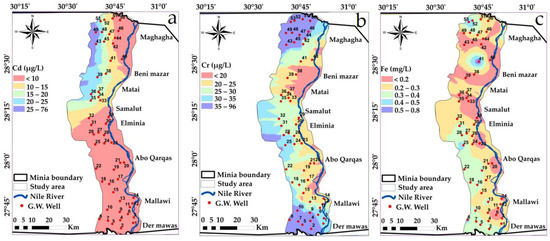
Figure 12.
Spatial distribution maps: (a) Cd (b) Cr (c) Fe variations in the study area in year, 2009.
Table 7.
Statistics of heavy metal values for groundwater in the study area.
| No. | Fe (mg/L) | Mn (mg/L) | SiO2 (mg/L) | Pb “µg/L” | Cd “µg/L” | Cr “µg/L” | As “µg/L” | Hg “µg/L” | Ni “µg/L” | Al “µg/L” | Se “µg/L” | PO4 “µg/L” |
|---|---|---|---|---|---|---|---|---|---|---|---|---|
| Maximum | 0.80 | 1.50 | 7.00 | 95.00 | 76.00 | 96.00 | 85.00 | 8.50 | 95.00 | 460.00 | 265.00 | 170.00 |
| Minimum | 0.00 | 0.00 | 0.00 | 1.00 | 0.10 | 0.00 | 1.00 | 0.10 | 0.00 | 12.00 | 2.00 | 0.00 |
| Average | 0.26 | 0.45 | 3.60 | 13.87 | 8.08 | 30.83 | 19.42 | 2.12 | 23.04 | 110.28 | 32.79 | 17.36 |
| Standard deviation | 0.16 | 0.35 | 1.35 | 20.31 | 14.77 | 26.47 | 24.13 | 2.56 | 27.65 | 133.80 | 50.00 | 31.14 |
Approximately half of the analyzed groundwater samples showed high values of Mn, As, Co, Cr, Ni, Hg, Cd and Se. These high values could be due to industrial water leaching from El-Moheet drain where Abou Heleika et al. [39]’s results almost agreed with the results of the present study for the same study area during the year 2018. However, about 50% of the groundwater samples had values below the permissible guideline limits of Egyptian standards; Figure 12, Figure 13, Figure 14 and Figure 15 show the distribution of heavy metals in the study area.
6. Conclusions
The current study on detecting the groundwater quality in the Minia Region along the West Nile River indicated that:
- Groundwater quality indicators/parameters are spatially variable from one site to another. We believe that integrating these parameters in a systematic procedure improves the awareness of the variation in the groundwater quality in the study area.
- From the chemical analysis of the groundwater, it was found that the major ions descend as follows: HCO3 > Cl > SO4 and Ca > Mg > Na > K for anions and cations, respectively.
- Most samples were found to be “suitable” for irrigation purposes based on the values of SAR, Na%, KI, SSP, MR%, PI and CAI.
- The calculated indices showed that the region’s groundwater lies almost into the good class for major ions and can be used for irrigation, but for trace elements it needs more attention and more studies to restrict values with respect to these metals.
- Seepage of wastewater from the Minia sewage treatment plant and network, industrial wastewater from a sugar factory of Abo-Qarqas city (e.g., El-Moheet drain), the fertilizer leaching process and pesticides seeping into groundwater from soils are the main sources of heavy metals traces.
- It is recommended that the needed measures are taken by the concerning authorities (Egyptian Environmental Agency Authority) to reduce the heavy metals traces that can be found in the groundwater in the Minia region, probably by applying the related Egyptian law no. 147/2021 and its detailed bylaw to any violations.
Supplementary Materials
The following supporting information can be downloaded at: https://www.mdpi.com/article/10.3390/su15054076/s1, Figure S1. Hydrogeological cross-section (A-A) (East–West) in Minia area, modified after [38,44]; for location see Figure 2a. Table S1. Coordinates of the studied wells during the years 2009 and 2019.
Author Contributions
Conceptualization, A.N., F.A., E.M.R., A.M.N. and A.M.B.; methodology, A.N., E.M.R. and F.A.; validation, E.M.R., A.M.N. and A.M.B.; formal analysis, A.M.N. and A.M.B.; investigation, A.N., E.M.R., F.A. and A.M.B.; data curation, A.M.B.; writing—original draft preparation, E.M.R., A.M.N. and A.M.B.; writing—review and editing, A.M.B.; supervision, A.N. and F.A.; project administration, F.A.; funding acquisition, F.A. All authors have read and agreed to the published version of the manuscript.
Funding
This study was funded by the EU H2020 PRIMA project SIGMA Nexus—Sustainable Innovation and Governance in the Mediterranean Area for the WEF Nexus, Grant #1943 [SIGMANEXUS] [Call 2019 Section 1 Nexus RIA]. The funding agency had no role in the study design, data collection and analysis, decision to publish, or preparation of the manuscript. The findings and conclusions in this publication are those of the authors and should not be construed to represent any official EU or PRIMA determination or policy.
Institutional Review Board Statement
Not applicable.
Informed Consent Statement
Not applicable.
Data Availability Statement
Not applicable.
Conflicts of Interest
The authors declare no conflict of interest.
References
- Bhuyan, M.; Bakar, M.; Sharif, A.S.M.; Hasan, M.; Islam, M. Water quality assessment using water quality indicators and multivariate analyses of the old Brahmaputra River. Pollution 2018, 4, 481–493. [Google Scholar]
- Pejman, A.; Bidhendi, G.; Karbassi, A.; Mehrdadi, N.; Bidhendi, M.E. Evaluation of spatial and seasonal variations in surface water quality using multivariate statistical techniques. Int. J. Environ. Sci. Technol. 2009, 6, 467–476. [Google Scholar] [CrossRef]
- Jalali, M. Groundwater geochemistry in the Alisadr, Hamadan, western Iran. Environ. Monit. Assess. 2010, 166, 359–369. [Google Scholar] [CrossRef]
- Singh, K.P.; Malik, A.; Mohan, D.; Sinha, S. Multivariate statistical techniques for the evaluation of spatial and temporal variations in water quality of Gomti River (India)—A case study. Water Res. 2004, 38, 3980–3992. [Google Scholar] [CrossRef]
- Pham, L. Comparison between Water Quality Index (WQI) and biological indices, based on planktonic diatom for water quality assessment in the Dong Nai River, Vietnam. Pollution 2017, 3, 311–323. [Google Scholar]
- Etteieb, S.; Cherif, S.; Tarhouni, J. Hydrochemical assessment of water quality for irrigation: A case study of the Medjerda River in Tunisia. Appl. Water Sci. 2017, 7, 469–480. [Google Scholar] [CrossRef]
- Ramakrishnaiah, C.; Sadashivaiah, C.; Ranganna, G. Assessment of water quality index for the groundwater in Tumkur Taluk, Karnataka State, India. J. Chem. 2009, 6, 523–530. [Google Scholar] [CrossRef]
- Abdel-Satar, A.M. Water quality assessment of River Nile from Idfo to Cairo. Egypt. J. Aquat. Res. 2005, 31, 200–223. [Google Scholar]
- Shamrukh, M.; Abdel-Wahab, A. Water pollution and riverbank filtration for water supply along river Nile, Egypt. In Riverbank Filtration for Water Security in Desert Countries; Springer: Berlin/Heidelberg, Germany, 2011; pp. 5–28. [Google Scholar]
- Ramadan, E.M.; Fahmy, M.R.; Nosair, A.M.; Badr, A.M. Using geographic information system (GIS) modeling in evaluation of canals water quality in Sharkia Governorate, East Nile Delta, Egypt. Model. Earth Syst. Environ. 2019, 5, 1925–1939. [Google Scholar] [CrossRef]
- Alnaimy, M.A.; Shahin, S.A.; Vranayova, Z.; Zelenakova, M.; Abdel-Hamed, E.M.W. Long-term impact of wastewater irrigation on soil pollution and degradation: A case study from Egypt. Water 2021, 13, 2245. [Google Scholar] [CrossRef]
- Schwarzenbach, R.P.; Egli, T.; Hofstetter, T.B.; Von Gunten, U.; Wehrli, B. Global water pollution and human health. Annu. Rev. Environ. Resour. 2010, 35, 109–136. [Google Scholar] [CrossRef]
- Shabana, A. Hydrogeological studies on the Area West Deir Mouas-Mallawi, El Minia Governorate, Egypt. Egypt. J. Geol. 2010, 54, 61–78. [Google Scholar]
- Al Temamy, A.; Abu Risha, U. Groundwater interaction and potential: Inferred from geoelectrical and hydrogeological techniques in The Desert fringe of Abu Qurqas area, El Menia, West Nile, Egypt. Egypt. J. Geol. 2016, 60, 75–95. [Google Scholar]
- Yousif, M.; Sabet, H.S.; Ghoubachi, S.Y.; Aziz, A. Utilizing the geological data and remote sensing applications for investigation of groundwater occurrences, West El Minia, Western Desert of Egypt. NRIAG J. Astron. Geophys. 2018, 7, 318–333. [Google Scholar] [CrossRef]
- Chowdhary, P.; Bharagava, R.N.; Mishra, S.; Khan, N. Role of industries in water scarcity and its adverse effects on environment and human health. In Environmental Concerns and Sustainable Development; Springer: Berlin/Heidelberg, Germany, 2020; pp. 235–256. [Google Scholar]
- Farzin, M.; Asadi, A.; Pukanska, K.; Zelenakova, M. An Assessment on the Safety of Drinking Water Resources in Yasouj, Iran. Sustainability 2022, 14, 3619. [Google Scholar] [CrossRef]
- Rahbar, A.; Vadiati, M.; Talkhabi, M.; Nadiri, A.A.; Nakhaei, M.; Rahimian, M. A hydrogeochemical analysis of groundwater using hierarchical clustering analysis and fuzzy C-mean clustering methods in Arak plain, Iran. Environ. Earth Sci. 2020, 79, 342. [Google Scholar] [CrossRef]
- Mirabbasi, R.; Mazloumzadeh, S.; Rahnama, M. Evaluation of irrigation water quality using fuzzy logic. Res. J. Environ. Sci. 2008, 2, 340–352. [Google Scholar]
- Karbassi, A.; Mir Mohammad Hosseini, F.; Baghvand, A.; Nazariha, M. Development of water quality index (WQI) for Gorganrood River. Int. J. Environ. Res. 2011, 5, 1041–1046. [Google Scholar]
- Tavakol, M.; Arjmandi, R.; Shayeghi, M.; Monavari, S.M.; Karbassi, A. Application of multivariate statistical methods to optimize water quality monitoring network with emphasis on the pollution caused by fish farms. Iran. J. Public Health 2017, 46, 83. [Google Scholar]
- Aliyu, T.; Balogun, O.; Namani, C.; Olatinwo, L.; Aliyu, A. Assessment of the presence of metals and quality of water used for irrigation in Kwara State, Nigeria. Pollution 2017, 3, 461–470. [Google Scholar]
- Cieszynska, M.; Wesolowski, M.; Bartoszewicz, M.; Michalska, M.; Nowacki, J. Application of physicochemical data for water-quality assessment of watercourses in the Gdansk Municipality (South Baltic coast). Environ. Monit. Assess. 2012, 184, 2017–2029. [Google Scholar] [CrossRef] [PubMed]
- Li, P.; Wu, J.; Qian, H. Assessment of groundwater quality for irrigation purposes and identification of hydrogeochemical evolution mechanisms in Pengyang County, China. Environ. Earth Sci. 2013, 69, 2211–2225. [Google Scholar] [CrossRef]
- Babushkina, E.A.; Belokopytova, L.V.; Grachev, A.M.; Meko, D.M.; Vaganov, E.A. Variation of the hydrological regime of Bele-Shira closed basin in Southern Siberia and its reflection in the radial growth of Larix sibirica. Reg. Environ. Chang. 2017, 17, 1725–1737. [Google Scholar] [CrossRef]
- Brindha, K.; Elango, L. Environmental assessment of water quality in Nagarjuna Sagar reservoir, India. Earth Resour. 2013, 1, 33–36. [Google Scholar] [CrossRef]
- Sadeghfam, S.; Bagheri, A.; Razzagh, S.; Nadiri, A.A.; Vadiati, M.; Senapathi, V.; Sekar, S. Hydrochemical analysis of seawater intrusion by graphical techniques in coastal aquifers to delineate vulnerable areas. In Groundwater Contamination in Coastal Aquifers; Elsevier: Amsterdam, The Netherlands, 2022; pp. 91–104. [Google Scholar]
- Gowd, S.S. Assessment of groundwater quality for drinking and irrigation purposes: A case study of Peddavanka watershed, Anantapur District, Andhra Pradesh, India. Environ. Geol. 2005, 48, 702–712. [Google Scholar] [CrossRef]
- Hem, J.D. Study and Interpretation of the Chemical Characteristics of Natural Water; Department of the Interior, US Geological Survey: Sunrise Valley Drive Reston, VA, USA, 1985; Volume 2254.
- Saeedi, M.; Abessi, O.; Sharifi, F.; Meraji, H. Development of groundwater quality index. Environ. Monit. Assess. 2010, 163, 327–335. [Google Scholar] [CrossRef]
- Jemmali, H.; Sullivan, C.A. Multidimensional analysis of water poverty in MENA region: An empirical comparison with physical indicators. Soc. Indic. Res. 2014, 115, 253–277. [Google Scholar] [CrossRef]
- Mashaly, A.F.; Alazba, A.; Al-Awaadh, A.; Mattar, M.A. Area determination of solar desalination system for irrigating crops in greenhouses using different quality feed water. Agric. Water Manag. 2015, 154, 1–10. [Google Scholar] [CrossRef]
- Awaad, H.A.; Mansour, E.; Akrami, M.; Fath, H.E.; Javadi, A.A.; Negm, A. Availability and feasibility of water desalination as a non-conventional resource for agricultural irrigation in the mena region: A review. Sustainability 2020, 12, 7592. [Google Scholar] [CrossRef]
- Semiromi, F.B.; Hassani, A.; Torabian, A.; Karbassi, A.; Lotfi, F.H. Water quality index development using fuzzy logic: A case study of the Karoon River of Iran. Afr. J. Biotechnol. 2011, 10, 10125–10133. [Google Scholar]
- Salem, A. Hydrogeological studies on the shallow aquifers in the area West Samalot, El-Minia Governorate, Egypt. Egypt J. Pure Appl. Sci. 2015, 53, 49–60. [Google Scholar]
- Abdelhalim, A.; Sefelnasr, A.; Ismail, E. Numerical modeling technique for groundwater management in Samalut city, Minia Governorate, Egypt. Arab. J. Geosci. 2019, 12, 124. [Google Scholar] [CrossRef]
- Ahmed, A.; El Ammawy, M.; Hewaidy, A.G.; Moussa, B.; Abdel Hafz, N.; El Abd, E.S. Mapping of lineaments for groundwater assessment in the desert fringes east El-Minia, eastern desert, Egypt. Environ. Monit. Assess. 2019, 191, 556. [Google Scholar] [CrossRef] [PubMed]
- Ismail, E.; Zaki, R.; Rapantová, N.; Ličbinská, M.; Sharawi, H. Hydrogeochemical characteristics of the groundwater in the quaternary aquifer of western fringes of El-Minia Governorate, Egypt using an integration of geochemical modeling and geo-statistical techniques. Desalin. Water Treat 2020, 189, 134–151. [Google Scholar] [CrossRef]
- Abou Heleika, M.; Ismail, E.; Ahmed, M. Delineation of contamination zone using geophysical and hydrogeochemical methods around the El Moheet drain in the El Minia district, Upper Egypt. Arab. J. Geosci. 2018, 11, 625. [Google Scholar] [CrossRef]
- DG Al-Afify, A.; YM Aly, M. Application of Nile Chemical Pollution Index to evaluate the quality of water for drinking and agricultural purposes on Bahr Yusuf Branch, River Nile, Egypt. Egypt. J. Aquat. Biol. Fish. 2019, 23, 367–379. [Google Scholar] [CrossRef]
- Said, R. The Geological Evolution of the River Nile; Springer Science & Business Media: Berlin, Germany, 2012. [Google Scholar]
- Conoco Coral Egypt, Geologic Map of Egypt (Scale 1:500,000); General Petroleum Company: Cairo, Egypt, 1987.
- Ghodeif, K.; Grischek, T.; Bartak, R.; Wahaab, R.; Herlitzius, J. Potential of river bank filtration (RBF) in Egypt. Environ. Earth Sci. 2016, 75, 671. [Google Scholar] [CrossRef]
- Moneim, A.A.A.; Fernández-Álvarez, J.P.; El Ella, E.M.A.; Masoud, A.M. Groundwater management at West El-Minia desert area, Egypt using numerical modeling. J. Geosci. Environ. Prot. 2016, 4, 66. [Google Scholar] [CrossRef]
- El Kashouty, M. The hydrogeochemical evolution and modeling of the Quaternary aquifer west of the River Nile, El Minia district. Arab. J. Geosci. 2012, 5, 617–635. [Google Scholar] [CrossRef]
- Snousy, M.G.; Ismail, E.; Zaki, R. Trace element occurrence and distribution problems in the irrigation water at El-Minia district, north upper Egypt. Arab. J. Geosci. 2019, 12, 582. [Google Scholar] [CrossRef]
- Alam, F. Evaluation of hydrogeochemical parameters of groundwater for suitability of domestic and irrigational purposes: A case study from central Ganga Plain, India. Arab. J. Geosci. 2014, 7, 4121–4131. [Google Scholar] [CrossRef]
- Yıldız, S.; Karakuş, C.B. Estimation of irrigation water quality index with development of an optimum model: A case study. Environ. Dev. Sustain. 2020, 22, 4771–4786. [Google Scholar] [CrossRef]
- Zahedi, S. Modification of expected conflicts between drinking water quality index and irrigation water quality index in water quality ranking of shared extraction wells using multi criteria decision making techniques. Ecol. Indic. 2017, 83, 368–379. [Google Scholar] [CrossRef]
- Omran, E.-S.E. A proposed model to assess and map irrigation water well suitability using geospatial analysis. Water 2012, 4, 545–567. [Google Scholar] [CrossRef]
- Shabbir, R.; Ahmad, S.S. Use of geographic information system and water quality index to assess groundwater quality in Rawalpindi and Islamabad. Arab. J. Sci. Eng. 2015, 40, 2033–2047. [Google Scholar] [CrossRef]
- Seth, R.; Mohan, M.; Singh, P.; Singh, R.; Gupta, V.K.; Dobhal, R.; Uniyal, D.P.; Gupta, S. Assessment of seasonal variations in surface water quality of Bageshwar District, Uttarakhand, India for drinking and irrigation purposes. Proc. Natl. Acad. Sci. India Sect. A Phys. Sci. 2015, 85, 283–293. [Google Scholar] [CrossRef]
- Meireles, A.C.M.; Andrade, E.M.; Chaves, L.C.G.; Frischkorn, H.; Crisostomo, L.A. Uma nova proposta de classificação da água para fins de irrigação. In A New Proposal of the Classification of Irrigation Water; Revista Ciência Agronômica: Fortaleza, Brasil, 2010. [Google Scholar]
- Sayyed, J.; Bhosle, A. Analysis of chloride, sodium and potassium in groundwater samples of Nanded City in Mahabharata, India. Eur. J. Exp. Biol. 2011, 1, 74–82. [Google Scholar]
- Kaur, T.; Bhardwaj, R.; Arora, S. Assessment of groundwater quality for drinking and irrigation purposes using hydrochemical studies in Malwa region, southwestern part of Punjab, India. Appl. Water Sci. 2017, 7, 3301–3316. [Google Scholar] [CrossRef]
- Gedamy, Y.; Abdulhady, Y.; Zaghlool, E. Hydrochemistry of the Eocene aquifer at the desert fringes of west El-Minya governorate, Egypt. Curr. Sci. Int. 2019, 8, 734–763. [Google Scholar]
- Eisena, C.; Anderson, M.P. The effects of urbanization on ground-water quality—A case study. Groundwater 1979, 17, 456–462. [Google Scholar] [CrossRef]
- Guy, F. Irrigation water quality standards and salinity management strategies. Tex. Agric. Ext. Serv. 1997, 1–18. Available online: https://www.google.com.hk/url?sa=t&rct=j&q=&esrc=s&source=web&cd=&cad=rja&uact=8&ved=2ahUKEwi___etxJT9AhUM0GEKHRglBbkQFnoECA0QAQ&url=https%3A%2F%2Ftwon.tamu.edu%2Fwp-content%2Fuploads%2Fsites%2F3%2F2021%2F06%2Firrigation-water-quality-standards-and-salinity-management-strategies-1.pdf&usg=AOvVaw0y-8ervD5_J3ikOZkJ0mji (accessed on 5 December 2022).
- El Shinawi, A.; Zeleňáková, M.; Nosair, A.M.; Abd-Elaty, I. Geo-spatial mapping and simulation of the sea level rise influence on groundwater head and upward land subsidence at the rosetta coastal zone, nile delta, egypt. J. King Saud Univ. Sci. 2022, 34, 102145. [Google Scholar] [CrossRef]
- Abu Salem, H.S.; Gemail, K.S.; Junakova, N.; Ibrahim, A.; Nosair, A.M. An Integrated Approach for Deciphering Hydrogeochemical Processes during Seawater Intrusion in Coastal Aquifers. Water 2022, 14, 1165. [Google Scholar] [CrossRef]
- Ayers, R.S.; Westcot, D.W. Water Quality for Agriculture; Food and Agriculture Organization of the United Nations Rome: Roma, Italy, 1985; Volume 29. [Google Scholar]
- Purushothaman, P.; Rao, M.; Kumar, B.; Rawat, Y.; Krishan, G.; Gupta, S.; Marwah, S.; Bhatia, A.; Kaushik, Y.; Angurala, M. Drinking and irrigation water quality in Jalandhar and Kapurthala Districts, Punjab, India: Using hydrochemsitry. Int. J. Earth Sci. Eng. 2012, 5, 1599–1608. [Google Scholar]
- Ibrahem, S.M.M. Groundwater and Characteristics of the Tertiary-Quaternary Aquifer System West of Mallawi, Upper Egypt. In Groundwater in Egypt’s Deserts; Springer: Cham, Switzerland, 2021; pp. 153–175. [Google Scholar]
- Alnaimy, M.; Zelenakova, M.; Vranayova, Z.; Abu-Hashim, M. Effects of Temporal Variation in Long-Term Cultivation on Organic Carbon Sequestration in Calcareous Soils: Nile Delta, Egypt. Sustainability 2020, 12, 4514. [Google Scholar] [CrossRef]
- Rajmohan, N.; Elango, L. Identification and evolution of hydrogeochemical processes in the groundwater environment in an area of the Palar and Cheyyar River Basins, Southern India. Environ. Geol. 2004, 46, 47–61. [Google Scholar] [CrossRef]
- Hounslow, A.W. Water Quality Data: Analysis and Interpretation; CRC Press: Boca Raton, FL, USA, 2018. [Google Scholar]
- Vasanthavigar, M.; Srinivasamoorthy, K.; Rajiv Ganthi, R.; Vijayaraghavan, K.; Sarma, V. Characterisation and quality assessment of groundwater with a special emphasis on irrigation utility: Thirumanimuttar sub-basin, Tamil Nadu, India. Arab. J. Geosci. 2012, 5, 245–258. [Google Scholar] [CrossRef]
- Ishaku, J.; Ahmed, A.; Abubakar, M. Assessment of groundwater quality using chemical indices and GIS mapping in Jada area, Northeastern Nigeria. J. Earth Sci. Geotech. Eng. 2011, 1, 35–60. [Google Scholar]
- Abdel-Fattah, M.K.; Mohamed, E.S.; Wagdi, E.M.; Shahin, S.A.; Aldosari, A.A.; Lasaponara, R.; Alnaimy, M.A. Quantitative evaluation of soil quality using Principal Component Analysis: The case study of El-Fayoum depression Egypt. Sustainability 2021, 13, 1824. [Google Scholar] [CrossRef]
- Mohammed, I.; Ndahi, A.; Adamu, I. Rapid assessment of reservoir water quality and suitability indices for irrigation purpose: A case study of Ero and Ele Reservoirs in Ekiti State Nigeria. Int. J. Multidiscip. Curr. Res. 2015, 3, 215–219. [Google Scholar]
- Wilcox, L. Classification and Use of Irrigation Waters; US Department of Agriculture: Washington, DC, USA, 1955.
- Todd, D.K.; Mays, L.W. Groundwater Hydrology; John Wiley & Sons: Hoboken, NJ, USA, 2004. [Google Scholar]
- Adimalla, N. Groundwater quality for drinking and irrigation purposes and potential health risks assessment: A case study from semi-arid region of South India. Expo. Health 2019, 11, 109–123. [Google Scholar] [CrossRef]
- González-Acevedo, Z.I.; Padilla-Reyes, D.A.; Ramos-Leal, J.A. Quality assessment of irrigation water related to soil salinization in Tierra Nueva, San Luis Potosí, Mexico. Rev. Mex. De Cienc. Geológicas 2016, 33, 271–285. [Google Scholar]
- Almeida, C.; Quintar, S.; González, P.; Mallea, M. Assessment of irrigation water quality. A proposal of a quality profile. Environ. Monit. Assess. 2008, 142, 149–152. [Google Scholar] [CrossRef] [PubMed]
- Richards, L. Diagnosis and Improvement of. Saline Alkali Soils. Handb. 1954, 60, 1–160. [Google Scholar]
- Elewa, H.H.; Shohaib, R.E.; Qaddah, A.A.; Nousir, A.M. Determining groundwater protection zones for the Quaternary aquifer of northeastern Nile Delta using GIS-based vulnerability mapping. Environ. Earth Sci. 2013, 68, 313–331. [Google Scholar] [CrossRef]
- Olioso, A.; Inoue, Y.; Ortega-Farias, S.; Demarty, J.; Wigneron, J.-P.; Braud, I.; Jacob, F.; Lecharpentier, P.; Ottle, C.; Calvet, J.-C. Future directions for advanced evapotranspiration modeling: Assimilation of remote sensing data into crop simulation models and SVAT models. Irrig. Drain. Syst. 2005, 19, 377–412. [Google Scholar] [CrossRef]
- Laboratory, R.S. Diagnosis and Improvement of Saline and Alkali Soils; US Department of Agriculture: Washington, DC, USA, 1954.
- Nosair, A.M.; Shams, M.Y.; AbouElmagd, L.M.; Hassanein, A.E.; Fryar, A.E.; Abu Salem, H.S. Predictive model for progressive salinization in a coastal aquifer using artificial intelligence and hydrogeochemical techniques: A case study of the Nile Delta aquifer, Egypt. Environ. Sci. Pollut. Res. 2022, 29, 9318–9340. [Google Scholar] [CrossRef]
- Paliwal, K.; Gandhi, A. Effect of salinity, SAR, Ca: Mg ratio in irrigation water, and soil texture on the predictability of exchangeable sodium percentage. Soil Sci. 1976, 122, 85–90. [Google Scholar] [CrossRef]
- Hundal, H.; Kumar, R.; Singh, K.; Singh, D. Occurrence and geochemistry of arsenic in groundwater of Punjab, Northwest India. Commun. Soil Sci. Plant Anal. 2007, 38, 2257–2277. [Google Scholar] [CrossRef]
- Rahman, M.; Das, R.; Hassan, N.; Roy, K.; Haque, F.; Akber, M.A. Environmental study on water quality of Mayur River with reference to suitability for irrigation. Int. J. Environ. Sci. 2014, 4, 1150. [Google Scholar]
- Sallam, F.T.M.; Sadek, M.A.H.; Rayan, R.A. Sources of Salinity and Suitability for Irrigation and Drinking Use of the Groundwater of Northwest of ElMinia, Upper Egypt. Egypt. J. Chem. 2020, 63, 4063–4074. [Google Scholar] [CrossRef]
- Aghazadeh, N.; Mogaddam, A.A. Assessment of groundwater quality and its suitability for drinking and agricultural uses in the Oshnavieh Area, Northwest of Iran. J. Environ. Prot. 2010, 1, 30. [Google Scholar] [CrossRef]
- Jafar Ahamed, A.; Ananthakrishnan, S.; Loganathan, K.; Manikandan, K. Assessment of groundwater quality for irrigation use in Alathur block, Perambalur district, Tamilnadu, South India. Appl. Water Sci. 2013, 3, 763–771. [Google Scholar] [CrossRef]
- Kumar, P.; Kumar, M.; Ramanathan, A.; Tsujimura, M. Tracing the factors responsible for arsenic enrichment in groundwater of the middle Gangetic Plain, India: A source identification perspective. Environ. Geochem. Health 2010, 32, 129–146. [Google Scholar] [CrossRef]
- Rasool, A.; Xiao, T.; Farooqi, A.; Shafeeque, M.; Liu, Y.; Kamran, M.A.; Katsoyiannis, I.A.; Eqani, S.A.M.A.S. Quality of tube well water intended for irrigation and human consumption with special emphasis on arsenic contamination at the area of Punjab, Pakistan. Environ. Geochem. Health 2017, 39, 847–863. [Google Scholar] [CrossRef] [PubMed]
- Schoeller, H. Geochemistry of groundwater. In Groundwater Studies, An International Guide for Research and Practice; UNESCO: Paris, France, 1977; 18p. [Google Scholar]
Disclaimer/Publisher’s Note: The statements, opinions and data contained in all publications are solely those of the individual author(s) and contributor(s) and not of MDPI and/or the editor(s). MDPI and/or the editor(s) disclaim responsibility for any injury to people or property resulting from any ideas, methods, instructions or products referred to in the content. |
© 2023 by the authors. Licensee MDPI, Basel, Switzerland. This article is an open access article distributed under the terms and conditions of the Creative Commons Attribution (CC BY) license (https://creativecommons.org/licenses/by/4.0/).