Article

Influence of Eco-Innovation and Recycling on Raw Material Consumption; Econometric Approach in the Case of the European Union

Institute of National Economy, Romanian Academy, 050711 București, Romania
*
Author to whom correspondence should be addressed.
Sustainability 2023, 15(5), 3996; https://doi.org/10.3390/su15053996
Submission received: 3 January 2023 / Revised: 14 February 2023 / Accepted: 21 February 2023 / Published: 22 February 2023

Abstract

:
The main objective of this paper is to identify the intensity and the sense of the impact that eco-innovation and recycling exert on raw material consumption in the European Union member-states. The basic hypothesis is that eco-innovation and recycling have a significant influence on raw material consumption. The authors consider that, in the long run, by promoting eco-innovation and recycling, countries will minimize their demand and use of raw materials. In the paper, the material footprint per capita has been considered as an adequate indicator to measure the material consumption induced by economic and social activities. The model used has estimated the influence of eco-innovation and recycling on the material footprint per capita using panel data regression by considering the 27 EU countries, for the 2010–2019 time period. The authors found that the most adequate econometric model is the panel model with fixed effects. The respective econometric model validates the hypothesis that eco-innovation and recycling have significant influence on reducing the material footprint per capita and reveals heterogeneity existing among EU countries. At the same time, the model shows the intensity of influence exerted by each regressor. The eco-innovation and recycling have an important role in decreasing the material footprint per capita and should be in the centre of policies aimed at decoupling the economic growth from the raw material consumption.

1. Introduction

The decoupling of the gross domestic product growth from material consumption is one of the main conditions for achieving a sustainable economic and social development. A significant decrease in the demand for material resources accompanied with the extension of the economic activities and the narrowing of the development gap between the world’s countries could be obtained only if some conditions are fulfilled. One important condition to achieve this is the overall reduction in raw material and energy consumption that, in today’s economic circumstances, is perceived as a mode of progress. There are different ways to achieve this objective: (a) the expansion of innovation in order to help the occurrence and implementation of a new type of technical solution for the reduction in material and energy consumption; (b) the expansion of the recycling processes based on economic reasons.
The literature indicates that material consumption is affected by the following three factors: resource intensity in the production of goods and services, consumption of goods and services per person, and population size [1]. The resource intensity (in this paper, the means to reduce consumption/capita or population size will not be discussed) in obtaining goods and services can be reduced by several steps, such as enhancing eco-innovation and maximizing the activities that promote a circular economy. These steps could ensure a significant advance toward a new paradigm of the economy. The authors note that recent research [2] revealed that the continuous innovation processes designed to promote economic growth and environmental protection favour the transition from the linear economy, which stimulates the increase in material consumption, to the circular economy, defined by decreasing material consumption and the growing importance of recycling activities. In other words, by promoting the changes in the technological and institutional landscape, it is possible to make a transition from the principle “take–make–dispose” of the linear economy to the principle “reduce –reuse–recycle” of the circular economy [3] (The principle “reduce–reuse–recycle” of the circular economy was an initial one. The steps which were made for the implementation of circular economy led to the considerable extension of the principle which contributes to the building of the respective type of economy. Recent research [4] speaks about 33 Rs principle of circular economy which concerns technical, institutional, and business aspects.).
Therefore, the main objective of this paper is to estimate the intensity and the direction of the influence that eco-innovation and recycling exert on material consumption dynamics. The basic hypothesis adopted is that eco-innovation and recycling have a significant influence on diminishing material consumption. The authors consider that the direction of this influence is downward and, in the long run, by promoting recycling and eco-innovation, countries will decrease their demand for raw materials with notable positive effects on the environment. However, this assumption needs to be proven by using econometric models that rely on data which take into account a relatively large number of observations concerning time periods and countries. Thus, it is possible to confirm the role of technological changes, production organization, and sectoral economic structure in the redesign of the correlation between economic growth and material consumption.
It is important to note that the concepts of eco-innovation and recycling and also the indicators defined to measure their intensity and impact on economic and social activities are widely used in the studies or strategies regarding sustainable development elaborated by specialized organizations of the United Nations (UNDP, UNEP, UNIDO) World Bank, OECD, or European Commission.
In this context, the authors first consider that it is necessary to examine the indicators and concepts that are used in the literature for the adequate quantification of the raw material dynamics, eco-innovation, and recycling and eventually find new cognitive valences. Usually, these indicators can be found in the databases of international organizations, such as the European Commission, World Bank, and the United Nations. Based on the respective examination, it is possible to choose the adequate indicators which allow for examining the impact of the extension of eco-innovation and recycling on the reduction in raw material consumption. The above-mentioned impact in the case of European Union member-states can be revealed with the help of panel econometric models. This way, we are able to detect the long-term behaviour of the real material consumption, at the level of the whole European Union, on the one hand, and some particularities of each member countries to the respective structural adjustments, on the other hand.

2. Literature Review

The reduction in raw material consumption is an important direction for promoting sustainable development. This assumption is revealed by the fact that the Sustainable Development Goals adopted in 2015 in the framework of the United Nations include some approaches related to responsible consumption and production. This tendency can be highlighted by indicators such as (a) domestic material consumption (DMC) and (b) material footprint (MF). Recent research [1] showed that DMC reveals the apparent material consumption and its use in the analysis of the progress in ensuring the premises of sustainable growth can lead to distorted results. Depending on the foreign trade structure, it is possible to draw some distorted conclusions regarding the decoupling of economic growth from the material consumption dynamics.
The material footprint exposes the real demand for raw material inputs generated by economic and social activities which take place in a country. The respective indicator quantifies the allocation of used raw material extraction to the final demand of an economy [1]. Material footprint values depend on the size of the analyzed economies. In order to eliminate the influence of the size of the countries’ economies, the material footprint per capita indicator can be used and comparable data can be generated. For this reason, in this paper, the material footprint per capita will be used as an indicator of raw material consumption in the European Union member states.
There are many articles and research papers that took into account and discussed the evolution and main drivers that influence raw material demand and consumption. A recent paper [5] analyzed a complex relationship among several variables such as resource footprints, quality of life, and economic development. The dataset that was used was large, comprising 173 countries over the period of 25 years. The authors found that the relationship among variables is a logarithmic one and this type of dependency could be used for other resource footprints such as all greenhouse gases, and raw materials. Another important finding of the paper is that resource footprints and GDP per capita have a positive linear relationship.
A new research paper [6] explored factors that influence the ecological footprint at different income levels. The paper took into account a panel regression model to analyze the factors that affect the ecological footprint. The panel data model was used in order to determine the individual difference between samples, at a regional level. The model that was used was a panel with random effects and several regressors as GDP per capita (log), the urban population as % of the total (residual), exports of goods and services as % of the total GDP (log), and foreign direct investment (log). This model was applied to three income groups of countries (low, medium, and high income). The empirical results obtained confirmed that in all three income groups, GDP/capita sensibly influences the ecological footprint. The consequence of this result means that there will be a lower environmental quality as a result of economic development irrespective of the level of income. However, the model also showed that the effect of GDP/capita on the ecological footprint is not the same for different income levels. For instance, an increase in the GDP/capita in a low-income country will determine a smaller effect on the ecological footprint than the same increase in the GDP/capita in a middle or high-income country.
In the last decades, the concept of eco-innovation was used to define and support the efforts to sustain a reduction in resource intensity in the production of goods and services. As well, the economic practice showed that one of the main outcomes of the innovations (and eco-innovations makes no exception) is diminished material consumption. Eco-innovation processes strongly depend on many factors among which we could mention the scientific paradigm and the production organizing methods. In addition, an important contribution to the acceptance of proposals for the changes in the technological linkages in the productive apparatus is given by the economic, social, and cultural environment [5,6]. The economic literature reveals the existence of several types of innovation. The role of innovation in sustaining economic growth was analyzed by Schumpeter in his works published for the first time in 1911 and 1942 [7,8]. In the Schumpeterian vision, the innovation processes are linked with the activities of the entrepreneurs in the context of a market economy. During the second half of the XXth century, there were contributions to economic innovation brought by several authors such as [9] concerning the role of learning by doing, from a neoclassical vision by [10], from an evolutionary vision [9,10,11]. In most cases, the innovation processes are described as multidimensional ones. Another author [12] shows that the innovations are classified as incremental, radical, and new technological systems [12]. Incremental innovations are usually generated by the implementation of the “learning by doing” or “learning by using” principles. The respective innovations contribute to the cost changes (usually by diminishing) to supply goods and services. In the case of incremental innovations, usually, the first effect is the saving of human or natural resources. Usually, the respective type of innovation is obtained in the context of a short-term vision of economic evolution.
Radical innovations have major contributions to the occurrence of new economic activities or branches, in the context of maintaining the paradigm of the productive apparatus. The above-mentioned classification reveals the impact of the innovation processes on the linkage between economic activities. The radical innovations were most often obtained in the context of structural adjustment of the economy and extended use of new technologies and implicitly had consequences on a long-term vision regarding economic evolution. This type of innovation ensures the sustainability of the innovation processes underlining that, in the long run, incremental innovations cannot be sustained if the innovations are not implemented [13].
In the context of the third industrial revolution, one of the forms of innovation is the occurrence of new technological systems, which represents a challenge for the existing paradigms which are dominant, at one moment, in science, technologies, and productive apparatus. The respective form of innovation has a long-term impact not only on the sectoral or branch structure of the economy but also on the methods of the production organization, skills requirements for the employees, demand for fixed capital, and raw materials and waste management. In many cases, the implementation of new technological systems has disruptive effects on traditional activities, caused by the sudden diminishing of the demand, production factor substitution, or the new skills requirements for the potential workers or employees.
The advances towards a new economic structure generated by the large-scale implementation of informational communication technologies have favoured the occurrence of new features of innovations. The theoretical framework concerning the innovations has been sensibly enriched. Considering the factors which have influenced the need for changes in the productive apparatus and the new features of the economic environment, the existing types of innovations were redefined.
Therefore, the study of the innovation processes has focused on the role of market forces and the features of technologies used for the supply of products and services. Various authors [14] stated the existence of four types of innovation considering the novelty of technology and markets. Hence, we deal with four types of innovations, i.e., (a) incremental innovation, when an existing technology is used to improve a product (service) in an existing market; (b) disruptive innovation, which occurs when firms use new technologies to supply new products in an existent market; the respective products act as a challenge for the traditional products and in the long run tend to replace them; (c) architectural innovation which occurs when firms use existing technology to create new products and in the middle and long run would create new markets; in other words, the firms recreate the architecture of the product to meet and extend the needs of the consumers; (d) radical innovation, when the economic agents use new technologies to supply new products (services) and implicitly open up new markets. It is important to note that, in many cases, innovations occur in the framework of firms as a consequence of the strategic management [15].
Nevertheless, the theoretical constructs related to innovation are continuously growing. For example, OECD [16] distinguishes other types of innovation concerning the improved (new) products, technological processes, marketing methods, workplace organization, business model, and firm’s external relations. The causes of this evolution are the multiplication of the factors sustaining the innovation processes, on the one hand, and the new constraints which have to be overpassed by firms in order to achieve the development of economic activities, on the other hand.
Among the relatively new types of innovation, the literature has increasingly paid attention to the concepts of eco-innovation and frugal innovation. The above-mentioned types of innovation are mainly generated by new conditions which are manifested in the context of the developed countries’ transitions to a post-industrial society, an extension of industrialization to new developing countries, an increasing degree of globalization, and the large-scale implementation of informational communicational technologies. The respective evolution caused the occurrence of important constraints/restrictions on economic growth and one of the most important restrictions is the depletion of natural resources and environmental degradation. In this context, the concept of eco-innovation was considered both by economic theorists and entrepreneurs in their activities, either long-term or day-to-day activities [17].
One of the first definitions of eco-innovation was given by [18], who considered it to be a process in the development of goods or services providing customer and business value but in the context of a significant decrease in environmental impact. The respective definition reveals that the main goal of eco-innovation is maintaining or even extending the utility provided by the economic agents to the final consumers, fixed goods producers, or public authorities at the same time with diminishing of the negative externalities, especially the depletion of natural resources and pollution.
In the context of extended preoccupations for ensuring the sustainability of economic growth and its decoupling from material resource consumption, the study of the features of eco-innovations has represented one of the main aspects of economic and technological research. Therefore, the number of definitions of the concept of eco-innovation has really exploded, as [19] highlighted, in 2007 the number of definitions was 105. The respective trend has continued in our days.
The impressive number of definitions given to eco-innovation is influenced by the higher complexity of the respective phenomenon, from the point of view of causes and economic, technological, and social impact. During the first two decades of the 21st century, the innovation definitions were correlated with the action programs adopted by the international organizations (EU, OECD, UNIDO) to create favourable conditions for the significant reduction in the use of natural resources and the impact of harmful substances in all the fields of economic activities. Additionally, the definitions have considered a wide range of modelling factors and the correlations between eco-innovation and the features of the business model [20].
During the second decade of the 21st century, eco-innovation is seen as one of the main components of the strategies of the European Union dedicated to obtaining a significant increase in resources and energy efficiency and creating a low-carbon society. Therefore, it is possible to create new premises for the survival of the companies [21]. In recent years, the definitions of the above-mentioned type of innovation stress their role in the use of clean technologies and eco-products, the extension of material recycling, and transition to a more circular economy [22].
Eco-innovation can also be examined in connection with frugal innovation. The concept of frugal innovation has originated in the theories of appropriate technologies, designed to ensure the narrowing of gross domestic product per capita gaps between the developed and developing countries. The first clear definition of frugal innovation occurred in the second part of the first decade of the 21st century. Therefore, Ref. [23] defined frugal innovation as the innovation which aims to create new products, services, processes, and even business models which cause a frugal use of materials, low costs of production, and a sparing impact on the environment. In fact, the respective type of innovation is based on the principle “doing more with less”. In this context, most frugal innovations are incremental ones and aim to resolve the constraints which confront local communities.
Frugal innovation has represented a constant concern of the economists and other specialists implicated in the design and implementation of policies for the acceleration of economic growth in developing countries and the raising of the living standard in the case of persons with low incomes. These preoccupations were largely manifested in India, where many concepts were identified, such as Gandhian innovation or Jugaad innovation. These concepts emphasized the idea that, in the context of low-income levels, the innovation processes have to be focused on the cost reduction and increase in the labour content of the products and services. This way, it is possible to obtain a decrease in prices of the products and services and consequently an enlargement of the market and a significant growth in the number of consumers. In other words, frugal innovation could significantly contribute to the democratization of consumption in the context of decreasing the pressure on the natural resources. Therefore, the increase in the labour content of the products and services would contribute to the growth of the number of jobs.
It is important to mention that frugal innovation is not only suitable for developing countries but desirable. One of the main principles of the respective category of innovation can be found in the technique called “Value analysis”, which was largely used by the firms in developed countries in order to reduce the costs of energy consumption in the context of maintaining the utility of the supplied goods or services. The preoccupations for sustaining frugal innovations in developed countries are continuously increasing. The respective evolution is caused by the multiple valences of the frugal innovations concerning the increase in the firm’s competitiveness in the short run, but also provides for environmental protection [24].
The promotion of frugal innovation in developed countries has to consider the particular features of the respective states or provinces, such as environmental concerns, specific needs, and the market structure [23]. Therefore, [25] speaks about “second-degree frugal innovation” in the above-mentioned states or provinces. The respective variety of frugal innovation is determined by the usability, quality, and price variances between the developed and developing countries/provinces. The extension of frugal innovation is also favoured by the constant research of this type of innovation, both in developed and developing countries [26].
Because frugal innovations contribute, in so many cases, to the objectives of ecological innovations, [27] introduced the concept of frugal eco-innovation. Therefore, the above-mentioned variant of innovation is defined as the concept of new products, services, processes, and business models, which are orientated to low costs and minimizing the environmental impact of economic activities and also favour re-using and recycling. It is important to note that frugal eco-innovation has both economic and social impact. It can be either incremental or radical innovation. In fact, frugal eco-innovation can offer one or more solutions for the reduction in material costs. At the same time, it also creates conditions for advancing the economic paradigm of circular economy or an increased corporate responsibility and renewal of the management practices. Hence, the definition and implementation of frugal eco-innovation reveal its complexity and their role in obtaining a sustainable economic growth and the significant reduction in the pressure on the natural environment.
Some experts expressed the opinion that frugal products and services should focus mainly on the customers’ core needs and give up unnecessary complexity while adhering to high quality standards. In this logic, they have predicted a trend towards frugal solutions in some developed countries such as Germany or other Protestant Nordic countries that used to appreciate simplicity of “frugal choices” being considered cultural heritages. Another widespread consensus was that frugal innovations are necessary to secure long-term competitiveness of German companies in fast-growing, unsaturated markets in the emerging economies [28]. It was realized that an overwhelming reliance on tech-driven products and high complexity may act as a prevailing obstacle in implementing frugality in products that are going to be exported.
The recycling represents one of the main factors acting for a steady decrease in the material footprint. The respective process is modelled by several factors, such as (a) the development of new technologies which allow the extension of recycling processes to new kind of waste, which can be transformed in raw or secondary materials, (b) the changes in the institutional framework in order to favour the extension of the recycling processes, (c) the transformation of the business model in such a way to create favourable conditions for the implication of entrepreneurs in the recycling activities [29,30]. There are defined a considerable number of recycling indicators considering the content of recycling processes and other features of the recycled materials and recycling technologies. The most often used indicator at the macroeconomic level is circular material use rate, being defined by Eurostat as the share of material recycled and fed back into the economy—thus saving the extraction of primary raw materials—in overall material use. The above-mentioned indicator is seen as a monitor of member states progress towards circular economy implementation.

3. Materials and Methods

3.1. Data Used

The data and information used for the analysis are provided mainly by the Eurostat database. The analysis of the indicators was made for the periods that are available in the database (longer samples provide better information in regard with the evolution of the indicator). A regression panel model was developed, including 27 EU countries for a period of 10 years (2010–2019). For this timeframe, the date samples are overlapping. The dependent variable is material footprint and the independent regressors are circular material use and eco-innovation (Table 1).

3.1.1. Material Footprint

According to Eurostat [31,32], the material footprint (MF) indicator measures the global demand for material extracted (biomass, metal ores, non-metallic minerals, and fossil energy materials/carriers) in order to satisfy investment by households, governments, and businesses in the EU. Raw material consumption is a measure of material footprints, being calculated as raw material input minus exports (calculated at the aggregate product level, by material). The indicator gives an understanding about the quantity and type of materials needed to meet the request for products in each economy. It is measured in tonnes per capita and covers the period 2008–2019 (Figure 1). Figure 1 shows that EU member states could be clustered in several groups, depending on the average values recorded in the period 2008–2019. The highest value is found in Finland (34.4 tonnes/capita) and Luxemburg (31.5 tonnes/capita). The second group includes countries which have recorded high values for material footprint, with averages between 20 and 26 tonnes/capita (Romania, Denmark, Sweden, Cyprus, Austria, and Estonia). The third group includes 10 countries that recorded average values between 15 tonnes/capita and 18.6 tonnes/capita. It is important to notice that Germany, the biggest EU country, has a value situated at the bottom of the third group (15.6 tonnes/capita). The fourth group is composed of eight countries with the material footprint indicator in the lower range of 11.5–14 tonnes/capita. Some of the biggest economies of the EU (France, Italy, Spain) are in this group. The lowest value of the indicator (average of 8.4 tonnes/capita) is documented in the Netherlands.
At the aggregate level of the EU, the MF recorded a slow descending evolution: from an average value of 17.86 tonnes/capita in 2008 to 14.57 tonnes/capita in 2019, which means a reduction of 3.28 tonnes/capita (18.37%) in 12 years.
It is important to mention that the material footprint series is stationary, having no unit root. According to the test carried out by Levin, Lin, and Chu [33], the probability of a unit root for material footprint series (with individual intercept) is zero (Appendix A).

3.1.2. Eco-Innovation

Eco-innovation is one of the leading approaches to promote resource and energy efficiency and create a low-carbon society in the EU. The occurrence of a growing number of patents related to recycling and secondary raw materials creates good conditions for a sensible increase in resource productivity and the reduction in GHG emissions. In this context, there are positive economic and social effects, such as employment increases and the development of exports or increasing of gross domestic product. The number of patents also depends on the size of population, among other factors of influence. Theoretically, a country with a large number of citizens would have a higher potential to innovate and produce a larger number of patents in comparison to a country with a smaller number of citizens. Hence, in order to have feasible similarity in the eco-innovation capacity of the considered countries, the number of patents related to population was used [24].
In this paper, eco-innovation is measured by the number of patents related to recycling and secondary raw materials: the analysis timeframe is 2000–2019, measured as patents to 1 mil. inhabitants. Figure 2 represents the eco-innovation indicator for the EU member states. During 2000–2019 (20 years), the eco-innovation indicator did not change much. In 2000, 288.37 recycling-related patents were registered in the EU-27, while in 2019 the number of patents increased to 295.32. The average value of the indicator, for the period 2000–2019, is 0.656 patents/1 mil. inhabitants.
Figure 2 highlights a miscellaneous representation of eco-innovation, taking into consideration the country average values for the period 2000–2019. Finland is the country with the highest value for eco-innovation in this period; the number of patents is, on average, 2.15/patents/1 mil. inhab/year. Some other countries with good indicators for eco-innovation are Austria and Germany with 1.21 patents/1 mil. inhab/year, the Czech Republic and the Netherlands with 1.0 patents/1 mil. inhab/year, and Denmark with 0.87 patents/1 mil. inhab/year. A low value for eco-innovation is reported in Greece, Bulgaria, and Croatia (less than 0.1 patents/1 mil. inhab/year).
It should be mentioned that the eco-innovation series is stationary, having no unit root. According to the Levin, Lin, and Chu [33] test, the probability of a unit root for the eco-innovation series is zero (with individual intercept) (Appendix A).

3.1.3. Circular Material Use Rate

In this paper, material recycling is measured by the global indicator circular material use rate (CMUR) which is included in the section Secondary Raw Materials, part of Circular Economy data set [31,32]. The indicator was developed in order to give an overall indicator to measure circular economy. According to the Eurostat definition, the indicator circular material use rate is the share of material recovered and fed back into the economy—thus saving the extraction of primary raw materials—in total material use. CMUR, also identified as circularity rate, is measured in percentage. There are other specific indicators for measuring the recycling of various waste fractions, such as municipal waste, packaging, and electric and electronic waste. In this paper, CMUR is used as an indicator for general recycling.
It is clear that a higher value for CMUR shows the use of more recycled materials as a substitute for primary raw materials, thus reducing the environmental impact derived from extracting raw resources.
Figure 3 presents the CMUR graphs for EU member states for the period 2010–2020. For this timeframe, the EU average of CMUR was 11.41%. The indicator had a slow evolution: from a value of 10.8% in 2010 to 12.8% in 2020. That shows a 2% increase over 11 years. The performance of the member states is miscellaneous. The best performer is the Netherlands, which has the highest value—30.9% for the year 2020—showing a 5.6% increase from 25.3% in 2010. In 2020, high values are also recorded by several countries including: Belgium (24%), France (22.2%), and Italy (21.6%). In this context, Germany is still dependent on raw materials for production, due to a low circular material use rate (13.4% in 2020), despite the high rate of waste recycling [34,35].
Some other countries documented low values and limited evolution. For instance, values recorded in 2020 for CMUR are very low in Bulgaria (2.6%), Cyprus (3.4%), Ireland (1.8%), Portugal (2.2%), and Romania (1.3%). For this group of countries, a minor positive trend was recorded during the analyzed period of time.
Nevertheless, other countries recorded a negative trend. For example, Finland recorded an important decline in CMUR, from 13.5% in 2010 to 6.2% in 2020 and Sweden recorded a slight decline from 7.2% to 7.1%. Luxembourg has the sharpest decline, from 24.1% to 13.6% (−43.56%). There are no clear explanations for negative trends of the CMUR. Nevertheless, it could be explained by changes in reporting methodology.
It is useful to underline that the circular material use series is stationary, having no unit root. According to the Levin, Lin, and Chu [33] test, the probability of a unit root for CMUR series is zero (with individual intercept) (Appendix A).

4. Results

4.1. Methodology

As mentioned before, the goal of this research is to estimate the influence of two independent regressors (eco-innovation and CMUR) on the dependent variable material footprint (MF). In the context of the green transformation of EU economies, the decrease in the MF is obvious but with significant particularities among national economies. For this goal, the authors constructed and tested a panel-type regression model [34], which considers 27 EU countries, for the period 2010–2019:
Yit = αi+ β Xit + γ Zit + Uit
where
  • Yit = MFit—material footprint (t/cap) will be the dependent variable;
  • Xit = CMURit—rate of the circular material use (%) will be one independent variable;
  • Zit = PATENTSit—eco-innovation—(patents/1 mil. inhab) will be the second independent variable;
  • Uit—is the error associated to the model;
  • i—represents transversal variables (countries) and
  • t represents time.
The variable CMUR is considered an indicator that points to the efforts made in each economy to reintroduce and reuse recyclable materials into the economic flows. The result of this is the reduction in the consumption of material resources so MF will be diminished. The second regressor, eco-innovation, shows the effect of new techniques and technologies on reducing material footprint. Both regressors would influence the MF in a downward trend so it is expected that the two coefficients of the regressors (β and γ) will be negative. As mentioned earlier, all three series considered are stationary in levels (I (0)), therefore the Ordinary Least Square method will be used to illustrate a long run relationship.
The model described in Equation (1) is a pooled model in which one equation describes the whole 27 cross-section components (countries). In this model, it is not possible to distinguish among the transversal components (countries). By carrying out this pooling, the model denies the heterogeneity or individuality that may be present among the EU countries (α is a time constant in Equation (1)). From this basic pooled model, it is possible to derive specific models that allow the identification of individual equations for each of the 27 countries within the pool. For instance, a fixed effect (FE) model can be considered in order to take advantage of the option to detect the individual country effects. These specific effects are included in the intercept (αi) of the Equation (1) being time invariant. Therefore, for each country, the distinct equations having a country specific intercept (αi) can be calculated. The two slopes (β and γ) will be the same for all countries.
Another model would be the random effect (RE) model. This is based on the hypothesis that the individual specific effects (αi) are distributed autonomously in regard to the regressors and are included in the error term. The RE model is as follows:
Yit = β Xit + γ Zit + (αi + Uit)
Our approach is to accept the coefficients of the model if they are statistically significant at 0.1 level (10%).
In order to determine what model is most suitable, the following tests were performed: the Breusch–Pagan test to verify if there are cross-section effects in the model and the Hausman test to see if RE model is appropriate or not.
The Breusch–Pagan test was applied to the polled OLS model, presented in Table 2; the H0 is no cross-section effects. As shown, the Breusch–Pagan test for cross-section has the value 527.56 which indicates a null probability (p < 0.0000). Both probabilities (cross-section and time) are null; therefore, the H0 is rejected, and the alternative hypothesis Ha is accepted: there are cross-section effects in this model. The next step will be to differentiate between random effect model and fixed effect model and for that, the Hausman test will be used.
Table 3 presents the Hausman test for the model. In this test, H0 is as follows: the random effect model is appropriate and Ha is the individual effects (Ui), significantly correlated with at least one regressor. In the case of Ha, the random effect model is problematic; therefore, it is better to turn toward the fixed effect model. From Table 3 it can be noticed that H0 has a value of 24.852 for Chi-stat. This value has a probability near zero (p < 0.0000), which means that H0 is rejected, and Ha is accepted. This means that the model will be a panel with fixed effects.

4.2. Model Used and Results

As a result of the tests mentioned above, the authors have concluded that the fixed effects model is the most appropriate (Equation (1)). The main statistics and the parameters of the model are in Table 4. All coefficients are statistically significant up to the probability limit of 10%. In addition, the adjusted R-squared has a value of 0.945906 meaning that the variation in the dependent variable is well explained by the regressors. The F-statistic, which has a null hypothesis that all coefficients of the model are zero, has a value of 168.9935. The probability for this value of F-statistic is 0.0000; therefore, the null can be confidently rejected. Thus, it can be concluded that the model is reliable, and the coefficients of the model are not zero.
Hence, we conclude that the panel model with fixed effects has a substantial goodness-of-fit and is accepted as a final model. The model is represented by the Equation (3).
MATERIAL_FOOTPRINT = 18.877232 − 0.100363 × CIRCULAR_MAT_USE − 0.419239 × PATENTS_RECYCL_CAP
Important information can be extracted from the accepted model (panel EGLS cross-section weights):
  • Both regressors are negative, signalling that any increase in circular material use rate or in eco-innovation (measured by patents) will determine a reduction in the material footprint; this is in concordance with the basic initial hypothesis;
  • In the case of zero circular material use rate and no eco-innovation, the material footprint is positive and is expected to have a value equal to the intercept (18.877232 tonnes/capita) (p < 0.001); the intercept could be seen as an average value for the group of 27 countries taken into consideration; this value is the starting point before recycling and eco-innovation gets underway;
  • For 10% increase in the recycling activities (CMUR) the material footprint will decrease with 1 tonne/capita (p < 0.100), holding all other variables constant;
  • For 10% increase in eco-innovation, the material footprint will decrease with 4.192 tonnes/capita (p < 0.050); holding all other variables constant.
While the fixed effect model fits the data well; it may be assumed that each country has a different intercept, when the two slopes are constant. Therefore, each country, out of the 27 considered, has its own initial material footprint that is significantly different from those of other countries.

4.3. Discussion on Heterogeneity among EU Countries

As mentioned in several studies [35,36], the FE model, as compared with the pooled OLS model, captured the presence of differences/heterogeneity across countries or over time. Our FE model provides for heterogeneity among the 27 countries used in this analysis. The EGLS equation gives the possibility to analyze the whole group of 27 countries without any possibility to identify the heterogeneity.
The general intercept of the model (C = 18.877 tonnes/capita) represents an average for the countries analyzed as a group. Cross-section effects represent the deviation of each country from this average value of the whole group. For the two slopes of the model, CMUR (−0.100363) and eco-innovation (−0.419239) are constant for all countries. Nevertheless, if individual intercept is calculated, a separate equation can be determined for each country.
The deviation from the general intercept of the model for all 27 countries analyzed was calculated in the Appendix B. The sum of the deviations from the intercept is practically equal to zero. Based on these values, the individual intercept for each country was calculated and is displayed in Figure 4.
The value of the intercept could be interpreted as the base value for material footprint from where a country may evolve in time, if eco-innovation and recycling will progress. It is obvious that a smaller value is preferable, showing that a country has a lower base for the start, in order to reduce the consumption of raw materials required to meet the demand for products.
The data set for the intercept, calculated for the 27 countries, has a minimum of 11.31 tonnes/capita and a maximum of 35.64 tonnes/capita. The coefficient of variation for this set of values is 32.65%.
The lowest intercept is found in the Netherlands (11.31 tonnes/capita), a country that has the highest rate of material recycling (CMUR was 30.2% in 2020). Lower values of the intercept could be found in countries including Spain (11.35 tonnes/capita), Malta (13.01 tonnes/capita), Croatia (13.09 tonnes/capita), Hungary (13.22 tonnes/capita), and Italy (13.80 tonnes/capita). Figure 4 highlights that 18 countries are under the average (18.88 tonnes/capita) and 9 countries recorded higher values than the average. In the higher than average category, the following countries are included: Finland (has the highest value for the intercept 35.64 tonnes/capita or almost double related to the average), Luxembourg (34.26 tonnes/capita), Austria (26.56 tonnes/capita), and Estonia (27.45 tonnes/capita).
After calculating the intercepts, the individual equation for each country can be written, as follows:
MATERIAL_FOOTPRINTNetherlands = 11.3122 − 0.100363 × CIRCULAR_MAT_USE − 0.419239 × PATENTS_RECYCL_CAP
MATERIAL_FOOTPRINTGermany = 17.3694 − 0.100363 × CIRCULAR_MAT_USE − 0.419239 × PATENTS_RECYCL_CAP
MATERIAL_FOOTPRINTDenmark = 21.8435 − 0.100363 × CIRCULAR_MAT_USE − 0.419239 × PATENTS_RECYCL_CAP
MATERIAL_FOOTPRINTFinland = 35.6407 − 0.100363 × CIRCULAR_MAT_USE − 0.419239 × PATENTS_RECYCL_CAP
Therefore, depending on the requirements and needs, it can be used one equation that describe the behaviour of all 27 countries as a group or 27 individual equations, one for each country.

5. Conclusions

This paper brings new considerations regarding the factors that have an influence on raw material consumption measured by the material footprint indicator. The two factors that were analyzed are eco-innovation and circular material use within EU countries.
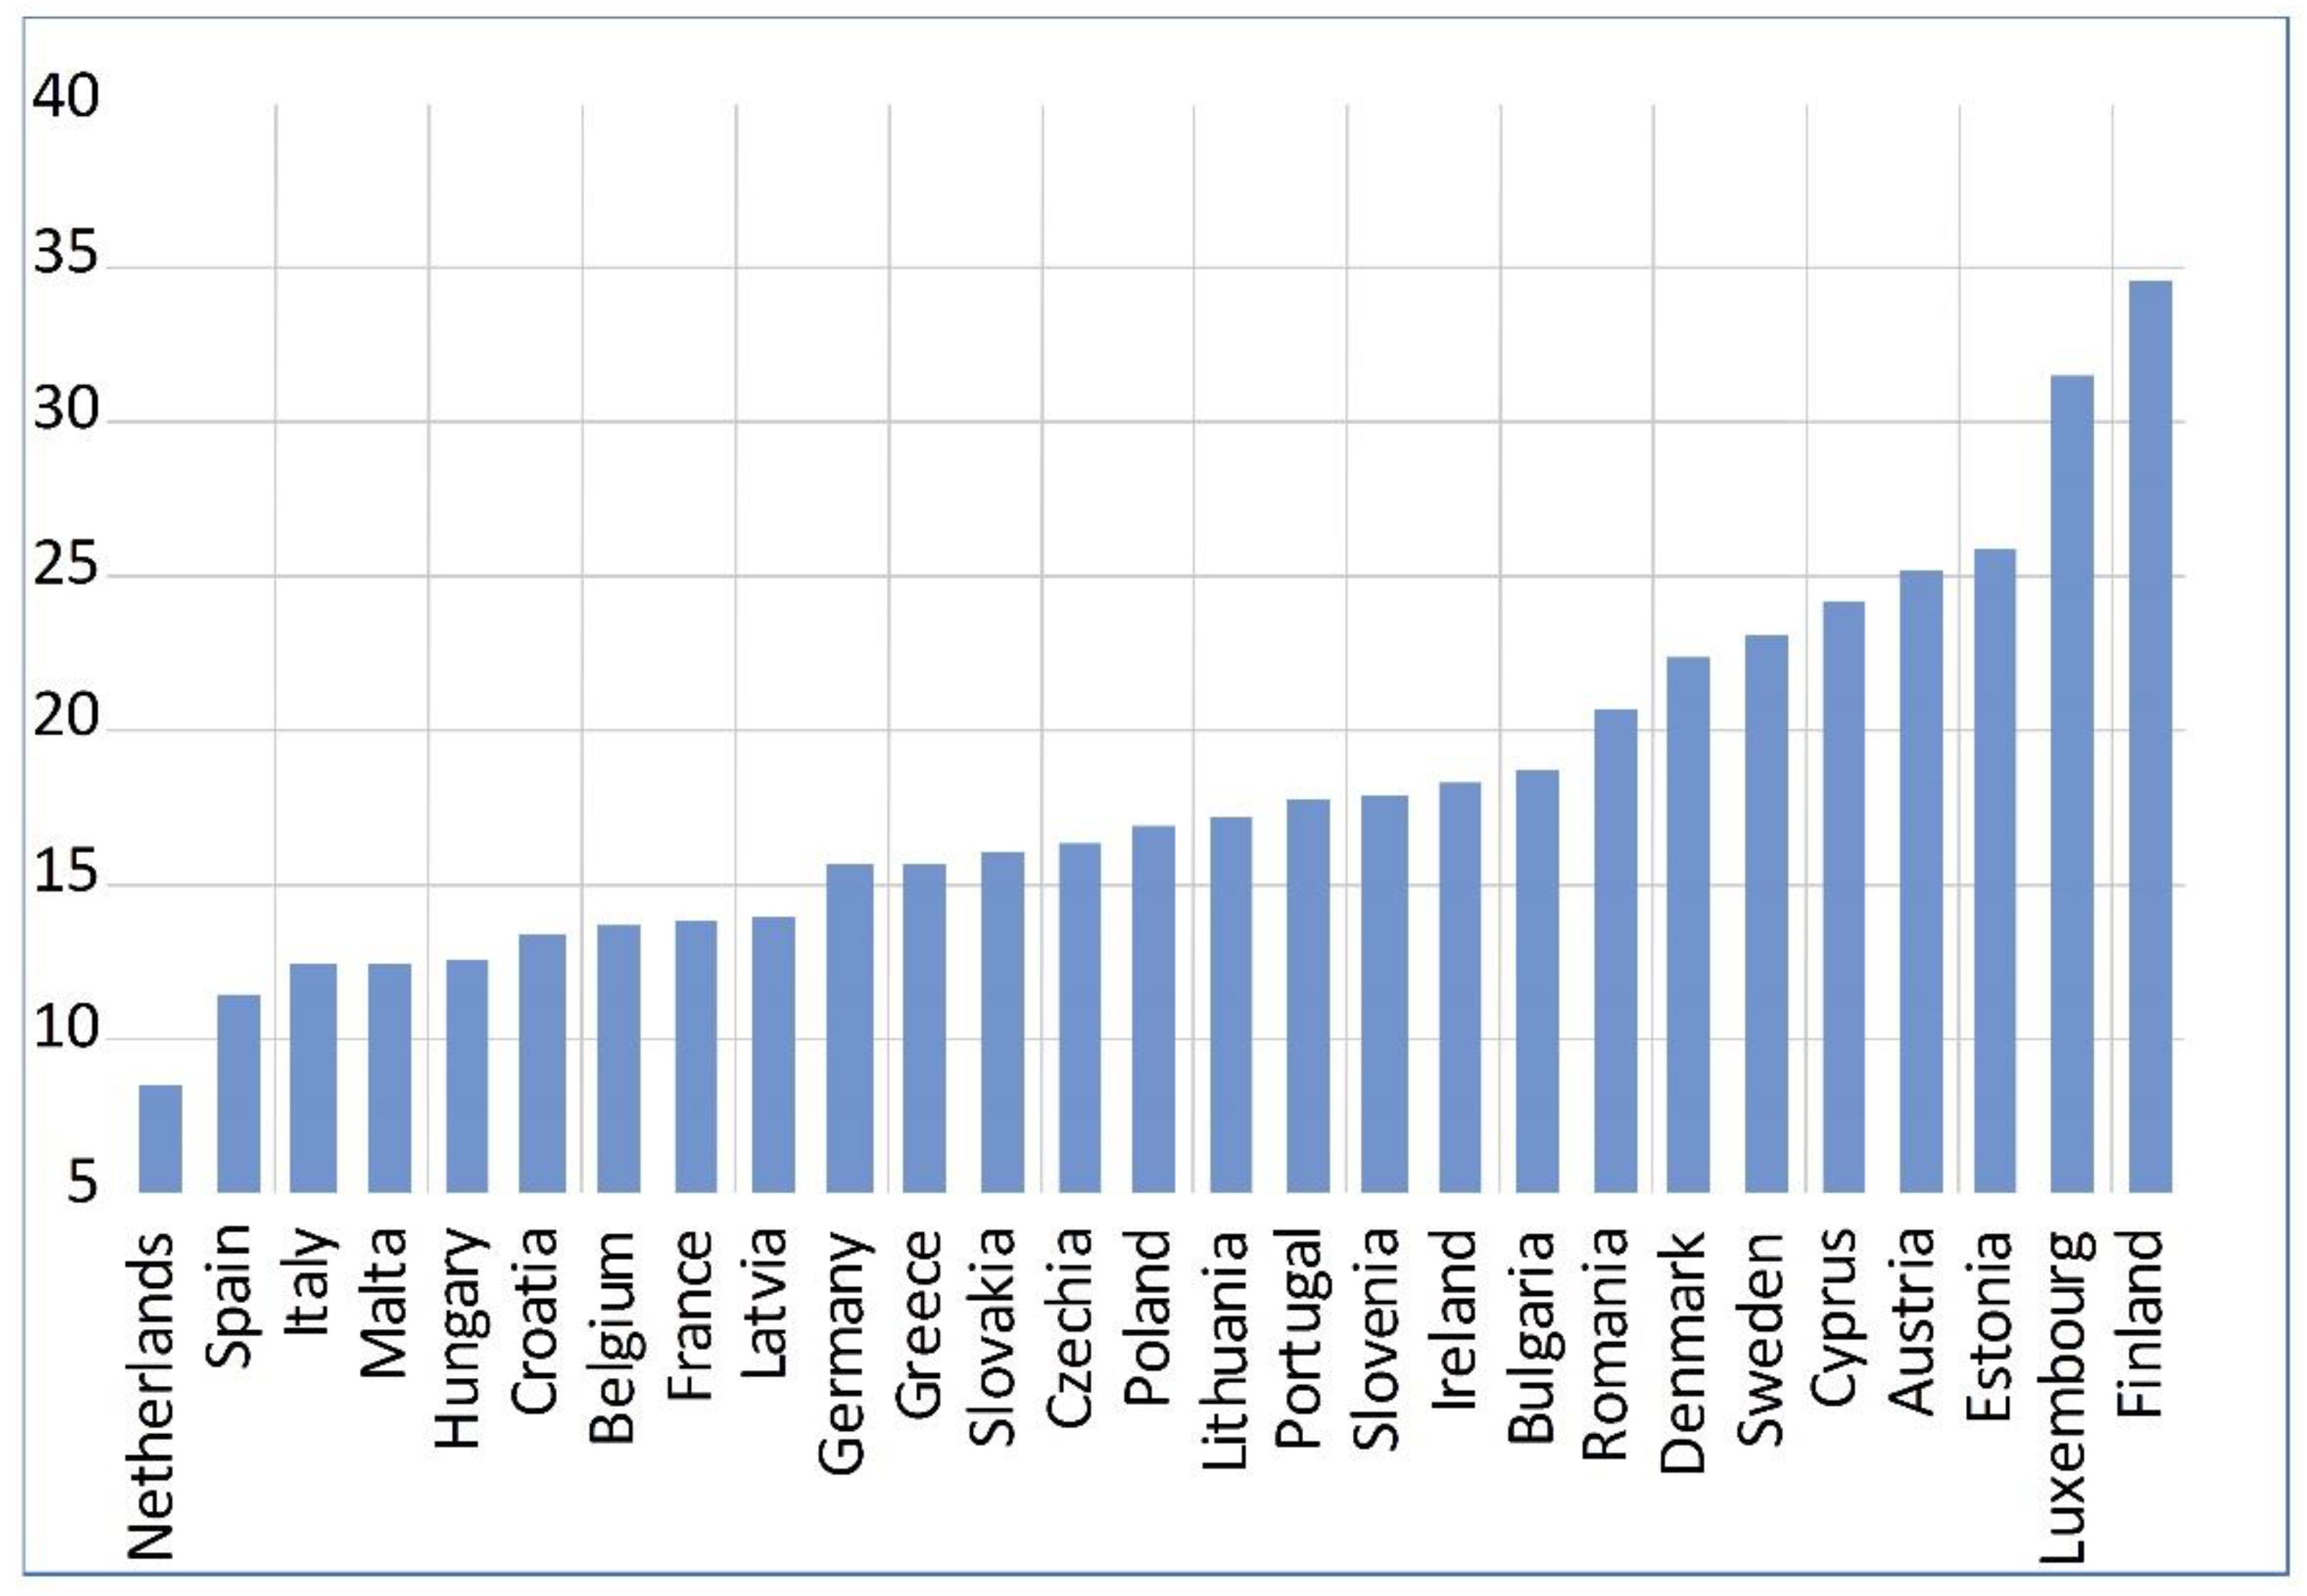
Analyzing the material footprint indicator for the period 2008–2019, the authors found that the highest average values are recorded in Finland (34.4 tonnes/capita) and Luxemburg (31.5 tonnes/capita). There is a group of countries which have recorded high average values for material footprint, between 20 and 26 tonnes/capita (Romania, Denmark, Sweden, Cyprus, Austria, Estonia). The third group includes 10 countries that recorded average values between 15 tonnes/capita and 18.6 tonnes/capita. The most favourable situation was found within a group composed of eight countries, where the material footprint average is in the range of 11.5–14 tonnes/capita. In this group are some of the biggest economies of the EU (France, Italy, Spain). The lowest value of the indicator (average value of 8.4 tonnes/capita) is recorded in the Netherlands. In our model, material footprint was the dependent variable.
Examining more thoroughly the two independent regressors selected (eco-innovation and recycling), the authors found a pattern of uneven distribution among member states.
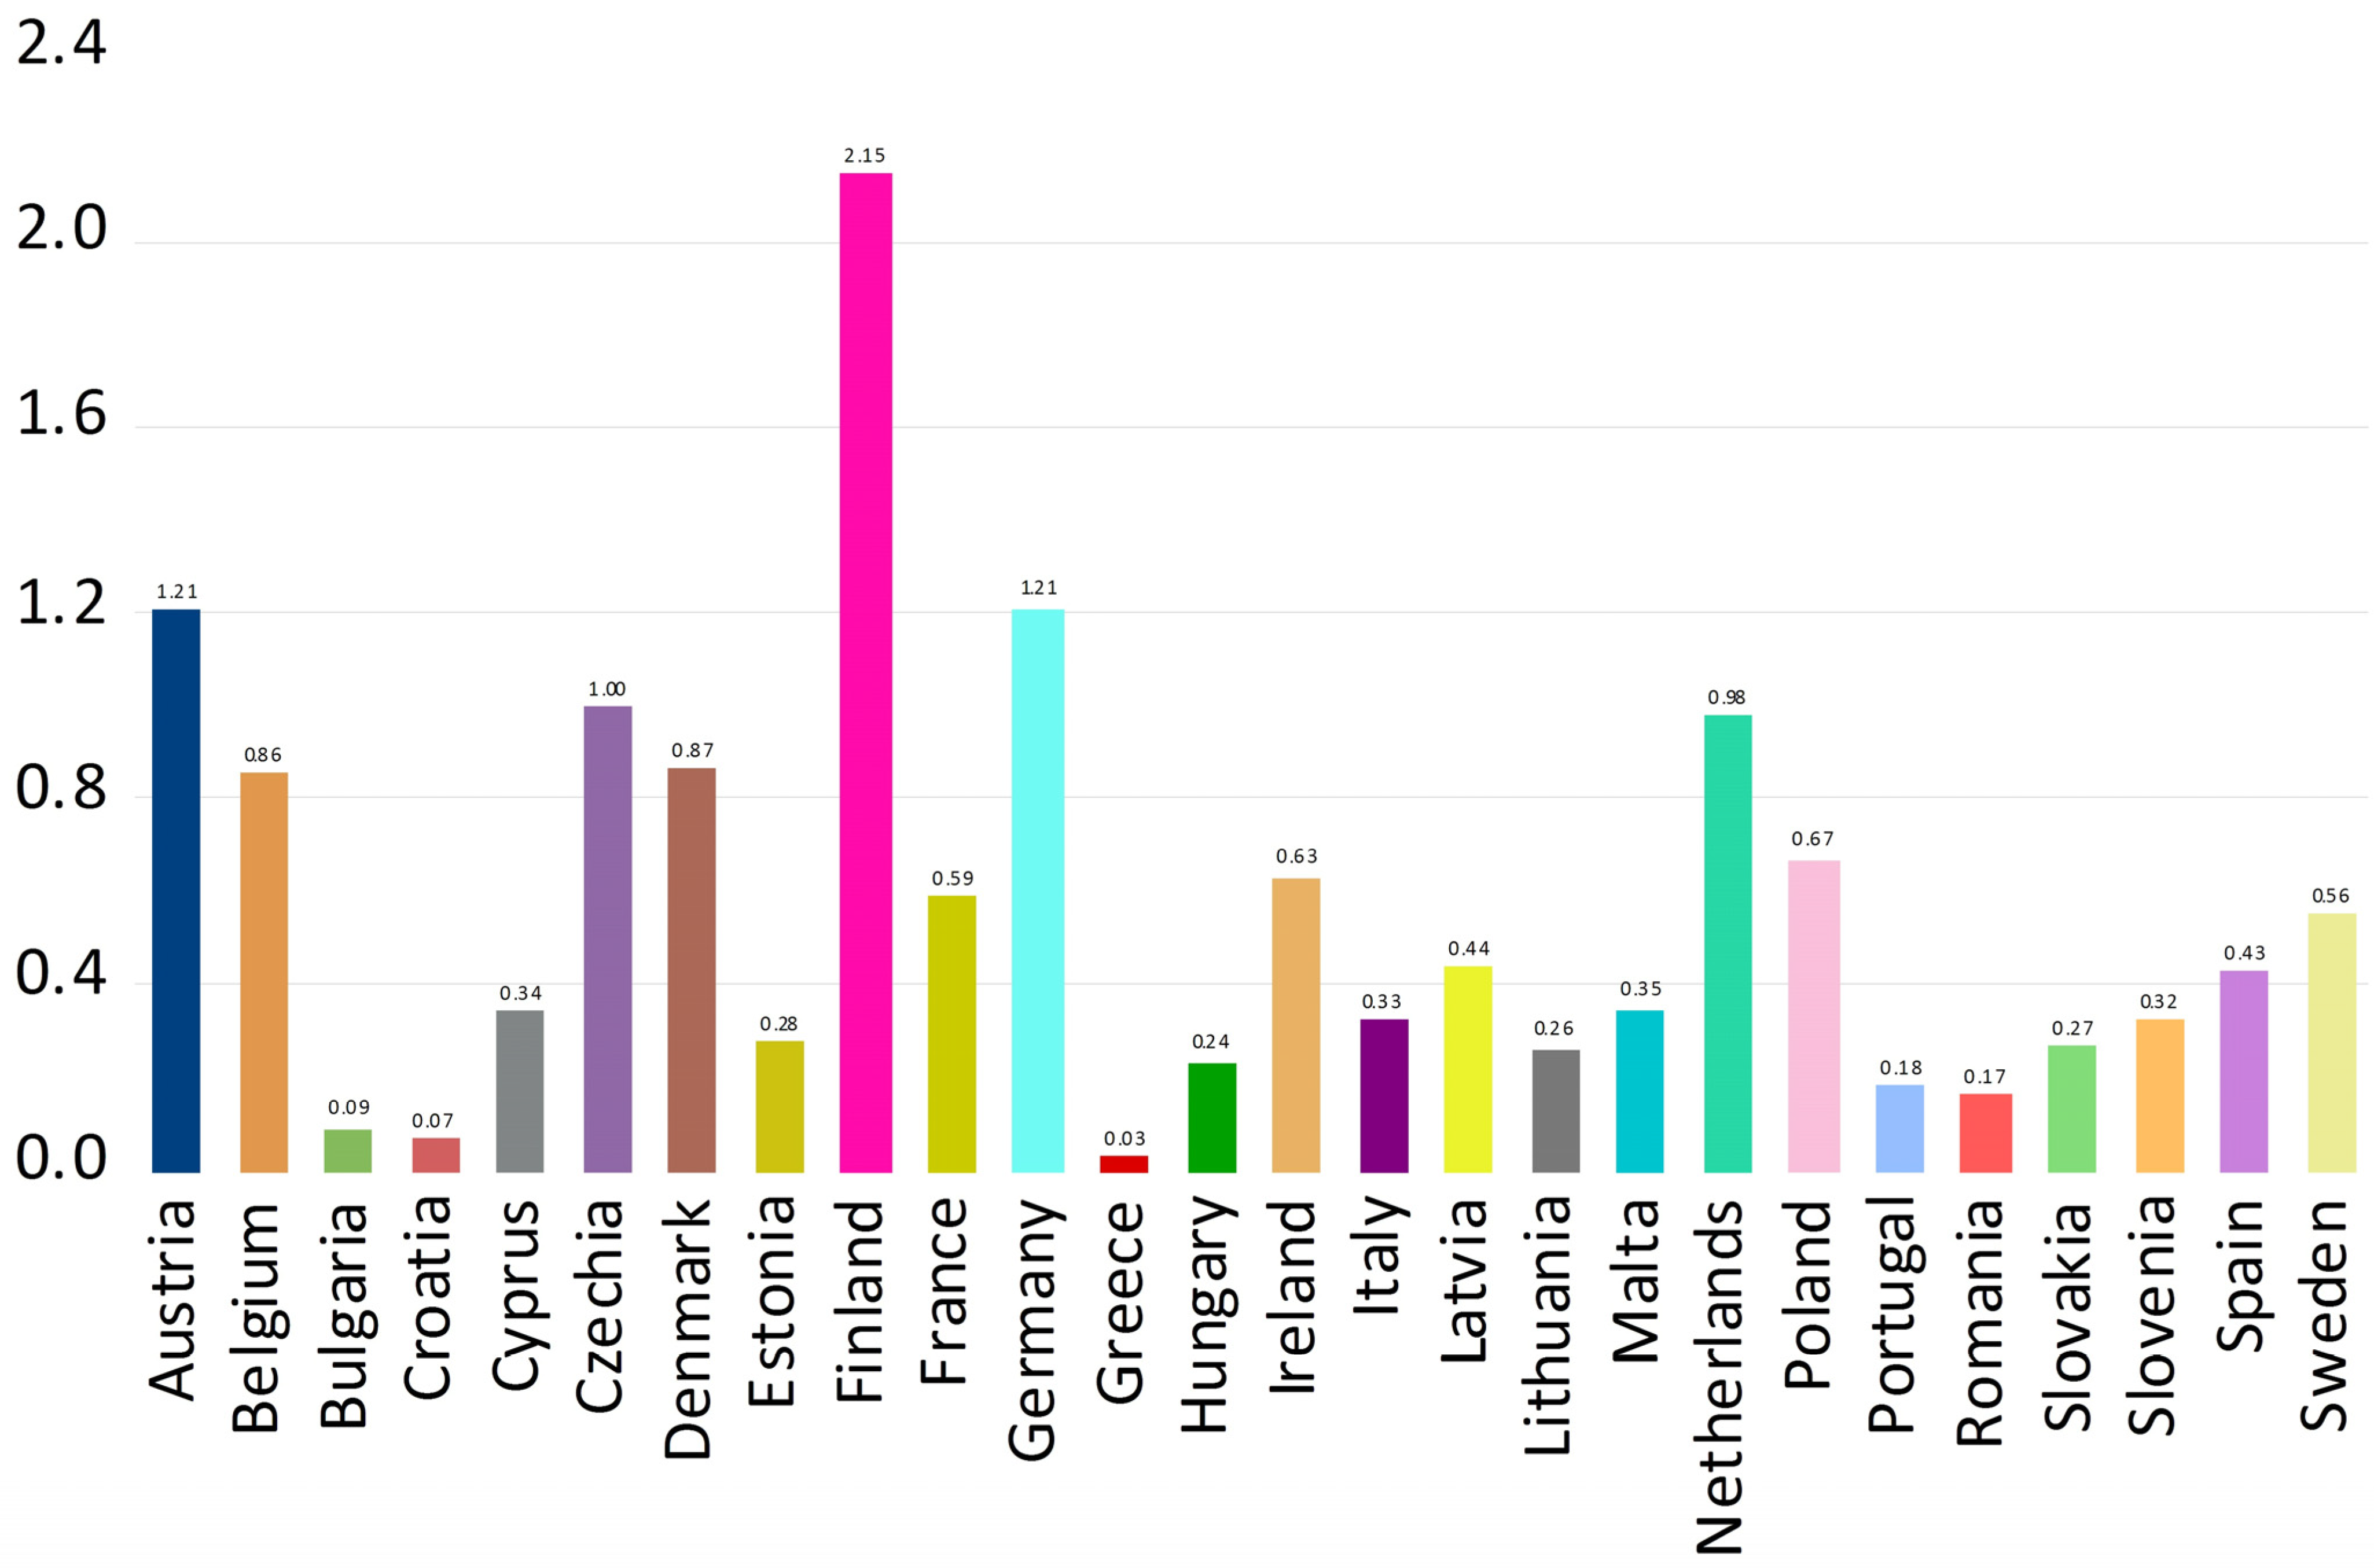
The first important indicator selected as a regressor was eco-innovation. From the analysis performed for the 27 EU countries, a positive trend was discovered, in regard to eco-innovation, during the 2000–2019 timeframe. In this period, Finland was the country with the highest rate for eco-innovation; the average number of patents was 2.1 patents/1 mil. inhab/year. Some other EU countries with good indicators for eco-innovation are Austria and Germany with 1.2 patents/1 mil. inhab/year, the Czech Republic and the Netherlands with 1.0 patents/1 mil. inhab/year, and Denmark with 0.9 patents/1 mil. inhab/year. A low value for eco-innovation was reported in Greece, Bulgaria, and Croatia (less than 0.1 patents/1 mil. inhab/year).
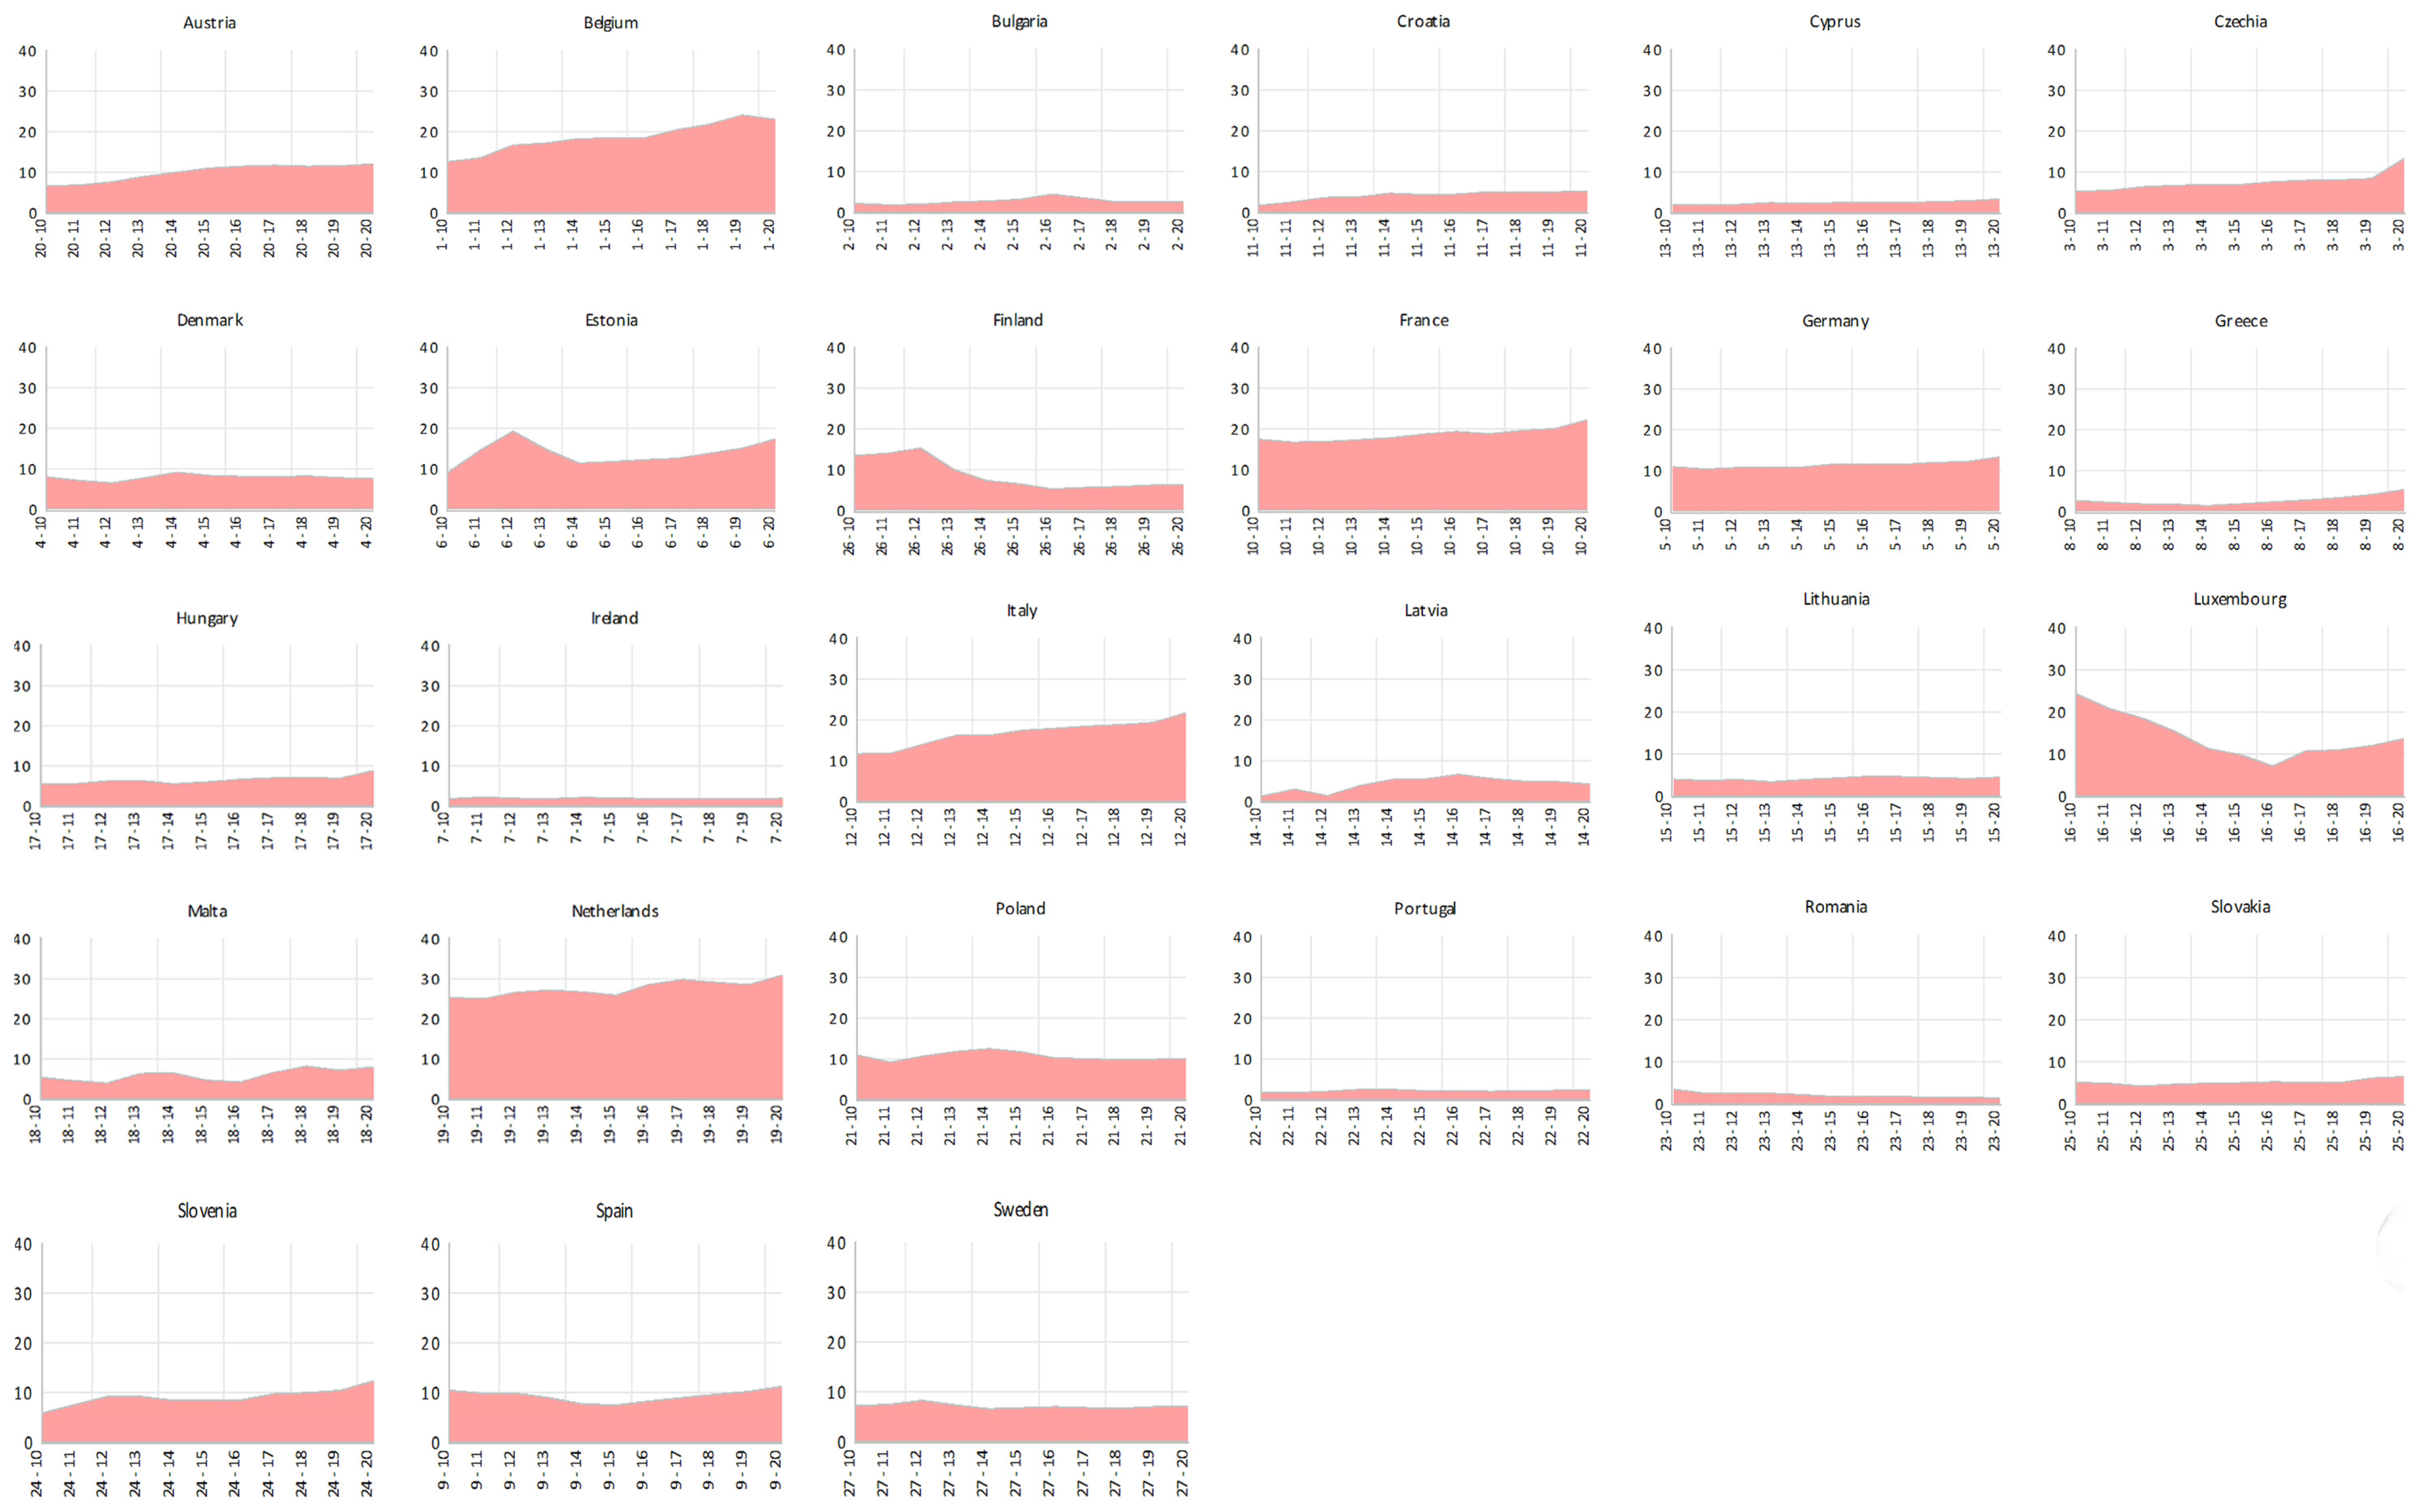
The second significant Indicator selected as a regressor was circular material use, which has a substantial influence on the reduction in the material footprint. For the period 2010–2020, the whole EU has recorded an average circularity rate of 11.41%. The indicator had a slow evolution: from a value of 10.8% in 2010 to 12.8% in 2020, meaning a 2% increase over 11 years. The performance of the member states was not even. The Netherlands is the country that is the best performer with the highest value (30.9%) for the year 2020, showing a 5.6% increase from 25.3% in 2010. High values are recorded in 2020 by several countries including Belgium (24%), France (22.2%), and Italy (21.6%). Some other countries documented low values and limited evolution: (Bulgaria (2.6%), Cyprus (3.4%), Ireland (1.8%), Portugal (2.2%), and Romania (1.3%). For this last group of countries, in the period 2010–2020, a minor positive trend is worth mentioning.
In this paper, a panel data regression analysis was performed for the 27 EU countries and the time period of 10 years (2010–2019). The model was developed to explore the influence of two regressors on material footprint. The four-step analysis followed these stages: first—visual analysis of the data and drawing graphs; second—identification of the proper model to be used by comparing OLS pooled model with the FE model and RE model; third—selection of the most appropriate model which is the FE model; and fourth—debating the heterogeneity among EU countries. This was followed by the discussion and interpretation of the results.
The most appropriate model for this research was found to be the FE model, which accounts for heterogeneity among the 27 countries used in the analysis. The model showed how much the material footprint is influenced by the two regressors selected (eco-innovation and CMUR). The model presented as Equation (3) has all the coefficients statistically significant for 10% probability. Goodness-of-fit gave the information that the model fits data well. The F-test shows that the model is significant and R2 has a value of 0.9459, meaning that a high proportion in the variation of the dependent variable is explained by the two regressors.
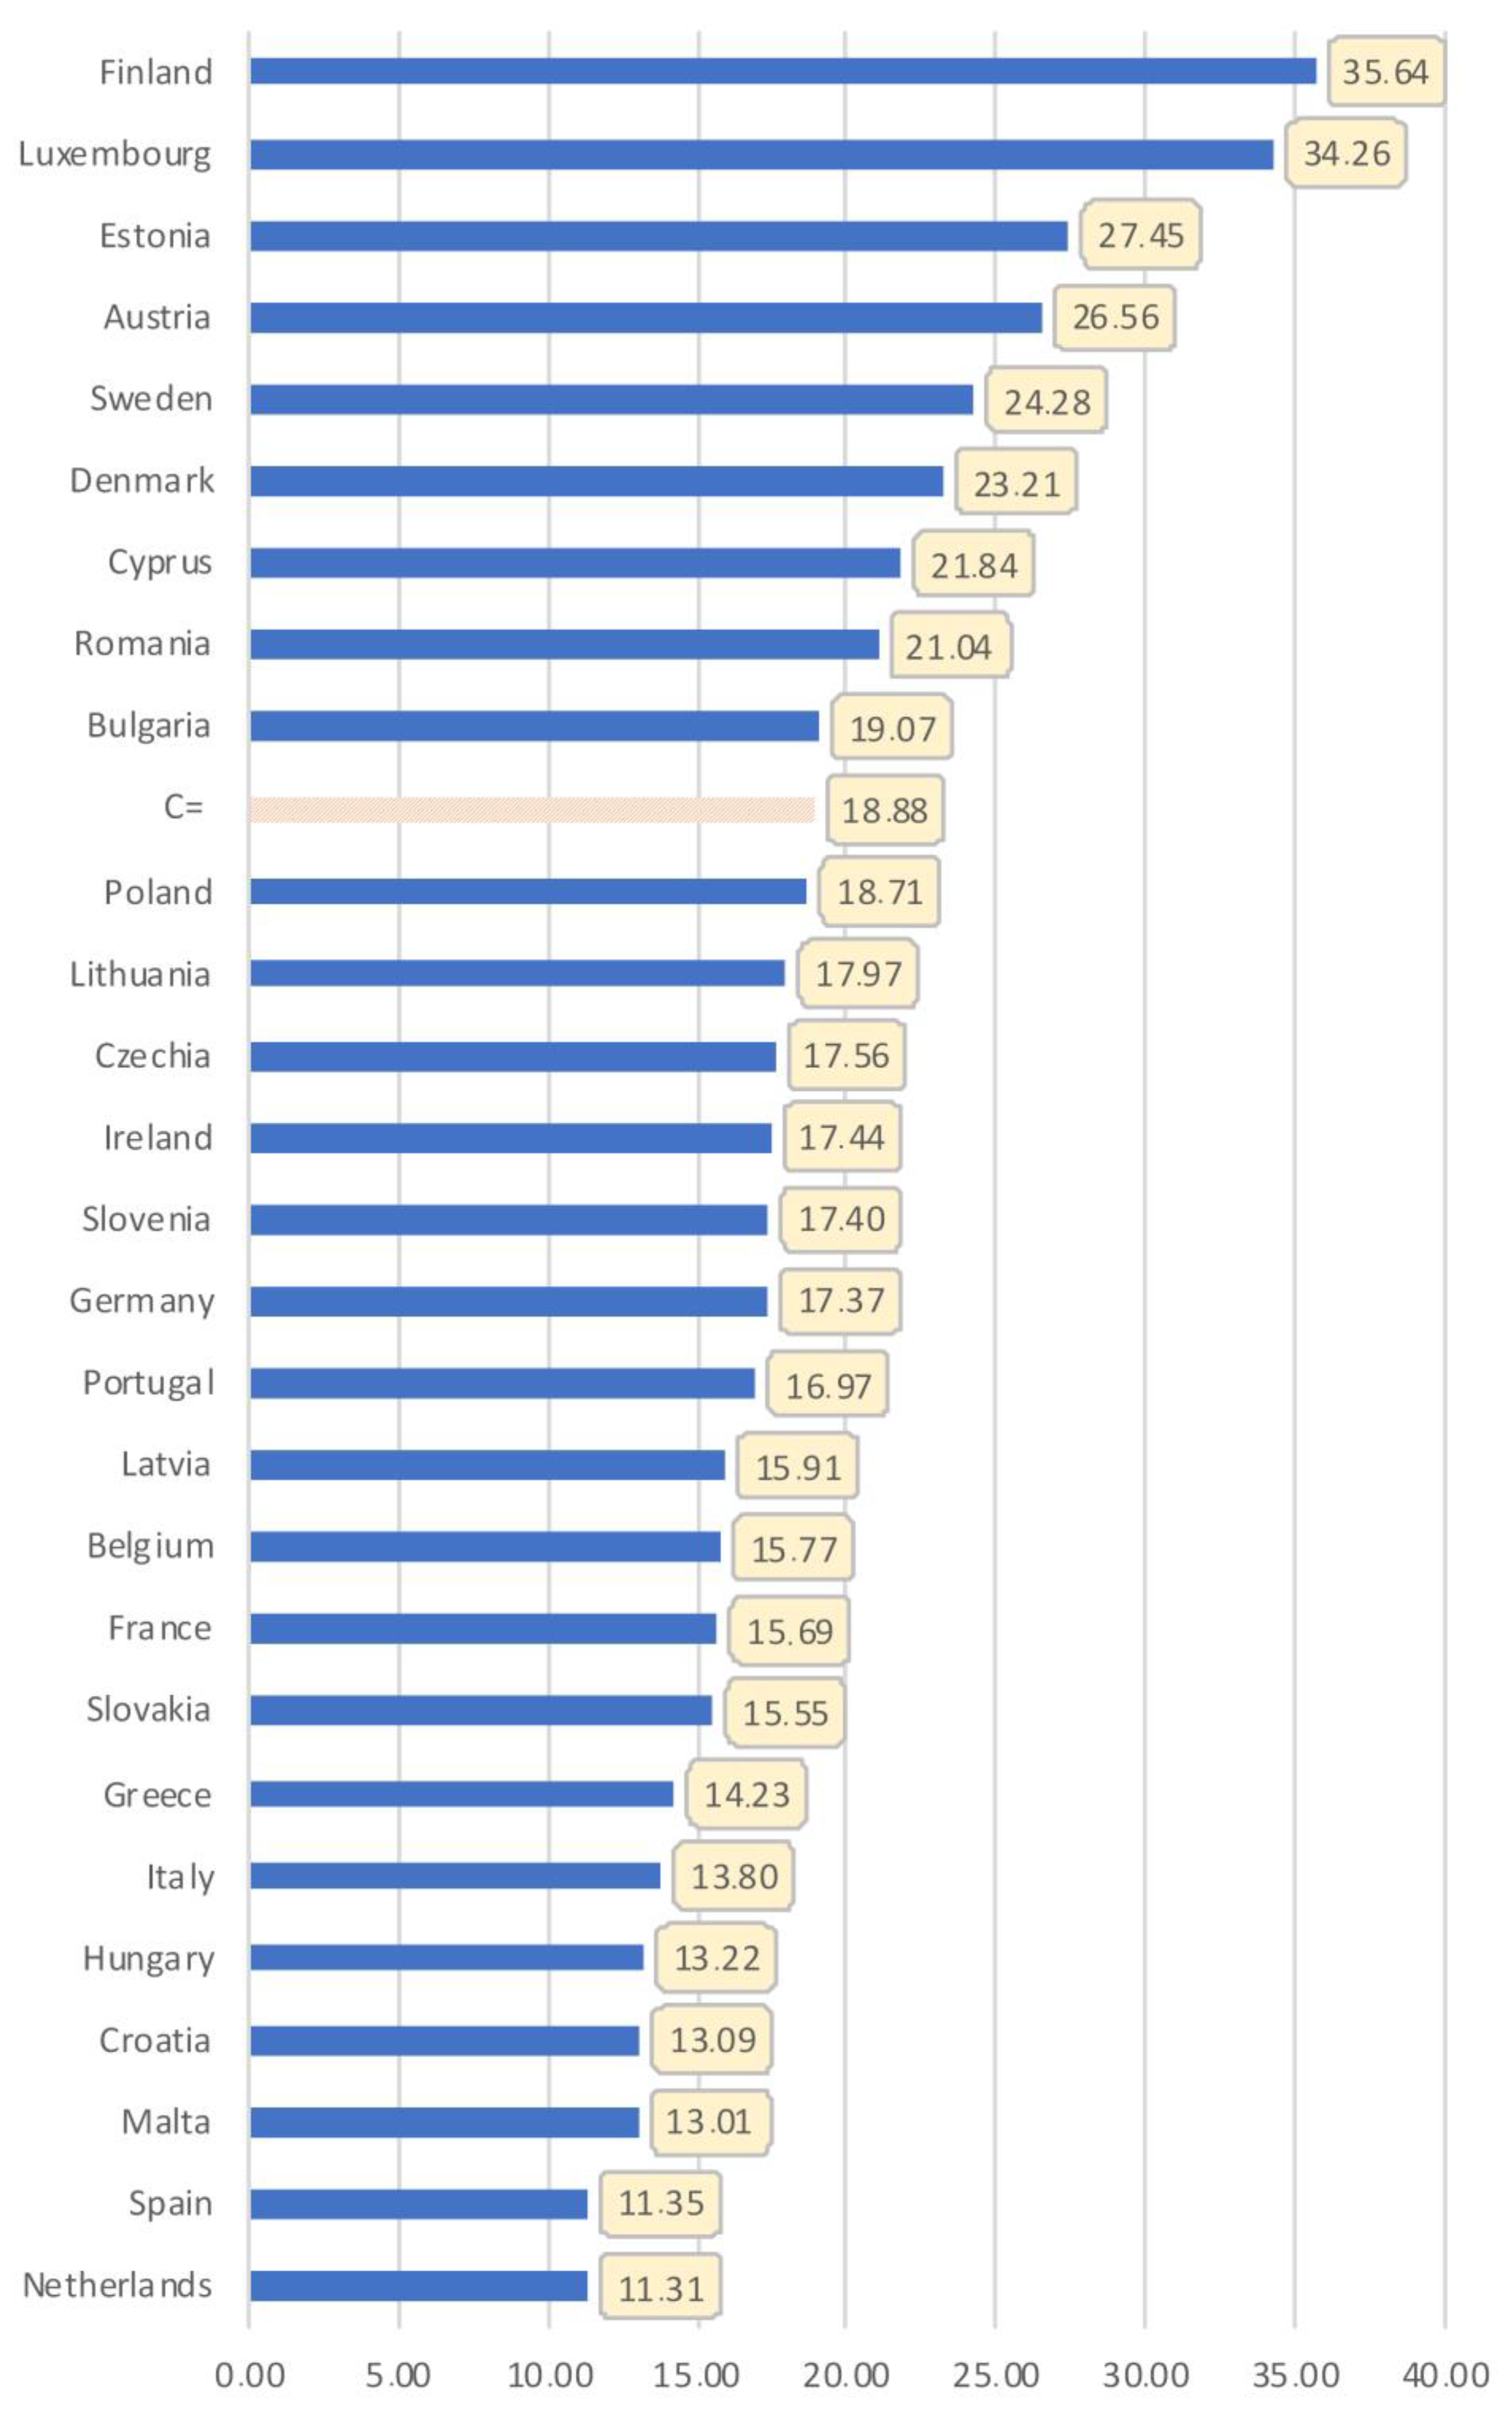
The intercept of the FE model was positive (18.8772 tonnes/capita); this could be interpreted as an initial average value of the material footprint for the 27 countries analyzed, in the absence of recycling and eco-innovation. If these two activities start to manifest their influence, then there will be a constant reduction in the material footprint from this initial value. The authors highlight that a reduction in the material footprint is due to a downward influence of both regressors: eco-innovation has a negative slope of −0.4192 and CMUR has a negative slope of −0.1003. The general model could be applied to the whole group of 27 countries that are EU members.
There was a significant heterogeneity among member states which is highlighted in the intercept, which is constant in time, according to the fixed effect model. The two slopes are the same for all 27 countries. In order to see the heterogeneity, the intercept (initial footprint) was calculated for each country. The lowest intercept was found in the Netherlands (11.31 tonnes/capita), a country that has the highest rate of material recycling. Lower values of the intercept could be found in Spain (11.35 tonnes/capita), Malta (13.01 tonnes/capita), Croatia (13.09 tonnes/capita), Hungary (13.22 tonnes/capita), and Italy (13.80 tonnes/capita). The value of the intercept can help to estimate individual equations for each country.
The econometric model validates the initial hypothesis that recycling and eco-innovation have a significant influence on reducing material footprint. Nevertheless, the model shows the intensity of the influence exerted by each regressor. This influence is important and should be at the centre of policies aimed to diminish raw material consumption.

Author Contributions

V.P. conceived the study and was responsible for the design and development of the data analysis. F.M.P. and M.S. were responsible for the data interpretation. V.P. wrote the first draft of the article. F.P. and S.F. were responsible for the data collection, analysis, and for reviewing the first draft of the article. A.C. and R.M. were responsible for the general assembly of the article, template compliance and other proofreading corrections and syntax modifications. All authors have read and agreed to the published version of the manuscript.

Funding

This paper received financial support through the project entitled DECIDE—Development through entrepreneurial education and innovative doctoral and postdoctoral research, project code POCU/380/6/13/125031, a project co-financed from the European Social Fund through the Operational Program Human Capital 2014–2020.

Institutional Review Board Statement

Not applicable.

Informed Consent Statement

Not applicable.

Data Availability Statement

Not applicable.

Conflicts of Interest

The authors declare that they have no known competing financial interests or personal relationships that could have appeared to influence the work reported in this paper. We, the authors—Victor Platon, Florin Marius Pavelescu, Marius Surugiu, Simona Frone, Raluca Mazilescu, Andreea Constantinescu, Florina Popa—hereby declare that there are no competing financial, professional, or personal interests from other parties that relate to the research described in this paper.

Appendix A

Table A1. Panel unit root test: Summary for the variables considered.
VariablesStatisticProb.Cross SectionObs.
Null: Unit root (assumes common unit root process)Method: Levin, Lin, and Chu test
Material footprint−11.80600.000027299
CMUR−4.491780.000027262
Eco-innovation−8.939430.000027491
Source: own processing data with EViews 11.

Appendix B

Table A2. Deviation from the average intercept (C).
C = 18.877233
CountryCross Section Effect
Belgium−3.10915
Bulgaria0.196994
Czechia−1.314928
Denmark4.333438
Germany−1.507794
Estonia8.572277
Ireland−1.440803
Greece−4.646592
Spain−7.527649
France−3.187094
Croatia−5.791643
Italy−5.081318
Cyprus2.966232
Latvia−2.964294
Lithuania−0.906977
Luxembourg15.38736
Hungary−5.659366
Malta−5.870596
Netherlands−7.565003
Austria7.679746
Poland−0.171706
Portugal−1.90773
Romania2.163163
Slovenia−1.479239
Slovakia−3.330151
Finland16.76347
Sweden5.399359
Source: Own calculation based on data from Eurostat database 2022.

References

  1. Wiedmann, T.; Schandl, H.; Lenzen, M.; Moran, D.; Suh, S.; West, J.; Kanemoto, K. The material footprint of nations. Proc. Natl. Acad. Sci. USA 2015, 112, 6271–6276. [Google Scholar] [CrossRef] [PubMed] [Green Version]
  2. Hysa, E.; Kruja, A.; Rehman, N.U.; Laurenti, R. Circular Economy Innovation and Environmental Sustainability Impact on Economic Growth: An Integrated Model for Sustainable Development. Sustainability 2020, 12, 4831. [Google Scholar] [CrossRef]
  3. Islam, T.; Huda, N. Reshaping WEEE management in Australia: An investigation on the untapped WEEE products. J. Clean. Prod. 2019, 250, 119496. [Google Scholar] [CrossRef]
  4. Srinivas, H. Moving towards a Circular Economy: More than Just 3Rs! GDRC Research Output–Concept Note Series E-097. Global Development Research Center: Kobe, Japan. Available online: https://www.gdrc.org/uem/waste/more-3r.html (accessed on 28 January 2023).
  5. Cibulka, S.; Giljum, S. Towards a Comprehensive Framework of the Relationships between Resource Footprints, Quality of Life, and Economic Development. Sustainability 2020, 12, 4734. [Google Scholar] [CrossRef]
  6. Chen, S.-T.; Chang, H.-T. Factors that affect the ecological footprint depending on the different income levels. AIMS Energy 2016, 4, 557–573. [Google Scholar] [CrossRef]
  7. Schumpeter, J.A. The Theory of Economic Development; Duncker und Humblot: Leipzig, Germany, 1911. [Google Scholar]
  8. Schumpeter, J.A. Capitalism. Socialism and Democracy; Harper& Brothers: Manhattan, NY, USA, 1942. [Google Scholar]
  9. Arrow, K.J. The Economic Implications of Learning by Doing. Rev. Econ. Stud. 1962, 29, 155–173. [Google Scholar] [CrossRef]
  10. Baltagi, B.H. Econometric Analysis of Panel Data, 3rd ed.; John Wiley & Sons: West Sussex, UK, 2005. [Google Scholar]
  11. Dosi, G. Technological paradigms and technological trajectories: A suggested interpretation of the determinants and directions of technical change. Res. Policy 1982, 11, 147–162. [Google Scholar] [CrossRef]
  12. Sandu, S. Politicile cercetării-dezvoltării (Research-Development Policies). Rom. J. Econ. 1992, 2. Available online: http://www.revecon.ro/articles/1992-1-2/1992-1-2-14.pdf (accessed on 10 January 2023).
  13. Constantinescu, A.; Frone, S. Impact of technological innovation on the pillars of sustainable development. Qual.-Access Success 2014, 15, S1. [Google Scholar] [CrossRef]
  14. Satell, G. The 4 Types of Innovation and the Problems They Solve. Harvard Business Review. 2017. Available online: https://hbr.org/2017/06/the-4-types-of-innovation-and-the-problems-they-solve (accessed on 20 November 2022).
  15. Alfaro, E.; Yu, F.; Rehman, N.U.; Hysa, E.; Kabeya, P.K. Strategic Management of Innovation. In The Routledge Companion to Innovation Management, 1st ed.; Routledge: Oxfordshire, UK, 2019. [Google Scholar]
  16. OECD. The Oslo Manual Guidelines for Collecting and Interpreting the Innovation Data; OECD: Paris, France, 2005. [Google Scholar]
  17. Platon, V.; Pavelescu, F.M.; Antonescu, D.; Frone, S.; Constantinescu, A.; Popa, F. Innovation and Recycling—Drivers of Circular Economy in EU. Front. Environ. Sci. 2022, 10, 902651. [Google Scholar] [CrossRef]
  18. Fussler, C.; James, P. Driving Eco-Innovation: A Breakthrough Discipline for Innovation and Sustainability; Pitman Publishing: London, UK, 1996. [Google Scholar]
  19. Hellström, T. Dimensions of environmentally sustainable innovation: The structure of eco-innovation concepts. Sustain. Dev. 2006, 15, 148–159. [Google Scholar] [CrossRef]
  20. Joller, L. Eco-innovation models—Theoretical considerations. In Proceedings of the Druid Academy Conference, Cambridge, UK, 19–21 January 2012. [Google Scholar]
  21. Eryigit, N.; Özcüre, G. Eco-Innovation as Modern Era Strategy of Companies in Developing Countries: Comparison Between Turkey and European Union. Procedia-Soc. Behav. Sci. 2015, 195, 1216–1225. [Google Scholar] [CrossRef] [Green Version]
  22. Sehnem, S.; Queiroz, A.A.F.S.L.; Pereira, S.C.F.; Correia, G.S.; Kuzma, E. Circular economy and innovation: A look from the perspective of organizational capabilities. Bus. Strat. Environ. 2021, 31, 236–250. [Google Scholar] [CrossRef]
  23. Gupta, V.; Govindarajan, V.; Wang, H. The Quest for Global Dominance: Transforming Global Presence into Global Competitive Advantage, 2nd ed.; Jossey-Bass: Washington, DC, USA, 2008. [Google Scholar]
  24. Constantinescu, A.; Platon, V.; Surugiu, M.; Frone, S.; Antonescu, D.; Mazilescu, R. The Influence of Eco-Investment on E-Waste Recycling-Evidence from EU Countries. Front. Environ. Sci. 2022, 10, 928955. [Google Scholar] [CrossRef]
  25. Weyrauch, T.; Herstatt, C. What is frugal innovation? Three defining criteria. J. Frugal Innov. 2016, 2, 1. [Google Scholar] [CrossRef]
  26. Winkler, T.; Ulz, A.; Knöbl, W.; Lercher, H. Frugal innovation in developed markets–Adaption of a criteria-based evaluation model. J. Innov. Knowl. 2019, 5, 251–259. [Google Scholar] [CrossRef]
  27. Vilchez, V.F.; Leyva de la Hiz, D.I. Lessons on Frugal Eco-Innovation: More with Less in the European Business Context. In The Critical State of Corporate Social Responsibility in Europe; Emerald Publishing Limited: Bentley, UK, 2018; pp. 279–298. [Google Scholar]
  28. Tiwari, R.; Kalogerakis, K.; Fischer, L. Frugal innovation in Germany: A qualitative analysis of potential socio-economic impacts. Work. Pap. Technol. -Und Innov. Manag. 2017, 96. [Google Scholar]
  29. Panait, M.; Hysa, E.; Raimi, L.; Kruja, A.; Rodriguez, A. Guest editorial: Circular economy and entrepreneurship in emerging economies: Opportunities and challenges. J. Entrep. Emerg. Econ. 2022, 14, 673–677. [Google Scholar] [CrossRef]
  30. Manta, O.; Hysa, E.; Kruja, A. Finances and National Economy: Frugal Economy as a Forced Approach of the COVID Pandemic. Sustainability 2021, 13, 6470. [Google Scholar] [CrossRef]
  31. Available online: https://ec.europa.eu/eurostat/data/database (accessed on 20 November 2022).
  32. Available online: https://ec.europa.eu/eurostat/databrowser/view/CEI_CIE020/default/table?lang=en&category=cei.cei_cie (accessed on 30 November 2022).
  33. Bornhorst, F.; Baum, C. LEVINLIN: Stata Module to Perform Levin-Lin-Chu Panel Unit Root Test. 2006. Available online: https://EconPapers.repec.org/RePEc:boc:bocode:s419702 (accessed on 20 December 2022).
  34. Wooldrige, J.M. Econometric Analysis of Cross Section and Panel Data, 2nd ed; MIT Press: Cambridge, MA, USA, 2001. [Google Scholar]
  35. Wilts, H. The Circular Economy Kick-Starting the Transformation. 2021. Available online: https://library.fes.de/pdf-files/wiso/19034.pdf (accessed on 20 December 2022).
  36. Gil-García, J.R.; Puron-Cid, G. Using Panel Data Techniques for Social Science Research: An Illustrative Case and Some Guidelines. Cienc. Soc. 2013, 21, 203–216. [Google Scholar]
Figure 1. Mean of material footprint by EU countries (2008–2019) (tonnes/capita). Source: processed data from Eurostat database, 2022.
Sustainability 15 03996 g001
Figure 2. Eco-innovation (average number of patents related to recycling and secondary raw materials/1 mill. inhabitants), by EU countries (2000–2019). Source: processed data from Eurostat database, 2022.
Sustainability 15 03996 g002
Figure 3. Circular material use rate, by EU countries (2010–2020) (%). Source: processed data from Eurostat database, 2022.
Sustainability 15 03996 g003
Figure 4. Individual intercept (tonnes/capita) for the 27 EU countries (2010–2019). Source: processed data from Appendix B.
Sustainability 15 03996 g004
Table 1. Indicators used in the model.
IndicatorUnit of MeasureVariable TypeSample for:
Indicator EvolutionEconometric Model
Material footprintTonnes/capitaDependent2008–20192010–2019
Circular
material use
%Independent2010–20202010–2019
Eco-innovationPatents/1 mil. inhabIndependent2000–20192010–2019
Source: own processing of data from Eurostat.
Table 2. Breusch–Pagan test for the pooled OLS model.
Null Hypotheses (H0)Alternative Hypotheses (Ha)
No effectsCross-section effects are present
Test Hypothesis
Cross-sectionTimeBoth
Breusch–Pagan527.56080.001606527.5624
Probability(0.0000)(0.9680)(0.0000)
Source: own processing of data from Eurostat.
Table 3. Hausman test for the random effect model.
Test Cross-Section Random Effects
Test SummaryChi-Sq. StatisticChi-Sq. d.f.Prob.
Cross-section random24.85273520.0000
Source: own processing of data from Eurostat.
Table 4. Summary of the Fixed Effects model.
Method: Panel—Estimated Generalized Least Square (Cross-Section Weights)
Dependent Variable: MATERIAL_FOOTPRINTTotal Panel (Balanced) Observations: 270
Sample (Adjusted): 2010–2019 Periods Included: 10Cross-Sections Included: 27
VariableCoefficientStd. Errort-Statistic
C18.877232 *0.50402637.45291
CIRCULAR_MAT_USE−0.100363 ***0.053890−1.862366
PATENTS_RECYCL_CAP−0.419239 **0.175941−2.382835
* p < 0.001; ** p < 0.05; *** p < 0.10. Source: own processing of data from Eurostat.
Disclaimer/Publisher’s Note: The statements, opinions and data contained in all publications are solely those of the individual author(s) and contributor(s) and not of MDPI and/or the editor(s). MDPI and/or the editor(s) disclaim responsibility for any injury to people or property resulting from any ideas, methods, instructions or products referred to in the content.

