Article

Guinea Grass (Megathyrsus maximus) Fibres as Sorbent in Diesel Bioremediation

by
Farah Eryssa Khalid
1,
Nur Nadhirah Zakaria
1,
Alyza Azzura Azmi
2,*,
Noor Azmi Shaharuddin
1,3,
Suriana Sabri
4,
Khalilah Abdul Khalil
5,
Claudio Gomez-Fuentes
6,7,
Azham Zulkharnain
8,
Sooa Lim
9 and
Siti Aqlima Ahmad
1,7,10,*
1
Department of Biochemistry, Faculty of Biotechnology and Biomolecular Sciences, Universiti Putra Malaysia, Serdang 43400, Selangor, Malaysia
2
Faculty of Science and Marine Environment, Universiti Malaysia Terengganu, Kuala Nerus 21030, Terengganu, Malaysia
3
Institute of Plantation Studies, Universiti Putra Malaysia, Serdang 43400, Selangor, Malaysia
4
Department of Microbiology, Faculty of Biotechnology and Biomolecular Sciences, Universiti Putra Malaysia, Serdang 43400, Selangor, Malaysia
5
School of Biology, Faculty of Applied Sciences, Universiti Teknologi MARA, Shah Alam 40450, Selangor, Malaysia
6
Department of Chemical Engineering, Universidad de Magallanes, Avda. Bulnes, Punta Arenas 01855, Chile
7
Center for Research and Antarctic Environmental Monitoring (CIMAA), Universidad de Magallanes, Avda. Bulnes, Punta Arenas 01855, Chile
8
Department of Bioscience and Engineering, College of Systems Engineering and Science, Shibaura Institute of Technology, 307 Fukasaku, Minumaku, Saitama 337-8570, Japan
9
Department of Pharmaceutical Engineering, Hoseo University, Asan-si 31499, Chungnam, Republic of Korea
10
Laboratory of Bioresource Management, Institute of Tropical Forestry and Forest Products (INTROP), Universiti Putra Malaysia, Serdang 43400, Selangor, Malaysia
*
Authors to whom correspondence should be addressed.
Sustainability 2023, 15(5), 3904; https://doi.org/10.3390/su15053904
Submission received: 28 September 2022 / Revised: 3 November 2022 / Accepted: 16 December 2022 / Published: 21 February 2023
(This article belongs to the Special Issue Sustainable Management Practices to Treat Solid Waste and Wastewater)

Abstract

:
In this study, the ability of a natural grass named Megathyrsus maximus (Guinea grass) as a sorbent for cleaning up diesel spills in water was investigated. Fourier transform infrared (FTIR) spectroscopy was used to identify the physicochemical properties of untreated and treated GG. Several parameters influencing the efficiency of oil absorbed by guinea grass were optimised using established One Factor at a Time (OFAT) and followed by Response Surface Methodology (RSM) approaches. The optimised parameters include heat treatment, time of heating, packing density, and diesel concentration, with only the significant factors proceeded to statistical optimisation through RSM. As a result of OFAT analysis, 18.83 mL of oil was absorbed at 110 °C for 15 min time of heating, with packing density of 14 g/cm3 and oil concentration of 10% (v/v). Through RSM, the predicted model was significant, confirming that packing density and oil concentration significantly influenced the efficiency of oil absorption by GG. The software predicted an oil absorption efficiency of 16.64 mL, whereas the experimental model validated the design with 22.33 mL of oil absorbed at a constant temperature and time, respectively. The RSM technique has proven better efficiency and effectiveness in absorbing oil compared to OFAT. This research advances our understanding of the utilisation of natural sorbents as a diesel pollution remediation strategy.

1. Introduction

Water is a vital component of all manufacturing processes as well as a source of life. Seawater has been increasingly prone to man-made disasters as human activities progress [1]. Any inadvertent or purposeful discharge of liquid hydrocarbons into the environment is termed an oil spill. Marine oil spills, also known as oil spills in the waters, are exceedingly difficult to handle and have severe implications for the marine environment. Oil pollution harms the environment, ecosystems, sea life, the economy, and tourism. The unpleasant odour can be perceived from miles away, and the increasing growth of green algae has a negative impact on the landscape [2]. The major sources of spills include natural seepage, exploration, production, refining operations, as well as transportation [3].
Tremendous efforts for removing oil spills in water have been widely mentioned in the literature. Biosorption is the process of removing pollutants from water using biological materials like an agricultural waste. The physicochemical process in biosorption involves many types of physical binding (electrostatic interactions, hydrogen bonding, van der Waals forces) and chemical bonding (ionic and covalent bonds) that occur based on biomass properties [4,5]. The sorption approach (ion exchange and adsorption) is utilised since it is less expensive (up to USD 200 per million litres) than other processes (up to USD 500 per million litres) [6]. By introducing sorbent materials to a spill, they are able to remove the spilt fluid by drawing liquids together and converting them to a semisolid or solid state [7].
Sorbents are oleophilic materials that absorb oil by absorption, adsorption, or a combination of these processes. They are categorised as hybrid systems since they may be used for both active and passive removal, in addition to being particularly good at recovering oil traces from both land and water. Natural sorbents have a poor exchange capacity, whereas synthetic sorbents have a price disadvantage. To boost their sorption capacities, natural materials are treated and modified in several ways, including chemical or physical treatment [8]. Excellent efficiency, simple process operation, high selectivity, capacity and affinity, no additional nutritional needs, freely available, and application in a wide variety of experimental circumstances are some of the benefits of optimised biosorption [9,10,11]. Furthermore, using biosorbents in the cleaning process results in no secondary pollution.
The threat of environmental and disposal concerns arising from agricultural waste overproduction intensifies the value-added initiative, which is a perfect option for zero-waste. Remarkably, almost all agricultural activities generate wastes, which is produced in huge quantities in many countries. These agricultural wastes are typically burned or left to decay in public spaces in the open air, causing pollution of air and water and global warming [12]. These wastes may then pose a substantial hazard to human health through environmental contamination, and their disposal may result in significant economic loss [13]. Thus, using agricultural waste for biosorption aids in the decoupling of environmental pressures and the preservation of a healthy ecosystem for all living species.
Agricultural waste with a high lignocellulosic content has the potential to substitute commercial goods at a lower cost. Various surface functional groups originating from lignocellulose and some proteins from agricultural waste make it suitable for removing oil in polluted water [6]. Grass is a common agricultural lignocellulosic biomass with low economic and nutritional value. In recent years, grass research has mostly focused on directly employing treated grass in adsorption [14].
Megathrysus maximus or guinea grass (GG) is a popular and nutritious animal feed, owing to its high protein content and resistance to grazing and warm environmental conditions [15]. GG is a tropical plant native to Africa that grows throughout the continent. This tropical grass is used for pasturising, cutting and carrying, silage and hay across the tropics [16]. Since it is a perennial bunchgrass with deep root development, it has the ability to minimise soil erosion while simultaneously contributing to organic matter [17].
Apart from its potential to provide high nutritional fodder, guinea grass may have an impact on the functioning and stability of ecosystems because of its genetic aspects and eco-physiological traits such as competitive ability, allelopathy effect, and resistance to stress [18]. Guinea grass’ ability to spread swiftly presents issues when it grows in the wrong area at the wrong time because the seeds are easily dispersed on the fur of local species travelling through an infestation of guinea grass. In unexploited fields with disturbed soil, it may pose a threat as major agronomic weeds [19].
GG has been reported in various other bioremediation studies [20,21,22]. To our best knowledge, no biosorption studies focusing on diesel removal using guinea grass have been reported. Thus, the present work aimed to study the potential of guinea grass as an oil biosorbent through optimisation via OFAT and RSM approaches while considering various factors such as temperature, time of heating, packing density, and diesel concentration. The sorption capacity is investigated in the context of oil removal from contaminated water.

2. Materials and Methods

2.1. Materials

Guinea grass (GG) was collected in large quantities from a green area at Universiti Putra Malaysia, UPM. In the experiment, only the leaves were utilised. The leaves were cut into 5 cm lengths and thoroughly washed under running tap water to eliminate excess dirt and remaining pollutants. The leaves were sun-dried for 8 h for 7 d until the weight remained constant. The dried material was stored in a zip lock bag until further analysis. Seawater (pH 7.50–8.50, salinity 15–19 ppt) was acquired from Pantai Port Dickson, Negeri Sembilan (2.5011° N, 101.8373° E) and diesel fuel (PETRONAS Dynamic Diesel Euro 5) was purchased from Petronas UPM Serdang, Selangor.

2.2. Experimental Setup and Sorbent Screening

An opened bottle (25 cm height × 5 cm diameter) that acts as a column was invertedly fixed to the retort stand. A 500 mL measuring cylinder was positioned beneath the column inlet to collect the residual oil and water effluent. A holder made of PVC mesh wire (10 cm height × 5 cm diameter) was used to hold 14 g of guinea grass and inserted inside the column. A mixture of 40 mL diesel and 400 mL seawater was poured into the column’s aperture and allowed to drip for 10 min. The total weight of the samples, as well as the total amount of water and oil effluents, were measured. All the experiments were done in triplicates at room temperature (22 ± 1 °C). Figure 1 depicts the experimental setup for the entire procedure [23].
The sorption capacity (Equation (1)) was evaluated using the standard technique of the American Society for Testing and Materials (ASTM) F726-99 [24].
Oil   sorption   capacity   ( g / g ) = S i S f S i
where Si is the initial weight (g) of sample before sorption and Sf is the final weight (g) of sample after sorption.
The efficiency of diesel and seawater absorbed (Equation (2)) was calculated using the following formula.
Efficiency   of   diesel / seawater   absorbed   ( % ) = D i D f D i × 100 %
where Di is the initial volume (mL) of diesel/water before sorption and Df is the final volume (mL) of diesel/water after sorption.

2.3. Fourier Transform Infrared Spectroscopy (FTIR) Analysis

The functional group differences between untreated and treated samples before and after sorption was studied using FTIR (ALPHA, Bruker Optik GmbH, Ettlingen, Germany). The vibration frequencies of the adsorbents lattice originated from the stretching or bending modes of the functional groups present at a spectral range of 4000–500 cm−1 with a 4 cm−1 resolution were determined using the attenuated total reflectance (ATR) technique.

2.4. Conventional One Factor at a Time (OFAT) Optimisation

Several ideal parameters were designed into OFAT to optimise oil absorption by GG. Among the optimised parameters were temperature (110, 120, 130, 140 and 150) °C, time (15, 30, 45, 60, and 75) min, packing densities (0.12, 0.14, 0.16, 0.18 and 0.20) g/cm3, and oil concentration (5, 10, 15, 20, 25, 30, 35) % (v/v). The studies were carried out in triplicates, whereas the data of various parameters were subjected to a one-way analysis of variance (ANOVA) using the GraphPad Prism software (GraphPad Inc, San Diego, CA, USA, version 8.0.2). Tukey’s multiple range test was used to compare the significant difference (p < 0.05) between the means.

2.5. Statistical Respond Surface Methodology (RSM) Optimisation

RSM is methodical, time-saving, and cost-effective as compared to OFAT as it reduces the number of experimental runs. RSM was employed in this study to improve the GG treatment procedure. Using Design Expert software, the experimental data were analysed using Plackett Burman Design (PBD) and Central Composite Design (CCD) (Stat-Ease Inc, Minneapolis, MN, USA, Version 13.0.5).

2.5.1. Plackett Burman Design (PBD)

PBD’s factorial model was used to analyse four independent factors, namely temperature, heating duration, packing density, and oil concentration at minimum (–1) and maximum (+1) levels (Table 1). The oil absorption efficiency was employed as a response variable in 18 experimental runs to screen for significant parameters. The PBD follows the first-order model (Equation (3)) provided below:
Y = β 0 + i = 1 k βiXi
where Y is the efficiency of diesel and seawater absorbed (responses), β0 is the intercepted model, βi is the coefficient of linearity, Xi is the independent variable’s coded level, and k is the number of variables [25].

2.5.2. Central Composite Design (CCD)

The response surface of the indicated significant parameters (p < 0.05) was generated using CCD. Two factors that influence oil absorption are listed in Table 2, each of which was evaluated at five levels with two axial points (+2, −2), two factorial points (+1, −1), and one central point (0). Two significant factors with five centre points were evaluated in 13 experimental runs. The relationship between response and independent factors was best described using the quadratic model of CCD (Equation (4)), which was constructed using a second-order polynomial equation as follows:
Y = β 0 i = 1 k β iXi + i = 1 k β iiX 2 i + 1 i j k β ijXi   Xj
where Y represents the oil absorption (response), β0 represents the model intercept, βi represents the linear coefficient, βii represents the quadratic coefficient, Xi and Xj represent the independent variables, and k is the number of variables [26]. Analysis of variance was used to determine the model’s significance and regression coefficients (ANOVA). Based on the statistical parameters obtained such as the R2 and the model’s lack of fit, three-dimensional response surface plots were used to determine the interaction among the components. All experiments were carried out in triplicate.

3. Results and Discussion

3.1. Screening of Guinea Grass

The percentage of oil absorbed by untreated and treated GG samples is shown in Figure 2. Heat treatment of treated GG at 110 °C for 60 min resulted in 40.42% oil absorption. Meanwhile, the untreated GG showed only 34.17% oil absorption.
The screening graph (Figure 2) implies that treated GG absorbed 40.42% oil, whereas untreated GG absorbed 34.17% oil, resulting in a 6.25% difference between the two samples. Additionally, treated GG showed a higher sorption capacity of 1.40 g/g and lower water absorption of 2.5%, compared to 1.06 g/g for untreated GG and 3.62% water absorption. Diffusion into the pores or hollow lumen of the sorbents, as well as adsorption of crude oil molecules at hydrophobic reactive sites, both contributed to the increase in oil sorption capacity [27]. Treated GG has notably absorbed more oil while absorbing less water after being subjected to heat treatment and, hence, was preferred and used for optimisation. When grass fibres are heated, their hydrophilic characteristics are reduced because moisture evaporates quickly. Oil absorption with less water pickup is preferred, thus the amount of water absorbed by samples was evaluated. The presence of minimal water pickup implies sorbent selectivity between oil and water.

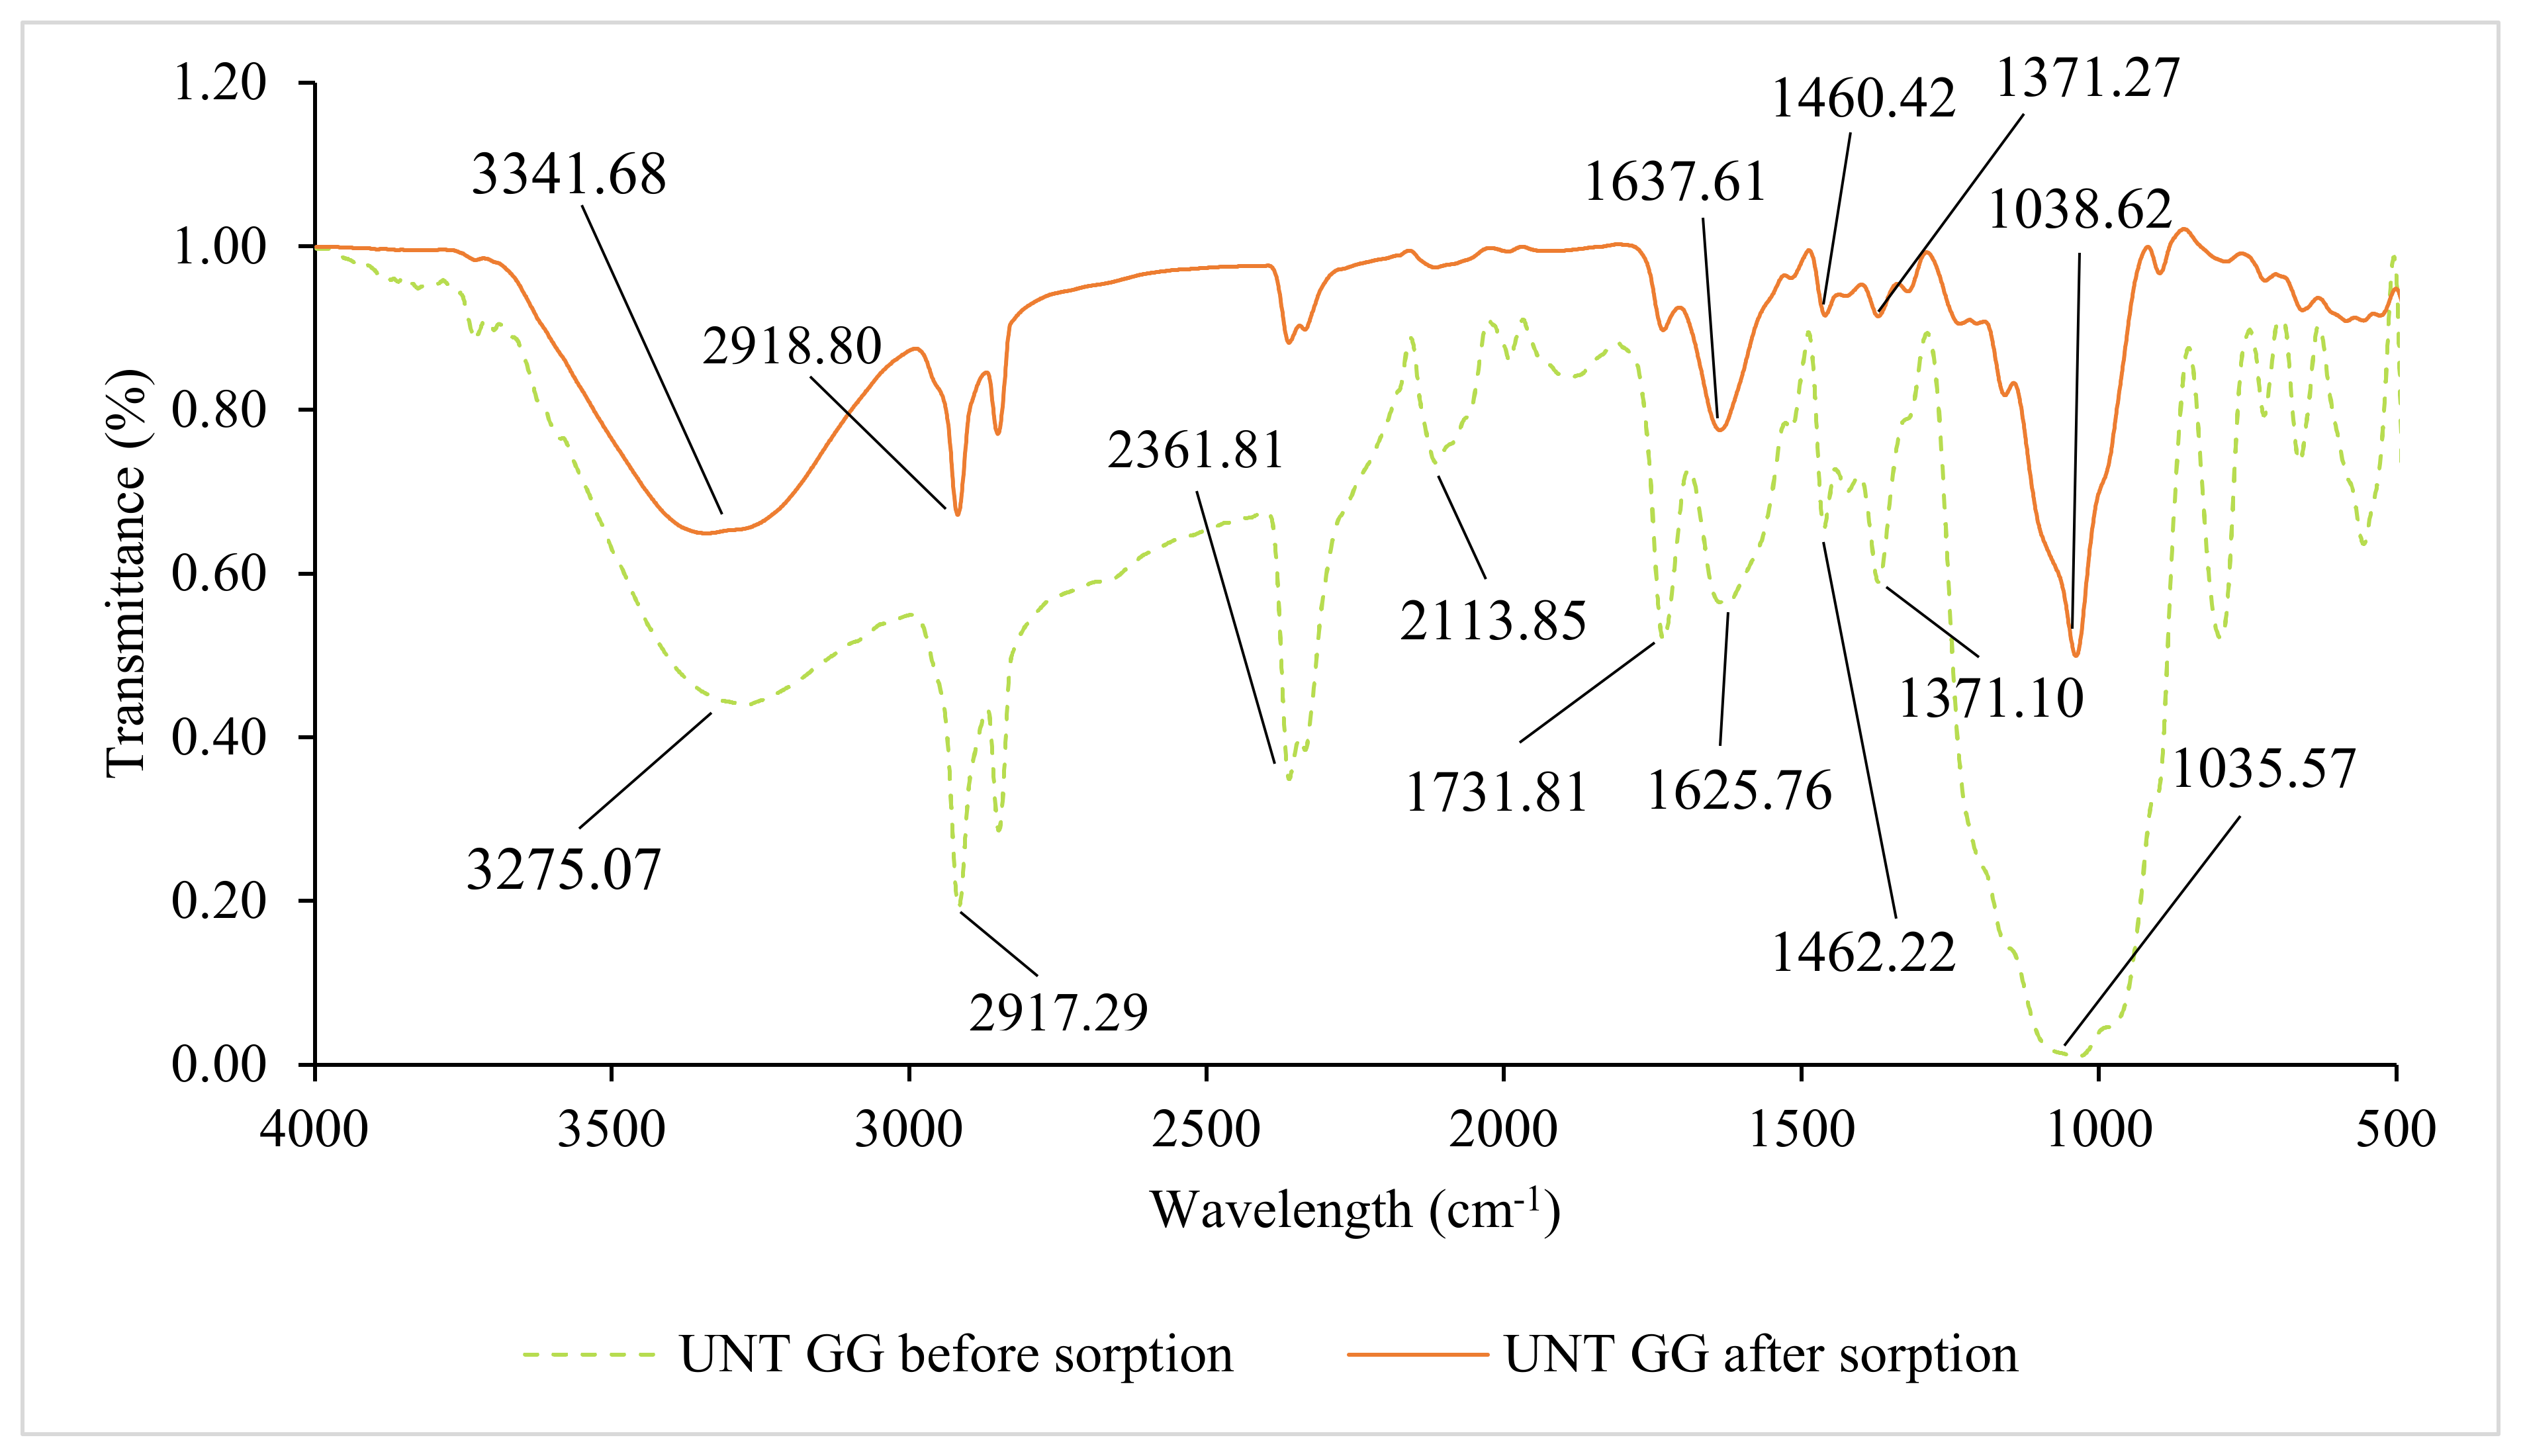
3.2. Fourier Transform Infrared Spectroscopy (FTIR) Analysis

Figure 3 and Figure 4 show the FTIR infrared spectra of untreated and treated GG before and after they were wetted with oil in the 4000 to 500 cm−1 regions to determine the presence of functional groups, as well as the effect of heat treatment and diesel-seawater sorption. The obtained spectra for untreated GG before and after adsorption are shown in Figure 3. The presence of cellulose, hemicellulose, and lignin from the plant was revealed by the existence of a broad peak at 3341.68 cm−1 in the FTIR spectra of untreated GG before wetting with oil, indicating substantial quantities of stretching of O-H groups [28]. The O-H stretching at 3275.07 cm−1 decreased when untreated GG was wetted with oil, implying that hydroxyl groups from lignin, hemicellulose, and cellulose were reduced [29,30]. The enhanced stretching band of the C-H (2849.75 cm−1 and 2917.29 cm−1) in FTIR spectra before wetting with oil was thought to comprise lignin, hemicellulose, and cellulose backbone. Since the carboxylic group of lignin was linked, the prominent peak at 1731 cm−1 in the untreated GG denoted the ester [31]. Following adsorption, FTIR spectra revealing the stretching band of the C-H (2851.40 cm−1 and 2918.25.80 cm−1) indicated the presence of a long chain alkyl group from the diesel hydrocarbons [32]. Meanwhile, the aromatic ring of lignin’s stretching (C=C) exhibited a peak wavelength of 1400–1600 cm−1, whereas untreated GG after sorption had a greater reflectance than untreated GG before sorption [33]. The peak in the fingerprint region, 1200–900 cm−1 range corresponded to the C-O deformation band caused by the ether group, which can be found in hemicellulose, cellulose, or lignin [34].
The FTIR spectra of treated GG that had been heat-treated at 110 °C before and after being wet with oil were analysed (Figure 4). The presence of diesel oil was a major factor in all the findings. Contrasting with the untreated GG spectra, the intense O-H stretching (3000 to 3500 cm−1) after heat treatment was visible, contributed to the hydroxyl groups from lignin, hemicellulose, cellulose, and other impurities [35]. This indicates that the same groups were responsible for oil/water mixture absorption in both samples. The existence of a long chain alkyl group from the diesel hydrocarbon was revealed by the elevated stretching band of the C-H (2852.01 cm−1 and 2918.84 cm−1) following wetting with oil as shown by FTIR spectra [36]. The presence of the diesel aromatic ring C=C group was verified by a deeper slope in the FTIR spectra of treated wetted samples, which showed a peak in the 1600–1300 cm−1 range. The C=C bond stretching vibration between alkenes and aromatic functional groups in diesel oil caused a steeper slope. At 2918.84 cm−1, the presence of the C-H functional group, alkane, verified the sorption of diesel oil at the GG hydrophobic areas [37]. The potential of GG to absorb diesel oil has therefore been confirmed.

3.3. Conventional OFAT Optimisation

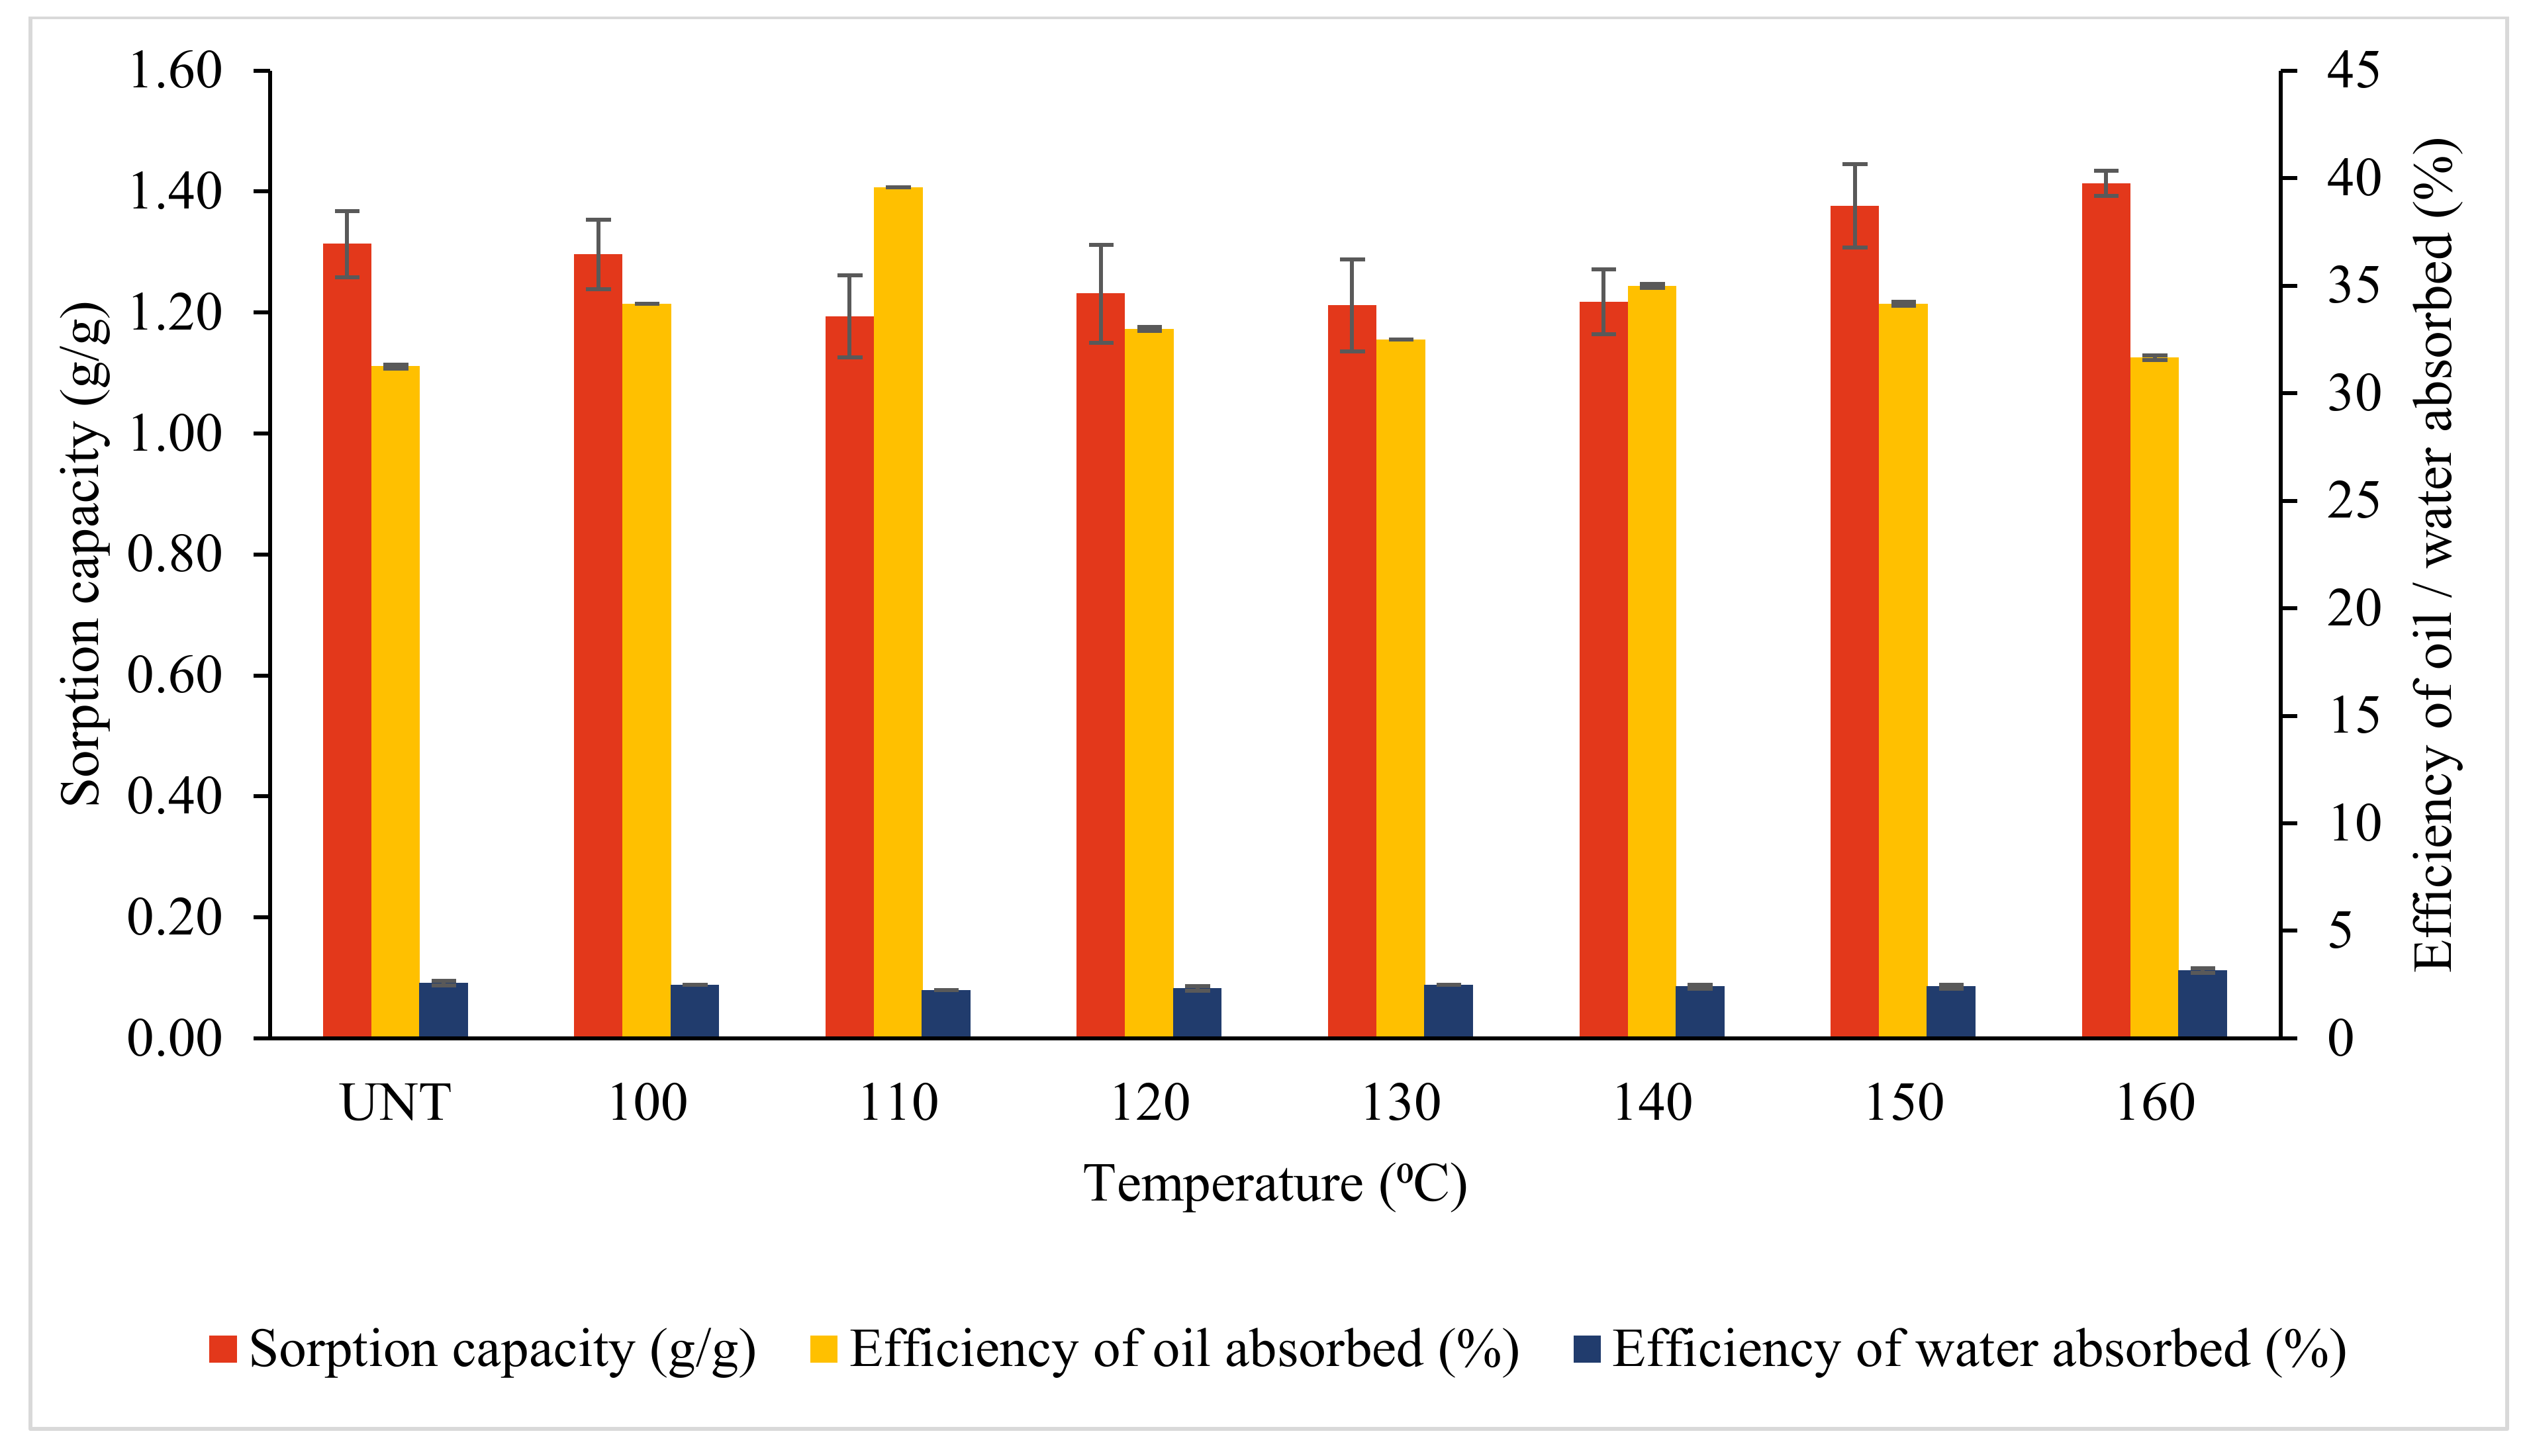
3.3.1. Effects of Temperature

Time, temperature and concentration are all important treatment variables for maximising natural sorbent efficiency in oil absorption. Temperature, on the other hand, has only a minor impact on oil absorption, as seen in Figure 5. The influence of temperature on the efficiency of oil absorption was studied using one-way analysis of variance (ANOVA). Figure 5 displays that oil absorption by GG was more pronounced at 110 °C, with the highest oil absorption efficiency of 39.58%, with 2.25% seawater absorption and 1.19 g/g sorption capacity, whereas untreated guinea grass has the lowest oil absorption efficiency of 31.25%, 2.58% water absorption, and 1.31 g/g sorption capacity. Tukey’s post hoc comparisons demonstrated no significant impact of oil absorption over the range of temperatures except for 110 °C. When the temperature climbed above 110 °C, the oil absorption efficiency dropped to between 31.67–35%. For varied heating temperatures, the efficiency of oil absorbed differed significantly (F7,16 = 9.561, p = 0.0001). For the absorbed water, the results were the opposite with no significant variation in heating temperatures (F7,1 = 0.181 4, p = 0.9487). Further ANOVA analysis revealed a significant difference in sorption capacity between the guinea grass treatments (F7,16 = 2.562, p = 0.0565). According to a study on wood fibre by Yan et al. [38], high temperatures caused significant moisture loss, causing the sorbent’s quality and density to deteriorate. Boonstra et al. [39] added that when the temperature rises, enormous hemicellulose degradation accelerates, resulting in the loss of hemicellulose binding in the cell wall and a weakening of cellulose and lignin binding strength. The binding process is usually temperature-dependent; as the temperature rises, the biosorptive removal of activity and kinetic energy of the adsorbate increases although very high temperatures can occasionally destroy the physical structure of the biosorbent [10,40]. During the mechanical recovery of oil, mechanical pressure may produce deformations in the pore structure of the material, resulting in a reduction in oil sorption capacity [41]. Heat treatment using a standard oven is recommended over chemical changes and pyrolysis treatment since they are costly and complicated, and they may introduce harmful substances into the water supply [42,43].

3.3.2. Effects of Time

The second factor, time, was also optimised by OFAT (Figure 6). A total of 15 min of treatment resulted in guinea grass with a maximum oil absorption efficiency of 40.42% and low water absorption efficiency of 2.5%. However, although having a high sorption capacity of 1.6 g/g at 30 min, the oil absorption efficiency became 36.67%, whereas the absorbed water value was 0.08% greater than at 15 min. According to post hoc comparisons, the sorption capacity was highest at 15 min and significantly different from other heating times. The longest duration, 75 min, yielded 1.40 g/g sorption capacity, 34.58% oil absorbed, and 4% water absorbed, which is definitely not the best condition to proceed with. According to Tukey’s post hoc tests, no significant differences in oil concentration between UNT and 75 min, UNT and 30 min, 30 min and 75 min and 45 min and 60 min were observed. Significant differences in oil absorption and sorption capacity were found to be (F4,10 = 43, p < 0.0001; F4,10 = 13.77, p = 0.0004) through ANOVA analysis. In terms of water absorption, however, no significant difference was seen across the time intervals (F4,10 = 0.7344, p = 0.5891). As a result, the best time to move on to the next parameter was 15 min. Plant fibres have a lot of free hydroxyl groups easily attached to oil or water, giving them a lot of attraction for both. Plant fibres have a lot of free hydroxyl groups that link readily with oil or water and therefore have a lot of affinity for both [44]. The treatment of fibre is believed to increase the fibre’s affinity for oil. Thermal treatment of fibres resulted in a change in their properties [45]. Logic dictates that the longer the heating period, the more changes will occur.

3.3.3. Effects of Packing Density

Figure 7 shows the oil content as a function of packing density. Using various packing densities, the sorption capacity and oil absorption efficiency of sorbent were examined. The value of (F5,12 = 94.88, p < 0.0001) from ANOVA analysis revealed that packing densities had no significant influence on guinea grass oil absorption efficiency. At a packing density of 0.14 g/cm3, optimal oil absorption efficiency was attained with a sorption capacity and efficiency of oil and water absorbed of 1.981 g/g, 47.08% and 2.458%, respectively. Except for 0.14 g/cm3 and 0.18 g/cm3, Tukey’s post hoc comparisons demonstrated a significant impact of oil absorption over the range of packing densities. ANOVA confirmed that the sorption capacity and efficiency of water absorbed were significantly influenced by packing density (F5,12 = 32.18, p < 0.0001) and (F5,12 = 248.7, p < 0.0001). Based on post hoc comparisons, the sorption capacity was maximum at 0.14 g/cm3, which was substantially different from other packing densities; however, the efficiency of water absorbed was not statistically different for 0.14 g/cm3 and 0.16 g/cm3. The packing volume and density have an impact on the biosorption process, hence should be properly optimised [46]. According to previous research by Xu et al. [47] as well as Lim and Huang [48], the order of increasing oil sorption capacity is related to packing density. Apparently, there appears to be a limit to how much oil can be absorbed by the grass fibre within its structure, as seen in the diagram above. It is possible that the more tightly packed and less loosely packed the packing, the more difficult it is for the oil to absorb through. Previous literature reported that sorbents with higher packing densities possess superior dynamic oil retention capacity but lower oil sorption capacity than sorbents with lower packing densities [49], which supports the findings of this current study. In a published study, natural fibres have been regarded as having outstanding sorption capacity, a comparable density to manufactured sorbent, and are chemical-free and highly biodegradable [50].

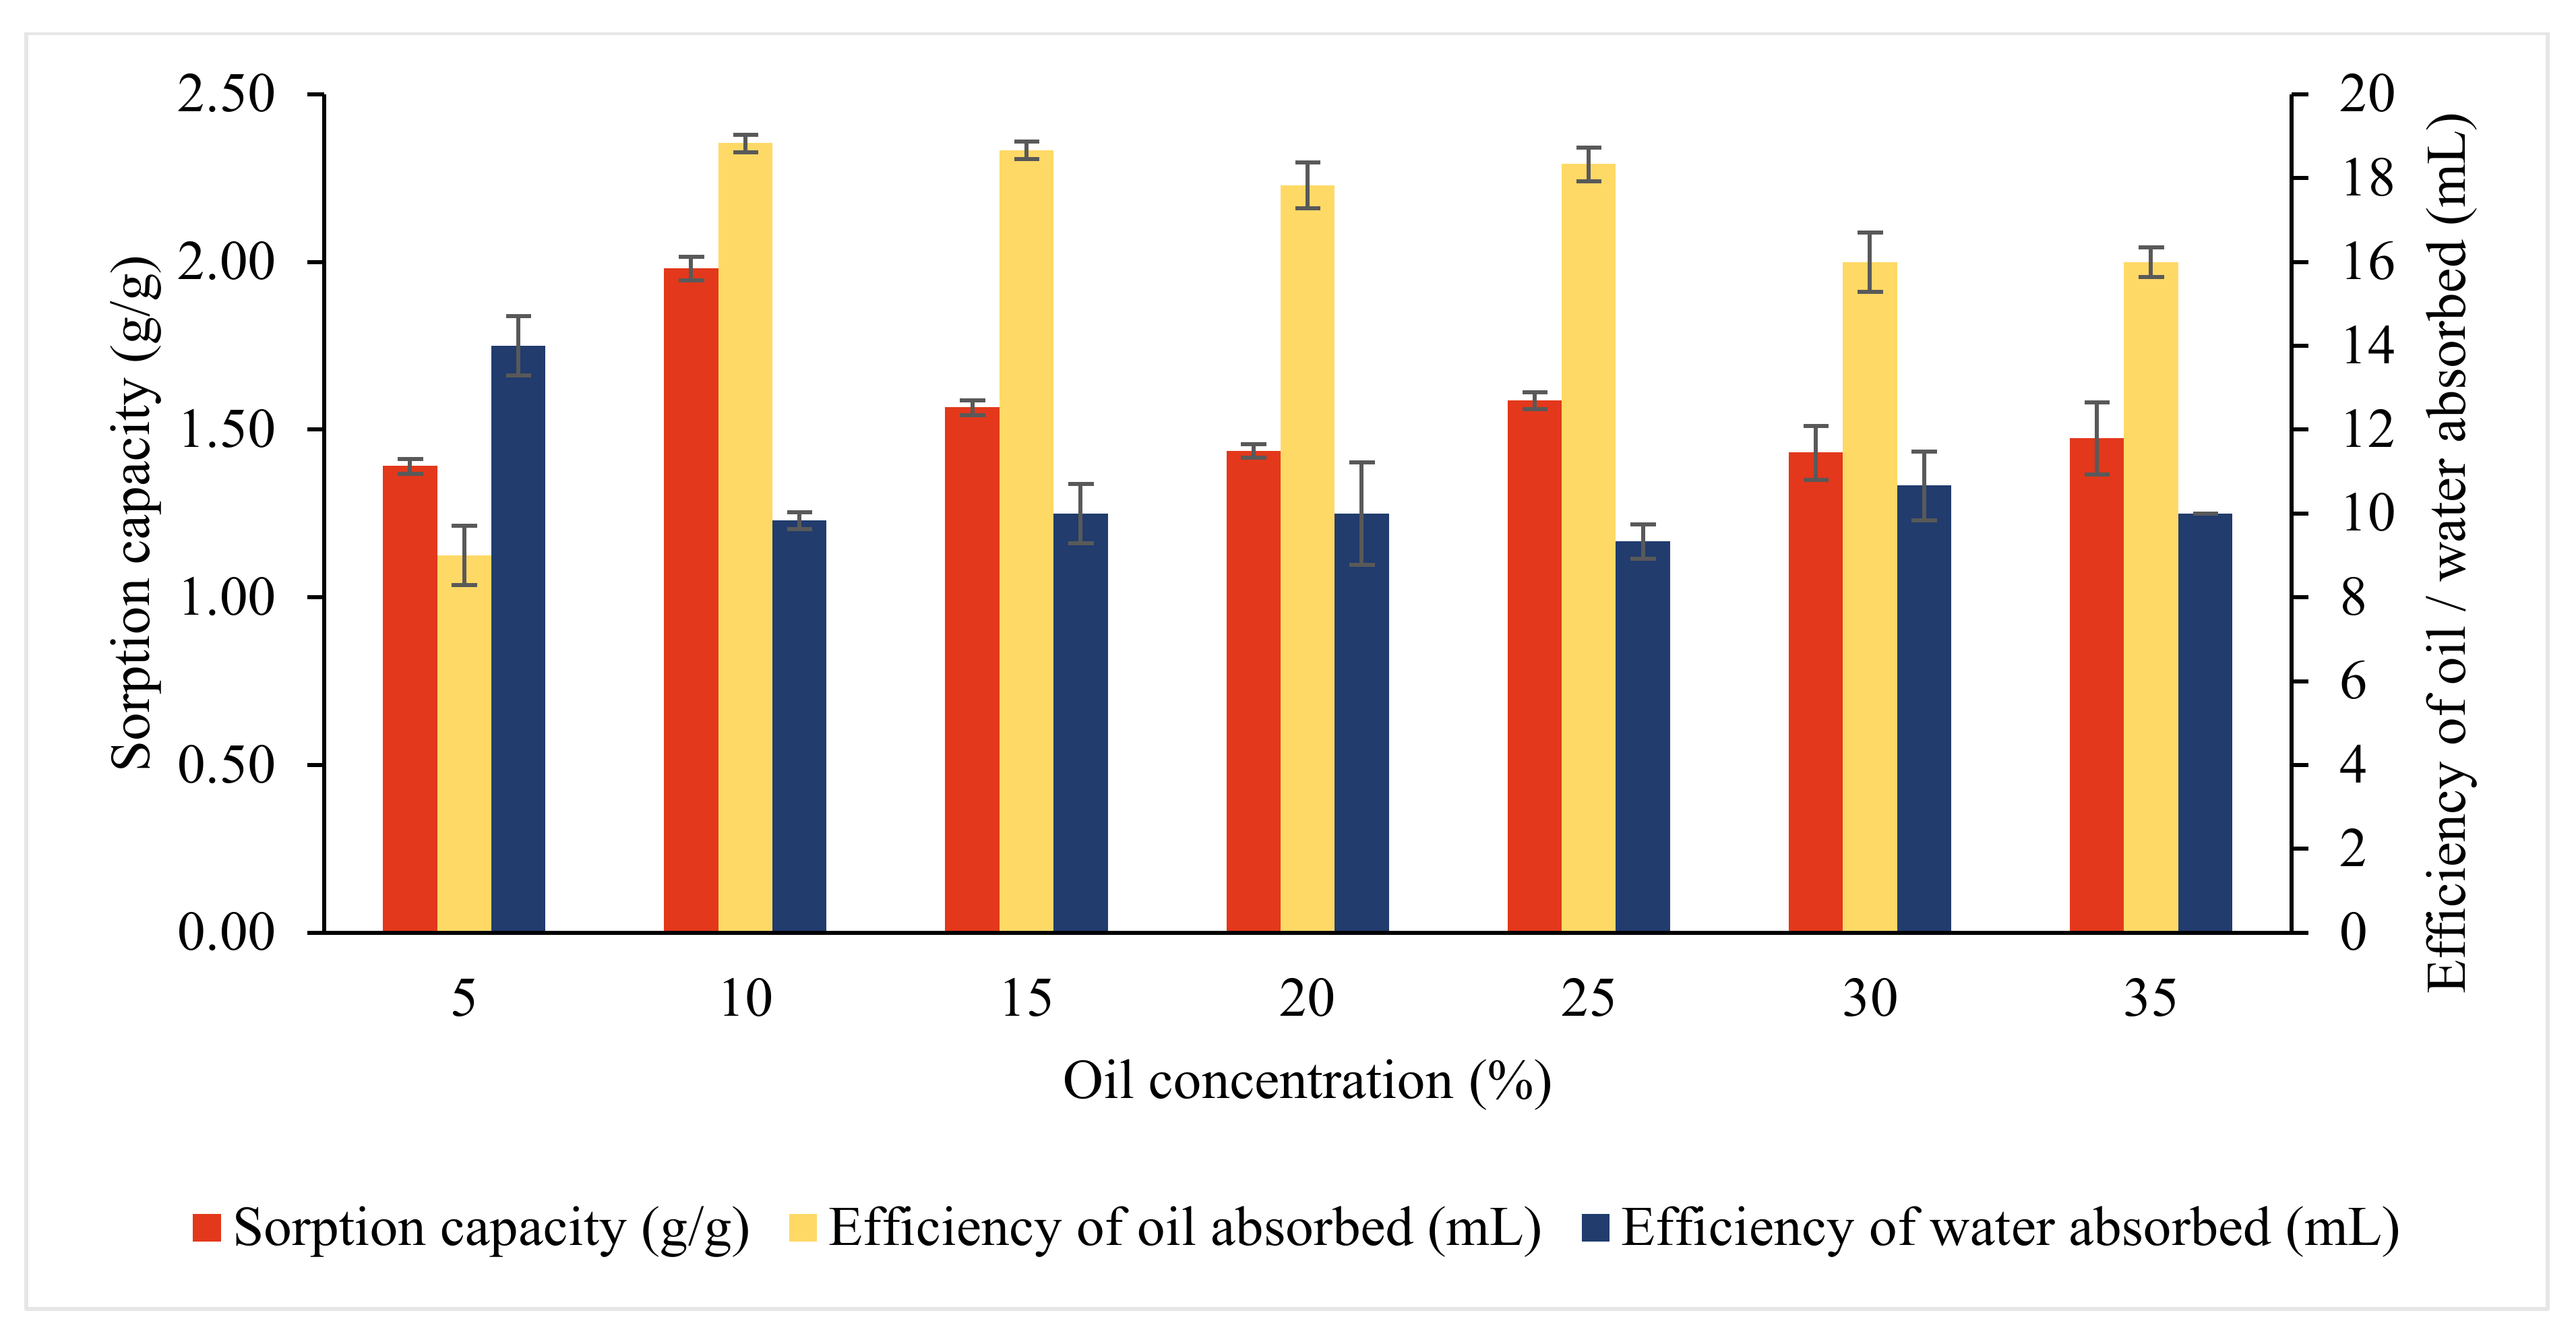
3.3.4. Effects of Oil Concentration

The GG sample was exposed to various concentrations of diesel oil ranging from 5% to 35% (v/v) as the final parameter investigated utilising OFAT (Figure 8). The graph demonstrated that 10% (v/v) led to the highest oil absorption and sorption capacity compared to others (18.83 mL and 1.98 g/g). In comparison to the other concentration, 10% (v/v) resulted in the maximum oil absorption and sorption capacity (18.83 mL and 1.98 g/g). With a slightly better oil absorption efficiency than 15% (v/v) (18.67 mL), 10% was chosen as the optimal concentration for diesel since it absorbed less water (9.833%). At greater concentrations, the efficiency of oil absorbed decreased, whereas the sorption capacity was not significantly different. Across the diesel concentration, ANOVA analysis revealed significant differences for sorption capacity (F6,14 = 20.32, p < 0.0001), oil absorption efficiency (F6,14 = 159.9, p < 0.0001), and water absorption efficiency (F6,14 = 7.683, p = 0.0009). The sorption capacity was not significantly different in terms of oil absorbed, according to Tukey’s multiple comparison test except for 10% (v/v) and 15% (v/v), 10% (v/v) and 20% (v/v), 10% (v/v) and 25% (v/v), and 10% (v/v) and 30% (v/v). A post hoc test conducted for oil absorbed indicated significant differences over various diesel concentrations except for 20% (v/v) and 25% (v/v), 25% (v/v) and 30% (v/v), and 30% (v/v) and 35% (v/v). Oil seemed to occupy the sorbent surface at high oil concentrations, causing saturation to occur significantly faster, leaving a large amount of unattached oil. As reported by Huang and Lim [51] and Wahi et al. [49], this phenomenon may be explained in terms of a filtering mechanism in which oil fills the gaps between sorbent particles, known as macropores, preventing more oil from entering the sorbent.

3.4. Response Surface Methodology (RSM) Optimisation

3.4.1. Plackett Burman Design

In the 18 runs of the Plackett Burman design used to improve the performance of GG, oil absorption ranged from 6.33 to 23.67 mL (Table 3). Maximum oil absorption (run 13) was achieved at 100 °C for 30 min with a packing density of 0.16 g/cm3 and a 30% (v/v) oil concentration. The lowest oil absorption (run 4) was measured at 100 °C for 5 min with a packing density of 0.10 g/cm3 and a 5% oil concentration. ANOVA confirmed that the model generated was highly significant overall, with R2 = 0.9134, with packing density and oil concentration being the significant factors (Table 4). These factors were therefore carried forward to CCD analysis. The model equation for the efficiency of oil absorption (Y) is listed in Equation (5).
Y = + 13.69 + 0.44A − 0.19B + 3.28C + 4.64D

3.4.2. Central Composite Design

The main purpose of conducting CCD was to investigate the relationships between the important components and find the best conditions for oil absorption. Table 5 illustrates the results of CCD’s experimental runs, including the experimental and predicted values for two critical factors: packing density (g/cm3) and oil concentration % (v/v). The remaining non-significant factors, temperature (°C) and time (min), were not further optimised during the CCD analysis and were only employed at its low (−) or high (+) levels. Generally, it is recommended that the (+) value be employed when the factor exerted a positive influence and the (−) value when a negative influence was exerted. In the figure, the oil absorption levels ranged from 0.00 to 19.74 mL. According to ANOVA (Table 6), the model was significant (p < 0.01), based on a quadratic model. The R2 value of 0.9011 shows that the model used was acceptable. The linear terms (A and B) as well as the quadratic term (B2) were significant; however, another quadratic term (A2) and interacting terms (AB) were insignificant. The oil absorption (Y) model equation efficiency is listed in Equation (6).
Y = + 15.03 + 3.29A + 3.75B + 3.00AB + 0.03A2 − 6.31B2
Design-Expert Software version 13.0.5 was used to visualise the interaction effects between two pairs of variables while keeping the other variables constant. The largest oil absorption was expected near the top of the 3D surface map, where the optimum parameter values were obtained. Figure 9 shows the response surface contour plot generated based on the significant interaction terms identified in Table 6. The factors involved were packing density and oil concentration, which are denoted as A and B, respectively. The contour plot indicated the most oil was absorbed in an oil concentration of 5–10 mL and a packing density of 0.1–0.11 g/cm3. Packing density and oil concentration both affected the efficiency of oil absorption. The robustness of these models was validated by comparing the predicted response in CCD to the experimental runs.

3.4.3. Model Validation Experiment

The model was validated by performing an experimental trial using the combination of the two significant variables, packing density and oil concentration, as displayed in Table 7. The programme predicted 16.64 mL of total oil absorption for RSM. Using the given conditions (0.14 g/cm3 packing density and 21.12% (v/v) oil concentration), the experimental result of 22.23 mL was obtained. The experimental and predicted values closely agreed, validating the model. In OFAT, employing GG heated at 110 °C for 15 min, then packed at a packing density of 0.14 g/cm3, and subjected to 10% (v/v) diesel resulted in 18.83 mL of total oil absorbed. The difference in total oil absorbed between OFAT and RSM was 3.4 mL, indicating that RSM provided a slight improvement over the usage of OFAT alone. The findings demonstrated that the RSM design provided a suggested approach to the efficacy of oil absorption when compared to OFAT.

4. Conclusions

In summary, the potential of GG fibres as a suitable biosorbent for oil spill removal was assessed. According to the FT-IR results, a significant number of functional groups from both untreated and treated GG before and after sorption were identified, which may enhance and influence the adsorptive properties. Several parameters influenced the selectivity and efficiency of the oil absorbed such as temperature, time of heating, packing density, and oil concentration. Optimisation using the statistical approach (RSM) resulted in greater efficiency of oil absorbed with 74.25% (22.33 mL) compared to the conventional approach (OFAT) with 47.1% (18.83 mL). Ultimately, RSM aided in the improvement of GG performance. The RSM findings on the efficiency of diesel absorbed by GG revealed significant parameters, particularly packing density and oil concentration, as well as potential interactions influencing the responses. Natural materials such as GG are environmentally friendly, sustainable, have a minimal carbon footprint, and are inexpensive. The usage of GG in this investigation may be technically possible, therefore considerably contributing to oil spill cleaning. Further research into GG as a sorbent material for oil absorption will improve the use of agricultural waste as a bioremediation tool. A detailed characterisation through SEM and EDX analysis of GG should be conducted further to improve the performance of GG as an effective cellulosic material for oil absorption.

Author Contributions

Conceptualization, S.A.A. and N.A.S.; methodology, S.A.A., A.A.A., N.A.S., F.E.K., N.N.Z. and K.A.K.; software, F.E.K., N.N.Z., A.A.A. and K.A.K.; validation, S.A.A., N.A.S., A.A.A., S.S. and K.A.K.; formal analysis, F.E.K., S.A.A., N.A.S., A.A.A., S.S. and K.A.K.; investigation, F.E.K.; resources, S.A.A. and N.A.S.; data curation, F.E.K., S.A.A., N.A.S., A.A.A. and K.A.K.; writing—original draft preparation, F.E.K.; writing—review and editing, S.A.A., N.N.Z., A.A.A., N.A.S., S.S., K.A.K., C.G.-F., A.Z. and S.L.; visualization, F.E.K.; supervision, S.A.A., N.A.S., K.A.K., C.G.-F., A.Z. and S.S.; project administration, S.A.A., A.A.A. and N.A.S.; funding acquisition, S.A.A. and A.A.A. All authors have read and agreed to the published version of the manuscript.

Funding

This project was financially supported by the YPASM Smart Partnership Initiative (6300247), disbursed by the Sultan Mizan Antarctic Research Foundation (YPASM). APC has been funded by Universiti Putra Malaysia (UPM) and Universiti Malaysia Terengganu (UMT). The authors also thank the Majlis Amanah Rakyat (MARA) for granting a personal scholarship to F.E. Khalid.

Institutional Review Board Statement

Not applicable.

Informed Consent Statement

Not applicable.

Data Availability Statement

Not applicable.

Acknowledgments

The authors would like to thank Eco-Remediataion Technology, Universiti Putra Malaysia, Universiti Malaysia Terengganu, Universiti Teknologi MARA, and Universidad de Magallanes, Shibaura Institute of Technology and Hoseo University.

Conflicts of Interest

The authors declare no conflict of interest.

References

  1. Song, J.; Han, W.; Dong, S.; Fang, C.; Cheng, Y.; Liu, D.; Zhang, X. Constructing hydrothermal carbonization coatings on carbon fibers with controllable thickness for achieving tunable sorption of dyes and oils via a simple heat-treated route. J. Colloid Interface Sci. 2020, 559, 263–272. [Google Scholar] [CrossRef] [PubMed]
  2. Anuzyte, E.; Vaisis, V. Natural oil sorbents modification methods for hydrophobicity improvement. In Energy Procedia; Elsevier Ltd.: Amsterdam, The Netherlands, 2018; Volume 147, pp. 295–300. [Google Scholar] [CrossRef]
  3. Bhardwaj, N.; Bhaskarwar, A.N. A review on sorbent devices for oil-spill control. Environ. Pollut. 2018, 243, 1758–1771. [Google Scholar] [CrossRef] [PubMed]
  4. Crini, G.; Lichtfouse, E.; Wilson, L.D.; Morin-Crini, N. Conventional and non-conventional adsorbents for wastewater treatment. Environ. Chem. Lett. 2019, 17, 195–213. [Google Scholar] [CrossRef]
  5. Zoroufchi Benis, K.; Motalebi, D.A.; McPhedran, K.N.; Soltan, J. Treatment of aqueous arsenic—A review of biosorbent preparation methods. J. Environ. Manag. 2020, 273, 111126. [Google Scholar] [CrossRef]
  6. Yap, K.L.; Lee, C.M.; Gan, Y.L.; Tang, T.K.; Lee, Y.Y.; Tee, T.P.; Lai, O.M. High intrinsic biosorption efficiency of cattle manure on Cr (VI): A potential low-cost fibre-rich biosorbent. Pertanika J. Sci. Technol. 2018, 26, 193–214. [Google Scholar]
  7. Jmaa, S.B.; Kallel, A. Assessment of performance of Posidona oceanica (L.) as biosorbent for crude oil-spill cleanup in seawater. Biomed Res. Int. 2019, 2019, 6029654. [Google Scholar] [CrossRef] [Green Version]
  8. Kenzhaliyev, B.K.; Surkova, T.Y.; Berkinbayeva, A.N.; Dosymbayeva, Z.D.; Mukhanova, A.A.; Abdikerim, B.E. Development of a method of modifying a natural sorbent for uranium extraction. J. Chem. Technol. Metall. 2020, 55, 1041–1046. [Google Scholar]
  9. Crini, G. Non-conventional low-cost adsorbents for dye removal: A review. Bioresour. Technol. 2006, 97, 1061–1085. [Google Scholar] [CrossRef]
  10. Singh, A.; Saini, P. Biosorption: A novel biotechnological application for removal of hazardous pollutants. In Innovations in Food Technology; Springer: Singapore, 2020; pp. 341–360. [Google Scholar] [CrossRef]
  11. Hossain, M.A.; Ngo, H.H.; Guo, W.S.; Setiadi, T. Adsorption and desorption of copper (ii) ions onto garden grass. Bioresour. Technol. 2012, 121, 386–395. [Google Scholar] [CrossRef]
  12. Sindhu, N.; Shehrawat, P.S.; Singh, B. Agricultural waste utilization for healthy environment and sustainable lifestyle. Ann. Agric. Biol. Res. 2015, 20, 110–114. [Google Scholar]
  13. Adejumo, I.O.; Adebiyi, O.A. Agricultural solid wastes: Causes, effects, and effective management. In Strategies of Sustainable Solid Waste Management; IntechOpen: Rijeka, Croatia, 2021. [Google Scholar] [CrossRef]
  14. Song, Y.; Li, H.; Gao, Y.; Yue, Q.; Gao, B.; Kong, W.; Zang, Y.; Jiang, W. Grass-modified graphene aerogel for effective oil-water separation. Process Saf. Environ. Prot. 2019, 129, 119–129. [Google Scholar] [CrossRef]
  15. Habermann, E.; de Oliveira, E.A.D.; Contin, D.R.; Delvecchio, G.; Viciedo, D.O.; de Moraes, M.A.; de Mello Prado, R.; de Pinho Costa, K.A.; Braga, M.R.; Martinez, C.A. Warming and water deficit impact leaf photosynthesis and decrease forage quality and digestibility of a C4 tropical grass. Physiol. Plant. 2019, 165, 383–402. [Google Scholar] [CrossRef]
  16. Aswanimiyuni, A.; Mohamad, N.I.; Haryani, H.; Norfadzrin, F. A comparison of feed intake and growth performance of goats fed guinea grass and napier grass. Malays. J. Vet. Res. 2018, 9, 13–18. [Google Scholar]
  17. Soti, P.; Thomas, V. Review of the invasive forage grass, guinea grass (Megathyrsus maximus): Ecology and potential impacts in arid and semi-arid regions. Weed Res. 2022, 62, 68–74. [Google Scholar] [CrossRef]
  18. Rhodes, A.C.; Plowes, R.M.; Goolsby, J.A.; Gaskin, J.F.; Musyoka, B.; Calatayud, P.A.; Cristofaro, M.; Grahmann, E.D.; Martins, D.J.; Gilbert, L.E. The dilemma of guinea grass (Megathyrsus maximus): A valued pasture grass and a highly invasive species. Biol. Invasions 2021, 23, 3653–3669. [Google Scholar] [CrossRef]
  19. Benabderrahim, M.A.; Elfalleh, W. Forage potential of non-native guinea grass in north african agroecosystems: Genetic, agronomic, and adaptive traits. Agronomy 2021, 11, 1071. [Google Scholar] [CrossRef]
  20. Asemoloye, M.D.; Ahmad, R.; Jonathan, S.G. Synergistic action of rhizospheric fungi with Megathyrsus maximus root speeds up hydrocarbon degradation kinetics in oil polluted soil. Chemosphere 2017, 187, 1–10. [Google Scholar] [CrossRef]
  21. Olatunji, S.O.; Ximba, J.B.; Fatoki, S.O.; Opeolu, O.B. Assessment of the phytoremediation potential of Panicum maximum (guinea grass) for selected heavy metal removal from contaminated soils. Afr. J. Biotechnol. 2014, 13, 1979–1984. [Google Scholar] [CrossRef] [Green Version]
  22. Abad, I.M.G.; Capundag, R.O., Jr.; Gamalo, J.C.; Cordulo, P.A.I.; Lacang, G.C. Phytoremediation potential of selected grass species in the mine tailing pond of Sitio Manlauyan, Gango, Libona. J. Biodivers. Environ. Sci. 2017, 11, 321–328. [Google Scholar]
  23. Khalid, F.E.; Ahmad, S.A.; Zakaria, N.N.; Shaharuddin, N.A.; Sabri, S.; Azmi, A.A.; Khalil, K.A.; Verasoundarapandian, G.; Gomez-Fuentes, C.; Zulkharnain, A. Application of cogon grass (Imperata cylindrica) as biosorbent in diesel-filter system for oil spill removal. Agronomy 2021, 11, 2273. [Google Scholar] [CrossRef]
  24. ASTM. Sorbent Test Program 1999–2000; SAIC: Ottawa, ON, Canada, 2000; pp. 1–24. [Google Scholar]
  25. Venkataraghavan, R.; Thiruchelvi, R.; Sharmila, D. Statistical optimization of textile dye effluent adsorption by Gracilaria edulis using plackett-burman design and response surface methodology. Heliyon 2020, 6, e05219. [Google Scholar] [CrossRef]
  26. Mourabet, M.; El Rhilassi, A.; El Boujaady, H.; Bennani-Ziatni, M.; Taitai, A. Use of response surface methodology for optimization of fluoride adsorption in an aqueous solution by brushite. Arab. J. Chem. 2017, 10, S3292–S3302. [Google Scholar] [CrossRef] [Green Version]
  27. Onwuka, J.C.; Agbaji, E.B.; Ajibola, V.O.; Okibe, F.G. Treatment of crude oil-contaminated water with chemically modified natural fiber. Appl. Water Sci. 2018, 8, 86. [Google Scholar] [CrossRef] [Green Version]
  28. Suryanto, H.; Marsyahyo, E.; Irawan, Y.S.; Soenoko, R. Morphology, structure, and mechanical properties of natural cellulose fiber from mendong grass (Fimbristylis globulosa). J. Nat. Fibers 2014, 11, 333–351. [Google Scholar] [CrossRef]
  29. Klavins, M.; Porshnov, D. Development of a new peat-based oil sorbent using peat pyrolysis. Environ. Technol. 2013, 34, 1577–1582. [Google Scholar] [CrossRef]
  30. Kenes, K.; Yerdos, O.; Zulkhair, M.; Yerlan, D. Study on the effectiveness of thermally treated rice husks for petroleum adsorption. J. Non. Cryst. Solids 2012, 358, 2964–2969. [Google Scholar] [CrossRef]
  31. Cao, S.; Dong, T.; Xu, G.; Wang, F. Study on structure and wetting characteristic of cattail fibers as natural materials for oil sorption. Environ. Technol. 2016, 37, 3193–3199. [Google Scholar] [CrossRef]
  32. Rengasamy, R.S.; Das, D.; Karan, C.P. Study of oil sorption behavior of filled and structured fiber assemblies made from polypropylene, kapok and milkweed fibers. J. Hazard. Mater. 2011, 186, 526–532. [Google Scholar] [CrossRef]
  33. Dong, T.; Xu, G.; Wang, F. Oil spill cleanup by structured natural sorbents made from cattail fibers. Ind. Crop. Prod. 2015, 76, 25–33. [Google Scholar] [CrossRef]
  34. Balogun, A.O.; Adeleke, A.A.; Ikubanni, P.P.; Adegoke, S.O.; Alayat, A.M.; McDonald, A.G. Study on combustion characteristics and thermodynamic parameters of thermal degradation of guinea grass (Megathyrsus maximus) in N2-Pyrolytic and Oxidative Atmospheres. Sustainability 2022, 14, 112. [Google Scholar] [CrossRef]
  35. Alassod, A.; Gibril, M.; Islam, S.R.; Huang, W.; Xu, G. Polypropylene/lignin blend monoliths used as sorbent in oil spill cleanup. Heliyon 2020, 6, e04591. [Google Scholar] [CrossRef] [PubMed]
  36. Onwuka, J.C.; Agbaji, E.B.; Ajibola, V.O.; Okibe, F.G. Kinetic studies of surface modification of lignocellulosic Delonix regia pods as sorbent for crude oil spill in water. J. Appl. Res. Technol. 2016, 14, 415–424. [Google Scholar] [CrossRef]
  37. Ibrahim, S.; Ang, H.M.; Wang, S. Removal of emulsified food and mineral oils from wastewater using surfactant modified barley straw. Bioresour. Technol. 2009, 100, 5744–5749. [Google Scholar] [CrossRef] [PubMed]
  38. Yan, J.; Zhang, L.; Li, X.; Wu, Q.; Liu, J. Effect of temperature on color changes and mechanical properties of poplar/bismuth oxide wood alloy during warm-press forming. J. Wood Sci. 2022, 68, 25. [Google Scholar] [CrossRef]
  39. Boonstra, M.J.; Van Acker, J.; Tjeerdsma, B.F.; Kegel, E.V. Strength properties of thermally modified softwoods and its relation to polymeric structural wood constituents. Ann. For. Sci. 2007, 64, 679–690. [Google Scholar] [CrossRef] [Green Version]
  40. Park, D.; Yun, Y.S.; Park, J.M. The past, present, and future trends of biosorption. Biotechnol. Bioprocess Eng. 2010, 15, 86–102. [Google Scholar] [CrossRef]
  41. Doshi, B.; Sillanpää, M.; Kalliola, S. A review of bio-based materials for oil spill treatment. Water Res. 2018, 135, 262–277. [Google Scholar] [CrossRef]
  42. Rocha, C.G.; Zaia, D.A.M.; da Silva Alfaya, R.V.; da Silva Alfaya, A.A. Use of rice straw as biosorbent for removal of Cu(ii), Zn(ii), Cd(ii) and Hg(ii) ions in industrial effluents. J. Hazard. Mater. 2009, 166, 383–388. [Google Scholar] [CrossRef]
  43. Verasoundarapandian, G.; Zakaria, N.N.; Shaharuddin, N.A.; Khalil, K.A.; Puasa, N.A.; Azmi, A.A.; Gomez-Fuentes, C.; Zulkharnain, A.; Wong, C.Y.; Rahman, M.F.; et al. Coco peat as agriculturalwaste sorbent for sustainable diesel-filter system. Plants 2021, 10, 2468. [Google Scholar] [CrossRef]
  44. Bazargan, A.; Tan, J.; Hui, C.W.; McKay, G. Utilization of rice husks for the production of oil sorbent materials. Cellulose 2014, 21, 1679–1688. [Google Scholar] [CrossRef]
  45. Wong, C.; McGowan, T.; Bajwa, S.G.; Bajwa, D.S. Impact of fiber treatment on the oil absorption characteristics of plant fibers. Bioresources 2016, 11, 6452–6463. [Google Scholar] [CrossRef] [Green Version]
  46. Thirunavukkarasu, A.; Nithya, R.; Sivashankar, R. Continuous fixed-bed biosorption process: A review. Chem. Eng. J. Adv. 2021, 8, 100188. [Google Scholar] [CrossRef]
  47. Xu, Y.; Su, Q.; Shen, H.; Xu, G. Physicochemical and sorption characteristics of poplar seed fiber as a natural oil sorbent. Text. Res. J. 2019, 89, 4186–4194. [Google Scholar] [CrossRef]
  48. Lim, T.T.; Huang, X. Evaluation of kapok (Ceiba pentandra (L.) Gaertn.) as a natural hollow hydrophobic-oleophilic fibrous sorbent for oil spill cleanup. Chemosphere 2007, 66, 955–963. [Google Scholar] [CrossRef]
  49. Wahi, R.; Chuah, L.A.; Choong, T.S.Y.; Ngaini, Z.; Nourouzi, M.M. Oil removal from aqueous state by natural fibrous sorbent: An overview. Sep. Purif. Technol. 2013, 113, 51–63. [Google Scholar] [CrossRef]
  50. Annunciado, T.R.; Sydenstricker, T.H.D.; Amico, S.C. Experimental investigation of various vegetable fibers as sorbent materials for oil spills. Mar. Pollut. Bull. 2005, 50, 1340–1346. [Google Scholar] [CrossRef]
  51. Huang, X.; Lim, T.T. Performance and mechanism of a hydrophobic-oleophilic kapok filter for oil/water separation. Desalination 2006, 190, 295–307. [Google Scholar] [CrossRef]
Figure 1. Experimental setup for the entire procedure: (A) retort stand; (B) holder; (C) opened bottle; (D) beaker.
Sustainability 15 03904 g001
Figure 2. Screening of untreated (UNT) and treated guinea grass (T−110 °C, 60 min) after sorption. Error bars indicates ±SEM for the three replicates.
Sustainability 15 03904 g002
Figure 3. ATR-FTIR spectrum of untreated (UNT) guinea grass before and after sorption.
Sustainability 15 03904 g003
Figure 4. ATR-FTIR spectrum of treated guinea grass before and after sorption. Treated (T) guinea grass was heated at 110 °C for 15 min.
Sustainability 15 03904 g004
Figure 5. Effects of varying temperature (°C) on sorption capacity and oil/water absorption efficiency. Error bars indicates ±SEM for the three replicates.
Sustainability 15 03904 g005
Figure 6. Effects of varying time (min) on sorption capacity and oil/water absorption efficiency. Error bars indicates ±SEM for the three replicates.
Sustainability 15 03904 g006
Figure 7. Effects of varying packing densities (g/cm3) on sorption capacity and oil/water absorption efficiency. Error bars indicates ±SEM for the three replicates.
Sustainability 15 03904 g007
Figure 8. Effects of varying oil concentrations % (v/v) on sorption capacity and oil/water absorption efficiency. Error bars indicates ±SEM for the three replicates.
Sustainability 15 03904 g008
Figure 9. Three-dimensional contour plots generated by Design Expert (Stat Ease, Inc.) of the significantly interacting model terms (a) A: Packing density (g/cm3) and B: Oil concentration % (v/v).
Sustainability 15 03904 g009
Table 1. Experimental values and levels of independent variables tested in PBD.
CodeNameUnitsExperimental Value
Minimum (−1)Maximum (+1)
ATemperature(°C)100.00120.00
BTimemin5.0030.00
CPacking densityg/cm30.100.26
DOil concentration% (v/v)5.0030.00
Table 2. Experimental values and levels of the selected independent factors for CCD.
CodeVariablesUnitsExperimental Value
(−2)(−1)(0)(+1)(+2)
APacking densityg/cm30.0880.100.130.160.172
BOil concentration% (v/v)−0.1785.0017.5030.0035.178
Table 3. Secondary screening of significant parameters affecting diesel absorption using Plackett Burman design for cogon grass (±SEM, n = 3).
RunABCDOil Absorption (mL)
111017.50.1317.515.83
211017.50.1317.519.00
312030.00.165.011.67
41005.00.105.06.33
51205.00.1630.022.33
612030.00.105.06.50
711017.50.1317.518.83
810030.00.1030.014.33
91005.00.165.011.00
101205.00.1630.022.33
1112030.00.1030.014.00
121005.00.1030.013.33
1310030.00.1630.023.67
1411017.50.1317.515.33
1510030.00.165.010.83
161205.00.105.08.00
1711017.50.1317.519.83
1811017.50.1317.515.83
A: Temperature (°C); B: Time of heating (min); C: Packing density (g/cm3); D: Oil concentration % (v/v).
Table 4. Analysis of variance (ANOVA) of the Plackett Burman design (PBD) model used to identify the factor significantly influencing diesel absorption.
SourceSum of SquaresdfMean SquareF-Valuep-Value
Model389.98497.5031.63<0.0001 ***
A-Temperature2.3712.370.76900.3978
B-Time0.453710.45370.14720.7080
C-Packing density128.931128.9341.82<0.0001 ***
D-Oil concentration258.231258.2383.77<0.0001 ***
Residual36.99123.08
Lack of Fit17.2962.88
Pure Error19.7063.28
Cor Total483.2217
Std. Dev.1.76 R20.9134
Mean14.94 Adjusted R20.8845
C.V.11.75 Predicted R20.8146
Adequate Precision16.4967
A: Temperature (°C); B: Time of heating (min); C: Packing density (g/cm3); D: Oil concentration % (v/v); *** p < 0.001.
Table 5. Optimisation of parameters for diesel absorption using Central Composite Design (CCD) (±SEM, n = 3).
RunADOil Absorption (mL)
Experimental ValuePredicted Value
10.08817.5010.6710.43
20.105.002.334.71
30.1030.008.506.21
40.13−0.180.000.00
50.1317.5015.1715.03
60.165.003.835.29
70.1317.5014.0015.03
80.1317.5016.0015.03
90.1717.5018.6719.74
100.1317.5017.0015.03
110.1630.0022.0018.79
120.1335.184.007.72
130.1317.5013.0015.03
A: Temperature (°C); D: Oil concentration % (v/v).
Table 6. Analysis of variance (ANOVA) of the Central Composite design (CCD) model used to identify the factor significantly influencing oil absorption.
SourceSum of SquaresdfMean
Square
F-Valuep-Value
Model516.905103.3812.760.0021 **
A-Packing density86.55186.5510.680.0137 *
B-Oil concentration112.431112.4313.880.0074 **
AB36.00136.004.440.0730
A20.004310.00430.00050.9822
B2276.841276.8434.170.0006 ***
Residual56.7178.10
Lack of Fit46.69315.566.210.0550
Pure Error10.0242.51
Cor Total573.6112
Std. Dev.2.85 R20.9011
Mean11.17 Adjusted R20.8305
C.V.25.49 Predicted R20.3939
Adequate Precision11.6977
A: Packing density (g/cm3); B: Oil concentration % (v/v); * p < 0.05, ** p < 0.01, *** p < 0.001.
Table 7. Model validation of predicted optimum factor values.
Optimised ParametersValuePredicted ValueExperimental ValueEfficiency
Packing density0.14 g/cm316.64 mL22.33 mL74.52%
Oil concentration21.12% (v/v)
Disclaimer/Publisher’s Note: The statements, opinions and data contained in all publications are solely those of the individual author(s) and contributor(s) and not of MDPI and/or the editor(s). MDPI and/or the editor(s) disclaim responsibility for any injury to people or property resulting from any ideas, methods, instructions or products referred to in the content.

