Article

High-Efficiency Microplastic Sampling Device Improved Using CFD Analysis

1
Department of Environmental and Energy Engineering, Yonsei University, Wonju 26493, Republic of Korea
2
Water Environmental Safety Management Department, K-Water, Daejeon 34045, Republic of Korea
*
Author to whom correspondence should be addressed.
Sustainability 2023, 15(5), 3907; https://doi.org/10.3390/su15053907
Submission received: 2 February 2023 / Revised: 17 February 2023 / Accepted: 17 February 2023 / Published: 21 February 2023
(This article belongs to the Topic Microplastics Pollution)

Abstract

:
Since microplastics are considered harmful to the human body, studies on their samplings, pretreatments and analyses environmental media, such as water, are continuously being conducted. However, a standard sampling and pretreatment method must be established, particularly because microplastics of a few micrometers in size are easily affected by external contamination. In this study, a microplastic sampling device was designed and developed to obtain a high recovery rate of microplastics and prevent plastics contamination during all processes. For the evaluation of the developed device, microplastic reference materials were produced and used, and computational fluid dynamics (CFD) analysis was performed. This device has not only been applied to the relatively large previously studied microplastics (100 µm) but also to microplastics of approximately 20 µm that are vulnerable to contamination. A recovery rate of 94.2% was obtained using this device, and the particles were separated by filtration through a three-stage cassette. In conclusion, we propose a method to increase the accuracy and reproducibility of results for microplastic contamination in the environment. This method is able to consistently obtain and manage microplastics data, which are often difficult to compare using various existing methods.

1. Introduction

Microplastics are plastics with a diameter of less than 5 mm. They are classified as either primary and secondary microplastics, which are produced by human activities and environmental decomposition, respectively. Recently, microplastics have attracted much research attention because of their toxicity, bioaccumulation [1,2,3,4], and organic matter transportation [5]. Microplastics can cause contamination problems in all environmental media, such as fresh water, tap water, sea, air, and soil [6,7,8,9,10]. Secondary microplastics are microplastics produced by the decomposition of discharged plastics and pose a higher risk to the environment and life forms as their size decreases over time [11,12,13,14]. In particular, microplastics with sizes of a few microns are involved in bioaccumulation and organic matter accumulation [1,5,15]. However, research on microplastic sampling and analysis methods is being actively conducted, and ISO standardization is in progress (ISO/DIS 24187).
The most widely used devices for isolating plastic particles in the aqueous phase are the manta trawl, plankton net, and Van Dorn sampler [16]. However, there are disadvantages to using these samplers, and additional equipment, such as a boat, is required to transport large samplers during the research process. Additionally, a manta trawl cannot be used for microplastics of less than 50 µm in diameter, and it is difficult to control tool contamination [17,18,19,20]. To overcome these problems, in this study, small-sized microplastic samples were collected using the encapsulation and centrifuge methods [17,19]. The encapsulation method consumes less energy, easily controls pollution, and collects microplastics of a few microns in diameter depending on the pore of the woven stainless filter. To improve the device and ensure efficiency, a CFD analysis was conducted to check the fluid flow inside the device, and to identify, predict, and correct the cause of sampling loss. This analysis can identify the cause of a problem by comparing it with the actual result and performing an improved complementary analysis. In addition, in the case of fouling that occurs in sample collection using a filter, studies are currently being conducted to increase the efficiency of sample collection by finding the cause of pressure decreases through CFD [21,22]. In this study, the cause of the pressure decrease that may occur during filter filtration was predicted using modeling and used to solve the problems of previous studies.
Fragments of microplastics present in devices, which are only a few microns in size, can affect the analysis results [23]. The microplastics present in a typical laboratory environment can affect microplastic samples with sizes of a few microns [24,25,26]. In another study of ours, POM fragments were found in environmental and falling blank samples during the sampling process, which used a polyoxymethylene (POM) cassette in the most commonly used low-volume air sampler. However, as a result of using a stainless filter and cassette, the POM cassette was no longer found in the atmospheric sample (Figure 1 and Table 1).
Although the need for contamination control has been frequently reported, the control method used in each study is different. For instance, one study used high-temperature treatment to remove plastic contamination [25]. Another study conducted by Hermsen et al. [27] found that “laboratory preparation” has the second lowest performance in the quality assessment of microplastics. The aim of this study was to develop a high-efficiency and low-cross contamination device to sample microplastics a few microns in sizes and separate them by sizes. A CFD analysis was then used to identify and improve the mechanical defects and sample losses in the developed device.

2. Materials and Methods

2.1. Reagents

A 35% hydrogen peroxide (H2O2) solution was purchased from Daejung Chemical & Metals Co., Ltd., Seoul, Republic of Korea. Ethyl alcohol (C2H6O, 99%) solution and zinc chloride (ZnCl2, 98%) powder were purchased from DUKSAN Pure Chemicals, Inc., Seoul, Republic of Korea. The high-performance liquid chromatography (HPLC) equipment for analyzing field blank samples was purchased from Baker. Distilled, deionized (DI) water was used in all experiments. All reagents were first filtered using a Whatman’s glass fiber filter (GF/F) and then filtered again using an STS filter to remove microplastics and glass fibers from the reagents. Before use, the GF/F and STS filters were washed with ethyl alcohol and oven-dried at 100 °C for 24 h.

2.2. Analytical Devices

The surfaces of the STS filter and plastic were analyzed using scanning electron microscopy (SEM; JSM-IT500). The blank sample was analyzed using μ-Raman spectroscopy (New XploRA Plus, HORIBA, Kyoto, Japan) and silicon filter (Si-filter). Micro-balance (BM-20, A&D, Tokyo, Japan) which has 0.001 mg resolution was used to measure the weight of the STS filter to estimate the recovery rate of the sampler and pretreatment process.

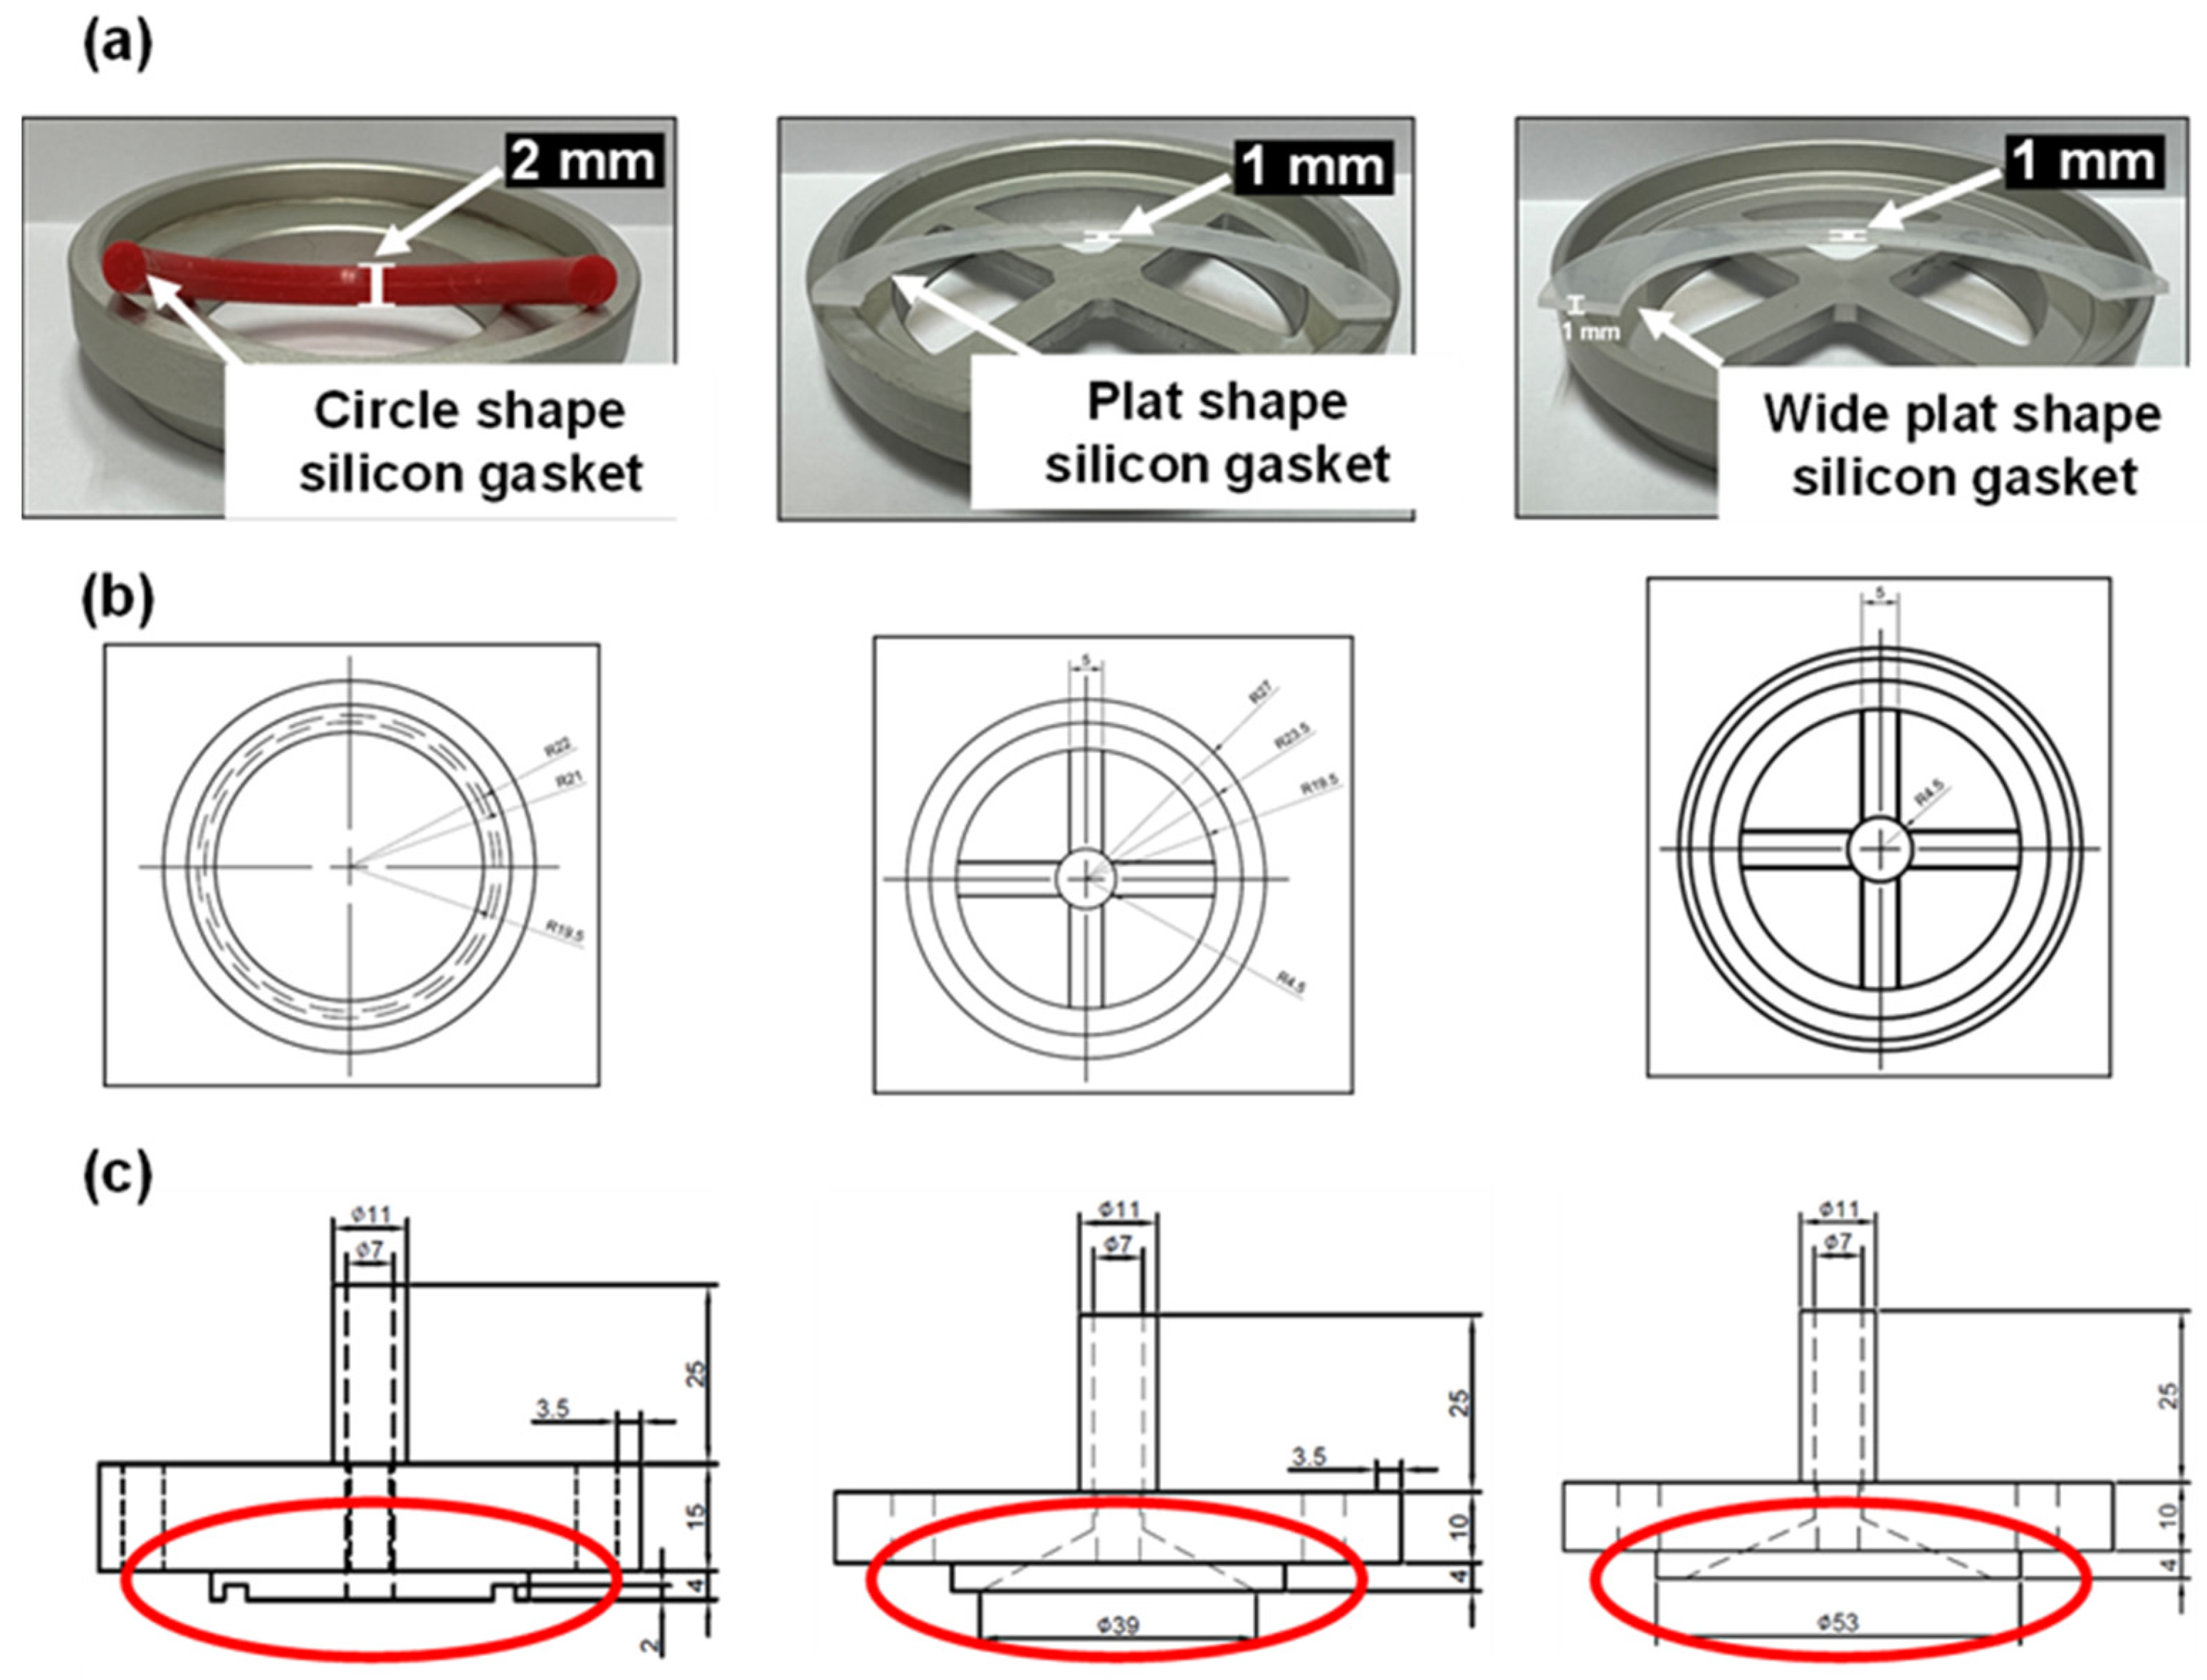
2.3. Sampling and Pretreatment Device Development

A device was developed to sample small-sized microplastics over 5 µm in environmental media. In addition, it was modified into three types according to the problems that occurred during the sampling process. The sampling device is based on a filtration method to allow for flexible filter pore size and easy filter replacement after contamination. Each device was manufactured according to the design depicted in Figure 2. All sampling devices consisted of a housing and cassette, and each cassette was watertight with a silicone O-ring or gasket. The cassettes could be easily stacked in multiple stages within the housing. In the case of conventional sampling and pretreatment devices, additional units (several individual housings) or processes for size classification were required. However, the developed sampling device requires only one compact housing and several optional cassettes for size classification. In this study, three-stage cassettes equipped with filters of different pores were used for size classification. The devices were made from an aluminum alloy with a low cost, easy machinability, light weight, and higher chemical resistance than conventional metals such as stainless steel. The device was modified and supplemented to increase the recovery rate of the microplastic sampler. Similar to other studies, by applying a stainless steel (STS) filter, it was possible to collect a large volume of samples and microplastics measuring several microns with the device at the user’s discretion. In addition, the STS filter could withstand vacuum pump pressure and had a strong chemical resistance, maintaining filter pore during sampling and pretreatment.

2.4. Computational Fluid Dynamics (CFD) Analysis

The water flow of the sampling device was simulated using Flow-3D software (Flow Science, Inc., Santa Fe, NM, USA). The solver version was 12.0.3.02 lnx64 02/05/2021 HPC. More details regarding the software, hardware, and fluid properties are provided in Table S1. Before the CFD analysis, the flow velocity was studied in the following three cases:
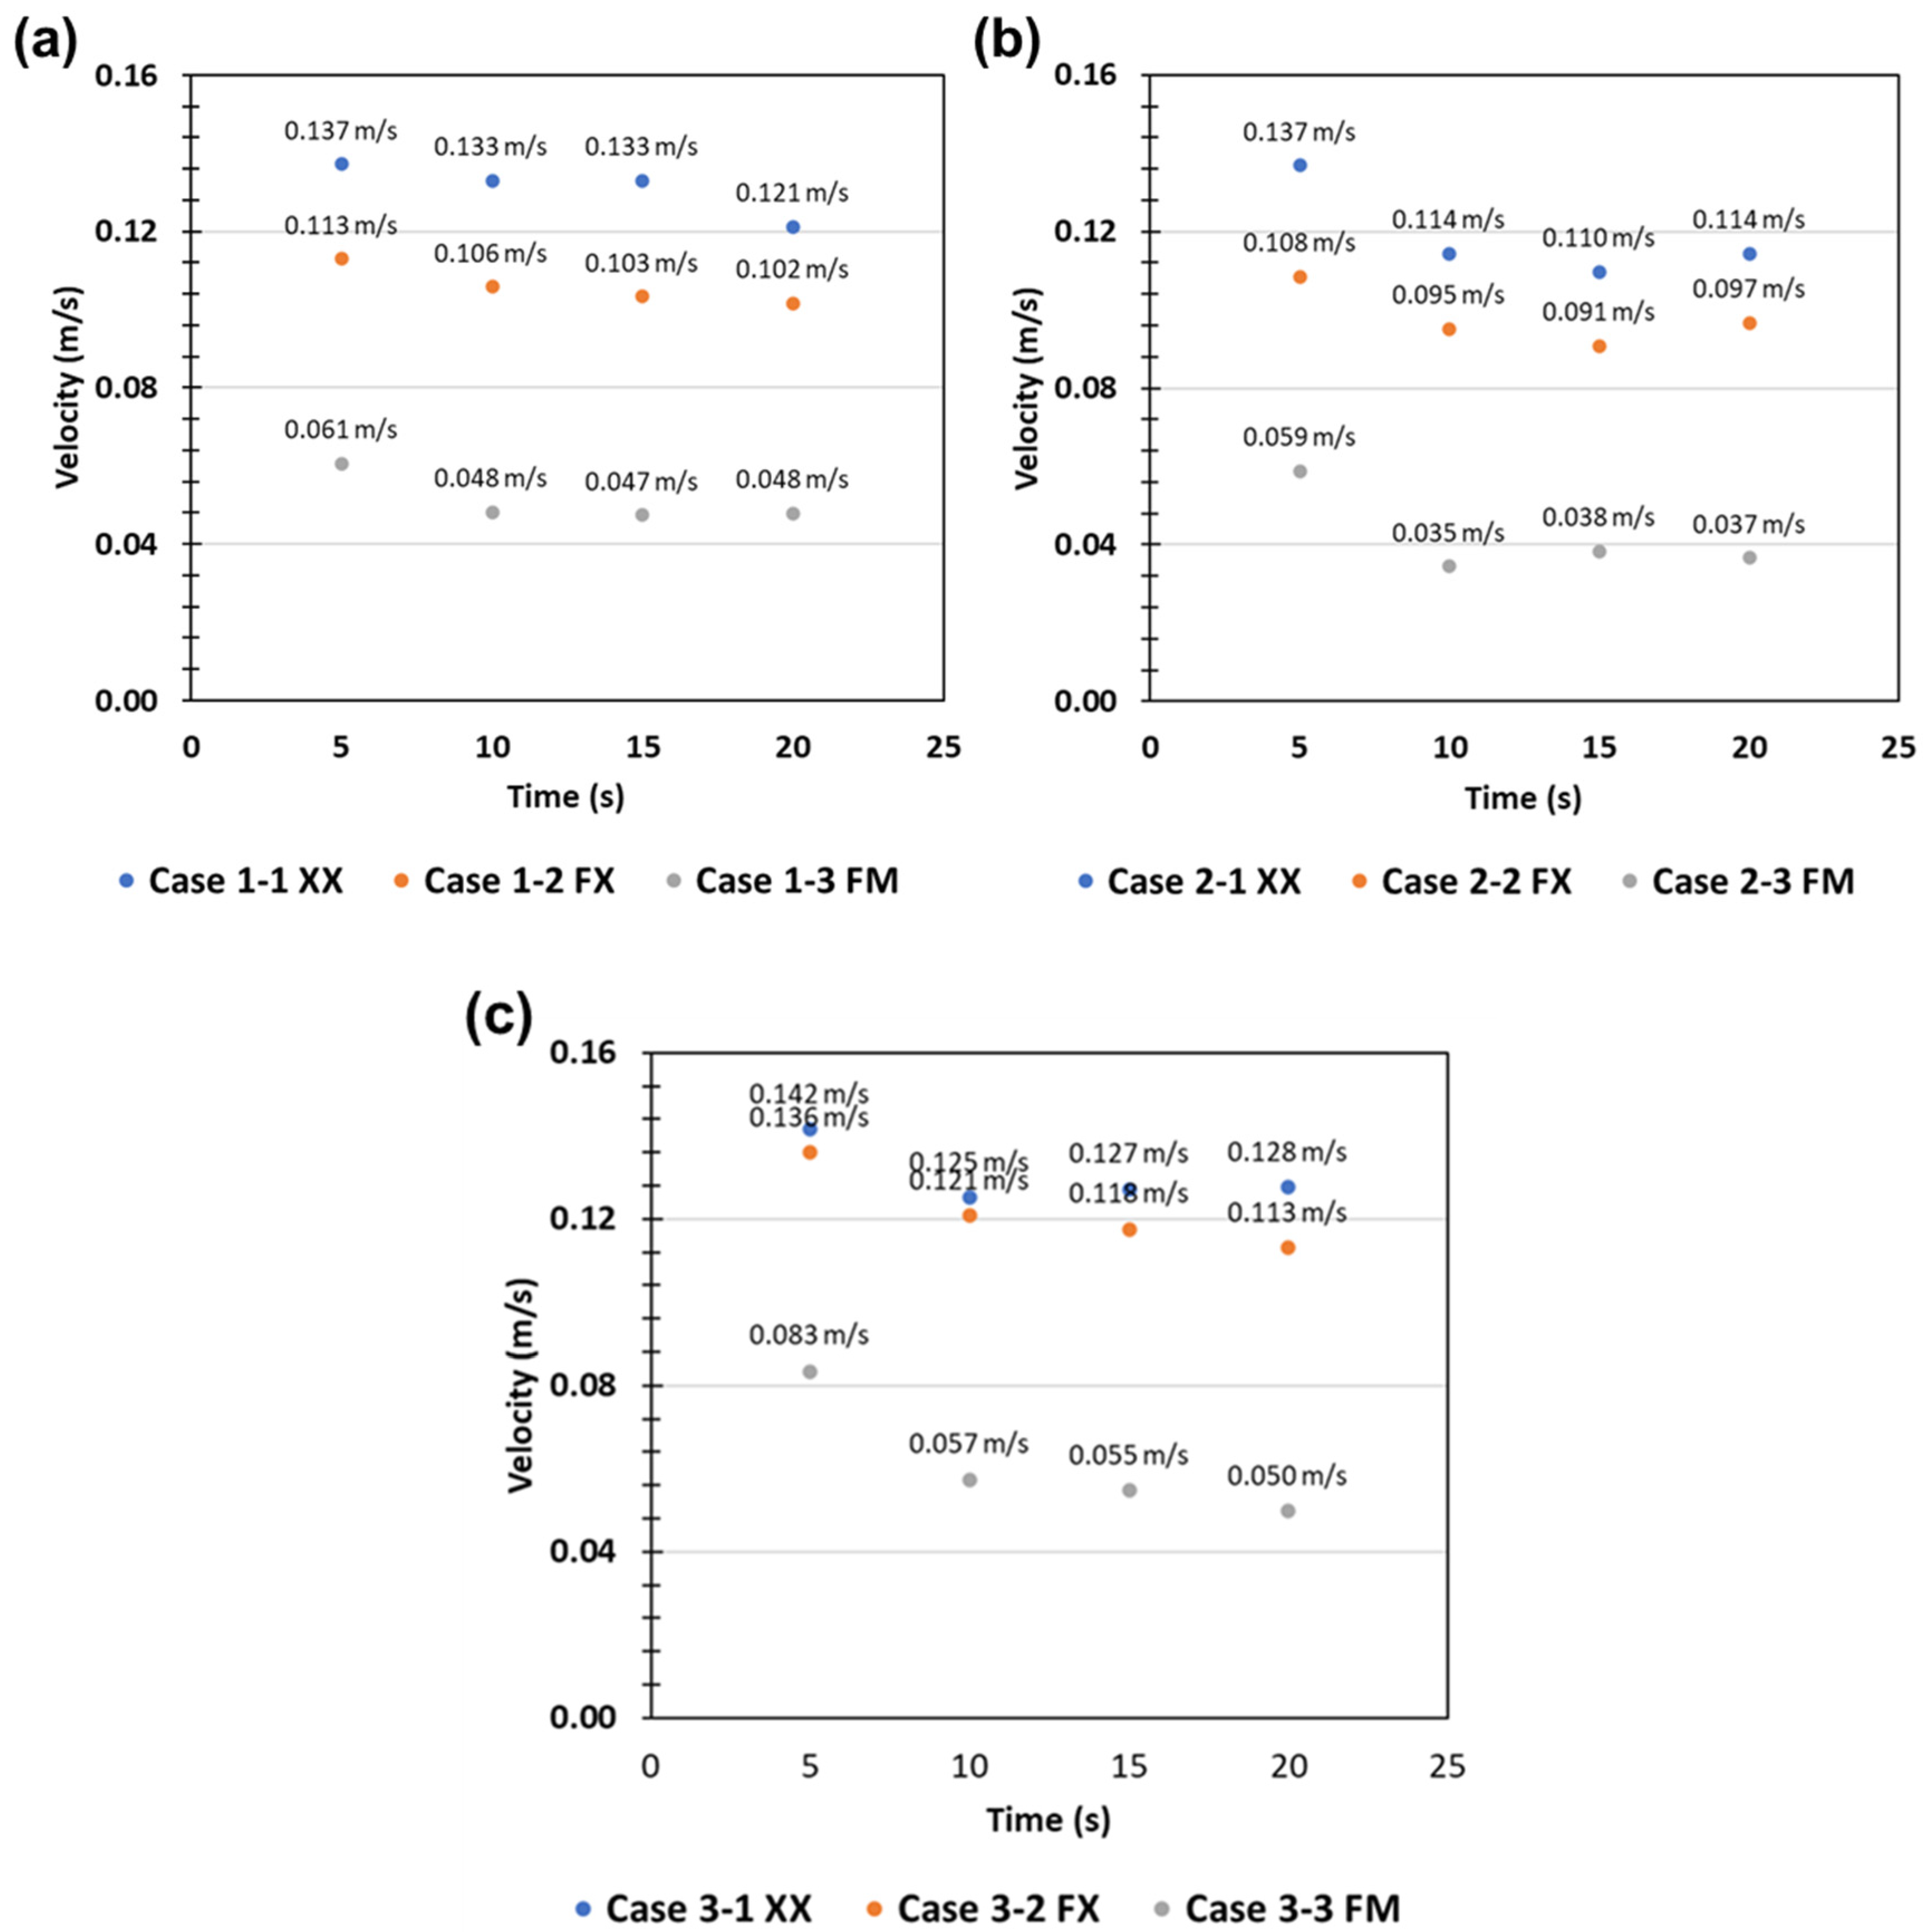
  • Case 1 (XX): Filtration without filters and microplastics.
  • Case 2 (FX): Filtration with an STS filter inside the device without microplastics.
  • Case 3 (FM): Filtration with an STS filter inside the device and 30 mg of microplastic solution dispersed in 30 mL of ethanol.
The amount of microplastics selected for the flow velocity experiment was set at 30 mg, which minimizes the influence of external factors such as air flow and vibration on the measured value of the ultra-microbalance. Since the device has a symmetrical structure, the simulation was carried out for only one quarter of the device, and the microplastic particles were excluded from the CFD analysis.

2.5. Reference Material Recovery of the Sampling Device

The recovery rate of the sampling device was confirmed by the difference in weight before and after the filtration of microplastics of 20 µm or less using an ultra-microbalance. A woven STS filter was used for filtration to prevent plastic contamination using a membrane filter, and the SEM image is shown in (Figure 3). The microplastic reference materials used were polypropylene (PP), polystyrene (PS), polyethylene terephthalate (PET), polyvinyl chloride (PVC), and polyethylene (PE). These five plastics are the most frequently found plastics in the environment [28].
The microplastics were prepared with multi-stage sieve shaking after ultrafine grinding at the Korea Testing & Research Institute (KTR). Two types of microplastic reference materials produced by Bundesanstalt fuer Materialforschung und -pruefung (BAM) in Germany, PS and PE, with diameters in the range of 10–300 µm, were used. The microplastics produced by KTR are diverse and several micrometers in size. These reference materials were divided into two size ranges. The first range included microplastics with diameters of dozens of microns, and the second range included microplastics with sizes of a few hundred microns. The lower 10% size, middle size, and upper 90% size for the particle size of each range are shown in (Table 2 and Table 3). The average particle size and the distribution of the microplastics were analyzed using a particle size analyzer (LA-350, HORIBA), and the shape of the particles was confirmed using a SEM analysis (Figure 2).
First, the filter was washed with an 99 % filtered ethanol solution and oven-dried at 90 °C for 1 h in a glass Petri dish. Microplastics were weighed and sonicated in 500 mL of DI water for 30 min. The DI water containing microplastics was filtered through a sampling device that was set to the STS filter on the cassette. After filtration, the STS filter was oven-dried at 90 °C for 1 h and then weighed again. By comparing the injected plastic weight (winj), the difference in the weights of the STS filter before (Fwini) and after (Fwfin) filtration was calculated to estimate the recovery rate of the device (Equation (1)).
Recovery rate   ( % ) = F w f i n F w i n i w i n j × 100
All procedures for the recovery experiment were conducted while covered with an aluminum foil to minimize contamination caused by exposure to air, and a cotton lab coat and neoprene powder-free gloves (Microflex®, Richmond, Australia) were used. All tools and dishes were washed with filtered ethanol and DI water. After filtration, all filters containing Petri dishes were sealed with a paraffin film. All pieces of the device were washed with filtered ethanol and DI water before use. The samples were covered with aluminum foil after oven drying. The device inlet and all sample passages had no contact with any filter or cassette. After using the device, all parts were removed, followed by washing with ethanol and drying in an oven.
The recovery from the pretreatment process was performed using an ultra-microbalance. The STS filter was weighed before and after each pretreatment process to estimate the recovery rate of the sampling device. Pretreatment involved conventional methods such as wet peroxide oxidation (WPO) and density separation with ZnCl2 [29,30] (Figure 4).

3. Result and Discussion

3.1. Sampling Device Modifications

First, the passage of samples cause by the occurrence of wrinkles in the existing filter was minimized, and the loss of samples due to circle-shaped silicon O-rings and low watertightness was reduced (Figure 5a and Figure S2). Circular silicone O-rings were prone to microplastic attachment and loss. The second improvement changed the overall support cross and sealing shape of the cassette so that the filter was positioned inside the gasket. Therefore, the filter wrinkling phenomenon was further prevented as shown in Table 4. The height difference due to filter crumpling disappeared via improvements in the sampling device (Table 4, Figure S2), and watertightness was improved to prevent the sample from passing through the side of the filter; this was verified by the 3.3 size distribution. Furthermore, a support structure was added to the cassette to prevent the wrinkling of the filter and to divide the sampling sites for analysis (Figure 5b). Finally, the upper space of the device was increased by improving the flow inside the device to weaken turbulence and flow velocity (Figure 5c).

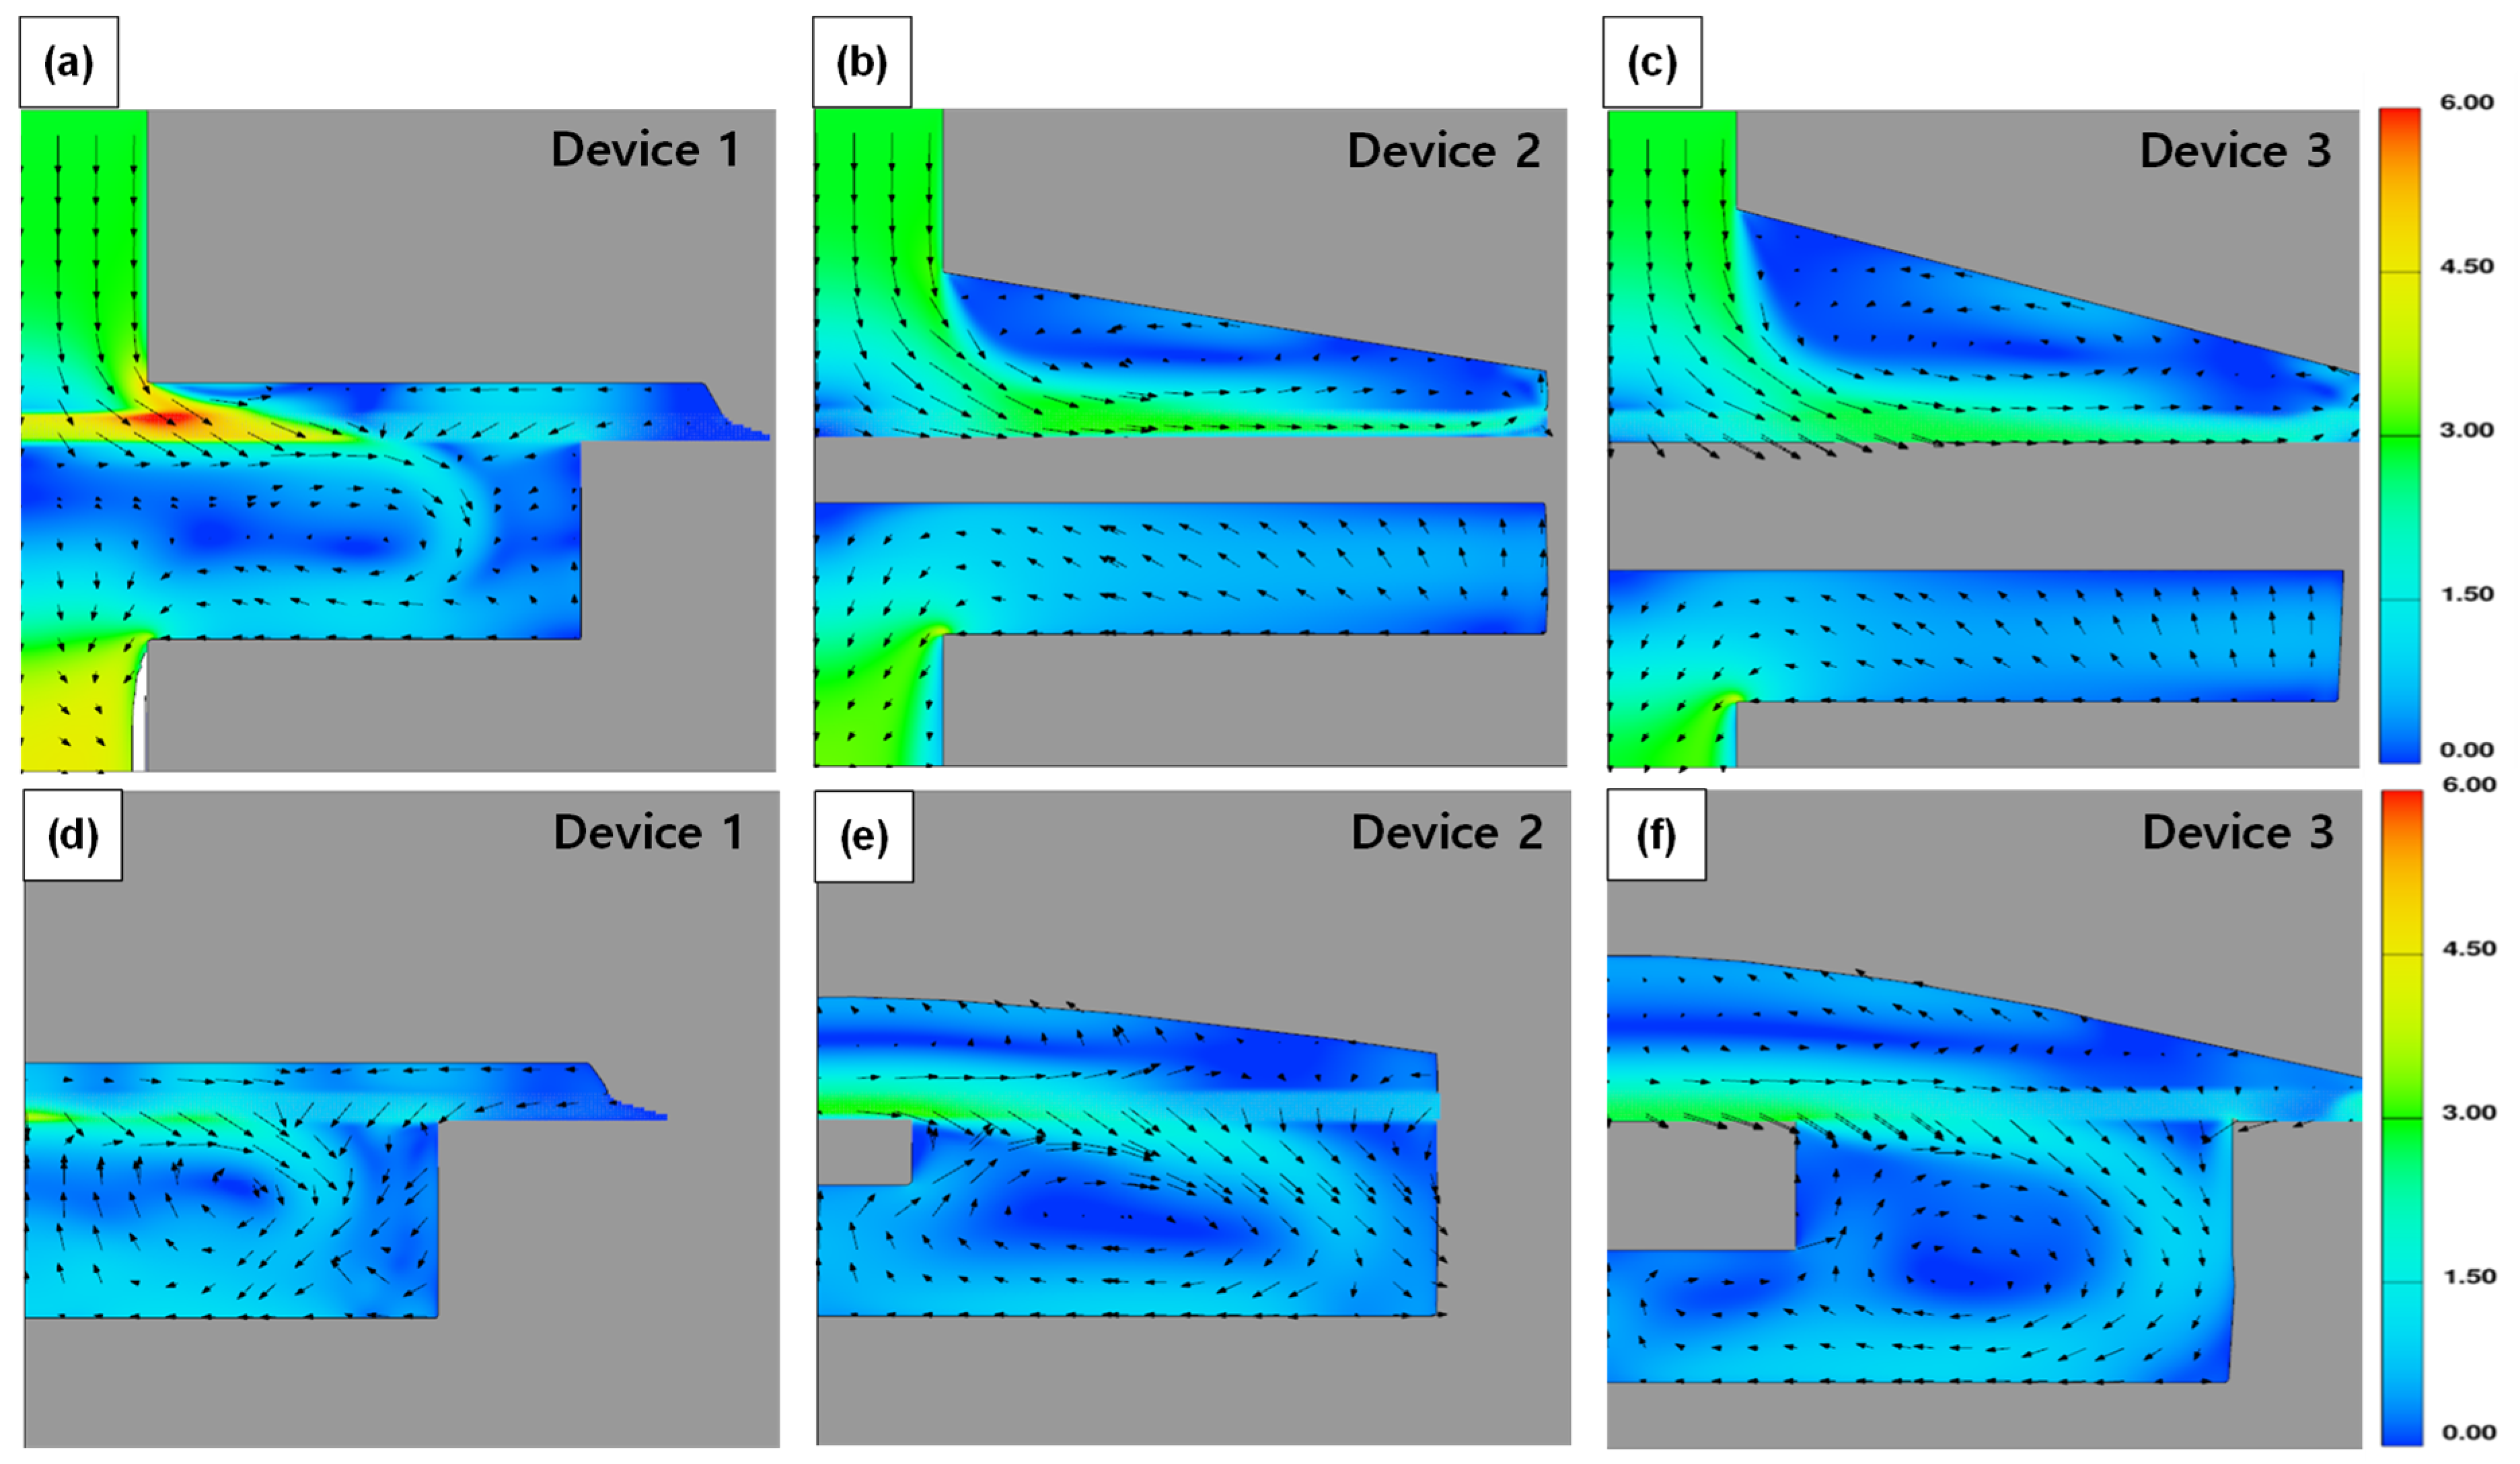
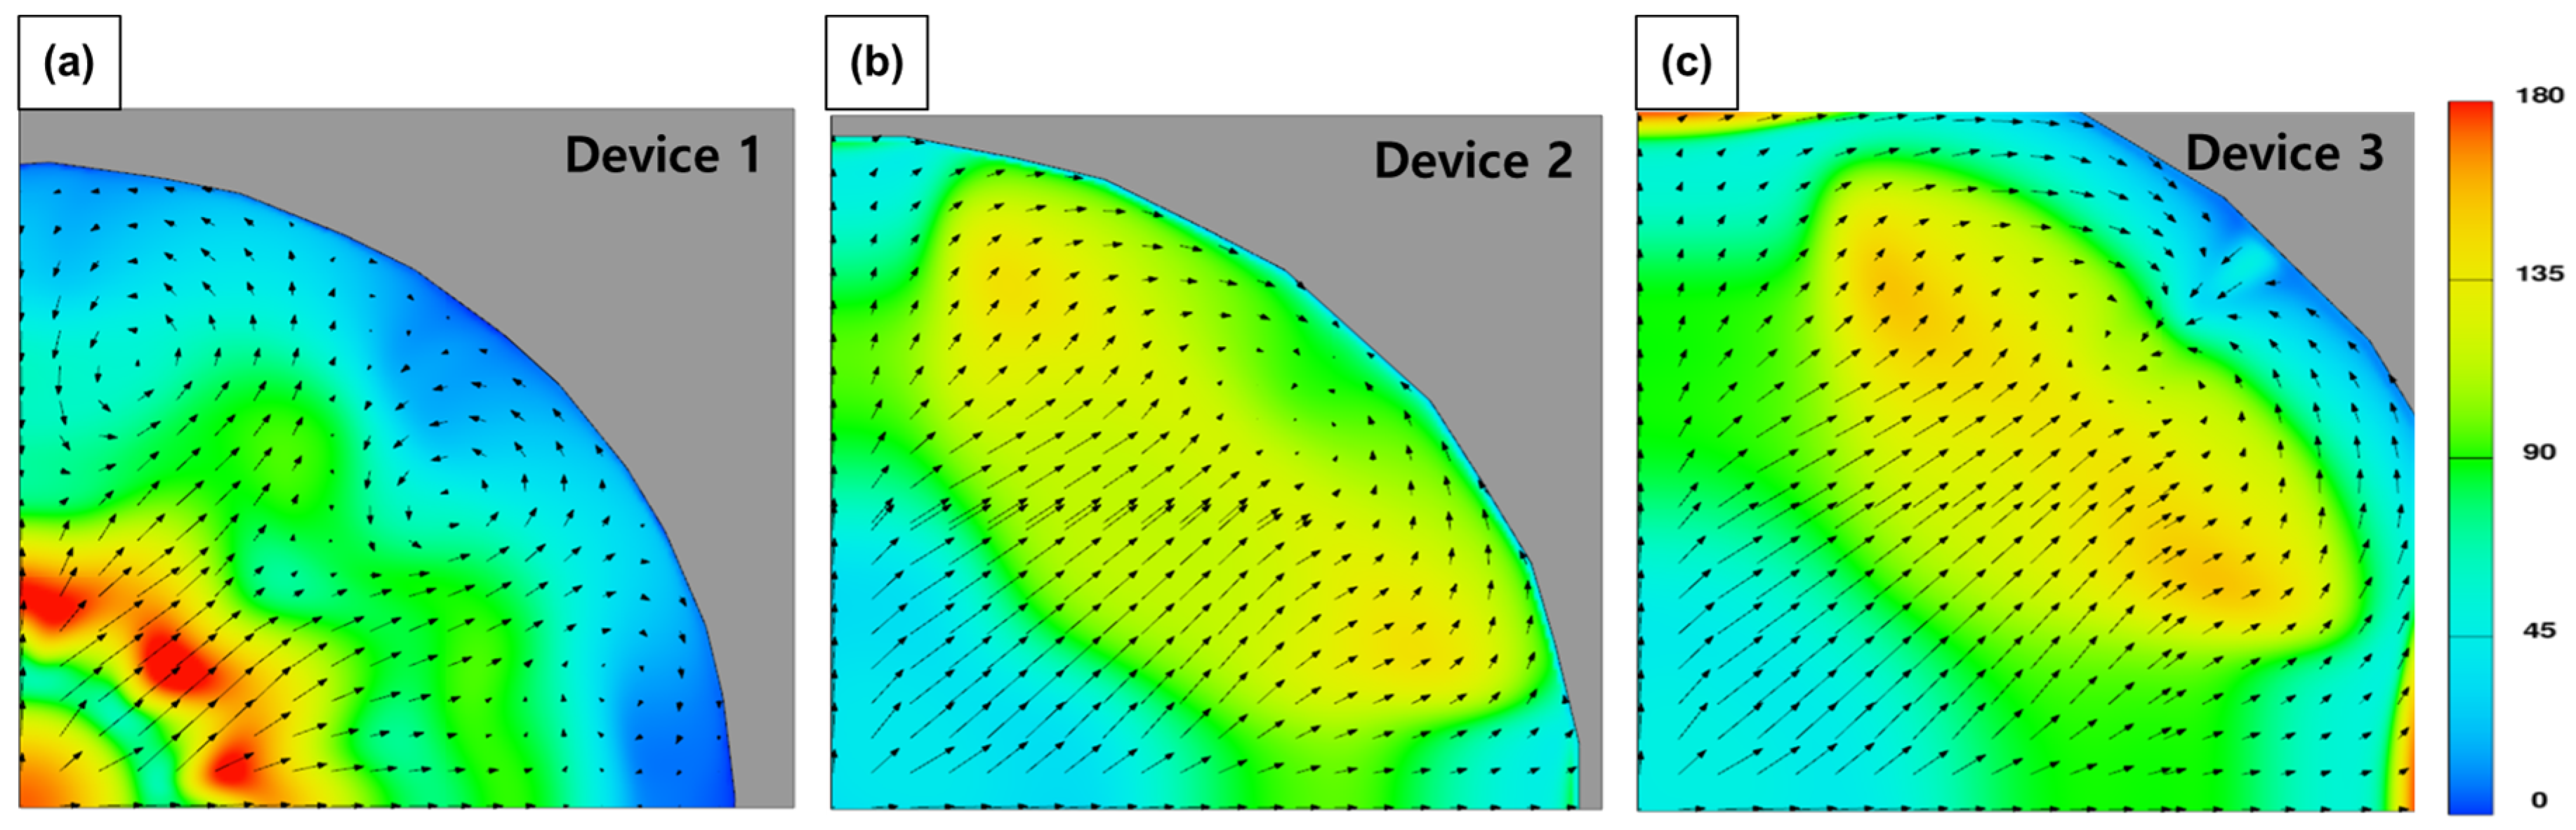
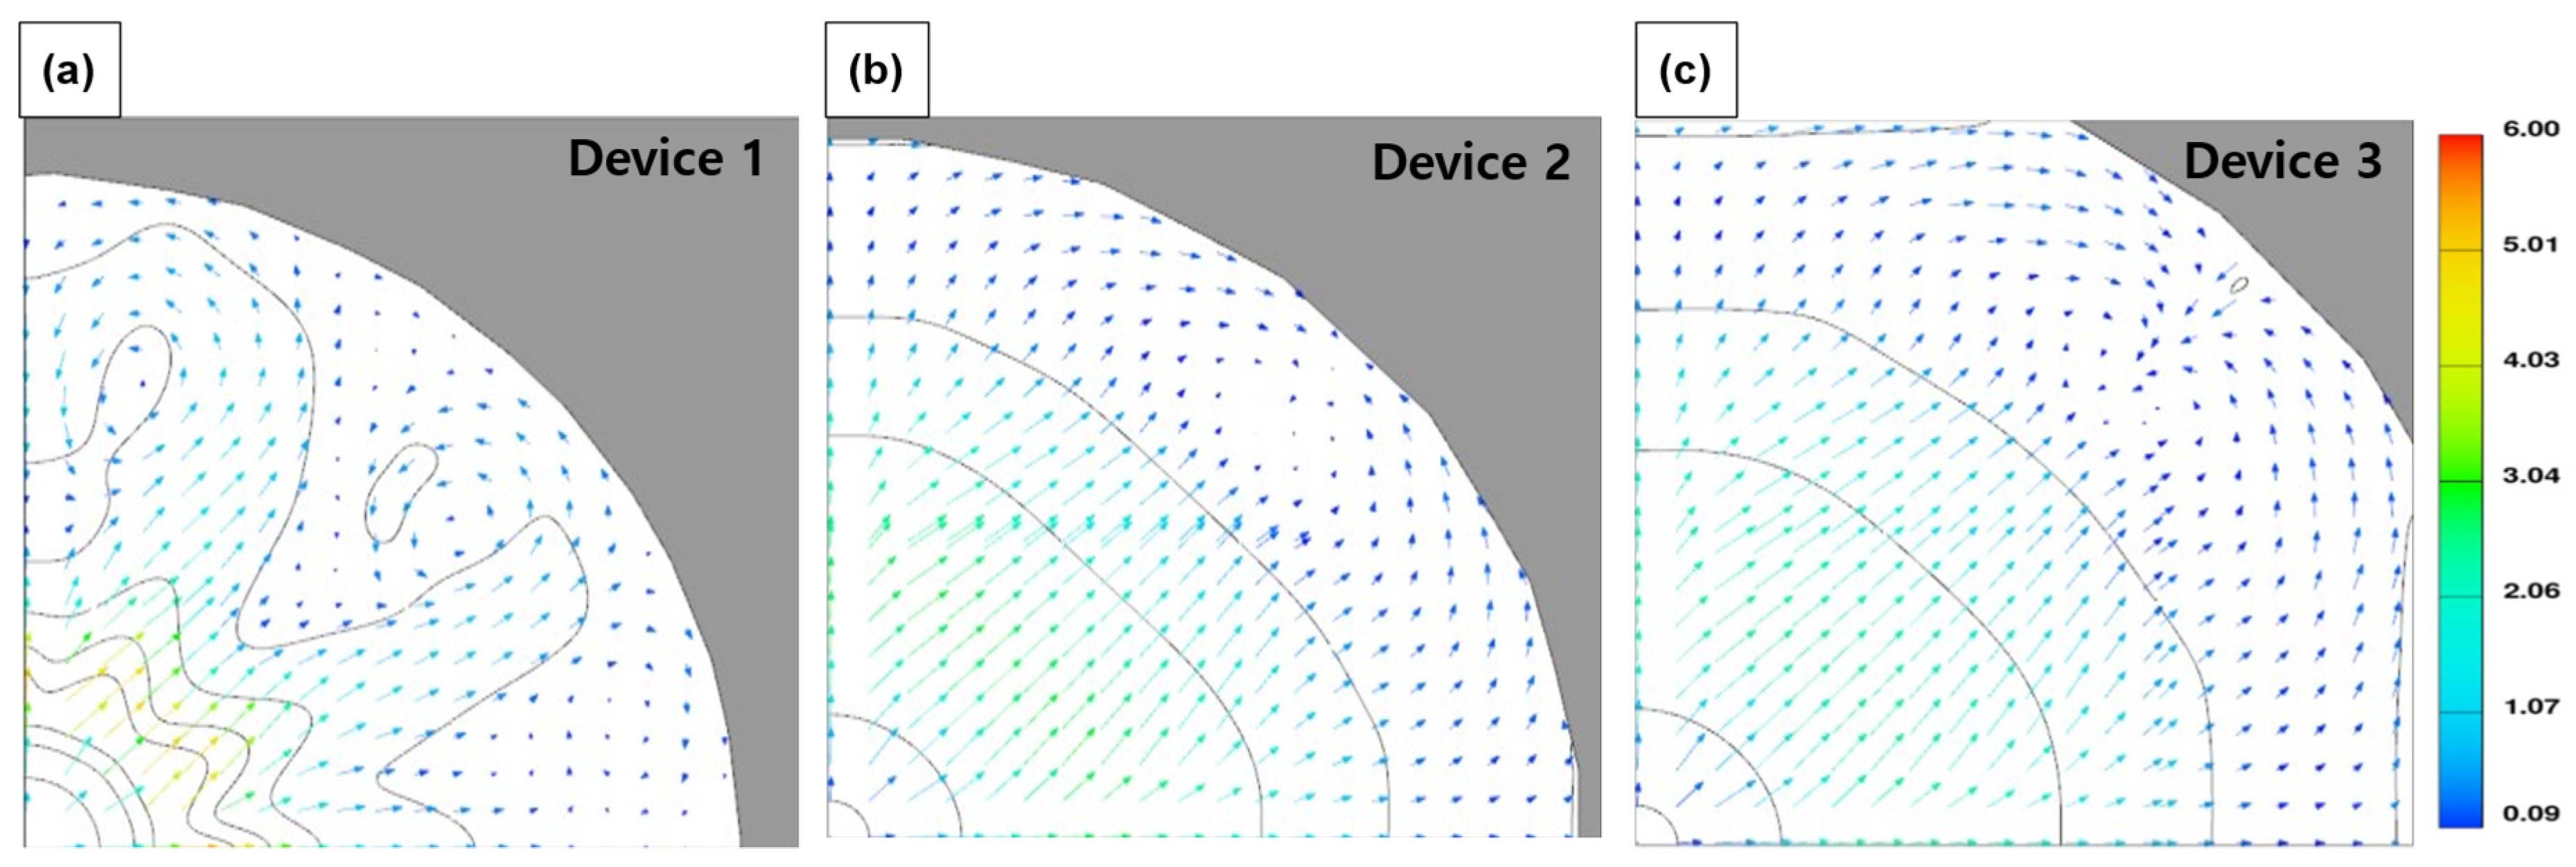
3.2. Changes in Flow Velocity and Turbulence in the Device

Figure 6 shows the average flow velocity (Superficial velocity to filtration direction; top to down) via—the sampling devices. Device 1 and 2 showed a relatively low flow velocity compared to Device 3 in the cases of XX and FX. This indicated that head loss in Device 3 was low compared to the other devices due to its structure. Device 3 had a relatively larger volume in the space between the cassette and the housing (Figure 2, Figure 5 and Figure 7). On the other hand, in Device 1, the water flow was obstructed due to the sudden expansion at the end of the inlet pipe, and the flow between the filter and the top of the housing was restricted due to the very narrow space between the cassette and the housing. As a result, the horizontal flow over the filter was restricted, and rapid vortices and turbulences were formed, intensifying the flow toward the center of the filter. CFD simulation results also supported this, as shown in Figure 8. In Device 1, unlike the other cases, strong turbulence formation could be seen at the outer edge of the central inlet pipe. The flow velocity distribution on the filter surface also showed strong fluctuations in Device 1 as shown in Figure 9.
This structural feature of Device 1 could lead to two poor outcomes as a sampling device. One outcome is that microplastics tend to be pushed out of the center of the filter and accumulate on the sides due to the concentrated central flow (Figure S2). Furthermore, the lateral flow with strong vortices forces the microplastics into contact with the housing walls O-ring and increases the risk of microplastic loss during the sampling process. Another outcome is the deformation of the filter caused by a centralized flow. The relatively unbalanced flow applies a strong vertical force to the center of the filter, which causes filter deformation, as shown in Table 4. In addition, in the case of Device 1, such deformation may be strongly formed due to the absence of a support under the filter. If the filter is deformed in this way, it may make it difficult to handle and increase errors in the analysis.
Meanwhile, the reverse flow at the bottom of the filter was confirmed in the CFD simulation as shown in Figure 8d–f. This reverse flow, which appeared as a rapid change in flow in a narrow space, was believed to decrease the filtration rate and increase resistance, as shown in Figure 7. Devices 2 and 3 had similar structural characteristics, but Device 3 had a larger space above and below the filter and a wider filter support. This structural difference seemed to weaken the reverse flow from the bottom to the top of the filter, as shown in Figure 8e,f. As a result, the flow in the cassette was relatively stable in Device 3, and the filtration stability was relatively secure. This flow stability may affect high recovery during the sampling.

3.3. Size Distribution of Filtered Reference Microplastics with Device

The size classification was performed by applying a three-stage filter to the sampling device, where the pores of the STS filter were 1, 20, and 45 µm in size. Three stages were applied to classify against the minimum particle size of the injected reference material. In the size distribution experiments, a mixture of the two size range reference materials was used. The average particle diameter and cumulative diameter of the reference material filtered through Device 3 are listed in (Table 4, Tables S5 and S6). Microplastics with an average target diameter could be sorted using multi-stage filtration. It is confirmed that the median particle size of microplastics present in the filtered filter increased according to the filter pores installed in Device 3 and was separated by filter pores. However, when the large amount of reference material was injected (over 30 mg), the small size of particles could not enter the next stage due to the fouling of the pores in the first stage. Therefore, the median particle size of some stages equipped with fouled filter, showed smaller than the installed filter pore size (Table 5). Microplastics of several microns present in the environment were difficult to analyze using microscopy and thermal analysis. Therefore, in this study, a relatively large amount of microplastics were used to evaluate the size classification and recovery rate of the device. Thus, fouling occurred in the size classification result. However, since the pretreated microplastic samples from the environments were present in a range of several micrograms [25,31,32,33,34], the fouling phenomenon of the filter was expected to be significantly reduced.

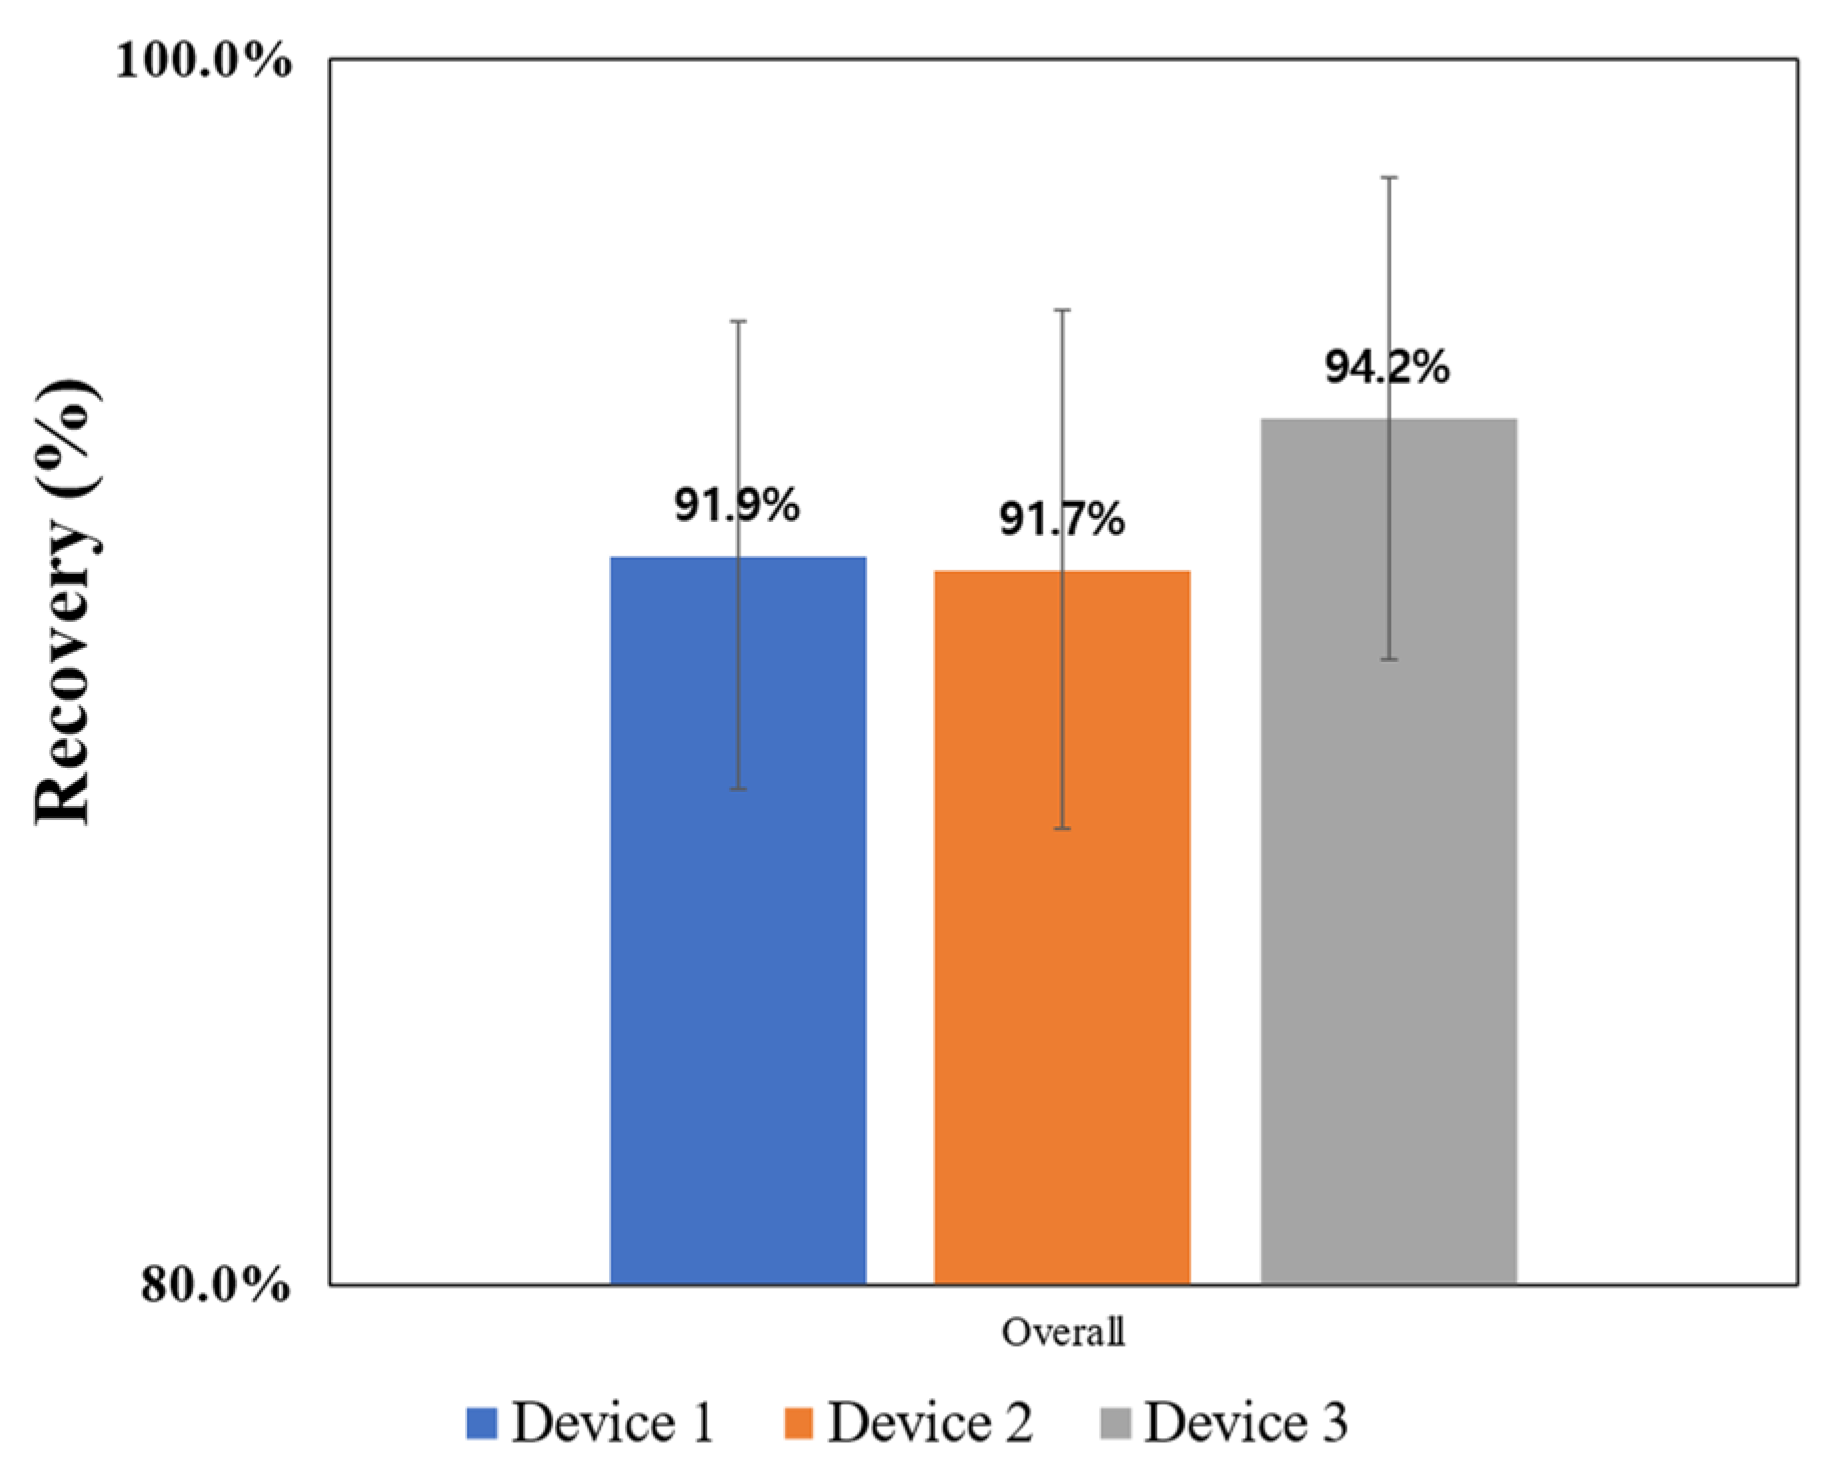
3.4. Microplastic Recovery Results of the Sampling Device

The final recovery rate of Device 3 was 94.2%, and the overall recovery rate of microplastics showed an increasing trend as the device improved (Figure 10). In the case of Device 3, a recovery rate of over 90% was confirmed for all plastics. A comparison of recovery rates found in previous studies that used the same encapsuled method is shown in Table 6. The developed device had the highest recovery rate. This rate increased when the loss in the device where the sample comes into contact with CFD was confirmed and improved.
Recovery rate experiment of pretreatment process was performed with Device 3 which has the highest recovery rate. The recovery rate of wet peroxide oxidation and density separation was at least 89.5% (Table 7). Thus, a high efficiency was confirmed even when sampling and pre-processing devices were used, as opposed to the experimental tools and equipment used in the previous study. Additionally, our proposed device showed less cross-contamination than was observed in other studies (Table 8). In the case of negative blank samples, 4–17 and 0–6 contaminating particles smaller than 20 μm appeared during the sampling and pretreatment processes, respectively.
For the encapsuled method used in this study, the amount of sample taken per sample was smaller than other methods. This limitation was improved by replacing the filter between samples, but this could increase the probability of contamination due to increased external exposure of samples. As a result, relatively small size and small amount of plastic contamination still occurred. In addition, since pump power is still required during sampling, an electrical device or sample transfer process is essential. Applying high-temperature treatment and using negative-pressure laboratories, methods employed in other studies, will solve the problem of pollution [17].
The smaller the microplastics, the more easily they can enter the human body and the greater risk they pose [39]. However, a new and cost-effective filter has a minimum pore size of 1 µm, and it is difficult to analyze microplastics at a nanoscale using spectroscopic analysis or thermal analysis. Therefore, the development and improvement of a device for analyzing microplastics of 10 µm or less will be helpful for tracking and analyzing microplastics, provided a suitable filter is used.

4. Conclusions

We proposed a microplastic sampling device and pretreatment process that excludes plastic from the entire process. In this study, using a highly efficient encapsulation method of sampling, sample loss and external contamination were minimized, and a device capable of classification by size was developed. The device was evaluated by using five types of reference microplastics. While carrying out structural modifications to the device, a CFD analysis was performed to identify the shape and flow velocity of turbulence that may occur during sampling. It was confirmed that the efficiency, contamination, minimization of loss, and the flow of fluids were made more suitable for the sampling via a structural improvement in the device. In addition, the minimization of the loss of microplastics contained in a sample has been verified by an experiment of recovery rates depending on weight of the used filter. As a result of the modification, a recovery rate of over 94% was confirmed, which is higher than the previous studies. Therefore, it could be easily applied by separating microplastics from different environmental samples and collecting microplastic samples of desired size. In conclusion, the proposed device can overcome existing limitations caused by contaminants generated during the pretreatment process and can prepare for high-quality microplastic analysis with a high recovery rate.

Supplementary Materials

The following supporting information can be downloaded at: https://www.mdpi.com/article/10.3390/su15053907/s1, Table S1: CFD analysis conditions for the sampling devices; Table S2: Recovery results using Device 1 with reference material; Table S3: Recovery results using Device 2 with reference material; Table S4: Recovery results using Device 3 with reference material; Table S5: Size distribution 10% value size (µm); Table S6: Size distribution 90% value size (µm); Figure S1: SEM image of STS filter (a) before and (b) after filtration; Figure S2: Visual results after filtration using the STS filter in (a) Device 1, (b) Device 2, (c) Device 3.

Author Contributions

Conceptualization, Y.Y. and S.J.; methodology, S.J.; software, J.Y., J.L. (Jihoon Lee); validation, J.Y., J.L. (Junho Lee) and J.L. (Jihoon Lee); formal analysis, K.K.; resources, C.L.; data curation, K.K.; writing—original draft preparation, J.L. (Junho Lee) and S.J.; writing—review and editing, S.J., J.Y.; visualization, J.K.; supervision, Y.Y.; project administration, Y.Y.; funding acquisition, Y.Y. All authors have read and agreed to the published version of the manuscript.

Funding

This research was supported by the Korea Environment Industry & Technology Institute (KEITI) through the Measurement and Risk Assessment Program for Management of Microplastics Project funded by the Korea Ministry of Environment (MOE) (Grant Number 2020003110005).

Institutional Review Board Statement

Not Applicable.

Informed Consent Statement

Not Applicable.

Data Availability Statement

All data used in this study are public.

Acknowledgments

Microplastics reference materials were provided by Korea Testing & Research Institute (KTR).

Conflicts of Interest

The authors declare no conflict of interest.

References

  1. Ma, Y.; Huang, A.; Cao, S.; Sun, F.; Wang, L.; Guo, H.; Ji, R. Effects of nanoplastics and microplastics on toxicity, bioaccumulation, and environmental fate of phenanthrene in fresh water. Environ. Pollut. 2016, 219, 166–173. [Google Scholar] [CrossRef] [PubMed]
  2. Ziccardi, L.M.; Edgington, A.; Hentz, K.; Kulacki, K.J.; Kane Driscoll, S. Microplastics as vectors for bioaccumulation of hydrophobic organic chemicals in the marine environment: A state-of-the-science review. Environ. Toxicol. Chem. 2016, 35, 1667–1676. [Google Scholar] [CrossRef] [PubMed]
  3. Dawson, A.; Huston, W.; Kawaguchi, S.; King, C.; Cropp, R.; Wild, S.; Eisenmann, P.; Townsend, K.; Bengtson Nash, S. Uptake and Depuration Kinetics Influence Microplastic Bioaccumulation and Toxicity in Antarctic Krill ( Euphausia superba). Environ. Sci. Technol. 2018, 52, 3195–3201. [Google Scholar] [CrossRef] [PubMed]
  4. Miller, M.E.; Hamann, M.; Kroon, F.J. Bioaccumulation and biomagnification of microplastics in marine organisms: A review and meta-analysis of current data. PLoS ONE 2020, 15, e0240792. [Google Scholar] [CrossRef]
  5. Lohmann, R. Microplastics are not important for the cycling and bioaccumulation of organic pollutants in the oceans-but should microplastics be considered POPs themselves? Integr. Environ. Assess Manag. 2017, 13, 460–465. [Google Scholar] [CrossRef] [Green Version]
  6. Zhang, Q.; Xu, E.G.; Li, J.; Chen, Q.; Ma, L.; Zeng, E.Y.; Shi, H. A Review of Microplastics in Table Salt, Drinking Water, and Air: Direct Human Exposure. Environ. Sci. Technol. 2020, 54, 3740–3751. [Google Scholar] [CrossRef] [PubMed]
  7. Gasperi, J.; Wright, S.L.; Dris, R.; Collard, F.; Mandin, C.; Guerrouache, M.; Langlois, V.; Kelly, F.J.; Tassin, B. Microplastics in air: Are we breathing it in? Curr. Opin. Environ. Sci. Health 2018, 1, 1–5. [Google Scholar] [CrossRef] [Green Version]
  8. Castañeda, R.A.; Avlijas, S.; Simard, M.A.; Ricciardi, A.; Smith, R. Microplastic pollution in St. Lawrence River sediments. Can. J. Fish. Aquat. Sci. 2014, 71, 1767–1771. [Google Scholar] [CrossRef]
  9. Guo, J.J.; Huang, X.P.; Xiang, L.; Wang, Y.Z.; Li, Y.W.; Li, H.; Cai, Q.Y.; Mo, C.H.; Wong, M.H. Source, migration and toxicology of microplastics in soil. Environ. Int. 2020, 137, 105263. [Google Scholar] [CrossRef]
  10. McCormick, A.; Hoellein, T.J.; Mason, S.A.; Schluep, J.; Kelly, J.J. Microplastic is an abundant and distinct microbial habitat in an urban river. Environ. Sci. Technol. 2014, 48, 11863–11871. [Google Scholar] [CrossRef]
  11. Baldwin, A.K.; Spanjer, A.R.; Rosen, M.R.; Thom, T. Microplastics in Lake Mead National Recreation Area, USA: Occurrence and biological uptake. PLoS ONE 2020, 15, e0228896. [Google Scholar] [CrossRef] [PubMed]
  12. Weinstein, J.E.; Crocker, B.K.; Gray, A.D. From macroplastic to microplastic: Degradation of high-density polyethylene, polypropylene, and polystyrene in a salt marsh habitat. Environ. Toxicol. Chem. 2016, 35, 1632–1640. [Google Scholar] [CrossRef] [PubMed]
  13. El Hadri, H.; Gigault, J.; Maxit, B.; Grassl, B.; Reynaud, S. Nanoplastic from mechanically degraded primary and secondary microplastics for environmental assessments. NanoImpact 2020, 17, 100206. [Google Scholar] [CrossRef]
  14. Wang, C.; Xian, Z.; Jin, X.; Liang, S.; Chen, Z.; Pan, B.; Wu, B.; Ok, Y.S.; Gu, C. Photo-aging of polyvinyl chloride microplastic in the presence of natural organic acids. Water Res. 2020, 183, 116082. [Google Scholar] [CrossRef] [PubMed]
  15. Yang, H.; Xiong, H.; Mi, K.; Xue, W.; Wei, W.; Zhang, Y. Toxicity comparison of nano-sized and micron-sized microplastics to Goldfish Carassius auratus Larvae. J. Hazard Mater. 2020, 388, 122058. [Google Scholar] [CrossRef] [PubMed]
  16. Filella, M. Questions of size and numbers in environmental research on microplastics: Methodological and conceptual aspects. Environ. Chem. 2015, 12, 5. [Google Scholar] [CrossRef] [Green Version]
  17. Prata, J.C.; da Costa, J.P.; Duarte, A.C.; Rocha-Santos, T. Methods for sampling and detection of microplastics in water and sediment: A critical review. TrAC Trends Anal. Chem. 2019, 110, 150–159. [Google Scholar] [CrossRef]
  18. Lenz, R.; Labrenz, M. Small Microplastic Sampling in Water: Development of an Encapsulated Filtration Device. Water 2018, 10, 1055. [Google Scholar] [CrossRef] [Green Version]
  19. Wang, W.; Wang, J. Investigation of microplastics in aquatic environments: An overview of the methods used, from field sampling to laboratory analysis. TrAC Trends Anal. Chem. 2018, 108, 195–202. [Google Scholar] [CrossRef]
  20. Tamminga, M.; Stoewer, S.C.; Fischer, E.K. On the representativeness of pump water samples versus manta sampling in microplastic analysis. Environ. Pollut. 2019, 254 Pt A, 112970. [Google Scholar] [CrossRef]
  21. Mu, J.; Zhang, S.; Qu, L.; Jin, F.; Fang, C.; Ma, X.; Zhang, W.; Wang, J. Microplastics abundance and characteristics in surface waters from the Northwest Pacific, the Bering Sea, and the Chukchi Sea. Mar. Pollut. Bull. 2019, 143, 58–65. [Google Scholar] [CrossRef] [PubMed]
  22. Liu, K.; Zhao, Y.; Jia, L.; Hao, R.; Fu, D. A novel CFD-based method for predicting pressure drop and dust cake distribution of ceramic filter during filtration process at macro-scale. Powder Technol. 2019, 353, 27–40. [Google Scholar] [CrossRef]
  23. Wang, Q.; Liu, Y.; Huang, A.; Yan, W.; Gu, H.; Li, G. CFD investigation on influence of orifice geometry on micro-scale inclusion movement. Powder Technol. 2020, 367, 358–375. [Google Scholar] [CrossRef]
  24. Gwinnett, C.; Miller, R.Z. Are we contaminating our samples? A preliminary study to investigate procedural contamination during field sampling and processing for microplastic and anthropogenic microparticles. Mar. Pollut. Bull. 2021, 173 Pt B, 113095. [Google Scholar] [CrossRef]
  25. Woodall, L.C.; Gwinnett, C.; Packer, M.; Thompson, R.C.; Robinson, L.F.; Paterson, G.L. Using a forensic science approach to minimize environmental contamination and to identify microfibres in marine sediments. Mar. Pollut. Bull. 2015, 95, 40–46. [Google Scholar] [CrossRef]
  26. Prata, J.C.; Reis, V.; da Costa, J.P.; Mouneyrac, C.; Duarte, A.C.; Rocha-Santos, T. Contamination issues as a challenge in quality control and quality assurance in microplastics analytics. J. Hazard Mater. 2021, 403, 123660. [Google Scholar] [CrossRef]
  27. De Frond, H.; Thornton Hampton, L.; Kotar, S.; Gesulga, K.; Matuch, C.; Lao, W.; Weisberg, S.B.; Wong, C.S.; Rochman, C.M. Monitoring microplastics in drinking water: An interlaboratory study to inform effective methods for quantifying and characterizing microplastics. Chemosphere 2022, 298, 134282. [Google Scholar] [CrossRef] [PubMed]
  28. Hermsen, E.; Mintenig, S.M.; Besseling, E.; Koelmans, A.A. Quality Criteria for the Analysis of Microplastic in Biota Samples: A Critical Review. Environ. Sci. Technol. 2018, 52, 10230–10240. [Google Scholar] [CrossRef]
  29. Koelmans, A.A.; Mohamed Nor, N.H.; Hermsen, E.; Kooi, M.; Mintenig, S.M.; De France, J. Microplastics in freshwaters and drinking water: Critical review and assessment of data quality. Water Res. 2019, 155, 410–422. [Google Scholar] [CrossRef]
  30. Coppock, R.L.; Cole, M.; Lindeque, P.K.; Queiros, A.M.; Galloway, T.S. A small-scale, portable method for extracting microplastics from marine sediments. Environ. Pollut. 2017, 230, 829–837. [Google Scholar] [CrossRef] [Green Version]
  31. Zhu, J.; Wang, C. Recent advances in the analysis methodologies for microplastics in aquatic organisms: Current knowledge and research challenges. Anal. Methods 2020, 12, 2944–2957. [Google Scholar] [CrossRef] [PubMed]
  32. Plee, T.A.; Pomory, C.M. Microplastics in sandy environments in the Florida Keys and the panhandle of Florida, and the ingestion by sea cucumbers (Echinodermata: Holothuroidea) and sand dollars (Echinodermata: Echinoidea). Mar. Pollut. Bull. 2020, 158, 111437. [Google Scholar] [CrossRef] [PubMed]
  33. Akanyange, S.N.; Lyu, X.; Zhao, X.; Li, X.; Zhang, Y.; Crittenden, J.C.; Anning, C.; Chen, T.; Jiang, T.; Zhao, H. Does microplastic really represent a threat? A review of the atmospheric contamination sources and potential impacts. Sci. Total Environ. 2021, 777, 146020. [Google Scholar] [CrossRef] [PubMed]
  34. Li, J.; Liu, H.; Paul Chen, J. Microplastics in freshwater systems: A review on occurrence, environmental effects, and methods for microplastics detection. Water Res. 2018, 137, 362–374. [Google Scholar] [CrossRef] [PubMed]
  35. Hale, R.C.; Seeley, M.E.; La Guardia, M.J.; Mai, L.; Zeng, E.Y. A Global Perspective on Microplastics. J. Geophys. Res. Ocean. 2020, 125, e2018JC014719. [Google Scholar] [CrossRef]
  36. Yuan, C.; Almuhtaram, H.; McKie, M.J.; Andrews, R.C. Assessment of microplastic sampling and extraction methods for drinking waters. Chemosphere 2022, 286 Pt 3, 131881. [Google Scholar] [CrossRef]
  37. Harrold, Z.; Arienzo, M.M.; Collins, M.; Davidson, J.M.; Bai, X.; Sukumaran, S.; Umek, J. A Peristaltic Pump and Filter-Based Method for Aqueous Microplastic Sampling and Analysis. ACS EST Water 2022, 2, 268–277. [Google Scholar] [CrossRef]
  38. Wright, S.L.; Kelly, F.J. Plastic and Human Health: A Micro Issue? Environ. Sci. Technol. 2017, 51, 6634–6647. [Google Scholar] [CrossRef]
  39. Tirkey, A.; Upadhyay, L.S.B. Microplastics: An overview on separation, identification and characterization of microplastics. Mar. Pollut. Bull. 2021, 170, 112604. [Google Scholar] [CrossRef]
Figure 1. μ-Raman result of (a) air blank sample and (b) air sample for POM cassette.
Sustainability 15 03907 g001
Figure 2. Sampling devices and cassette with silicon gasket: (a) Device 1, (b) Device 2, (c) and Device 3. (d) Assembly of the sampling device (D × H = 80 mm × 100 mm) and scheme of the sampling process.
Sustainability 15 03907 g002
Figure 3. SEM image of (a) a STS filter, (b) polyethylene, (c) polyethylene terephthalate, (d) polystyrene, (e) polypropylene, and (f) polyvinyl chloride.
Sustainability 15 03907 g003
Figure 4. Pretreatment processes (WPO was performed at 80 °C for 3 h; Density separation was performed at 1.6 kg/L density; Size classification was performed with the sampling device equipped with three multi-stage filters, a: 45 µm, b: 20 µm, and c: 1 µm).
Sustainability 15 03907 g004
Figure 5. Device modifications: (a) sealing silicon shape and methods, (b) housing upper shape and space, (c) cassette cross support.
Sustainability 15 03907 g005
Figure 6. Average water flow velocity through sampling devices. (a) Device 1, (b) Device 2, and (c) Device 3. Symbols in this graph represent the case as follows—XX: without filter and microplastics, FX: equipped filter, FX: equipped filter with microplastic in water flow.
Sustainability 15 03907 g006
Figure 7. Velocity magnitude contour and vectors of sampling devices. (ac) show cross-sectional view of the center of the devices. (df) show cross-sectional view at the half point from the center to edge.
Sustainability 15 03907 g007
Figure 8. Turbulence intensity contour and vectors on the surface of the filter: (a) Device 1, (b) Device 2, and (c) Device 3.
Sustainability 15 03907 g008
Figure 9. Velocity magnitude vectors on the surface of filter: (a) Device 1, (b) Device 2, and (c) Device 3.
Sustainability 15 03907 g009
Figure 10. Overall microplastic recovery of the sampling devices.
Sustainability 15 03907 g010
Table 1. μ-Raman result for POM and STS cassettes.
Cassette MaterialSamplePETPSPVCPEPPPOM
(#/m3)
POMPassive sample00.20901.0440.2090.209
Active sample0.4170.41704.1742.0870.209
STSActive sample2.8050.301041.67500
Table 2. Size distribution of the first range of microplastic reference materials.
Cumulative Diameterd (10%)d (50%)d (90%)
Cumulative diameter (µm)PE11.018.029.7
PET9.815.825.0
PS9.014.121.5
PP10.016.429.3
PVC10.616.725.2
d (10%): 10% of the total particles are smaller than this size. d (50%): 50% of the total particles are smaller than this size. d (90%): 90% of the total particles are smaller than this size.
Table 3. Size distribution of the second range of microplastic reference materials.
Cumulative Diameterd (10%)d (50%)d (90%)
Cumulative diameter (µm)PE102.1203.3331.1
PET108.4165.4235.5
PS70.4140.1218.0
PP120.1170.0253.7
PVC109.8160.3233.3
d (10%): 10% of the total particles are smaller than this size. d (50%): 50% of the total particles are smaller than this size. d (90%): 90% of the total particles are smaller than this size.
Table 4. Filter height change in STS filter after filtration. (Average and standard deviation value of four side of filter height).
Device 1Device 2Device 3
Filter height (mm)0.30 ± 0.140.13 ± 0.050.00 ± 0.00
Height reduction: Device 1 to 2 was 56.7%, Device 2 to 3 was 100%.
Table 5. Median (d 50%) value results of size distribution.
3rd Stage2nd Stage1st Stage
STS filter pore size5 µm20 µm45 µm
PE19.228.361.0
PET12.014.877.8
PS14.923.9105.9
PP13.816.124.1
PVC14.817.660.0
Table 6. Recovery rate of encapsuled methods.
Yuan et al. [35] Harrold et al. [36]This Study
Recovery rate (%)80.28894.2
Size range of references materials (µm)125–1505–2965–30
Table 7. Recovery rate of pretreatment.
No.SpeciesRecovery Rate of WPO (%)Recovery Rate of Density Separation (%)
1PP91.498.8
2PS94.398.0
3PET99.589.5
4PVC97.099.7
5PE92.998.1
Table 8. Results regarding the blank sample subjected to the sampling device and pretreatment process.
No.Concentration of MPsPhaseControlMethodRef.
10.172 particles/LWaterXEncapsuled[37]
291–141 particlesProcedure blankX [26]
3* 5–9 particlesAirOPassive air[38]
431 particlesWaterOManta net[20]
5** 4–7 particlesAir and waterOEncapsuledThe current study
6** 0–6 particlesPretreatmentOEncapsuled
* Over 50 µm. ** Under 25 µm.
Disclaimer/Publisher’s Note: The statements, opinions and data contained in all publications are solely those of the individual author(s) and contributor(s) and not of MDPI and/or the editor(s). MDPI and/or the editor(s) disclaim responsibility for any injury to people or property resulting from any ideas, methods, instructions or products referred to in the content.

