Article

Contribution of Air Management to the Energy Efficiency of Water Pipelines

1
School of Civil Engineering, Architecture and Urban Design, State University of Campinas, Campinas 13083-889, Brazil
2
School of Civil Engineering, University of Leeds, Leeds LS2 9JT, UK
3
Department of Civil Engineering, Architecture and Georesources, CERIS, Instituto Superior Técnico, University of Lisbon, 1049-001 Lisbon, Portugal
4
Department of Civil and Mineral Engineering, University of Toronto, Toronto, ON M5S 1A4, Canada
*
Author to whom correspondence should be addressed.
Sustainability 2023, 15(5), 3875; https://doi.org/10.3390/su15053875
Submission received: 5 December 2022 / Revised: 16 February 2023 / Accepted: 17 February 2023 / Published: 21 February 2023

Abstract

:
Water conveyance systems are notorious for incurring considerable energy expenditures, either as losses of gravitational potential energy or as increased electricity consumption. Entrapped air pockets, originating from ineffective or nonexistent air management schemes, are common and often significant contributors to these energy costs. This work summarizes the detrimental influence of entrapped air on the energetics and conveyance capacity of pressurized pipelines and identifies those conditions that typically result in temporary or persistent air accumulations. Gravity and pumped lines are considered and gravity lines are shown to be more prone to the negative effects of entrapped air. In addition, initially robust air management strategies can gradually degrade if poorly adjusted to evolving circumstances. The paper critically assesses two common air management strategies: through employing air valves or by air removal by hydraulic means—that is, by considering a line’s configuration along with an attempt to predict the necessary flow conditions for the hydraulic removal of entrapped air.

1. Introduction

Water utilities are facing crucial and increasingly complicated challenges as a result of many influences from climate change to sometimes rapid urbanization. Such issues put the serviceability of the water sector under considerable stress [1,2]. According to Ferroukhi et al. (2015) [3], the 2050-demand for water and energy is expected to increase by 55% and 80%, respectively. Importantly, the present-day water sector is particularly energy-intensive. Thus, the water–energy nexus requires special attention in the design, operation, maintenance, and retrofitting of water pipelines. Of note, the hydraulic behaviour of a water pipeline and its operating energy consumption are strongly influenced by many factors including pipeline friction [4], pressure variations [5], and level of air entrapment [6]. It is estimated that frictional losses in water conveyance systems account for about 10% of the global electricity consumption [7]. The current paper focuses on energy-related issues associated with pressurized water pipelines containing entrapped air.
Air entrapment can arise from many mechanisms and lead to a myriad of hydraulic issues. Causative mechanisms include incomplete filling operations [8]; air release from the liquid phase; air intrusion through inlets/outlets or from leaky appurtenances; admission through air valves during sub-atmospheric pressure surges [9]. Entrapped air in pressurized lines can, in turn, have many consequences: it can induce a local reduction of the celerity of pressure waves; it can increase the complexity of transient events, thus causing either their amplification or attenuation; it can increase head-losses, reducing a system’s conveyance capacity and increasing its energy costs; it can intensify vibration and turbulence, leading to noisier flow, white water, and accelerated corrosion of ferrous pipes; and, when it enters the line through leakage points or malfunctioning air valves, it can lead to water contamination [10].
Entrapped air, especially if present at multiple pipeline locations, generally complicates a system’s transient behaviour [11]. The marked complexity of air–water interactions in pressurized systems subject to transient flows emerges in part from the striking differences between the properties of air and water [9]. Entrapped air is often associated with the intensification of pressure oscillations during filling procedures [12], while, in special circumstances, it might actually attenuate transient events [13]. Importantly, two-phase flows are sometimes associated with incidents/accidents in piping systems [14,15,16,17]. Obvious economic/operational consequences of accidents include financial losses, service interruptions, leakages, and the health risks from water contamination.
Recent research has focused on the influence of entrapped air during typical unsteady pipeline flows, such as filling [18,19] and draining [20,21] procedures, pump trip events [22], and valve manoeuvres [23]. Nevertheless, entrapped air can also be influential to system behaviour during relatively steady flows, which are usually prolonged and thus have even greater importance regarding energy consumption considerations [16,24,25,26,27,28,29]. A pipeline system with persistent air entrapment inevitably will have a reduced conveyance capacity due to air-related head-losses. In fact, severe cases might even result in “air binding” in a pipeline [30], which can lead to the complete interruption of forward water flow [31]. Sorensen (2017) [32] offered three examples from engineering practice, one from North America and two from Africa, that demonstrate that neglecting air management (i.e., systems with adequately located, sized, and maintained air valves) can substantially impair a system’s conveyance capacity and result in wasted energy and increased operational costs. Sorensen (2017) [32] estimated that entrapped air in pipelines causes a 10% or greater increase in pumping costs. Significantly, Sorensen (2017) [32] mentioned that for a wastewater pumping station having five air valves, the strategic substitution of two of these valves with new (better performing) air valves resulted in an increase of pump capacity from about 100 gpm (gallons per minute) to more than 400 gpm.
Pressingly, all of these air-related issues can meaningfully affect the three pillars of sustainable development, namely equity, environment, and economy. In this context, the current paper aligns with the United Nation’s Sustainable Development Goals (SDG), specifically with SDG 6 (Clean Water and Sanitation) and SDG 9 (Industry, Innovation and Infrastructure) [33]. The focus of the current paper is to investigate the deleterious influence of entrapped air on the conveyance capacity of water pipelines and to discuss key strategies for the effective removal of air.
This work first briefly reviews the typical characteristics of water–air flows and then considers the discharge reductions that can occur due to entrapped air in gravity or water rising pipelines. Next, the evolution of entrapped air in gravity or rising pipelines is considered including the specific conveyance reductions in lines prone to siphon flow. Critical velocity formulations for the hydraulic removal of air from horizontal or descending pipes are then summarized along with a consideration of the occurrence of air binding and the application of air valves. The novelty of this work arises as follows: (i) it analytically studies the effect of entrapped air on the conveyance capacity of water pipelines; (ii) it considers how air pockets tend to grow or shrink in response to changing operational conditions; and (iii) it evaluates the key critical velocity equations for predicting the hydraulic removal of air and their practical use for locating air valves.

2. Water–Air Flows in Pipelines

The primary forces acting on an entrapped air pocket in a pipeline system are due to buoyancy and drag. The buoyant force tends to move air pockets upward while drag tugs air in the direction of the flow. Since these forces act in the same direction in upward-sloping segments, air here naturally moves downstream. By contrast, in horizontal or descending pipes, a minimum water velocity must be achieved for entrapped air to move downstream [24]. For a reduced superficial air velocity, the flow pattern in upward-sloped pipes is either intermittent or as dispersed bubbles within the water phase [34]. For a reduced superficial air velocity, depending on the inclination angle, the flow pattern in descending pipes is either stratified, intermittent, or dispersed bubble [34]. Naturally, air bubbles or pockets tend to move faster in upward segments and slower (or even backwards) in descending segments. Moreover, air bubbles or pockets might aggregate and grow at high points, whereas, at low-elevation bends, pockets tend to break apart [35].
The water flow under an entrapped air pocket in a pipeline is often developed as channel flow. At transitions between full pipe flow and channel flow, such as the upstream and downstream ends of an air pocket, water flow is often characterized as gradually varied channel flow [36]. If a descending segment with entrapped air has a mild slope for the pipeline discharge, some air may entrain into the water phase due to agitation at the pocket’s downstream end [30]. However, if a descending segment with air is steep, one or more hydraulic jump(s) may occur [27]. An entrapped air pocket may increase in size by merging with air bubbles that move with the flowing water or, more dramatically, blow-back along a downward pipe segment. According to Pozos et al. (2010) [36], for a given pipeline flow condition, increasing air pocket size changes its length only in the descending segment downstream of the high point. If air is carried to regions of high pressure, it may also slowly dissolve into the liquid water phase.
According to Pothof and Clemens (2010) [26], water–air flows in descending pipe segments can be classified as (1) stratified flows, (2) blow-back flows, (3) plug flows, or (4) bubble flows. For stratified flow, the film between the two phases is well-defined and there is no air entrainment through the surface. For stratified flow, air-related head-loss is essentially the variation in elevation across the air pocket. For blow-back flow, one (category 2a) or more air pockets (category 2b), with respective hydraulic jump(s), is/are observed, with the hydraulic jump(s) moving upstream as air is transported downstream of the jump(s) as entrained bubbles. Air pockets that result in stratified or blow-back flows are of greatest concern in terms of energy losses. For plug flow (category 3), air is present in the form of plugs and hydraulic jumps are absent. For plug flow, air-related head-loss is reduced, while, for bubble flow, air-related head-loss is typically negligible.
Hydraulic jumps at the downstream ends of entrapped air pockets create turbulence that agitates the water surface and promotes the formation of air bubbles that are more easily swept downstream [25]. The expected rate with which air is “pumped’’ into the water by a hydraulic jump depends on system specifics [10,24,37]. Ideally, for enhanced air bubble formation and air entrainment at a hydraulic jump, the jump should occupy the whole cross-section of the pipe, i.e., full pipe flow should occur after the jump. A hydraulic jump that does not occupy the whole cross-section is limited in its capacity to entrain air [10].

3. Discharge Reduction Due to Entrapped Air

3.1. Governing Equations Neglecting Water Depth in the Channel Flow

For a gravity pipeline without air entrapment, neglecting localized head-losses, the application of the Bernoulli equation between the upstream and downstream reservoirs results in
Z 1 Z 2 f L D 1 2 g A 2 Q 2 = 0
where Z 1 is the elevation of the upstream reservoir, Z 2 is the elevation of the downstream reservoir, f is the pipeline’s friction factor, L is the pipeline’s length, D is the pipeline’s diameter, g is the acceleration due to gravity, A is the pipeline’s cross-sectional area, and Q is water discharge.
Similarly, for a pipeline with upstream pumping system, the application of the Bernoulli equation results in
Z 1 Z 2 + a f L D 1 2 g A 2 Q 2 + c R 2 = 0
where a and c are the coefficients of the head (H) versus discharge (Q) curve of the pumping system, and R is the relative rotational speed of the pumping system given by R = N 2 / N 1 , with N 2 as the actual rotational speed and N 1 as the rated rotational speed. The H versus Q curve of the pumping system is assumed to be represented by H = a Q 2 + c R 2 [38]. Since the head droops with discharge in a typical pump curve, coefficient a is generally a negative number.
Considering an entrapped air pocket at the descending pipe segment associated with a distinct high point of the pipeline profile results in
Z 1 Z 2 + a f ( L L a ) D 1 2 g A 2 Q 2 + c R 2 h a = 0
where L a is the length of the air pocket, and h a is the head-loss caused by the air pocket. It is assumed that the air pocket is stationary. For a large pocket, channel flow is established under it, and the air-related head-loss is estimated by
h a = sin θ L a
where θ is the inclination of the descending pipe segment with entrapped air [26].
Substituting Equation (4) into Equation (3) results in the following expression with water discharge as the unknown:
Z 1 Z 2 + a f ( L L a ) D 1 2 g A 2 Q 2 + c R 2 sin θ L a ( C , Q ) = 0
where C is the polytropic constant related to the thermodynamic behaviour of the air pocket.
The polytropic transformation equation can be used to estimate the dependence between air pocket size, pressure, and temperature. Neglecting the variation in water depth for changes in water discharge, as done in Ramezani et al. (2016) [29], the polytropic transformation equation can be written as
L a = C P a 1 / k
where P a is air pressure, and k is the polytropic exponent. Considering the Bernoulli equation between the upstream reservoir and the high point with entrapped air pocket results in
P a = a Q 2 + c R 2 + Z 1 Z S f L 1 S D Q 2 2 g A 2 γ + P atm
where Z S is the elevation of the high point, L 1 S is the distance between the upstream reservoir and the high point, γ is the specific weight of water, and P atm is the atmospheric pressure. Putting Equation (7) into Equation (6) results in
L a = C / a Q 2 + c R 2 + Z 1 Z S f L 1 S D Q 2 2 g A 2 γ + P atm ( 1 / k )
Equation (5) can be solved iteratively for the water discharge Q considering a set of initial parameters Z 1 , Z 2 , Z S , a, c, R, f, L, L 1 S , D, θ , C, γ , g, and P atm .

3.2. Governing Equations Considering Water Depth in the Channel Flow

Considering air pocket volume instead of air pocket length in the polytropic transformation equation results in
V a = C * P a 1 / k
where C * is the polytropic constant. Considering Equation (9), the air pocket length can be obtained as
L a = 1 A a C * P a 1 / k
where A a is the cross-sectional area occupied by the air pocket. For a circular pipe, such an area is given by
A a = π D 2 4 A w
where A w is the cross-sectional area occupied by the water phase, which is given by
A w = D 2 ( ψ sin ψ ) 8
where ψ is the angle formed by the two cross-sectional radii that indicate the extremities of the water surface in the channel flow, i.e., ψ = 0 for pipe flow with negligible water depth, and ψ = 2 π for full pipe flow [39].
Rewriting Equation (5) as a function of C * instead of C results in
Z 1 Z 2 + a f ( L L a ) D 1 2 g A 2 Q 2 + c R 2 sin θ L a ( C * , Q ) = 0
Manning’s formula for the water discharge in the channel flow is given by
Q = sin θ n A w R h 2 / 3
where n is the Manning coefficient and R h is the hydraulic radius [39], which are respectively given by
n = R h 2 / 6 f 8 g
R h = D ( 1 sin ψ / ψ ) 4
Equations (13) and (14) can be used to determine Q and ψ considering a set of initial parameters. The dependence between water depth y in the channel flow and ψ is explicit [39] and is given by
y = D [ 1 cos ( ψ / 2 ) ] / 2
The current modelling approach is an elaboration of the model found in Ramezani et al. (2016) [29]. Despite the simplifying assumptions, the current approach aims to offer a reasonable and intuitively-satisfying prediction of the effect of entrapped air pockets in pressurized pipelines. The model allows for some natural complications including accounting for the compressibility of air and the occurrence of channel flow inside the pressurized pipe. The modelling approach, however, does not include some potentially relevant aspects such as the occurrence and effect of hydraulic jumps, air release from or dissolution in water, tracking air pocket movement along the line, or consideration of backwater curves.

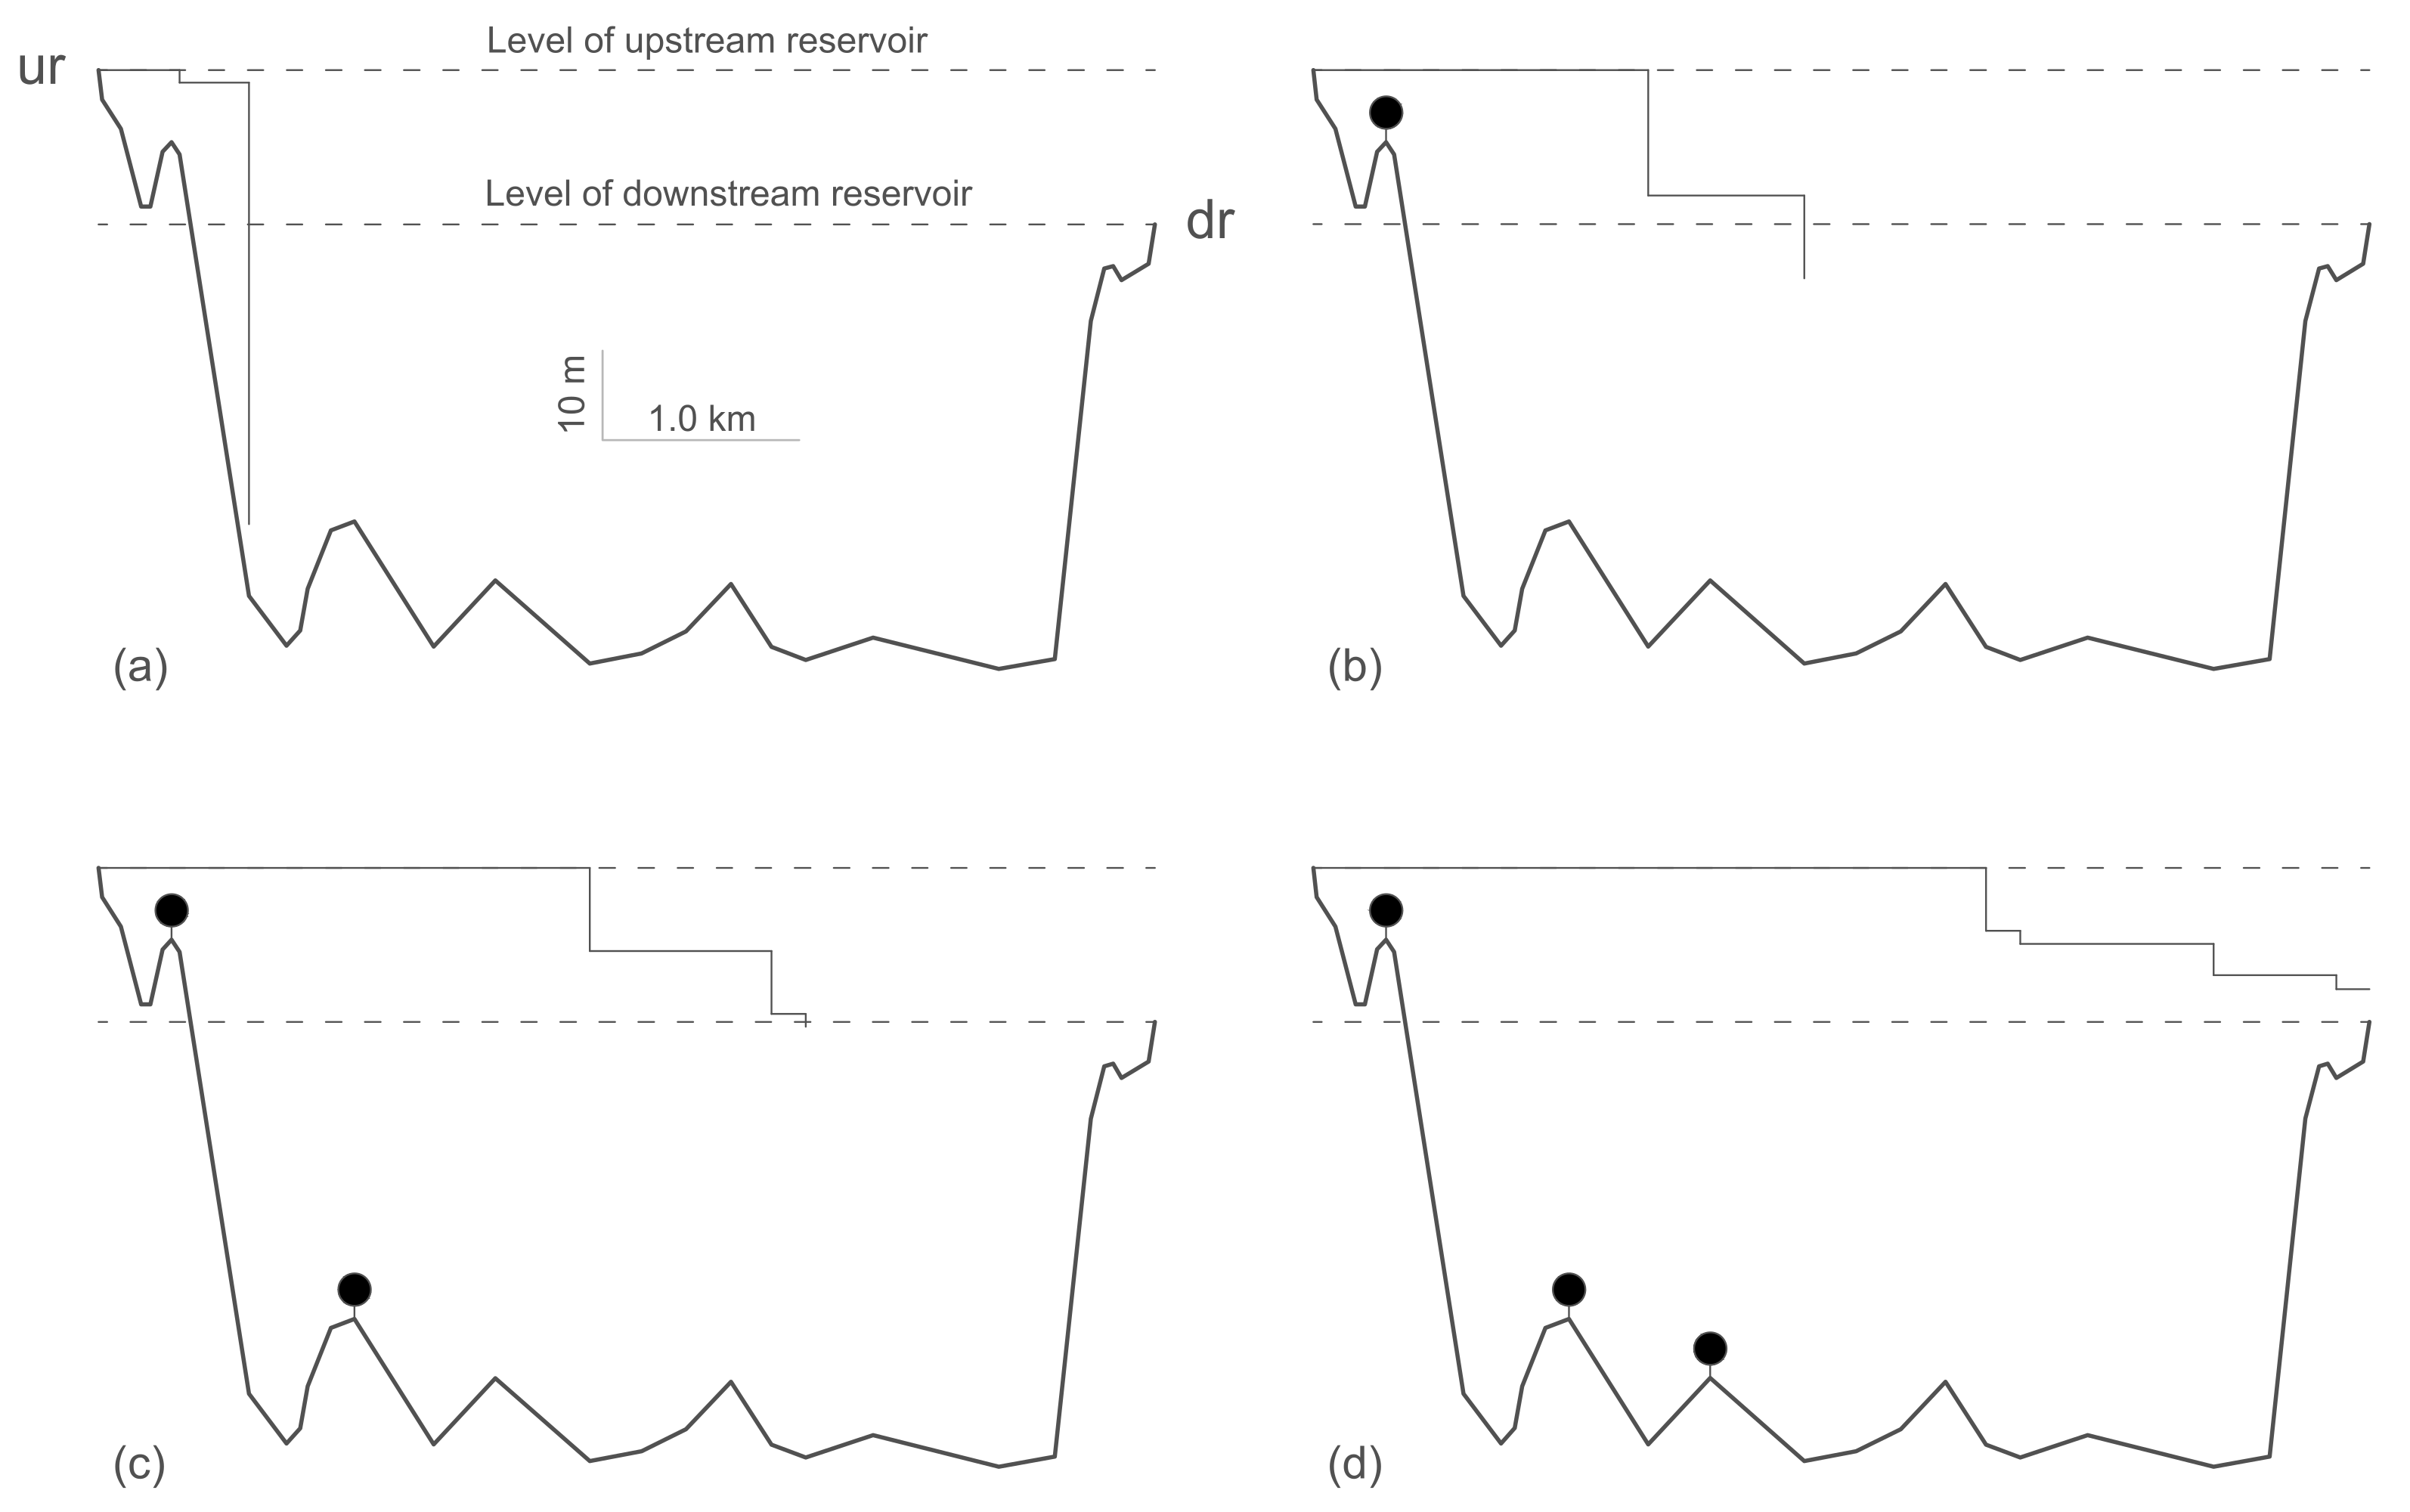
3.3. Discharge Reduction due to Entrapped Air Pocket at a System’s High Point

Figure 1 shows diagrams related to a pipeline with an entrapped air pocket at the upstream portion of the descending pipe segment associated with the line’s distinct high point. It is assumed that the air pocket is stationary. The pipeline profile represented in Figure 1 was also considered by Ramezani et al. (2016) [29]. In Figure 1, the polytropic constant is adopted as C = L a , atm k P atm = 2000 1.2 101,325, with L a , atm as the air pocket length if it was subject to atmospheric pressure. A large air pocket is expected to generate head-loss due to the formation of channel flow under it. Air pocket length and air-related head-loss are larger for the system in Figure 1a, with Z 1 = 100 m, than for the system in Figure 1b, with Z 1 = 145 m. The discontinuity of the hydraulic grade line (HGL) downstream of the high point is shorter in both the horizontal and vertical directions for the case in Figure 1b. Air pressure for the case in Figure 1a is less than for the case in Figure 1b.
Figure 2 and Figure 3 show the dependence, according to Equation (5), of water discharge Q, air-related head-loss h a , and air pocket length L a with head at the high point H P (which, in its part, is dependent on the elevation of the high point Z S ) and upstream head. It should be remembered that Equation (5) considers the simplification of neglecting the water depth in the channel flow under the air pocket. In Figure 2 and Figure 3, Q 0 , 1 is the water discharge for the case with an upstream reservoir with elevation of Z 1 , 1 = 55 m and absence of an entrapped air pocket; Δ H 1 is the difference in elevation between the reservoirs for the case with Z 1 , 1 = 55 m and Z 2 = 50 m, i.e., Δ H 1 = 5 m.
Moreover, the curves in Figure 2 and Figure 3 consider the following input data: pipeline length of 2000 m; L 1 , L 2 , L 3 , and L 4 of 500 m; source of upstream head from upstream reservoir at elevation Z 1 > 50 m or from upstream pumping system with associated upstream reservoir with Z 1 = 0 ; elevation of the downstream reservoir of 50 m; friction factor of 0.017; pipe diameter of 0.5 m; polytropic constant C = L a , atm 1.2 P atm = 320 1.2 101,325; elevation of the high point Z S varying from 47.5 to 2.0 m.
The pumping system considered in Figure 3 consists of 4 pumps of model KSB ETA 200-33 with rotor of 330 mm and rated rotational speed of 1760 rpm—two pumps in series are in parallel with two other pumps in series. For the case without entrapped air, the pumped line with pumping system with R respectively equals to 77%, 84%, 91%, and 100% ( R 1 , R 2 , R 3 , and R 4 , respectively) results in water discharge values equivalent to those of the gravity line without entrapped air with Z 1 respectively equals to 55, 60, 65, and 70 m ( Z 1 , 1 , Z 1 , 2 , Z 1 , 3 , and Z 1 , 4 , respectively).
In Figure 2, for the cases with Z 1 equals to 55 or 60 m, there is no forward flow for the largest elevations of the high point. For the corresponding pumped line cases in Figure 3, i.e., with R respectively equals to 77% and 84%, however, there is forward flow for all tested cases. The case with lowest rotational speed in Figure 3, however, is close to the stagnant condition for the higher elevations of the high point (lower values of air pocket pressure H P ).
The comparison between the curves in Figure 2 (gravity line) and Figure 3 (pumped line) shows that pumping systems are overall more resilient to the deleterious presence of entrapped air. Such a difference comes from the peculiar shape of pump curves—in a pump curve, the head grows as water discharge decreases. For a system with an upstream reservoir, however, the upstream head remains constant even with reductions in water discharge. As mentioned, there is a negative relation between air pocket size with air pocket pressure, which, in its part, holds a positive relation with the upstream head.
Figure 4 shows the dependence of water discharge, water depth in the channel flow y, and cross-sectional area occupied by the air pocket A a with head at the high point H P and upstream head. In Figure 4, Q values refer to results obtained when neglecting the water depth in the channel flow, according to Equation (5), while Q * values refer to results obtained when considering the water depth in the channel flow, according to Equations (13) and (14). It is apparent that the water discharge values when considering the water depth in the channel flow are less than those obtained when neglecting it. In fact, according to Equations (13) and (14), there is no forward flow for the higher elevations of the high point for the case with a pumping system with rotational speed of 77%—the same does not occur when using Equation (5) as indicated in Figure 3. As the water depth rises in the channel flow, less cross-sectional area is available for the entrapped air pocket, and, for a given air pocket pressure, the pocket will stretch further in the downward pipe segment, causing a larger air-related head-loss.

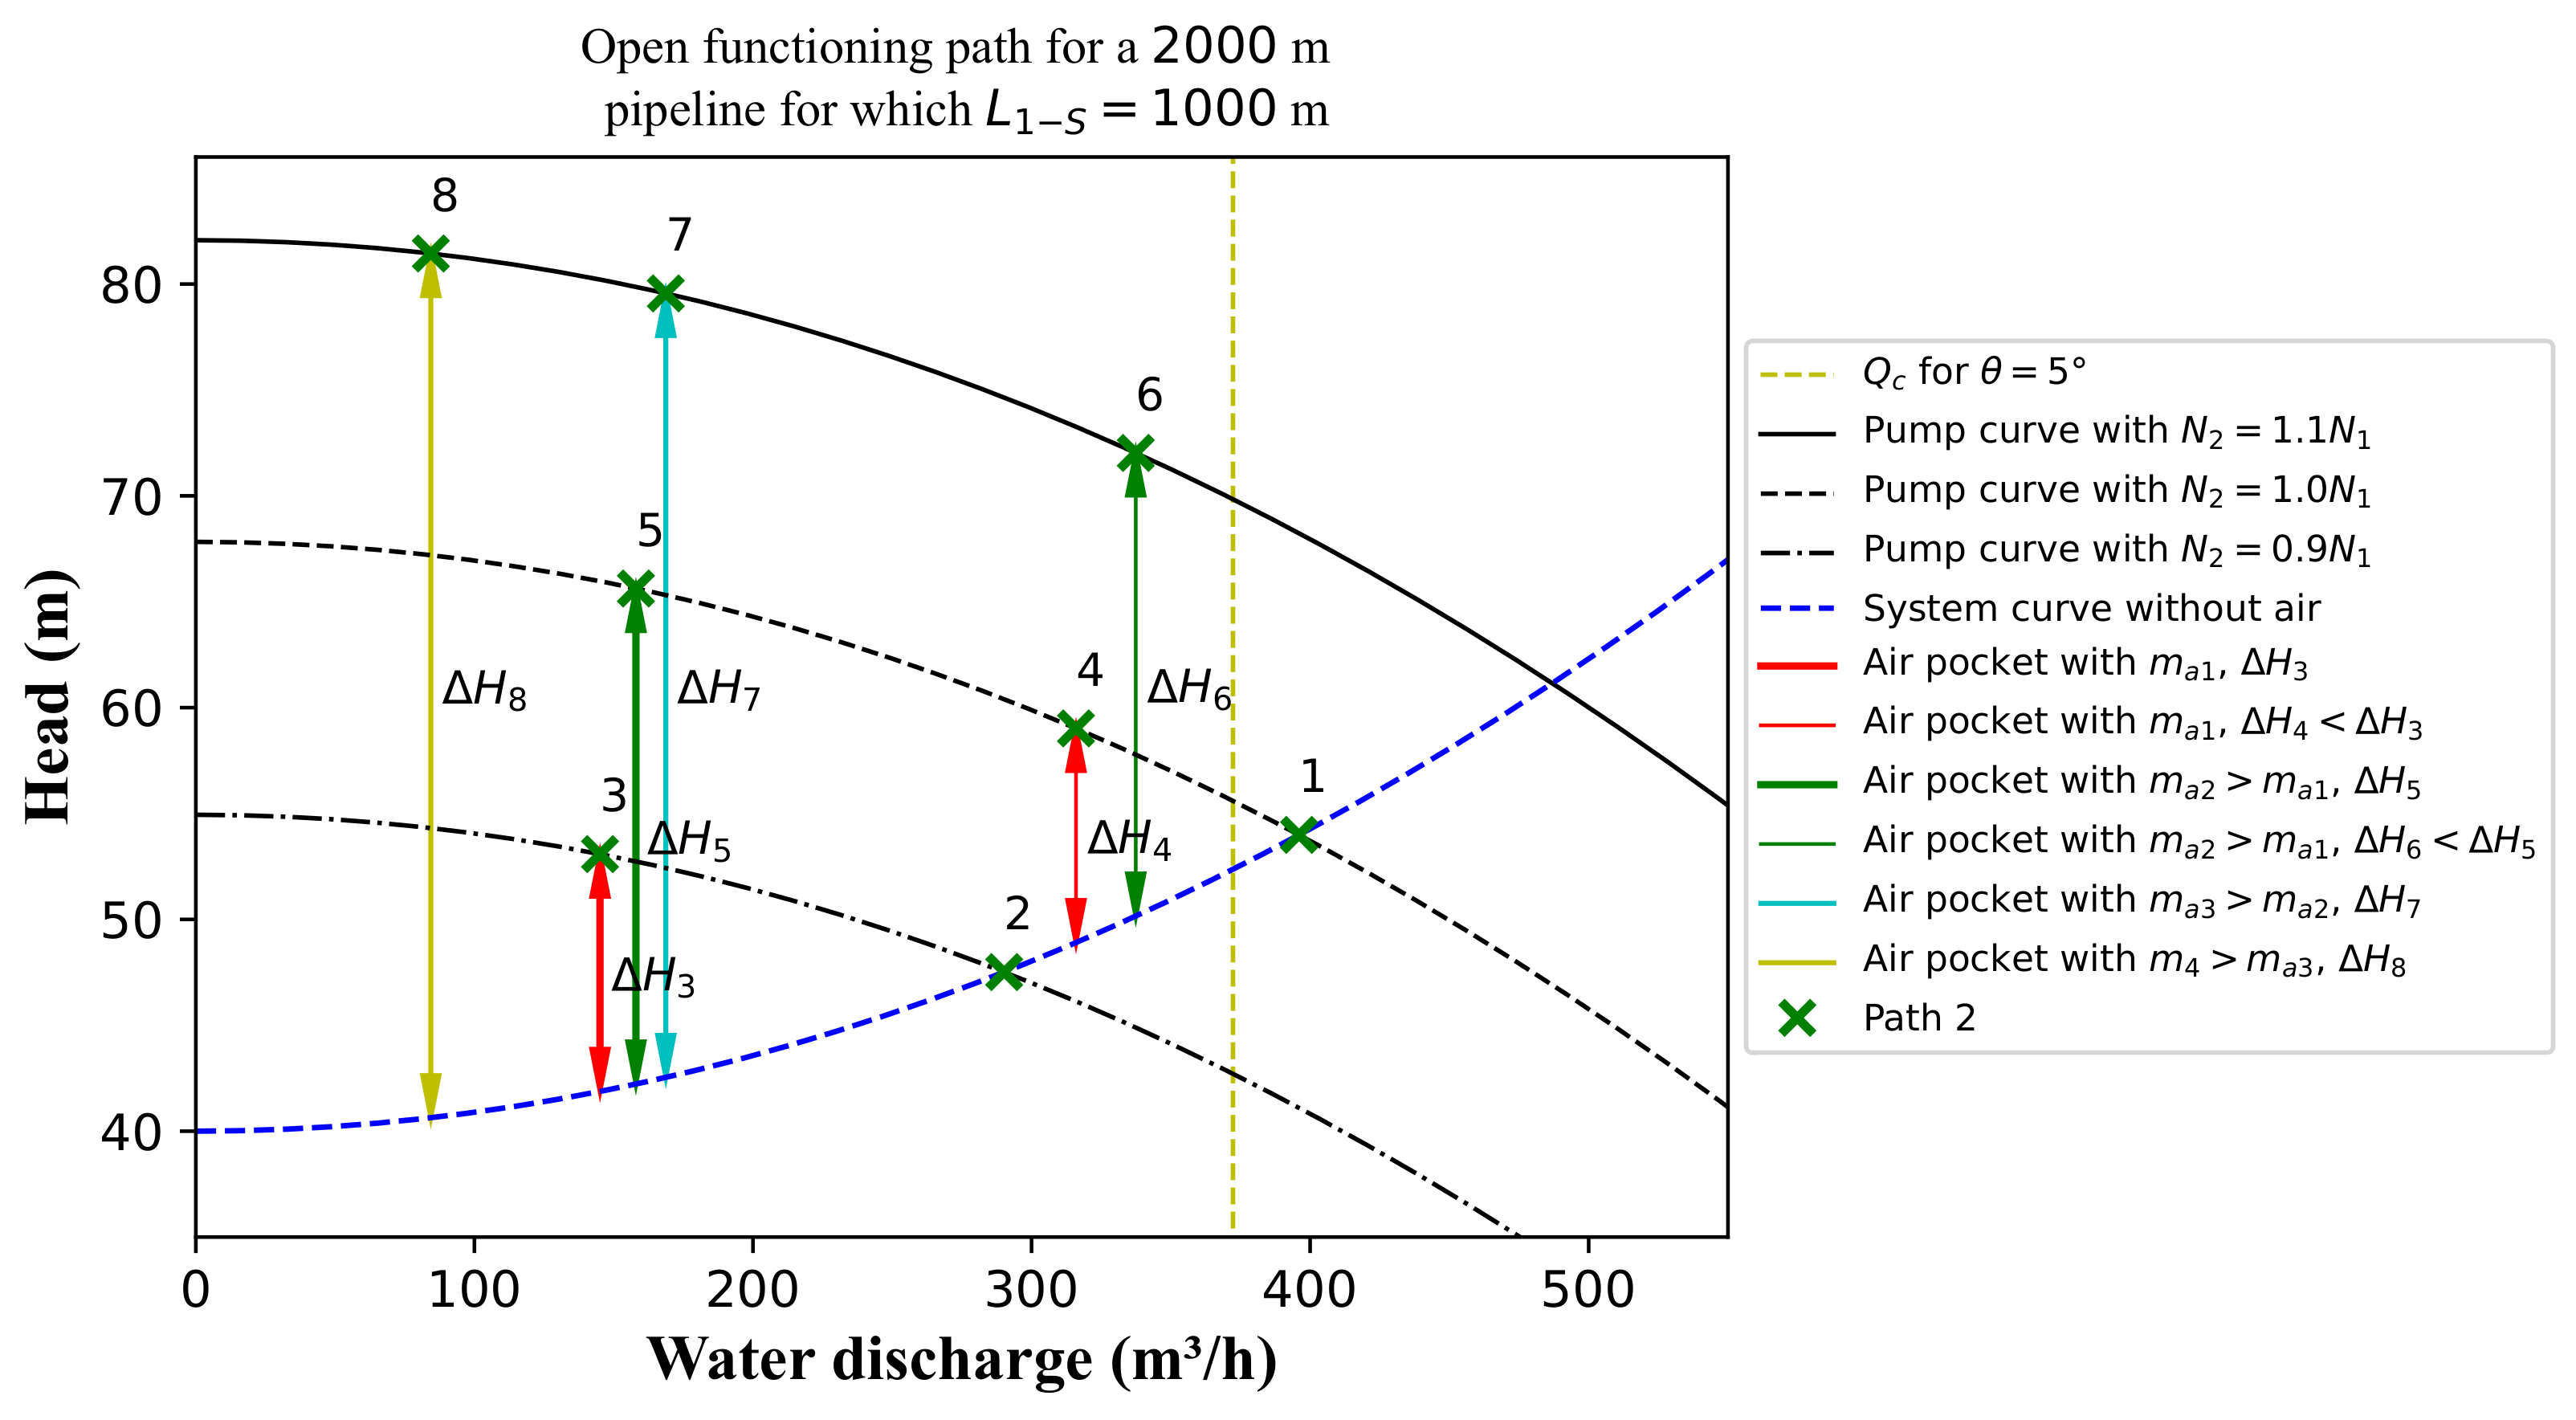
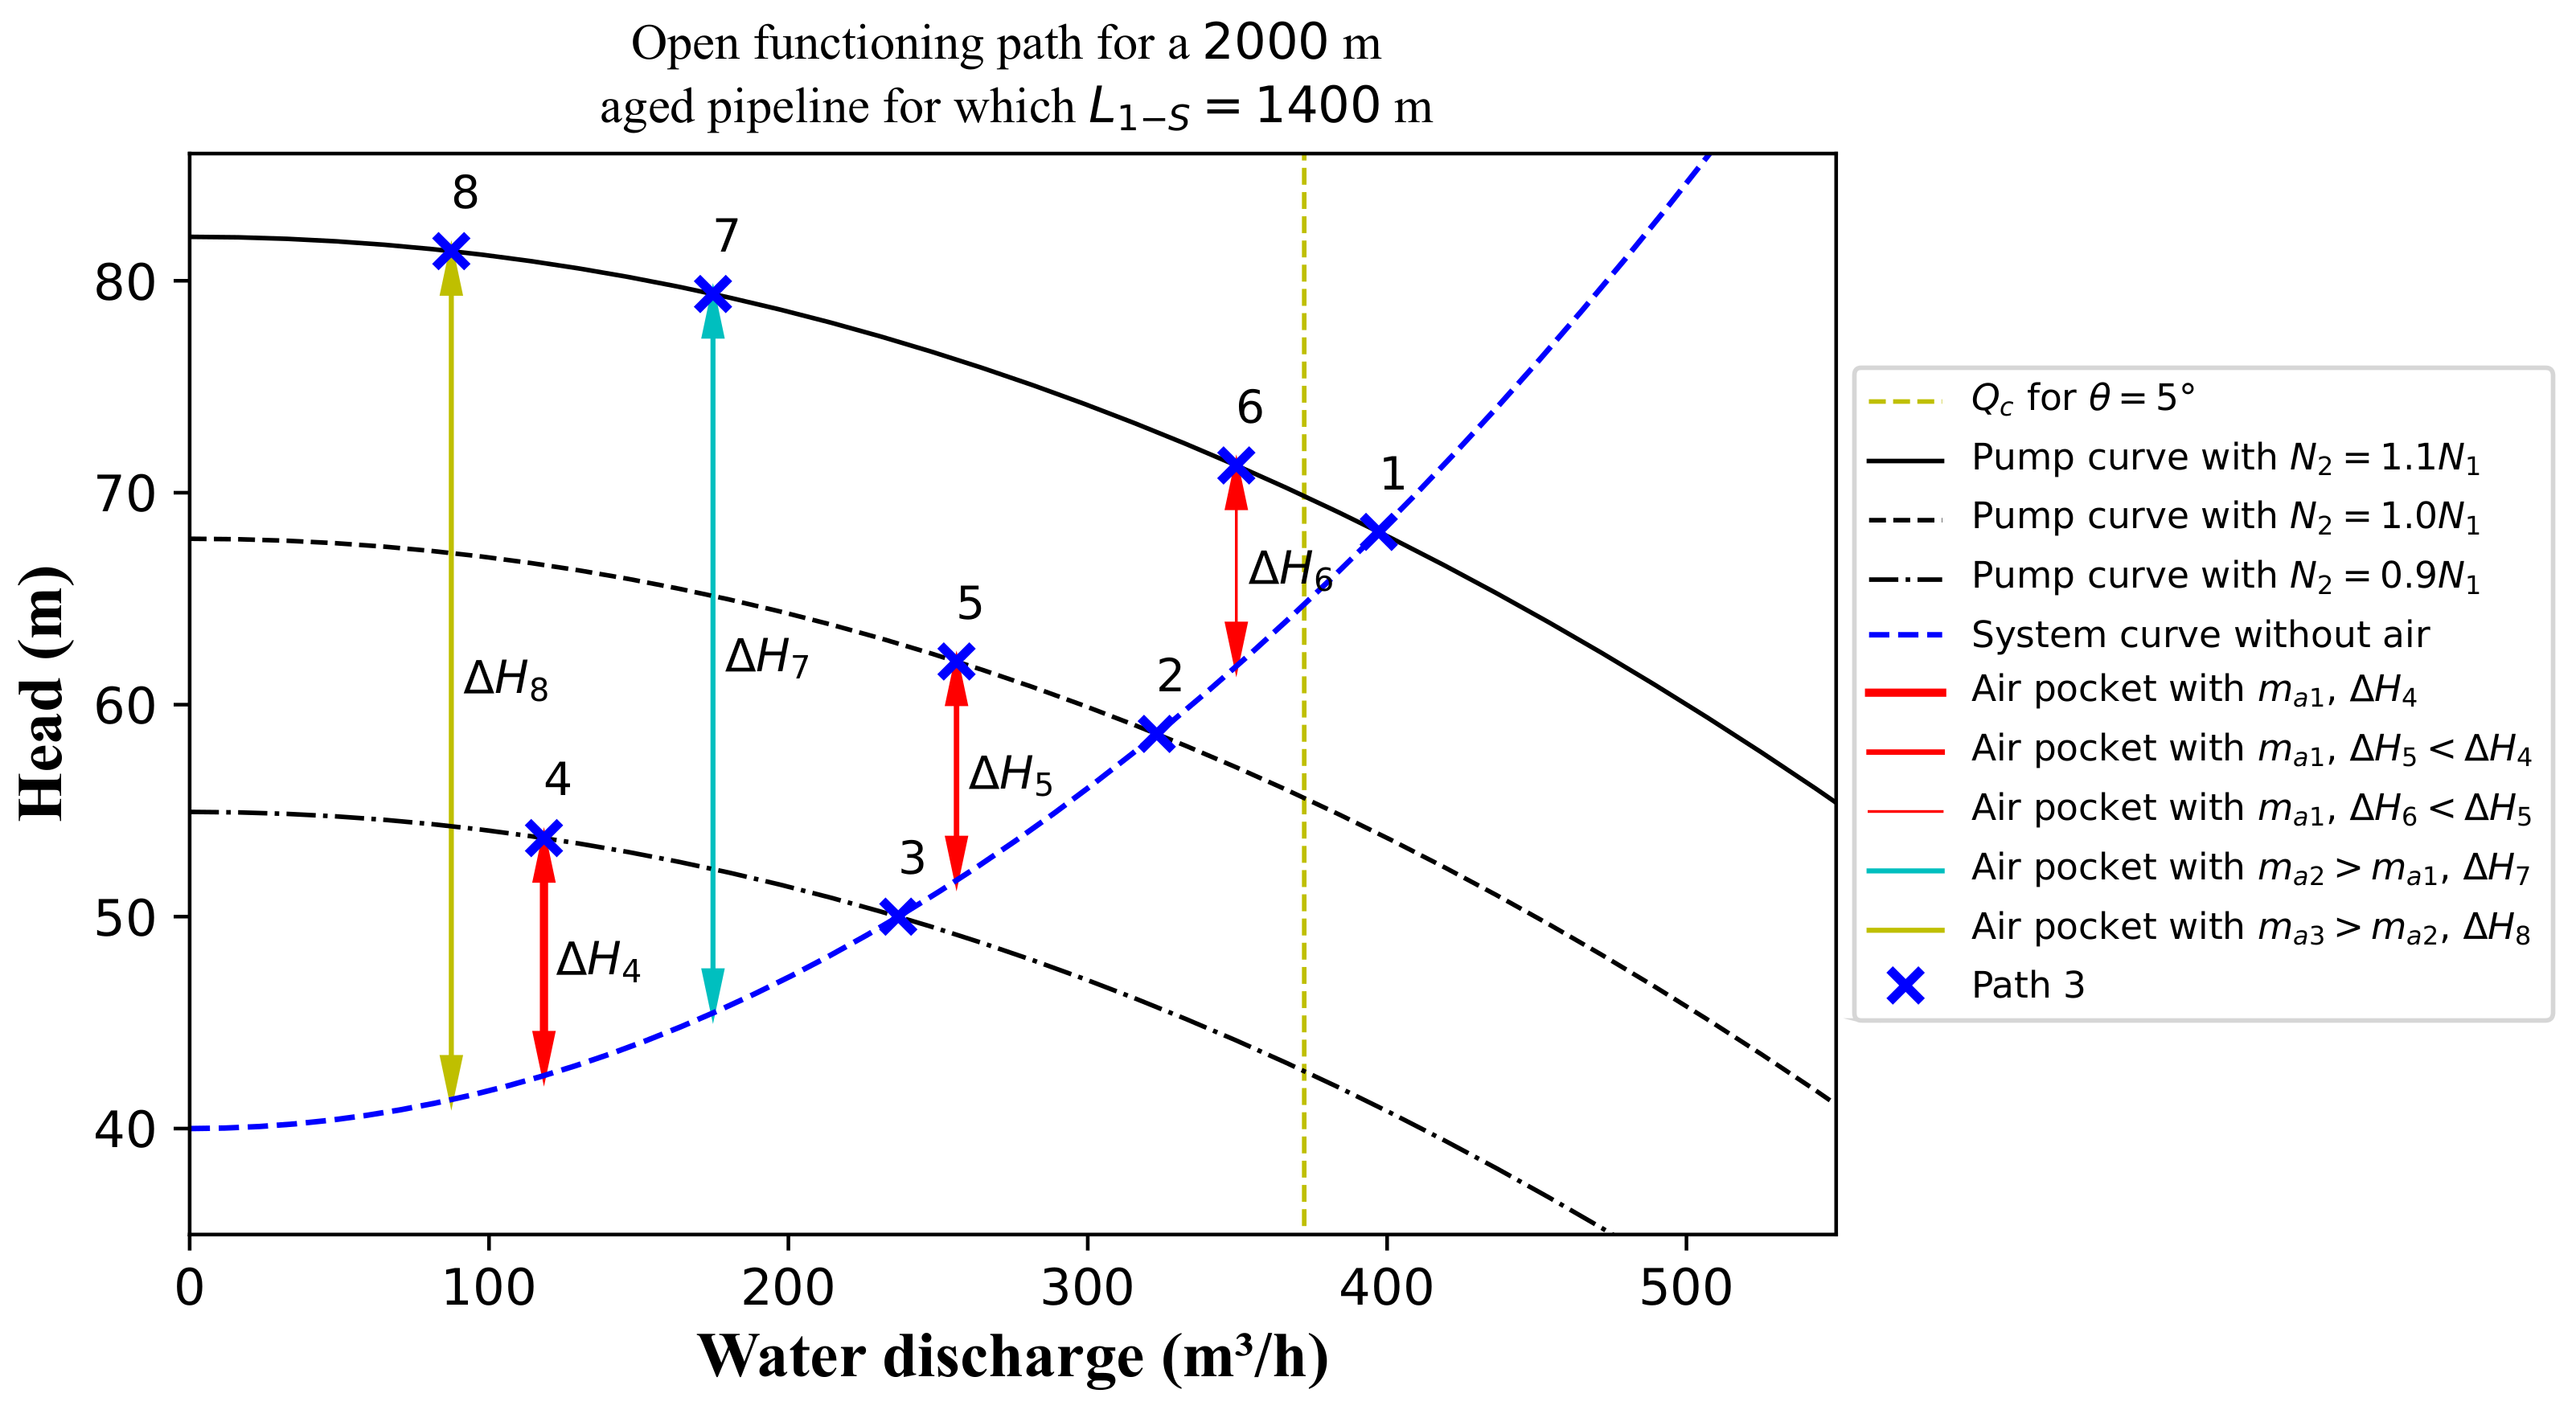
3.4. Evolution of Discharge Reduction in the Context of Air Entrapment

The examples explored in the previous section consider systems for which the mass of entrapped air is constant through time. In more realistic situations, however, air pockets behave dynamically: coalescing and growing at high points; breaking apart at low bends or hydraulic jumps; progressively dissolving air into the liquid water phase; or being released from the liquid water phase due to prolonged or transitory episodes of reduced pressures [10,35].
A water pipeline should be designed and operated to have sufficient velocity to avoid air accumulations in its descending segments. Indeed, the critical flow velocity for the hydraulic removal of entrapped air from a descending pipe segment is a key design parameter [29]. Formulations for the critical water velocity are discussed more thoroughly later in this work, but, in essence, the larger the pipe diameter and the steeper the downward inclination of a pipe segment, the larger the necessary water velocity for the hydraulic removal of entrapped air [24].
Figure 5, Figure 6 and Figure 7 show the pump and system curves for a rising pipeline with the following characteristics: the pipeline length is 2000 m with a diameter of 300 mm; a friction factor of 0.017 for a new pipe and 0.034 when aged; an unvented descending pipe segment with θ equals to 5 degrees; an elevation difference between upstream and downstream reservoirs of 40 m; Z S = 40 m; and a pumping system comprising a pump of model KSB ETA 150-40 with rotor of 360 mm and rated rotational speed of 1760 rpm. Figure 5 and Figure 6 refer to the system with f = 0.017 , while Figure 7 refers to the system with f = 0.034 . In Figure 5, Figure 6 and Figure 7, Equation (5) is used, k = 1.0 is assumed, i.e., isothermal air pocket evolution, and ( L L a ) is assumed as L.
In Figure 5, the system starts working at point 1 (situation without air entrapment and with rated rotational speed N 1 ) for which the water discharge is beyond the critical value Q c —such critical value is the necessary discharge for the hydraulic removal of entrapped air from the descending pipe segment. Q c is obtained according to the empirical formulation developed by Escarameia (2007) [24]. Thus, for point 1, the line is not prone to accumulate air. If, however, the pumping rotational speed reduces, say to 90% of the rated speed, the system will evolve to point 2. For point 2, however, water discharge is less than Q c and thus air accumulations would be initiated at the line’s descending pipe segment, with the system progressively losing its conveyance capacity until reaching point 3, for example. If the rotational speed is then increased back to the rated speed, the system will start working at point 4, not the original point 1. Note that going from point 3 to point 4 compresses the entrapped air pocket, i.e., Δ H 4 < Δ H 3 . This happens because of the head increase due to the increase in pumping speed. At point 4, Q is still less than Q c and thus, to avoid further air accumulations, increasing the rotational speed beyond the rated value—10% beyond the rated value, for example—would result in the system working at point 5 for which Q > Q c . Again, the increase in head due to the increase in pumping speed reduces the air pocket size even more and moves the system curve downwards from point 4 to point 5 ( Δ H 5 < Δ H 4 < Δ H 3 ). After reaching point 5, the system will naturally void the accumulated air by hydraulic means since Q > Q c until reaching point 6 (situation without entrapped air). The pipeline then could resume the rated rotation and finally work again at the original point 1. The functioning path just described related to Figure 5 can be classified as closed.
As observed in Figure 6, if the system, after reaching point 4, works for too long without an increase in rotational speed, it would continue to progressively retain air and eventually evolve to, say, point 5—at point 5 in Figure 6, the air pocket mass is greater than at point 4. In Figure 6, after the system reaches point 5, an increase in the pumping rotational speed from 100% to 110% would be insufficient to generate a discharge beyond the critical value Q c —the water discharge at point 6 is less than Q c . Without a further increment in the rotational speed beyond 110%, the line would tend to progressively retain more and more air—going from point 6 to point 7, and then from point 7 to point 8, for example. Of note, for a functioning point such as point 8, the water conveyance capacity of the line and the efficiency of the pumping system are greatly compromised. The functioning path related to Figure 6 can be classified as open.
For some pipe materials, cast iron, for example, as the pipeline ages, its wall roughness increases, and so does its friction factor. Figure 7 shows how the system would require an increased rotational speed of the pumping system to attain a discharge beyond Q c even with the line not containing an entrapped air pocket (point 1)—in practice, additional pumping power would be employed with a suitable retrofitting approach. This happens because of the increased slope of the system curve when considering a larger friction factor. For the case with an aged pipeline, the system would become problematic in relation to air entrapment and consequent water conveyance reduction if the rotational speed is reduced for a prolonged duration. Note that in Figure 7, even with only one period of air accumulation between points 3 and 4, the line is unable to achieve beyond the critical water discharge after reaching point 6. Since Q < Q c at point 6, progressive air accumulation would cause the system go from something like point 6 to point 7, and then from point 7 to point 8.
Note that the critical discharge for air removal by hydraulic means is unchanged between the cases with f = 0.017 and f = 0.034 Q c is the same in Figure 5, Figure 6 and Figure 7. Indeed, to a good approximation the choice of pipeline material does not influence the critical velocity for air removal by hydraulic means [10]. Discontinuities on pipe walls, however, might be conducive to the accumulation of air bubbles. Air valves, for example, are installed over pipeline risers with the function of collecting air bubbles or pockets [6].
Also note that the distance between the high point and the upstream reservoir L 1 S is different for each one of the studied situations, i.e., the L 1 S values are 250, 1000, and 1400 m for the cases depicted in Figure 5, Figure 6 and Figure 7, respectively. For all cases, however, the high point is at an elevation of 40 m. As the high point moves farther from the upstream reservoir, the sensitivity of the air pocket to the pumping system’s rotational speed reduces. In addition, as the high point elevation increases, so does the volume and detrimental influence of the entrapped air pocket.

Energy Considerations

Energy-wise, as noted, the progressive accumulation of air in a water rising pipeline tends to reduce its conveyance capacity, causing the pumping system to function at a lower efficiency. Moreover, for a pipeline without an air management strategy, to compensate for the air-related head-losses, either the pumping power needs to increase or the pumping system needs to function for longer periods, increasing the electricity consumption. Unfortunately, head-losses caused by entrapped air are sometimes mistaken by increased pipeline friction or other causes, which can distract attention from the primary cause of the problem.
For the case in Figure 6, at point 1, the efficiency of the pump is 81% and the pumping power is 72 kW. At point 2, with a reduction in the pump’s rotational speed (to 90%), the efficiency changes to 76%, the pumping power becomes 49 kW, and the water discharge decreases from 396 to 290 m 3 /h. Considering a hypothetical pumping functioning time of 9 h per day, the necessary time to achieve the same daily volume would increase to about 12 h. Considering the pumping power and new daily functioning time at point 2, the energy consumption would go from 645 to 608 kWh. Note that, from point 1 to point 2, there is still no entrapped air influencing the system.
At point 3, with the presence of an entrapped air pocket and 90% of the rated rotational speed, the efficiency goes to 53%, the pumping power goes to 39 kW, the water discharge goes to 145 m 3 /h, and the system would be required to function for more than 24 h, thus compromising the overall water delivery. The energy consumption would considerably increase at point 3 (going to 966 kWh). In the previous calculations, it was considered the usual pumping power equation ( P = 9.8 Q H / η , with η as the pump efficiency and P its power in kW) [39]. The reduction in efficiency due to a reduction in rotational speed was neglected. From this example, it becomes evident that adequately managing the air content in a pipeline is essential for its overall energy efficiency but also for the assurance of meeting the water conveyance requirements.

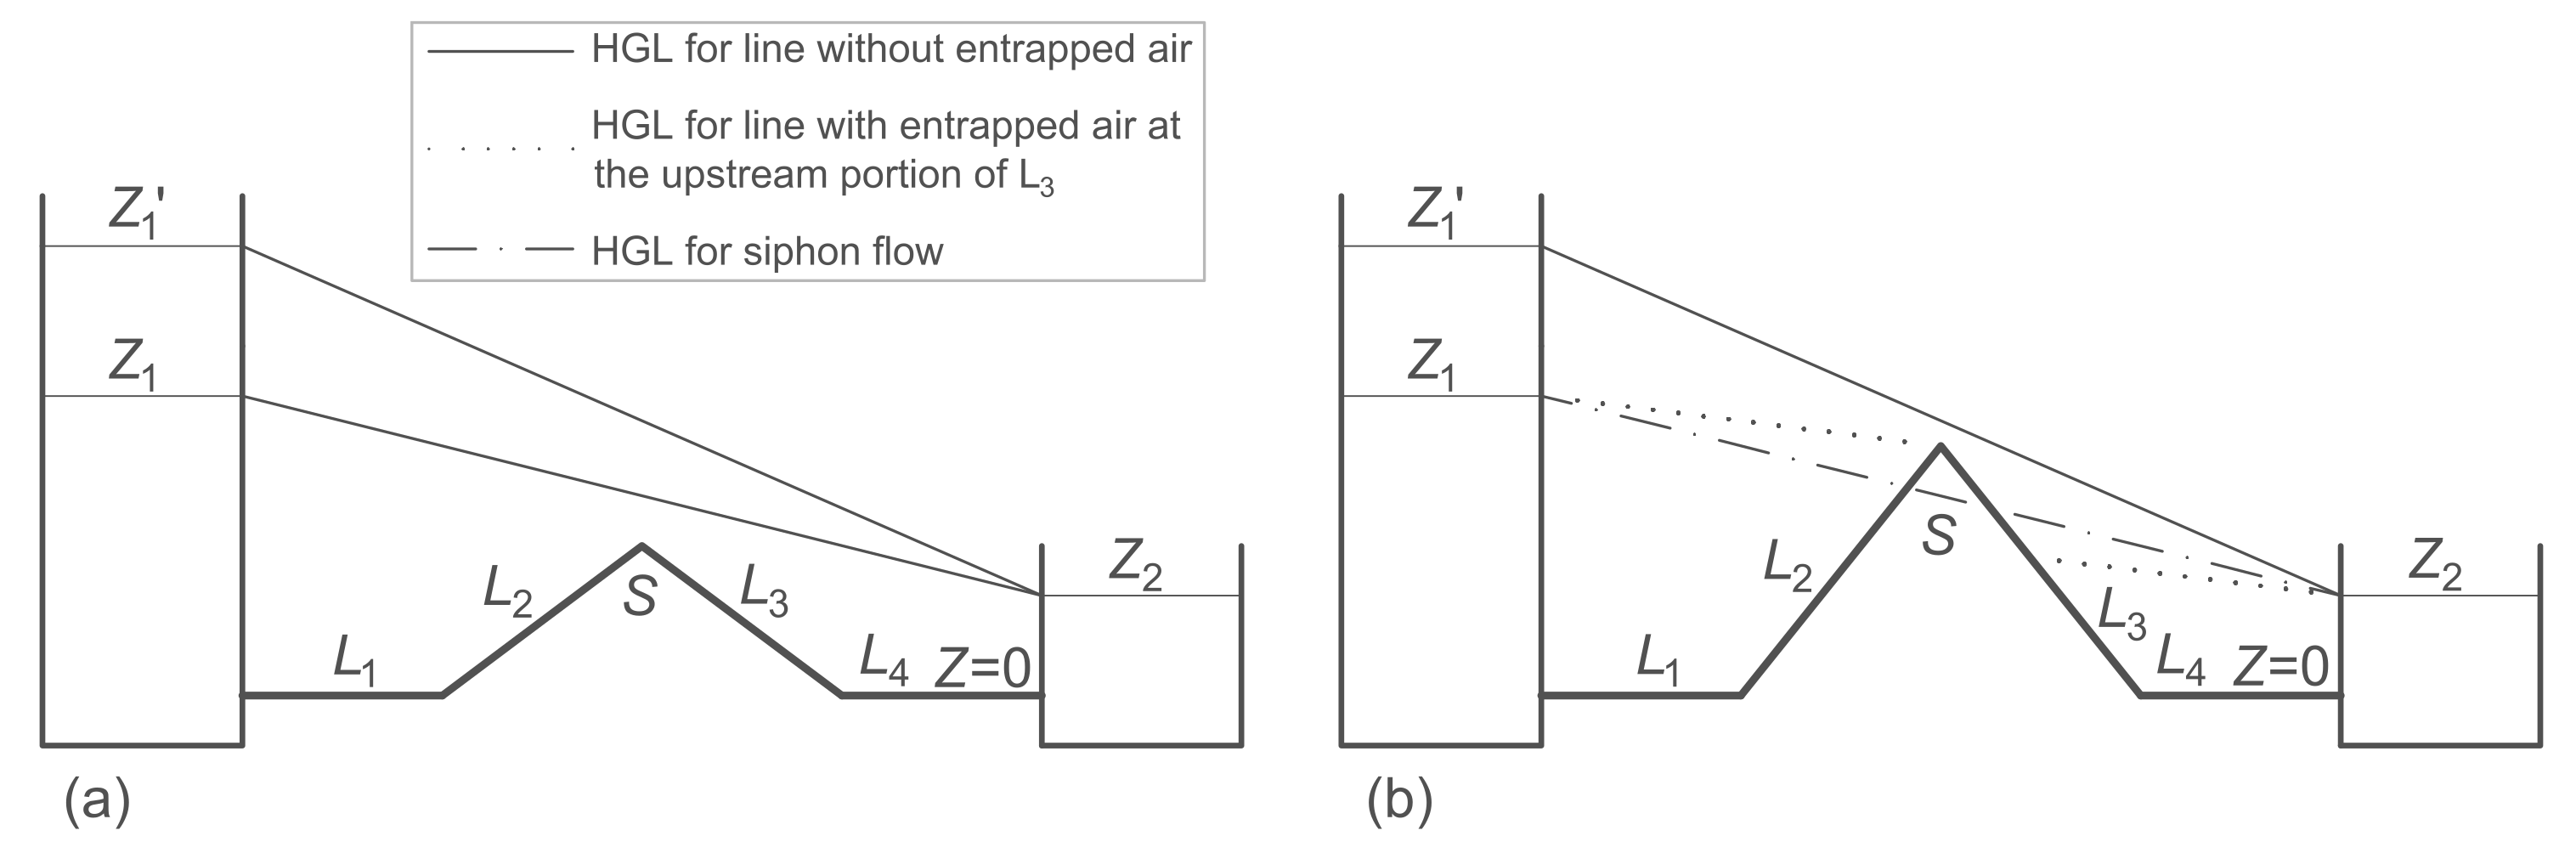
3.5. Siphon Flow and Associated Air Entrapment Risks

Siphon flow occurs when a portion of a pipeline continually works under negative (sub-atmospheric) pressures. A pipeline segment flowing under siphon flow is thus vulnerable to the intrusion of exterior fluids. In a sense, siphon flow could be classified as an intermediary situation between regular pipeline operation and operation with entrapped air. If a line is delivering water under siphon flow, then ventilation at the siphon’s high point, due to the presence of a leaky point or an air valve, is expected to decrease or eliminate the line’s conveyance capacity [40].
Figure 8 shows diagrams representing two similar gravity pipelines, with both lines having a distinct intermediate high point. In Figure 8a, the line is not prone to siphon flow for both considered elevations of the upstream reservoir, Z 1 or Z 1 . In Figure 8a, for the specific case without an air valve at the high point and with insufficient water velocity in the descending pipe segment, the line would be particularly vulnerable to air entrapment.
In Figure 8b, however, the line experiences siphon flow for the lower elevation of the upstream reservoir ( Z 1 ). In such a case, the installation of an air valve at the siphon’s high point would result in air admission and a consequent reduction in its conveyance capacity—this would eliminate the siphon flow since pressure would become atmospheric at the high point. Such a reduction in flow is represented in the figure by the reduced-slope piezometric lines (indicated by dotted lines). Such type of discharge reduction might be prevented with the use of an air valve with anti-inflow check valve [6].
For a pipeline prone to siphon flow and fitted with a usual air valve at the siphon’s high point, however, as the elevation of the high point increases, the conveyance capacity of the line decreases. In addition, for the case with a usual air valve, as the high point is moved away from the upstream reservoir, water discharge also decreases [40]. A system such as the one depicted in Figure 8b, even if initially operating without siphon flow or without entrapped air, can have its capacity substantially reduced—a reduction perhaps larger than that expected by an unsuspected operator—if its source of upstream head is at any time sufficiently decreased.

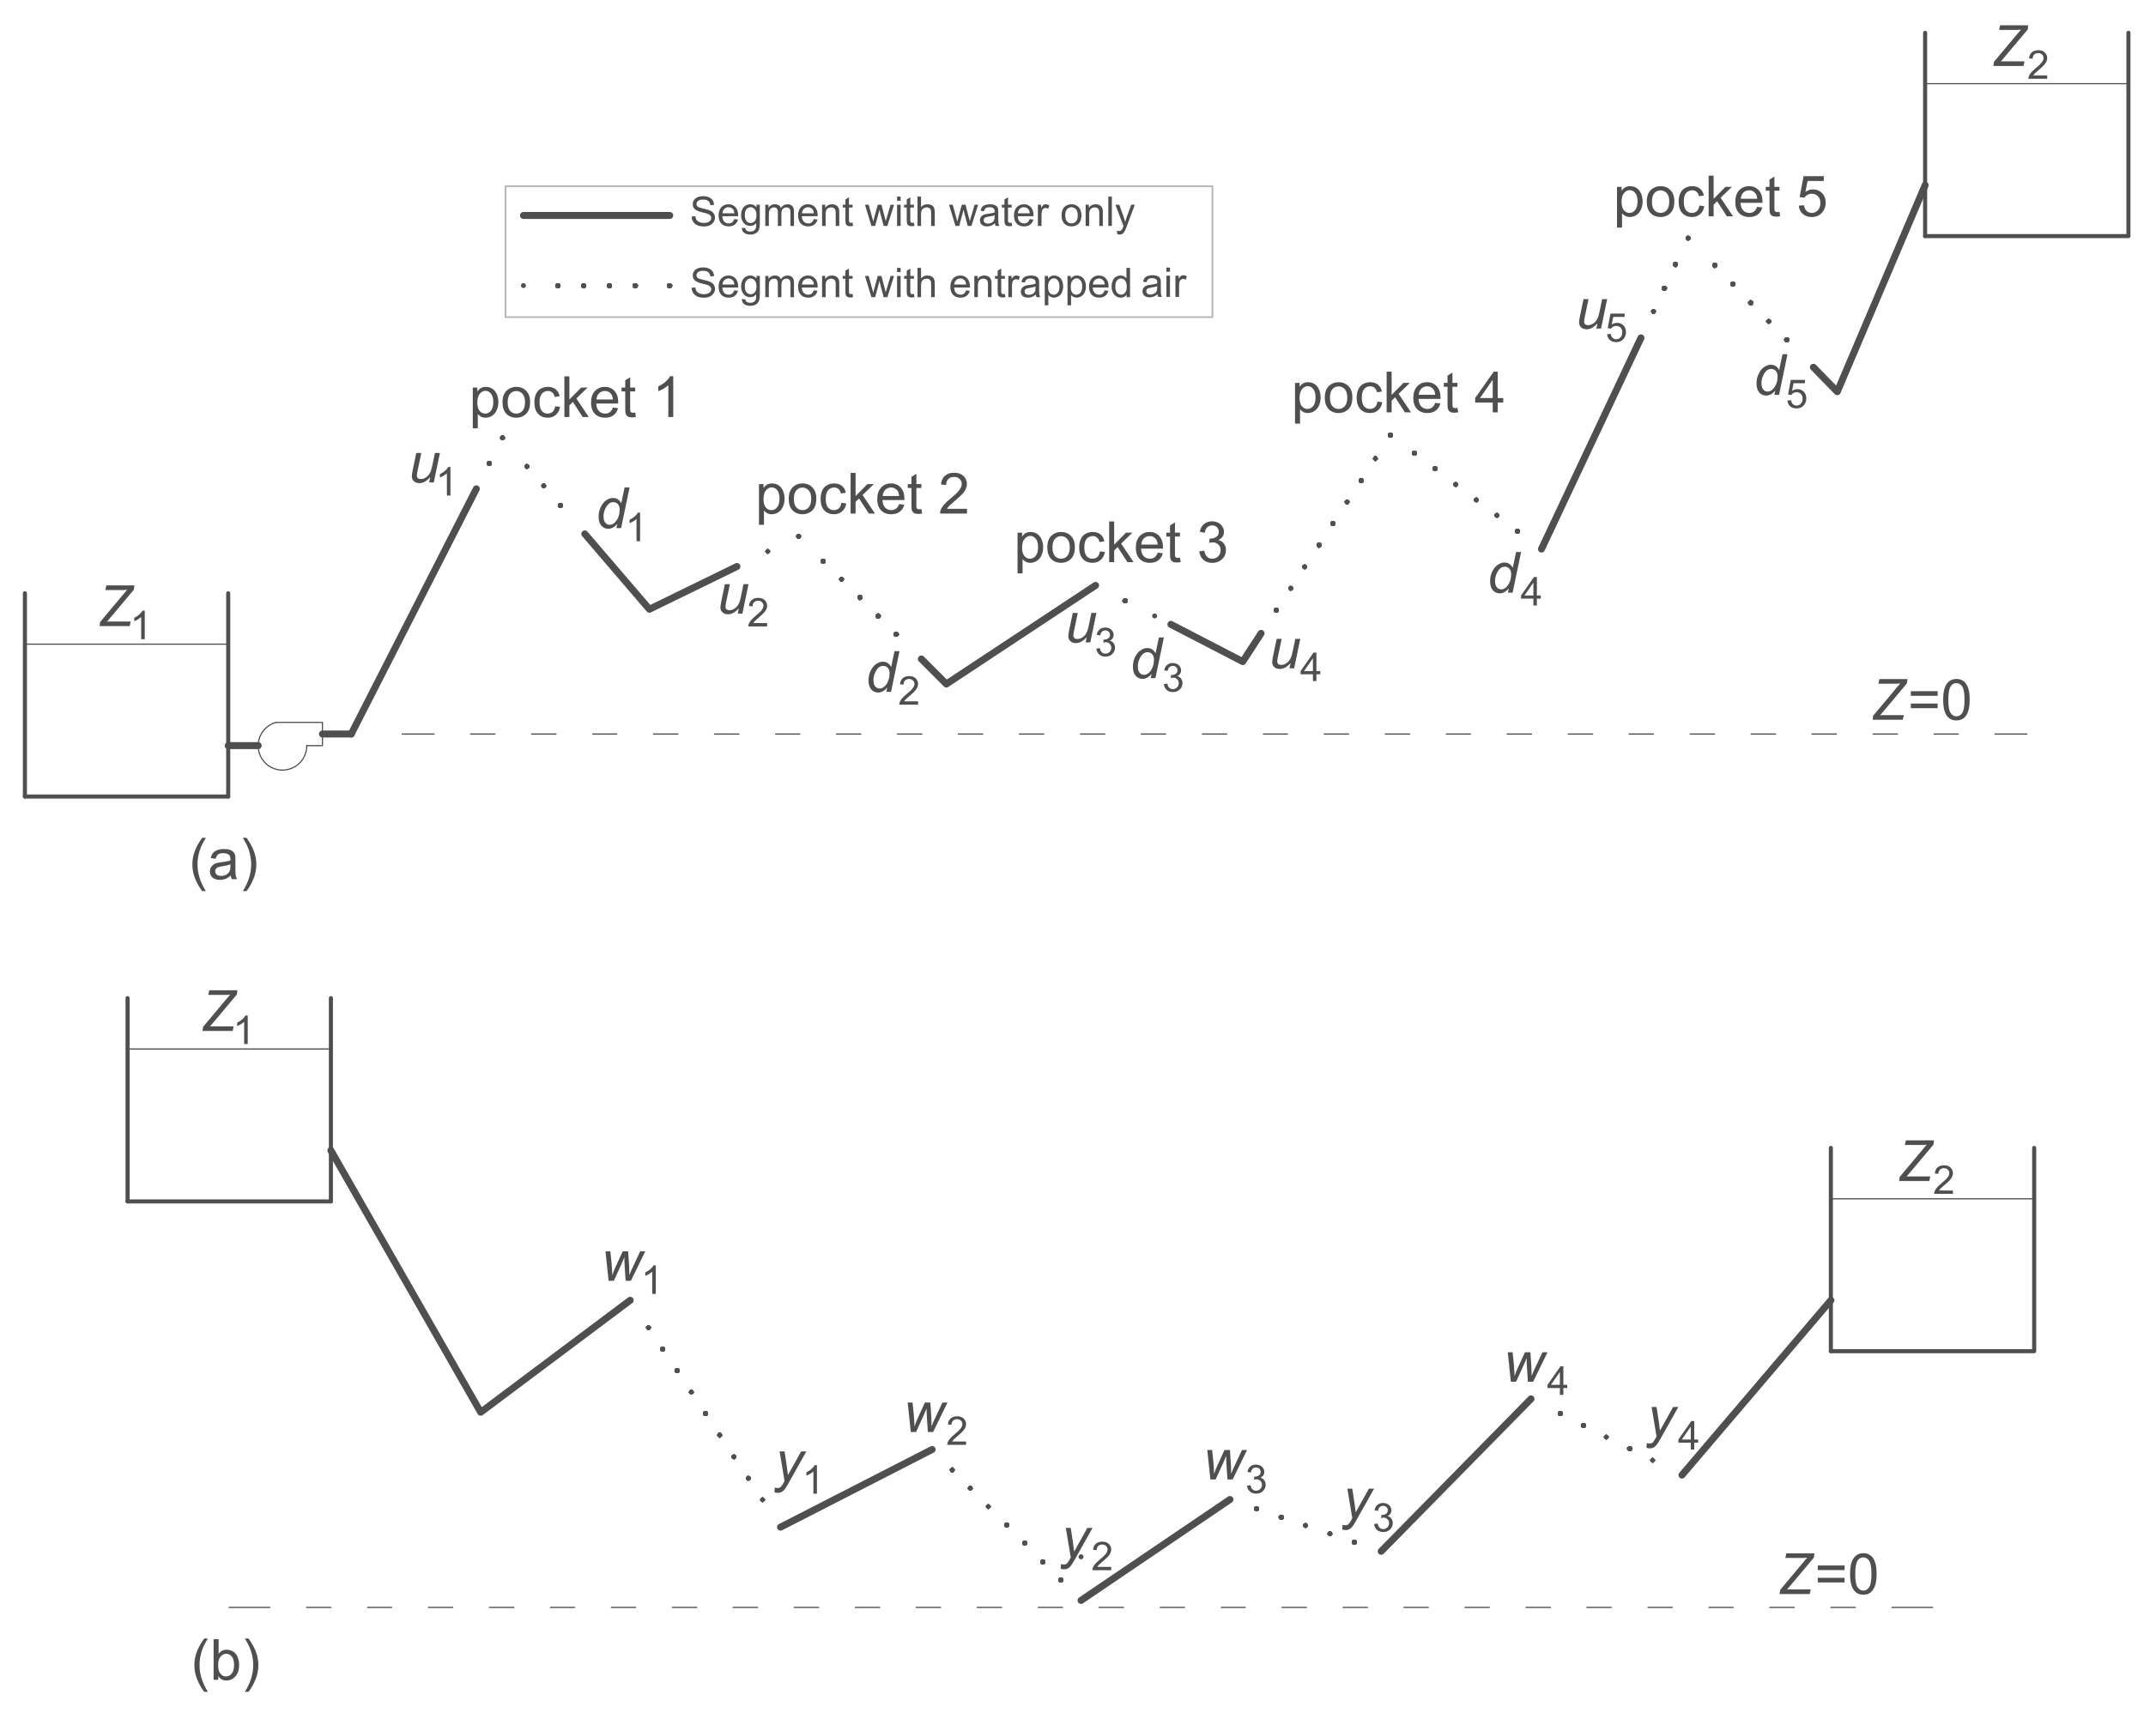
3.6. Air-Binding in Pipelines

If an entrapped air pocket becomes too large, air-binding might occur—that is, there may be a complete air-induced interruption of forward flow. Figure 9 shows the schematics of two illustrative pipelines: a rising line with entrapped air in the vicinity of its high points (Figure 9a) and a gravity line with entrapped air in most of its descending segments (Figure 9b). According to Koelle (1981) [41], the air pocket distribution hypothesis used in Figure 9b, i.e., air entrapment throughout the whole extension of descending segments, could be viewed as a conservative preliminary assumption. In fact, in practice, it is often difficult to determine the actual location of entrapped air pockets in pipeline systems [42].
For the water-rising line in Figure 9a, the static condition (no water discharge) is given by
H s + Z 1 Z 2 ( Z u 1 Z d 1 ) ( Z u 2 Z d 2 ) ( Z u 3 Z d 3 ) ( Z u 4 Z d 4 ) ( Z u 5 Z d 5 ) = 0
where H s is the pumping system’s shut-off head, Z 1 is the elevation of the upstream reservoir, Z 2 is the elevation of the downstream reservoir, Z u i is the elevation of the upstream end of the ith air pocket, and Z d i is the elevation of the downstream end of the ith air pocket. If the left-hand side of Equation (18) becomes larger than zero, then forward flow is established in the pipeline.
With the assumption of entrapped air throughout the whole extension of descending pipe segments, as in Figure 9b, the net available head for water conveyance is given by
H net = Z 1 Z 2 ( Z w 1 Z y 1 ) ( Z w 2 Z y 2 ) . . . ( Z w N Z y N )
where Z w i is the elevation of the upstream end of the ith descending pipe segment, Z y i is the elevation of the downstream end of the ith descending pipe segment, and N is the number of descending pipe segments with entrapped air—a descending pipe segment right downstream of an upstream reservoir should be unnumbered.
In Figure 9b, eventual entrapped air in the first descending pipe segment, if not conveyed downstream by the flowing water, will naturally blow back towards the upstream reservoir. An obvious way to increase H net in Equation (19), and consequently, the pipeline’s water discharge, is to avoid the presence of air in some or all descending pipe segments. This condition might be achieved with the installation of air valves at the line’s high points.

4. Air Management Strategies

Several approaches are valuable as a way of mitigating or eliminating operational issues associated with entrapped air. The two most common ones are to design the system to hydraulically remove entrapped air, or to use carefully chosen and maintained air valves.

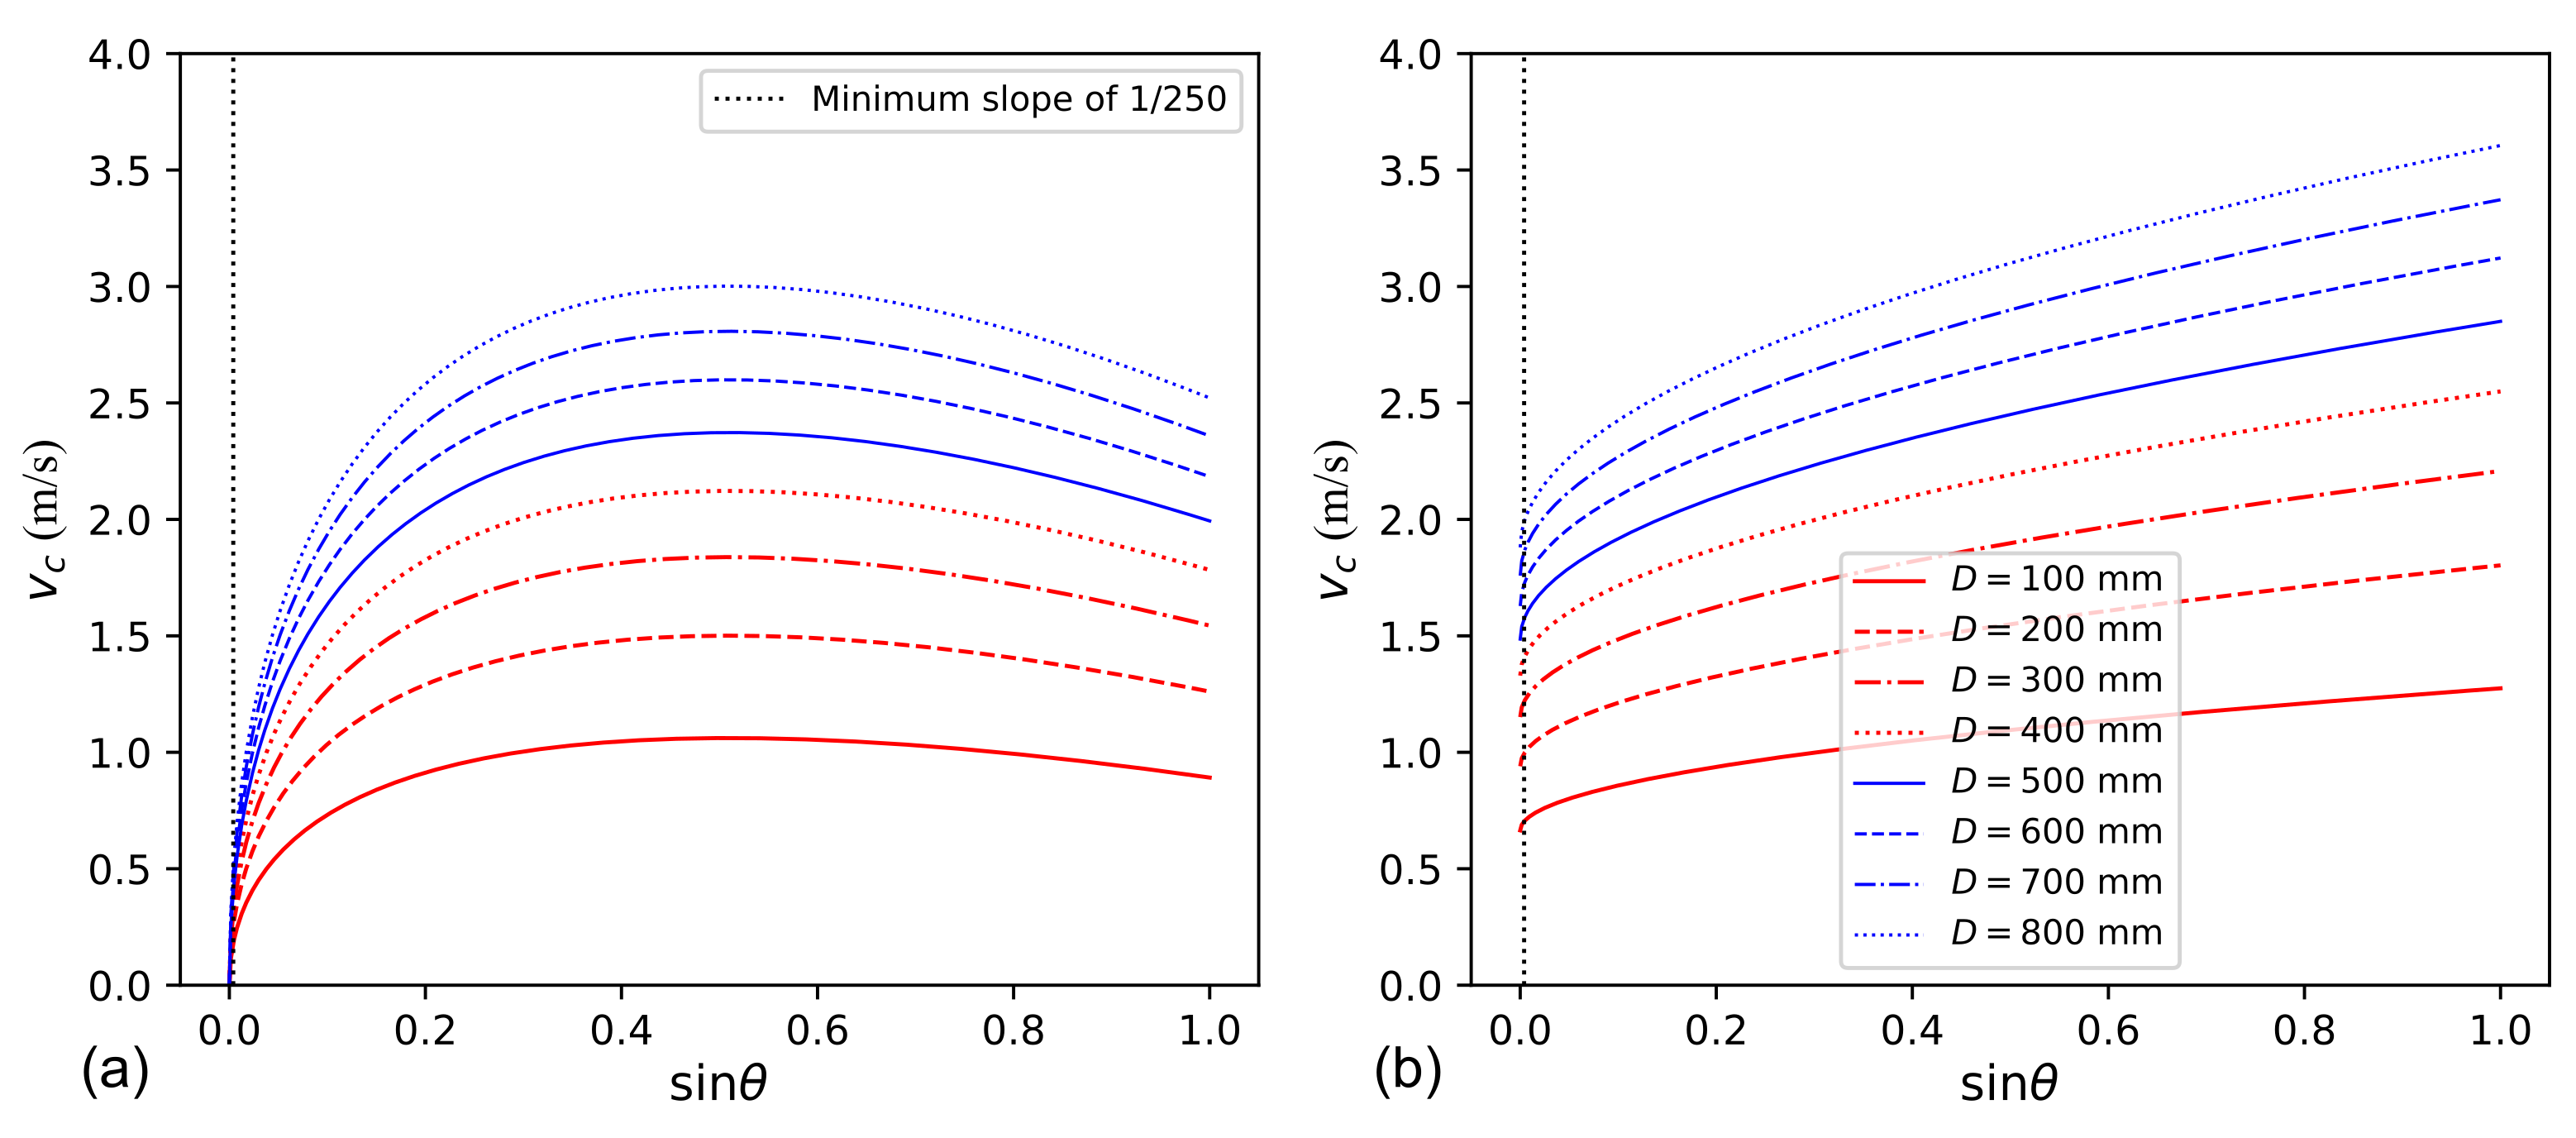
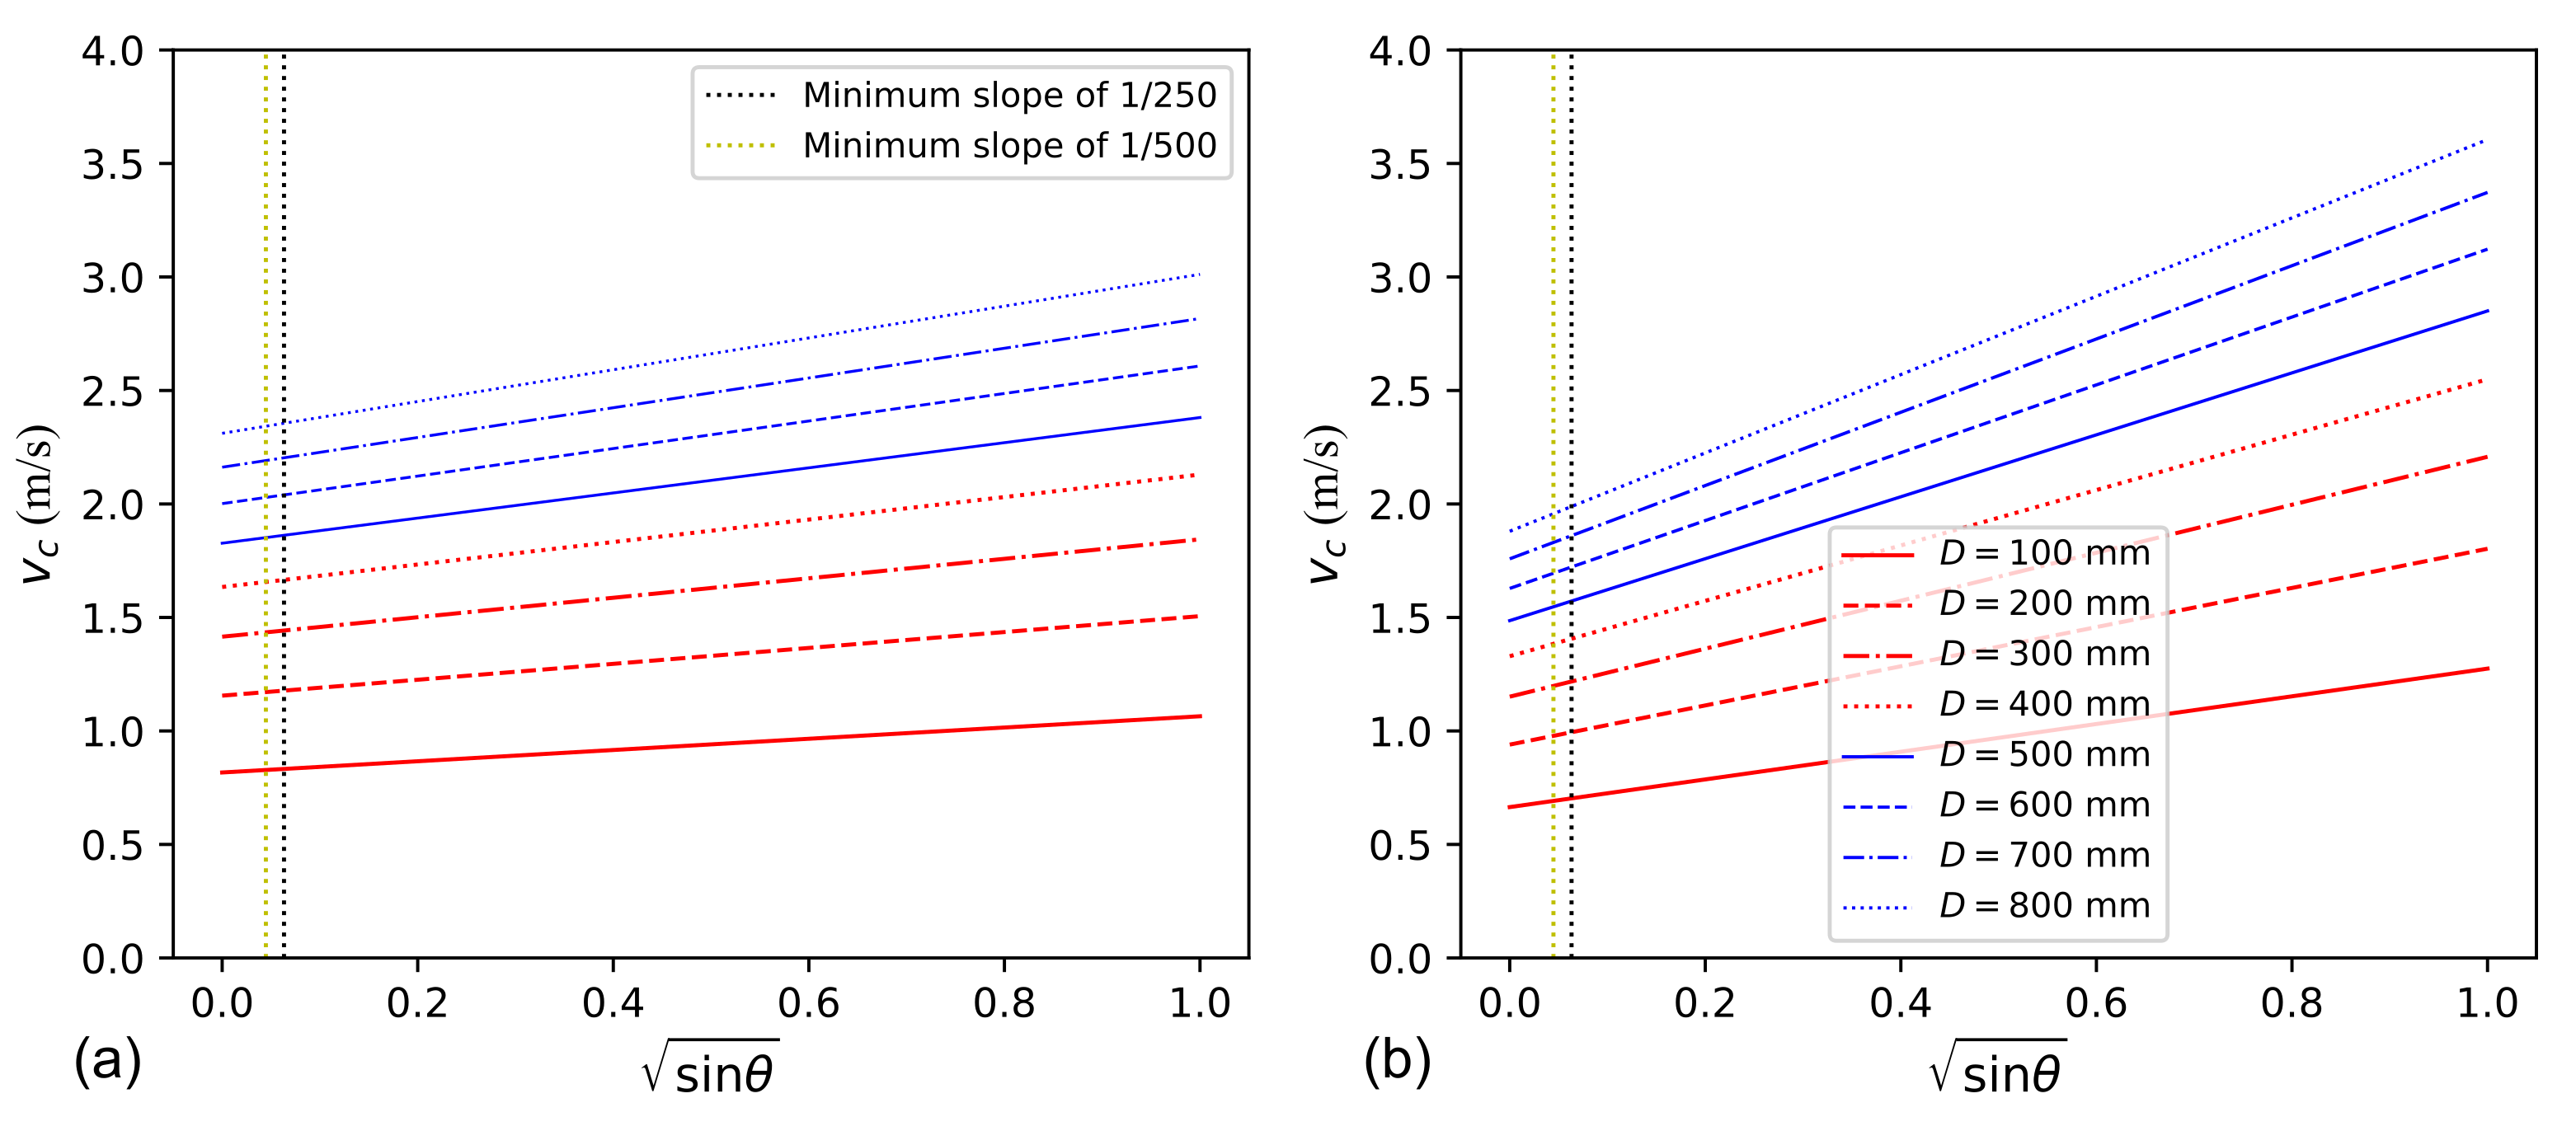
4.1. Hydraulic Removal of Air

As previously mentioned, if an entrapped air pocket is to be conveyed downstream in a descending pipe segment, the water velocity in the pipeline must exceed a certain critical value. Several such critical velocity equations have been reported in the literature. Lauchlan et al. (2005) [10], Escarameia (2007) [24], Pozos et al. (2010) [16] and Pothof et al. (2013) [28] bring selections of curves using critical velocity formulations found in the literature. Critical velocity equations are often presented in the following non-dimensional form:
v c / g D = α sin θ + β
where v c is the critical velocity for the hydraulic removal of air, g is the acceleration due to gravity, D is the pipe diameter, θ is the pipe’s downward inclination, and α and β are coefficients that depend on pipe diameter and air pocket size.
In essence, Equation (20) considers that the critical velocity for the hydraulic removal of air scales with the Froude number. Some critical velocity equations bring the assumption of β = 0 , i.e., any water velocity would be sufficient to carry air downstream in a horizontal pipe. Authors making this assumption are numerous, including Kalinske and Bliss (1943) [43], Kent (1952) [44], Falvey (1980) [45], Koelle (1981) [41], Pozos et al. (2010) [16]. In fact, Kalinske and Bliss (1943) [43] found a discontinuity in their data and, for nearly horizontal pipes, v c increased unexpectedly. Such a discontinuity possibly arises because the hydraulic jump in the experiments of Kalinske and Bliss (1943) [43] did not always fill the whole pipe [25]. The curve used by Kent (1952) [44] to represent experimental data was afterwards improved by Mosvell (1976) (apud Lauchlan et al. (2005) [10]), who achieved a better fit by not imposing β = 0 . The research conducted by Pozos et al. (2010) [16] highlights the need of a minimal v c for air movement in horizontal pipes. In the experiments conducted by Pozos et al. (2010) [16], however, no data were collected for horizontal segments. In fact, β should be expected to be larger than zero particularly since large air pockets in horizontal pipes tend be long and rather thin in the cross-sectional direction, thus limiting downstream-inducing drag [24,46].
Nevertheless, Koelle (1981) [41], based on data from previous research by Kent (1952) [44], Wisner et al. (1975) [47], and Edmunds (1979) [30], suggested a v c equation with β = 0 given by
v c / g D = 3 sin θ 2.1 sin θ
Note that this equation departs from the general form indicated by Equation (20). The critical velocity expressions suggested by Pothof and Clemens (2010, 2011) [26,27] also depart from Equation (20) but are more complex. In contrast to Equation (21), an example of v c equation with β > 0 is the one suggested by Escarameia (2007) [24], based on experimental tests using PVC pipes with D = 150 mm, which is given by
v c / g D = 1.1 ( 0.56 sin θ + 0.61 ) for 0.30 n < 2.0
where n = 4 V / ( π D 3 ) with V as the volume of the air pocket. Escarameia (2007) [24] mentioned that, despite using D = 150 mm in the tests, the use of Equation (22) to pipe diameters up to 1.0 m seems to be reasonable. It should be noted, however, that Pothof and Clemens (2010) [26] found that the clearing Froude number is dependent on the Eötvös Eo number up to Eo = 5000 , i.e., up to a pipe diameter of 200 mm. For D > 200 mm, the clearing Froude number is independent of the pipe diameter.
Equation (22) gives v c for the largest air pockets tested in the experiments reported by Escarameia (2007) [24]. In general, until a certain air pocket size, the larger the air pocket, the more difficult it is to hydraulically remove it from a descending pipe segment [10]. Gandenberger (1957) found that the clearing velocity v c was sensitive to air pocket size until n = 1 . Kent (1952) [44] did not find a strong relationship between v c and n. Wisner et al. (1975) [47] found that v c was independent of n if n > 0.8 . Escarameia (2007) [24] determined v c equations applicable for a range between 0.0002 to 2. According to Escarameia (2007) [24], further increments in air pocket size beyond n = 2 should not have much of an effect on v c . Table 1 shows v c values according to Equation (22) by Escarameia (2007) [24].
Figure 10 shows the v c versus sin θ curves obtained using Equations (21) and (22). Despite the discrepancies between the curves in Figure 10a,b, in part due to the different β assumptions, there is relatively good agreement for middle-range pipe inclinations. Nevertheless, Equation (22) seems more applicable than Equation (21) given its experimental substantiation. However, a strategy used by Koelle (1981) [41] for the determination of Equation (21) could be employed in the assessment of new v c expressions. To determine Equation (21), Koelle (1981) [41] considered not only experimental data from controlled tests but also some field data that were available at the time. As suggested by Edmunds (1979) [30], useful field data for the determination of v c curves would come as pipeline segment and flow characteristics versus whether air accumulates at such segments—a v c curve would pass between such points.
Like Escarameia (2007) [24], Wisner et al. (1975) [47] also considered β > 0 . More specifically, Wisner et al. (1975) [47], through experimental tests and considering previous studies, determined the following v c equation:
v c / g D = 0.25 sin θ + 0.825
Of note, Equation (23) has the largest value of β of those reported in the review done by Lauchlan et al. (2005) [10]. Figure 11 shows the v c versus sin θ curves obtained using Equations (22) and (23). The curves obtained from Equation (23) have a lower inclination than those obtained from Equation (22). However, this is somewhat compensated by the larger β in Equation (23). Figure 11 also indicates typically adopted minimum slopes for water pipelines [10].
Indeed, v c equations often disagree on the required values of α and β . This could be at least partly the result of peculiarities in the experimental set-ups or from unclear reporting of measurements. A key concern regarding the v c equations is the usual relatively low-pressure conditions for the entrapped air pockets during tests. In practice, entrapped air can be subject to a large range of pressure values [12,29].

4.2. Application of Air Valves

Air exchange valves (AEVs) in water pipelines are intended to permit the necessary air exchanges to and from a pipe’s exterior to avoid air-related misbehaviour. The main types of AEVs include air-release valves (ARVs) to exhaust entrapped air under pressurized conditions; air/vacuum valves (AVVs) to allow significant air exchanges under relatively low differential pressures during pipeline filling, draining, and transient events; combination air valves (CAVs) to perform the combined ARV and AVV functions; and, finally, vacuum breakers (VBs) to admit large quantities of air to limit sub-atmospheric pressures during draining procedures or transient events [6].
In general, air valves fitted with slower closing or throttling devices or with reduced expulsion orifices are beneficial for limiting intense secondary pressures during water hammer events [22,48]. Despite the importance of air valves, current methods for air valve selection and sizing might not achieve universally workable air management solutions [9]. A design approach thought to be especially conservative might lead to a system with too many or too large air valves [49]. A poorly maintained air valve, for example, might permit the ingress of undesirable fluids or water leakage [9]. Practitioners often isolate air valves deemed to be generally unessential for system operation.
When initiating water movement in a pipeline, entrapped air without an easy path for ready exhaustion can become an issue. For pipeline filling, the M51 manual by the American Water Works Association (AWWA) recommends slow velocities of no more than 0.3 m/s to avoid dangerous pressure surges [6]. As observed in Table 1, however, for a horizontal pipe say with a diameter of 500 mm, the critical velocity for the hydraulic removal of air is 1.5 m/s. Thus, the absence of sufficient locations with air venting during controlled pipeline filling may result in entrapped air. Moreover, a pipeline’s diameter is often selected considering a water discharge to be attained in a future operational condition that is greater than initially, leading to low water velocities during initial operation. Moreover, in water distribution systems, during periods with reduced water demand, such as late night or early morning, water velocities are less intense than in peak hours [32].
Figure 12 shows a gravity pipeline for which a graphical approach evaluates the line’s propensity to air-binding during line filling. Such a process is found in Lescovich (1972) [50] and Koelle (1981) [41]. In Figure 12, at the end of each descending pipe segment without air valve protection, the HGL drops as much as the vertical displacement of such segment except for the first descending pipe segment directly connected to the upstream reservoir. Such an HGL drop corresponds to the assumption of descending pipe segments with air throughout their extensions as exemplified in Figure 9b. For descending pipe segments with air valve protection, the HGL is not suppressed since air is expected to be vented through suitable air valves. The process exemplified in Figure 12 for the location of air valves to avoid the air-binding of the system can be mathematically represented by
H net , j = H net , j 1 + max ( Z w i Z y i ) j 1
with j as the number of installed air valves, and max ( Z w i Z y i ) j 1 as the largest elevation variation of a descending pipe segment without air valve for the line with j 1 air valves. As the number of installed air valves increases, so does the net hydraulic head. In particular, for a gravity pipeline, H net , 0 is determined by Equation (19).
For the case in Figure 12a, with the absence of air valves, forward flow is not attained. Indeed, the step-like HGL in Figure 12a crosses the level of the downstream reservoir after the second descending pipe segment, which is characterized by a substantial vertical displacement. Indeed, the application of Equation (19) for the case in Figure 12a would produce a negative number.
To address this issue, first, an air valve should be considered at the upstream end of the descending pipe segment with largest vertical displacement (high point most to the left) as shown in Figure 12b. An air valve at such point, however, would be insufficient to avoid the crossing between the step-like HGL and the level of the downstream reservoir. The next descending pipe segment with the largest vertical displacement ( Z w i Z y i ) is the one associated with the second high point (from left to right in the figure). Still, as observed in Figure 12c, the step-like HGL would barely cross the level of the downstream reservoir with two installed air valves. In sum, three air valves ( j = 3 ), as shown in Figure 12d, would be necessary to avoid the binding of the system, i.e., one air valve at each one of the high points closest to the upstream reservoir.
Even if an active line is sufficiently equipped with air valves, the water discharge might be too slow for the hydraulic removal of entrapped air in one or more descending segment(s) without air valve protection. In this type of situation, protection with ARV(s) should be used at the upstream end(s) of such segment(s). It should be noted that the shape of the pipeline depicted in Figure 12, i.e., concave upward shape, results in a line subject to a higher pressure level than what would happen for a more straight pipeline, for example. Higher pressure levels are conducive to air dissolution and to smaller entrapped air pockets.

5. Conclusions

This work examines the influence of entrapped air on the conveyance capacity and energy efficiency of water pipelines, as well as strategies to control these negative outcomes. As is widely appreciated, entrapped air in a pressurized system can reduce the system’s conveyance capacity, but some subtlety is required over the range of systems that occur in practice. Special care is needed particularly in pumping systems or if the level of the upstream reservoir is not adjusted to compensate for any air-induced deficit in the available head. A pipeline with entrapped air functions inefficiently, often well outside its ideal operational condition. The importance of these negative effects depends on many variables including the size and location of the air pockets, how frequently they form and how easily they are removed, which in turn depends on both the inclination of the descending pipe segments and the head of the upstream source. The reduction of conveyance capacity due to entrapped air is especially problematic for systems that run under relatively low pressures. It is found that rising water lines tend to be more resilient to air accumulations than gravity lines due to the peculiar shape of pump curves and the beneficial conjunction of buoyancy and drag forces. Air pocket size is sensitive to variations in upstream head, especially for pockets close to the upstream reservoir. A system initially resistant to air accumulations might eventually acquire chronic air-related issues if improperly operated or inadequately adapted to operational changes.
Two key air-management strategies are reviewed: hydraulic removal of air and use of air valves. The connection between steep descending pipe segments and air valves is evident: descending pipe segments for which the water discharge is insufficient for the hydraulic removal of air must usually be fitted with protective air valves. The paper discusses critical velocity equations for air removal from horizontal or descending pipe segments. In contrast to some published recommendations, the removal of entrapped air from a horizontal pipe is expected to require a minimum water flow velocity. Due to the difficulty of translating experimental results to the broad range of possible practical situations, the conditions for the hydraulic removal of entrapped air from horizontal or descending pipe segments remain uncertain. Some high point locations are expected to be particularly critical for air ventilation, particularly if upstream of long and steep descending pipe segments. A key takeaway is that air management strategies need to be periodically rethought and re-adapted as system conditions inevitably evolve over time.
Designers, operators, and owners of water pipelines should consider the following complications that may arise from unaddressed entrapped air pockets in piping systems:
  • The proclivity of a pipeline to the deleterious effects of entrapped air may significantly change over time. Initially well-behaved systems may get chronic air-related problems if not well maintained and adjusted to new operational circumstances.
  • Air valves should be carefully selected, sized, located, and maintained to allow the necessary air exchanges in a pipeline system in its varied operating conditions during its lifespan.
  • It is often difficult to identify the size and location of air pockets in a pipeline. Nevertheless, from their effects, operators might be able to infer their presence.
  • Entrapped air pockets can result in appreciable pumping inefficiency and conveyance capacity reduction.
  • The water conveyance reduction caused by unaddressed air pockets can put the serviceability of the system at risk.
The key implication is that the diligence and awareness of air management considerations are an ongoing need if water conveyance systems are to perform their many functions during their decades of service.

Author Contributions

Conceptualization, E.T. and B.K.; methodology, E.T. and H.M.R.; validation, E.T., M.B. and E.L.J.; formal analysis, E.T.; investigation, E.T.; data curation, E.T.; writing—original draft preparation, E.T.; writing—review and editing, E.T., M.B., H.M.R., E.L.J. and B.K.; supervision, E.L.J. and B.K. All authors have read and agreed to the published version of the manuscript.

Funding

This study was financed in part by the Coordenação de Aperfeiçoamento de Pessoal de Nível Superior—Brasil (CAPES)—Finance Code 001. This study was financed in part by the Pipeline Simulation Interest Group (PSIG) through the 2022 Orin Flanigan Scholarship awarded to Elias Tasca for his Ph.D. work.

Institutional Review Board Statement

Not applicable.

Informed Consent Statement

Not applicable.

Data Availability Statement

The data that support the findings of this study are available from the corresponding author upon reasonable request.

Conflicts of Interest

The authors declare no conflict of interest.

Abbreviations

Latin Symbols
Apipe cross-sectional area ( m 2 )
A a cross-sectional area occupied by the air pocket ( m 2 )
A w cross-sectional area occupied by the water phase ( m 2 )
acoefficient of the pump curve that characterizes its shape ( m 5 · s 2 )
Cpolytropic constant neglecting water depth in the channel flow
C * polytropic constant considering water depth in the channel flow
ccoefficient of the pump curve associated with the pump’s shut-off head (m)
Dpipe diameter (m)
EoEötvös number
ffriction factor
gacceleration due to gravity ( m / s 2 )
H net net available head for water conveyance (m)
H net , j net available head for pipeline with j locations with air valve protection (m)
H P head at the high point (m)
H S shut-off head (m)
h a head-loss caused by an entrapped air pocket (m)
kpolytropic exponent
Lpipeline length (m)
L 1 length of the first segment of the pipeline (m)
L 2 length of the second segment of the pipeline (m)
L 3 length of the third segment of the pipeline (m)
L 4 length of the fourth segment of the pipeline (m)
L 1 S distance between the upstream reservoir and the high point (m)
L a air pocket length (m)
L a , atm air pocket length under atmospheric pressure (m)
m a air pocket mass (kg)
Nnumber of descending pipe segments with entrapped air
N 1 pump’s rated rotational speed (rpm)
N 2 pump’s actual rotational speed (rpm)
nManning roughness coefficient ( m 1 / 3 · s) or dimensionless air pocket volume
P a air pocket pressure (Pa)
P atm atmospheric pressure (Pa)
Qwater discharge ( m 3 /s)
Q 0 , 1 water discharge for gravity line with Z 1 , 1
Q c critical water discharge for air removal by hydraulic means ( m 3 /s)
Q * water discharge considering the water depth in the channel flow ( m 3 /s)
Rrelative rotational speed
R h hydraulic radius (m)
Vair pocket volume ( m 3 )
v c critical velocity for air removal by hydraulic means (m/s)
ywater depth in the channel flow (m)
Z 1 elevation of the upstream reservoir (m)
Z 1 increased elevation of upstream reservoir (m)
Z 2 elevation of the downstream reservoir (m)
Z d i elevation of the downstream end of the ith air pocket (m)
Z S elevation of the high point (m)
Z u i elevation of the upstream end of the ith air pocket (m)
Z w i elevation of the upstream end of the ith descending pipe segment (m)
Z y i elevation of the downstream end of the ith descending pipe segment (m)
Greek Symbols
α coefficient that characterizes the shape of the critical velocity equation
β coefficient of the critical velocity equation related to the horizontal pipe
γ specific weight of water (N/ m 3 )
Δ H i additional head-loss caused by entrapped air pocket at point i (m)
Δ Z 1 elevation difference between Z 1 , 1 = 55 m and Z 2 = 50 m
θ inclination of the descending pipe segment (rad)
ψ angle formed by the water surface (rad)
Acronyms
ARVair-release valve
AVVair/vacuum valve
AWWA               American Water Works Association
CAVcombination air valve
drdownstream reservoir
HGLhydraulic grade line
SDGSustainable Development Goals
urupstream reservoir
VBvacuum breaker

References

  1. Vörösmarty, C.J.; Green, P.; Salisbury, J.; Lammers, R.B. Global water resources: Vulnerability from climate change and population growth. Science 2000, 289, 284–288. [Google Scholar] [CrossRef] [PubMed] [Green Version]
  2. Hamzekhani, H.; Mousavi, S.J.; Vesal, M. Water–energy nexus–based economic optimization of water supply projects. J. Water Resour. Plann. Manag. 2021, 147, 04021044. [Google Scholar] [CrossRef]
  3. Ferroukhi, R.; Nagpal, D.; Lopez-Peña, A.; Hodges, T.; Mohtar, R.H.; Daher, B.; Mohtar, S.; Keulertz, M. Renewable Energy in the Water, Energy and Food Nexus; International Renewable Energy Agency: Abu Dhabi, United Arab Emirates, 2015. [Google Scholar]
  4. Abdeldayem, O.M.; Ferràs, D.; van der Zwan, S.; Kennedy, M. Analysis of unsteady friction models used in engineering software for water hammer analysis: Implementation case in WANDA. Water 2021, 13, 495. [Google Scholar] [CrossRef]
  5. Martins, N.M.C.; Brunone, B.; Meniconi, S.; Ramos, H.M.; Covas, D.I.C. Efficient computational fluid dynamics model for transient laminar flow modeling: Pressure wave propagation and velocity profile changes. J. Fluids Eng. 2018, 140, 011102. [Google Scholar] [CrossRef]
  6. American Water Works Association (AWWA). Manual of Water Supply Practices M51—Air Valves: Air–Release, Air/Vacuum and Combination, 2nd ed.; AWWA: Denver, CO, USA, 2016. [Google Scholar]
  7. Kühnen, J.; Song, B.; Scarselli, D.; Budanur, N.B.; Riedl, M.; Willis, A.P.; Avila, M.; Hof, B. Destabilizing turbulence in pipe flow. Nat. Phys. 2018, 14, 386–390. [Google Scholar] [CrossRef] [Green Version]
  8. Fuertes-Miquel, V.S.; Coronado-Hernández, O.E.; Mora-Meliá, D.; Iglesias-Rey, P.L. Hydraulic modeling during filling and emptying processes in pressurized pipelines: A literature review. Urban Water J. 2019, 16, 299–311. [Google Scholar] [CrossRef]
  9. Ramos, H.M.; Fuertes-Miquel, V.S.; Tasca, E.; Coronado-Hernández, O.E.; Besharat, M.; Zhou, L.; Karney, B. Concerning dynamic effects in pipe systems with two–phase flows: Pressure surges, cavitation, and ventilation. Water 2022, 14, 2376. [Google Scholar] [CrossRef]
  10. Lauchlan, C.S.; Escarameia, M.; May, R.W.P.; Burrows, R.; Gahan, C. Air in Pipelines: A Literature Review; HR Wallingford: Oxfordshire, UK, 2005. [Google Scholar]
  11. Zhou, L.; Liu, D.; Karney, B. Investigation of hydraulic transients of two entrapped air pockets in a water pipeline. J. Hydraul. Eng. 2013, 139, 949–959. [Google Scholar] [CrossRef]
  12. Martins, S.C. Dinâmica da Pressurização de Sistemas Hidráulicos com Ar Aprisionado. Ph.D. Thesis, Instituto Superior Técnico, Universidade Técnica de Lisboa, Lisbon, Portugal, 2013. [Google Scholar]
  13. Pozos, O.; Sanchez, A.; Rodal, E.A.; Fairuzov, Y.V. Effects of water–air mixtures on hydraulic transients. Can. J. Civ. Eng. 2010, 37, 1189–1200. [Google Scholar] [CrossRef]
  14. Adamkowski, A. Case study: Lapino powerplant penstock failure. J. Hydraul. Eng. 2001, 127, 547–555. [Google Scholar] [CrossRef]
  15. Zhou, F.; Hicks, F.E.; Steffler, P.M. Transient flow in a rapidly filling horizontal pipe containing trapped air. J. Hydraul. Eng. 2002, 128, 625–634. [Google Scholar] [CrossRef]
  16. Pozos, O.; Gonzalez, C.A.; Giesecke, J.; Marx, W.; Rodal, E.A. Air entrapped in gravity pipeline systems. J. Hydraul. Res. 2010, 48, 338–347. [Google Scholar] [CrossRef]
  17. Vasconcelos, J.G.; Wright, S.J. Geysering generated by large air pockets released through water–filled ventilation shafts. J. Hydraul. Eng. 2011, 137, 543–555. [Google Scholar] [CrossRef]
  18. Aguirre-Mendoza, A.M.; Oyuela, S.; Espinoza-Román, H.G.; Coronado-Hernández, O.E.; Fuertes-Miquel, V.S.; Paternina-Verona, D.A. 2D CFD modeling of rapid water filling with air valves using OpenFOAM. Water 2021, 13, 3104. [Google Scholar] [CrossRef]
  19. Aguirre-Mendoza, A.M.; Paternina-Verona, D.A.; Oyuela, S.; Coronado-Hernández, O.E.; Besharat, M.; Fuertes-Miquel, V.S.; Iglesias-Rey, P.L.; Ramos, H.M. Effects of orifice sizes for uncontrolled filling processes in water pipelines. Water 2022, 14, 888. [Google Scholar] [CrossRef]
  20. Coronado-Hernández, O.E.; Derpich, I.; Fuertes-Miquel, V.S.; Coronado-Hernández, J.R.; Gatica, G. Assessment of steady and unsteady friction models in the draining processes of hydraulic installations. Water 2021, 13, 1888. [Google Scholar] [CrossRef]
  21. Hurtado-Misal, A.D.; Hernández-Sanjuan, D.; Coronado-Hernández, O.E.; Espinoza-Román, H.; Fuertes-Miquel, V.S. Analysis of sub–atmospheric pressures during emptying of an irregular pipeline without an air valve using a 2D CFD model. Water 2021, 13, 2526. [Google Scholar] [CrossRef]
  22. Tasca, E.; Karney, B.; Fuertes-Miquel, V.S.; Dalfré Filho, J.G.; Luvizotto, E., Jr. The crucial importance of air valve characterization to the transient response of pipeline systems. Water 2022, 14, 2590. [Google Scholar] [CrossRef]
  23. Li, X.; Wang, T.; Zhang, Y.; Guo, P. Study on the factors influencing air valve protection against water hammer with column separation and rejoinder. J. Water Supply Res. Technol.-Aqua 2022, 71, 949–962. [Google Scholar] [CrossRef]
  24. Escarameia, M. Investigating hydraulic removal of air from water pipelines. Water Manag. 2007, 160, 25–34. [Google Scholar] [CrossRef]
  25. Pozos, O. Investigation on the Effects of Entrained Air in Pipelines. Ph.D. Thesis, University of Stuttgart, Stuttgart, Germany, 2007. [Google Scholar]
  26. Pothof, I.; Clemens, F. On elongated air pockets in downward sloping pipes. J. Hydraul. Res. 2010, 48, 499–503. [Google Scholar] [CrossRef]
  27. Pothof, I.; Clemens, F. Experimental study of air–water flow in downward sloping pipes. Int. J. Multiph. Flow 2011, 37, 278–292. [Google Scholar] [CrossRef]
  28. Pothof, I.; Schuit, A.; Clemens, F. Influence of surface tension on air–water flows. J. Hydraul. Eng. 2013, 139, 44–50. [Google Scholar] [CrossRef]
  29. Ramezani, L.; Karney, B.; Malekpour, A. Encouraging effective air management in water pipelines: A critical review. J. Water Resour. Plann. Manag. 2016, 142, 04016055. [Google Scholar] [CrossRef] [Green Version]
  30. Edmunds, R.C. Air binding in pipes. J. Am. Water Work. Assoc. 1979, 71, 272–277. [Google Scholar] [CrossRef]
  31. Richards, R.T. Air binding in water pipelines. J. Am. Water Work. Assoc. 1962, 54, 719–730. [Google Scholar] [CrossRef]
  32. Sorensen, D.K. Energy savings in water and wastewater transmission systems through the use of air valves. In Proceedings of the Pipelines 2017: Condition Assessment, Surveying, and Geomatics, Phoenix, AZ, USA, 6–9 August 2017. [Google Scholar]
  33. United Nations General Assembly. Transforming Our World: The 2030 Agenda for Sustainable Development (A/RES/70/1); United Nations: New York, NY, USA, 2015; Available online: https://undocs.org/A/RES/70/1 (accessed on 5 December 2022).
  34. Barnea, D.; Shoham, O.; Taitel, Y. Flow pattern transition for gas–liquid flow in horizontal and inclined pipes. Int. J. Multiph. Flow 1980, 6, 217–225. [Google Scholar] [CrossRef]
  35. Zheng, G.; Brill, J.P.; Taitel, Y. Slug flow behavior in a hilly terrain pipeline. Int. J. Multiph. Flow 1994, 20, 63–79. [Google Scholar] [CrossRef]
  36. Pozos, O.; Giesecke, J.; Marx, W.; Rodal, E.A.; Sanchez, A. Experimental investigation of air pockets in pumping pipeline systems. J. Hydraul. Res. 2010, 48, 269–273. [Google Scholar] [CrossRef]
  37. Kalinske, A.A.; Robertson, J.M. Closed conduit flow. Trans. Am. Soc. Civ. Eng. 1943, 108. [Google Scholar] [CrossRef]
  38. Malekpour, A.; Karney, B.; Nault, J. Physical understanding of sudden pressurization of pipe systems with entrapped air: Energy auditing approach. J. Hydraul. Eng. 2016, 142, 04015044. [Google Scholar] [CrossRef] [Green Version]
  39. Porto, R.M. Hidráulica Básica, 4th ed.; Escola de Engenharia de São Carlos, Universidade de São Paulo: São Carlos, Brazil, 2006. [Google Scholar]
  40. Ramezani, L.; Karney, B.; Malekpour, A. The challenge of air valves: A selective critical literature review. J. Water Resour. Plann. Manag. 2015, 141, 04015017. [Google Scholar] [CrossRef]
  41. Koelle, E. Adutoras—Acessórios; Sabesp: São Paulo, Brazil, 1981. [Google Scholar]
  42. Malekpour, A.; She, Y. Air pocket detection in water and wastewater conveyance pipelines using inverse transient analysis. In Proceedings of the Pipelines 2018: Condition Assessment, Construction, and Rehabilitation, Toronto, ON, Canada, 15–18 July 2018. [Google Scholar]
  43. Kalinske, A.A.; Bliss, P.H. Removal of air from pipelines by flowing water. Civ. Eng. 1943, 13. [Google Scholar]
  44. Kent, J.C. The Entrainment of Air by Water Flowing in Circular Conduits with Downgrade Slopes. Ph.D. Thesis, University of California, Berkeley, CA, USA, 1952. [Google Scholar]
  45. Falvey, H.T. Air–Water Flow in Hydraulic Structures—Engineering Monograph No. 41; Water and Power Resources Service: Denver, CO, USA, 1980. [Google Scholar]
  46. Liu, T.; Yang, J. Experimental studies of air pocket movement in a pressurized spillway conduit. J. Hydraul. Res. 2013, 51, 265–272. [Google Scholar] [CrossRef]
  47. Wisner, P.E.; Mohsen, F.N.; Kouwen, N. Removal of air from water lines by hydraulic means. J. Hydraul. Div. 1975, 101, 243–257. [Google Scholar] [CrossRef]
  48. Ramezani, L.; Daviau, J. The challenge of air valve selection in pumping systems. In Proceedings of the Pipelines 2021: Design, Online, 3–6 August 2021. [Google Scholar]
  49. McPherson, D.L. Air valve sizing and location: A prospective. In Proceedings of the Pipelines 2009: Infrastructure’s Hidden Assets, San Diego, CA, USA, 15–19 August 2009. [Google Scholar]
  50. Lescovich, J.E. Locating and sizing air-release valves. J. Am. Water Work. Assoc. 1972, 64, 457–461. [Google Scholar] [CrossRef]
Figure 1. Pipeline with air pocket at distinct high point and corresponding descending pipe segment ( Z 2 = 50 m): (a) upstream reservoir with Z 1 = 100 m; (b) upstream reservoir with Z 1 = 145 m.
Sustainability 15 03875 g001
Figure 2. Influence of an air pocket at the high point and corresponding descending pipe segment of a gravity pipeline on its discharge capacity—neglecting the water depth in the channel flow under the pocket.
Sustainability 15 03875 g002
Figure 3. Influence of an air pocket at the high point and corresponding descending pipe segment of a water-rising pipeline on its discharge capacity—neglecting the water depth in the channel flow under the pocket.
Sustainability 15 03875 g003
Figure 4. Influence of an air pocket at the high point and corresponding descending pipe segment of a water-rising pipeline on its discharge capacity—considering the water depth in the channel flow under the pocket.
Sustainability 15 03875 g004
Figure 5. Pipeline for which the variation of the pumping rotational speed results in a system’s functioning path that returns to its initial step.
Sustainability 15 03875 g005
Figure 6. Pipeline for which the variation of the pumping rotational speed results in a system’s functioning path with progressive air accumulation.
Sustainability 15 03875 g006
Figure 7. Aged pipeline for which the variation of the pumping rotational speed results in a system’s functioning path with progressive air accumulation.
Sustainability 15 03875 g007
Figure 8. Hydraulic grade lines (HGLs) for two similar pipelines: (a) unvented line running with a positive pressure level at the high point; (b) line potentially with air entrapment if an air valve is installed at its high point or under siphon flow if an air valve is absent.
Sustainability 15 03875 g008
Figure 9. Air-binding in pipelines: (a) water-rising line with entrapped air at its high points; (b) gravity line with air at its descending pipe segments.
Sustainability 15 03875 g009
Figure 10. Critical water velocity for the hydraulic removal of air considering different assumptions for β in the v c equation: (a) equation according to Koelle (1981) [41]; (b) equation according to Escarameia (2007) [24] with 0.30 n < 2.0 .
Sustainability 15 03875 g010
Figure 11. Critical water velocity for the hydraulic removal of air considering β > 0 : (a) equation according to Wisner et al. (1975) [47]; (b) equation according to Escarameia (2007) [24] with 0.30 n < 2.0 .
Sustainability 15 03875 g011
Figure 12. Gravity pipeline for which air valves are necessary to avoid air–binding: (a) pipeline without forward flow (no air valve protection); (b) pipeline without forward flow (one air valve); (c) pipeline without forward flow (two air valves); (d) pipeline with forward flow (three air valves).
Sustainability 15 03875 g012
Table 1. Critical velocity v c in m/s for the hydraulic removal of air considering the v c equation by Escarameia (2007) [24] with 0.30 n < 2.0 .
Pipe
Diameter
(mm)
Inclination of Descending
Pipe Segment
0 2 4 6 8 10 12 14 16 18 20
1000.70.80.80.90.90.90.91.01.01.01.0
1500.81.01.01.11.11.11.21.21.21.21.3
2000.91.11.21.21.31.31.31.41.41.41.4
2501.11.21.31.41.41.51.51.51.61.61.6
3001.21.31.41.51.51.61.61.71.71.71.8
4001.31.61.71.71.81.81.91.92.02.02.0
5001.51.71.81.92.02.12.12.22.22.22.3
6001.61.92.02.12.22.32.32.42.42.52.5
7001.82.12.22.32.42.42.52.62.62.72.7
8001.92.22.32.42.52.62.72.72.82.82.9
9002.02.32.52.62.72.82.82.93.03.03.1
10002.12.52.62.72.82.93.03.13.13.23.2
Disclaimer/Publisher’s Note: The statements, opinions and data contained in all publications are solely those of the individual author(s) and contributor(s) and not of MDPI and/or the editor(s). MDPI and/or the editor(s) disclaim responsibility for any injury to people or property resulting from any ideas, methods, instructions or products referred to in the content.

