Article

Forecasting of Electricity Consumption by Household Consumers Using Fuzzy Logic Based on the Development Plan of the Power System of the Republic of Tajikistan

by
Saidjon Shiralievich Tavarov
1,*,
Pavel Matrenin
2,
Murodbek Safaraliev
3,
Mihail Senyuk
3,
Svetlana Beryozkina
4,* and
Inga Zicmane
5
1
Institute of Engineering and Technology, South Ural State University, 76, Lenin Prospekt, Chelyabinsk 454080, Russia
2
Ural Power Engineering Institute, Ural Federal University, Yekaterinburg 620002, Russia
3
Department of Automated Electrical Systems, Ural Federal University, Yekaterinburg 620002, Russia
4
College of Engineering and Technology, American University of the Middle East, Kuwait
5
Faculty of Electrical and Environmental Engineering, Riga Technical University, LV-1048 Riga, Latvia
*
Authors to whom correspondence should be addressed.
Sustainability 2023, 15(4), 3725; https://doi.org/10.3390/su15043725
Submission received: 10 December 2022 / Revised: 12 February 2023 / Accepted: 12 February 2023 / Published: 17 February 2023
(This article belongs to the Special Issue Power System Challenges toward Renewable Energies’ Integration)

Abstract

:
Seasonal fluctuations in electricity consumption, and uneven loading of supply lines reduce not only the energy efficiency of networks, but also contribute to a decrease in the service life of elements of power supply systems. To solve the problem of forecasting power consumption, it is proposed to use the theory of fuzzy sets to assess the effective development of the energy system of the Republic of Tajikistan. According to the statistical data of power consumption for the previous period, a fuzzy logic model with membership functions is proposed, which makes it possible to evaluate consumer satisfaction using the criteria unsatisfactory, satisfactory, conditionally satisfactory, and satisfactory, as well as the efficiency of the consumption mode of compliance using the criteria high, medium, and low, allowing the evaluation of the efficiency plan for the development of the energy system of the Republic of Tajikistan. To obtain and set more accurate data on electricity consumption, calculations were made for the winter period of the year. Based on the proposed calculation model of fuzzy logic, a quantitative component of electricity consumption, the corresponding satisfaction of the consumer, and the efficiency of the regime for nine cities of the Republic of Tajikistan were proposed in the form of diagrams of seasonal electricity consumption. The obtained seasonal power consumption makes it possible to improve the accuracy of estimating power consumption, thereby equalizing the balance of consumption and generation.

1. Introduction

The degree of development of the economically effective part of the hydro potential of the Republic of Tajikistan today is less than 10% [1,2,3,4,5]. To meet the growing electricity needs of the CAR, the region’s hydro resources are more than enough. All this testifies to the huge potential of the hydro resources of the Republic of Tajikistan, sufficient both to meet the needs of the republic itself and to export electricity. Hydropower is the main source of electricity for Tajikistan. To better understand the essence of the issue and the whole situation, it is necessary to consider the energy system of the republic in more detail.
Table 1 shows the data of commissioned hydroelectric power plants, a thermal power plant, and power transmission lines with a voltage of 220–500 kV after 2000 [1].
In this regard, the proposal of ways and means to improve energy efficiency for the Republic of Tajikistan is an urgent task.
Under such conditions, there is a need for other approaches to assessing the existing uncertainty that are different from the probabilistic methods.
Table 2 shows the main economic indicators of the energy system of the Republic of Tajikistan for 2011–2018 [1,2,3]. As can be seen, in the period from 2011 to 2018, there is an upward trend in the production and consumption of electricity (by 112% and 104%, respectively), which is associated with an increase in production capacities and the commissioning of new largest facilities such as the following:
Considering that in recent years the main consumer of electricity in the Republic of Tajikistan is the population (this can also be seen in Table 2), Table 3 provides statistical data on monthly seasonal electricity consumption by the population living in nine large cities for 2022.
Scientific research on the problem of increasing the energy efficiency of electric power systems, in particular by predicting the power consumption, is currently being carried out in several areas [6,7,8,9,10,11]:
  • Machine learning approaches have a variety of applications for predicting electricity consumption using smart meter data. Various methods analyze smart meter data to accurately predict utility consumption and peak load [12,13,14,15]. Forecasting the consumption of electricity by electrical consumers and peak load plays a vital and key role in the planning, maintenance, and development of automation for the electrical network and the electrical power system as a whole. However, these scientific studies do not consider the need to control and manage the modes of operation in urban electrical networks due to the use of single-phase electrical receivers in everyday life. In this regard, a detailed study of the indicators of smart meters is required to identify differences between the consumption of electrical consumers and the peak load of residential consumers.
  • Approaches to the use of renewable energy sources for energy saving and efficiency improvement are the needs of the global society [16,17,18]. It is estimated that global energy demand could triple by 2050, by which time 70% of the world’s population will live in cities. However, the use of these approaches does not completely solve the problem, since they do not cover such a factor as the nature of the load, which creates a problem affecting the operation mode of the converter equipment.
  • Management of household power consumption and monitoring of an intelligent network use artificial intelligence methods [19,20,21,22,23]. Recently, several new problems have arisen in the operation of urban power supply systems. First, the high penetration of renewable resources into microgrid distribution systems adds uncertainty and complexity to the systems. The variability of renewable resources can disrupt microgrid resilience and cause system instability. The second problem is related to the increase in the volume of trade in electricity in the restructured electricity supply system. Thus, the systems approach the boundaries of their operations. In this situation, the security of the power supply system can become a serious concern, as the occurrence of unforeseen situations in the system can lead to a shutdown of the system.
As result, one of the simplest and most effective methods, the application of which allows you to most accurately predict the power consumption of household consumers, is the theory of fuzzy sets.
The results obtained based on this method allow for a more accurate assessment and proposal of a plan for the development of the electric system of the Republic of Tajikistan. It should be noted that the effectiveness of this method today remains one of the most effective methods that is confirmed by numerous scientific publications in recent years [24,25,26,27,28,29,30,31]. It should also be noted that due to the simplicity of this method, it is often used in combination with artificial intelligence and machine learning methods [7,8,12,14].
The effectiveness of using fuzzy logic with the proposal of a model with the membership function will be described and discussed in detail in the Section 2 and Section 3.

2. Materials and Methods

Traditionally, the strategic tasks of forming plans (long-term, medium-term, operational) for the development of the energy system of the region as well as the tactical tasks of correcting the energy regime in their decisions are based on data arrays of statistical accounting of energy consumption, covering certain periods of days, weeks, months, seasons, and years [31,32]. Data processing is carried out by methods of statistical analysis, and elements of probability theory are applied. However, in the implementation of plans, the main, albeit limited, source of information about the risk is subjective expert assessments [33,34]. Therefore, the expert operator of generation and network is guided by action protocols that contain instructions using natural language, and qualitative rather than quantitative assessments: “in case of a significant excess of the value”, “in a situation where the values approach critical”, “if the risk of a shutdown is quite large”, etc. In such cases, it is difficult for the operator to decide, and the decision largely depends on his qualifications and intuition. The effectiveness of the decision and the risk of an incorrect decision is of the nature of a random variable, which, in addition to technical risks, also carries economic risks [15,16,17,18,19].
This approach is a possibilistic approach that emerged within the framework of fuzzy set theory [7,8,9,10,11], and it assesses the situation less accurately; however, in cases of information deficiency, it works more stably. The probabilistic approach allows processing expert assessments given in the form of natural statements using qualitative criteria, formalizing them, and giving the criteria a flexible but quantitative form. At the same time, the application of this approach expands the set of possible solutions for the expert operator, allows softer, more variable predictions and comparisons of quantitative criteria of objects, and solves optimization problems.
In the examined power system, such qualitative indicators were compliance with the company’s strategic goals, customer satisfaction, and environmental friendliness.
In the last ten years, the picture of electricity consumption by household consumers in the cities of the Republic of Tajikistan has changed significantly. At the same time, in cities, electricity consumption by household consumers changes not only upwards, but also downwards. The optimal power consumption by the considered consumers does not become the main reason for the decrease in the efficiency of urban electrical networks.
The identification of factors affecting uneven power consumption by household consumers remains the main problem at the moment, the solution of which allows solving several problems such as [9,10,11,12,13,14] the following:
  • Improve energy efficiency;
  • To increase the reliability of the elements of the electrical distribution network;
  • Reduce power loss;
  • Equalize the load between the phases;
  • Increase the service life of electrical equipment of urban electrical networks.
These qualitative indicators are expressed as a score given by one or more experts.
To solve this problem, the following steps are needed:
  • The first step is to determine the relative weight for each indicator. Finding weights for indicators was carried out by the method of constructing an analytical hierarchical process, proposed by T.L. Saaty [22]. At this stage, the priorities of these indicators relative to each other were determined, which ultimately influenced the content and type of management decision. The highest priority indicator was the indicator of compliance with the value of energy consumption with the company’s concept. For a pair of indicators, experts have developed a number that shows how much the first indicator exceeds the second. It is believed that in an ideal situation equality is satisfied as follows:
α i j = α i / α i j ,
where α i and α j —factor weights i and j, respectively.
2.
In the second stage, each indicator of the project with a fuzzy number is evaluated. In works [4,5,6,7], the construction of T.L. Saaty has been ported to the case of fuzzy sets. The company’s concept is aimed at bringing the current energy mode closer to the center of gravity of the fuzzy number of energy consumption in each season.
This can be represented as a linguistic change—the effectiveness of the regime.
The values “satisfactory”, “conditionally satisfactory”, and “unsatisfactory” can be taken.
The value of E(Y)—the mathematical expectation of the possibilistic characteristic of electricity consumption in winter—is determined as follows:
E Y = a + 2 · b + 2 · c + d 6 .
According to Equation (2), the value of the mathematical expectation characterizing the power consumption in winter was determined.
This value can be positioned as the center of gravity, that is, the optimal average over the specified time interval, the deviation from which with the variance Var(Y) was found as follows:
V a r Y = ( d a 2 + 2 d a · c b + 3 c b ) 2 24 .
3.
In the third stage, the indicators are normalized. The purpose of normalization is to bring the quantitative value of the indicator to a fuzzy number lying on the interval from 0 to 1.
This inequality condition can be represented in the following equivalent form:
NA (B) ≡ min max (1 − µA(y), µB(y)) > γ.
The condition for the reliability of solutions of the operator NA (B) ≥ γ is equivalent to the following inequality [4]:
(1 − γa3 + γ·a4γ·b3 + (1 − γb4.
4.
In the fourth stage, it is necessary to integrate fuzzy estimates with given weights and obtain a generalized estimate.
If A = {a1, a2, a3, a4} is (A (0, 0.55, 0.9, 1)), the fuzzy value of the compliance degree of the power consumption indicator for a specific development scenario based on the company’s concept, the possible values of the indicator for all scenarios are limited from above by the number declared in the concept of the company—1.
The data on electricity consumption by the population were obtained from the unified information collection center of the central dispatch service of the open joint stock holding company “Barki Tojik” of the Republic of Tajikistan.

3. Results and Discussion

For the analysis, the previously obtained statistical data on electricity consumption in winter [11,12] for the cities of the Republic of Tajikistan will be used. The intervals of quantitative values of power consumption are described by using the membership function of the power consumption mode given in Table 4.
The set of values from (2100–2800) of electricity consumption in the region in winter will be fixed, denoting its set as X.
By specifying the membership function µy: X → [0,1], the set Y is formed. The value µy (X) is a number between 0 and 1, showing the degree of membership of the element X in the fuzzy set Y. The equality µy (X) = 1 means that X exactly belongs to the set Y; the equality µy (X) = 0 says that X definitely does not belong to the set Y. Moreover, the set Y is fuzzy and normalized, since there is an element X such that µy (X) = 1.
Because the set X = R is a set of fuzzy real numbers, for the sake of convenience of practical calculations, it is represented as an asymmetric trapezoid with a membership function given by an equation that includes four numbers—the boundaries of frequency intervals (a, b, c, d), where a = 2100 kWh; b = 2458 kWh; c = 2463 kWh; d = 2850 kWh. It is necessary to determine the most probable value of power consumption, where its deviation will serve as a signal for the expert operator to pay attention. This can be the arithmetic average of 2463 kWh of electricity consumption, obtained as a result of abstract calculations.
However, if electricity consumption is considered as a fuzzy number, then (2100; 2458; 2463; 2850) kWh with this number will be associated.
According to Equation (2), the value of the mathematical expectation characterizing the power consumption in winter was determined, which amounted to E(Y) = 2465 kWh.
Substituting the values in Equation (3), we obtained the following:
V a r Y = 562 , 500 + 7500 + 75 24 = 23 , 753.125 = 154
The obtained value provides the basis for making decisions that correct the current energy mode using the concept of the energy generating and supplying the electricity company. That is, the power consumption values are 2158 kWh and 2758 kWh, and are the boundaries of the blue interval. The fuzzy number of power consumption takes the form of a symmetrical trapezoid. Figure 1 shows the membership functions of the power consumption mode. The implementation of the fuzzy logic model including the creation of membership functions, fuzzy rules, application Mamdani fuzzy inference algorithm, and visualization was performed using the open-source Python library SciKit-Fuzzy (github.com/scikit-fuzzy/scikit-fuzzy, accessed on 5 November 2022).
Going beyond the boundaries requires adjusting the regime.
Using similar reasoning, treatment can be applied to other seasons of the year. The results of calculating the center of gravity and blur interval for the winter season are given in Table 5.
The probabilistic approach also provides a means for evaluating fuzzy constraint conditions. Within the framework of the feasibility approach of fuzzy sets, the constraints that are used in solving the problems of forming a plan for the development of a power system will be analyzed. To do this, a comparison of the amount of electricity consumption A with the available energy capacities within the limitation condition B will be needed.
Let A (2100, 2158, 2758, 2850) kWh be the fuzzy number of energy consumption during winter in nine cities of the Republic of Tajikistan, where a1 = 2100 kWh; a2 = 2158 kWh; a3 = 2758 kWh; a4 = 2850 kWh. B (0.0, b3, 3000), the trapezoidal fuzzy number B (b1, b2, b3, b4), is the restriction condition representing an integral indicator of energy consumption limitation, depending on many technical (generator power, network bandwidth, operational situation in the overall system) and economic factors. Additionally, b3 is a fuzzy number, the most probable value of energy consumption, recorded in the documents of the generating company by the expert strategist and the supplier as the basis for the decisions of the expert operator. Additionally, a = 3000 is the maximum possibility of the value of energy generation and supply, an integral indicator determined by technical and economic characteristics.
Fixing a certain level of reliability of the operator’s decisions on the need for correction by the expert operator of the current energy regime and the expert strategy of the system development plan γ, 0 < γ < 1, it will be assumed that the number A satisfies the constraint B with reliability level γ = 0.9, if the ratio Pos (A ∈ B) < 1 − γ. The degree of correspondence of the number A to condition B will be called the number NA (B). Substituting data on energy consumption into inequality Equation (5) during winter in a region with a reliability level of 0.9, the problem is solved by the following:
(1 − 0.9)·2758 + 0.9·2850·a4 ≤ 0.9·b3 + (1 − 0.9)·3000,
where b3 ≥ 2823.1.
The obtained value makes it possible to make a decision on correcting the current power mode when the energy consumption value reaches 2823.1 kWh and not 3000 kWh, which increases the accident rate of the system.
Thus, the expert operator becomes more flexible characteristics of the values that limit power consumption, allowing them to make operational management decisions that are adequate to the thinking of a human expert.
The appearance of fuzzy sets made it possible to make the procedure for the transition from a point scale for assessing the quality of regional system development plans to a numerical one that is more flexible. The basic characteristic in the construction of plans for the development of the region is electricity consumption (seasonal and annual). Data are recorded continuously, subjected to statistical processing, and its values are predicted. Already in the established methodology for predicting power consumption, it is a function of several variables [13,14] such as the following:
Known variables include the following:
Meteorological;
Accounting for the design of residential buildings;
Non-uniformity of the load when it is distributed over the phases of three-phase lines and inputs.
The unknowns include considerations of the following:
The height difference above sea level;
A different number of consumers of electrical consumers—the well-being of the population.
However, in constructing plans for the development of a regional system, which is an element of a larger system, power consumption itself can be considered as an independent quantity that determines the quality function of the development plan for the regional energy system. When developing, adjusting, and evaluating the plan for the development of the energy system, not only quantitative indicators of electricity consumption, economic profitability, etc. are considered, but also qualitative ones.
To find it, along with numerical indicators, qualitative indicators are used. To analyze the qualitative indicators of the development plan, experts developed a three-point integrative scale for assessing social (customer satisfaction and compliance with the company’s strategic goals), technical, and economic criteria for power consumption (capacity, consistency with the operation of systems in other regions, economic attractiveness): “satisfactory”, “conditionally satisfactory”, and “unsatisfactory”.
If in the company’s concept 1 corresponds to 3000 kWh, then after normalization the project indicator will be equal to N1 (0.7, 0.72, 0.92, 0.95).
A fuzzy number of values for the indicator customer satisfaction is in percent X = (0; 0.55; 0.7; 1), while the possible value of the indicator for all plans is limited from the above to 100%. After normalization, the project indicator N1 = X.
Integrating fuzzy estimates with given weights, a generalized estimate will be obtained as follows:
A = (0.6 × 0 + 0.3 × 0 + 0.1 × 1 + 0.6 × 0.55 + 0.3 × 0.55 + 0.1 × 1 × 0.6 × 0.9 + 0.3 × 0.7 + 0.1 × 0.25; 0.6 × 1 + 0.3 × 0.9 + 0.1 × 0).
The overall qualitative assessment of the plan A = (0.1; 0.6; 0.78; 0.87).
Table 6 and Table 7 show the input indicators of the correspondence of linguistic changes “Consumer satisfaction”, “Efficiency of the consumption mode” and “Degree of compliance with the company’s concept”.
The graphical membership functions of customer satisfaction are represented in the form of Figure 2.
In graphical form, the membership functions of the efficiency of the power supply plan are represented in the form of Figure 3.
Figure 2 and Figure 3 represent the following emergences:
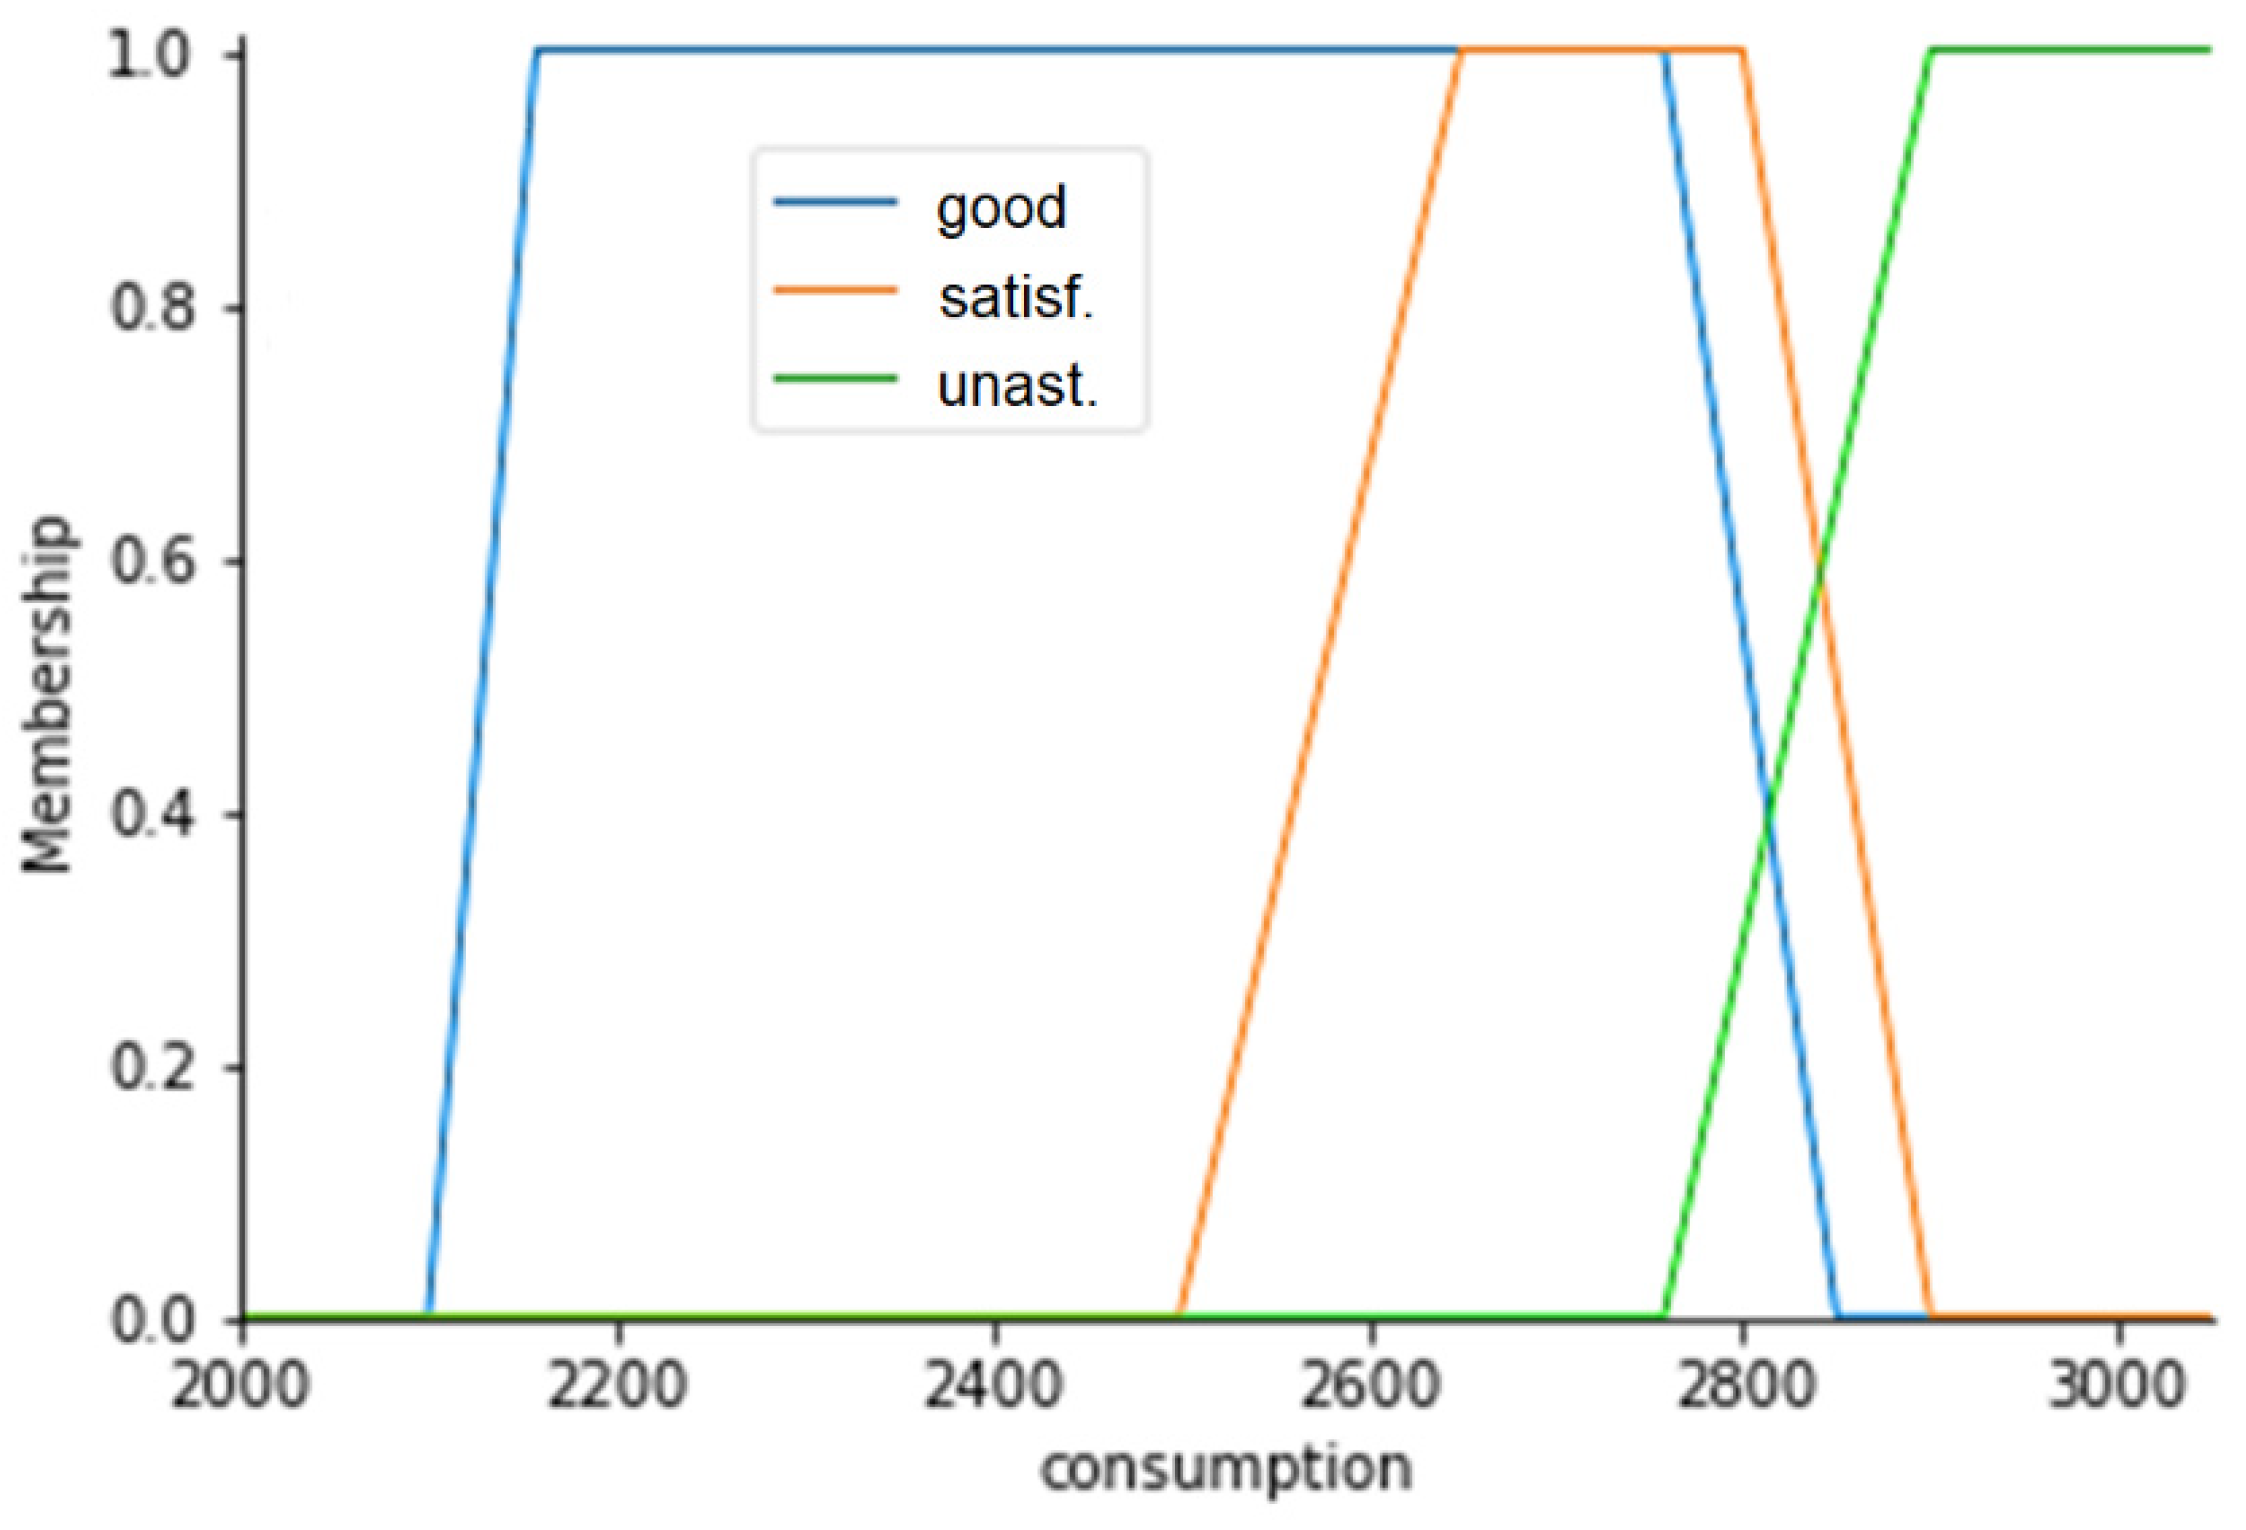
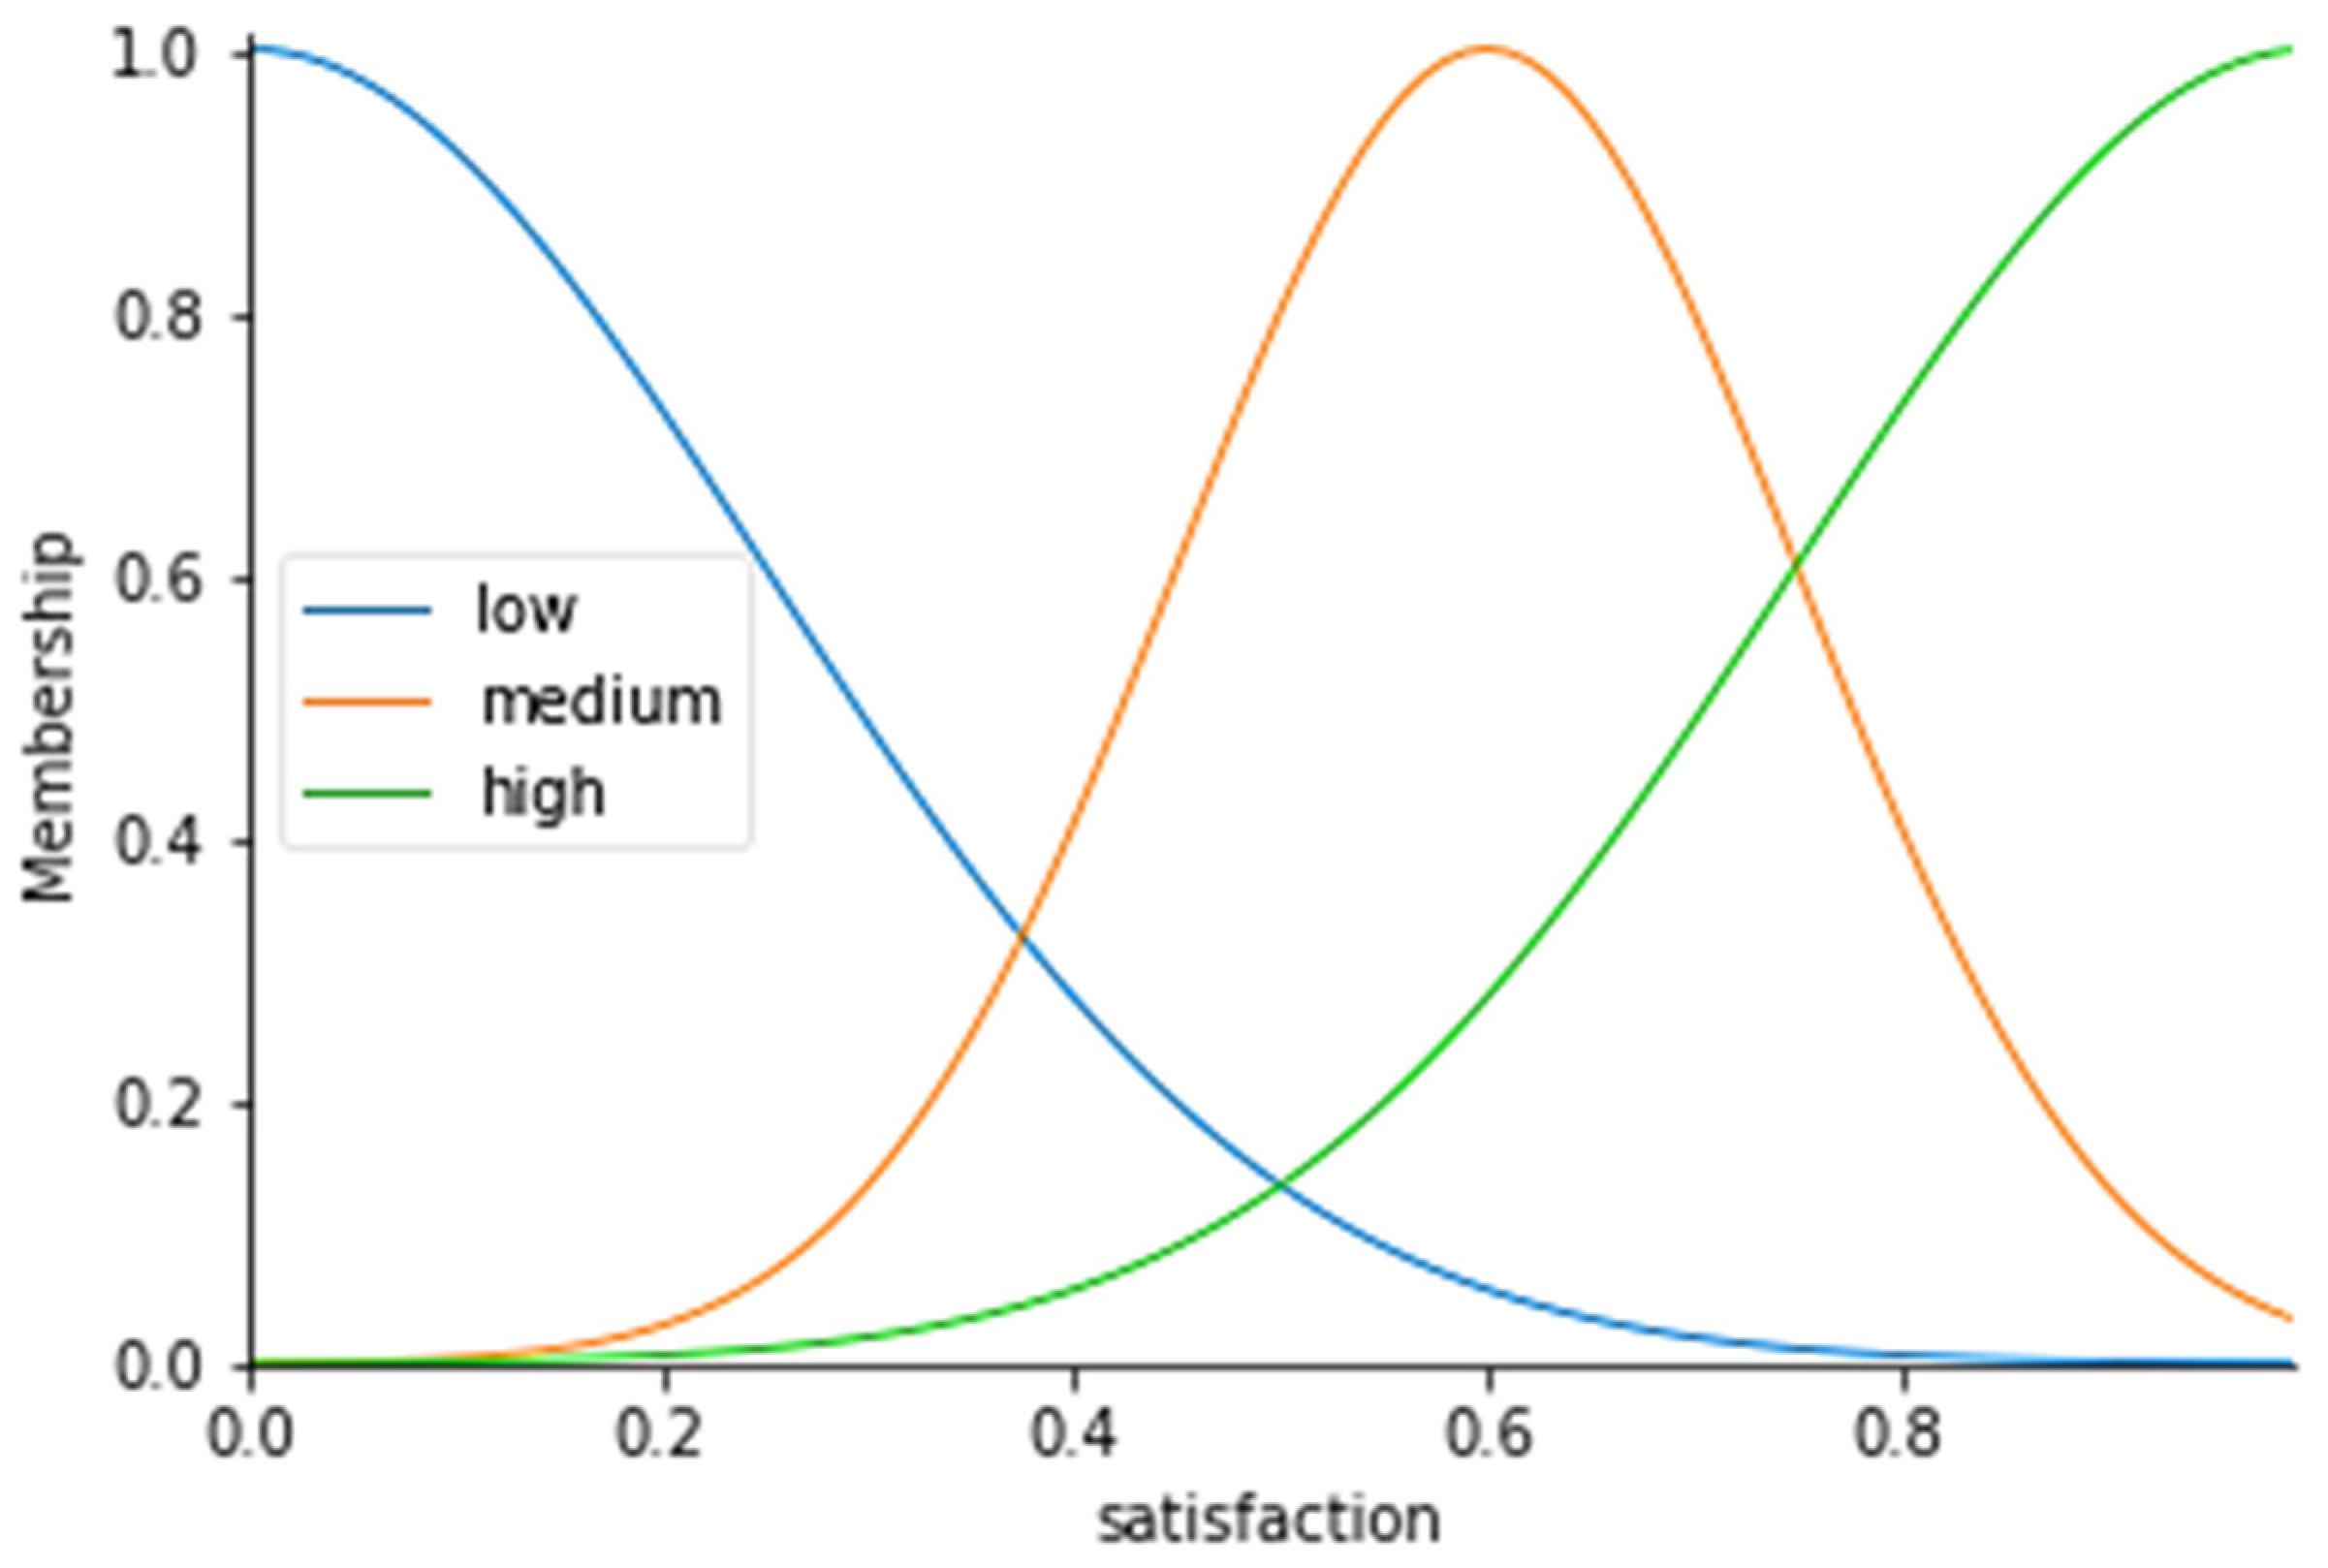
To achieve the effectiveness of the development plan for the electric system of the Republic of Tajikistan, customer satisfaction and the efficiency of the consumption regime must be fulfilled.
In turn, consumer satisfaction is assessed following the criteria unsatisfactory, satisfactory, conditionally satisfactory, and satisfactory, and the efficiency of the consumption mode of compliance with the criteria high, medium, and low, which allow us to evaluate the effectiveness of the development plan for the energy system of the Republic of Tajikistan.
Therefore, evaluating the effectiveness of the development plan for the energy system of the Republic of Tajikistan is proposed through the introduction of rules for consumer satisfaction from the consumption mode provided in Table 8.
Table 6 follows the following rules:
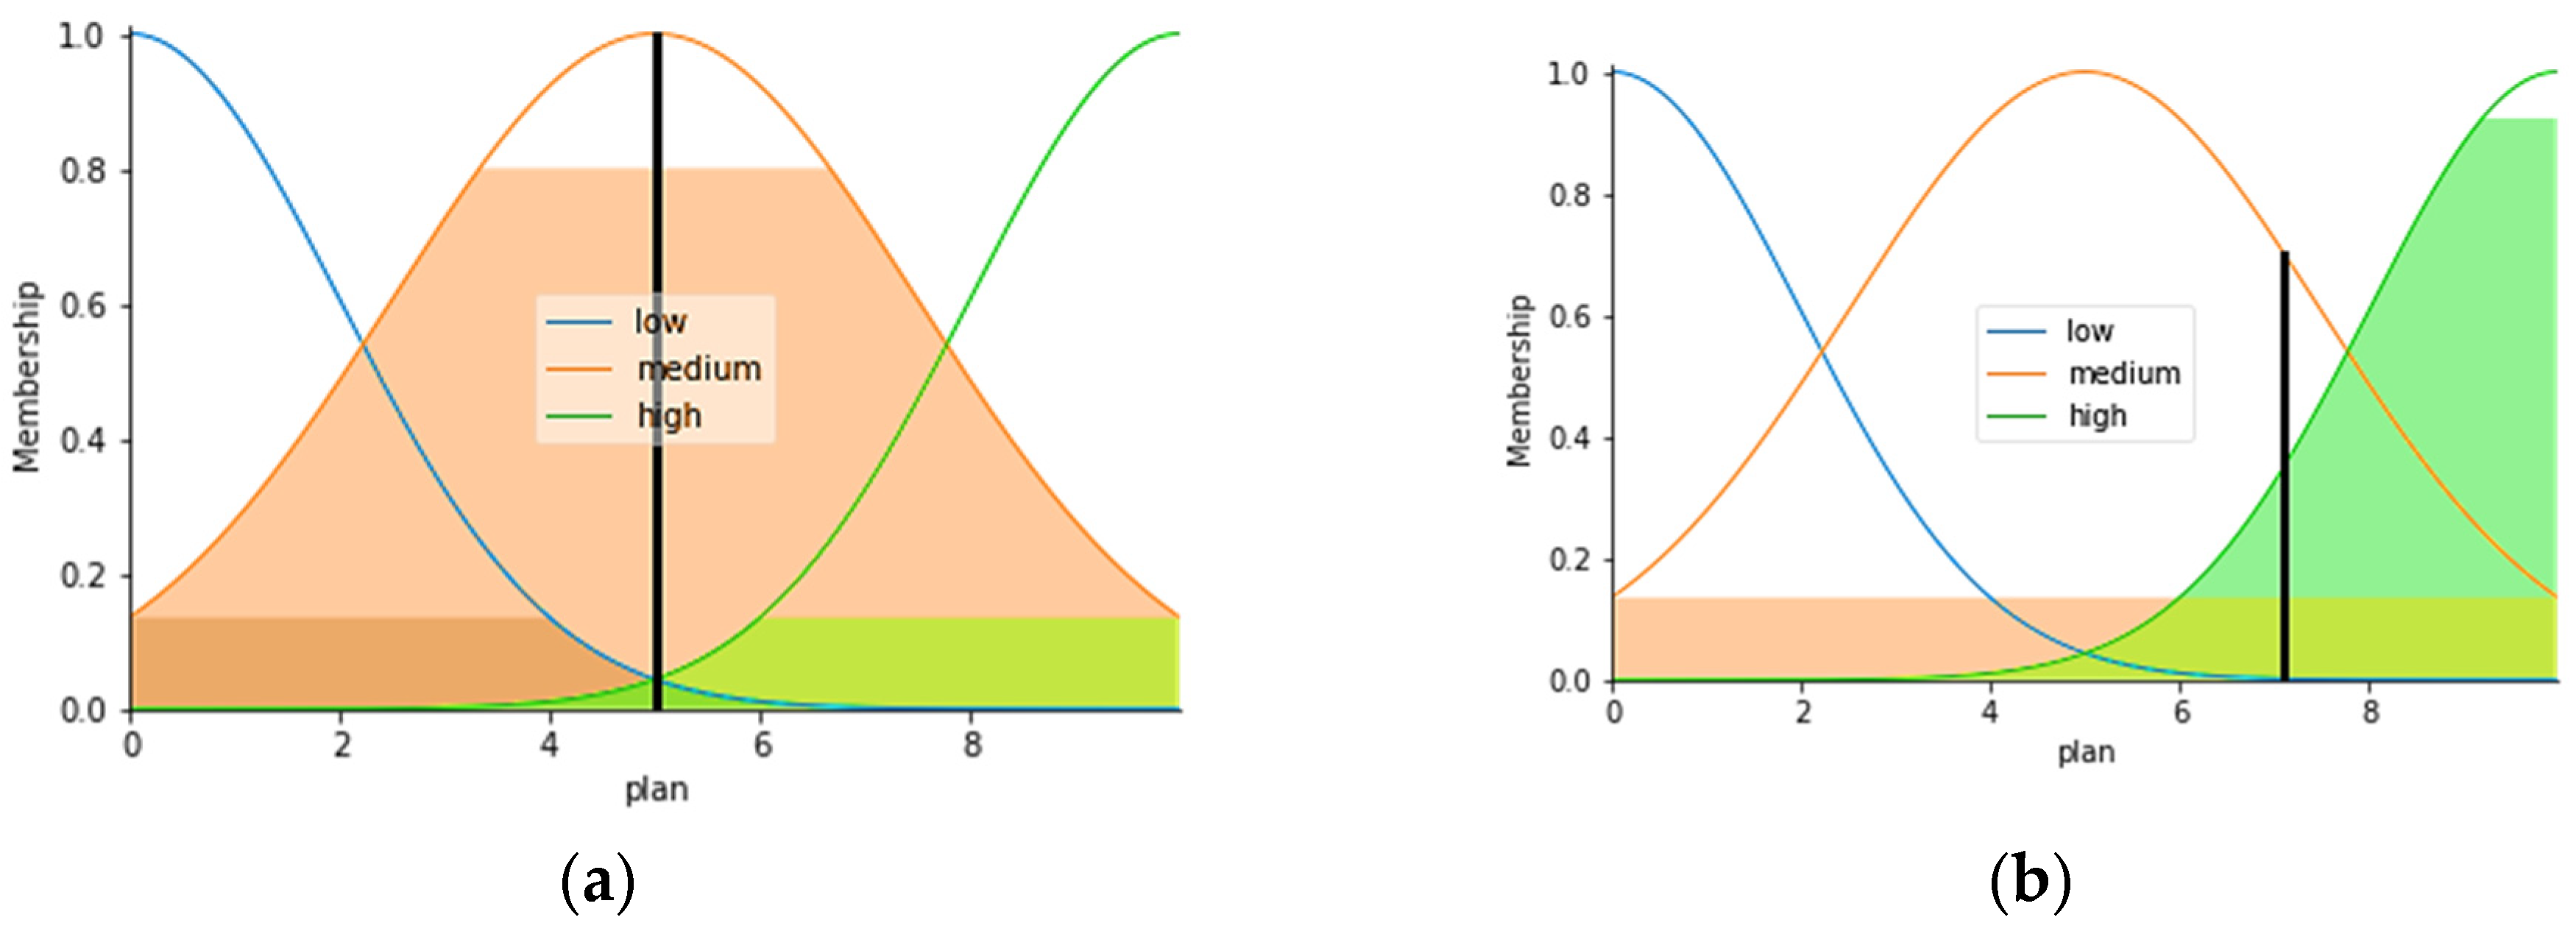
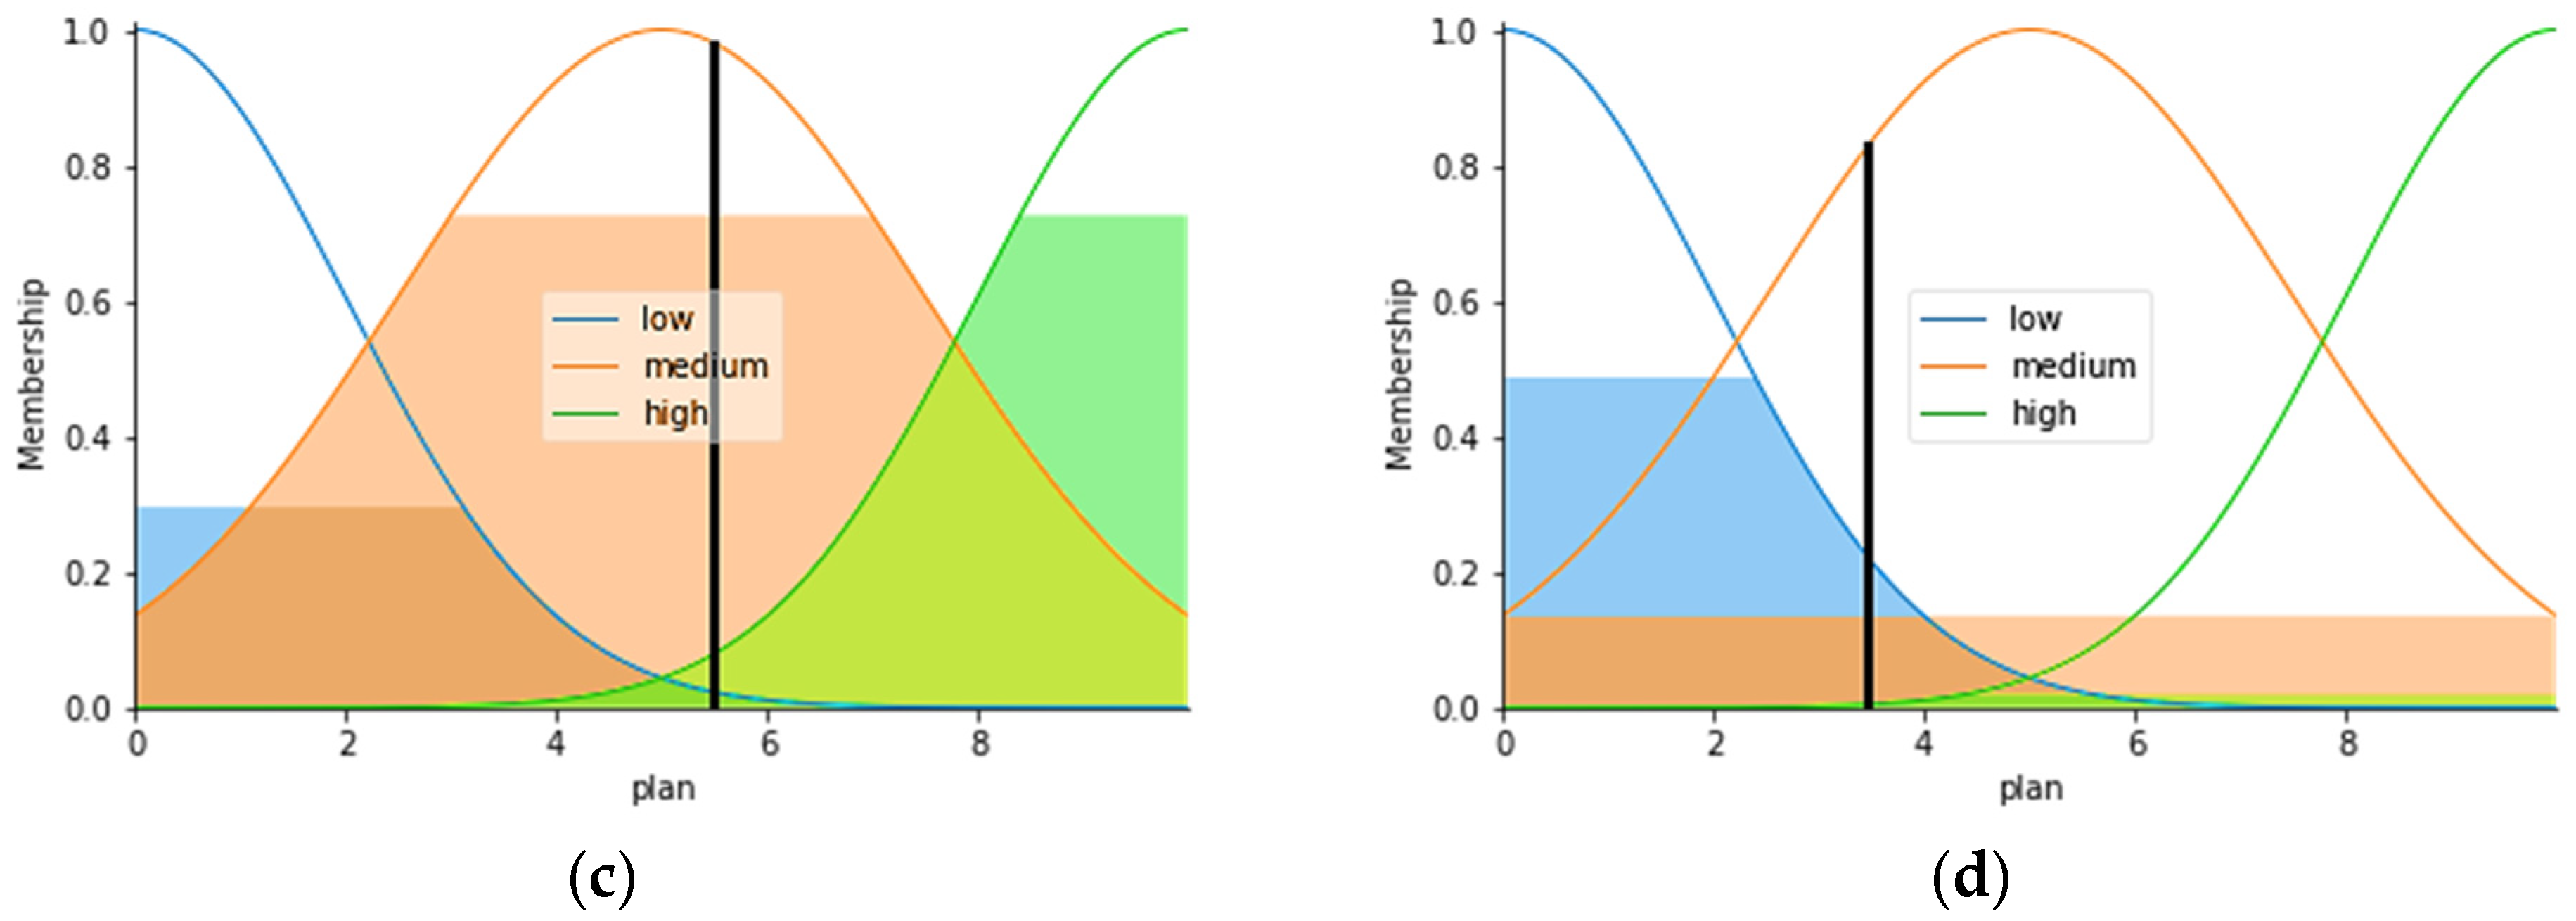
If customer satisfaction is satisfactory (high) and the power consumption mode is satisfactory (good), then the Efficiency of the electric system development plan of the Republic of Tajikistan is effective (high). It is not required to change the mode parameters;
If customer satisfaction is conditionally satisfactory (medium) and the power consumption mode is satisfactory (good), then the Efficiency of the development plan of the electric system of the Republic of Tajikistan is conditionally effective (medium). A change of mode parameters is required. Increase in electricity generation by 10%. In hydraulic power plants, it is achieved by increasing the flow of water;
If customer satisfaction is satisfactory (high) and the power consumption mode is conditionally satisfactory (satisf.), then the Efficiency of the development plan of the electric system of the Republic of Tajikistan is conditionally effective (medium). A change of mode parameters is required.
If customer satisfaction is unsatisfactory (low) or the power consumption mode is unsatisfactory (unsat.), then the Efficiency of the electric system development Plan of the Republic of Tajikistan is not effective. Requires urgent intervention of the dispatching service.
By solving this issue, it is possible to either transfer generators from the cold reserve to the hot one, or in the absence of such an opportunity, disconnect part of the consumers of the 3rd category. Then, you need to establish the reason for this.
The numerical values obtained by the seasonal indicator of one year are integrated into one numerical indicator 3-2-1, which is put in line with the linguistic variable—the effectiveness of the regime, which can take the values “satisfactory”, “conditionally satisfactory”, “unsatisfactory”, “satisfactory”, “satisfactory”, “satisfactory”.
It can be argued that if the consumption regime is efficient and consumer satisfaction is average, then the plan for the development plan of the electric system of the Republic of Tajikistan is effective.
Using the following rules, the calculation results of using the fuzzy model are presented in Figure 4.
Figure 5 shows the 3D surface of the resulting model, where x is the power consumption mode, kWh, y is consumer satisfaction, and z is the plan’s efficiency rating. The open-source Python Plotly library (plotly.com) was used for creating this interactive 3D surface.
The resulting model of non-leak logic allows us to evaluate the quality of the regional energy system development plan, quantitative and qualitative indicators, and make timely, and even preemptive management decisions to adjust the strategy and tactics of managing the region’s energy system.
Using the proposed fuzzy model, seasonal power consumption [32] schedules are proposed (for nine large cities of the Republic of Tajikistan), the use of which allows the achieving of the goal of increasing the efficiency of the electric power system [33,34,35], due to its correct assessment and forecasting accuracy (Figure 6).
Because the main electrical load and, therefore, the electricity consumption posed by household consumers (population), falls during winter and summer seasons, for consumers whose main source of electricity is hydroelectric power plants, this factor is manifested during these seasons. Figure 7 shows a comparison of two types of data, expected and received, using a fuzzy logic model with a membership function.
As can be seen from Figure 6, the proposed seasonal consumption of electricity by households is in line with the assumed indicators of compliance with the company’s concept of energy consumption. The use of these values of power consumption will contribute to improving the energy efficiency and reliability of the power grid economy of the cities of the Republic of Tajikistan.

4. Conclusions

According to the statistical data of electricity consumption for the previous period, a linguistic variable is proposed that qualitatively describes the interval of quantitative values of electricity consumption during the winter period of large cities of the Republic of Tajikistan. Based on the theory of fuzzy sets, a model with membership functions is proposed that allows the proposal of a plan for the development of the energy system based on assessing consumer satisfaction using of the criteria unsatisfactory, satisfactory, conditionally satisfactory, and satisfactory, and the efficiency of the consumption mode of compliance with the criteria high, medium and low. This allows for assessing the effectiveness of the development plan for the energy system of the Republic of Tajikistan, based on which the seasonal power consumption is obtained leading to improving the accuracy of estimating power consumption, thereby equalizing the balance of consumption and output.
The error in the data obtained using the proposed model with membership functions when compared with the data of the readings of electricity meters installed at electricity consumers (population) does not exceed 5% [22]. Therefore, the high adequacy of the proposed model can be argued.

Author Contributions

All authors contributed extensively to the work presented in this paper. Conceptualization, S.S.T., I.Z., S.B., P.M., M.S. (Murodbek Safaraliev) and M.S. (Mihail Senyuk); methodology, S.S.T., I.Z., S.B., P.M., M.S. (Murodbek Safaraliev) and M.S. (Mihail Senyuk); software, S.S.T. and M.S. (Mihail Senyuk); validation, S.S.T., I.Z., S.B. and M.S. (Murodbek Safaraliev); formal analysis, S.S.T., I.Z., S.B., P.M., M.S. (Murodbek Safaraliev) and M.S. (Mihail Senyuk); investigation, S.S.T., I.Z. and P.M.; writing—original draft preparation, S.S.T., I.Z., S.B., P.M. and M.S. (Murodbek Safaraliev); writing—review and editing, I.Z., S.B. and M.S. (Murodbek Safaraliev); visualization, S.S.T., P.M. and M.S. (Mihail Senyuk); supervision, S.S.T.; project administration, P.M. All authors have read and agreed to the published version of the manuscript.

Funding

The contribution of P.V. Matrenin to the research funding from the Ministry of Science and Higher Education of the Russian Federation (Ural Federal University Program of Development within the Priority-2030 Program) is gratefully acknowledged.

Institutional Review Board Statement

Not applicable.

Informed Consent Statement

Not applicable.

Data Availability Statement

The data presented in this study are available on request from the corresponding author. The data are not publicly available, due to confidential reasons.

Conflicts of Interest

The authors declare no conflict of interest.

References

  1. Sultonov, S.; Safaraliev, M.; Kokin, S.; Dmitriev, S.; Zicmane, I.; Dzhuraev, S. Specifics of hydropower plant management in isolated power systems. Prz. Elektrotechniczny 2022, 4, 53–58. [Google Scholar] [CrossRef]
  2. Ghulomzoda, A.; Gulakhmadov, A.; Fishov, A.; Safaraliev, M.; Chen, X.; Rasulzoda, K.; Gulyamov, K.; Ahyoev, J. Recloser-based decentralized control of the grid with distributed generation in the Lahsh district of the Rasht grid in Tajikistan, central Asia. Energies 2020, 13, 3673. [Google Scholar] [CrossRef]
  3. Sharifov, B.N.; Safaraliev, M.K.; Manusov, V.Z.; Kokin, S.E.; Dmitriev, S.A.; Tavlintsev, A.S.; Gulyamov, K.H. Electromagnetic transients in the control system of output parameters of a solar power plant in Tajikistan Central Asia region. Int. J. Hydrogen Energy 2022, 47, 5757–5765. [Google Scholar] [CrossRef]
  4. Asanov, M.S.; Safaraliev, M.K.; Zhabudaev, T.Z.; Asanova, S.M.; Kokin, S.E.; Dmitriev, S.A.; Obozov, A.J.; Ghulomzoda, A.H. Algorithm for calculation and selection of micro hydropower plant taking into account hydrological parameters of small watercourses mountain rivers of Central Asia. Int. J. Hydrogen Energy 2021, 46, 37109–37119. [Google Scholar] [CrossRef]
  5. Safaraliev, M.K.; Odinaev, I.N.; Ahyoev, J.S.; Rasulzoda, K.N.; Otashbekov, R.A. Energy Potential Estimation of the Region’s Solar Radiation Using a Solar Tracker. Appl. Sol. Energy 2020, 56, 270–275. [Google Scholar] [CrossRef]
  6. Lei, L.; Wei, C.; Bing, W.; Chao, C.; Wei, L. A building energy consumption prediction model based on rough set theory and deep learning algorithms. Energy Build. 2021, 240, 110886. [Google Scholar] [CrossRef]
  7. Zhong, H.; Wang, J.; Jia, H.; Mu, Y.; Lv, S. Vector field-based support vector regression for building energy consumption prediction. Appl. Energy 2019, 242, 403–414. [Google Scholar] [CrossRef]
  8. Amasyali, K.; El-Gohary, N.M. A review of data-driven building energy consumption prediction studies. Renew. Sustain. Energy Rev. 2018, 81, 1192–1205. [Google Scholar] [CrossRef]
  9. Dmitriev, S.A.; Khalyasmaa, A.I. Power Equipment Technical State Assessment Principles. In Applied Mechanics and Materials; Leeprechanon, B.N., Ed.; Trans Tech Publications Ltd.: Zurich, Switzerland, 2014; Power and energy systems III; Issue 492, pp. 531–535. [Google Scholar] [CrossRef]
  10. Dmitriev, S.A.; Khalyasmaa, A.I.; Doroshenko, V.O.; Romanov, A.M. Fuzzy dynamic model of power equipment state assessment. In Proceedings of the 2016 IEEE North West Russia Section Young Researchers in Electrical and Electronic Engineering Conference, EIConRusNW, St. Petersburg, Russia, 2–3 February 2016; pp. 547–552. [Google Scholar] [CrossRef]
  11. Fan, C.; Xiao, F.; Zhao, Y. A short-term building cooling load prediction method using deep learning algorithms. Appl. Energy 2017, 195, 222–233. [Google Scholar] [CrossRef]
  12. Gao, Y.; Zhou, X.; Ren, J.; Zhao, Z.; Xue, F. Electricity Purchase Optimization Decision Based on Data Mining and Bayesian Game. Energies 2018, 11, 1063. [Google Scholar] [CrossRef] [Green Version]
  13. Jallal, M.A.; González-Vidal, A.; Skarmeta, A.F.; Chabaa, S.; Zeroual, A. A hybrid neuro-fuzzy inference system-based algorithm for time series forecasting applied to energy consumption prediction. Appl. Energy 2020, 268, 114977. [Google Scholar] [CrossRef]
  14. Wei, Y.; Xia, L.; Pan, S.; Wu, J.; Zhang, X.; Han, M.; Zhang, W.; Xie, J.; Li, Q. Prediction of occupancy level and energy consumption in office building using blind system identification and neural networks. Appl. Energy 2019, 240, 276–294. [Google Scholar] [CrossRef]
  15. Rahman, A.; Srikumar, V.; Smith, A.D. Predicting electricity consumption for commercial and residential buildings using deep recurrent neural networks. Appl. Energy 2018, 212, 372–385. [Google Scholar] [CrossRef]
  16. Hähnel, P.; Mareček, J.; Monteil, J.; O’Donncha, F. Using deep learning to extend the range of air pollution monitoring and forecasting. J. Comput. Phys. 2020, 408, 109278. [Google Scholar] [CrossRef] [Green Version]
  17. Zhou, Q.; Mo, H.; Deng, Y. A New Divergence Measure of Pythagorean Fuzzy Sets Based on Belief Function and Its Application in Medical Diagnosis. Mathematics 2020, 8, 142. [Google Scholar] [CrossRef] [Green Version]
  18. Tian, C.; Li, C.; Zhang, G.; Lv, Y. Data driven parallel prediction of building energy consumption using generative adversarial nets. Energy Build. 2019, 186, 230–243. [Google Scholar] [CrossRef]
  19. Chou, J.S.; Tran, D.S. Forecasting energy consumption time series using machine learning techniques based on usage patterns of residential householders. Energy 2018, 165 Pt B, 709–726. [Google Scholar] [CrossRef]
  20. Tran, D.H.; Luong, D.L.; Chou, J.S. Nature-inspired metaheuristic ensemble model for forecasting energy consumption in residential buildings. Energy 2020, 191, 116552. [Google Scholar] [CrossRef]
  21. Chen, H.-Y.; Lee, C.-H. Electricity consumption prediction for buildings using multiple adaptive network-based fuzzy inference system models and gray relational analysis. Energy Rep. 2019, 5, 1509–1524. [Google Scholar] [CrossRef]
  22. Shiralievich, T.; Ivanovic, S.; Mamanazarovna, S.; Olimovich, S.; Yunusov, P. Learning algorithm of artificial neural network factor forecasting power consumption of users. Bull. Electr. Eng. Inform. 2022, 11, 602–612. [Google Scholar] [CrossRef]
  23. Saaty, T.L. How to handle dependence with the analytic hierarchy process. Math. Model. 1987, 9, 369–376. [Google Scholar] [CrossRef] [Green Version]
  24. Taliento, M. Corporate Valuation: Looking Beyond the Forecast Period Through New Fuzzy Lenses. IEEE Trans. Eng. Manag. 2021, 68, 467–482. [Google Scholar] [CrossRef]
  25. Appadoo, S.S. Possibilistic Fuzzy Net Present Value Model and Application. Math. Probl. Eng. 2014, 11, 20–31. [Google Scholar] [CrossRef]
  26. Abdallah, S.B.; Kouatli, I. Fuzzy Volatility Effect on Major Projects Timing. In Proceedings of the IEEE International Conference on Fuzzy Systems (FUZZ-IEEE), Rio de Janeiro, Brazil, 8–13 July 2018; pp. 1–6. [Google Scholar]
  27. Talebi, A.; Hatami, A. Online fuzzy control of HVAC systems considering demand response and users’ comfort. Energy Sources Part B Econ. Plan. Policy 2020, 15, 403–422. [Google Scholar] [CrossRef]
  28. Kim, Y.; Lee, E.B. Optimal Investment Timing with Investment Propensity Using Fuzzy Real Options Valuation. Int. J. Fuzzy Syst. 2018, 20, 1888–1900. [Google Scholar] [CrossRef]
  29. Sidorov, A.I.; Tavarov, S.S. Method for forecasting electric consumption for household users in the conditions of the Republic of Tajikistan. Int. J. Sustain. Dev. Plan. 2020, 15, 569–574. [Google Scholar] [CrossRef]
  30. Tavarov, S.S.; Sidorov, A.I. Improving energy efficiency by household consumers in the Republic of Tajikistan based on the developed forecasting method. Int. J. Des. Nat. Ecodynamics 2020, 15, 829–834. [Google Scholar] [CrossRef]
  31. Kokin, S.; Dmitriev, S.; Khalyasmaa, A. Evaluation model for urban power supply systems. Adv. Mater. Res. 2012, 468, 1642–1648. [Google Scholar] [CrossRef]
  32. Khalyasmaa, A.I.; Dmitriev, S.A.; Glushkov, D.; Baltin, D.; Babushkina, N. Electrical equipment life cycle monitoring. Adv. Mater. Res. 2014, 1008, 536–539. [Google Scholar] [CrossRef]
  33. Dmitriev, S.A.; Kokin, S.E. Working out the policy of technical modernization of big cities’ power supply on the basis of network condition estimation model. In Proceedings of the 2010 9th Conference on Environment and Electrical Engineering, Prague, Czech Republic, 16–19 May 2010; pp. 226–229. [Google Scholar]
  34. Asanov, M.; Kokin, S.; Asanova, S.; Satarkulov, K.; Dmitriev, S.; Safaraliev, M. The use of Petri computing networks for optimization of the structure of distribution networks to minimize power losses. Energy Rep. 2020, 6, 1337–1343. [Google Scholar] [CrossRef]
  35. Eroshenko, S.A.; Poroshin, V.I.; Senyuk, M.D.; Chunarev, I.V. Expert models for electric load forecasting of power system. In Proceedings of the 2017 IEEE Conference of Russian Young Researchers in Electrical and Electronic Engineering (EIConRus), 2017, St. Petersburg and Moscow, Russia, 1–3 February 2017; pp. 1507–1513. [Google Scholar]
Figure 1. Membership functions of power consumption in the form of a trapezoid.
Sustainability 15 03725 g001
Figure 2. Membership functions of customer satisfaction (Gaussians).
Sustainability 15 03725 g002
Figure 3. The membership functions for the efficiency of the power supply plan (Gaussians).
Sustainability 15 03725 g003
Figure 4. Computation results of using the proposed fuzzy model: (a) consumption 2200 kWh, satisfaction 0.5, plan efficiency 5.0; (b) consumption 2400 kWh, satisfaction 0.9, plan efficiency 7.1; (c) consumption 2800 kWh, satisfaction 0.8, plan efficiency 5.5; (d) consumption 2800 kWh, satisfaction 0.3, plan efficiency 3.5.
Sustainability 15 03725 g004aSustainability 15 03725 g004b
Figure 5. The 3D surface of the obtained model.
Sustainability 15 03725 g005
Figure 6. Proposed seasonal electricity consumption for nine large cities of the Republic of Tajikistan.
Sustainability 15 03725 g006
Figure 7. Comparison of power consumption values (expected and proposed using a fuzzy logic model with an accessory function).
Sustainability 15 03725 g007
Table 1. Commissioned hydroelectric power plants, thermal power plants, and power transmission lines with a voltage of 220–500 kV.
Hydroelectric Power Plant
/Heat and Power Plant
Capacity, MW
Sangtuda-1670
Sangtuda-2220
Dushanbe-2
Power line, kV
South-North500
Kanibadam-Batkent220
Lolazor-Khatlon220
Tajikistan-Afghanistan220
Table 2. Main economic indicators of the electricity market in Tajikistan.
Years20112012201320142015201620172018Attitude
2018/2011
Electricity generation
(billion kWh)
16.216.917.116.417.117.218.119.71.2
Electricity consumption (billion kWh):16.116.316.215.215.815.916.815.50.96
Industry and construction6.56.35.54.14.34.24.23.80.59
Transport1.60.40.40.40.50.40.30.010.01
Agriculture3.73.84.14.024.34.64.92.20.59
Other3.53.74.04.24.54.34.92.60.74
Population3.02.72.93.03.04.03.95.51.83
Electricity export
(billion kWh)
0.290.781.061.361.401.431.422.910
Electricity import
(billion kWh)
0.170.110.120.520.630.100.110.52.9
Average electricity tariff (diram */kWh)15.218.820.821.624.125.228.933.32.2
Industry21.326.630.630.635.735.741.047.11.92
Population9.0011.011.012.612.614.716.919.41.87
Small hydropower development rate number of small hydropower plants2362552632752782832862861.21
* Diram is the currency of the Republic of Tajikistan.
Table 3. Statistical data on temperatures and electricity consumption for the examined cities.
ConsumersAverage Winter Electricity Consumption by the Population, kWhAverage Spring Electricity Consumption by the Population, kWhAverage Summer Electricity Consumption by the Population, kWhAverage Autumn Electricity Consumption by the Population, kWh
Dushanbe1888.26890.98783.921176.32
Garm2762.561746.47832.721607.50
Khorog2290.66760.23328.75619.79
Isfara2686.681253.92523.951615.14
Panjakent2714.741445.39689.041622.57
Istarafshan2885.451603.47689.041622.57
Khajent2732.95976.37309.521452.75
Kulyab2150.41928.14174.961077.66
Bokhtar2221.45837.04305.421267.03
Table 4. Linguistic variable “Efficiency of the mode of consumption”.
Intervals of Statistical Values of Energy Consumption, kWhTerms and Short Designations
2100–2800Satisfactory (good)
2800–2850Conditionally satisfactory (satisf.)
above 2850Unsatisfactory (unsat.)
Table 5. Center of gravity and blur interval for the winter season.
SeasonCenter of GravityDispersionLeft Blur SpacingRight Blur Interval
Winter24583002100–21582758–2850
Table 6. Input linguistic variable “Consumer satisfaction”.
Ranges before FuzzificationTerm
0.78–0.87Conditionally satisfactory (high)
0.6–0.78Satisfactory (medium)
0.1–0.6Unsatisfactory (low)
Table 7. The linguistic variable “Degree of compliance with the concept of the company”.
ValueTerm
3high
2medium
1low
Table 8. Linguistic variable “Efficiency of the development plan of the electric system of the Republic of Tajikistan”.
Power Consumption ModeCustomer SatisfactionPlan Effectiveness
(unsat.)- (low)
- (low) (low)
(good) (medium) (medium)
(satisf.) (high) (medium)
(good)(high) (high)
Disclaimer/Publisher’s Note: The statements, opinions and data contained in all publications are solely those of the individual author(s) and contributor(s) and not of MDPI and/or the editor(s). MDPI and/or the editor(s) disclaim responsibility for any injury to people or property resulting from any ideas, methods, instructions or products referred to in the content.

