Abstract
In the context of “carbon neutral”, distributed energy, including photovoltaic power generation and energy storage systems, is developing rapidly. Meanwhile, the new generation of information technology, such as “Cloud computing, Big data, the Internet of things, Mobile Internet, AI, Blockchain”, is driving the digital transformation of the energy industry. Under digital drive, how the agents in the photovoltaic–storage–use value chain collaborate and create value intelligently is a question worthy of deep consideration. Firstly, the value creation mechanism and collaborative process of the digital-driven photovoltaic–storage–use value chain are analyzed from a value intelligence creation perspective. Secondly, the tripartite evolutionary game model of photovoltaic power generator, energy storage provider and user is established. Finally, the influencing factors of digital- driven photovoltaic–storage–use value chain collaboration are explored through a numerical simulation, and management suggestions are put forward. The study finds the following: (1) The behavior choice of each agent in the value chain will affect the decision of other agents. In particular, the photovoltaic power generator has a great influence on the cooperative willingness of other agents. To promote value chain collaboration, the guiding role of the photovoltaic power generator should be fully realized. (2) Agents on the value chain can use a variety of digital technologies to improve enabling benefits, which is conducive to promoting value chain collaboration. (3) The driving costs and potential risks are obstacles for value chain collaboration. Cost reduction and risk prevention are effective ways to improve the willingness of collaboration. (4) Reasonable incentive compensation mechanisms and information asymmetry punishment measures are the keys to enhancing collective willingness. This research provides theoretical support for photovoltaic–storage–use value chain collaboration from a value intelligence creation perspective.
1. Introduction
The aspects of “carbon peaking” and “carbon neutrality” put forward new requirements for upgrading energy structures and low-carbon development in the energy industry. Photovoltaics, wind power, and other new energy sources are gradually replacing fossil energy. Among them, photovoltaic power generation has developed rapidly in China, and its installed capacity and electricity generation have steadily ranked first in the world in recent years [1]. However, photovoltaic output is volatile, so energy storage systems are introduced to provide a stable power supply to users. Thus, a value chain of photovoltaic power generation–energy storage–energy use is formed. At the same time, the new generation of information technology and advanced technology represented by cloud computing, big data, Internet of things, mobile Internet, artificial intelligence and blockchain [2] have become important information asset elements for accelerating intelligent and information-based upgrading of the value chain of the photovoltaic-energy storage industry. They can promote the collaboration of energy flow, information flow and value flow and realize value intelligence creation.
According to complex system theory [3], the photovoltaic–storage–use value chain is a complex network system composed of multi-agents, multi-nodes and multi-links, as well as a complex adaptive system formed by the interaction and coupling of energy flow, information flow and value flow [4]. According to the theory of synergy [5], in complex systems, there are nonlinear relationships in the internal composition in the system and in each subsystem. The dynamic competition, mutual coordination and cooperative cooperation among these lead to the spontaneous evolution of the system from disorder to order on the macro level. Then, the overall effect of the system is enhanced to achieve the “1 + 1 > 2“ synergy effect. Based on the new generation of digital technology, the cooperation, competition and coupling coordination among the value subjects in photovoltaic power generation, energy storage and energy use will cause the value of the whole chain to change. Research on the collaboration mechanism driven by the digital aspects of the photovoltaic–storage–use value chain can promote the overall effect of the value chain, which provides a reference basis for realizing value intelligence creation.
The system’s coordination process is dynamic and complex, and the cooperation among the agents is based on the condition of information asymmetry. Each agent of the photovoltaic–storage–use value chain cannot determine its coordination strategy immediately, but seeks a better strategy through learning, comparison and imitation in the dynamic game process. The related characteristics, constraints and incentives will also affect the equilibrium state of the photovoltaic–storage–use value chain collaboration. Based on the above analysis, evolutionary game theory [6,7] is introduced to explore the cooperative decision-making and evolution mechanism among the bounded rational agents in the photovoltaic–storage–use value chain.
This paper makes the following three contributions: (1) It provides innovation in research perspectives. This paper studies how to realize the value intelligence creation of the photovoltaic–storage–use value chain under the background of digital drive. (2) This paper establishes an evolutionary game model of digital-driven photovoltaic–storage–use value chain collaboration. The co-evolution and stable state of the value chain are considered under the condition of bounded rationality. Unlike previous studies, this model considers a situation where the photovoltaic power generator, energy storage provider and user make collaborative decisions. (3) Considering the driving role of digital technology, the correlation coefficients of enabling benefit, driving cost and potential risk are introduced into the model. The influencing factors such as incentive compensation and information asymmetry penalty are also considered. This paper uses numerical simulation to dynamically analyze the evolution process of the decision of value chain collaboration. It provides a more specific research framework for value intelligence creation.
The remainder of this paper is organized as follows. Section 2 reviews relevant research. Section 3 analyzes the value intelligence creation mechanism and collaborative process. Section 4 establishes an evolutionary game model of photovoltaic power generator, energy storage provider and energy user three-party cooperation, and discusses the evolution path and stability of the game system. Section 5 carries out numerical simulation and puts forward relevant management suggestions. Section 6 concludes the paper.
2. Literature Review
This paper mainly focuses on the photovoltaic–storage–use value chain under digital drive. This section reviews and summarizes the literature on photovoltaic–storage–use value chain collaboration, new information technology, and the application of evolutionary game modeling in the field of electric energy production and consumption.
2.1. Study of Photovoltaic–Storage–Use Value Chain Collaboration
The emergence and development of energy storage technology has brought new opportunities for photovoltaic consumption. Many scholars have carried out extensive research on combinations of photovoltaic generation and energy storage. They focused on solving the safe and efficient consumption of photovoltaic power generation side, and improving the economy, safety and stability of the energy use side. In addition, as an independent new energy storage subject, energy storage is gradually expanding as part of electricity market operation. It plays an important role in supporting energy optimization scheduling [8], electric vehicle development [9] and intelligent community operation [10]. The rapid development of photovoltaic–storage technology promotes the formation of relevant value chains and industrial clusters. Multiple stakeholders have vertical and horizontal competition and cooperation under multiple links of production and operation. There are many studies on the clean energy value chain involving photovoltaic and energy storage, and they focus on industrial development [11], value addition [12], node coupling [13], collaborative optimization [14], benefit allocation [15], risk assessment [16], etc.
Collaboration and mutual influence exist in multiple agents of the photovoltaic–storage–use value chain, which can effectively integrate resources, realize information sharing, improve the overall efficiency of the value chain [17] and promote clean energy transformation. The main factors affecting the competitiveness and collaboration are concentrated among the main players in the upper, middle and lower reaches of the value chain [18]. Liu et al. established the Clean Energy Value Co-creation System in China and studied how the components of the clean energy value chain achieve value co-creation through the collaborative mechanism [19]. Denes-Santos and Kindl Cunha put forward that incentives are needed to encourage the Brazilian domestic solar panel industry across the whole value chain and to encourage technological innovation and the formation of cooperation [20]. Li et al. studied the mechanisms of technology, policy, markets and other aspects to drive the collaborative development of the energy storage industry in China based on synergetic industrial theory [21]. Bekti et al. studied the factors that influence the willingness of Indonesian customers to use PV, and the results showed that the behavior of users to participate in PV value chain collaboration is most significantly influenced by price value [22].
2.2. Background of New Information Technology
The new generation of information technology promotes the development of the digital economy and can inject new vitality into the photovoltaic-energy storage industry. On the one hand, the application of new information technology has accelerated energy’s digital transformation. Different information technologies have different applications in the energy field. Cloud computing [23] and Internet of Things technology [24] are used to build systems to enhance the prediction ability and power control ability of the power generation side, energy storage side and energy use side [25]. Big data technology is mainly used to collect and process relevant information. The application of artificial intelligence technology is mainly through the combination of intelligent algorithms and models, which can be used to solve PV power prediction [26], load prediction, capacity allocation, optimal scheduling [27] and other problems in the value chain. For example, machine learning algorithms play an important role in the prediction performance and fault detection of PV systems [28]. To cope with conditions such as variation of wind speed and variable solar radiation, based on machine learning, a dynamic general type-2 fuzzy energy management system for online frequency regulation is suggested [29]. With regard to block chain technology, its characteristics are decentralized, safe and reliable, can be used to improve transaction efficiency, solve trust problems [30], and enhance the participation willingness of each agent.
On the other hand, digital information technologies can enable collaboration and innovation in the value chain. Digital technologies can facilitate information sharing along supply chains, making their collaborative processes smarter, more value-driven and more efficient [31]. Big data technology and data-driven analytics can effectively identify and analyze value chains [32] to promote the value increment of the industry. Blockchain technology is designed to provide other value propositions beyond decentralized storage, such as innovative crypto economy and investment models and radically new forms of decentralized participative governance models that could lead to the evolution of a new generation of digital platforms in the supply chain and multiple stakeholder interactions along the value chain [33]. Huang et al. proposed a new sort of smart supply chain management model based on the “Internet of Things + Blockchain” [34], which can realize information and data sharing, conducive to value chain appreciation and industrial upgrading. Saretta et al. developed a more open and collaborative digital-based approach to achieve photovoltaic value chain collaboration and benefit improvement [35].
It is observed that digital technology can empower domestic green development [36]. The wider application of new information technology to the photovoltaic–storage–use value chain could therefore create a path towards value intelligence creation.
2.3. Application of Evolutionary Game Method in the Field of Electric Energy Production and Consumption
The evolutionary game method is suitable for solving finite conflict problems and describing the behavior of stakeholders. It can effectively describe the dynamic influence process of the change of relevant parameters on the trading strategy of stakeholders [7]. It is widely used in energy transformation [37], new energy utilization, the electricity market, the distributed energy system, microgrids, smart grids and energy storage [38].
In terms of clean energy development, considering the conflicts of interest among the Chinese government, the energy industry and third-party clean energy regulatory auditors, the three-party evolutionary game model is used to discuss the evolutionary form of strategy choice of each stakeholder group, as reported by Wang et al. The research finds that the government’s regulatory effort to adapt to the development status of China’s energy industry is the decisive factor for the effectiveness of government policy implementation [39]. Combining evolutionary game and system dynamics methods, Zhu et al. studied how policy interventions under different quota targets affect the behavioral strategies of electricity-selling companies and clean energy power generation companies [40]. Fang et al. simulated the connections between electricity producers under both the perfectly competitive market and monopoly market using a networked evolutionary game, proposed a dynamic renewable energy portfolio standard policy and analyzed its impact on the diffusion of renewable energy in China [41]. Liu et al. used evolutionary game theory to explore the behavioral strategies of private sectors from the perspectives of green energy generators and sellers, considering multiple influencing factors during green energy production in a PPP project [42].
In terms of behavior selection and collaboration strategy among relevant stakeholders in the photovoltaic–storage–use value chain, a three-party evolution game model is established by Chen et al., in which incentive policies of distributed photovoltaic systems and the actual industry situation are used for numerical simulation. The influence of initial willingness, financial subsidy, penalty tax, operating efficiency, additional cost and investment cost on participant behavior was analyzed [43]. Based on a variety of initial conditions of different regions, Zhang et al. explored the evolutionary process of electricity market players considering energy storage technology, and adopted a three-party evolutionary game model to analyze the strategies of the power plant, the power grid and the government [44]. Sun et al. established a dynamic evolutionary model of different types of users choosing retailers based on the logit revision protocol, considering characteristics of different types of users and interruptible loads as well as users’ distributed renewable energy [45].
To sum up, it is found that in terms of research objects, most focus on a single node, especially the collaborative mechanism of photovoltaic industrial chain development [46]. There are few studies on the energy storage node and energy use node as the main agent participating in the value chain collaboration. In terms of research background, there is a lack of relevant research on the collaboration of the photovoltaic storage value chain driven by digital technology. In the aspect of research methods, the essence of the collaborative problem is to play a game and find equilibrium among the subjects. The actual photovoltaic storage market is in an asymmetric information environment. There is an incomplete information game among photovoltaic nodes, energy storage nodes and energy consumption nodes [47]. Therefore, this paper uses an evolutionary game method to study the collaboration of the digital-driven photovoltaic–storage–use value chain to promote value intelligence creation.
3. Value Intelligence Creation Mechanism and Collaborative Process of Digital-Driven Photovoltaic–Storage–Use Value Chain
Based on the theory of information resources [48] and the connotation of digital empowerment [49], it can be seen that, driven by digital technologies such as “cloud computing, big data, Internet of things, mobile Internet, artificial intelligence and blockchain”, information flow can produce an energization effect based on the energy flow and value flow.
This can effectively promote photovoltaic consumption and innovation in energy storage and benefit the emergence of energy use among the subjects of the “power genera-tor–storage–use” value chain. Digital technologies can help to achieve transformation and upgrading of “informatization, digitization and intelligence” of the value chain. The agents of the value chain become the energy information resources agents, which are relevant and influenced by each other, to realize value intelligence creation.
3.1. Value Intelligence Creation Mechanism
The value intelligence creation mechanism is studied from the aspects of the upstream photovoltaic power generation node, midstream energy storage node, downstream energy consumption node and collaboration of these three nodes. See Figure 1.
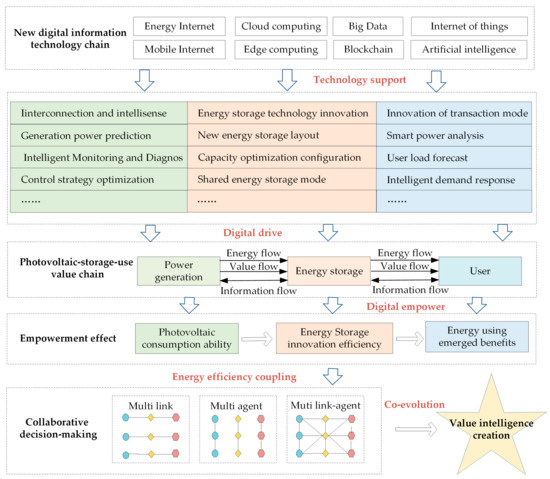
Figure 1.
Value intelligence creation mechanism of photovoltaic–storage–use value chain.
(1) At present, contradictions such as uneven consumption of photovoltaic power generation, incoordination between generation and power grid, and imperfect market mechanism still exist. The new generation of digital information technology, such as “cloud computing, big data, Internet of things, mobile Internet, artificial intelligence and blockchain”, are applied to data transmission, output prediction, system detection, power supply control and other aspects of photovoltaic power generation, which can realize the collaboratively rapid response of consumption and generation of photovoltaic power. Digital technology works on the power generation side, which increases the value of the power generation side of the value chain and forms value-added utility. The value contained in this utility generates new value when the value flows to the energy storage node, and then continuously acts on the middle and lower nodes of the value chain. Therefore, value intelligence creation can be realized in this process.
(2) The energy storage link is the intermediate node of the value chain. The photovoltaic abandonment generated by the upstream power generation link can be stored by the energy storage system and then supplied to users or power systems. The application of big data, blockchain, cloud computing and other technologies can achieve innovation in the energy storage management system and the optimization of capacity allocation, system scheduling, transaction mode, etc. This can promote energy storage applications that are safer, more efficient, more intelligent and more economic. Improvement of digital-driven energy storage innovation efficiency is manifested, as this digital information technology improves energy storage technology, reduces cost and increases efficiency. Application of information technology in energy storage realizes the value transmission from the power generation link to energy storage link, as well as the value extension from the energy storage link to energy use link. Through the collaboration of upstream and downstream nodes and the optimization of the layout of energy storage systems by digital-driven methods, the capacity of peak regulating in the energy system is improved, and the photovoltaic consumption is promoted.
(3) Under the demand of clean energy systems dominated by the demand side, energy trading is gradually liberalized. More energy users actively participate in the energy consumption link of the photovoltaic–storage–use value chain. By the application of digital information technology, energy users realize multi-dimensional benefits of energy using, such as economic benefits, social benefits and environmental benefits. Users can make more accurate load prediction and demand response and carry out more intelligent modes of power consumption and energy service. As the downstream node of the value chain, the energy-using side completes the terminal value added of the value intelligence creation process supported, by the new generation of information technology.
(4) With the application of new digital information technology, such as “cloud computing, big data, Internet of things, mobile Internet, artificial intelligence and blockchain”, the self-organizing characteristics of the value chain system and the adaptive characteristics of the main bodies promote the ecological niche change of the value chain system, so that the photovoltaic–storage–use value chain system evolves in the direction of intelligence and high efficiency. The application of new generation information technology stimulates the cooperative organization, cooperative operation and cooperative decision-making among all subjects in the node of “power generation –energy storage–energy use” and realizes the virtuous cycle of value intelligence creation. Digital technology can promote the control precision of the photovoltaic–storage–use value chain system and the timeliness of information sharing, realize the linkage of “upper and lower” and the interaction of “internal and external”, and maximize the energy consumption capacity, energy storage innovation efficiency and energy using benefit so that the value intelligence creation and the goals of “carbon neutral” are realized.
3.2. Collaborative Process
The collaborative process and mechanism of the value chain are embodied in the following stages: the first stage—resource input (information generation); the second stage—information sharing (energy efficiency improvement); the third stage—coupling collaboration (value intelligence creation). See Figure 2.
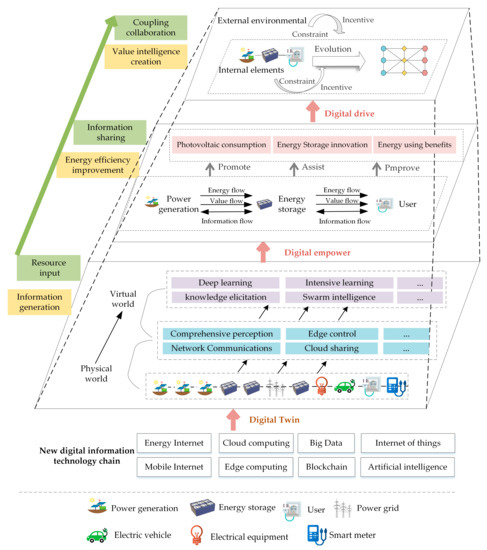
Figure 2.
Process of digital-driven photovoltaic–storage–use value chain collaboration.
(1) Resource input (Information generation). In the first stage, each agent actively builds a new generation of digital information technology chain and invests information resource elements, including information subjects, information technology and so on. New technologies such as big data, cloud computing, 5G networks and advanced sensing technologies support the abstraction of physical energy networks to logical networks in virtual networks, namely “Digital Twins”. As the initial stage of the collaborative process, each agent realizes the energy flow transmission and information network sharing based on the “Digital Twin”. The photovoltaic storage physical system is optimized by feedback through carrying out simulation, calculation, analysis and decisions of intelligent entities. Each agent has become a value intelligence creation agent of photovoltaic storage, with the functions of environment stereoscopic perception, knowledge deep learning, interactive evolution of behavior and so on. The collaborative intelligence creation effect of the photovoltaic–storage–use value chain thus initially emerges.
(2) Information sharing (energy efficiency improvement). In the second stage, each node in the photovoltaic–storage–use value chain collaborates, and multi-agents, multi-links and multi-levels are interconnected openly. Digital technologies are fully leveraged to drive data integration and information sharing. This realizes the two-way flow and interaction of energy flow and information flow in the whole life-cycle process of “photovoltaic power generation–energy storage–energy consumption” and each link of the value chain extension. The photovoltaic power generation side not only collects and transmits basic power generation data but also analyzes, integrates, identifies and extracts different types of data and information resources from other agents, such as electricity, heat, natural gas, transportation, energy storage and load. Energy storage flexible addition, agile response and innovation can coordinate some behavior activities of each agent on the value chain. This greatly improves the consumption capacity of photovoltaics, reduces carbon emissions, and realizes the emergence of multiple benefits on the energy-using side. The collaborative intelligence creation effect of the photovoltaic–storage–use value chain is further accumulated and value-added.
(3) Coupling collaboration (value intelligence creation). In this stage, the use of “cloud computing, big data, Internet of things, mobile Internet, artificial intelligence and blockchain” realizes resources coupling among material, information and technology. Under the influence of the internal system elements (individual characteristics, behavior patterns, organizational structure, development strategy, the types of decision making, etc.) and the external environmental conditions (technical progress, policy system, market competition and resource constraints, etc.), multiple intelligent agents on value chain will gradually adapt to the surrounding environment. They will optimize their own strategies according to their observed environment and the behaviors of other agents. Relying on the powerful learning function of digital technology, they adapt to the other main body behaviors. Combined with behavior advantages of adaptation, self-learning and self-organizing of all the agents, the optimal allocation and utilization of resources is achieved through coordinated decisions. In the third stage, each node of the photovoltaic–storage–use value chain uses information technology and means to constantly create new collaborative information resources and promote information sharing. With the internal and external coupling coordination, self-organization and self-adaptation, the intelligence creation effect of the photovoltaic–storage–use value chain keeps increasing. The system evolves into a stable, orderly and dynamic equilibrium state to maximize the intelligence creation effect of value.
4. The Evolutionary Game Model
4.1. Hypothesis
At present, there are development forms such as cooperation and alliance formation among the agents of the photovoltaic–storage–use value chain. Many agents on the interior of the value chain have contributed to digital construction foundation and collaboration mechanisms. There are basic conditions for digital technology to drive the intelligence creation. Compared with the traditional value chain collaborative mechanism, the main driving force of value intelligence creation is digital technology and information resources. Corresponding to the upper, middle and lower reaches of the value chain, it is assumed that there are photovoltaic power generators, energy storage providers and users to participate in the collaboration. All three parties are characterized by “bounded rationality”, which is the basis of evolutionary game analysis.
(1) Hypothesis of collaborative game strategy. Assume that the strategy is [digital-driven, non-digital-driven], and the proportion of the three parties choosing a “digital-driven” strategy for value chain collaboration is x, y, and z, respectively. Under the current asymmetric information condition, the choice of a “digital-driven” strategy represents the subject as actively using digital technology, driving data integration and information sharing on the value chain, improving the efficiency of information collaboration, fulfilling the contract with integrity, promoting the value chain collaboration, and realizing value intelligence creation. On the contrary, where the subject is unwilling to use digital technology to drive the value chain collaboration, and negatively participates, this is a “non-digital-driven” strategy. When the three parties do not use digital driving technology to make value chain collaborative decisions, the digital empowerment effect will not occur; this is the traditional value chain game mode. The initial income of the three parties is .
(2) Hypothesis of collaborative empowerment benefit. With the help of the coupling and collaboration of the new generation of information technology, the agents produce the agglomerative digital-driven effect, which can improve the consumption capacity of photovoltaic power generation, energy storage innovation efficiency and user emergence benefit. Here, represents the enabling benefit obtained by the three parties collaboratively making decisions. This paper assumes that is used to reflect the input of information resource elements (information subject, information and information technology) from each subject. When the subject chooses the “non-digital-driven” strategy, . Different agents have different data mining abilities, information processing levels, integration means and application degrees of digital driving technology. So, the intelligence creation effect obtained by digital-driven methods is different. represents the enabling benefit coefficient of each subject under digital driving. Each subject drives data integration, resource sharing, information circulation and dynamic coordination through digital technology. Therefore, the enabling benefit obtained by subject i is not only related to the information resource elements invested by itself but also related to the input of other subjects. Taking photovoltaic power generators as an example, photovoltaic power generation needs to carry out prediction, operation, maintenance and scheduling based on historical and real-time power big data, and use big data, cloud computing and other new technologies to promote photovoltaic consumption. Generally speaking, the application level and informatization level of digital technology of photovoltaic power generators will be relatively high. Their digitally driven enabling benefits and income coefficients will also be relatively high, which can be represented by .
(3) Hypothesis of collaborative drive cost. In the process of using new-generation information technology to drive value chain collaboration and enhance the intellectual creation effect, each subject needs to build digital systems, technology operation and maintenance, research investment, data conversion, information communication, etc. These increase the cost of information technology use, infrastructure and other hardware, system platforms and other software construction. The above costs are summarized as the driving costs of the collaborative decision making of all subjects. represents the driving cost coefficient of all subjects, and represents the driving cost of the value chain collaboration driven by all subjects using digital technology.
(4) Hypothesis of potential risk. Information asymmetry, fluctuation of trust level, opportunistic behaviorism, changes in external market and policy environment may lead to the loss of core data or knowledge advantages of the subject. There may also be potential risks, including technology, personnel, core information, negotiation red lines and so on. is used to represent the potential risk coefficient of each subject’s collaboration, and is used to represent the potential risk of each subject’s collaboration.
(5) Hypothesis of collaborative incentive mechanism. There will be corresponding incentive measures for the subjects who actively choose digital technology to drive value intelligence creation. In the context of continuous policy support and encouragement of clean energy power generation and the great development of the Internet, especially in the context of “carbon peaking and carbon neutrality goals” and the digital economy, collaborative decision making based on digital technology among photovoltaic power generators, energy storage providers and users is an effective way to respond to national policies and drive the development of energy Internet. Suppose is the incentive compensation coefficient. It shows the policy incentive benefits provided by the government and the value chain alliance when each subject adapts to new policy changes and makes collaborative decisions based on digital driving technology to carry out value intelligence creation, such as material rewards and reputation rewards.
(6) Hypothesis of collaborative punishment mechanism. The degree of integration of information resources will affect the effectiveness of decision making in the process of value chain collaboration. The punishment mechanism of information asymmetry is set up here in order to promote the degree of information symmetry among the three parties in the game. The penalty coefficient is denoted by . When the subject does not use the digital-driven technology but makes use of the information factor resources of other collaborative interests, it will be punished. For example, if the collaboration between subjects is further reduced, and the reputation of subjects is reduced, some funds will be affected. The greater the input information elements of other subjects, the greater the benefit of “free riding” obtained by the negative subject, so the corresponding punishment should be greater.
Abbreviations and basic parameters are shown in Table 1.

Table 1.
Abbreviations and parameters of the model.
The payoff matrix is shown in Table 2 below.

Table 2.
Payoff matrix of the three-way evolutionary game.
4.2. Tripartite Evolutionary Game Model
Based on the above game assumptions, the expected revenues of PV choosing “digital-driven” and “non-digital-driven” strategies in the game are calculated, which can be represented by and , respectively. The average revenue is , as follows.
Similarly, it can be obtained that the expected revenues of the ES choosing “digital-driven” and “non-digital-driven” strategies in the game are and respectively. The average revenue is , as follows.
In the game, US chooses the “digital-driven” and “non-digital-driven” strategies, the expected revenues are and , respectively, and the average payoff is , as follows:
The dynamic change rate of a game’s strategy is the core of bounded rational game analysis. The dynamic change rate of a game model can be reflected by differential equations. According to the replication dynamic formula, the replication dynamic equations of photovoltaic–storage–use can be obtained as follows:
4.2.1. Photovoltaic Power Generator Evolutionary Path
According to the stability theorem of the replicated dynamic differential equation and the properties of the evolutionary stability strategy, the derivative of is
If , at this time ; no matter what value x takes, the strategy selection of PV is in a stable state and will not change with time, as shown in Figure 3a.

Figure 3.
Evolutionary process of PV. (a) When ; (b) When ; (c) When .
If , and we let , we get two evolution stable points, which are x = 0 and x = 1. When x = 0, , and when x = 1, , so x = 1 is the evolution stable point, as shown in Figure 3b.
If , let , at this time, when x = 0, , and when x = 1, , so x = 0 is the evolution stable point, as shown in Figure 3c.
4.2.2. Energy Storage Provider Evolutionary Path
Similarly, taking the derivative of yields
If , at this time, ; no matter what value y takes, the strategy selection of ES is in a stable state and will not change with time, as shown in Figure 4a.
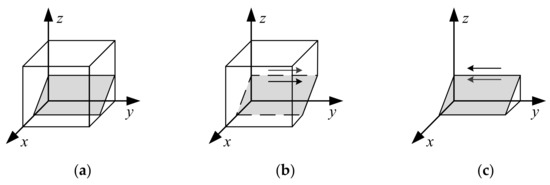
Figure 4.
Evolutionary process of ES. (a) When ; (b) When ; (c) When .
If , let ; there are two evolution stable points, which are y =0 and y =1. When y = 0, and when y = 1, , so y = 1 is the evolution stable point, as shown in Figure 4b.
If , let ; at this time, when y = 0, and when y = 1, , so y = 0 is the evolution stable point, as shown in Figure 4c.
4.2.3. User Evolutionary Path
Similarly, taking the derivative of yields
If , at this time ; no matter what value z takes, the strategy selection of US is in a stable state and will not change with time, as shown in Figure 5a.
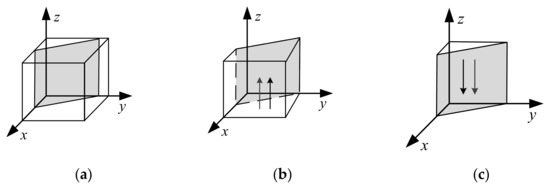
Figure 5.
Evolutionary process of US. (a) When ; (b) ; (c) When .
If , let , there are two evolution stable points, which are z = 0 and z = 1. When z = 0, and when z = 1, , so z = 1 is the evolution stable point, as shown in Figure 5b.
If , let ; at this time, when z = 0, and when z = 1, , so z = 0 is the evolution stable point, as shown in Figure 5c.
4.3. Stability Analysis of Evolutionary Game System
Friedman proposed that the differential equation system describes the group dynamics, and the stability of the equilibrium point can be obtained by the local stability analysis of the Jacobi matrix of the system. The Jacobi matrix is calculated by the above formula, as follows:
In the asymmetric game, if the condition of information asymmetry holds, the evolutionarily stable strategy is pure strategy. Therefore, this paper only needs to discuss the asymptotic stability of the eight local equilibrium points, , , , , , , , and , in the above formula [50]. The evolutionarily stable strategy (ESS) of game is judged by judging the eigenvalues () of the Jacobian matrix. When all eigenvalues are greater than 0, the equilibrium point is unstable, and is the source point. The positive and negative signs of the eigenvalues are different, and the equilibrium point is a saddle point. All the eigenvalues are less than 0, the equilibrium point is stable and is the sink point. The eigenvalues of the above eight local equilibrium points are shown in Table 3 below.

Table 3.
Equilibrium points and their eigenvalues.
Taking the local equilibrium point as an example, the stable equilibrium point of the evolving system is discussed. This paper studies the situation in which the three parties in the game adopt digital technology to drive information sharing, data integration and collaborative decision making of the photovoltaic–storage–use value chain and promote value intelligence creation. Therefore, equilibrium point is the ideal equilibrium situation. When all three eigenvalues are less than 0, becomes a stable point. The following conditions are met:
The eigenvalue symbols of the eight local equilibrium points and their corresponding stability analysis are shown in Table 4 below.

Table 4.
Signs and stability of eigenvalues of equilibrium points.
Taking condition ④ as an example, when becomes the stable point (ESS), the stability of the other three uncertain local equilibrium points , and in Table 4 are discussed, as shown in Table 5 below.

Table 5.
Stability of uncertain local equilibrium points.
It can be seen that if the parameters satisfy the above assumptions, the stable points of the system evolution may converge to , and (when condition ② is satisfied).
Combined with the characteristic value of the Jacobi matrix in Table 3, the local equilibrium point is taken as an example to analyze and discuss. The results (Table 4 and Table 5) show that the conditions of stable points of the tripartite collaborative evolutionary game are conflicting. There are few stable points at the same time, and there are only a few stable equilibrium solutions in the game of tripartite collaborative evolution of the photovoltaic–storage–use value chain.
5. Simulation Analysis
To clearly and intuitively demonstrate the impact of changes in the parameters on the evolutionary path of the system, this paper uses MATLAB to carry out simulations. During this process, we first interviewed senior executives in the photovoltaic and energy storage industry and experts from relevant government departments. According to the actual research situation, we established the conditions that the initial simulation parameters should meet. In general, as the interest subject of the power generation side, the photovoltaic power generator is the starting point of the whole value chain, with a large amount of photovoltaic resource data and advanced digital technology. As the value transfer terminal of the energy side, the user’s information resource is the basic source of intelligent electricity analysis. Therefore, compared with the energy storage provider and user, the photovoltaic power generator has a larger volume of initial input information resource elements and a greater degree of digital technology utilization proficiency. In the current environment, the photovoltaic power generator and user have a certain amount of information construction. However, when the energy storage provider participates in value chain collaboration as a new type of energy storage transaction subject, the requirements of flexible configuration and agile response of the energy storage system lead to the higher demands for the energy storage provider on cloud computing, edge computing and other information technologies, so the driving cost will be relatively high. Therefore, in most cases, , , and .
Take the real situation of agents in a micro-grid as an example. A PV power generation company, an energy storage company and a community user group form a value chain alliance. After negotiation, the three subjects respectively invest information resources (including shared information, technology, etc.) with the volume of 30, 10, and 20. The enabling income of the three parties from each unit of information resources is, respectively, 45,000 yuan, 35,000 yuan and 40,000 yuan. The driving cost from each unit of information resources is, respectively, 100,000 yuan, 200,000 yuan and 150,000 yuan. The risk cost from each unit of information resources is, respectively, 30,000 yuan, 20,000 yuan and 25,000 yuan.
The parameter values of incentive compensation coefficient and asymmetric penalty coefficient are assigned concerning the actual operation situation of the value chain alliance, suggestions of system simulation experts and the simulation data of existing research results [50,51,52], so that the parameter settings are more relevant to the actual situation. Based on the above real situation and objective facts, and combined with other scholars’ relevant research [53,54], the parameters are set as follows: let , , , , , , , , , , , ,, , , , , and . Matlab R2018a is used to simulate and obtain the results of the three-party dynamic evolution game, as shown in Figure 6 below. At this time, the stable points of system evolution are (0,0,0) and (1,1,1).
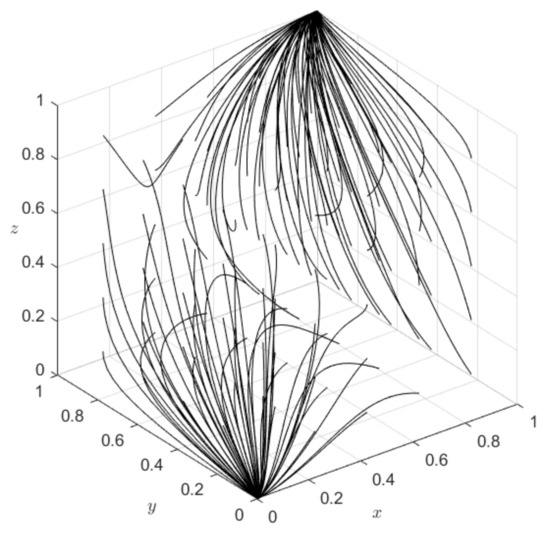
Figure 6.
Results of the three-party dynamic evolution game.
5.1. Influence of Initial Willingness of Game Parties
To simulate the change of the initial probability (that is, the initial willingness of tripartite collaboration to choose the digital-driven strategy) of tripartite collaboration of PV, ES and US, assume . As shown in Figure 7, the threshold of initial intention x, y and z are all 0.4~0.5. When the initial intentions x, y and z are all less than the threshold, x, y and z will converge to 0, where the convergence speed of z is faster, and the smaller x, y and z are, the faster the system will evolve to the stable point (0,0,0). On the contrary, when the initial intentions x, y and z are all larger than the threshold, they will evolve to converge to 1. Among them, y converges faster, and the larger x, y and z are, the faster the system evolves to the stable point (1,1,1). This shows that (1) the greater the initial willingness, the greater the probability that PV, ES and US all choose the digital-driven strategy, and the faster the stabilization speed. (2) The strategy stabilizes faster when ES chooses the digital-driven method. While the strategy of US is affected by the behavior of others; when US defers, the collaboration converges faster.
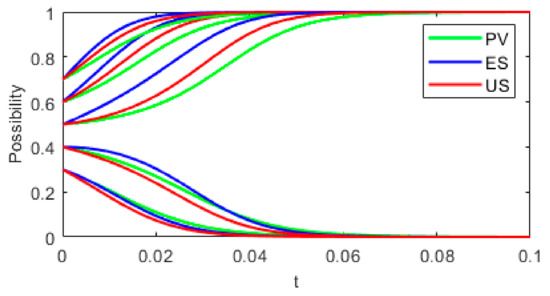
Figure 7.
Evolution results of different initial intentions.
As shown in Figure 8a, when the initial y = z = 0.3, the threshold value of the initial willingness x of the PV is between 0.5 and 0.6 (medium range). As shown in Figure 8b, when the initial x = z = 0.3, no matter how big the ES’s initial willingness y is, x and z will converge to 0. The more minor y is, the faster the convergence speed of evolution will be. As shown in Figure 8c, when x = y = 0.3 at the beginning, the threshold of z is between 0.7 and 0.8 (higher interval). When z = 0.7, the values of x and y will initially rise due to the high initial value of z, but with the evolution of time, x and y gradually decrease, and the system gradually converges to (0,0,0). The results show that when the collaboration willingness of the other two subjects is low, the initial willingness of PV has the most significant impact on the value chain collaboration, followed by US and ES.
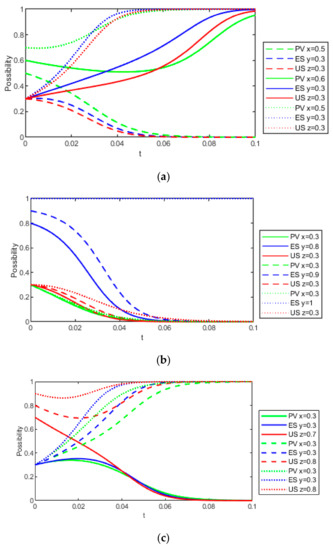
Figure 8.
Dynamic evolutionary game results when initial intentions changes. (a) When initial x changes; (b) When initial y changes; (c) When initial z changes.
5.2. Parameter Sensitivity Analysis
5.2.1. Enabling Benefit Coefficient
Assume that the initial x, y and z are all 0.5, and take different values for . The evolution results are shown in Figure 9. As shown in Figure 9a, the threshold of is between 3.8 and 3.9. When is lower than the threshold, the stable strategy of three-party collaboration evolution tends to (0,0,0), and the more minor is, the faster the three parties converge to 0. When is higher than the threshold, the stable strategy tends to (1,1,1), and the larger is, the faster the three parties converge to (1,1,1). As can be seen from Figure 9b, when , the stability points are (1,1,1), and the larger is, the faster the convergence speed. Similarly, Figure 9c shows that the threshold value of is between 2.4 and 2.5. Figure 9 shows that y converges to 1 faster in most cases. The results show that (1) the larger the enabling efficiency coefficient is, the stronger the willingness of PV, ES and US’s selection of the digital-driven strategy for value chain collaboration is, and the faster the speed of convergence to the stable state. This is due to the increasingly advanced information technology in the context of the digital economy, which has greater power to drive the digital transformation of energy and digital utility of the value chain, and greater encouragement for stakeholders to carry out collaborative decision making. (2) PV and US are sensitive to the enabling benefit coefficient, because they have more input in information resource elements. (3) Even when the ES is under the condition of small enabling benefit coefficient, it will evolve to choose the digital-driven strategy. Because ES can profit from the large amount of information resources invested by the PV and US, it has a stronger willingness to collaborate.
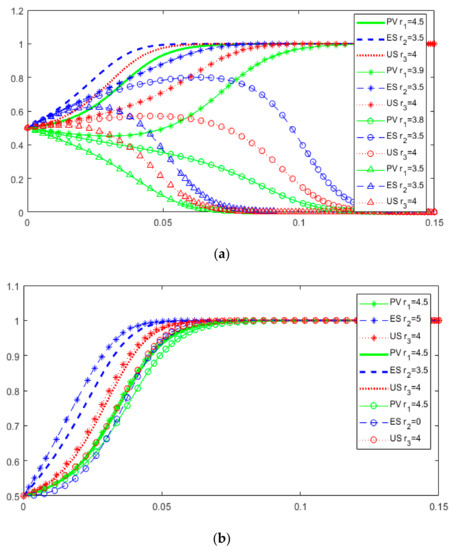
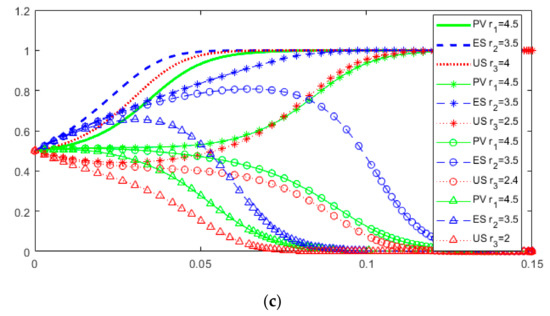
Figure 9.
Dynamic evolution game results when change. (a) For different values of ; (b) For different values of ; (c) For different values of .
5.2.2. Driving Cost Coefficient
Figure 10 shows the simulation results when different values of are taken. The threshold value of is between 10 and 11. The threshold ranges from 34 to 35. When is lower than the threshold but not very low, y rapidly drops to 0, and x and z rise slowly. After a long period of evolution, y gradually increases with the increase of x and z, and finally y converges to 1, and the game system stabilizes to the equilibrium point (1,1,1). Similarly, the threshold value of is between 16 and 17. The results show that (1) there is a critical value of the driving cost coefficient. When the driving cost is too high, the three parties in the game will give up the digital technology to drive the value chain collaboration; (2) compared with PV and US, ES is less sensitive to the driving cost coefficient, because ES has less input in information resources and less overall driving costs. In the long run, even if the driving cost of ES is high, the ES will still benefit from the other two players’ choice of digital-driven strategy collaboration and eventually evolve to the strategy of using digital technology to carry out value chain collaboration.
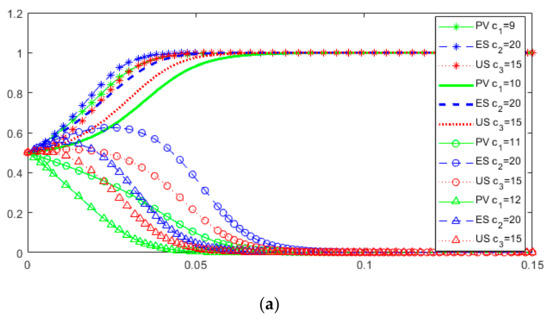
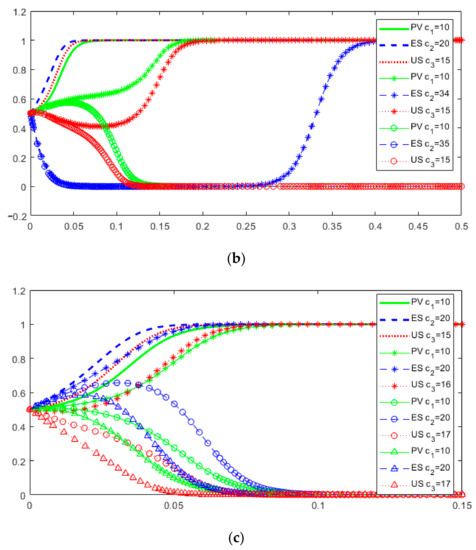
Figure 10.
Dynamic evolution game results when change. (a) For different values of ; (b) For different values of ; (c) For different values of .
5.2.3. Potential Risk Coefficient
Figure 11 shows that the threshold value of is between 3.6 and 3.7. The threshold of ranges from 16 to 17. When is lower than the threshold but not very low, the ES’s willingness y to collaborate is not very strong at the beginning. After a period of evolution, as x and z become stronger, ES will choose to collaborate with the other two subjects, and finally y converges to 1. Similarly, the threshold of is between 4 and 4.1. The results show that (1) if the potential risk coefficient is too large, it will take a long time to reach the stable point of tripartite collaboration or directly lead to the three parties not choosing the collaboration strategy; (2) PV and US are more sensitive to the potential risk coefficient. This is due to the high initial resource investment of these two parties, which may face risks such as data leakage. They also have high dependence on information resources. In particular, PV has high requirements for the accuracy of data elements and needs to prevent potential risks in advance.
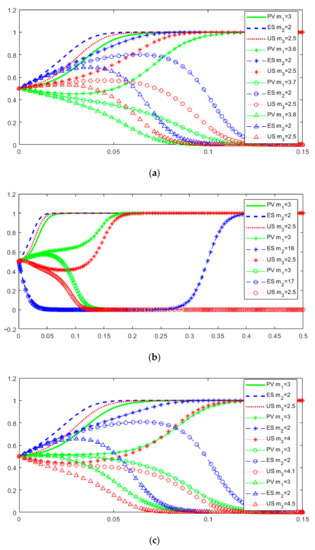
Figure 11.
Dynamic evolution game results when change. (a) For different values of ; (b) For different values of ; (c) For different values of .
5.2.4. Incentive Compensation Coefficient
As shown in Figure 12, the threshold of is between 4.3 and 4.4. No matter how changes, the stable point is (1,1,1), but the larger is, the faster the convergence speed. When is 0, y decreases first, then slowly rises with the evolution of the system, and finally converges to 1. The threshold of ranges from 4.4 to 4.5. The results show that (1) the incentive compensation coefficient’s size will affect the three-party evolutionary game’s result and stability speed. The larger the incentive degree is, the faster the three parties tend to collaborate in the value chain. To adapt to the current environment of “digital economy” and “carbon neutral”, the choice of collaborative strategy will obtain more policy incentives, and the willingness of three-party collaboration will gradually increase to improve the value intelligence creation effect. (2) Compared with PV and US, the strategy selection of ES is less affected by the incentive compensation coefficient. However, if the coefficient is too small, the ES will not have strong willingness to collaborate in the early stage of the game, which will eventually slow down the stability speed of the system.
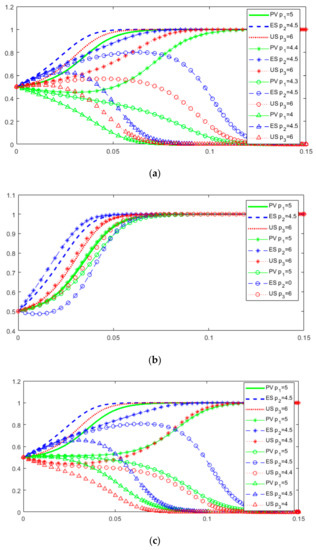
Figure 12.
Dynamic evolution game results when change. (a) For different values of ; (b) For different values of ; (c) For different values of .
5.2.5. Asymmetric Penalty Coefficient
As can be seen from Figure 13, the threshold value of is between 6.1 and 6.2. The threshold of ranges from 2.8 to 2.9. When is less than the threshold, y converges to 0. The stable equilibrium point of the three-way game system is (1,0,1). When = 2.9, is larger than the threshold but not very large, and y rapidly evolves toward 0. However, with a longer period of game and evolution, y will gradually increase due to x = y = 1, and slowly converge to 1. The threshold of ranges from 6.5 to 6.6. The results show the following: (1) The penalty mechanism of information asymmetry will affect the value chain collaboration, and the asymmetric penalty coefficient has a critical value. The greater the asymmetric penalty coefficient is, the greater the final probability of PV, ES and US’s collaboration will be, and the faster the stabilization speed will be. (2) When each subject is punished by free-riding behavior, the severity of punishment is related to the input of information resource factors of the other two subjects. Due to PV and US having relatively high information integration, and the initial resource investment of ES being relatively small, the critical values of the asymmetric penalty coefficient of PV and US are high, and the critical value of the asymmetric penalty coefficient of ES is low. (3) When the asymmetric penalty coefficient of ES is small, it tends toward a non-numerically driven strategy in the early stage of the game. However, in the longer term, because PV and US choose to collaborate in the value chain and gradually improve the intelligence creation ability of the value chain, ES will be influenced by the other two parties and gradually evolve to choose the digital-driven strategy for value intelligence creation.
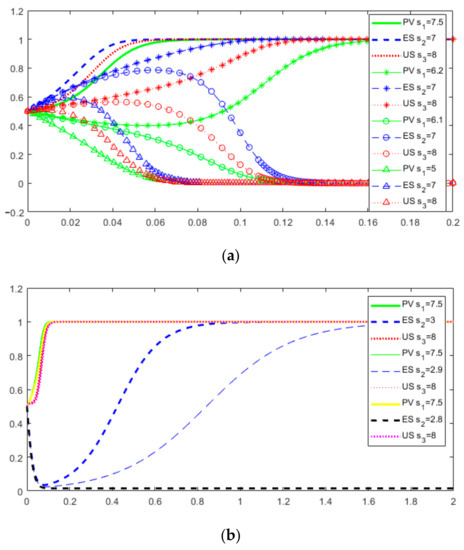
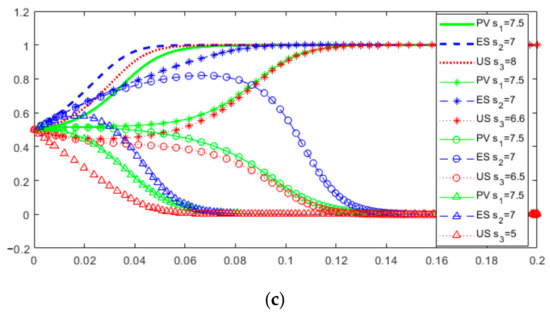
Figure 13.
Dynamic evolution game results when change. (a) For different values of ; (b) For different values of ; (c) For different values of .
Some results obtained from numerical simulation have been verified in related studies. For example, [50] found that digital transformation is an essential regulator of collaboration in the supply chain, and government support provides critical links in the collaboration formation path. However, the applicability to value intelligence creation of the suggested sensitivity factors in this paper is higher versus some other influencing factors, such as digital-transformation degree [50], supervision costs [55] and sharing income coefficient [51].
5.3. Mangement Suggestions
Based on above analysis and simulation results, according to the main conclusions, the incentive mechanism and management suggestions of digital-driven photovoltaic–storage–use value chain collaboration from the perspective of value intelligence creation are put forward as follows:
(1) The photovoltaic power generator, energy storage provider and user should strengthen the application of digital technology and promote value intelligence creation. For example, the photovoltaic power generator can use digital technologies such as “Cloud computing, Big data, the Internet of things, Mobile Internet, AI, Blockchain” to widely collect and integrate big data such as meteorological data, energy consumption data and macroeconomic data. Machine learning, data mining and big data analysis are used to grasp the energy consumption characteristics of photovoltaic power generation systems and users, coordinate planning and scheduling multiple power generation subsystems.
The energy storage provider can implement system status and fault monitoring based on big data technology, considering the use of blockchain, cloud computing, etc., to optimize shared energy storage and cloud energy storage operation transaction modes, capacity configuration and optimal scheduling.
On the user side, blockchain technology and Internet of Things technology can be used to realize intelligent electricity information collection, energy platform applications and intelligent service of electric vehicles. A variety of artificial intelligence methods are used for load forecasting and demand response modeling to provide users with clean, efficient, low-carbon and safe electricity. It can also provide users with personalized services and solutions for energy use.
(2) It is suggested to strengthen the collaboration intensity among the photovoltaic power generator, energy storage provider and user. Due to the mutual influence of the three parties’ willingness to collaborate, the collaboration results of the value chain will eventually evolve into different states. The stronger the initial willingness of the three parties to collaborate, the faster the evolution speed. As the photovoltaic power generator is the node that has the strongest influence on the value chain collaboration, it should be further promoted to participate in the collaboration of the photovoltaic–storage–use value chain, so that it can play a guiding role, and then influence the user and energy storage side to actively lay out the digital construction and transformation.
(3) It is essential to improve the benefits of digital empowerment and better promote the digital-driven photovoltaic–storage–use value chain collaboration. On the one hand, digital technology is used to realize horizontal resource complementarity of the photovoltaic–storage–use value chain system to improve energy efficiency.
On the other hand, it should play the coordinating role of digital technology in the vertical link of “power generation, energy storage and energy use” of the value chain; realize the interconnection among energy flow, information flow and value flow; fully improve the use and empowerment of digital technology; and enhance photovoltaic power consumption, energy storage innovation efficiency and energy use benefit.
(4) There should be a move to reduce the driving costs and potential risks of using digital technology. In terms of reducing driving costs, the photovoltaic power generator can consider leading the formation of a value chain alliance, jointly build a digital platform, formulate a reasonable cost sharing mechanism, use blockchain and other technologies to achieve data integration and sharing, improve the reusability of information resources and data elements, reduce the cost of system construction, and ensure the efficient use of collaborative information resources sharing.
In terms of potential risks, an effective trust mechanism should be established to give full play to the advantages of information technology and realize the gradual feedback and accumulation of energy data. In addition, stakeholders need to build information sharing mechanisms, improve the transparency of information of each subject, realize the traceability of information, and prevent the system risk caused by information distortion.
In addition, the government and relevant industry departments should also improve the relevant regulations to reduce the potential risks driven by digital technology; the photovoltaic–storage–use value chain alliance can consider carrying out pilot applications for crucial business scenarios, implement the feedback and replication expansion mode, and form a continuously strengthened risk prevention mechanism.
(5) Reasonable incentive compensation mechanisms and information asymmetry punishment measures are the keys to enhancing collective willingness. Guided by policy goals and driven by digital technology, the value creation of the traditional photovoltaic–storage–use value chain and energy trading market has been disrupted and transformed. The incentive measures of external forces in the system can give participants greater choices, activate innovation consciousness and promote collaborative participation. Therefore, it is necessary to formulate scientific and reasonable incentive means and punishment measures with guidance, which should take into account economic effects, environmental effects and social effects.
(6) Due to the different sensitivities of the photovoltaic power generator, user and energy storage provider to different influencing factors of digitally driven value chain collaboration, targeted management is needed in practical applications. The photovoltaic power generator and user are more sensitive to the influencing factors because they invest more resources and have higher technical requirements. Energy storage providers are relatively weak in sensitivity, but they are more willing to collaborate. To encourage energy storage providers to adopt collaborative strategies faster, it is necessary to strengthen efforts to improve the digital empowerment effect of energy storage providers and reduce risks and costs. Therefore, energy storage providers can consider a new type of energy storage subject to speed up digital construction and reduce information costs and risks. In addition, safety risks caused by some electrochemical energy storage technologies should be prevented, and more advanced energy storage technologies should be developed and used.
6. Conclusions
Based on the development background of the “carbon neutral” and “digital economy”, this paper studies the cooperation of digital drive photovoltaic–energy storage–use value chain from the perspective of value intelligence creation. An evolutionary game model of the three-party collaboration among the digital-driven photovoltaic power generator, energy storage provider and user is constructed. Through game analysis and simulation, this paper draws the following conclusions: (1) Driven by digital technologies, the photovoltaic–storage–use value chain can collaborate more effectively. The photovoltaic power generation, energy storage and energy use stakeholders can adopt various information technologies to improve node energy efficiency and realize value intelligence creation. (2) The larger the initial willingness of the photovoltaic power generator, energy storage provider and user, the faster the three parties choose digital-driven value chain collaboration. At the same time, the three parties will also impact each other’s choice of collaboration strategy. For example, in the simulation case studied in Section 5.1, when the initial collaborative willingness of the other two parties is low (0.3), the threshold of the initial collaborative willingness of the photovoltaic power generator and user is in the medium range (0.5–0.6) and high range (0.7–0.8), respectively. The initial willingness of each party should be improved, especially the guiding role of the photovoltaic power generator. (3) The photovoltaic power generator and user are more sensitive to influencing factors. Although the energy storage provider is relatively weak in sensitivity, its willingness to collaborate is stronger. (4) Digital-driven photovoltaic–storage–use value chain collaboration will be affected by many factors. The higher the enabling benefit coefficient, the lower the driving cost and potential risk, and the greater the incentives and punishment, the more efficiently and effectively the three parties will evolve in the direction of collaboration. For example, in the simulation case in Section 5.2.1, when the enabling benefit coefficient of the photovoltaic power generator increases from 3.9 to 4.5, the time to evolve to the collaborative state accelerates from about 0.12 to about 0.06, saving half of the time. Therefore, the corresponding management strategies should be developed to promote the coordinated decision making of the three agents in the value chains, so as to realize the intelligent creation of value better. This paper reveals the digital-driven photovoltaic–storage–use value chain collaborative mechanism, and how to achieve value intelligence creation, providing a reference for stakeholders to choose strategies. Next, the content of digital-driven photovoltaic–storage–use value chain collaborative decision-making, cost allocation method, risk prevention mechanism and other aspects mentioned will be further studied.
Author Contributions
Conceptualization, J.Y. and J.L.; methodology, J.Y.; software, J.Y.; validation, J.Y., J.S. and M.S.; formal analysis, J.L.; investigation, M.S.; resources, J.L.; data curation, J.Y.; writing—original draft preparation, J.Y.; writing—review and editing, J.S. and M.S.; visualization, J.S.; supervision, J.L.; project administration, J.L.; funding acquisition, J.L. All authors have read and agreed to the published version of the manuscript.
Funding
This research was funded by National Natural Science Foundation of China, grant number 71771085.
Institutional Review Board Statement
Not applicable.
Informed Consent Statement
Not applicable.
Data Availability Statement
Data sharing is not applicable to this article as no data sets were generated or analyzed during the current study.
Conflicts of Interest
No conflict of interest exists in the submission of this manuscript, and all authors have read and agreed to the published version of the manuscript.
References
- Wang, Z.; Yang, B.; Wei, W.; Zhu, S.; Guan, X.; Sun, D. Multi-Energy Microgrids: Designing, operation under new business models, and engineering practices in China. IEEE Electrif. Mag. 2021, 9, 75–82. [Google Scholar] [CrossRef]
- Kale, V. Creating Smart Enterprises: Leveraging Cloud, Big Data, Web, Social Media, Mobile and IoT Technologies, 1st ed.; CRC Press: New York, NY, USA, 2017; pp. 1–380. [Google Scholar] [CrossRef]
- Svitek, M. Towards complex system theory. Neural Netw. World 2015, 25, 5–33. [Google Scholar] [CrossRef]
- Liu, J.; Yin, Y. Research on self-organizing evolution mechanism of clean energy value co-creation system in China. J. Renew. Sustain. Energy 2021, 13, 046301. [Google Scholar] [CrossRef]
- Haken, H. Synergetics an Introduction; Springer: Berlin/Heidelberg, Germany, 1983; pp. 120–127. [Google Scholar] [CrossRef]
- Smith, J.M. Game theory and the evolution of behaviour. Behav. Brain Sci. 1984, 7, 95–101. [Google Scholar] [CrossRef]
- Tanimoto, J. Fundamentals of Evolutionary Game Theory and Its Applications, 1st ed.; Springer: Tokyo, Japan, 2015; pp. 30–150. [Google Scholar] [CrossRef]
- Feizi, M.R.; Yin, S.; Khodayar, M.E. Solar photovoltaic dispatch margins with stochastic unbalanced demand in distribution networks. Int. J. Electr. Power Energy Syst. 2022, 140, 107976. [Google Scholar] [CrossRef]
- Yang, Y.W.; Lu, C.M.; Liu, H.; Wang, N.; Chen, L.; Wang, C.C.; Jiang, X.D.; Ye, C. Optimal design and energy management of residential prosumer community with photovoltaic power generation and storage for electric vehicles. Sustain. Prod. Consum. 2022, 33, 244–255. [Google Scholar] [CrossRef]
- Chang, H.-C.; Ghaddar, B.; Nathwani, J. Shared community energy storage allocation and optimization. Appl. Energy 2022, 318, 119160. [Google Scholar] [CrossRef]
- Moreno-Brieva, F.; Marín, R. Technology generation and international collaboration in the Global Value Chain of Lithium Batteries. Resour. Conserv. Recycl. 2019, 146, 232–243. [Google Scholar] [CrossRef]
- Liu, J.; Lin, X. Empirical analysis and strategy suggestions on the value-added capacity of photovoltaic industry value chain in China. Energy 2019, 180, 356–366. [Google Scholar] [CrossRef]
- Liu, J.; Li, Y.; Lu, Y.; Yan, S. Study on coupling optimization model of node enterprises for energy storage-involved photovoltaic value chain in China. Energy Rep. 2020, 6, 69–81. [Google Scholar] [CrossRef]
- Zhao, S.; Wang, Y.; Jiang, Z.; Hu, T.; Chu, F. Research on emergency distribution optimization of mobile power for electric vehicle in photovoltaic-energy storage-charging supply chain under the energy blockchain. Energy Rep. 2022, 8, 6815–6825. [Google Scholar] [CrossRef]
- Liu, J.; Bao, H. Research on interest coordination model of wind power supply chain with energy storage participation. J. Energy Storage 2022, 49, 104107. [Google Scholar] [CrossRef]
- Yin, Y.; Liu, J. Risk assessment of photovoltaic—Energy storage utilization project based on improved Cloud-TODIM in China. Energy 2022, 253, 124177. [Google Scholar] [CrossRef]
- Wang, R.; Mu, Y. The impacts of supply chain cooperation activities on firm’s market value. In Proceedings of the 2019 16th International Conference on Service Systems and Service Management (ICSSSM), Piscataway, NJ, USA, 13–15 July 2019. [Google Scholar] [CrossRef]
- Garlet, T.B.; Ribeiro, J.L.D.; De Souza Savian, F.; Siluk, J.C.M. Value chain in distributed generation of photovoltaic energy and factors for competitiveness: A systematic review. Sol. Energy 2020, 211, 396–411. [Google Scholar] [CrossRef]
- Wang, Y.; Gao, W.; Qian, F.; Li, Y. Evaluation of economic benefits of virtual power plant between demand and plant sides based on cooperative game theory. Energy Convers. Manag. 2021, 238, 114180. [Google Scholar] [CrossRef]
- Denes-Santos, D.; Kindl Cunha, S. Transformative innovation policy for solar energy: Particularities of a developing country. Clean Technol. Environ. Policy 2020, 22, 43–57. [Google Scholar] [CrossRef]
- Li, B.; Yin, S.; Xing, Z.; Luo, Z. Coordinated Development Policy of Energy Storage Industry in China Based on Evolutionary Game Theory. Ind. Eng. Manag. 2019, 24, 171–179. [Google Scholar] [CrossRef]
- Bekti, D.B.M.; Prasetyo, Y.T.; Redi, A.A.N.P.; Budiman, A.S.; Mandala, I.M.P.L.; Putra, A.R.; Persada, S.F.; Nadlifatin, R.; Young, M.N. Determining Factors Affecting Customer Intention to Use Rooftop Solar Photovoltaics in Indonesia. Sustainability 2021, 14, 280. [Google Scholar] [CrossRef]
- Chung, H.-M.; Maharjan, S.; Zhang, Y.; Eliassen, F.; Strunz, K. Optimal Energy Trading with Demand Responses in Cloud Computing Enabled Virtual Power Plant in Smart Grids. IEEE Trans. Cloud Comput. 2022, 10, 17–30. [Google Scholar] [CrossRef]
- Oprea, S.-V.; Bara, A. Mind the gap between PV generation and residential load curves: Maximizing the roof-top PV usage for prosumers with an IoT-based adaptive optimization and control module. Expert Syst. Appl. 2023, 212, 118828. [Google Scholar] [CrossRef]
- Emamian, M.; Eskandari, A.; Aghaei, M.; Nedaei, A.; Sizkouhi, A.M.; Milimonfared, J. Cloud Computing and IoT Based Intelligent Monitoring System for Photovoltaic Plants Using Machine Learning Techniques. Energies 2022, 15, 3014. [Google Scholar] [CrossRef]
- Nguyen, T.N.; Musgens, F. What drives the accuracy of PV output forecasts? Appl. Energy 2022, 323, 119603. [Google Scholar] [CrossRef]
- Alizadeh Bidgoli, M.; Ahmadian, A. Multi-stage optimal scheduling of multi-microgrids using deep-learning artificial neural network and cooperative game approach. Energy 2022, 239, 122036. [Google Scholar] [CrossRef]
- Sohani, A.; Sayyaadi, H.; Cornaro, C.; Shahverdian, M.H.; Pierro, M.; Moser, D.; Karimi, N.; Doranehgard, M.H.; Li, L.K.B. Using machine learning in photovoltaics to create smarter and cleaner energy generation systems: A comprehensive review. J. Clean. Prod. 2022, 364, 132701. [Google Scholar] [CrossRef]
- Mohammadzadeh, A.; Sabzalian, M.H.; Ahmadian, A.; Nabipour, N. A dynamic general type-2 fuzzy system with optimized secondary membership for online frequency regulation. ISA Trans. 2021, 112, 150–160. [Google Scholar] [CrossRef]
- Zulfiqar, M.; Kamran, M.; Rasheed, M.B. A blockchain-enabled trust aware energy trading framework using games theory and multi-agent system in smat grid. Energy 2022, 255, 124450. [Google Scholar] [CrossRef]
- Büyüközkan, G.; Göçer, F. Digital Supply Chain: Literature review and a proposed framework for future research. Comput. Ind. 2018, 97, 157–177. [Google Scholar] [CrossRef]
- Kim, K.; Lee, S. How Can Big Data Complement Expert Analysis? A Value Chain Case Study. Sustainability 2018, 10, 709. [Google Scholar] [CrossRef]
- Zutshi, A.; Grilo, A.; Nodehi, T. The value proposition of blockchain technologies and its impact on Digital Platforms. Comput. Ind. Eng. 2021, 155, 107187. [Google Scholar] [CrossRef]
- Huang, L.; Han, Y.; Yuan, A.; Xiao, T.; Wang, L.; Yu, Y.; Zhang, X.; Zhan, H.; Zhu, H. New Business Form of Smart Supply Chain Management Based on “internet of Things + Blockchain”. Mob. Inf. Syst. 2022, 2022, 1724029. [Google Scholar] [CrossRef]
- Saretta, E.; Bonomo, P.; Maeder, W.; Nguyen, V.K.; Frontini, F. Digitalization asWill researching digital technology really empower green development? A driver for supporting PV deployment and cost reduction. EPJ Photovolt. 2022, 13, 1. [Google Scholar] [CrossRef]
- Wang, L.; Chen, Y.; Ramsey, T.S.; Hewings, G.J.D. Will researching digital technology really empower green development? Technol. Soc. 2021, 66, 101638. [Google Scholar] [CrossRef]
- Qiao, W.; Yin, X. Understanding the impact on energy transition of consumer behavior and enterprise decisions through evolutionary game analysis. Sustain. Prod. Consum. 2021, 28, 231–240. [Google Scholar] [CrossRef]
- Wang, G.; Chao, Y.; Cao, Y.; Jiang, T.; Han, W.; Chen, Z. A comprehensive review of research works based on evolutionary game theory for sustainable energy development. Energy Rep. 2022, 8, 114–136. [Google Scholar] [CrossRef]
- Wang, H.; Gao, L.; Jia, Y. The predicament of clean energy technology promotion in China in the carbon neutrality context: Lessons from China’s environmental regulation policies from the perspective of the evolutionary game theory. Energy Rep. 2022, 8, 4706–4723. [Google Scholar] [CrossRef]
- Zhu, C.; Fan, R.; Luo, M.; Zhang, Y.; Qin, M. Simulating policy interventions for different quota targets of renewable portfolio standard: A combination of evolutionary game and system dynamics approach. Sustain. Prod. Consum. 2022, 30, 1053–1069. [Google Scholar] [CrossRef]
- Fang, Y.; Wei, W.; Mei, S. How dynamic renewable portfolio standards impact the diffusion of renewable energy in China? A networked evolutionary game analysis. Renew. Energy 2022, 193, 778–788. [Google Scholar] [CrossRef]
- Liu, J.; Yu, J.; Yin, Y.; Wei, Q. An evolutionary game approach for private sectors’ behavioral strategies in China’s green energy public-private partnership projects. Energy Rep. 2021, 7, 696–715. [Google Scholar] [CrossRef]
- Chen, Z.; Wang, T.; Mao, Y. Strategies of stakeholders to promote distributed photovoltaics in China: An evolutionary game study. Energy Rep. 2022, 8, 11039–11051. [Google Scholar] [CrossRef]
- Zhang, T.; Cao, S.; Pan, L.; Zhou, C. A Policy Effect Analysis of China’s Energy Storage Development Based on a Multi-Agent Evolutionary Game Model. Energies 2020, 13, 6293. [Google Scholar] [CrossRef]
- Sun, Y.; Song, Y.; Yao, L.; Yan, Z. Study on Power Consumers Choices of Electricity Retailers in Electricity Selling Market. Dianwang Jishu Power Syst. Technol. 2018, 42, 1124–1131. [Google Scholar] [CrossRef]
- Abid, H.; Thakur, J.; Khatiwada, D.; Bauner, D. Energy storage integration with solar PV for increased electricity access: A case study of Burkina Faso. Energy 2021, 230, 120656. [Google Scholar] [CrossRef]
- Hart, O. Incomplete Contracts and Control. Am. Econ. Rev. 2017, 107, 1731–1752. [Google Scholar] [CrossRef]
- Tworek, K.; Bieńkowska, A.; Kluczka, A.Z. Organizational Reliability:Human Resources, Information Technology and Management, 1st ed.; Taylor and Francis: New York, NY, USA, 2020; pp. 1–380. [Google Scholar] [CrossRef]
- Passarelli, B.; Straubhaar, J.; Cuevas-Cervero, A. Handbook of Research on Comparative Approaches to the Digital Age Revolution in Europe and the Americas; IGI Global: Hershey, PA, USA, 2015; pp. 1–530. [Google Scholar] [CrossRef]
- Li, G.; Yu, H.; Lu, M. Low-Carbon Collaboration in the Supply Chain under Digital Transformation: An Evolutionary Game-Theoretic Analysis. Processes 2022, 10, 1958. [Google Scholar] [CrossRef]
- Shen, L.; Yang, Q.; Hou, Y.; Lin, J. Research on information sharing incentive mechanism of China’s port cold chain logistics enterprises based on blockchain. Ocean. Coast. Manag. 2022, 225, 106229. [Google Scholar] [CrossRef]
- Wang, J.; Peng, X.; Du, Y.; Wang, F. A tripartite evolutionary game research on information sharing of the subjects of agricultural product supply chain with a farmer cooperative as the core enterprise. Manag. Decis. Econ. 2021, 43, 159–177. [Google Scholar] [CrossRef]
- Gao, J.; Zhang, W.; Guan, T.; Feng, Q. Evolutionary game study on multi-agent collaboration of digital transformation in service-oriented manufacturing value chain. Electron. Commer. Res. 2022. [Google Scholar] [CrossRef]
- Zhiwen, Z.; Yujun, X.; Junxing, L.; Limin, G.; Long, W. Supply Chain Logistics Information Collaboration Strategy Based on Evolutionary Game Theory. IEEE Access 2020, 8, 46102–46120. [Google Scholar] [CrossRef]
- Wang, E.; Nie, J.; Wang, Y. Government Subsidy Strategies for the New Energy Vehicle Power Battery Recycling Industry. Sustainability 2023, 15, 2090. [Google Scholar] [CrossRef]
Disclaimer/Publisher’s Note: The statements, opinions and data contained in all publications are solely those of the individual author(s) and contributor(s) and not of MDPI and/or the editor(s). MDPI and/or the editor(s) disclaim responsibility for any injury to people or property resulting from any ideas, methods, instructions or products referred to in the content. |
© 2023 by the authors. Licensee MDPI, Basel, Switzerland. This article is an open access article distributed under the terms and conditions of the Creative Commons Attribution (CC BY) license (https://creativecommons.org/licenses/by/4.0/).