Thermal Environment Control at Deep Intelligent Coal Mines in China Based on Human Factors
Abstract
1. Introduction
2. Materials and Methods
2.1. Metabolic Rate of the Miners under Hot and Humid Mine
- M0—metabolic rate at rest, W/m2;
- HR—heart rate, in beats per minute;
- HR0—heart rate, in beats per minute;
- RM—increase in heart rate per unit of metabolic rate;
- RQ—respiratory quotient;
- —oxygen consumption rate, L/h;
- —carbon dioxide production, L/h;
- ADu—body surface area, m2.
2.2. Modified Clothing Insulation (Icl) and Evaporation HEAT resistance (Rt)
- (1)
- No sweat remains on the skin’s surface;
- (2)
- Fabric volume was constant;
- (3)
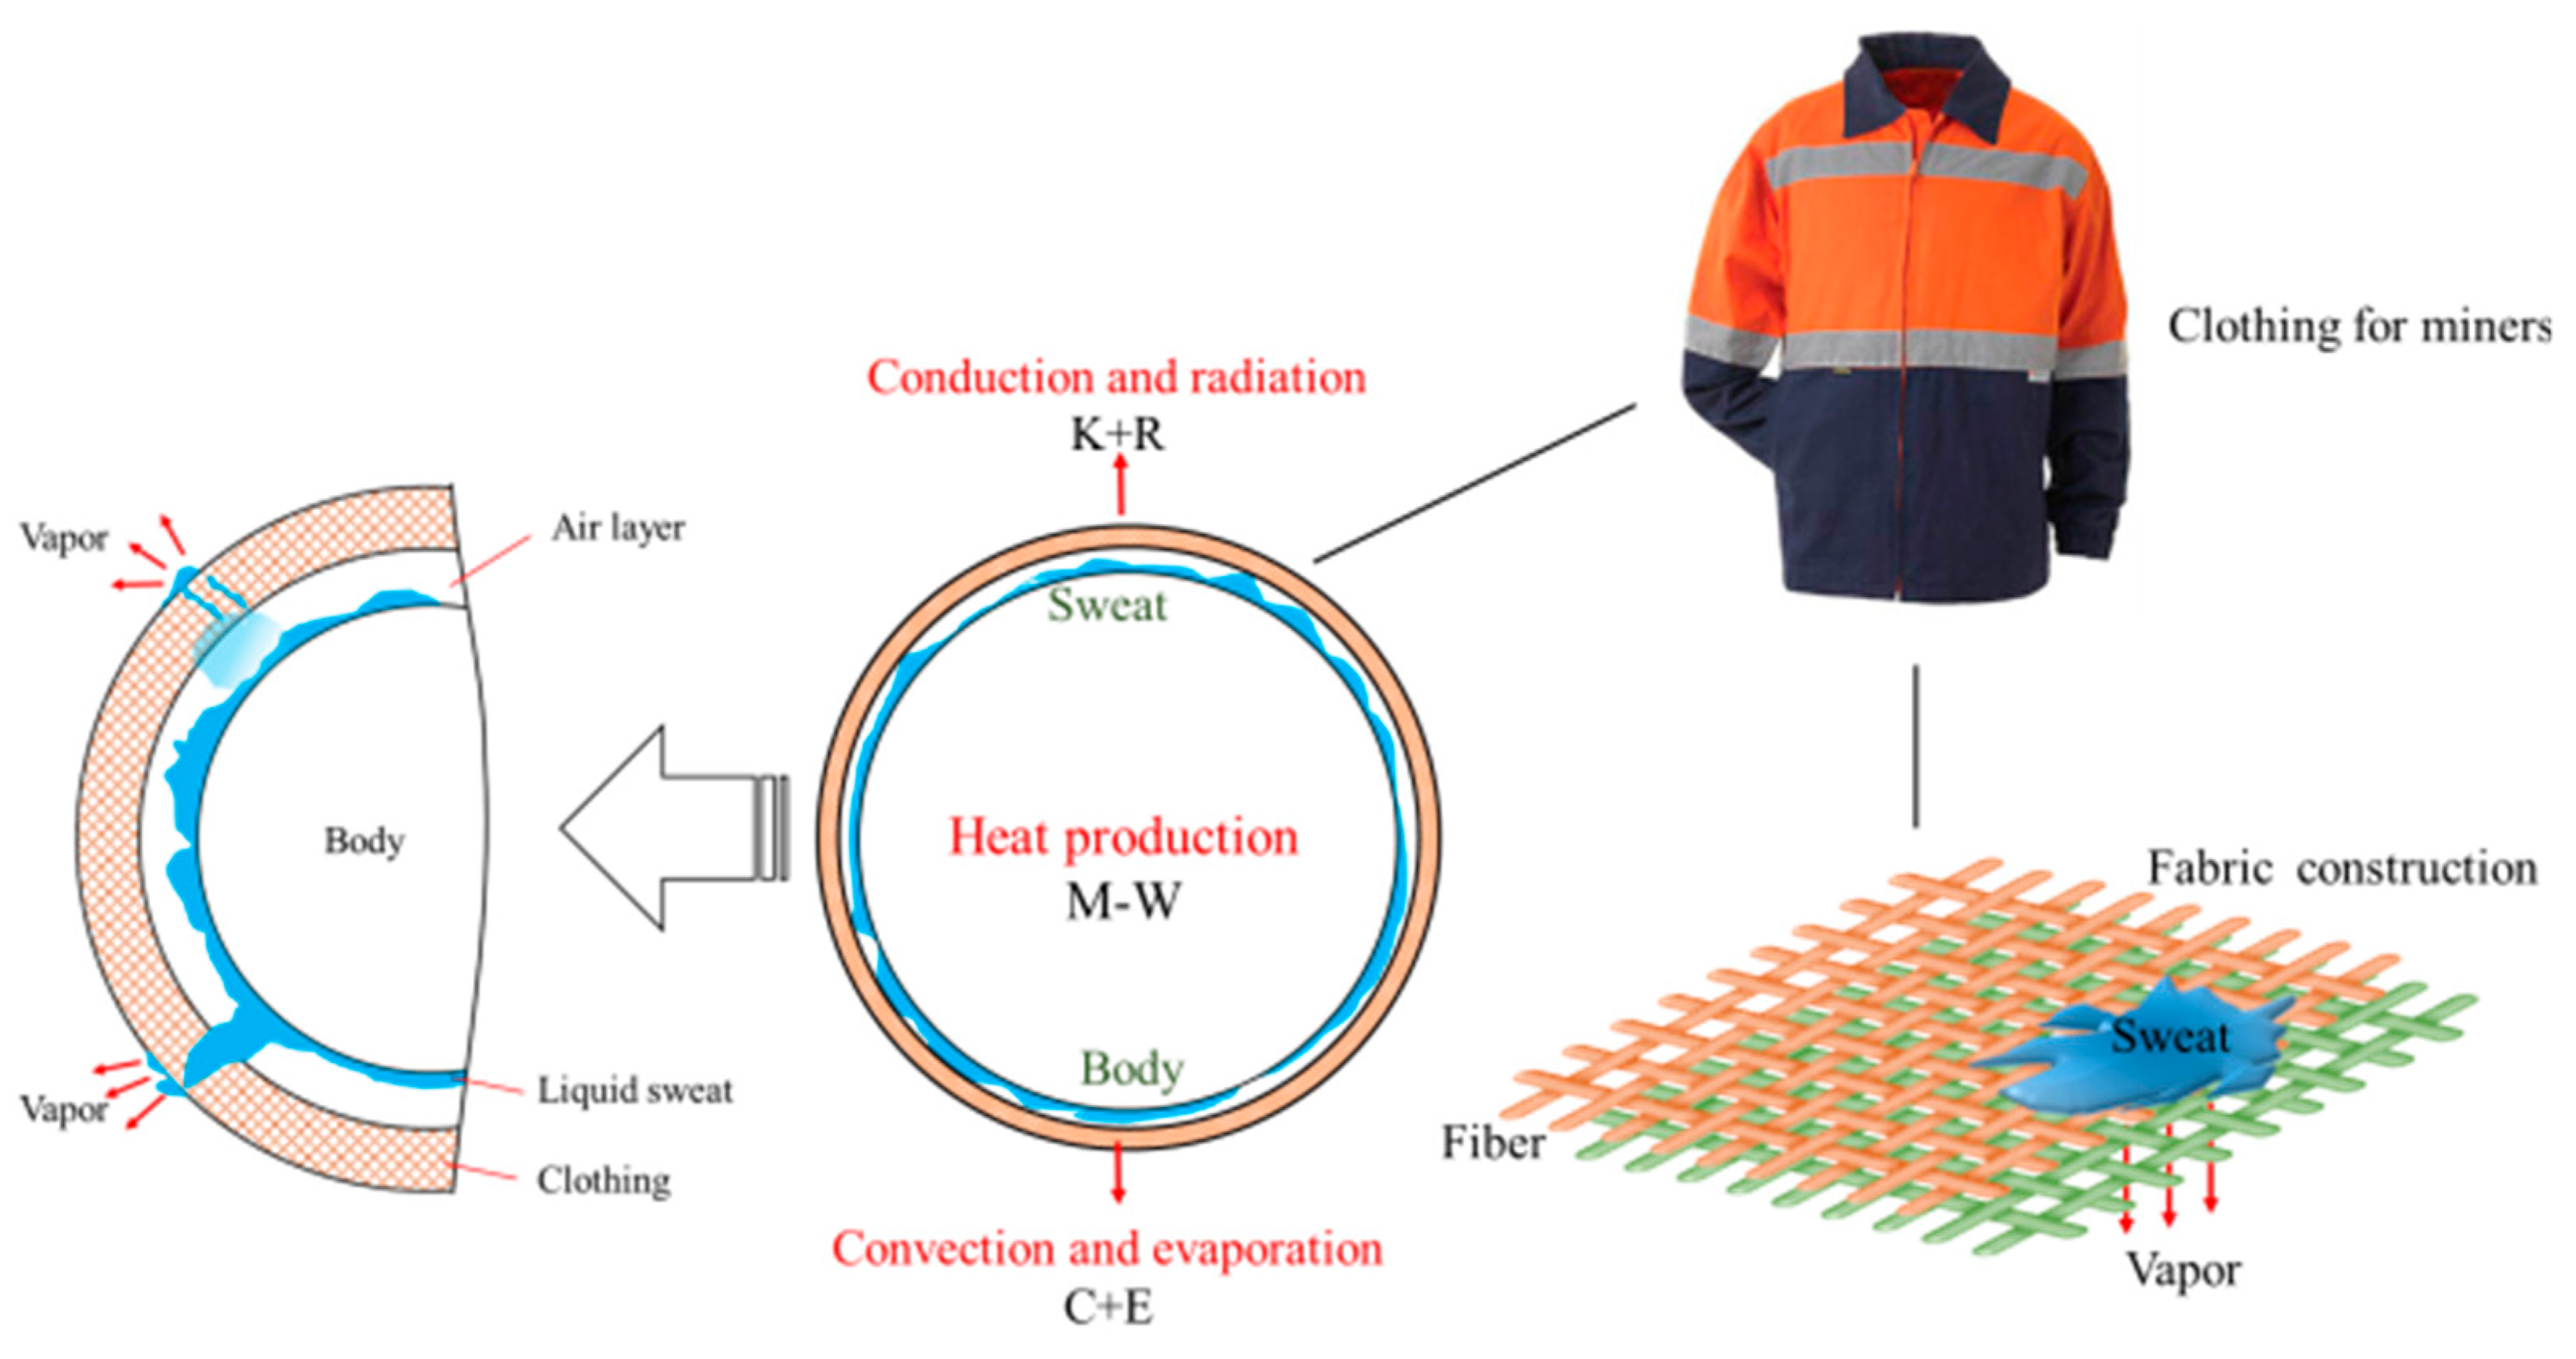
- Heat conduction occurs when heat is transferred from the inside to the outside fabric;
- (4)
- The clothing fabric is made of 100% cotton.
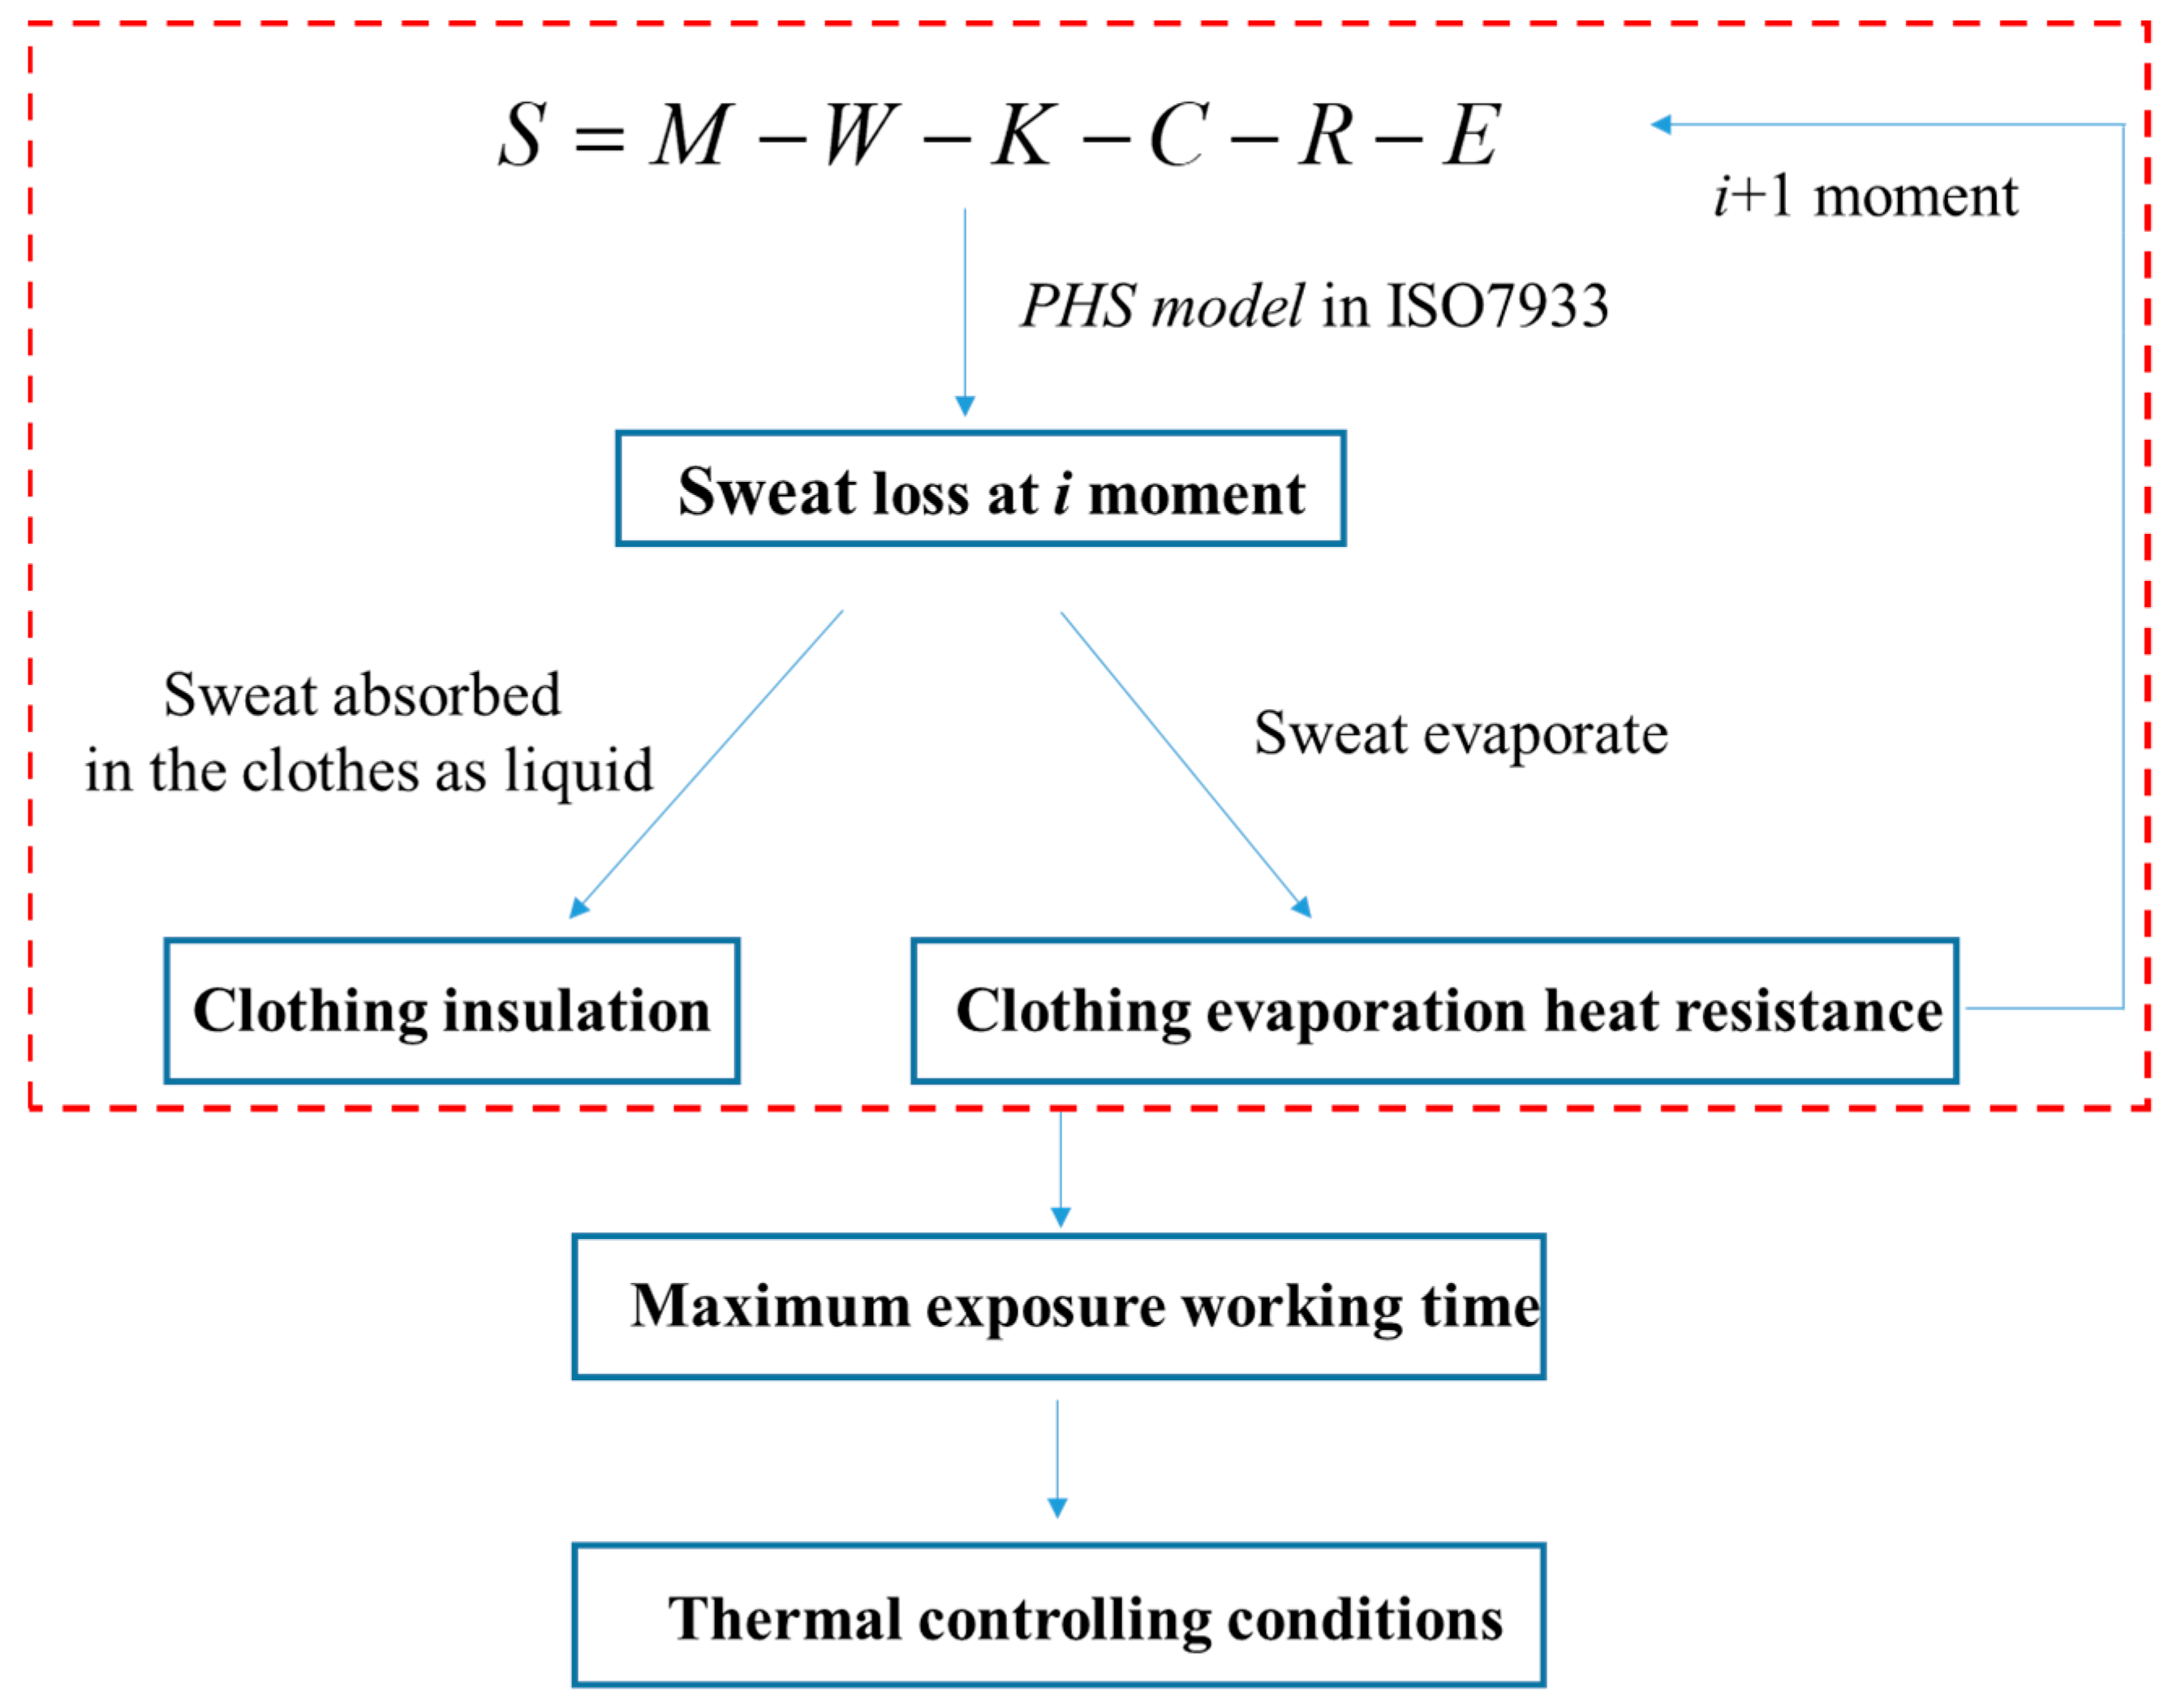
- mi—Total weight of the clothing at the i moment, kg;
- swti—Total sweat at the i moment, kg/s;
- mzi—Sweat that enters the air as a gas through a fabric, kg/s;
- msi—Sweat evaporating from the outer surface of the garment, kg/s;
- mli—Sweat remaining in the fabric;
- ∆t—Iteration interval, 60 s.
- hm—Mass transfer coefficient, m/s;
- Tcl—Water vapor saturation temperature of a garment’s outer surface, K;
- Rw—Constant of water vapor gas, 461.89 J/(kg·K);
- Pcl—Water vapor pressure on the outer surface of the garment, Pa;
- Pa—Water vapor pressure in roadway air, Pa;
- Psk—Water vapor pressure on the surface of the skin, Pa;
- Ai—effective evaporation area, m2;
- Rzi—Moisture vapor resistance at i moment, Pa·s/kg;
- Rti—Evaporative resistance of clothing at i moment, kPa·m2/W;
- r—latent heat of vaporization, J/kg;
- d—the diameter of the bottom surface, 0.3 m;
- D0—Coefficient of diffusion, cm2/s; u-air velocity, m/s.
2.3. Model Verification
3. Results and Discussion
3.1. Exposure Duration of Miners in the Hot and Humid Mine
3.2. Economic Analysis of Localized Cooling under Deep Mine
- —Theoretical power consumption of refrigeration unit, kW;
- —Total sensible heat load of the system, kW;
- —Coefficient of performance of refrigerator, multi-purpose screw refrigerator, take 4.7;
- —Annual cooling cost per ton of coal, RMB/t;
- —electricity price, RMB/kW·h;
- —annual operating time, h;
- —The annual coal mining volume of the working face, t;
4. Conclusions
- (1)
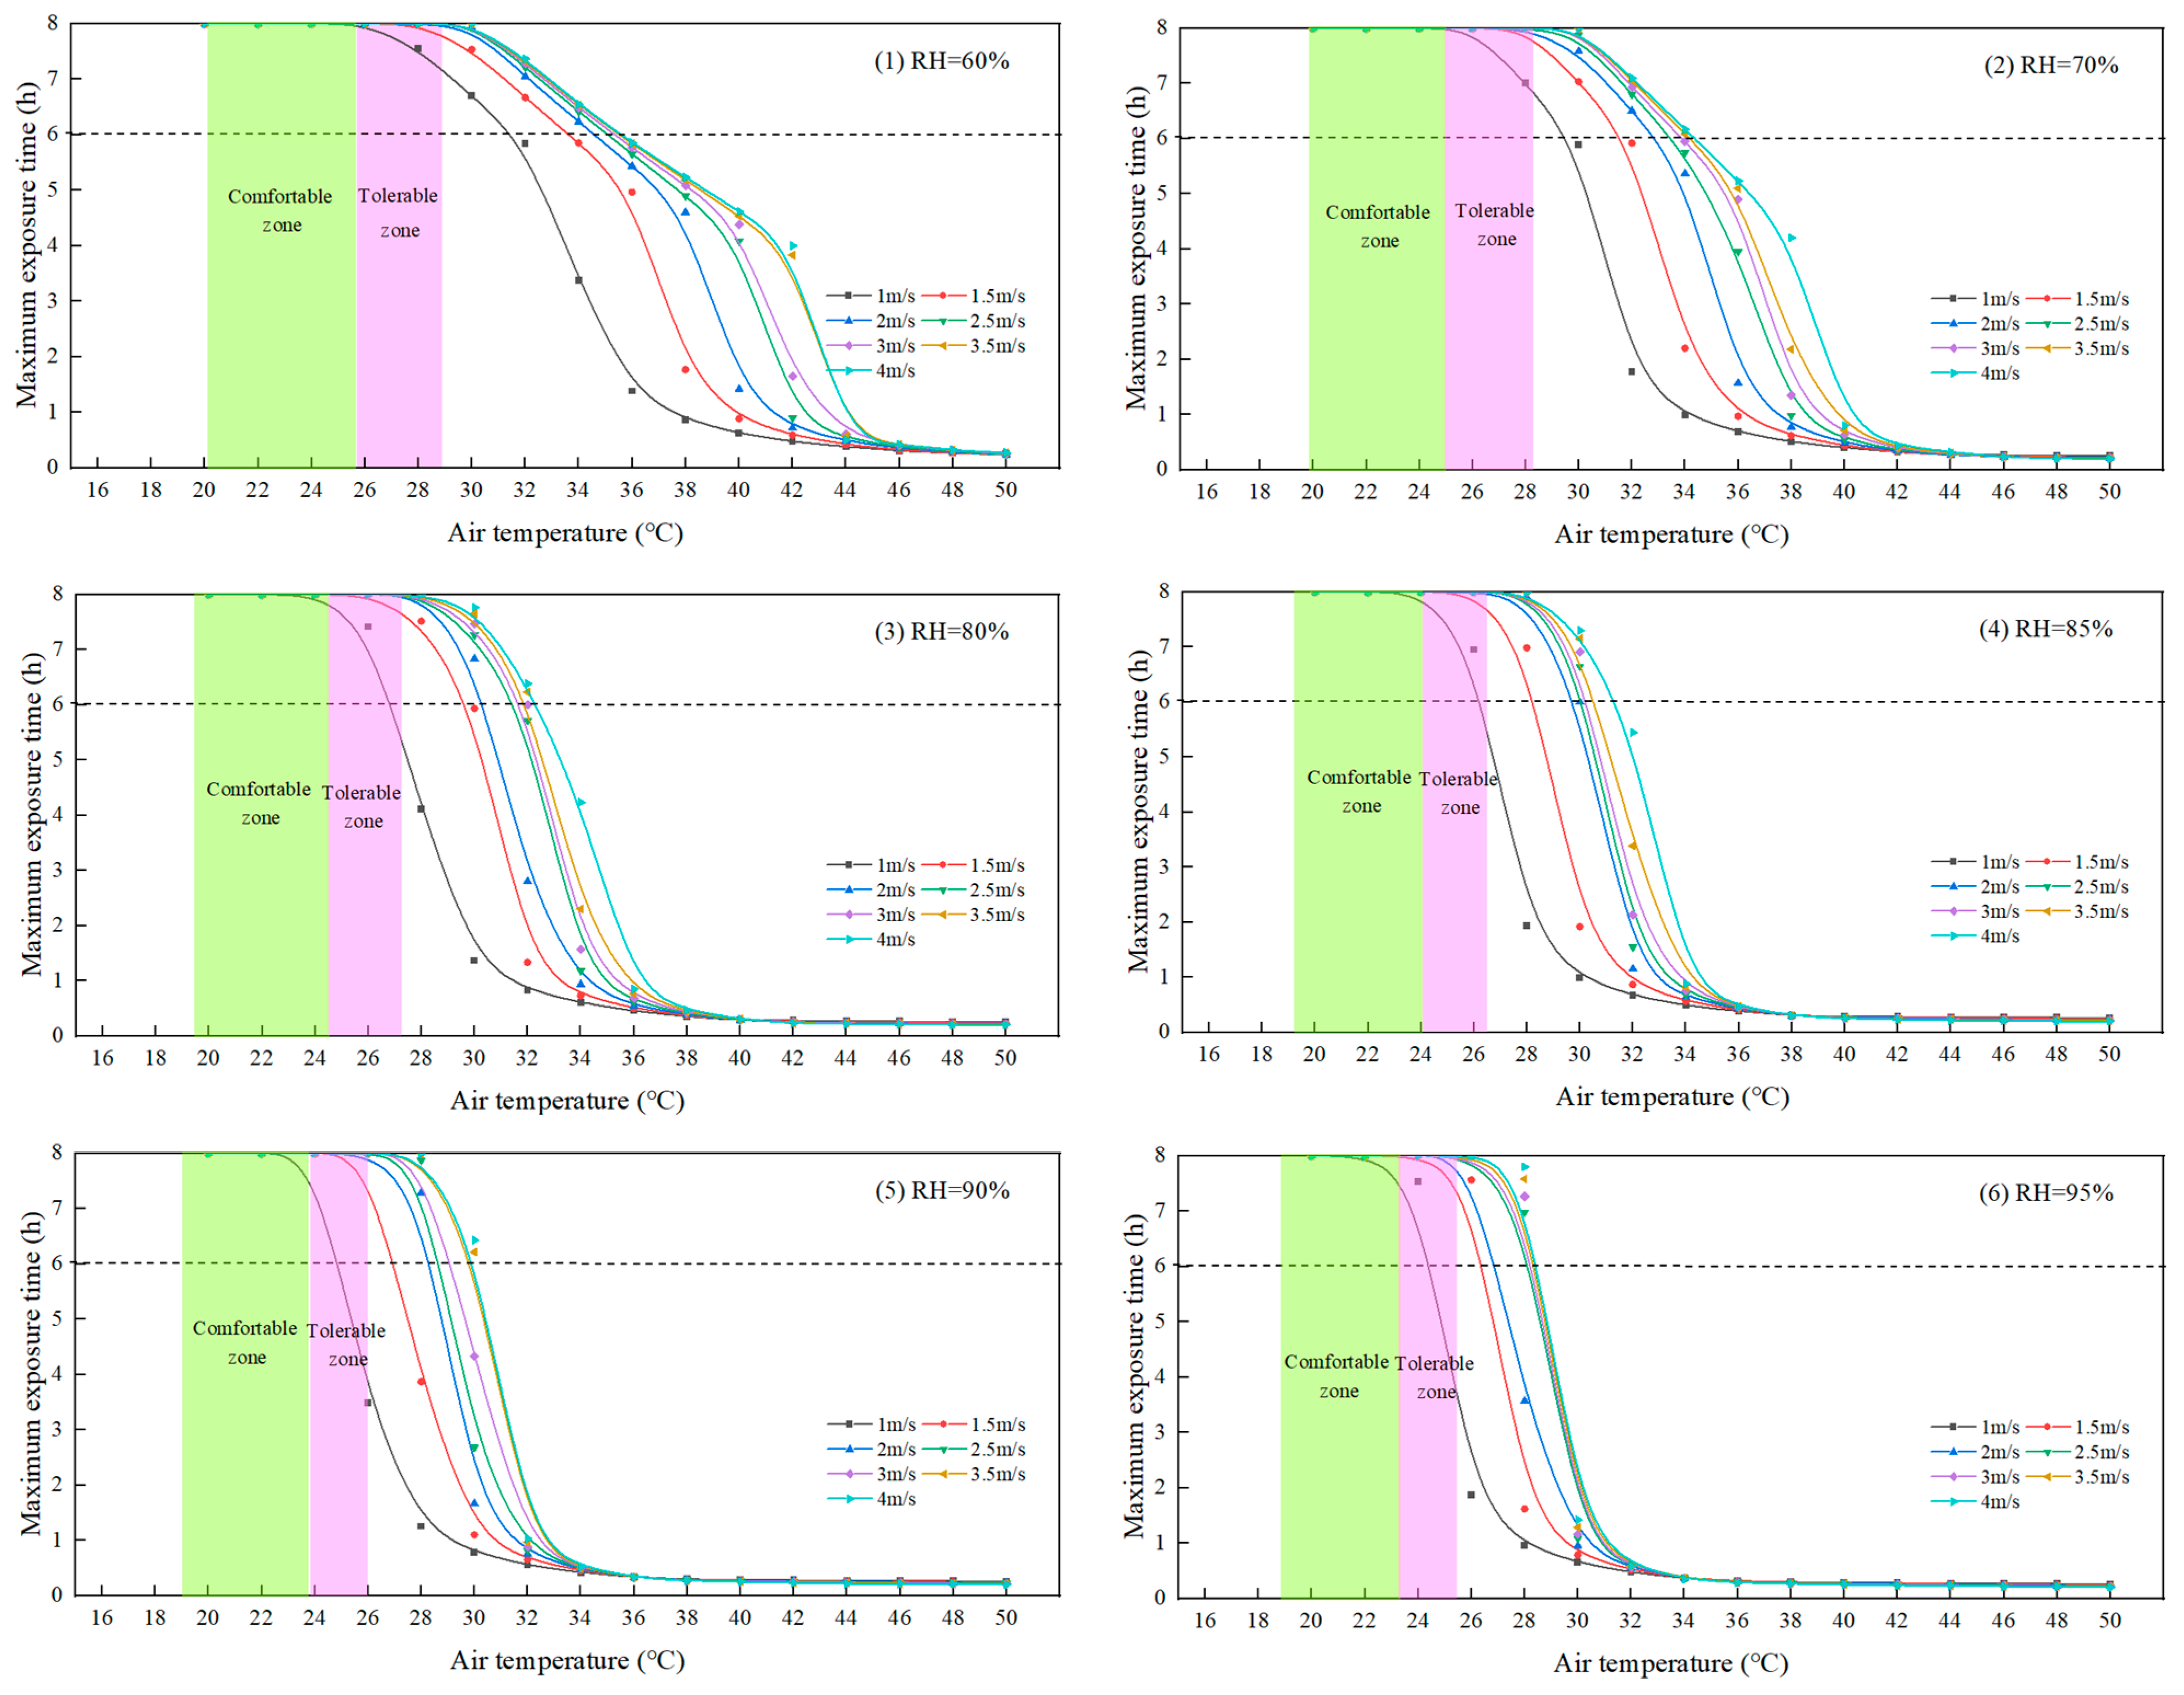
- The article modified the PHS model to account for warm and humid conditions based on human factors. The metabolic rate, clothing insulation, and evaporation heat resistance of clothing were modified for warm and humid underground environments. Based on the modified PHS model, the duration of miners’ exposure was calculated using MATLAB.
- (2)
- Air temperature was the primary factor affecting underground miners’ safety, followed by relative humidity and air velocity. The improvement of the thermal environment by increasing air velocity is directly related to the thermal humidity index; when the thermal humidity index is lower than 32, increased air velocity will achieve a significant cooling effect.
- (3)
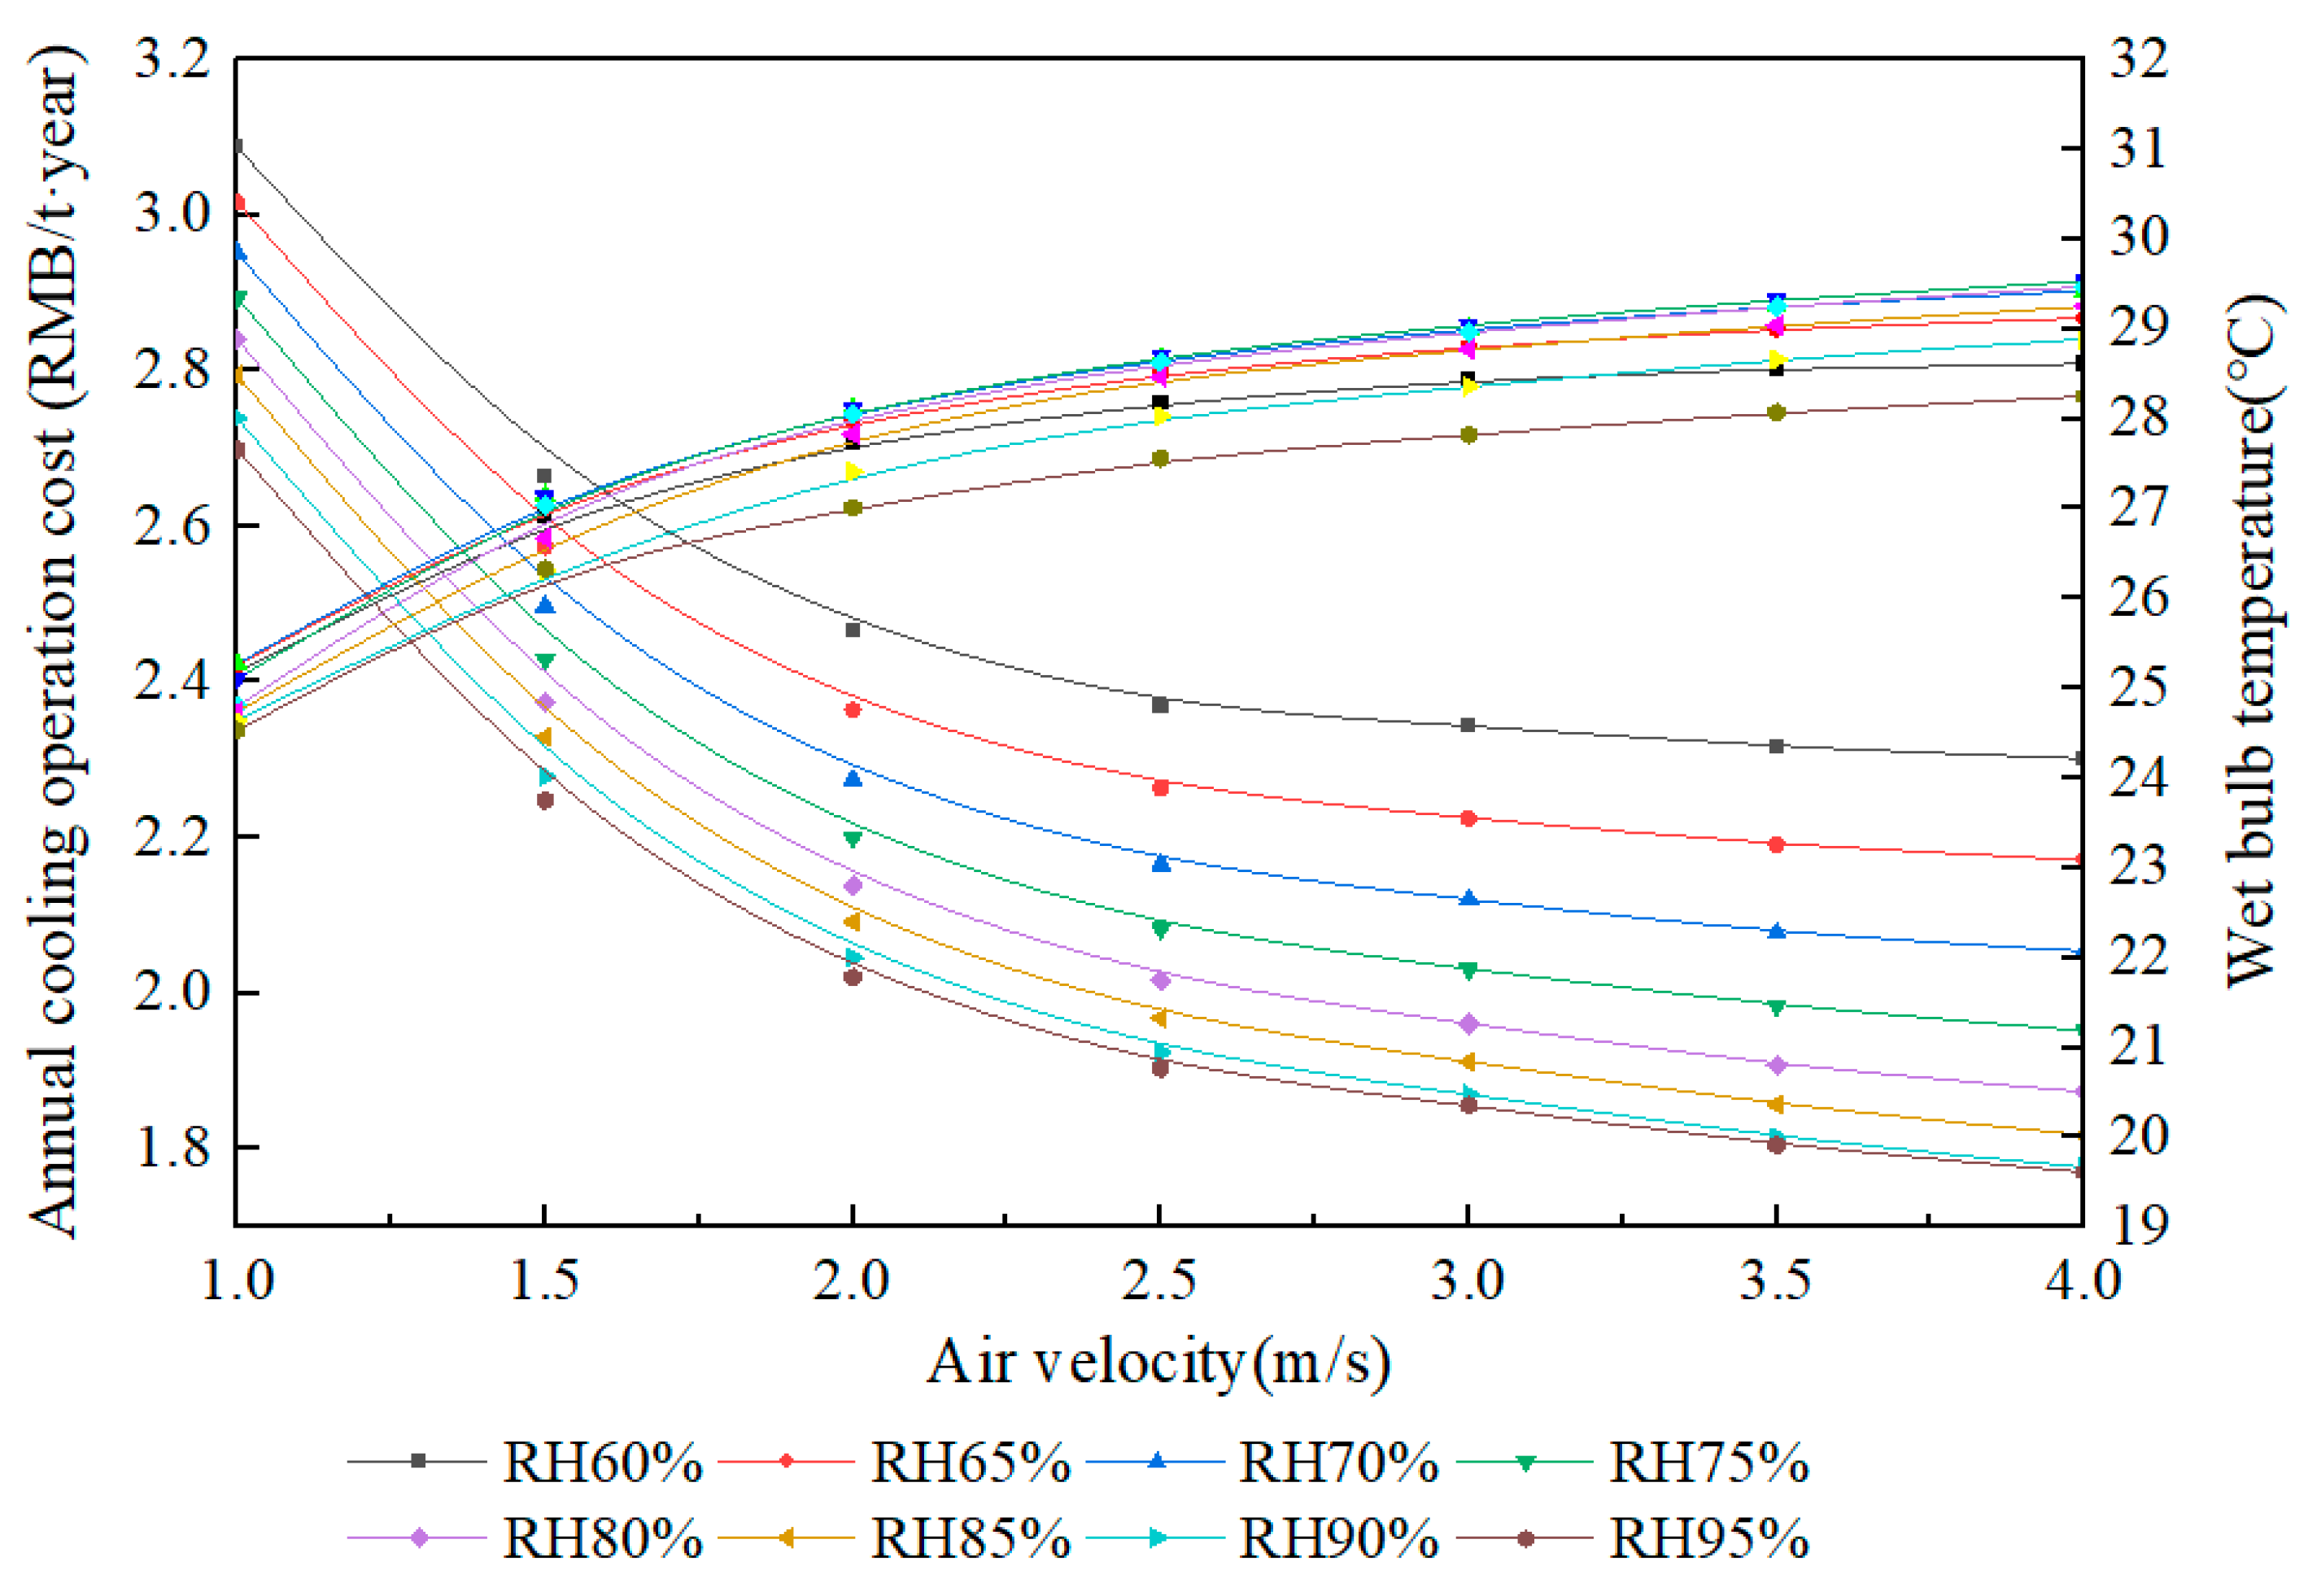
- The recommended air velocity would be 2 m/s, and the maximum temperature of the wet bulb would be 28 °C for a 6-hour working period and 26 °C for an 8-hour working period, taking into account the security of mining workers and the economic efficiency of the cooling system.
Author Contributions
Funding
Acknowledgments
Conflicts of Interest
References
- Li, J.G.; Zhan, K. Intelligent mining technology for an underground metal mine based on unmanned equipment. Engineering 2018, 4, 381–391. [Google Scholar] [CrossRef]
- Wang, M.; Liu, P.; Shang, S.Y.; Chen, Q.; Zhang, B.; Liu, L. Numerical and experimental studies on the cooling performance of backfill containing phase change materials. Build. Environ. 2022, 218, 109155. [Google Scholar] [CrossRef]
- Li, S.B.; Li, S.; Zhang, S.X.; Wang, F. Key technology and application of intelligent perception and intelligent control in fully mechanized mining face. Coal Sci. Tech. 2021, 49, 28–39. [Google Scholar]
- Crawford, J.A.; Joubert, H.P.R.; Mathews, M.J.; Kleingeld, M. Optimised dynamic control philosophy for improved performance of mine cooling systems. Appl. Therm. Eng. 2019, 150, 50–60. [Google Scholar] [CrossRef]
- Vosloo, J.; Liebenberg, L.; Velleman, D. Case study: Energy savings for a deep-mine water reticulation system. Appl. Energy 2012, 92, 328–335. [Google Scholar] [CrossRef]
- Twort, C.T.; Lowndes, I.S.; Pickering, S.J. An application of thermal exermal analysis to the development of mine cooling systems. Proc. Inst. Mech. Eng. Part C J. Mech. Eng. Sci. 2002, 216, 845–857. [Google Scholar] [CrossRef]
- Belle, B.; Biffi, M. Cooling pathways for deep Australian longwall coal mines of the future. Int. J. Min. Sci. Technol. 2018, 28, 865–875. [Google Scholar] [CrossRef]
- Han, Q.Y.; Zhang, Y.; Li, K.Q.; Zou, S.H. Computational evaluation of cooling system under deep hot and humid coal mine in China: A thermal comfort study. Tunn. Undergr. Space Technol. 2019, 90, 394–403. [Google Scholar]
- Roghanchi, P.; Kocsis, K.C.; Sunkpal, M. Sensitivity analysis of the effect of airflow velocity on the thermal comfort in underground mines. J. Sustain. Min. 2016, 15, 175–180. [Google Scholar] [CrossRef]
- Wang, H.Q.; Zou, Z.Y.; Chen, S.Q.; Li, Y.Q. Improving thermal comfort of high-temperature environment of heading face through dehumidification. J. Coal Sci. Eng. 2010, 16, 389–393. [Google Scholar] [CrossRef]
- Wang, S.G.; Xu, Z.; Zhang, T.F.; Liang, Y.T. Human thermal comfort for mine environment. J. China Coal Soc. 2010, 35, 97–100. [Google Scholar]
- Saunders, A.G.; Dugas, J.; Tucker, R.; Lambert, M.; Noakes, T. The effects of different air velocities on heat storage and body temperature in humans cycling in a hot, humid environment. Acta. Physiol. Scand. 2005, 183, 241–255. [Google Scholar] [CrossRef] [PubMed]
- Paloma, L.; Moe, M. Development of a modified predicted heat strain model for hot work environments. Int. J. Min. Sci. Technol. 2020, 30, 477–481. [Google Scholar]
- Sasmito, A.P.; Kurnia, J.C.; Birgersson, E.; Mujumdar, A.S. Computational evaluation of thermal management strategies in an underground mine. Appl. Therm. Eng. 2015, 90, 1144–1150. [Google Scholar] [CrossRef]
- Nie, X.X.; Wang, T.Y.; Sun, F.G.; Wang, Z. Influence of Heat and Humidity Environment on Function of Human Body in High Temperature Mine. Metal Mine 2020, 526, 186–193. [Google Scholar]
- Talebi, E.; Sunkpal, M.; Sharizadeh, T.; Roghanchi, P. The Effects of Clothing Insulation and Acclimation on the Thermal Comfort of Underground Mine Workers. Min. Metal Explor. 2020, 37, 1827–1836. [Google Scholar] [CrossRef]
- Kalkowsky, B.; Kampmann, B. Physiological strain of miners at hot working places in German coal mines. Ind. Health 2006, 44, 465–473. [Google Scholar] [CrossRef]
- Zhang, J.G.; Yang, S.H.; Suo, C.Y. Research on effects of high temperature and high humidity environment on miners physiology and psychology. J. China Saf. Sci. 2015, 25, 23–28. [Google Scholar]
- Zhang, C.; Tang, S.C.; Li, D.M.; Xing, J.J.; Xu, A.M.; Li, J. Experimental study of the heavy-duty working condition and intensified fatigue grade for the workmen under high temperature and great humidity environment. J. Saf. Environ. 2015, 15, 176–180. [Google Scholar]
- Wu, J.S.; Fu, M.; Tong, X.; Song, H.T.; Kong, S. Evaluation on heat strain of mine worker in high temperature and high humidity mine. Coal Sci. Tech. 2015, 43, 30–36. [Google Scholar]
- Du, C.Q.; Li, B.Z.; Li, Y.Q.; Xu, M.N.; Yao, R.M. Modification of the Predicted Heat Strain (PHS) model in predicting human thermal responses for Chinese workers in hot environments. Build. Environ. 2019, 165, 106349. [Google Scholar] [CrossRef]
- Sunkpal, M.; Roghanchi, P.; Kocsis, K.C. A Method to Protect Mine Workers in Hot and Humid Environments. Saf. Health Work 2017, 9, 149–158. [Google Scholar] [CrossRef] [PubMed]
- Chu, Z.; Zhou, G.; Rao, Z.; Wang, Y.; Zhao, X. Field measurement and assessment on airflow thermodynamic parameters in hot and humid underground tunnelling: A case study. Tunn. Undergr. Space Technol. 2022, 121, 104341. [Google Scholar] [CrossRef]
- Li, Z.J.; Xu, Y.; Li, R.R.; Jia, M.T.; Wang, Q.L.; Chen, Y.; Cai, R.Z.; Han, Z.Q. Impact of the water evaporation on the heat and moisture transfer in a high-temperature underground roadway. Case Stud. Therm. Eng. 2021, 28, 101551. [Google Scholar] [CrossRef]
- Wang, J.; Du, C.; Wang, Y. Study on the influence of ventilation parameters on the airflow temperature in excavation roadway and ventilation duct. Case Stud. Therm. Eng. 2021, 28, 101387. [Google Scholar] [CrossRef]
- Wei, D.; Du, C.; Lin, Y.; Chang, B.; Wang, Y. Thermal environment assessment of deep mine based on analytic hierarchy process and fuzzy comprehensive evaluation. Case Stud. Therm. Eng. 2020, 19, 100618. [Google Scholar] [CrossRef]
- Li, J.; Song, F.M.; Cheng, C.X. Study on continuous working time of mine personnel in high temperature and high humidity environment. Min. Saf. Environ. Prot. 2021, 48, 112–115. [Google Scholar]
- Zuo, Q.M.; Cheng, W.M.; Miao, D.J.; Wang, G. Fuzzy Synthetic Evaluation of Thermal Environment of High Temperature Mine Based on Heat Hazard Effects on People. Saf. Coal Min. 2009, 40, 86–89. [Google Scholar]
- Fanger, P.O. Thermal Comfort-Analysis and Applications in Environmental Engineering; Danish Technical Press: Copenhagen, Denmark, 1970. [Google Scholar]
- Long, S.Z. Research on Theory and Application of Human-Machine-Environment System Engineering; Science Press: Beijing, China, 2004. [Google Scholar]
- González-Alonso, J. Influence of body temperature on the development of fatigue during prolonged exercise in the heat. J. Appl. Physiol. 1999, 86, 1032–1039. [Google Scholar] [CrossRef]
- Hao, X.L.; Guo, C.X.; Lin, Y.L.; Wang, H.Q.; Liu, H.Q. Analysis of heat stress and the indoor climate control requirements for movable refuge chambers. Int. J. Environ. Res. Public Health 2016, 13, 518. [Google Scholar] [CrossRef]
- Werner, J.; Buse, M. Temperature profiles with respect to inhomogeneity and geometry of the human body. J. Physiol. 1988, 65, 1110–1118. [Google Scholar] [CrossRef] [PubMed]
- Qu, J.T.; Zeng, F.X.; Feng, W.P.; Li, X. Difference of energy consumption in high temperature and high humidity environment and normal temperature environment. Chin. J. Sports Med. 2015, 34, 164–169. [Google Scholar]
- Tian, S.C.; Zhou, R.K.; Yang, J. Effects of cooling garments on firefigher’s thermal responses under high temperature. China Saf. Sci. J. 2020, 30, 166–171. [Google Scholar]
- Sudo, M.; Murakami, S.; Kato, S.; Song, D. Study on the personal air-conditioning system considering human thermal adaptation (Part 7)-thermal comfort and response time to thermal stimulus given from change of activity. The Society of Heating, Air-Conditioning Sanitary Engineers of Japan, 2004. [Google Scholar]
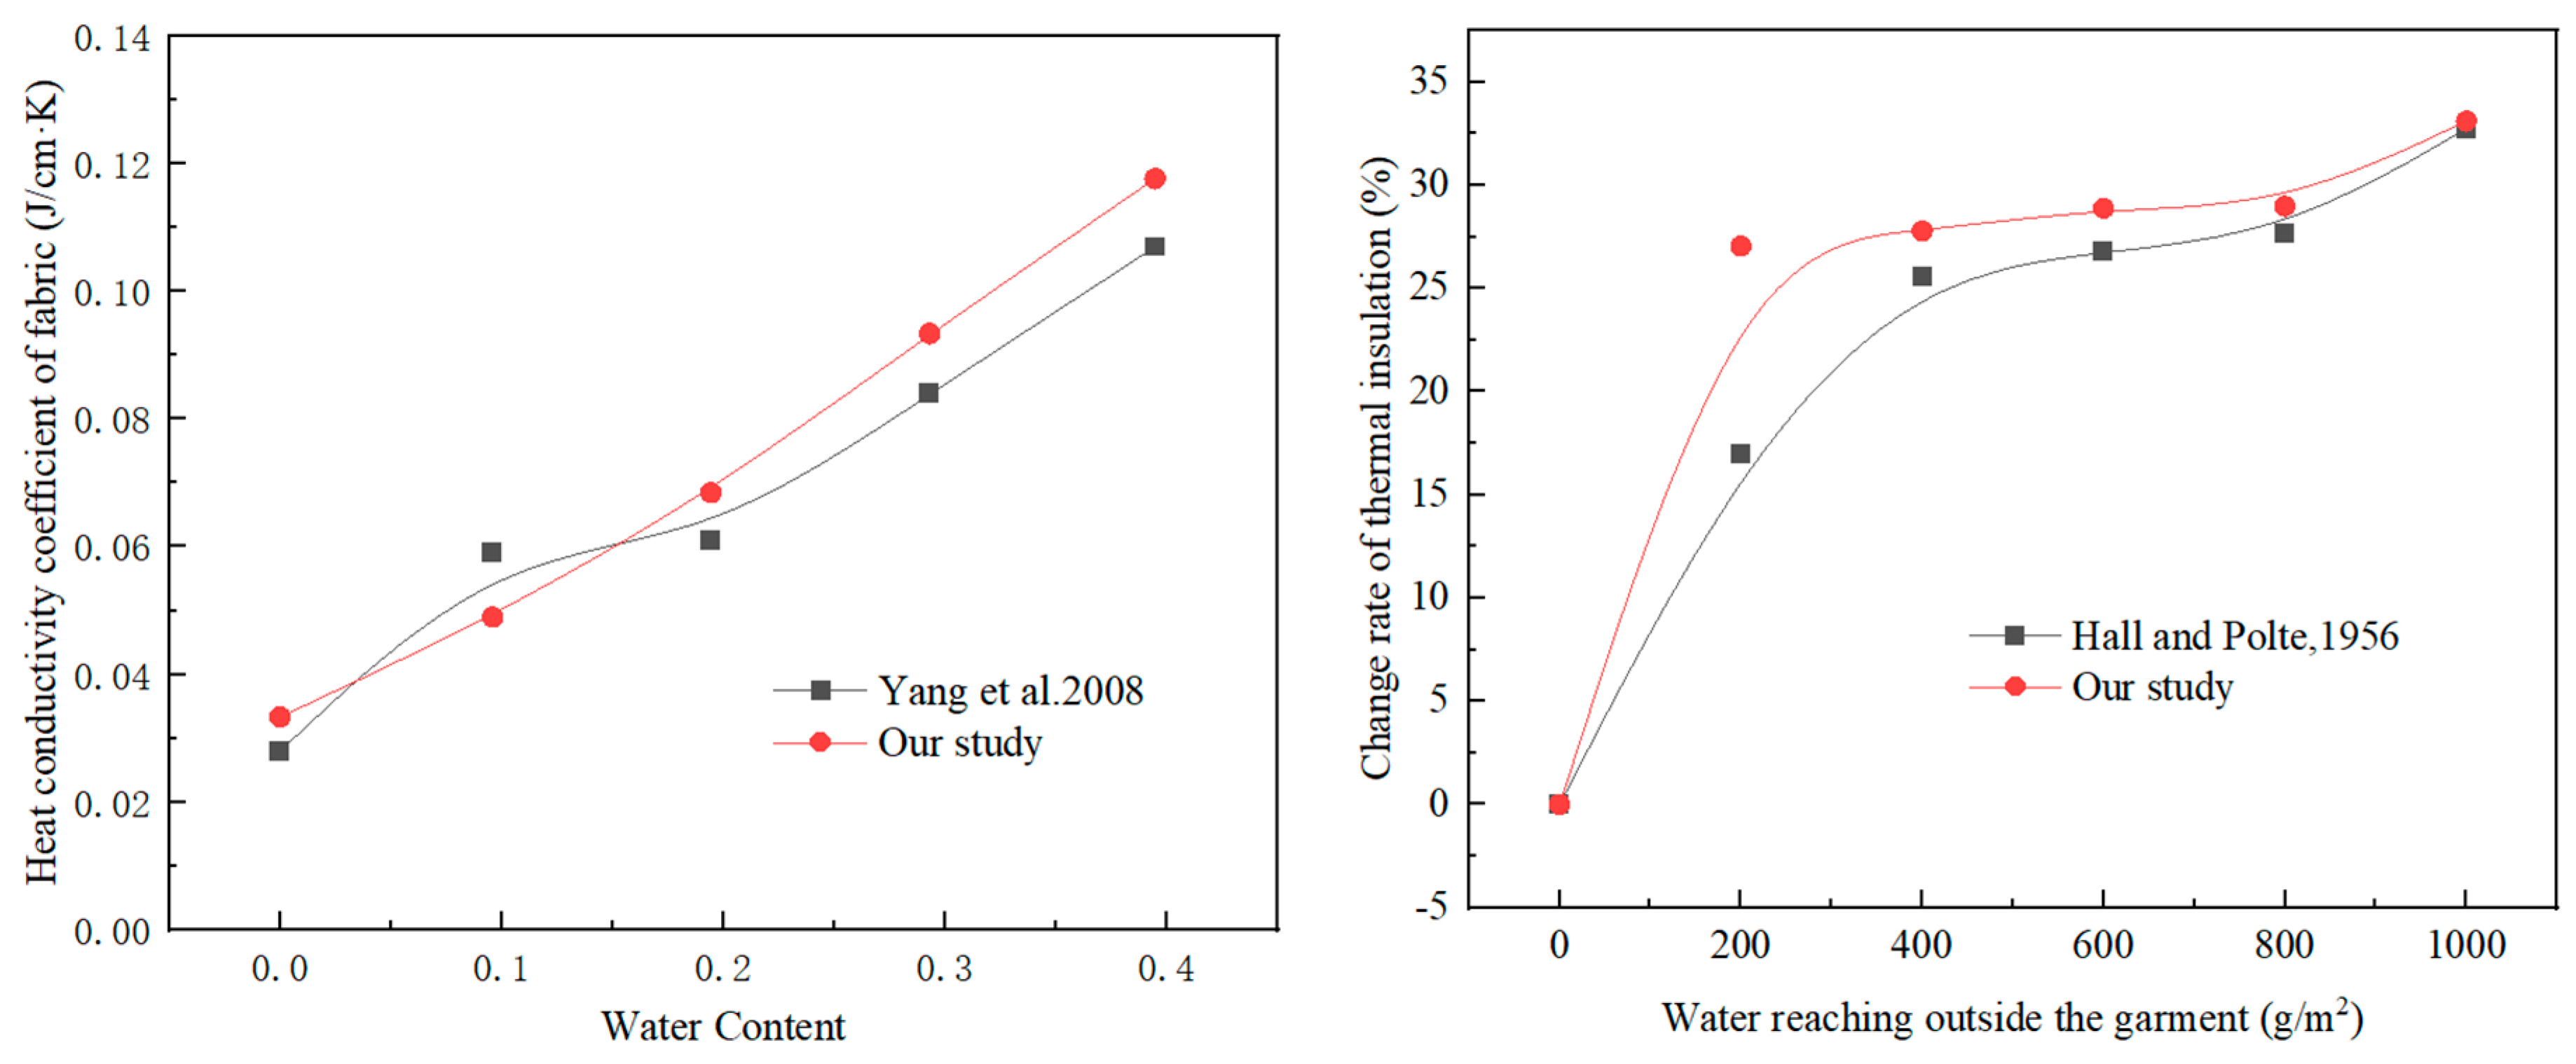
- Hall, J.R.J.F.; Polte, J.W. Effect of water content and compression on clothing insulation. J. Appl. Physiol. 1956, 8, 539–545. [Google Scholar] [CrossRef] [PubMed]
- Yang, X.Q.; Sun, Y.C.; Pei, Y.F. The influence of water containing rate on the thermal comfort of fabric. Prog. Text. Sci. Technol. 2008, 1, 61–63. [Google Scholar]
- Shapiro, Y.; Pandolf, K.B.; Goldman, R.F. Predicting sweat loss response to exercise, environment and clothing. Eur. J. Appl. Physiol. Occup. Physiol. 1982, 48, 83–96. [Google Scholar] [CrossRef] [PubMed]
- Wu, Q.Q.; Liu, J.H.; Zhang, L.; Zhang, J.W.; Jiang, L.L. Effect of temperature and clothing thermal resistance on human sweat at low activity levels. Build. Environ. 2020, 183, 107117. [Google Scholar]
- Mehnert, P.; Bröde, P.; Griefahn, B. Gender-related difference in sweat loss and its impact on exposure limits to heat stress. Int. J. Ind. Ergonom. 2002, 29, 343–351. [Google Scholar] [CrossRef]
- Yang, X.J.; Han, Q.Y.; Pang, J.W.; Shi, X.W.; Hou, D.J.; Liu, C. Progress of heat-hazard treatment in deep mines. Min. Sci. Technol. 2011, 21, 295–299. [Google Scholar]
- Zhu, N.; Chong, D. Evaluation and improvement of human heat tolerance in built environments: A review. Sustain. Cities Soc. 2019, 51, 101797. [Google Scholar] [CrossRef]
- Zou, S.H.; Li, K.Q.; Han, Q.Y.; Yu, C.W. Numerical simulation of the dynamic formation process of fog-haze and smog in transport tunnels of a hot mine. Indoor Built Environ. 2017, 26, 1062–1069. [Google Scholar] [CrossRef]

| Intelligent Mining Faces | Workers (People/8 h) | |
|---|---|---|
| Traditional Mining | Intelligent Mining | |
| 1306 mining face, Licun Coal mine | 28 | 16 |
| 1001 mining face, Huangling 1# Coal mine | 11 | 3 |
| 1008 mining face, Fumei Coal mine | 12 | 5 |
| 5# Xiangshan Coal mine | 25 | 10 |
| 214,201 mining face, Hanjiawan Coal mine | 15 | 6 |
| 7302 mining face, Yanzhou Coal mine | 25 | 7 |
| 74,104 mining face, Zhangshuanglou Coal mine | 16 | 5 |
| Occupations | Metabolic Rate (W/m2) | Traditional Mining | Intelligent Mining |
|---|---|---|---|
| Inspector | 160 | √ | √ |
| Driver | 160 | √ | √ |
| Maintenance engineer | 160 | √ | √ |
| Coal cleanup workers | 300 | √ | × |
| Workers at the head and tail of coal-cutter | 250 | √ | × |
| Workers for the hydraulic supports | 250 | √ | × |
| Country | Environmental Conditions |
|---|---|
| China | When the DBT exceeds 30 °C, production must be stopped. |
| United States | Upper WBT of 30 °C for unimpaired performance on sedentary tasks and 28 °C for moderate levels of physical work. |
| Australia | WBT ≤ 28 °C |
| France | Synthesizing temperature < 28 °C |
| Germany | 1. When DBT > 28 °C or ET > 25 °C
|
| Great Britain | When the ET exceeds 28 °C, the working time would be no longer than 1.5 h. |
| Semi-mechanization working face: ET ≤ 27.2 °C; Mechanized working face: ET ≤ 28.3 °C ET ≤ 30.0 °C: light levels of physical work; ET ≤ 28.0 °C: moderate levels of physical work; ET ≤ 26.5 °C: heavy levels of physical work. | |
| Poland | When DBT > 26 °C, the workload should be reduced by 4%; DBT > 28 °C, working time should be no longer than 6 h; DBT > 33 °C, only ambulance work is allowed. |
| India, Italy | DBT ≤ 32 °C |
| Japan | DBT ≤ 30 °C in the mining face and 31 °C for heading face. |
| South Africa | WBT ≤ 27.5 °C |
| Former Soviet Union | When RH ≥ 90%, the allowable DBT was 25 °C if air velocity was larger than 2 m/s and no more than 24 °C if the air velocity was smaller than 1 m/s. |
| Material | Fabric Insulation (m2∙KW−1) | Fabric Surface Density (g/m2) | Thickness/mm |
|---|---|---|---|
| Denim/twill weave | 0.023 | 206 | 0.8 |
| Clothing Ensemble | Iclu/clo |
|---|---|
| Briefs | 0.04 |
| Long sleeves | 0.16 |
| Work pants | 0.24 |
| Socks | 0.02 |
| shoes | 0.02 |
| Cap | 0.01 |
| Clothing | Walking Speed (m/s) | Treadmill Grade (%) | Sweat Loss (g/(m2·h)) | Predicted Sweat Loss (g/(m2·h)) | Error Rate (%) |
|---|---|---|---|---|---|
| Fatigue | Rest | - | 198 ± 15 | 193.94 | 2.05% |
| Fatigue | 1.34 | 0 | 580 ± 31 | 540.44 | 6.82% |
| Fatigue | 1.34 | 5 | 691 ± 41 | 644.76 | 6.69% |
| Shorts | Rest | - | 164 ± 16 | 156.69 | 4.46% |
| Shorts | 1.34 | 0 | 386 ± 43 | 415.89 | 7.74% |
| Shorts | 1.34 | 5 | 556 ± 23 | 594.58 | 6.94% |
| Clothing | Walking Speed (m/s) | Sweat Loss (g/(m2·h)) | Predicted Sweat Loss (g/(m2·h)) | Error Rate (%) | |
|---|---|---|---|---|---|
| Still conditions | 0.56 | 0 | 28 | 30.45 | 8.76% |
| 0.6 | 0 | 35 | 38.45 | 9.86% | |
| 0.68 | 0 | 50 | 50.65 | 1.29% | |
| Activity 1 | 0.56 | 0.8 | 38 | 41.69 | 9.72% |
| 0.6 | 0.8 | 43 | 43.04 | 0.10% | |
| 0.68 | 0.8 | 52 | 54.62 | 5.04% | |
| Activity 2 | 0.56 | 1.2 | 53 | 57.69 | 8.86% |
| 0.6 | 1.2 | 59 | 58.96 | 0.06% | |
| 0.68 | 1.2 | 70 | 69.60 | 0.58% |
| Parameters | Experiment 1 | Experiment 2 |
|---|---|---|
| Number of subjects | 58 | 56 |
| Ta (°C) | 32 | 25 |
| RH (%) | 50–55 | 50–55 |
| Icl | 0.6 | 0.85 |
| Total sweat loss (g/m2) | 261 | 232 |
| Predicted sweat loss (g/m2) | 264 | 221 |
| Error rate (%) | 1.2% | 4.7% |
| Calculating Parameters | Values |
|---|---|
| Weight/kg | 65 |
| Height/m | 1.72 |
| Mexp/W/m2 | 160 |
| Icl0/clo | 0.57 |
| DBT/°C | 16–50 |
| RH/% | 60–95 |
| Air speed u/m/s | 1–4 |
| Walking Speed Wa/m/s | 1 |
| Duration/minutes | 480 |
| Coal Mine | Work Shift | Resting Time/Minutes |
|---|---|---|
| Hongyang 3# Coal Mine | Three eight-hour shifts | 30 |
| Dongqu Coal Mine | Four six-hour shifts | 0 |
| Jinggong Coal Mine | Three eight-hour shifts | 20–30 |
| Longwanggou Coal Mine | Three eight-hour shifts | 30 |
| Liuyuanzi Coal Mine | Three eight-hour shifts | ≤25 |
| Hecaogou Coal Mine | Three eight-hour shifts | 30 |
| Zhangshuanglou Coal Mine | Three eight-hour shifts | almost 30 |
| Jiahe Coal Mine | Three eight-hour shifts | almost 30 |
| Zhangxiaolou Coal Mine | Three eight-hour shifts | almost 30 |
| Sanhejian Coal Mine | Three eight-hour shifts | almost 30 |
| Zhangji Coal Mine | Three eight-hour shifts | almost 30 |
| Zhouyuanshan Coal Mine | Three eight-hour shifts | almost 30 |
| Source | Type III Sum of Squares | Degrees of Freedom | Mean Square | F | Salience |
|---|---|---|---|---|---|
| Corrected model | 5197 | 20 | 259.8 | 230 | 0.000 |
| Intercept | 29,256 | 1 | 29,256 | 25,921 | 0.000 |
| DBT | 4816 | 6 | 802.7 | 713.5 | 0.000 |
| RH | 625 | 4 | 156.3 | 139.5 | 0.000 |
| Wind speed | 798 | 5 | 159.6 | 145.4 | 0.000 |
| Error | 995 | 911 | 1.1 | ||
| Total | 41,687 | 895 | |||
| Corrected total | 7145 | 893 |
| DBT (°C) | Equipment Load (W) | Staff Load (kW) | Ventilation Load (kW) | Surrounding Rock Heat Dissipation (W) | Total Sensible Heat Load (kW) |
|---|---|---|---|---|---|
| 26 | 1200 | 1.2 | 253.10 | 11,022.88 | 264.57 |
| 27 | 1200 | 1.2 | 230.90 | 9795.02 | 241.30 |
| 28 | 1200 | 1.2 | 208.70 | 8567.16 | 217.63 |
| 29 | 1200 | 1.2 | 186.49 | 7339.30 | 194.20 |
| 30 | 1200 | 1.2 | 164.29 | 6111.44 | 170.77 |
| 31 | 1200 | 1.2 | 142.09 | 4883.58 | 147.34 |
| RH (%) | Personnel Loose Moisture (W) | Ventilation Latent Heat Load (kW) | Moisture Loss of Surrounding Rock (kW) | Total Latent Heat Load (kW) |
|---|---|---|---|---|
| 60 | 0.26 | 129.61 | 3.97 | 136.51 |
| 65 | 0.26 | 113.73 | 3.47 | 119.80 |
| 70 | 0.26 | 97.76 | 2.98 | 103.00 |
| 75 | 0.26 | 81.70 | 2.48 | 86.10 |
| 80 | 0.26 | 65.54 | 1.98 | 69.11 |
| 85 | 0.26 | 49.29 | 1.49 | 52.03 |
| 90 | 0.26 | 32.94 | 0.99 | 34.86 |
| 95 | 0.26 | 16.50 | 0.50 | 17.58 |
Disclaimer/Publisher’s Note: The statements, opinions and data contained in all publications are solely those of the individual author(s) and contributor(s) and not of MDPI and/or the editor(s). MDPI and/or the editor(s) disclaim responsibility for any injury to people or property resulting from any ideas, methods, instructions or products referred to in the content. |
© 2023 by the authors. Licensee MDPI, Basel, Switzerland. This article is an open access article distributed under the terms and conditions of the Creative Commons Attribution (CC BY) license (https://creativecommons.org/licenses/by/4.0/).
Share and Cite
Han, Q.; Lin, D.; Yang, X.; Li, K.; Yin, W. Thermal Environment Control at Deep Intelligent Coal Mines in China Based on Human Factors. Sustainability 2023, 15, 3193. https://doi.org/10.3390/su15043193
Han Q, Lin D, Yang X, Li K, Yin W. Thermal Environment Control at Deep Intelligent Coal Mines in China Based on Human Factors. Sustainability. 2023; 15(4):3193. https://doi.org/10.3390/su15043193
Chicago/Turabian StyleHan, Qiaoyun, Debo Lin, Xiaojie Yang, Kongqing Li, and Wei Yin. 2023. "Thermal Environment Control at Deep Intelligent Coal Mines in China Based on Human Factors" Sustainability 15, no. 4: 3193. https://doi.org/10.3390/su15043193
APA StyleHan, Q., Lin, D., Yang, X., Li, K., & Yin, W. (2023). Thermal Environment Control at Deep Intelligent Coal Mines in China Based on Human Factors. Sustainability, 15(4), 3193. https://doi.org/10.3390/su15043193


