Article

Experimental Study on Fan Aerodynamic Noise Variation Characteristics under Non-Proportional Variation Law

1
School of Resource & Environment and Safety Engineering, Hunan University of Science and Technology, Xiangtan 411201, China
2
Hunan Mine Ventilation and Dust Removal Equipment Engineering Technology Research Center, Xiangtan 411100, China
3
Tunnel Design Branch, China Railway Liuyuan Group Co., Ltd., Tianjin 300133, China
*
Author to whom correspondence should be addressed.
Sustainability 2023, 15(3), 2025; https://doi.org/10.3390/su15032025
Submission received: 29 November 2022 / Revised: 14 January 2023 / Accepted: 17 January 2023 / Published: 20 January 2023

Abstract

:
This paper presents the noise characteristics of axial fans in the process of variable frequency adjustment, so as to clarify the basis of frequency adjustment and high-risk area division for practical purposes. In the aerodynamic performance experiment, 11 kinds of operating conditions (OC) were divided into 3 groups, and the air flow rate and power consumption were measured. At the same time, an aerodynamic noise experiment was carried out, and nine measuring points were selected to test the noise of the air inlet and shell. The data showed that the aerodynamic performance parameters have the characteristics of non-proportional law. The maximum ventilation coefficient of OC2, OC7, OC11 is 3.9%, and its noise always has a negative growth rate. Furthermore, the typical OC were selected from all experiments, and broadband noise and discrete noise analyses were performed. The results indicated that the fan noise of the changes under variable frequency adjustment may come from boundary layer noise and shedding noise. In addition, the fundamental frequency sound pressure level of discrete noise is the highest in the whole frequency band. At the high-speed condition, the contribution of higher harmonics to the fan overall noise increases, but the broadband noise is still the dominant noise. Finally, the noise rating was introduced, and the high-risk noise index was divided for the noise of the air inlet and the shell. It was found that the main noise variation index of typical OC mostly exceeded the high-risk noise index, and the main target frequency band of noise control is 250–4000 Hz.

1. Introduction

The difficulty of tunneling is affected by the geographical environment. Mountainous areas have higher requirements for the ventilation system of highway tunnels under construction [1]. In tunnel construction, the ventilation method can be used in forced ventilation types, exhaust ventilation types, mixed ventilation types, and so on [2]. The longer the distance of tunnel excavation, the greater the ventilation resistance; therefore, high-power fans are used in engineering sites, but they produce high-decibel noise. The working state of fans can be adjusted to the actual demand of the tunnel, which can save energy and control noise. Obviously, it is important to study the adjustable basis and its noise characteristics.
The first thing to study is the ventilation performance in confined spaces and environments. The performance evaluation of a general fan mainly focuses on flow, power, and noise [3,4,5]. The study of non-proportional variation law provides an estimated method for the energy-saving rate, which is an important branch of fan energy-saving research [6,7,8]. Studying the noise of an axial fan, A. Maaloum et al. [9] found that the noise is mainly affected by the broadband noise in the intake zone. Takahiro Ito et al. [10] conducted a study on a small axial fan, and broadband noise components were increased. Furthermore, discrete noise frequency components were decreased by increasing the blade clearance. Compared with two different blade tips, Jang [11] found that broadband noise was related to the backflow zone formed by the tip leakage vortex shedding.
Furthermore, scholars have investigated fan aerodynamic noise prediction [12,13]. H. Posson et al. [14] proposed a broadband noise model for predicting the interaction between turbulence and fan rotors. Combining aeroacoustics with the boundary element method, Bin-bin Hu et al. [15] proposed a thin-body boundary element method for predicting the far-field sound pressure level (SPL) of noise. At 400 to 2000 Hz, Alessandro Zanon et al. [16] introduced that the main source of broadband noise was the boundary layer scattering at the trailing edge and the interaction of the tip vortex with the blade trailing edge, and at a frequency above 2000 Hz, the front portion of the blade suction side was the primary noise source, and its intensity was found to depend on the inflow turbulence. On the other hand, Luo et al. [17] studied the effect of blade tip clearance on aerodynamic noise and found that low-frequency broadband noise below 600 Hz was mainly affected by the blade tip vortex and the boundary layer, whereas above 1200 Hz, turbulent boundary layer fluctuations mainly caused the broadband noise.
The structure of a fan also effects noise and performance. For example, C. Scheit et al. [18] conducted numerical simulation and experimental research on the sound of the impeller, and the study found that the aerodynamic efficiency and sound radiation could be balanced by changing the wrap angle.The optimization of the blade tip structure can improve fan perforance and reduce noise [19]. The type of blade tilt affects the noise. The study found that unsteady flow characteristics in the area of the blades led to an increase in turbulent intake noise [20].
There are few research studies on the noise characteristics and energy consumption of fans under variable frequency adjustment. In the construction site of a highway tunnel, the ventilation system adopts frequency conversion to meet site requirements, which is the minimum air volume limit of the environmental maintenance device and humans [21,22]. On the premise of meeting the demand for air volume inside the tunnel, the speed of the fan can be reduced to reach the economic and technical velocity. Long-term use of the scheme can reduce the scale of highway investment, save environmental energy [23], reduce carbon emissions [24], and protect the occupational health of operators. This paper takes the fan sound field as the main problem in order to study the broadband and discrete noise characteristics of pipeline fans, and the high-risk index of different regions of the fan is analyzed. The noise characteristics study is intended to strengthen occupational health protection.

2. Fan Noise Source

2.1. Aerodynamic Noise

Aerodynamic noise is a main type of fan noise. It is considered to be the characteristics of the noise in the spectrum, and it is divided into discrete noise and broadband noise [25,26]. The mechanism of discrete noise is that the air pressure pulsation caused by the periodic rotation of uniformly distributed blades hits the uneven flow field, so it is affected by the rotational speed and the number of blades. The sound intensity of the discrete noise is proportional to the 5–6th power of the circumferential speed of the impeller. At the same time, the periodically rotating blades are separated and broken to form a vortex, and the vortex produces broadband noise, which is mainly divided into the following points. (1) Incoming turbulence noise—interaction between surface shedding vortexes and blades. (2) Blade boundary layer noise—impeller shedding noise is generated by vortex separation at the blade interface, which can be divided into the turbulent boundary layer and laminar boundary layer. (3) Tip and inter-blade vortex noise—summarized as laminar vortex shedding noise, laminar boundary layer noise, turbulent boundary layer noise, and turbulent vortex shedding noise.

2.2. Mechanical Noise and Electromagnetic Noise

The vibration of the internal structure of the fan produces mechanical noise, and abnormal noise is caused by the friction vibration of long-term operation. Electromagnetic noise is the low frequency noise by the motor [27], and it is related to the electromagnetic field and electromagnetic load. Therefore, mechanical and electromagnetic noise can be effectively reduced by improving the manufacturing process.

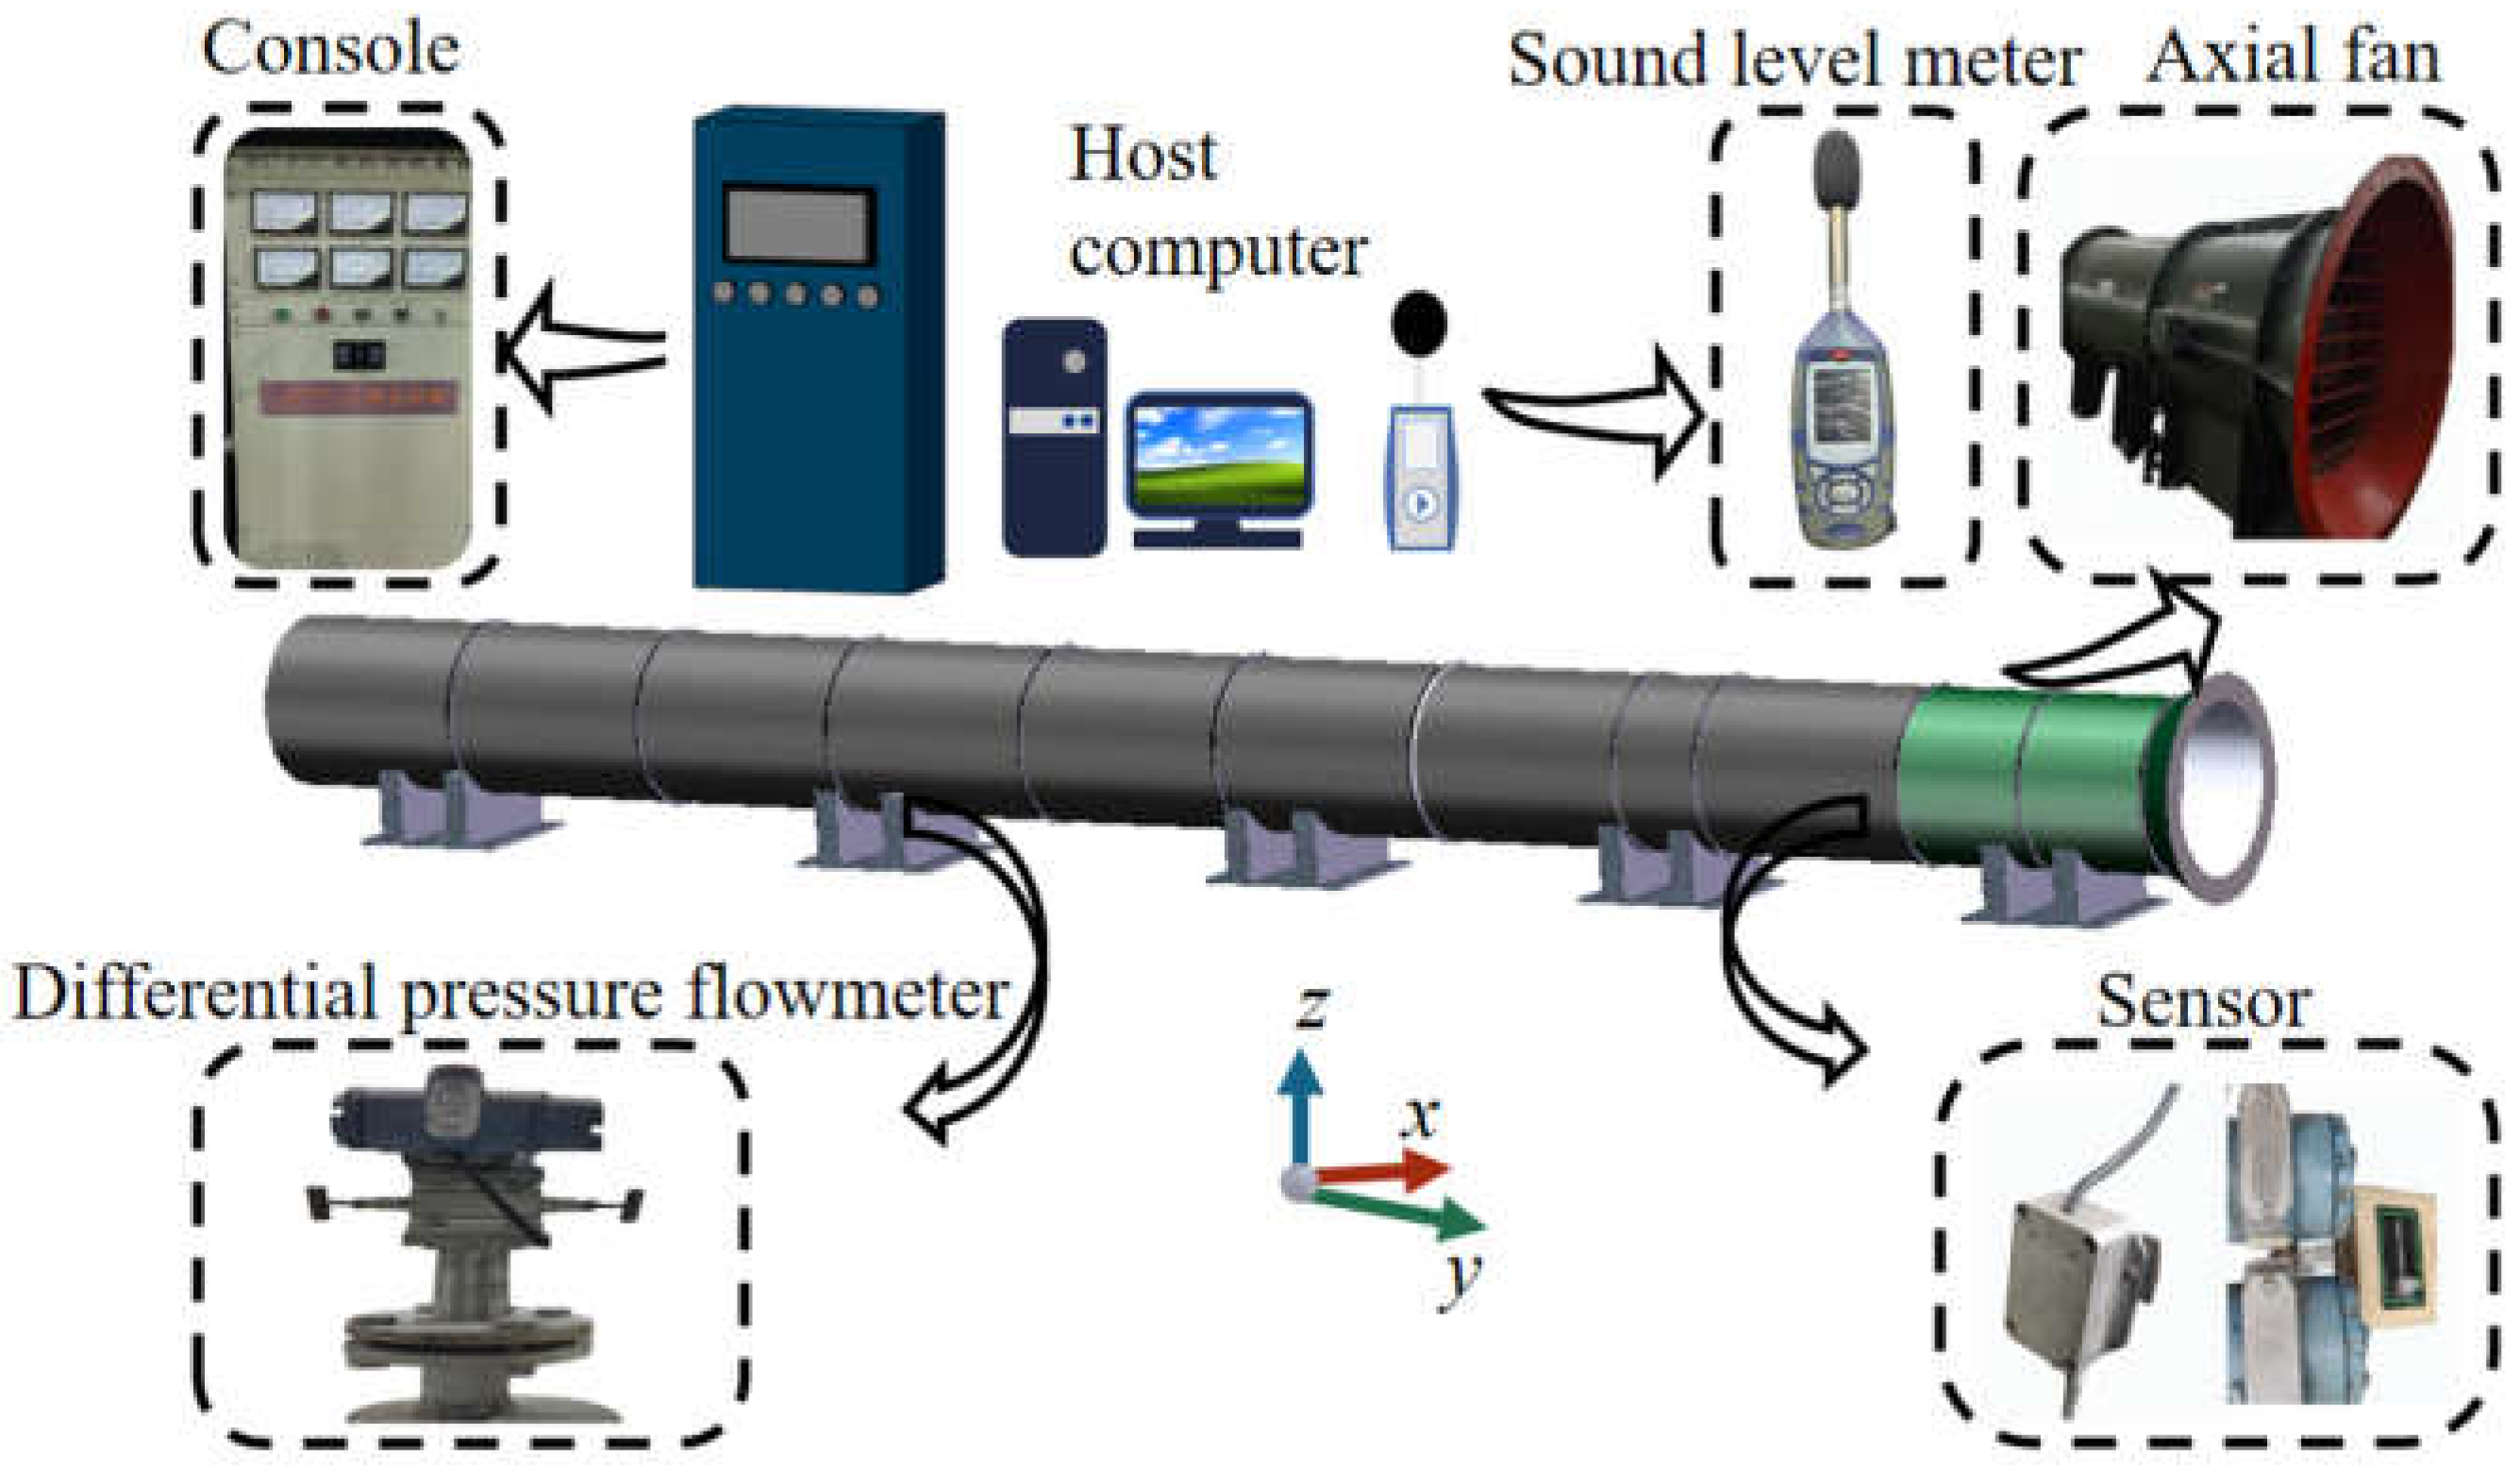
3. Experimental Device

3.1. Experimental System Setup

The experimental device is shown in Figure 1. The total length of the ventilation experimental system is 18.5 m. The ventilation system is composed of a power subsystem, control subsystem, and measurement subsystem. The power subsystem is mainly composed of an axial fan and flow collector. The type of fan is a K45 axial fan (Xiangtan Pingan Electric Co., Ltd., Xiangtan, China), the rated power is 18.5 kW, the air volume flowrate is 8.5~18.2 m3/s, the rotational speed is 1470 r/min, and the static pressure range is 350~950 Pa. The control subsystem is composed of a frequency conversion cabinet and variable-frequency drive. The control cabinet has two starting modes: power frequency start and frequency conversion start. This paper conducts experimental measurements for variable frequency conditions.
The measurement subsystem is mainly used for real-time data transmission for the fan, comprising data cables and sensors. The sensors mainly include a differential pressure flowmeter and a rotary speed sensor. The flowmeter type is LJC-1000-114400 (Hunan Lijia instruments Co., Ltd., Changsha, China), with a range of 0~676 Pa and an error of ±1 m/s. The speed sensor adopts HMS-A-02, non-contact measurement, high resolution, a small error, large range, suitable for fan speed measurement. In addition, it also includes a pressure transmitter (TYPW HDK20, Viatran Corporation, Tonawanda, NY, USA), potential transformer, and current transformer. They all have low delay, high precision, and so on.
The ventilation system is equipped with a sound level meter CEL-63X (IDEAL INDUSTRIES, Inc., Bedford, UK). This instrument comprises one host, one windproof ball, one microphone, one amplifier, and a data cable. The measuring range is 20~140 dB(A) of SPL and 12.5~20,000 Hz of frequency. The accuracy of the equipment meets the requirements of experimental measurement and data processing software Casella Insight for sound pressure meter.

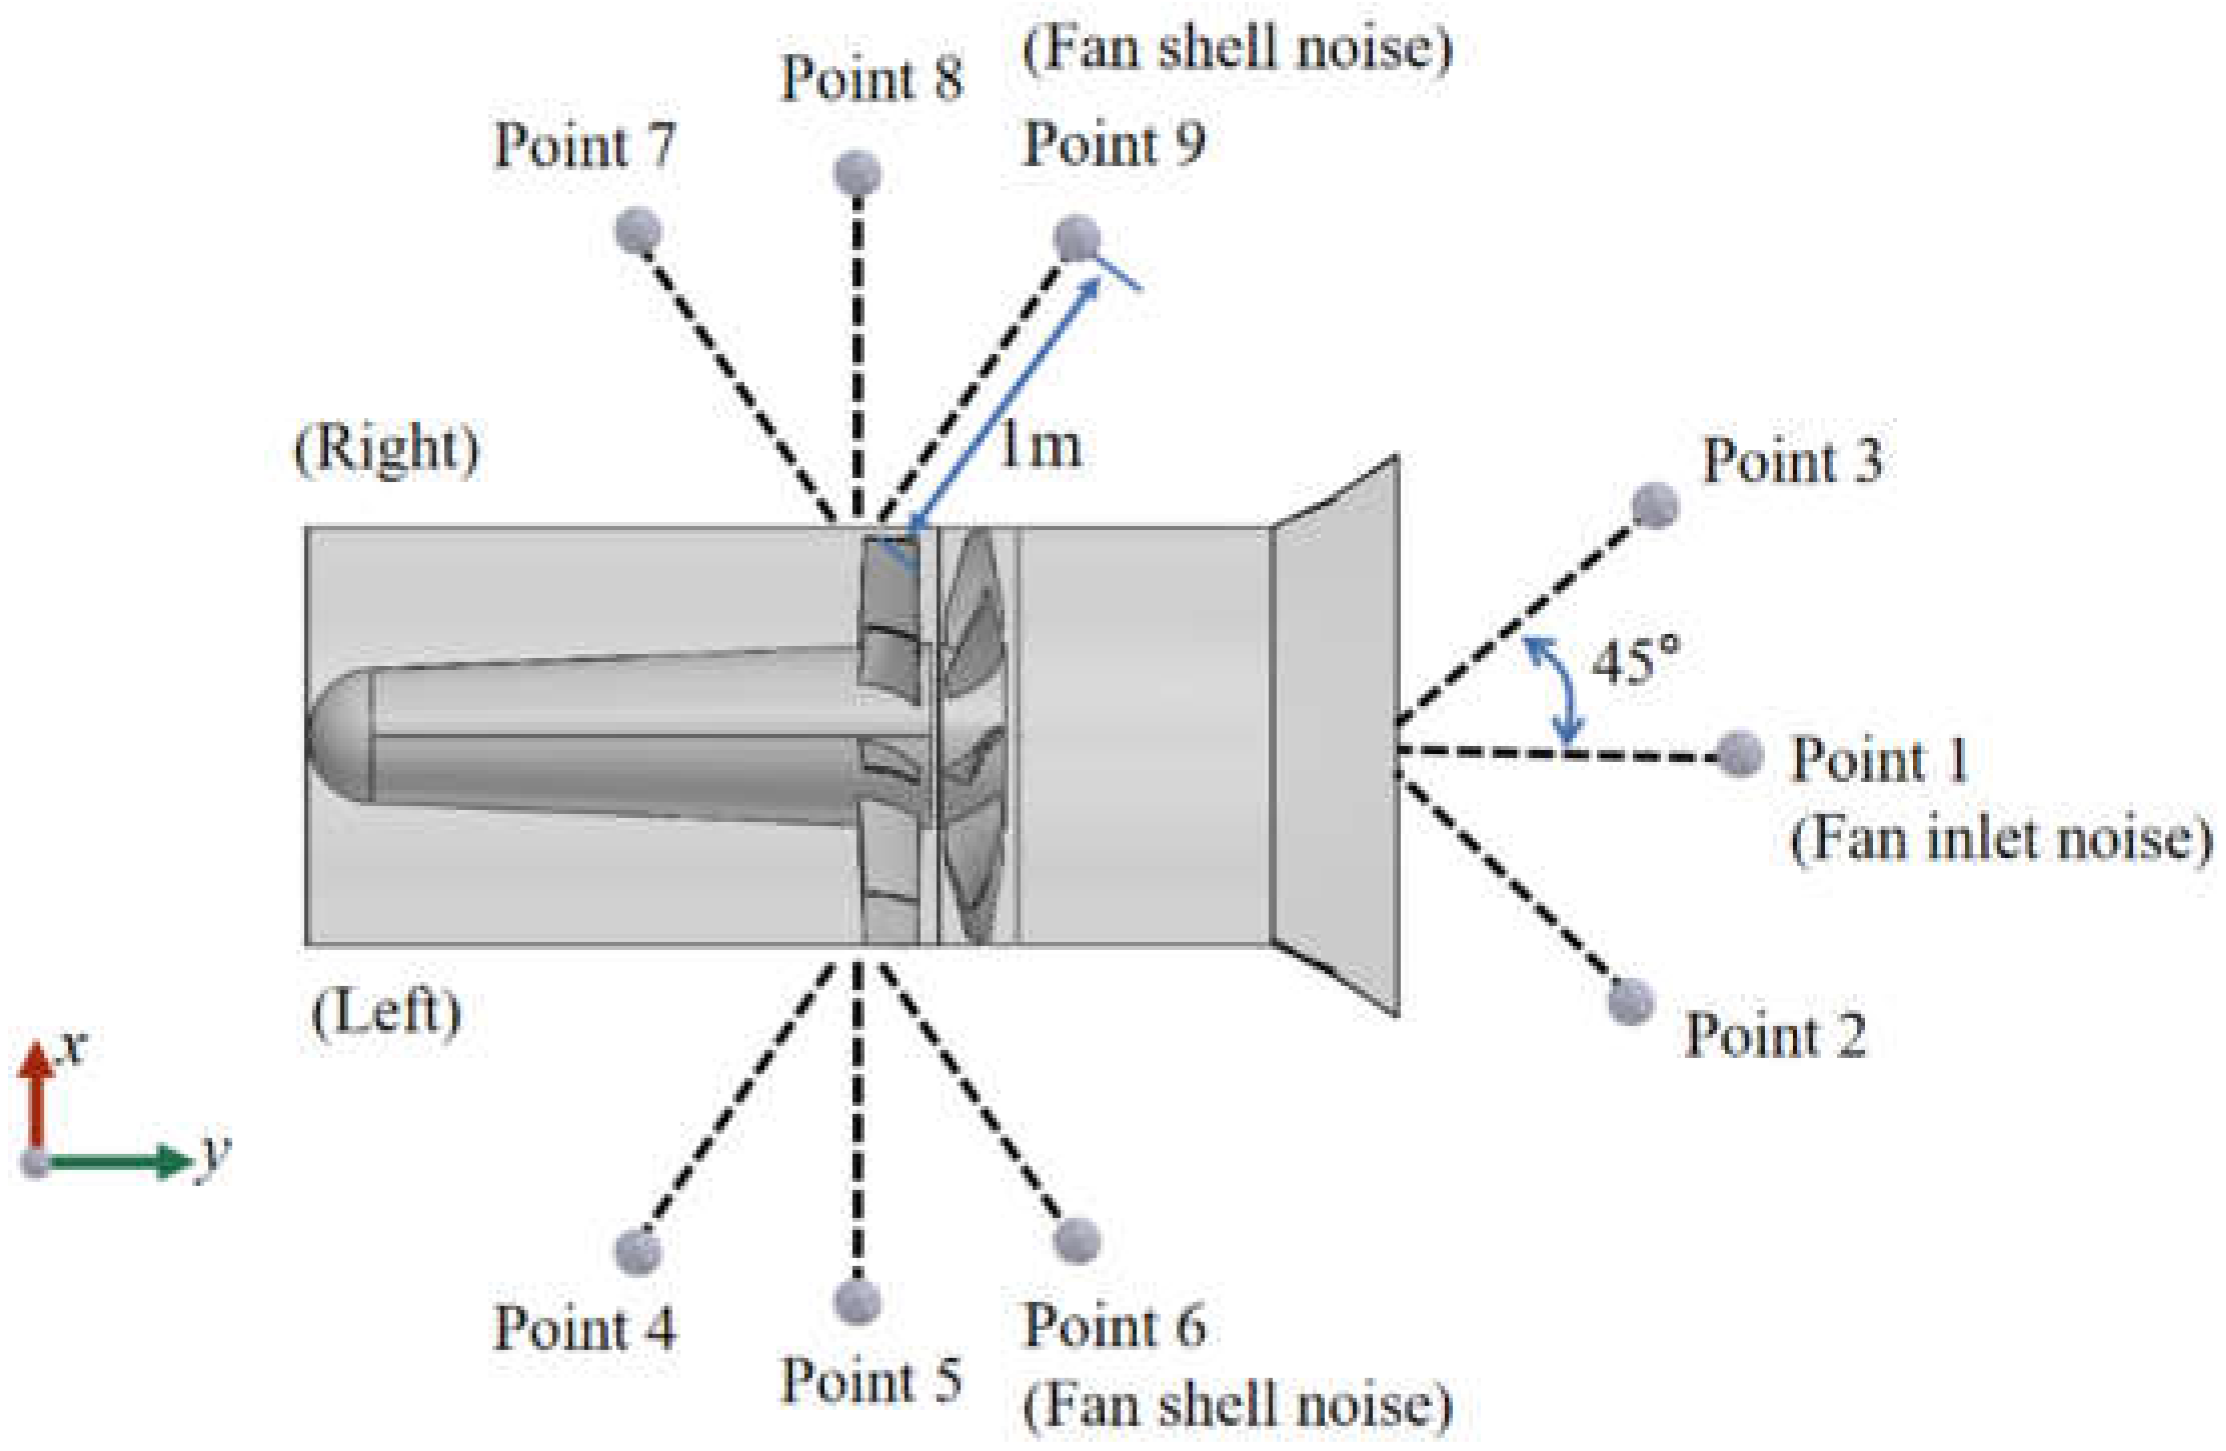
3.2. Measurements and Conditions

The noise measurement in this experiment refers to GB/T2888-2008 [28]. Nine distributed measuring points are selected and divided into two types: one is fan inlet noise measurement points, the other is the symmetrical shell noise measurement points, as shown in Figure 2. According to the serial number of the measuring points, the noise information is measured in sequence. The angle between each measuring point and the central axis of the fan is 45°, the distance is 1 m, the standard error of noise measurement sound level is 2 dB(A), and the sampling time is 15 s. The background noise in the experimental period is much less than the experimental noise. According to the relevant provisions of GB/T2888-2008, the measurement results do not need to be corrected.
In this paper, 11 operating conditions (OC) are set up. The environmental parameters of the test site are as follows: atmospheric pressure is 102.3 kPa, temperature is 8 °C, and humidity is 93%, and they are divided into the low rotation speed operation condition (Group A), medium rotation speeds operation condition (Group B), and high rotation speed operation condition (Group C). The specific OC are shown in Table 1. OC1 to OC11 indicate that the power supply frequency ranges from 25 to 50 Hz, and each group of OC is increased by 2.5 Hz, according to the serial number. It should be noted that 50 Hz means frequency conversion start 50 Hz, not power frequency start.

4. Results and Discussion

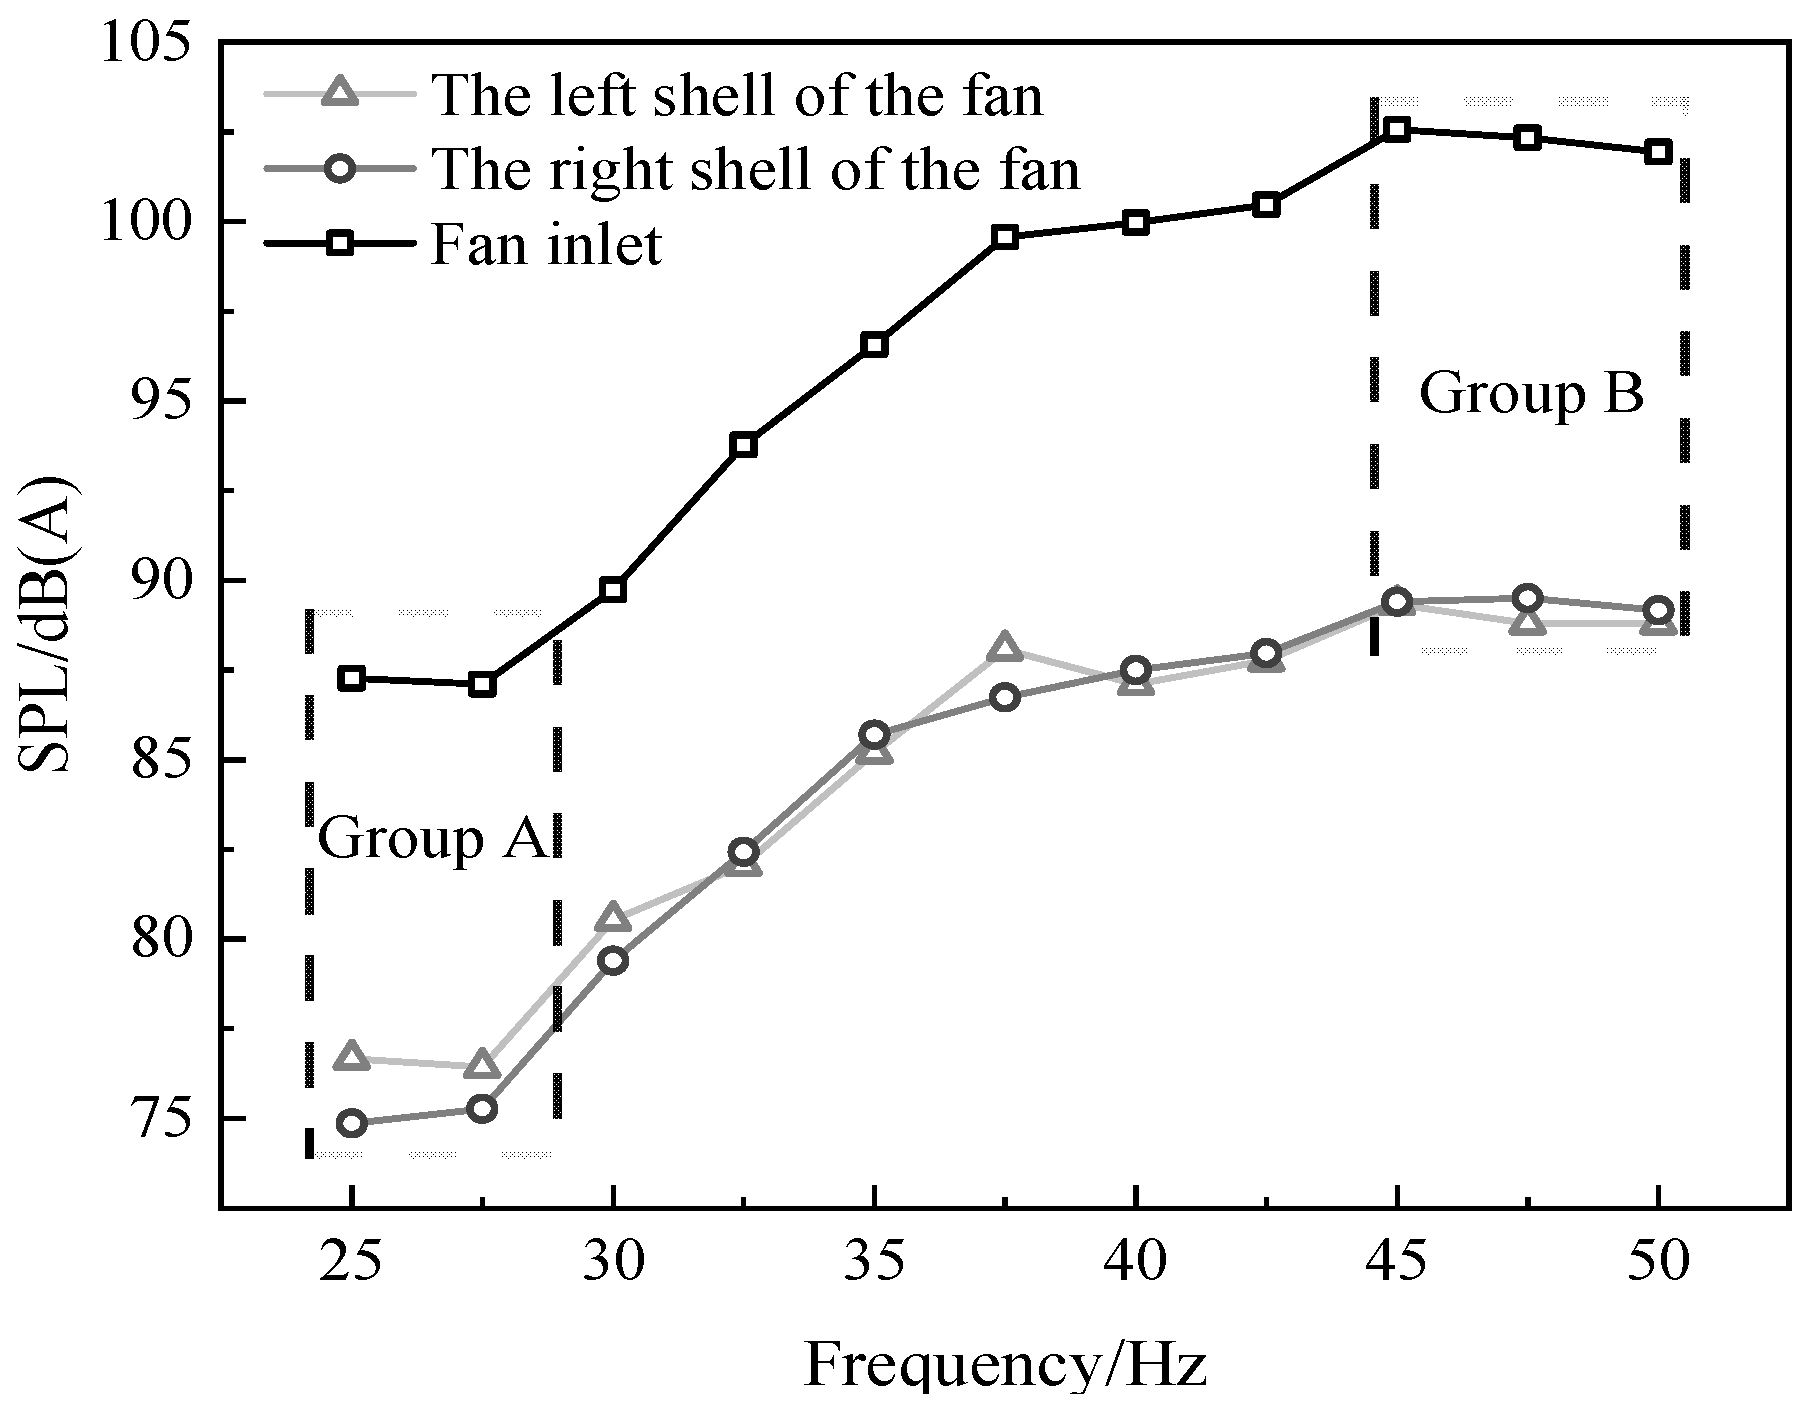
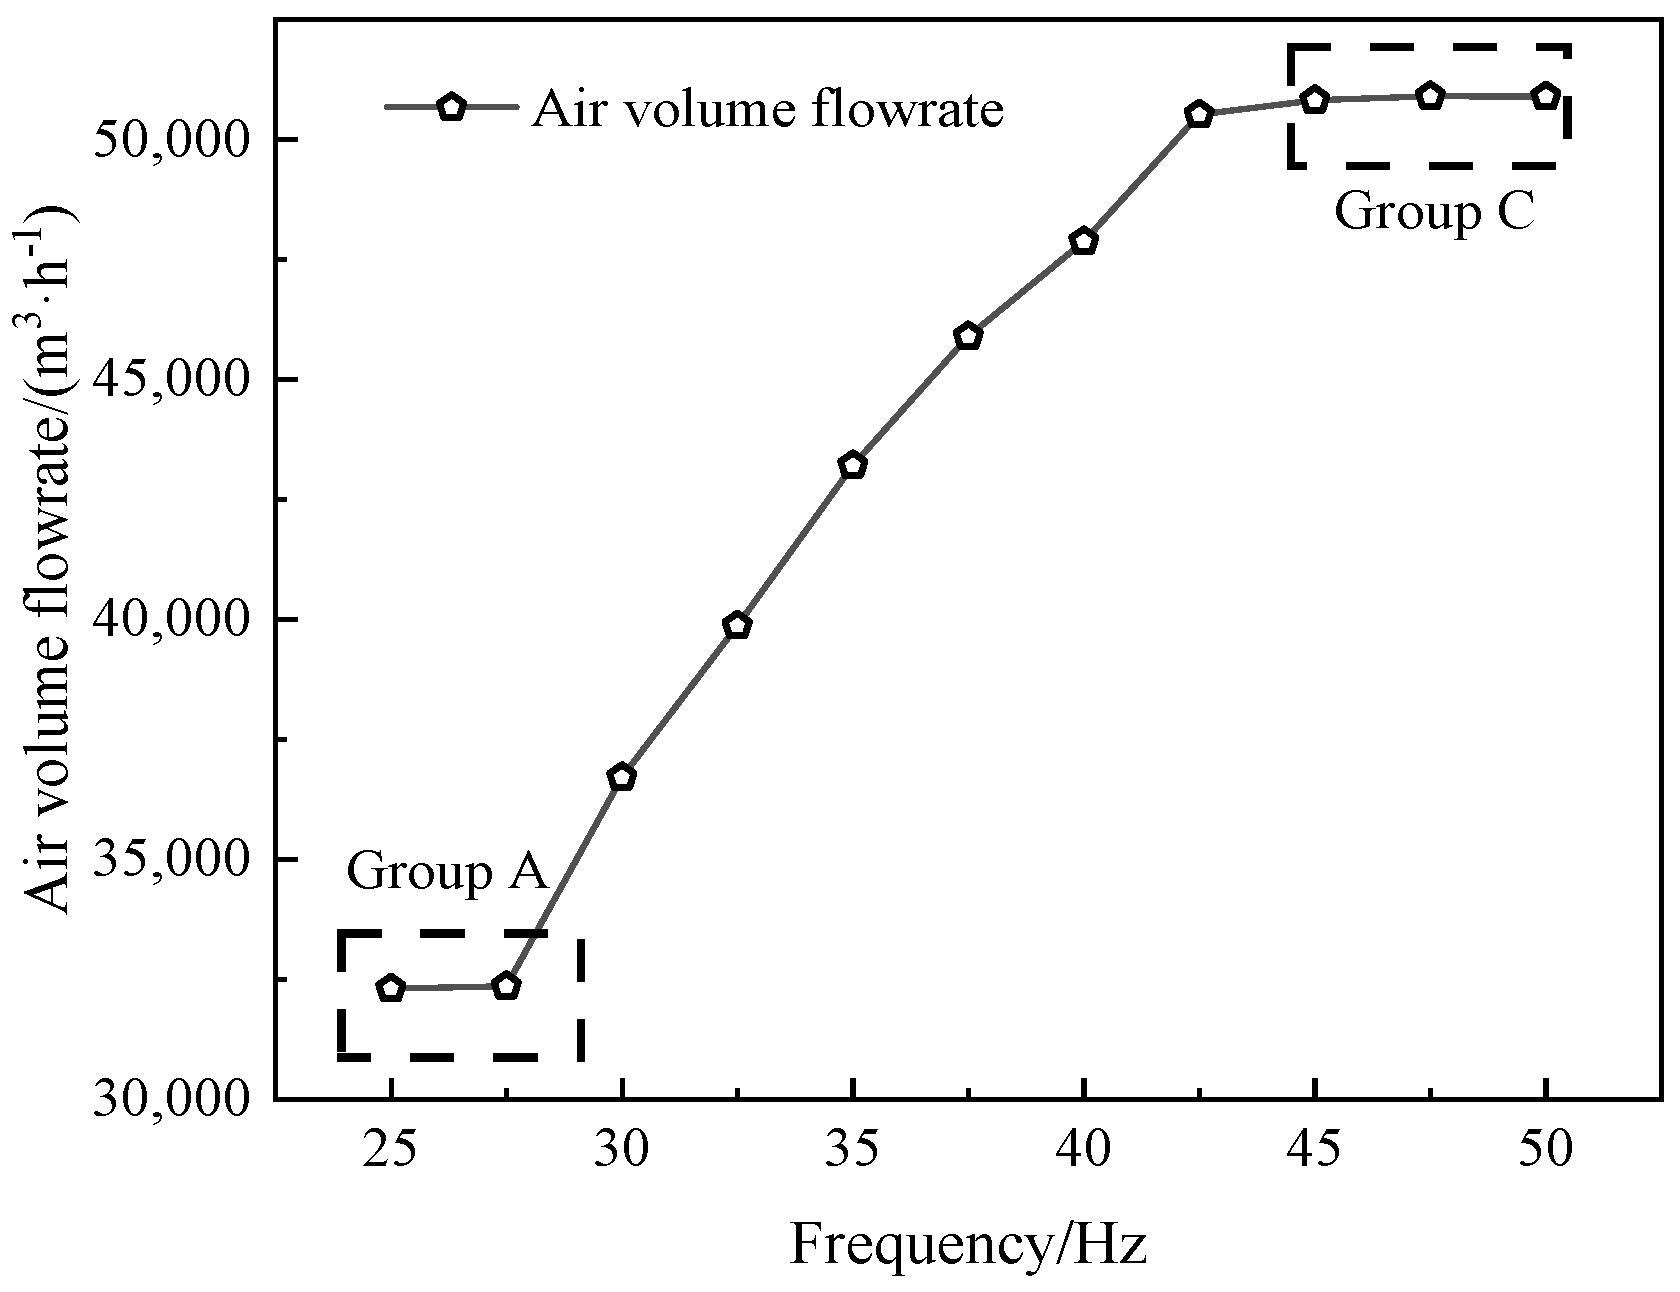
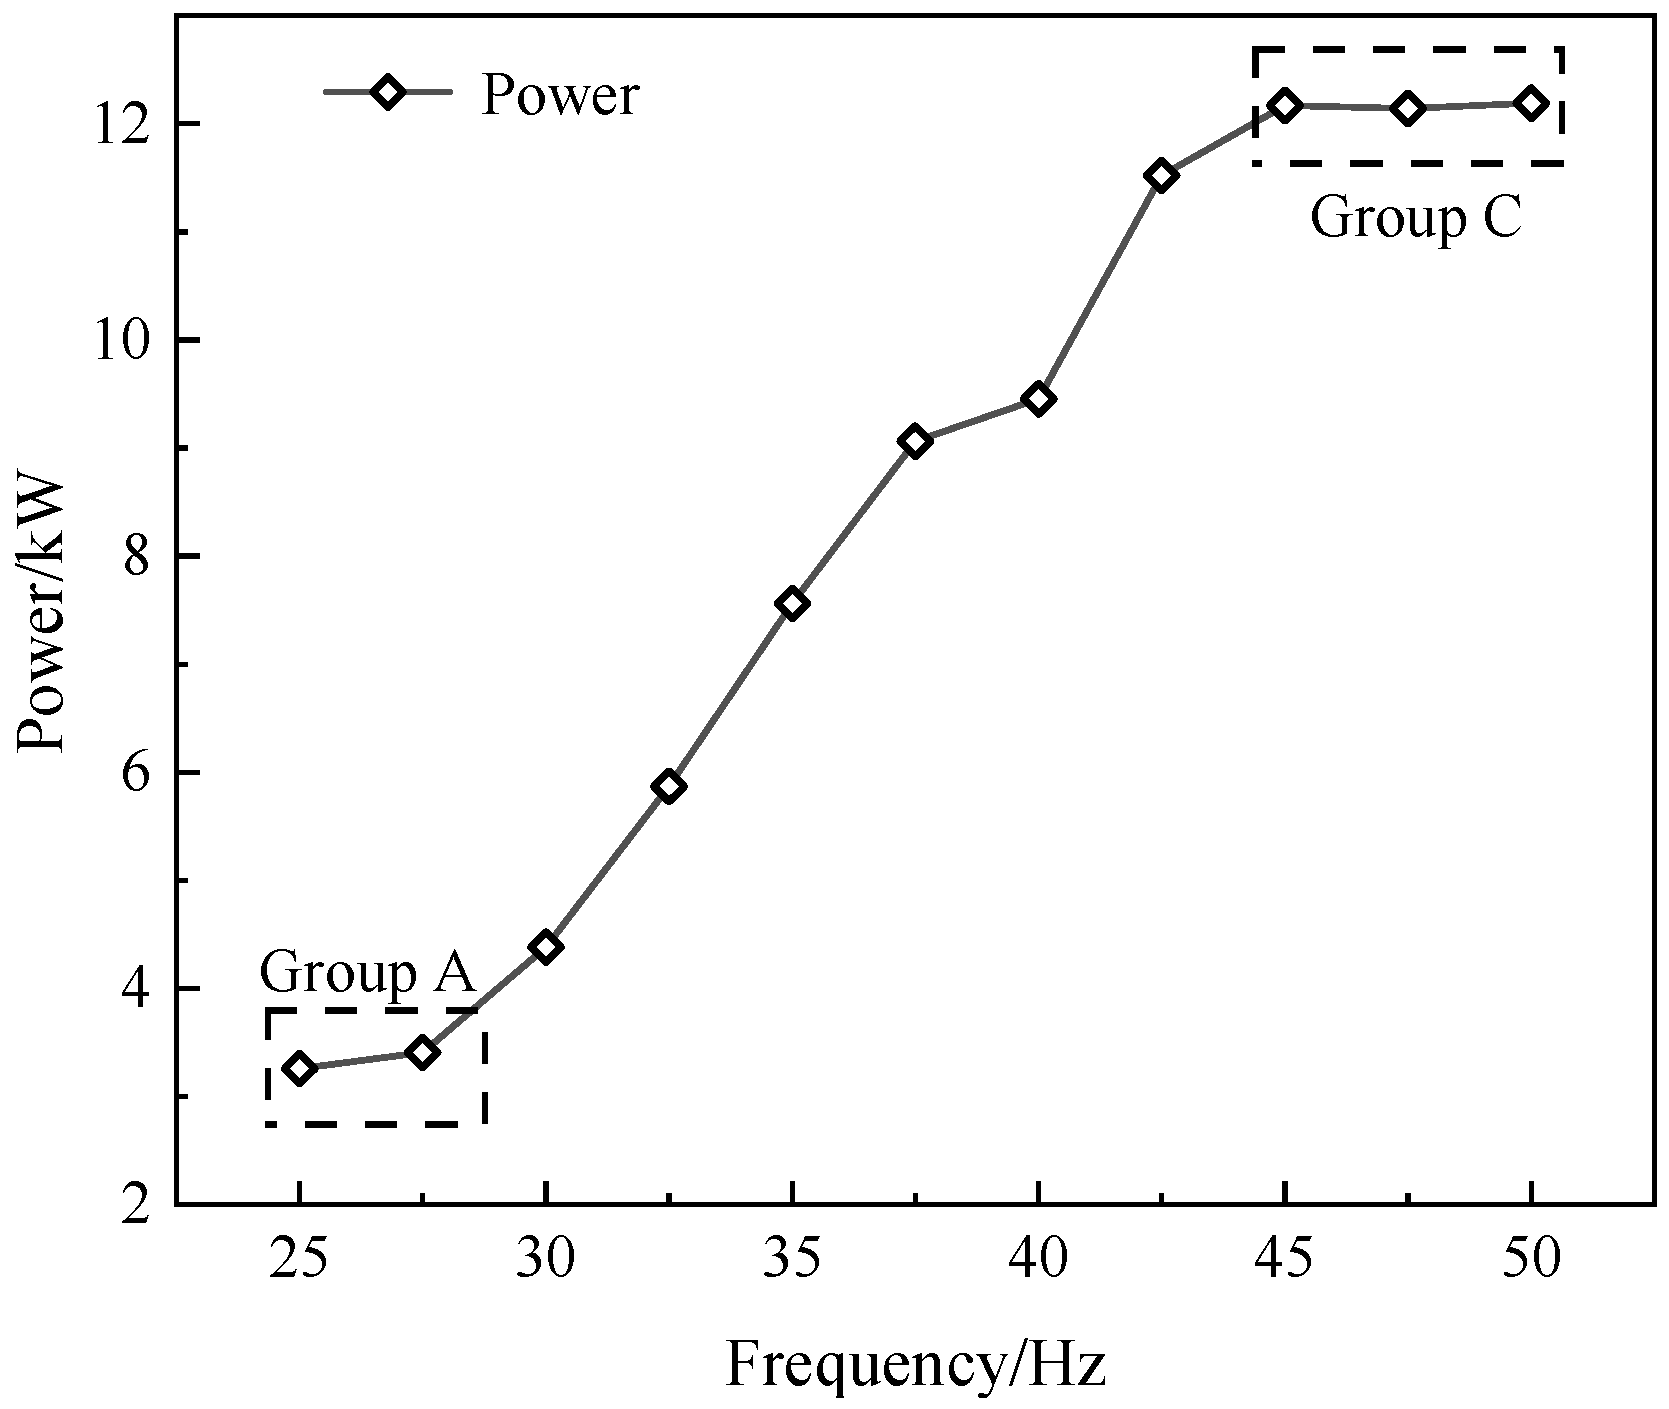
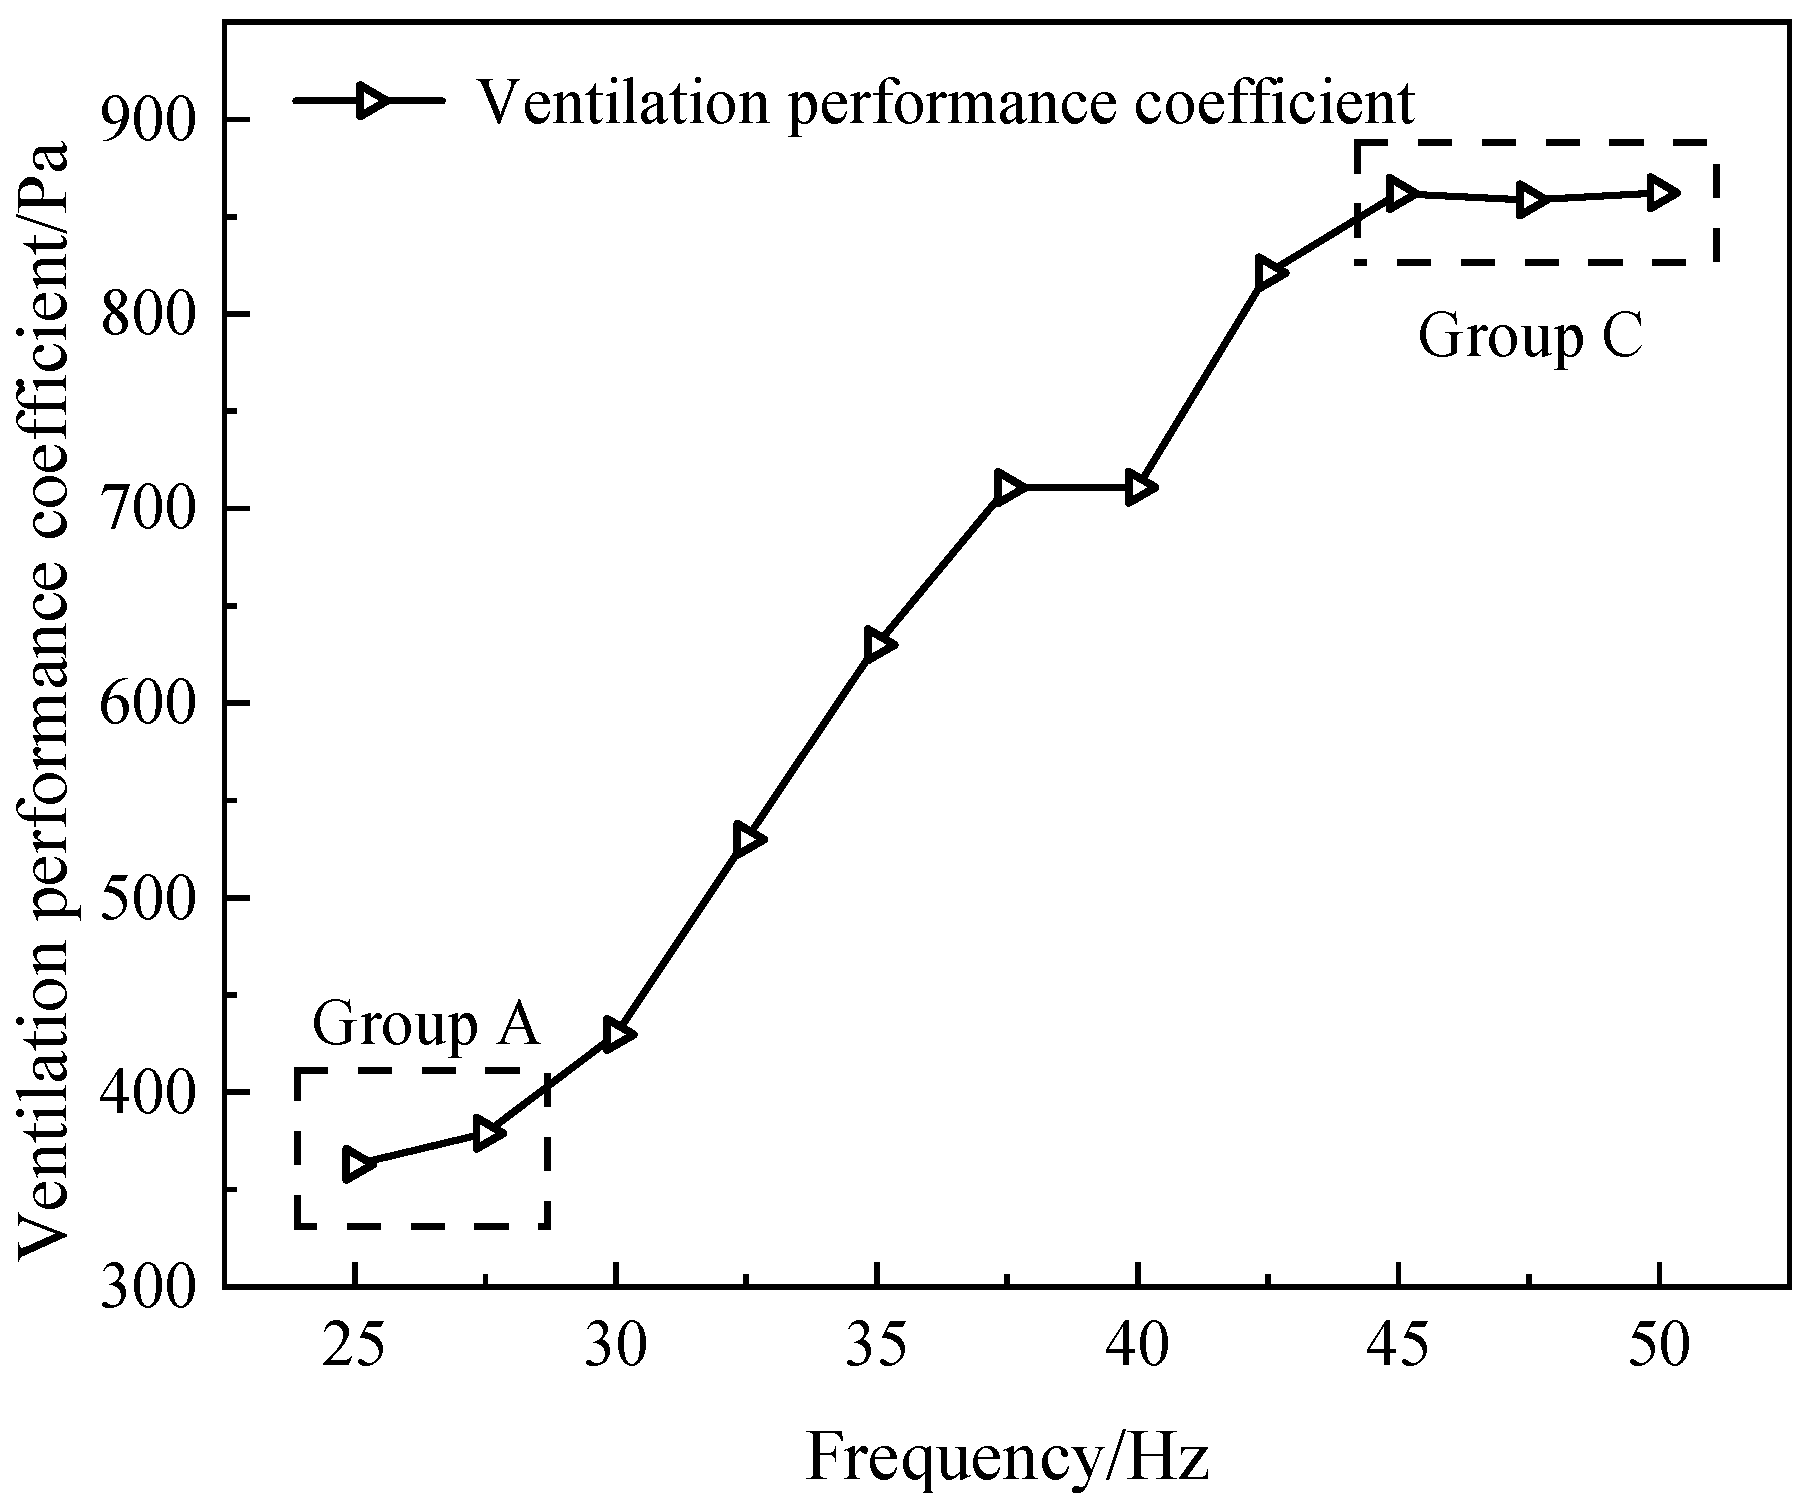
4.1. SPL and Air Volume Flowrate, Power Consumption

To evaluate the overall performance of the fan, the influence of the fan OC should be considered. Therefore, the first issue to be discussed is the relationship between the average SPL of each OC. Average SPL refers to the mean value of SPL at several measuring points in a noise area (fan inlet noise or fan shell noise), as shown in Figure 3.
In Figure 3, the amount of change on the horizontal axis is the selected 11 OC. On the left vertical axis, it is “sound pressure level”, its unit is “dB(A)”, and “dB(A)” represents the A weighting SPL. The maximum error of SPL of each measuring point under all OC is not more than 3%. In Group A, the SPL of OC2 is lower than that of OC1, showing a decrease of 0.3%. In Group C, the SPL decreases with the increase of frequency among OC9, OC10, and OC11. The proportion of SPL decreased by 0.6% from OC11 to OC10. In addition, the growth rate of OC3 to 6 of SPL is much higher than that of OC7 to OC8. Bounded by OC7, the growth rate of noise SPL slows down, and the proportion of SPL decreased by 1.1% from OC7 to OC6
The variation trend of noise SPL at different positions (fan inlet and shell) is the same. The rule of noise and the frequency of the left and right shell is as follows. In Group A, the left noise SPL is larger, and in Group C, the right noise SPL is larger.
From the point of view of noise, when the fan is regulated by variable frequency adjustment, the noise and frequency values are not always proportional. Therefore, with the noise of the fan, the difference in the air volume at adjacent frequencies should be observed.
In Figure 4, it is also found that the air volume is non-proportional to the frequency. In Group A and C, the trend of the air volume is opposite to that of the noise: the air volume increases slowly with the change of frequency. In Group B, there are two stages for noise change, but the air volume increases in approximately equal proportion. There are non-equal proportional changes and characteristics in various OC.
In Figure 5, the variation trend of power and air volume with frequency is similar. Yet, the power of OC7 is not significantly increased compared with OC6, and the air volume is significantly increased compared to OC6. The power of OC8 is greatly increased compared with that of OC7. In addition, it is found that the power of OC 2 is slightly larger than that of OC1. Group C has nearly the same power.
To analyze the influence of each OC and the ventilation performance, and to evaluate the ventilation performance of the fan under the ventilation pipe network, the equivalent airflow pressure can be used to characterize the ventilation performance. The ventilation performance coefficient is expressed as follows,
H F A N = N Q p
where N is the power consumed by the fan (W), Qp is the air volume flowrate supplied by the fan (m3/s), and HFAN is the Ventilation performance coefficient of the ventilator under certain OC (Pa).
Since there is little difference in air volume between Group A and C, the ventilation performance coefficient of the two groups is compared. The coefficients of Group A changed from 363.8 Pa to 378.1 Pa, an increase of 3.9%; the coefficients of OC9, 10, and 11 are 861.9 Pa, 858.9 Pa, 861.7 Pa, respectively; and OC11 is 0.3% less than OC10. Formula (1) indicates that the smaller the ventilation performance coefficient, the greater the ventilation performance. By comparing the data in Figure 6, it is found that OC1 and OC10 have good ventilation performance. Due to the influence of pipe network resistance, the noise of OC10 is lower than that of OC9 and OC8, indicating that the flow field of OC10 is relatively stable and the resulting SPL of the noise is reduced by 0.6 dB(A). In Group B, the ventilation performance coefficient of OC3–6 increases in equal proportion, but the ventilation performance coefficient of OC7 is basically the same as that of OC6. To sum up, if the demand for air volume is moderate, OC7 can be selected. When the demand for air volume is small, OC2 should be used to control the noise, and OC1 should be used to regulate the efficiency. When the demand for air volume is large, OC11 can be considered to ensure air volume and control noise.

4.2. Noise Variation Characteristics at Typical OC

The SPL of fan noise is related to the frequency distribution of the noise, as well as the specific noise source. The issue also should be discussed as the relationship between the octave central frequency and each OC, and the analysis of fan aerodynamic noise is carried out. The estimation table of fan aerodynamic noise can be obtained in [29], as shown in Table 2.
To determine the effect of the fan inlet on noise, the SPL of the octave central frequency among the typical OC is compared, as shown in Figure 7. The noise of the fan inlet is related to the frequency of the variable frequency adjustment. The major gap between OC1 and OC2 is 63 Hz and 1000 Hz. The difference may come from changes in the boundary layer and laminar vortex noise. The major gap between OC7 and OC6 is that at 125 Hz; the noise source is turbulent boundary layer noise, while the main change point between OC10 and OC11 (or OC9) is 4000 Hz, and the noise source is turbulent vortex shedding noise. It can be seen that the turbulence vortex shedding noise SPL relation of Group C is OC11 > OC9 > OC10.
Next, in Figure 8, the difference of the shell noise under different OC is analyzed. The major gap between OC2 and OC1 is 8000 Hz, and the aerodynamic noise changes into laminar boundary layer noise and turbulent boundary layer noise. The major gap between OC7 and OC6 is 125 Hz, and the noise sources are laminar vortex shedding noise and turbulent boundary layer noise. At Group C, there is no significant difference in octave. However, OC10 and OC11 are slightly different in the range of 250~1000 Hz. At 1000 Hz, OC11 is larger than OC10, and other octaves are opposite. OC9 and OC10 differ at 1000 Hz octave central frequency. To clarify the difference of noise, spectrum analysis is used to determine the difference of discrete noise.

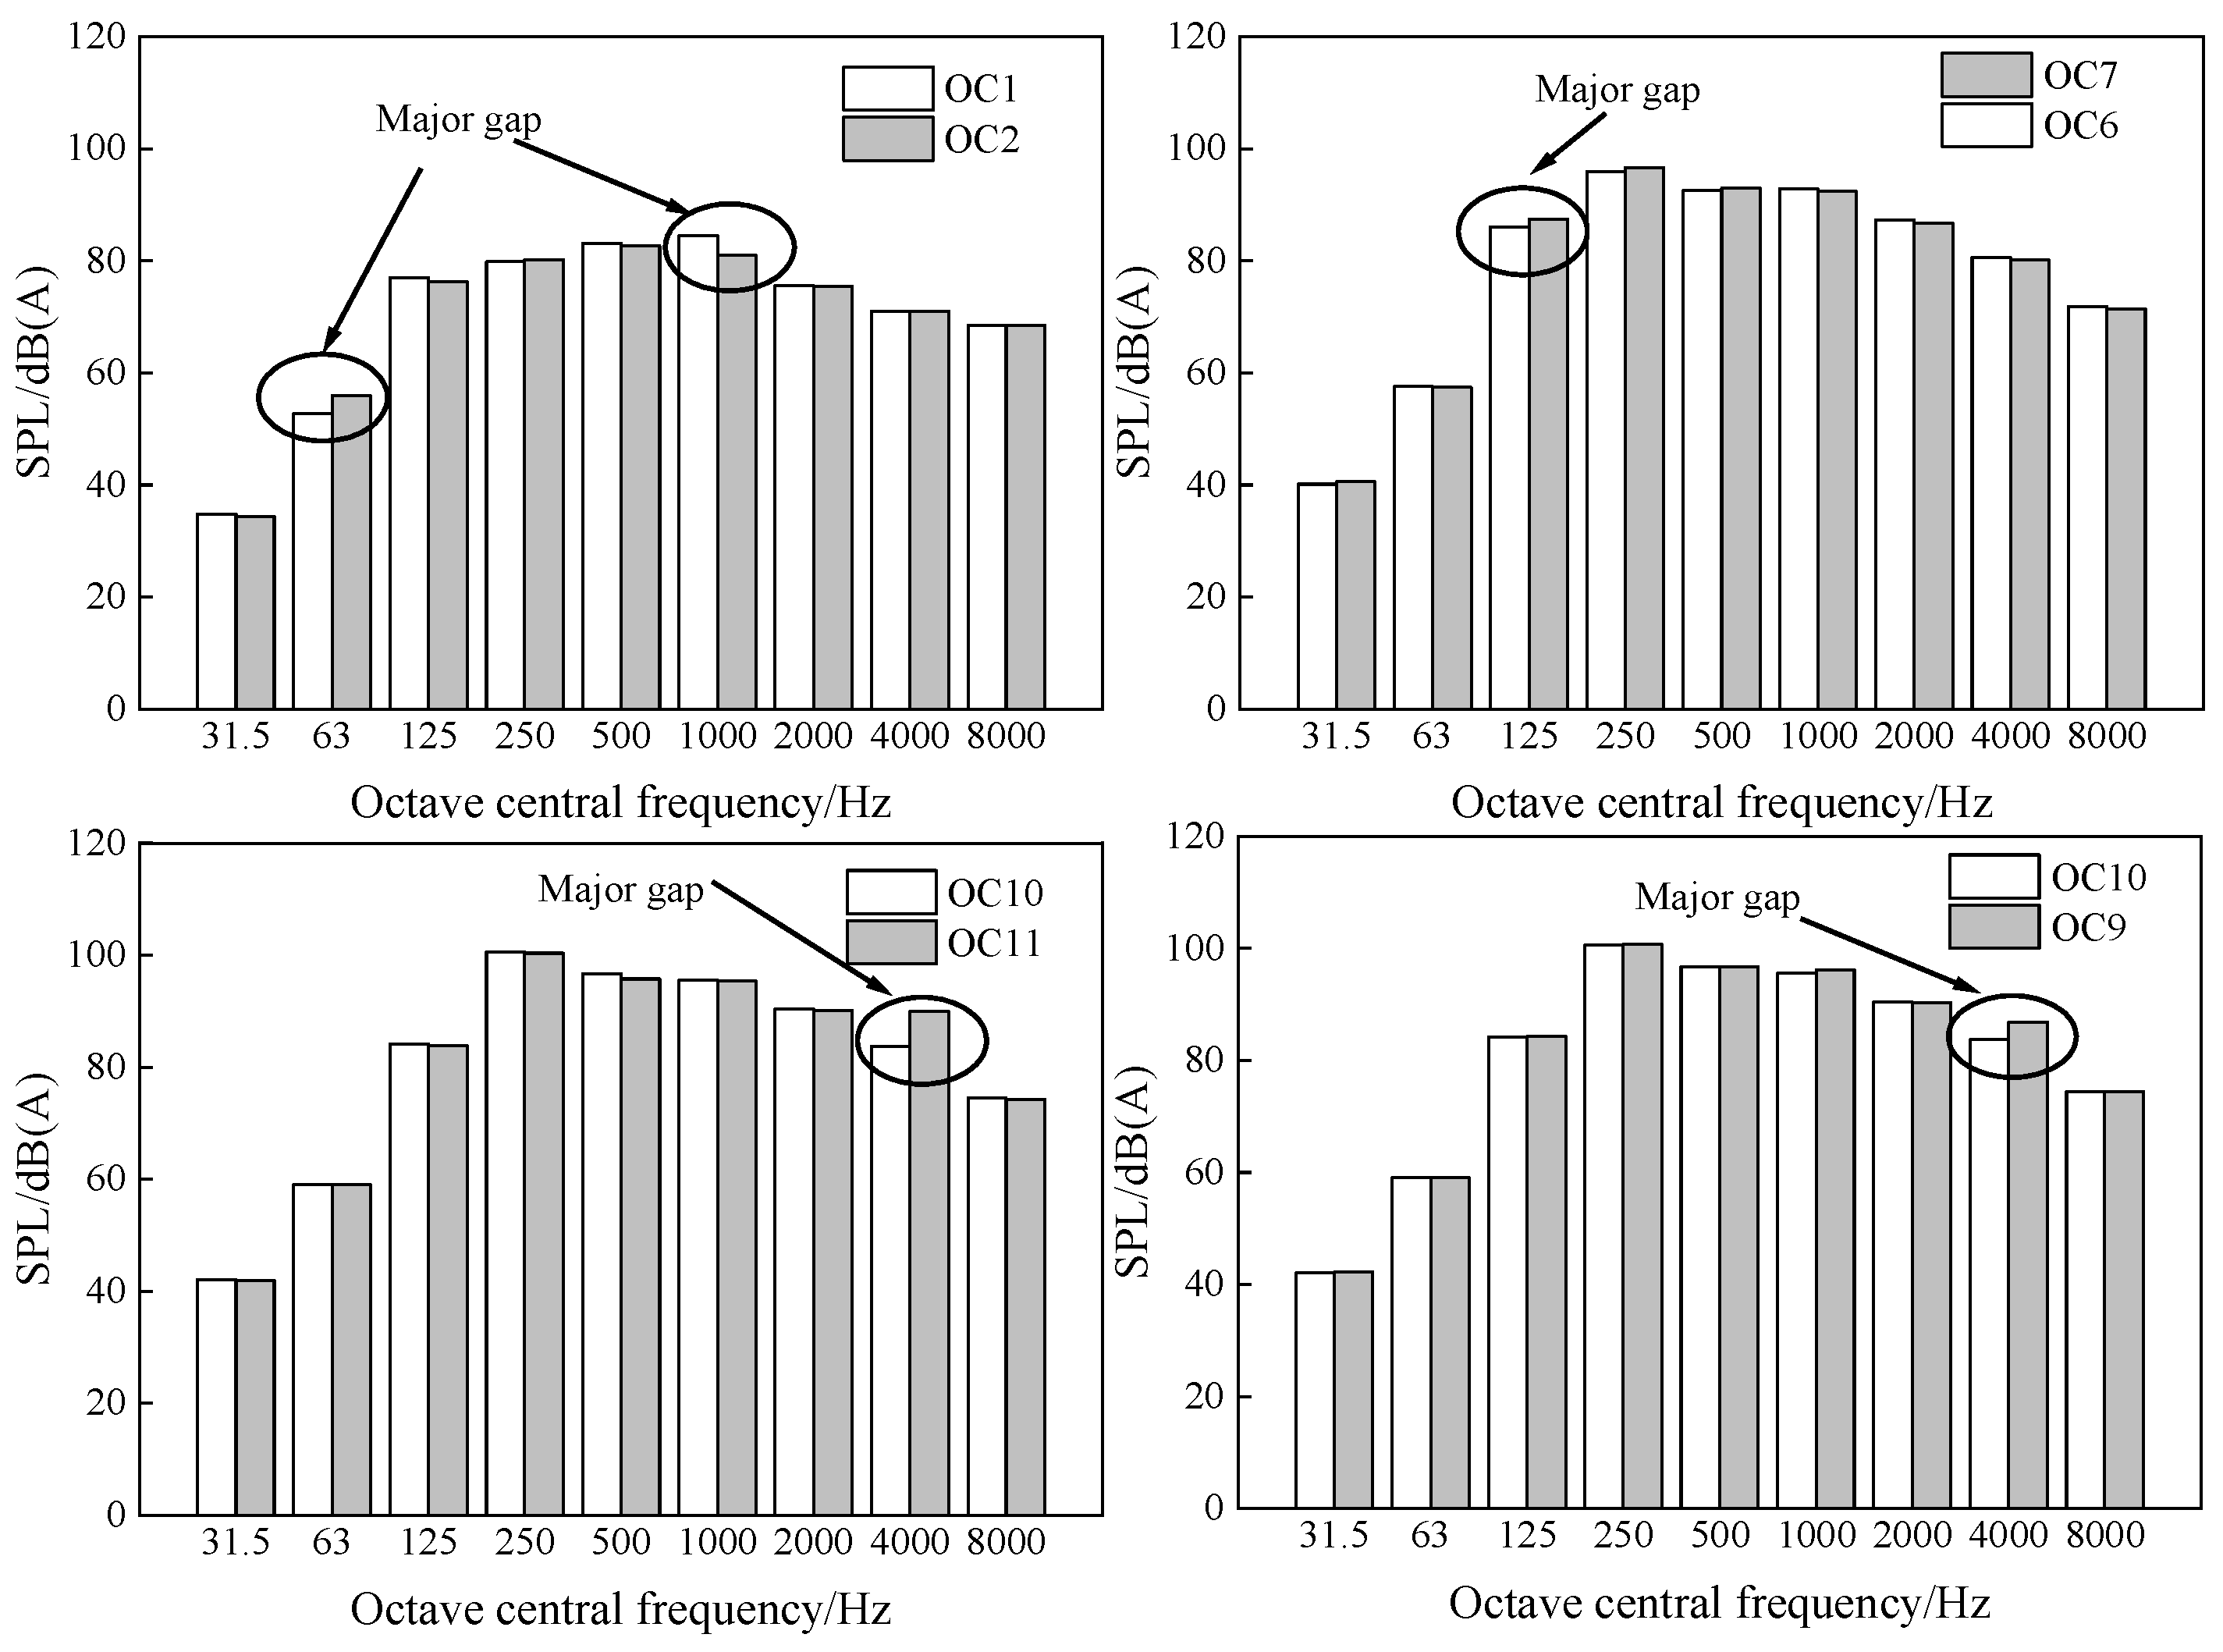
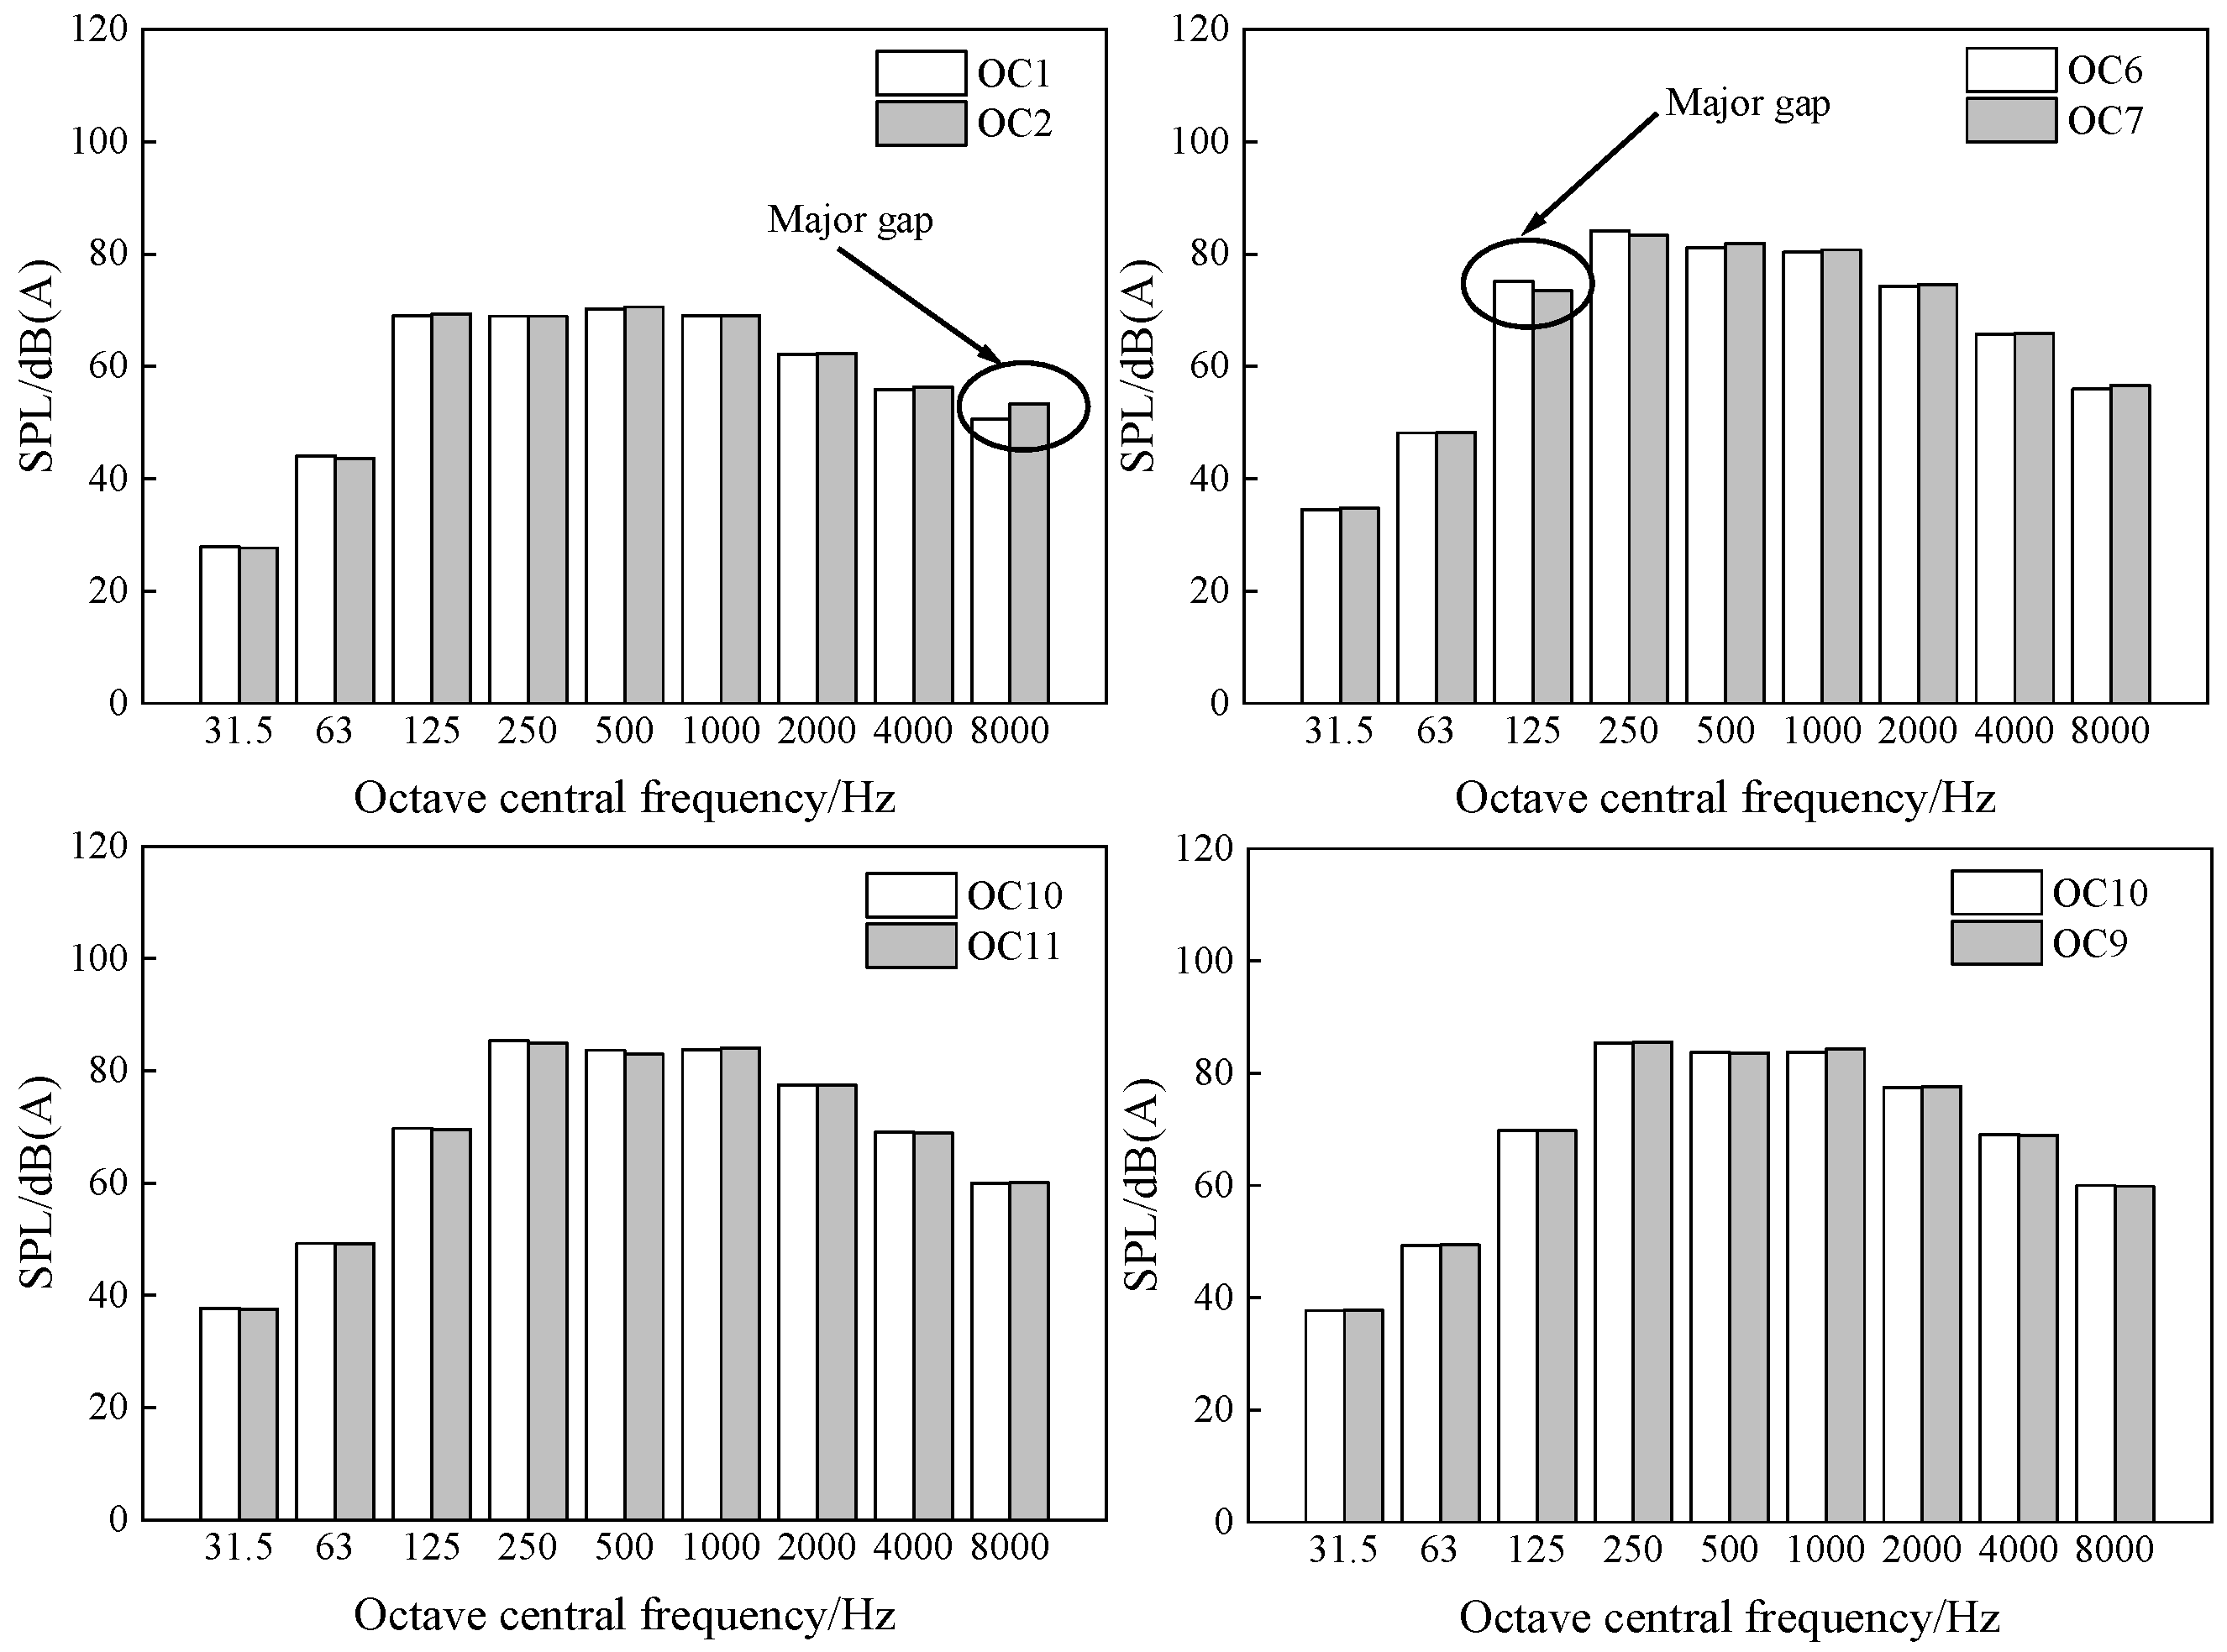
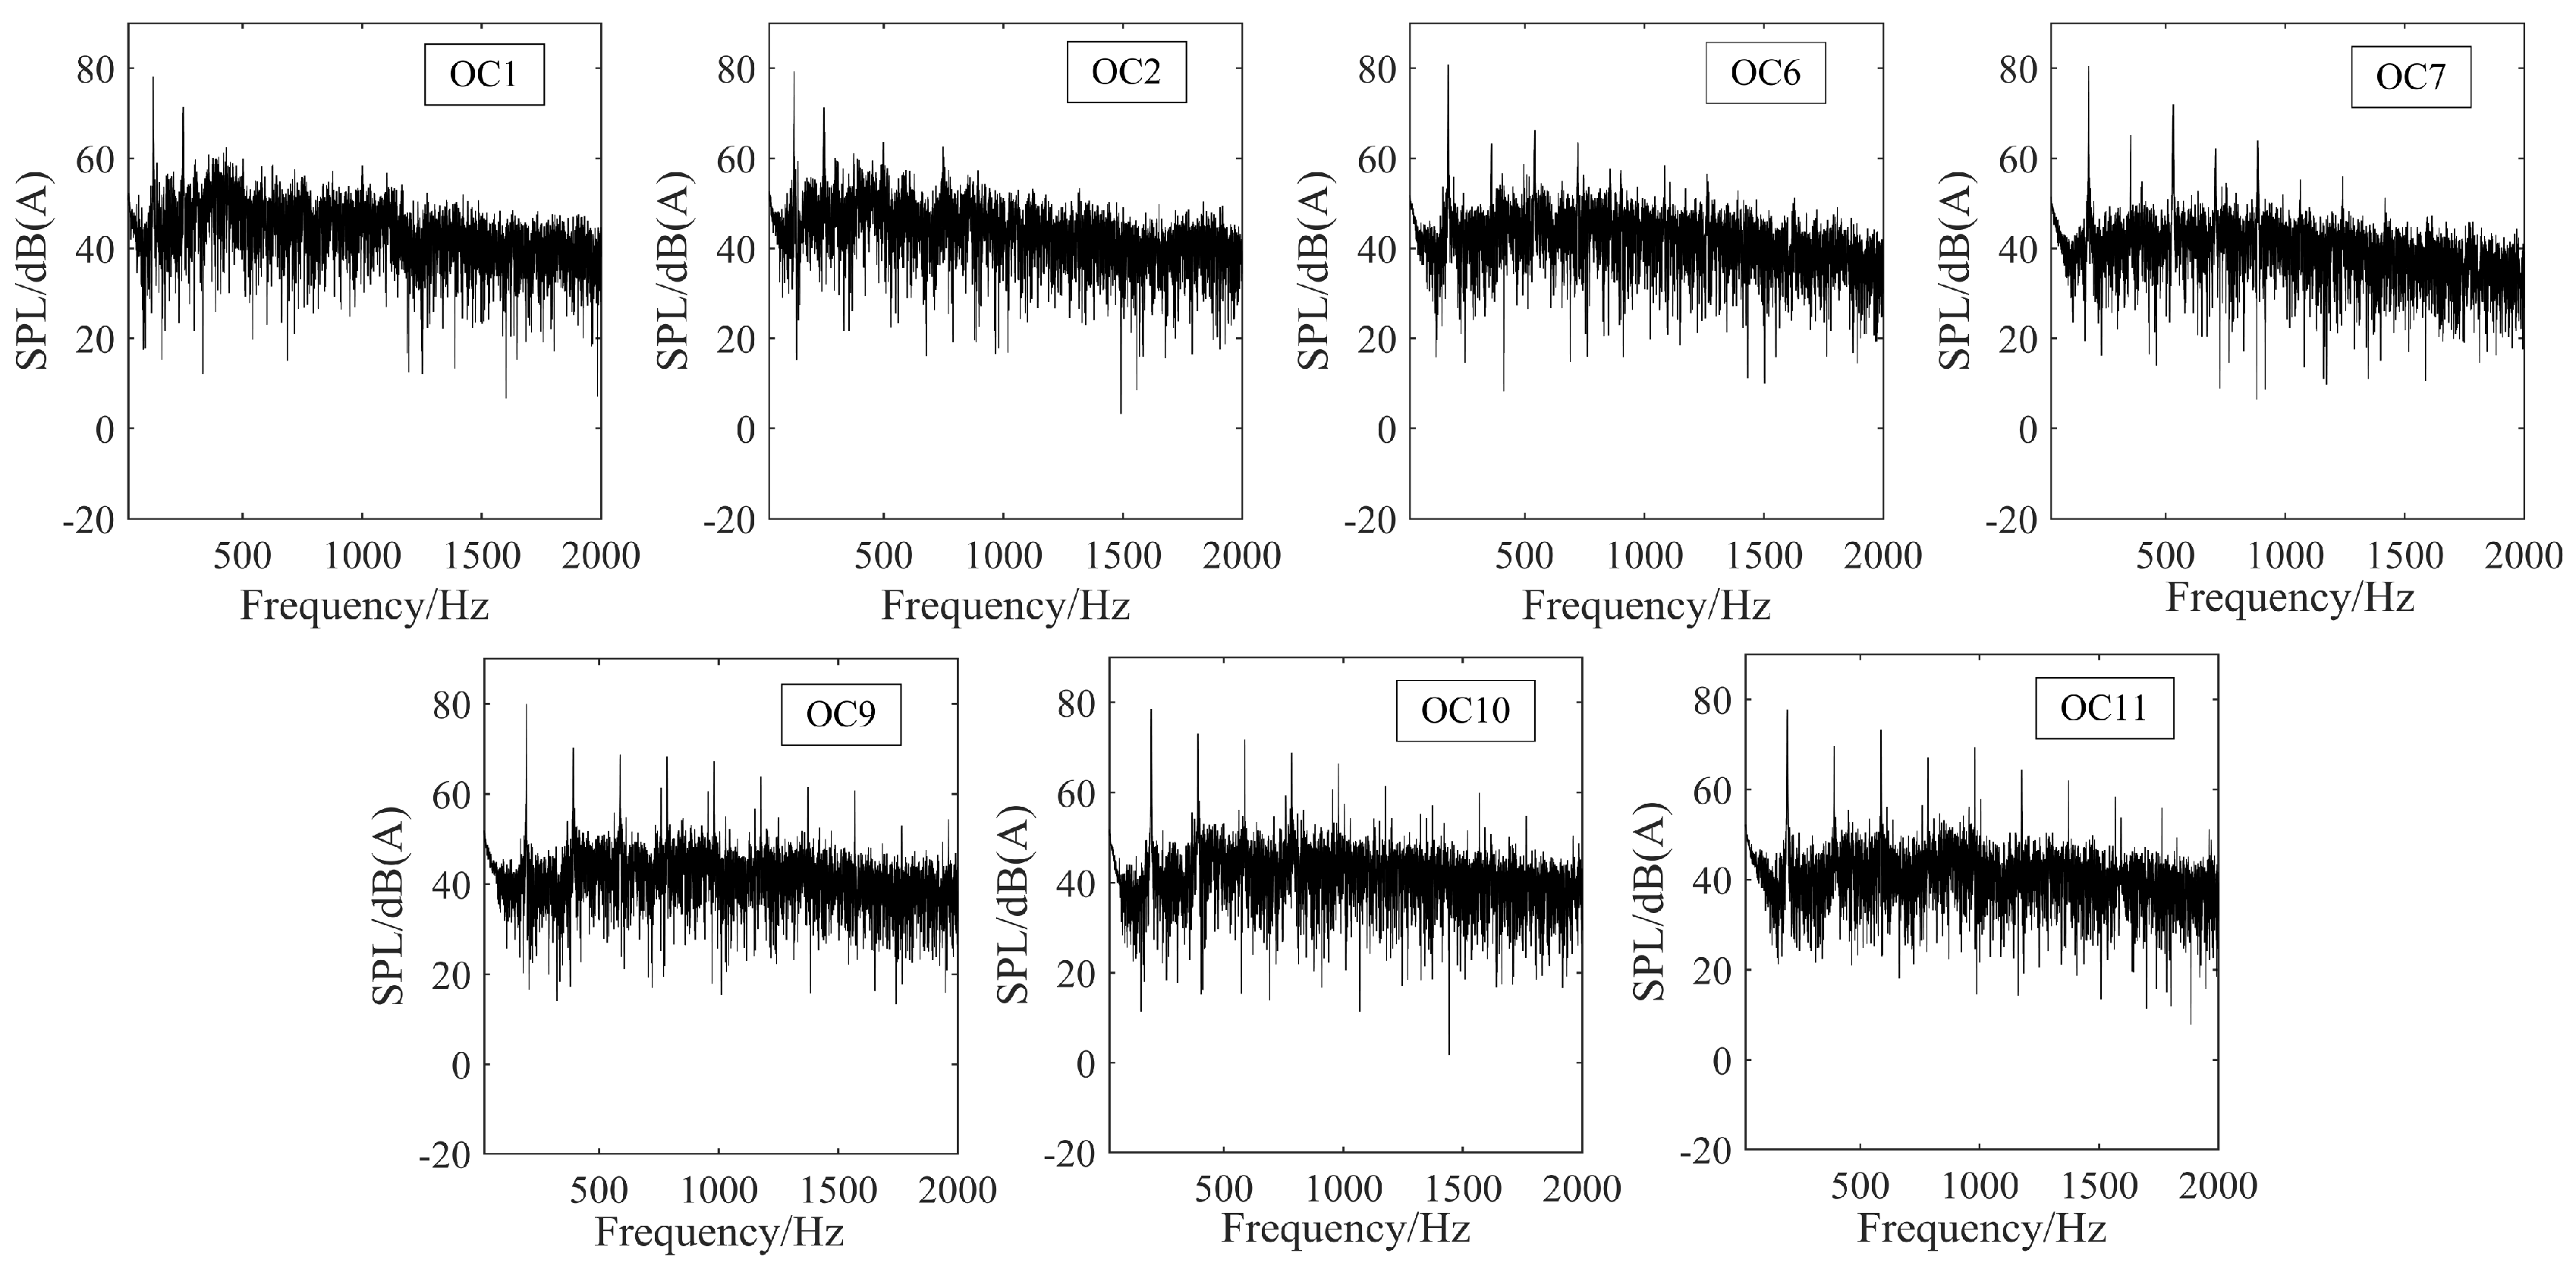
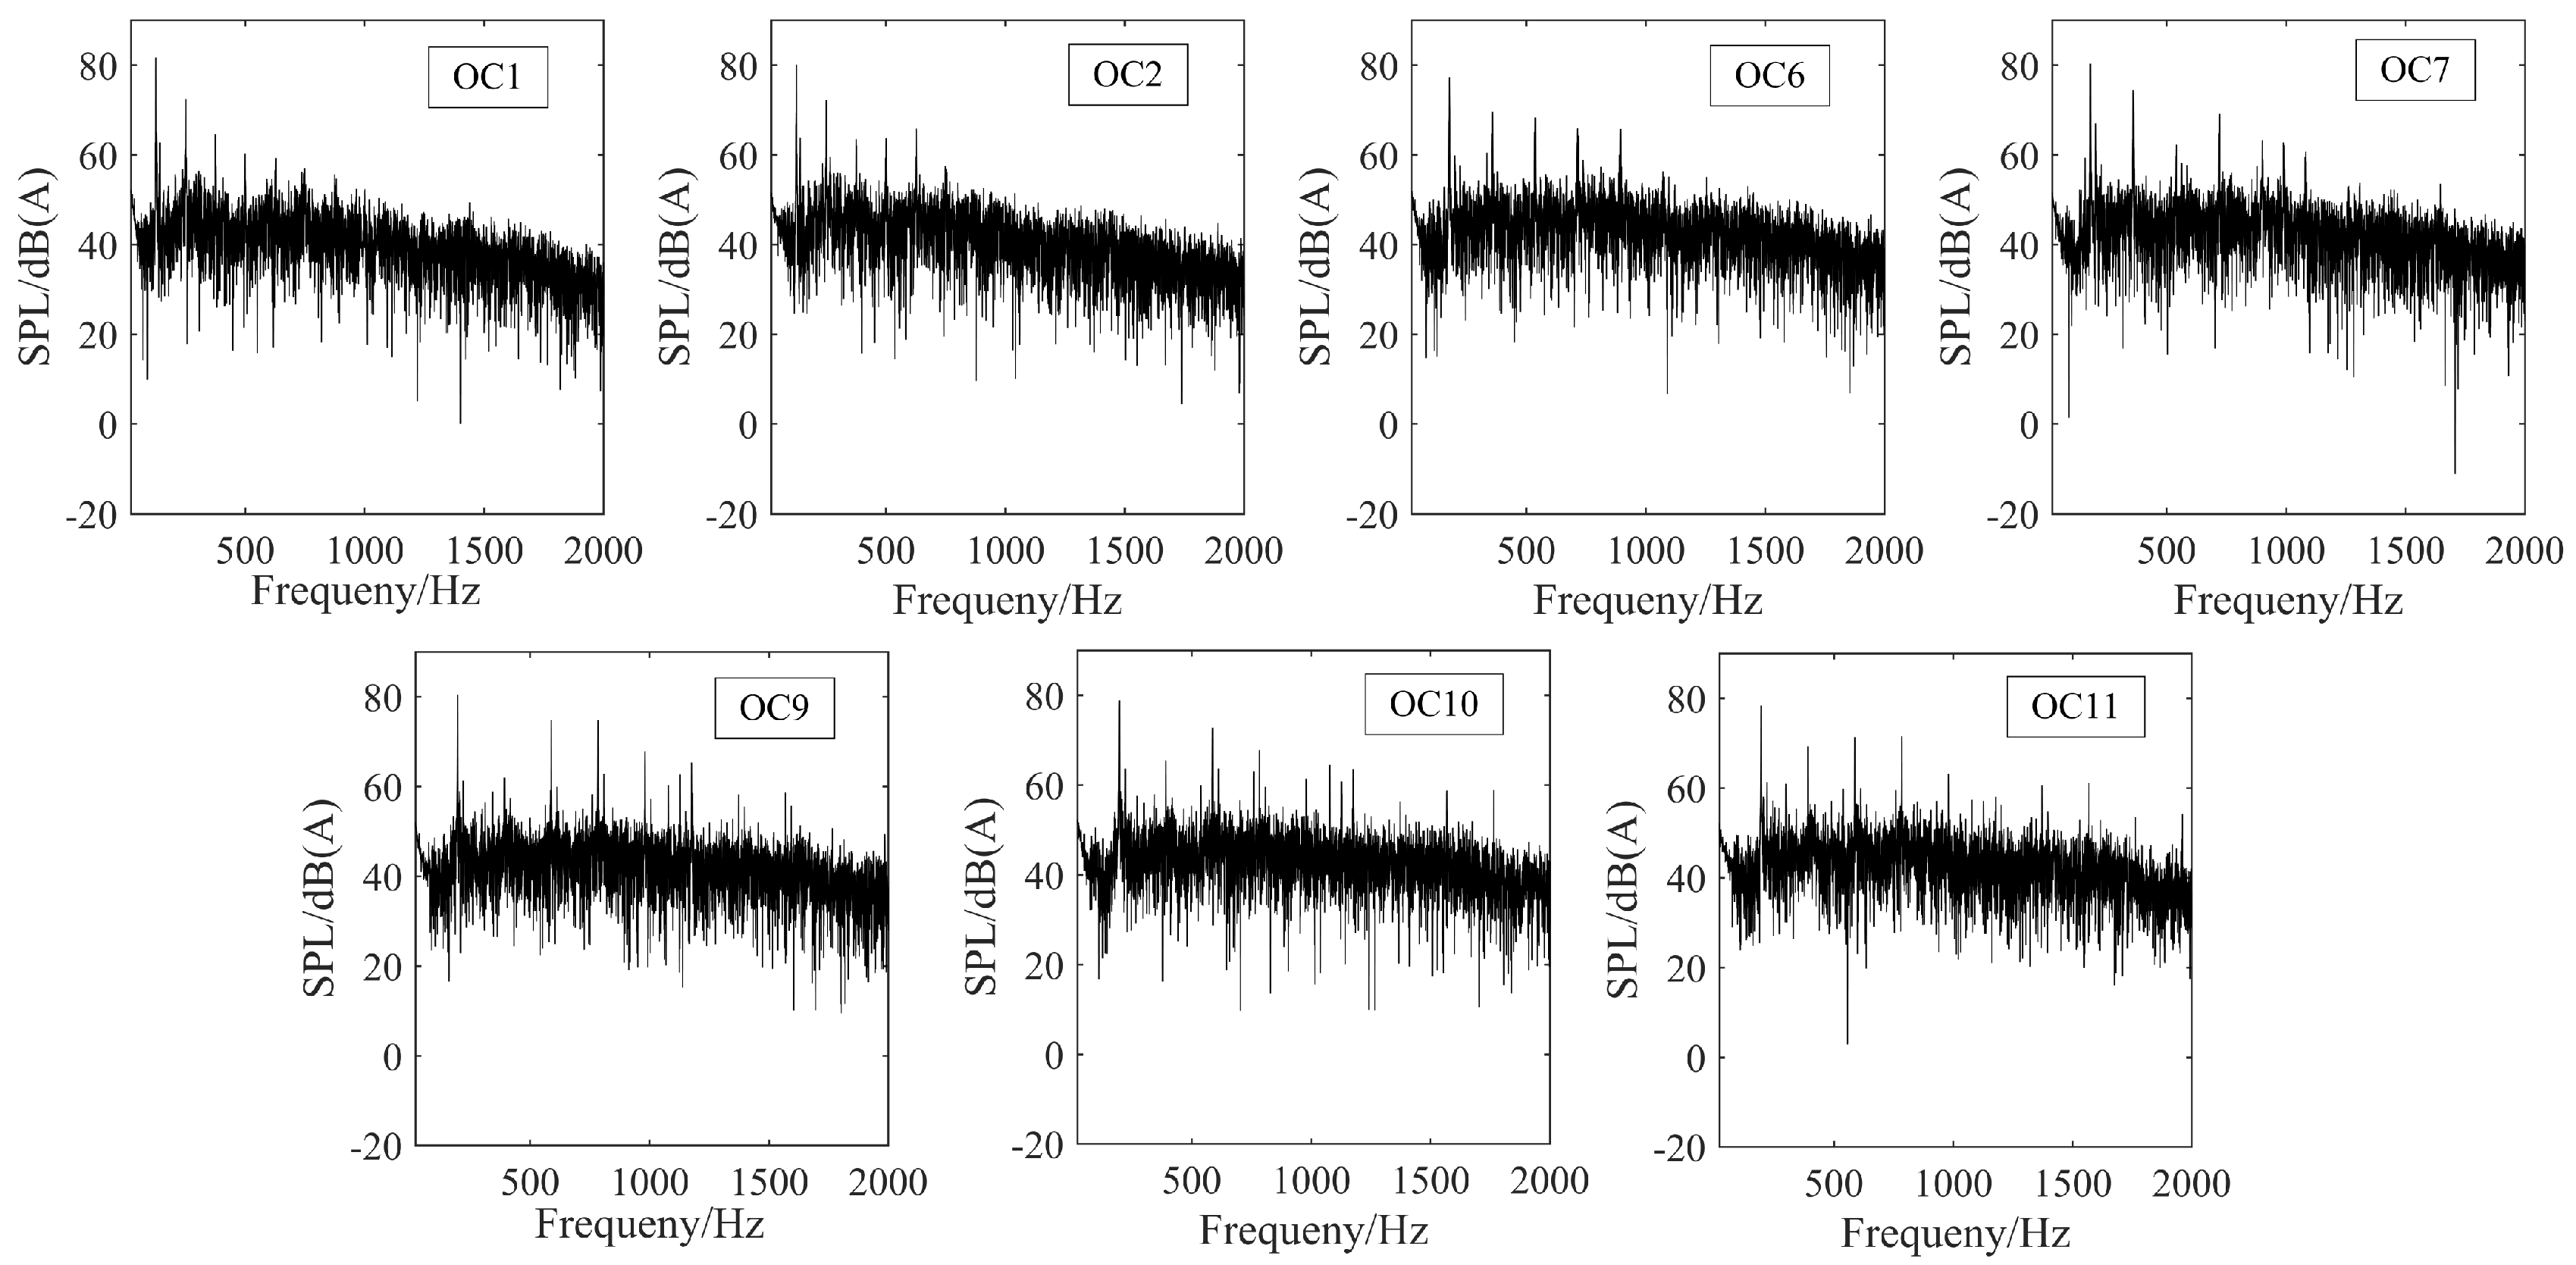
4.3. Sound Spectrum Characteristics at Typical OC

4.3.1. Spectrum Characteristics of Fan Inlet

In different OC of the fan, due to the interaction between the pipe network and the air volume flowrate, the sound field has become complicated, and characteristics need to be discovered from the spectrum analysis. In particular, the SPL in the spectrogram is calculated by the amplitude obtained by the Fast Fourier Transform.
The calculation formula for the discrete noise of the fan is
f = n z i 60
where f is the rotational frequency of the fan (Hz); n is the fan rotational speed (r/min); z is the number of fan blades, the number of blades of the selected axial fan is 8; and i is the harmonic sequence number, and i is set to 1 as the fundamental frequency, and when 2, 3, 4... is the high-order harmonic frequency.
The fan blade rotation speed measured experimentally under frequency conversion regulation is shown in Table 3. The experimental results show that OC2 and OC7 can be regarded as critical OC, and the speed of these OC has a downward trend. When the frequency modulation is greater than this OC, the speed can be significantly increased. In addition, in group C, the speed is close to the limit value of the fan speed, so the speed increases slowly.
The frequency spectrum analysis on the variable frequency adjustment of typical OC is performed, as shown in Figure 9. According to Formula (2), the positions of the fundamental and higher-order harmonic frequencies can be calculated.
Combined with Figure 9, it can be found that the fundamental frequency is the highest peak in discrete noise. With the gradual increase of variable frequency adjustment, the proportion of the high-order harmonic frequency in the discrete noise increases at high rotational speed. In typical OC, the difference in discrete noise is mainly 750 Hz between OC1 and OC2, and the SPL of OC7 is higher than that of OC6 at the high-order harmonic frequency. Similarly, in Group C, the overall SPL becomes smaller, but the SPL of the discrete noise becomes larger. Therefore, in the OC of the high air volume flowrate, the inlet noise of the fan is still dominated by broadband noise.
The spectrum characteristics of the fan inlet are discussed. In the above octave analysis, it is found that the shell noise is not obvious at high rotational speed, but it is worth noting the frequency spectrum characteristics of the fan shell.

4.3.2. Spectrum Characteristics of Fan Shell

In Figure 10, the SPL of the continuous broadband noise is decreased in Group A and B, the amount of discrete noise is increased in Group C, and the proportion of discrete noise in the shell noise is increased relative to the inlet noise. However, the discrete noise in Group C is suppressed, and the distribution of discrete noise is non-proportional.

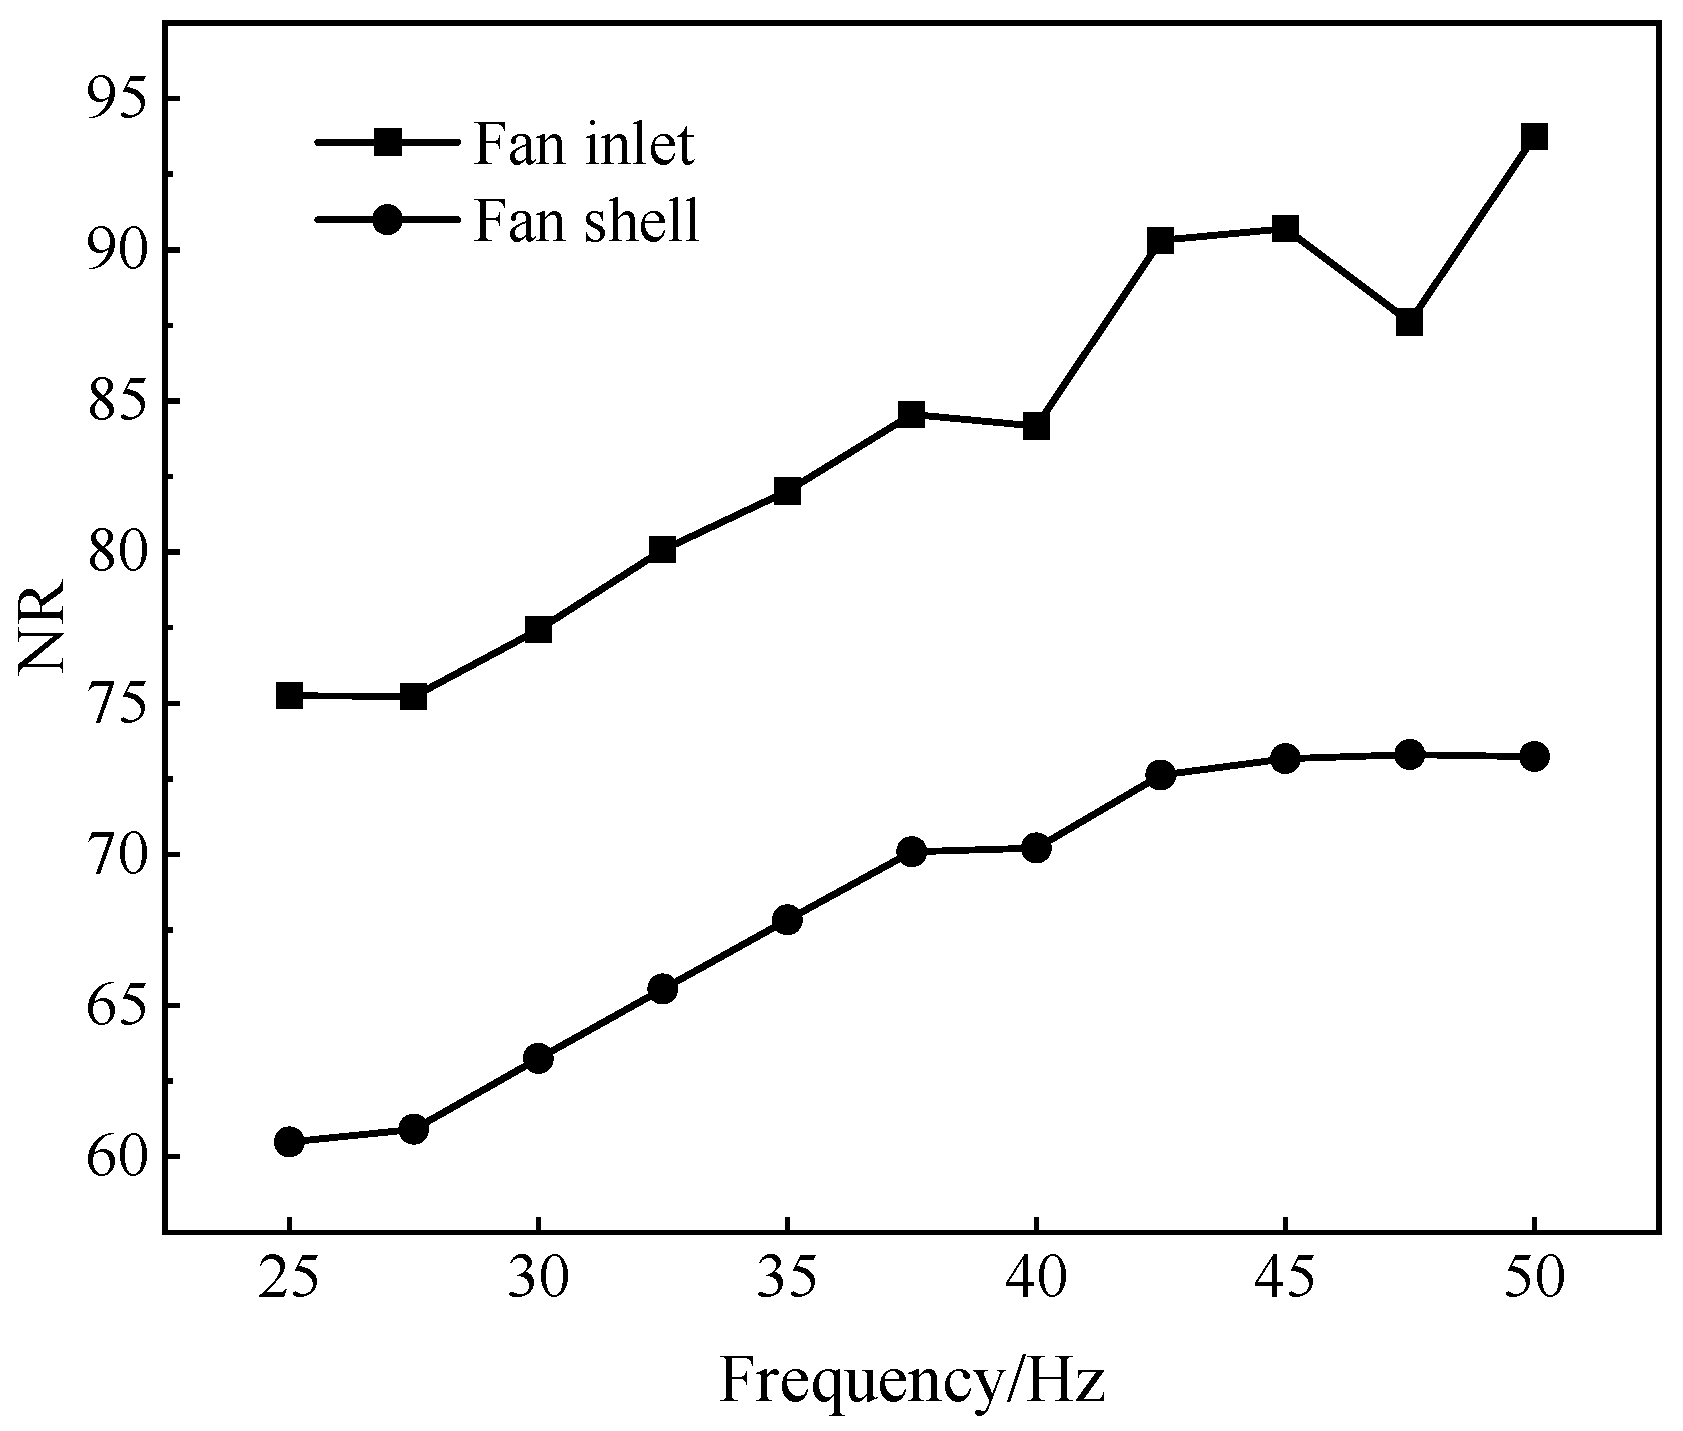
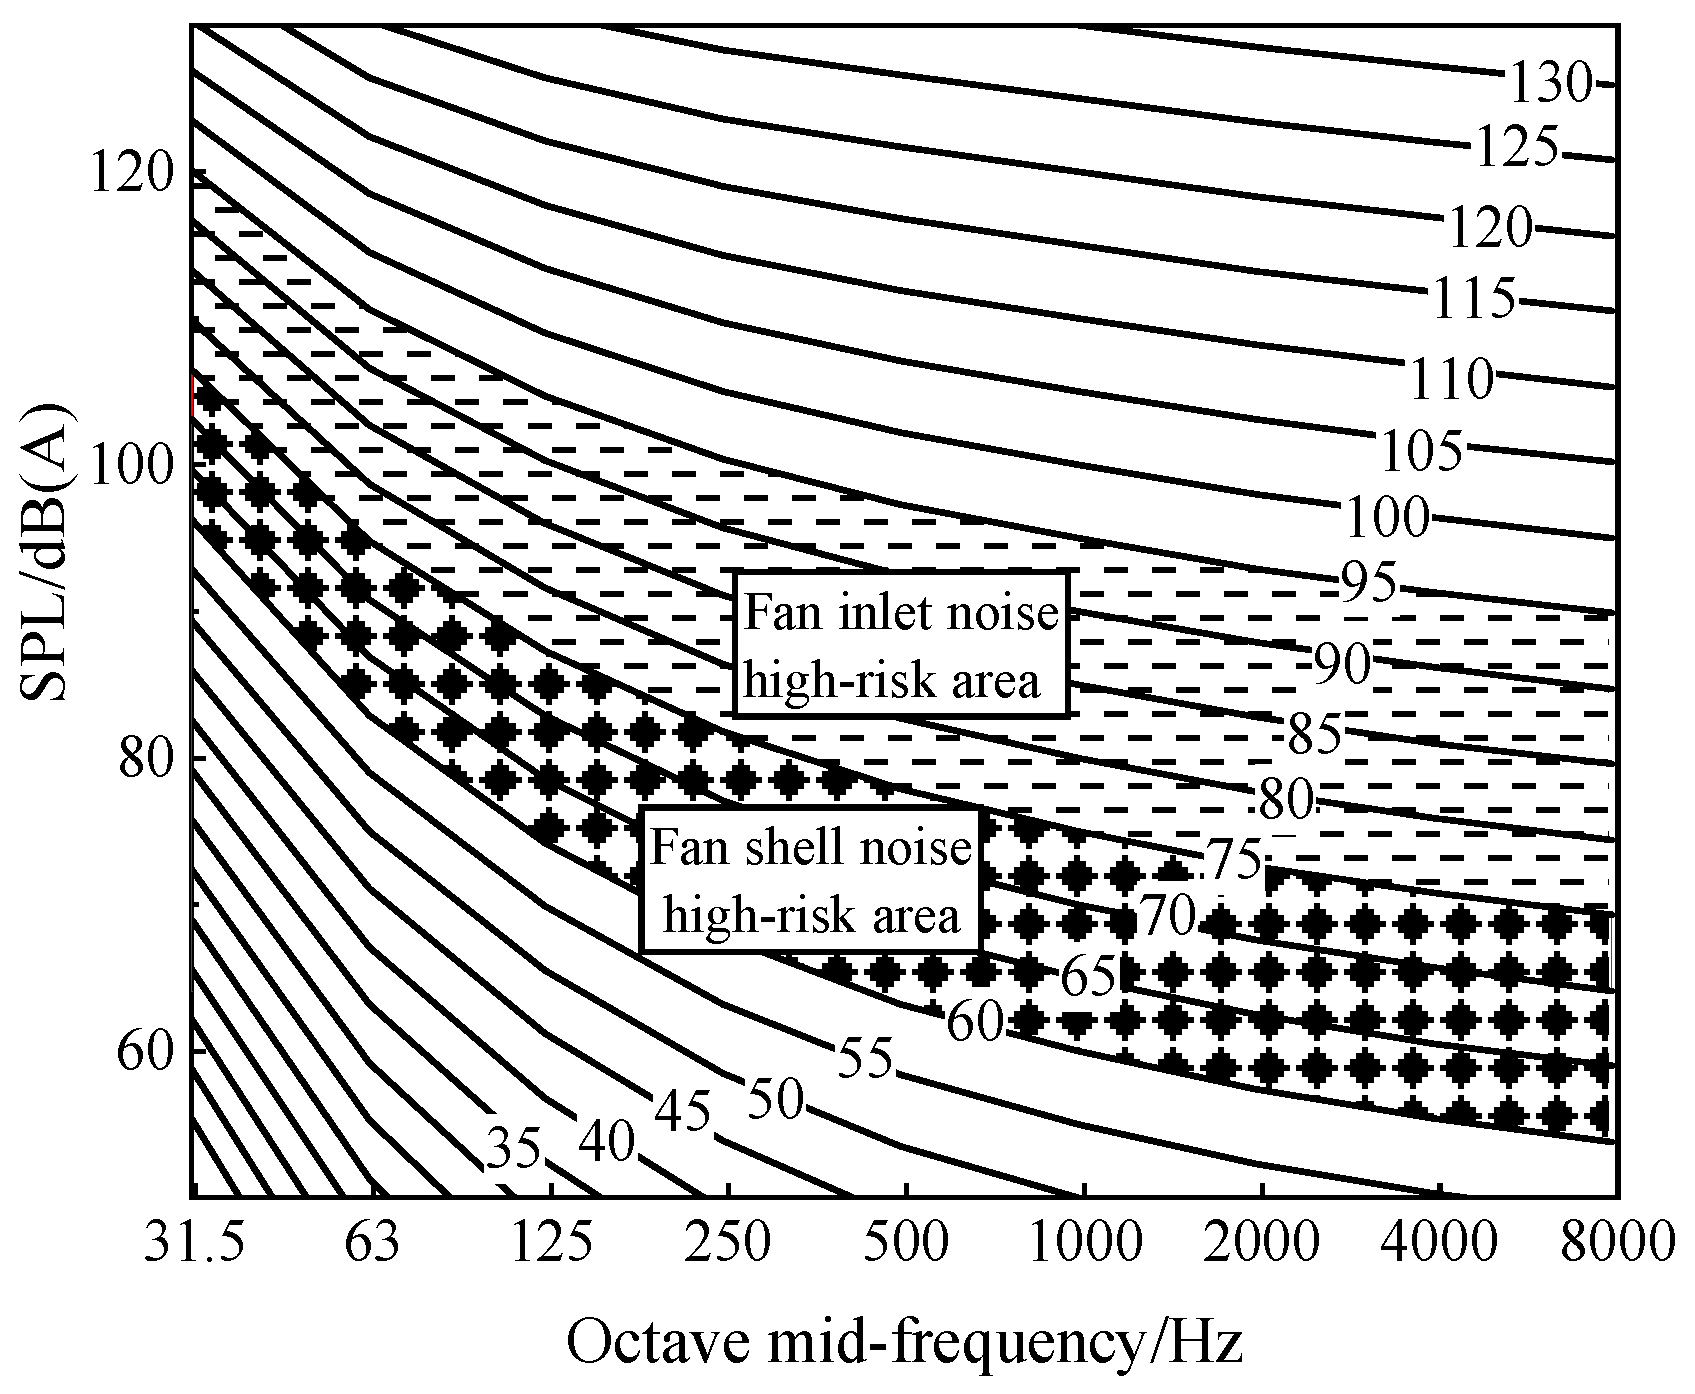
4.4. Noise Evaluation and High-Risk Area Division

The human body has a different perception or damage of different frequency bands, which can be evaluated by using a noise rating (NR) curve [30]. A NR curve is a group of curve clusters divided according to octave to quantify the evaluation index. Usually, in the first step, 0~130 dB(A) noise is selected; in the second step, the octave range of 31.5–8000 Hz is divided into 9 octaves; in the third step, curve clusters are used for index quantification, and the NR evaluation number of noise is determined by the maximum SPL.
According to relevant reports, the hearing loss of operators is concentrated in the range of 3000~6000 Hz, and 4000 Hz has the greatest impact on occupational deafness [31]. Taking 4000 Hz as the benchmark, the NR number of typical points is analyzed to establish the high-risk noise index. The index curve of OC1-11 is shown in Figure 11. The data show the index of high risk in various frequency adjustments; if the noise index of a certain frequency band exceeds this value, it causes great harm to the human body. According to Figure 12, NR curves with high-risk areas are divided. In the above typical OC, the high-risk octave of OC1 is 500, 1000, 2000, and 4000 Hz, while that of OC2 is the same. OC6 and OC7 are 250, 500, 1000, 2000, and 4000 Hz. OC11 is 250, 500, 1000, and 4000 Hz.
It was found that the major gap of typical OC belongs to the high -risk area, so noise control research should be carried out. Currently, the excavation of highway and railway tunnels is usually forced ventilation, and there are several local fans in the tunnels. If the noise pollution of a tunnel construction site is aggravated, high-frequency suppression earplugs of 250~4000 Hz should be worn, which can deal with the noise damage under multi-part OC.
Combined with the existing correlation studies of the main sources of occupational impairment [32], irreversible hearing impairment is concentrated in males and the older occupational population. Smoking is an independent factor of hearing loss. Smoking should be eliminated in high-noise sites (250~4000 Hz) to avoid the occurrence of occupational deafness.

5. Conclusions

On the ventilation system of the pipe-type variable frequency adjustment, the sound pressure value of each measuring point was quantitatively measured for the noise of the air inlet and fan shell, and the ventilation performance was studied. This provided the noise data and analysis for the non-proportional change rate of the fan, and provides the proof for the field application requiring various frequency adjustment. The main conclusions are as follows.
On the premise that the air volume meets the field demand, OC2, OC7, and OC11 can be selected to control the noise.
In the case of the variable frequency adjustment process of the fan, with octaves as the observation method, the main changes of the fan noise and fan shell noise are different. If only the aerodynamic noise is considered, the noise changes may be due to the different contributions of boundary layer noise and vortex shedding noise to the fan noise.
In the case of variable frequency adjustment, the fundamental frequency SPL of discrete noise is the highest in the whole frequency band. At high rotating speeds, the contribution of higher-order harmonics to the overall noise of the fan increases, but the broadband noise is still the main noise.
The NR rating number was introduced to establish the high-risk noise index based on the air inlet and shell. It was found that most of the main noise changes in typical OC exceeded the high-risk noise index, and the main target frequency band for noise control is 250–4000 Hz.

Author Contributions

X.D.: Conceptualization, Formal analysis, Writing—original draft, Study conception and design, Analysis and interpretation of results, Draft manuscript preparation. S.C.: Conceptualization, Study conception and design, Resources, Methodology. Z.L.: Conceptualization, Study conception and design, Formal analysis, Validation. Z.Z.: Writing—review & editing, Resources, Conceptualization. Y.C.: Formal analysis. All authors have read and agreed to the published version of the manuscript.

Funding

The research was funded by the National Natural Science Foundation of China (Grant No. 51864014).

Institutional Review Board Statement

Not applicable.

Informed Consent Statement

Not applicable.

Data Availability Statement

Data will be made available on request.

Conflicts of Interest

The authors declare no conflict of interest.

References

  1. Li, Y. Development of ventilation methods for mountain-crossing tunnels during construction. Tunn. Constr. 2010, 30, 569–572. [Google Scholar]
  2. Wang, Y. The selection and optimization of ventilation scheme for railway tunnel construction. Chin. J. Undergr. Space Eng. 2015, 11, 359–366. [Google Scholar]
  3. Heinemann, T.; Becker, S. Axial Fan Performance under the Influence of a uniform ambient flow field. Int. J. Rotating Mach. Vol. 2018, 2018, 6718750. [Google Scholar] [CrossRef] [Green Version]
  4. Sarraf, C.; Nouri, H.; Ravelet, F.; Bakir, F. Experimental study of blade thickness effects on the overall and local performances of a controlled vortex designed axial-flow fan. Exp. Therm. Fluid Sci. 2011, 35, 684–693. [Google Scholar] [CrossRef] [Green Version]
  5. Venter, S.; Kröger, D. The effect of tip clearance on the performance of an axial flow fan. Energy Conver. 1992, 33, 89–97. [Google Scholar] [CrossRef]
  6. Sheng, Y.; Zhang, L.; Wang, Y.; Fang, L. Explore energy saving operation strategy: Indoor VOCs removal performance of silica gel rotor in Clean-Air Heat Pump system at low regeneration air temperature. Energy Build. 2019, 202, 109379. [Google Scholar] [CrossRef]
  7. Chen, S.; Wang, H.; Yang, C.; Li, X.; Jia, T. Experimental investigation of a mine main fan with variable frequency adjustment and the non-equal law between flowrate-ratio and power-ratio. J. Hunan Univ. Sci. Technol. 2016, 31, 1–7. [Google Scholar]
  8. Sheng, Y.; Zhang, Y.; Zhang, G. Simulation and energy saving analysis of high temperature heat pump coupling to desiccant wheel air conditioning system. Energy 2015, 83, 583–596. [Google Scholar] [CrossRef]
  9. Maaloum, A.; Kouidri, S.; Bakir, F.; Rey, R. Effect of inlet duct contour and lack thereof on the noise generated of an axial flow fan. Appl. Acoust. 2003, 64, 999–1010. [Google Scholar] [CrossRef]
  10. Ito, T.; Minorikawa, G.; Fan, Q. Experimental research for performance and noise of small axial fan. Int. J. Fluid Mach. Syst. 2009, 2, 136–146. [Google Scholar] [CrossRef]
  11. Jang, C.; Fukano, T.; Furukawa, M. Effects of the tip clearance on vortical flow and its relation to noise in an axial flow fan. JSME Int. J. Ser. B 2003, 46, 356–365. [Google Scholar] [CrossRef] [Green Version]
  12. Sanjose, M.; Moreau, S. Direct noise prediction and control of an installed large low-speed radial fan. Eur. J. Mech. B Fluids 2017, 61, 235–243. [Google Scholar] [CrossRef] [Green Version]
  13. Grace, S.; Logue, M. Comparison of two low-order models for the prediction of fan broadband noise. J. Sound Vib. 2018, 431, 304–327. [Google Scholar] [CrossRef]
  14. Posson, H.; Moreau, S.; Roger, M. Broadband noise prediction of fan outlet guide vane using a cascade response function. J. Sound Vib. 2011, 330, 6153–6183. [Google Scholar] [CrossRef]
  15. Hu, B.; OuYang, H.; Wu, Y. Numerical prediction of the interaction noise radiated from an axial fan. Appl. Acoust. 2013, 74, 544–552. [Google Scholar] [CrossRef]
  16. Zanon, A.; De Gennaro, M.; Kuehnelt, H.; Giannattasio, P. Assessment of the broadband noise from an unducted axial fan including the effect of the inflow turbulence. J. Sound Vib. 2018, 429, 18–33. [Google Scholar] [CrossRef]
  17. Luo, B.; Chu, W.; Zhang, H. Tip leakage flow and aeroacoustics analysis of a low-speed axial fan. Aerosp. Sci. Technol. 2020, 98, 105700. [Google Scholar] [CrossRef]
  18. Scheit, C.; Karic, B.; Becker, S. Effect of blade wrap angle on efficiency and noise of small radial fan impellers—A computational and experimental study. J. Sound Vib. 2012, 331, 996–1010. [Google Scholar] [CrossRef]
  19. Bizjan, B.; Milavec, M.; Širok, B.; Trenc, F.; Hočevar, M. Energy dissipation in the blade tip region of an axial fan. J. Sound Vib. 2016, 382, 63–72. [Google Scholar] [CrossRef]
  20. Krömer, F.; Moreau, S.; Becker, S. Experimental investigation of the interplay between the sound field and the flow field in skewed low-pressure axial fans. J. Sound Vib. 2019, 442, 220–236. [Google Scholar] [CrossRef]
  21. Zhao, Z.; Zhu, B. Application of variable-frequency variable-voltage in highway tunnel ventilation control. J. Chang. Univ. 2006, 4, 71–74. [Google Scholar]
  22. Fan, S.; Chen, S.; Wu, Z.; Wu, S.; Chen, Y.; Liu, D.; Yao, Y.; Huang, J. Analysis of droplet size distribution and selection of spray parameters based on the fractal theory. J. Clean. Prod. 2022, 371, 133315. [Google Scholar] [CrossRef]
  23. Wang, S.; Sheng, M.; Hu, D. Energy-saving analysis and calculation of HV frequency conversion retrofitting for fan and pump. Electr. Power Autom. Equip. 2011, 31, 117–120. [Google Scholar]
  24. Li, Y.; Li, C.; Yang, J. Analysis on the influence of different adjustment modes on economy of induced draft fan. J. Eng. Therm. Energy Power 2021, 36, 39–43. [Google Scholar]
  25. Li, Y.; Shi, H. The Aerodynamic noise of analysis of the fan. Fluid Mach. 2000, 2, 20–22. [Google Scholar]
  26. Wu, X.; Li, Z. Principle of ventilator blade noise and methods to cut it down. Chin. J. Turbomach. 2001, 4, 11–13. [Google Scholar]
  27. Han, J.; Wang, Q. Noise analysis and reduction of mine ventilator. Coal Technol. 2016, 35, 265–267. [Google Scholar]
  28. GB/T 2888-2008; General Administration of Quality Supervision, Inspection and Quarantine of the People’s Republic of China. Methods of Noise Measurement for Fans Blowers Compressors and Roots Blowers. Standards Press of China: Beijing, China, 2008.
  29. Cui, X. The performance assessment of aerodynammic noise in axial flow fans. Fluid Mach. 1994, 22, 19–21. [Google Scholar]
  30. Cen, Y.; Deng, Y.; Liu, X. Risk of hearing loss in noise-exposed workers: A retrospective cohort study. Chin. J. Public Health 2016, 32, 642–645. [Google Scholar]
  31. Wang, D.; Dai, X.; Chen, W. Study on the association between occupational noise exposure and cardiovascular diseases. Chin. J. Ind. Hyg. Occup. Dis. 2021, 39, 555–557. [Google Scholar]
  32. Tan, J.; Huang, X. Discussion about the noise rating number. Tech. Acoust. 2008, 2, 240–243. [Google Scholar]
Figure 1. Model experiment system and its main components.
Sustainability 15 02025 g001
Figure 2. Location map of measuring points.
Sustainability 15 02025 g002
Figure 3. SPL of various OC.
Sustainability 15 02025 g003
Figure 4. Air volume flowrate of various OC.
Sustainability 15 02025 g004
Figure 5. Relation between power and frequency change.
Sustainability 15 02025 g005
Figure 6. Diagram of ventilation performance coefficient.
Sustainability 15 02025 g006
Figure 7. The change of octave at the fan inlet.
Sustainability 15 02025 g007
Figure 8. The change of octave at the fan shell.
Sustainability 15 02025 g008
Figure 9. Spectrum diagram of fan inlet.
Sustainability 15 02025 g009
Figure 10. Spectrum diagram of fan shell.
Sustainability 15 02025 g010
Figure 11. High-risk noise NR index.
Sustainability 15 02025 g011
Figure 12. NR curve cluster and high-risk area.
Sustainability 15 02025 g012
Table 1. Experimental conditions.
OCGroup AGroup BGroup C
1234567891011
supply frequency (Hz)2527.53032.53537.54042.54547.550
Table 2. Spectrum estimation of aerodynamic noise.
Classification of Aerodynamic NoiseRange of Frequency/HzSPL Range/dB
Laminar vortex shedding noise0~184037~78
Laminar boundary layer noise2600~8700
Turbulence vortex shedding noise1800~680050~110
Turbulence boundary layer noise0~900040~87
Table 3. Actual speed under variable frequency adjustment.
OC1234567891011
Fan rotational speed/(r·min−1)85382591510161116122312081312140914651480
Disclaimer/Publisher’s Note: The statements, opinions and data contained in all publications are solely those of the individual author(s) and contributor(s) and not of MDPI and/or the editor(s). MDPI and/or the editor(s) disclaim responsibility for any injury to people or property resulting from any ideas, methods, instructions or products referred to in the content.

