Article

Comparative Assessment of the Dyeing Process for Pristine and Modified Cotton Fabrics towards the Reduction of the Environmental Fingerprint

by
Zoi G. Lada
1,2,*,
Georgios N. Mathioudakis
1,
Silvia Pavlidou
3,
Georgios Goulas
4,
Charalampos Anastasopoulos
2,
Georgios Bokias
2,
Konstantinos S. Andrikopoulos
1,5 and
George A. Voyiatzis
1,*
1
Foundation for Research and Technology-Hellas, Institute of Chemical Engineering Sciences, (FORTH/ICE-HT), Stadiou Str. Platani, GR-265 04 Patras, Greece
2
Department of Chemistry, University of Patras, GR-265 00 Patras, Greece
3
MIRTEC S.A., 72th km Athens-Lamia National Road, P.O. Box 150, GR-322 00 Schimatari, Greece
4
COLORA S.A., P.O. Box 60590, GR-570 01 Thermi, Greece
5
Department of Physics, University of Patras, GR-265 00 Patras, Greece
*
Authors to whom correspondence should be addressed.
Sustainability 2023, 15(4), 3144; https://doi.org/10.3390/su15043144
Submission received: 28 December 2022 / Revised: 27 January 2023 / Accepted: 7 February 2023 / Published: 9 February 2023
(This article belongs to the Special Issue Sustainability in Textiles)

Abstract

:
Though an important and chronic source of dyes released to the environment, the determination of the release of dyes that occurs during household or industrial washing is usually disregarded. The main scope of this study is to reveal the extent of dye release through washing, and to understand if the modification of cotton fabrics with cationic polymers could reduce it. Modified cotton fabrics, dyed with Acid Blue 281 (AB) or by a mixture of the reactive dyes Novacron Yellow S-3R (NY), Novacron Ruby S-3B (NR) and Novacron Dark Blue S-GL (NDB), underwent a certified washing process. The dyed fabrics were analyzed colorimetrically, while the washing waters were analyzed spectroscopically, via UV/Vis absorption and surface enhanced Raman scattering (SERS). In the modified fabrics dyed with the acid dye, an increased dye uptake was noticed that exhibited a color intensity of K/S~16, compared to K/S~0.45 of the unmodified fabrics. The corresponding normalized dye release (dye concentration/color intensity factor) in the wash water was ~1.6 for the modified fabrics, compared to ~6.5 in the case of the unmodified fabrics, indicating the significance of cotton modification on both the dye uptake and dye release during washing. In the fabrics dyed with a mixture of selected reactive dyes, the color uptake of modified (K/S~10) was also increased compared with unmodified fabrics (K/S~4.5). An important observation, is that in the case of the dyeing of the reactive dyes mixture, a selectivity on the part of the dye uptake was noticed, since the contribution of NY (yellow) is higher compared to that of the blue (positive value of color indicator coordinate (b)); however, this also resulted in an increased NY dye release during washing. The findings of this study could contribute to the dye release problem control due to fabric washing, and to the understanding of any potential selectivity on the part of dye–cotton interactions.

1. Introduction

Textiles are considered an important class of materials necessary for covering our every-day needs and rank second among human needs after food [1,2]. The textile industry consists of several process steps including the conversion of fibers into yarns and yarns to fabrics. Finishing of the fabrics is achieved through a variety of manufacturing and dyeing operations of either yarns or fabrics [3,4]. Dyeing is the application of dyes to textile materials such as fibers, yarns and fabrics with the goal of achieving the desired color fastness. In the textile industry, during wet processing, several dyes, chemicals and reagents are required to comply with the needs of fabric production. Annually, approximately 7 × 10⁵ tons of synthetic dyes are produced worldwide for textile industries [5]. The most common class of synthetic dyes used by textile industries is the azo type, which includes reactive, acid and disperse dyes. Currently, cotton is the most preferable fabric in textiles for apparel and home furnishings [6,7]. The use of reactive dyes for cellulosic textiles is constantly increasing and different reactive dyes have been developed, particularly for color differentiation and wash fastness. The increased interest in these dyes stems from the ability of reactive dyes to form a covalent bond with cellulose when the dyeing process occurs in the presence of salt in order to reduce dye–cotton repellency or by chemically modifying cotton fabrics to promote the interaction [8,9,10,11]. However, color fading and dye release of fabrics during domestic washing are still common consumer concerns [7,12]. Furthermore, analogous problems may arise when acid dyes are used instead, where the interaction between the acid dye and the cotton is very weak [13]. An effective approach to increase cotton–dye interactions and avoid any electrostatic repulsions between cellulose and dyes is the chemical modification of cotton fabrics with cationic groups [14,15,16,17,18,19,20,21,22]. Among the various modification approaches, the use of polymers with cationic or amino groups shows advantages such as enhanced reactivity with cotton fibers and dyeing agent penetrability, and homogenous dyeing, which are very promising features in real application [23,24,25]. The medium or weak binding of dyes to the fabric leads to their discharge as effluent into the aquatic environment, with significant negative consequences on the environment and human health; the associated wastewater treatment also has a socioeconomic impact [26,27,28]. In particular, the accumulation of dyes in aquatic systems could be responsible for the following: (a) the deterioration of the quality of water and soil, reducing soil fertility and inducing photosynthetic activity of aquatic plants with the development of anoxic conditions for aquatic fauna and flora; and (b) for diseases in living organisms, such as dermatitis or even disorders of the central nervous, mutagenicity and carcinogenicity [29]. In addition, textile dyes reduce the esthetic quality of water by increasing biochemical and chemical oxygen demand, affecting photosynthesis and plant growth. Additionally, dyes enter the food chain, where they can cause significant recalcitrance and bioaccumulation, promoting their toxicity [30,31]. In one way or another, we are therefore led to an increased presence of dyes in textile wastewater, with a tendency of these dyes to bioaccumulate and become a threat to both the environment and human health [32]. Nevertheless, there has been limited effort to assess the dye release that occurs during the household or industrial washing of fabrics [33,34,35,36].
In the context of the sustainability of textiles, the main goal is twofold: firstly, to extend the life of textiles by improving their dye uptake properties through the utilization of novel cationic polymer structures for cotton modification, and, secondly, to minimize water pollution during fabrics time in a washing bath. The advantages deriving from the modification of cotton with polymers that are associated with the interactions between the modifiers—cottons, as well as dyes, have been demonstrated [37]. The current study mainly focuses on evaluating the extent of dye release that takes place during washing, and tries to verify whether the modification of cotton fabrics could minimize/prohibit this dye release. In this regard, modifications of cotton fabrics with two differently structured cationic copolymers bearing active sites for electrostatic and covalent interactions with dyes and cotton (Scheme 1b), have been performed. The modified fabrics were then appropriately dyed with two different classes of dyes (Figure 1a), either a representative acid dye or a mixture of three different colored reactive dyes. The dyeing was performed on a laboratory as well as an industrial scale. Unmodified fabrics were also dyed using the same dyeing protocols in order to draw comparisons. Colorimetric analysis was applied to the dyed fabrics to evaluate the dyeing process for each of them. The washing bath of these fabrics was thoroughly analyzed/investigated with respect to identification and quantification of the released dyes. This was achieved via spectroscopic techniques that included the conventional UV/Vis absorption as well as the surface enhanced Raman scattering (SERS) technique. The latter has previously been introduced as an advanced analytical tool for the quantification of molecules at very low detection limits with structural specificity, and has been reported to be able to detect even single or very few molecules [38]. An additional task of the study, related to the case of dyeing with a ternary combination, is to identify any potential selectivity of dyes binding onto the modified fabrics. The quantification of each dye released in the wash effluent and the evaluation of the efficiency of the dyeing process are expected to have positive socio-economic and health impacts, as well as supporting role on the reliable estimation of the extent of the associated environmental footprint.

2. Materials and Methods

2.1. Materials and Reagents

The acid dye, Acid Blue 281 (AB) and the reactive dyes Novacron Yellow S-3R (NY), Novacron Ruby S-3B (NR) and Novacron Dark Blue S-GL (NDB) were all provided by “Colora S.A.”; their chemical structures are illustrated in Scheme 1. The substrate was cotton knit and was also provided by “COLORA S.A.” (areal density: 12,862 g/m2, yarn density 30/1 Ne). All materials and reagents used in the present study were used without further purification. Calibration curves of model aqueous solutions of all dyes with soap water (simulating the washing conditions, surfactant concentration equal to 4 g/L) at different concentrations (i.e., 5 to 50 μg/mL) were constructed for both UV/Vis and SERS quantitative measurements of the dyes in wash water. The polymers used for the modification of the cotton fabrics are also shown in Scheme 1, indicated as Polymer 1 and Polymer 2 in the following section. The synthetic procedures for the polymer modifiers are described in S1.

2.2. Cotton Fabrics Treated with Polymers, Dyeing Procedure and Washing Procedure of Colored Fabrics

The fabric modification and dyeing procedures are described in S2 and S3, respectively. The dyeing process was performed in the absence of salt, which was feasible due to the polymeric modification of the pristine cotton fabric. The cotton fabrics modified either by Polymer 1 or Polymer 2 were dyed either by the acid dye AB, or a mixture of equal amounts of the reactive dyes (NY, NR, NDB).
Washing was carried out in an Ahiba Polymat microwasher (Figure S5), at 40 °C for 30 min, according to ISO 105-C06 Fastness to Washing. Color fastness to washing was evaluated according to the standards defined in the ‘Textiles—Tests for color fastness Part C06: Color fastness to domestic and commercial laundering’ standard.

2.3. Colorimetric Analysis of the Colored Fabrics

The evaluation of the dyeing process was performed through a spectral colorimetry reflectance analysis of the colored fabrics (colorimeter Data Color). The color coordinates were measured by using CIELAB, the most complete and widespread method defined by the International Commission on Illumination which describes all the colors visible to the human eye and acts as a device-independent model [39,40]. The CIELAB scale generally gives better approximation to visual evaluation of color difference for very dark colors and expands the yellow region of color in comparison with Hunter L, a, b scale. The three coordinates of CIELAB (Figure S1) comprise of the color lightness (L* = 0 yields black and L* = 100 indicates diffuse white), a* (positive values indicate red color, while negative values indicate green color) and b* (positive values indicate yellow, while negative values indicate blue color).
The color difference between two samples is expressed by the index ΔE*, which corresponds to the “distance” of the colors on the CIELAB chart (Figure S1), and is mathematically given by the following relationship:
Δ E * = ( Δ α * ) 2 + ( Δ b * ) 2 + ( Δ L * ) 2
Another important parameter determined colorimetrically is the “color intensity”, which is expressed through the K/S ratio of the Kubelka–Munk equation:
K S = ( 1 R ) 2 2 R
where R corresponds to the reflectance index, K to the absorbance index and S to the scattering index.
In practice, the ΔE* value is used when two shades are to be compared. Color intensity, i.e., the K/S ratio, is the parameter used to evaluate dyeing processes, dyeability, etc., as it is proportional to the concentration of the color in the sample. In theory, the value of K/S should be given for each wavelength in the range of the spectrum under consideration. However, only one value of K/S for each sample tends to be provided, the one at the wavelength where maximum absorption is observed. Therefore, in the present study, as a measure to evaluate the dyeability, the intensity of the color is used, i.e., the K/S ratio. Evaluation of color gradation is performed by dyeing the differently modified samples in the same bath as the unmodified samples and determining their color intensity after dyeing. Finally, the homogeneity of the fabric’s color is evaluated through the determination of the maximum color difference (ΔE*) between different points of the fabric. In the case of the industrially prepared colored fabrics, the standard deviation of the color intensity (K/S) in different parts of the fabric has also been determined as a synergistic factor for the color’s homogeneity evaluation. Obviously, the higher these parameters are, the less homogeneity they indicate.

2.4. Analysis of Washing Bath through UV/Vis Spectroscopy

Washing baths of blue (dyed with the acid dye AB) and brown (dyed with the reactive dyes NY, NR, NDB) colored cotton fabrics were analyzed by UV/Vis spectroscopy. Quantification of dye release for AB, NY, NR and NDB was performed via the absorbance maximum at 594 nm, 420 nm, 546 nm and 618 nm, respectively.
The UV/Vis absorption spectra of all dyes solutions were recorded by a Hitachi U-3000 UV/Vis spectrometer. The reference beam was delivered through an optical cell filled with soap reference solution in triple-distilled water with surfactant concentration equal to 4 g/L. The spectra were recorded from 800 to 200 nm with a slit of 0.5 nm.

2.5. Analysis of Washing Bath through Surface Enhanced Raman Scattering (SERS)

For the analysis of the washing baths, the SERS technique was also implemented for the brown fabrics dyed by the mixture of the anionic reactive dyes. An Ag NPs/PLL type nanocolloidal suspension was used to generate the SERS spectra. This was prepared by the chemical reduction of silver nitrate with sodium citrate according to the Lee and Meisel method [41]. In order to bring anionic dyes in close proximity to Ag NPs for the SERS signal optimization, a solution of 0.1 w/v poly-L-lysine (PLL) in a 1:1 ratio was subsequently added in order to coat the colloidal particles surface [42] with pendent positively charged groups. Analytical grade silver nitrate > 99.99% (CAS Number: 7761-88-8, sodium citrate tribasic dihydrate 99.0% (CAS Number: 6132-04-3) and poly-L-lysine (CAS Number: 25988-63)-0 were purchased from Sigma-Aldrich. The analysis of the wash water of blue fabrics (dyed by AB) did not provide any information, probably due to the chemical structure of AB and its subsequently low interaction with the colloidal suspension.
The SERS spectra were excited with a He–Ne laser (OptronicsTechnologies S.A. model HLA-20P, 20 mW) operating at 632.8 nm with a laser power on the sample of 17 mW. The scattered light was delivered to the spectrograph utilizing a right-angle light scattering collection geometry. The T-64000 spectrometer of Jobin Yvon (ISA-Horiba group) was used in the single spectrograph configuration for the dispersion and detection of the Raman photons via a 600 grooves/mm grating and a Spectraview-2DTM liquid N2-cooled CCD detector, respectively. The spectrometer was calibrated using the standard Raman peaks positions of the cyclohexane at 801.3 and 1444.4 cm−1. The spectral resolution was approximately 4 cm−1.

3. Results

3.1. Cotton Fabrics Colored with Acid Dyes

3.1.1. Colorimetric Analysis

The colored cotton fabrics modified by either Polymer 1 or Polymer 2 were investigated through colorimetric analysis. During this study, our goal was to focus on “un-compatible” or “industrial-simulated” conditions. To that end, we focused firstly on the investigation of the challenging dyeing of acid dyes on cotton modified fabrics. Secondly, we focused on the investigation of a tricolored system consisting of reactive dyes which are able to interact with cotton, simulating industrial realistic conditions in order to obtain direct feedback towards the sustainability of the process. In the first attempt, an acid dye was used for the dyeing of the modified fabrics (AB). Under the applied dyeing conditions, a high dye exhaustion (~85–88%) was found in the cases of modified cotton fabrics. In Figure S2 the modified colored fabrics along with the colored unmodified fabric are presented. It is apparent by observation with the naked eye that both polymers actively contribute to the dye uptake of the fabrics, since a very pale blue color was noticed for the unmodified fabric, compared with the intense blue color of the modified fabrics. In order to quantify this trend, we determined the color coordinates (L, a*, b*) based on the CIELAB method, where the factors of color intensity (K/S) and color difference (ΔΕ*) were also calculated as indicators of the coloring effectiveness and homogeneity, respectively. In Table 1 the color coordinates (L, a*, b*) and the factors K/S and ΔΕ* (the average values of 10 measurements) are presented for the modified cotton fabrics, while the values for the unmodified fabric are also presented for comparison. The color coordinates of the pristine cotton fabric were L = 91.00, a = 0.21, b = 2.02 and with brightness of 68.5 Berger.
In terms of color intensity, the unmodified samples showed an extremely low K/S value, as expected, given that unmodified cotton is not easily susceptible to dyeing with acid dyes. Comparing the two different polymers used as cotton modifiers, a slightly higher color intensity was displayed for the sample modified with Polymer 2, indicating a better interaction between the acid dye and this modified fabric. In addition, the color difference ΔΕ* between the unmodified and the modified sample was 51.59 and 50.72, for Polymer 1 and Polymer 2, respectively, indicating a slightly better uniformity for Polymer 2. It is important to note that subsequently, in the contingent release study, the color intensity K/S was used as normalization factor, since the color intensity on the fabric rationally affects the dye release concentration.

3.1.2. Evaluation of the Dye Release on Washing Bath of Fabrics Dyed with Acid Dye

For evaluation of the dye release occurring during washing, specific washing protocols were followed and the washing bath was selected for further spectroscopic analysis. In Figure 1a the UV/Vis spectra of the wash water for the unmodified and the two modified fabrics are shown. AB release was noticed for both modified fabrics, exhibiting higher concentration in wash water for the fabric modified with Polymer 2 and for the unmodified fabric. In particular, based on the calibration curve of AB, the concentration of the AB in the wash water was 24.16 and 28.5 μg/mL for the fabric modified with Polymer 1 and 2, respectively, and 2.41–2.53 μg/mL for the unmodified fabric. However, we should bear in mind that the color intensity of the color fabric, i.e., the dye uptake on the fabric, naturally affects the dye release concentration. Therefore, the concentration of the dye in the washing bath is to be normalized with the color intensity factor. In this context, the absorbance on the washing bath of both samples has been divided by the K/S factor determined in Section 3.1 (Figure 1b, Table 2). Hence, the normalized dye release in the wash water was calculated to be 1.63 and 1.66 for the fabric modified with Polymer 1 and 2, respectively, and 5.03–6.49 for the unmodified fabric. It is therefore evident that the dye release/fastness is similar for both polymeric modifiers and significantly lower/higher compared with the unmodified fabric. Therefore, the modification of the fabric improved the dye uptake of the acid dye.
Figure 1. The UV/Vis spectra of the washing bath when (a) fabric was modified with Polymer 1 and Polymer 2 (the UV/Vis spectrum of acid blue 281 with C = 40 μg/mL is also provided for comparison), and (b) the normalized UV/Vis spectra after normalization with color intensity K/S factor.
Sustainability 15 03144 g001

3.2. Tricolored Cotton Fabrics with Reactive Dyes

3.2.1. Colorimetric Analysis

An analogous study was performed for fabrics in which the mixture of three different reactive dyes, namely Novacron Yellow S-3R (NY), Novacron Ruby S-3B (NR) and Novacron Dark Blue S-GL (NDB), used during the dyeing process. More specifically, equal amounts of the three dyes were mixed in the same dyeing bath resulting brown colored fabrics (modified or not) as shown in Figure S3. It is also obvious in this case, even to the naked eye, that both polymers actively contribute to the dye uptake on the fabrics; the unmodified fabric was also colored, however in a pale brown fade.
It is worth noting that reactive dyes are generally used for the dyeing of cotton and therefore color uptake is anticipated. However, the modification of the fabrics with Polymer 1 and Polymer 2 seem to promote the dye uptake. The color coordinates (L, a*, b*) based on CIELAB method, and the factors of color intensity (K/S) and color difference (ΔΕ*) were also calculated as indicators of the coloring effectiveness and uniformity, respectively. In Table 3 the color coordinates (L, a*, b*) and the factors K/S and ΔΕ* (the average values of 10 measurements) are presented.
In terms of the color intensity achieved in each case, the fabric modified by Polymer 1 showed more than twice the K/S color intensity value. Analogous behavior was also noticed for the fabric modified by Polymer 2 compared with the unmodified fabric. Indeed, from the ΔE* values the color difference between a modified and an unmodified sample dyed simultaneously in the same bath is much higher than that between the two modified samples (when they are also dyed in the same bath). Comparing the two modified fabrics, we notice that a higher color intensity was noticed for the Polymer 1 modified fabric.

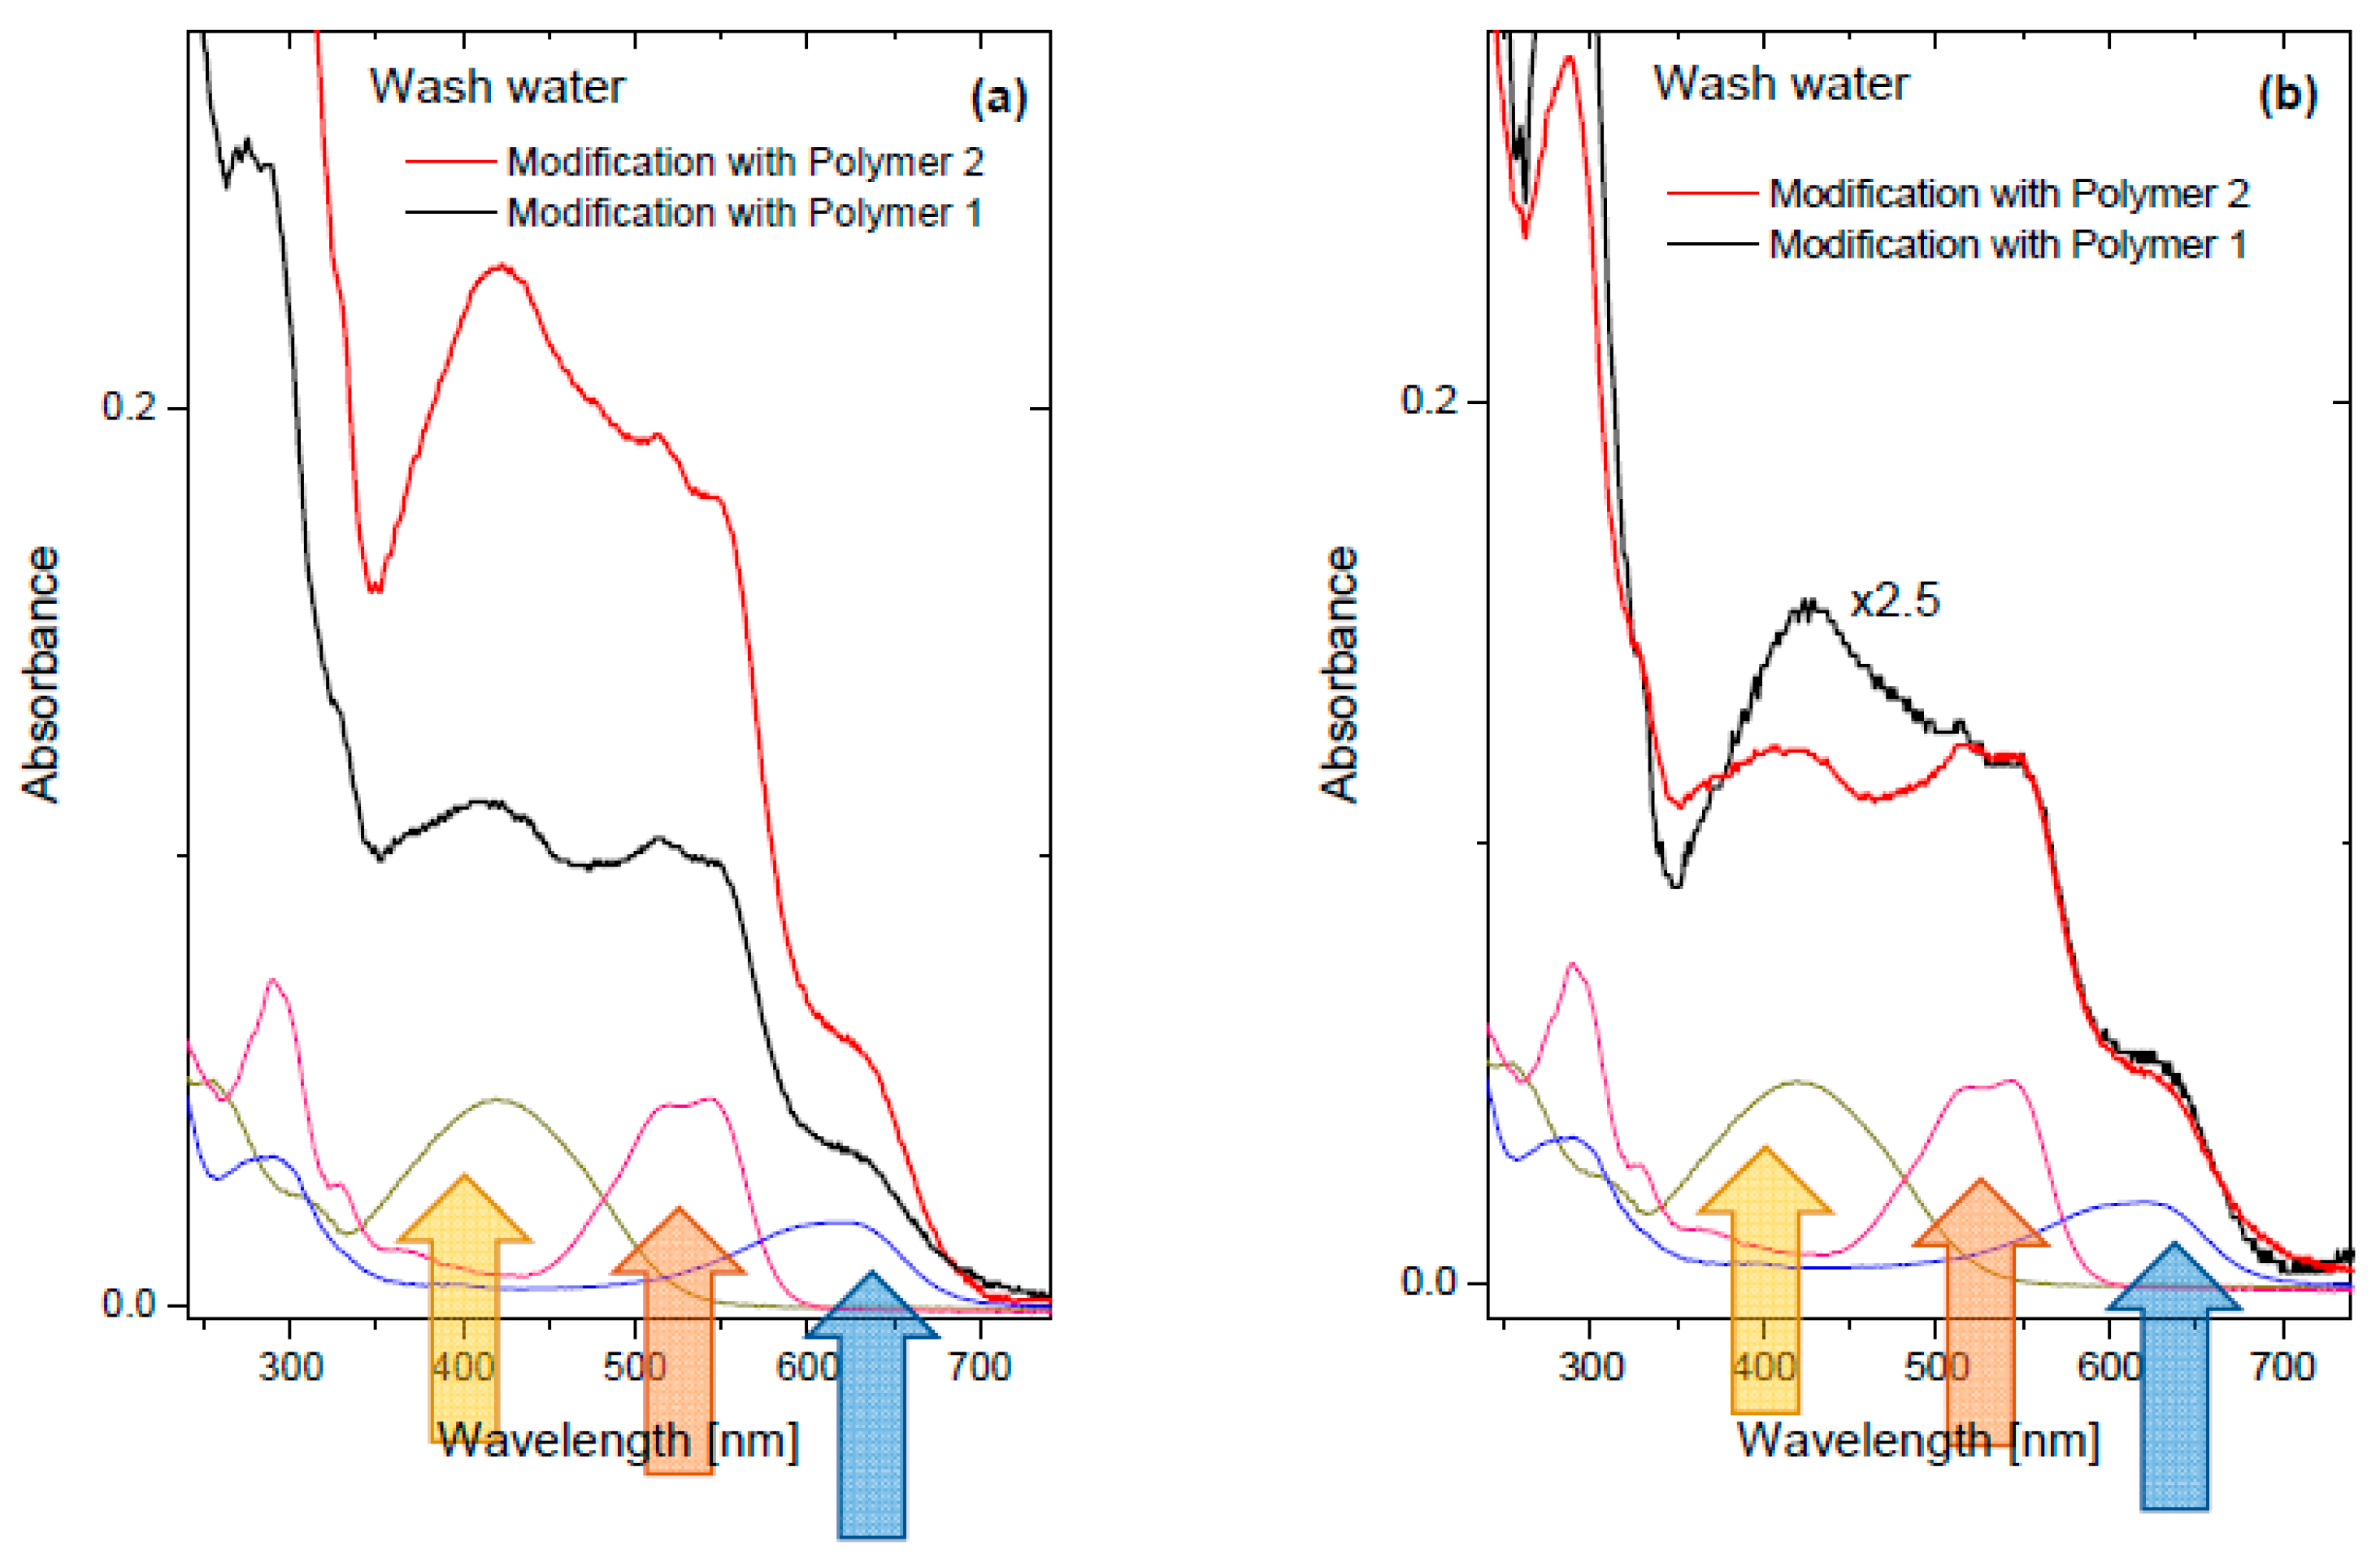
3.2.2. Evaluation of the Dye Release on Wash Water of Fabrics Dyed with Reactive Dyes

The evaluation of the potential dye release was also determined. The main scope of this task was to simulate real industrial conditions, where usually different dyes are used for the dyeing of the fabrics or/and different dyes co-exist in the wastewater. In this context, the wash water was evaluated with two different spectroscopic methods. In Figure 2a the UV/Vis spectra of the wash water for the modified fabrics are presented, showing the characteristic absorbance bands of all dyes. Based on the calibration curves, the concentration of the dye release for the fabric modified with Polymer 1 was 7.20 μg/mL, 4.20 μg/mL and 3.27 μg/mL for Novacron Ruby, Novacron Dark Blue and Novacron Yellow, respectively, while for the fabric modified by Polymer 2 the corresponding values were 9.86 μg/mL, 4.20 μg/mL and 10.5 μg/mL, respectively (Table 4).
It is apparent that a greater release was noticed when the fabric was modified with Polymer 2, in spite of the fact that K/S and therefore color uptake was lower for this case. Normalizing the spectra based on the absorption peak attributed to the red color (NR), we observe that the release of the yellow dye (NY) is more intense while the yellow dye seems to be more effectively attached in the case of the modification with Polymer 1. In the case of the blue dye (NDB) no strong differentiation is seen. This indicates that there is a possibility of differentiating retention of various colors during their contemporary presence. If we also consider the colorimetric measurements of the dyed fabrics before washing (Table 3) and take into account that the more positive the +b index (Figure S1) the stronger the contribution of the yellow color, we can conclude that the yellow dye binds more strongly than the red color, while the value of +b is greater in the case of modification with Polymer 2. In a more practical aspect, this probably means that a greater amount of yellow color is released because a greater amount of yellow dye has also adhered to the fabric with Polymer 2. The increased NY dye uptake for both modified polymers may be attributed to the chemical structure of the dye, which possesses higher number of available interacting groups (SO3, NH2) with low steric hindrance and a linear “skeleton” promoting the dye-modified polymer binding.

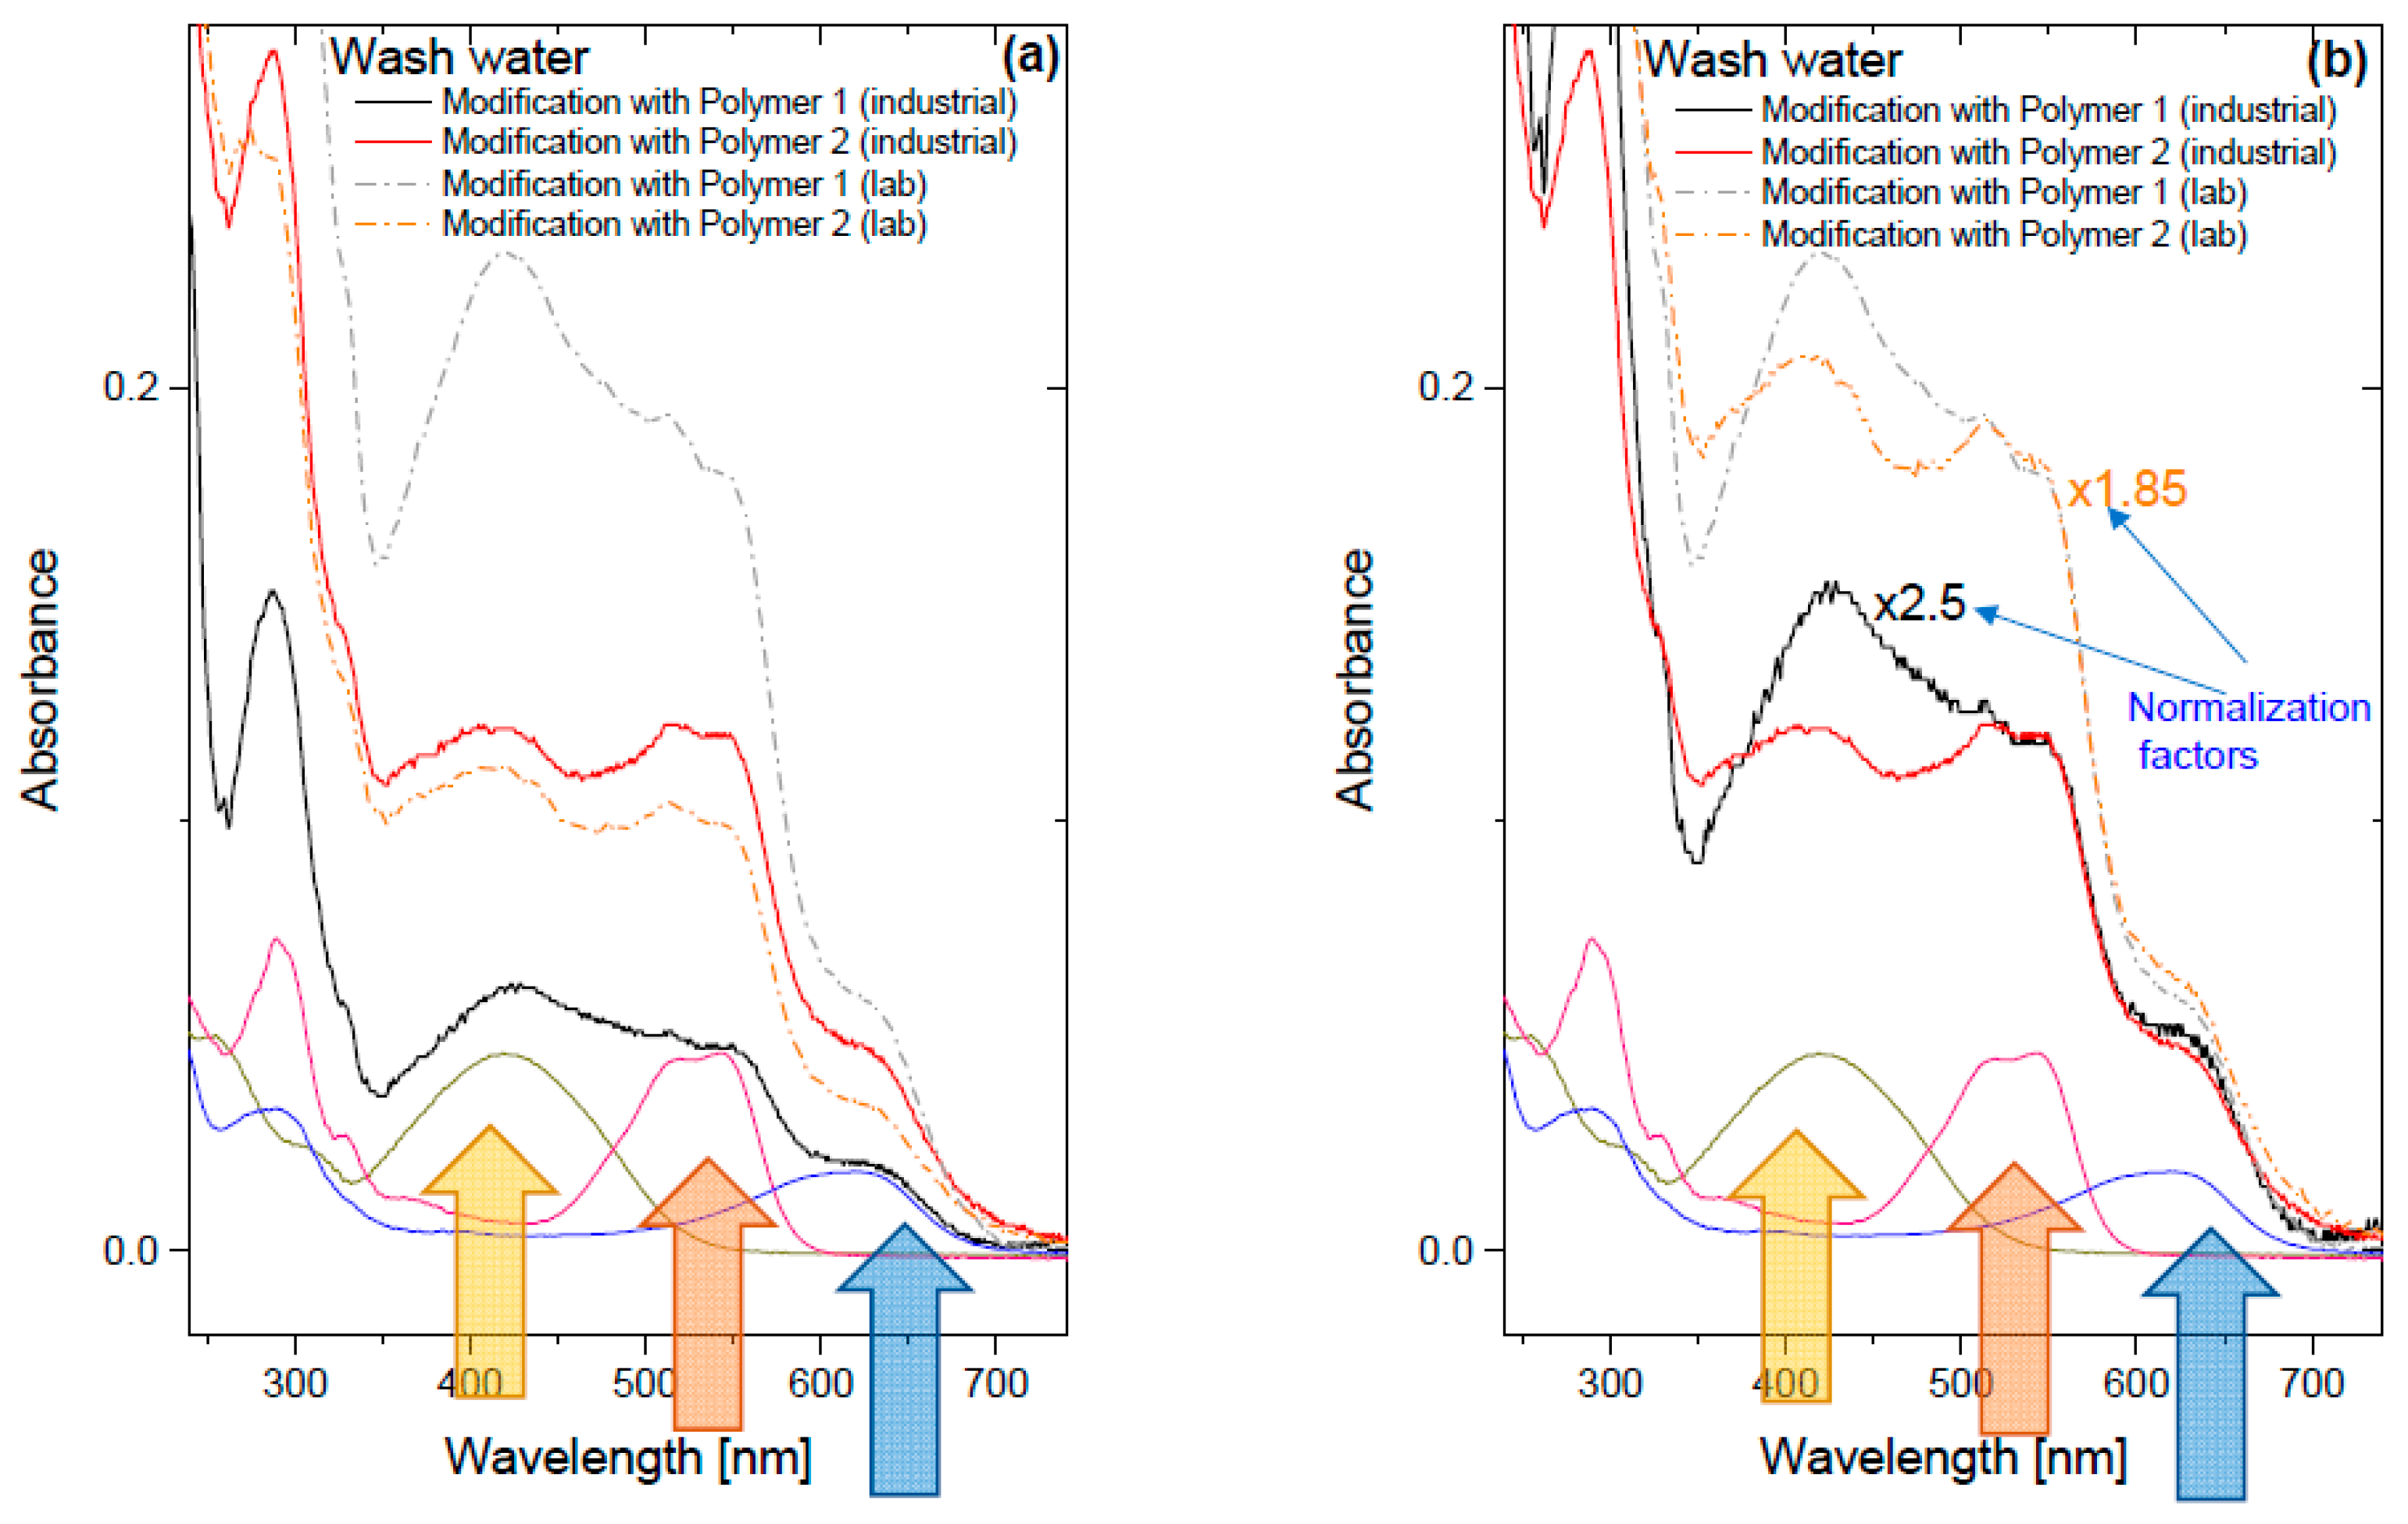
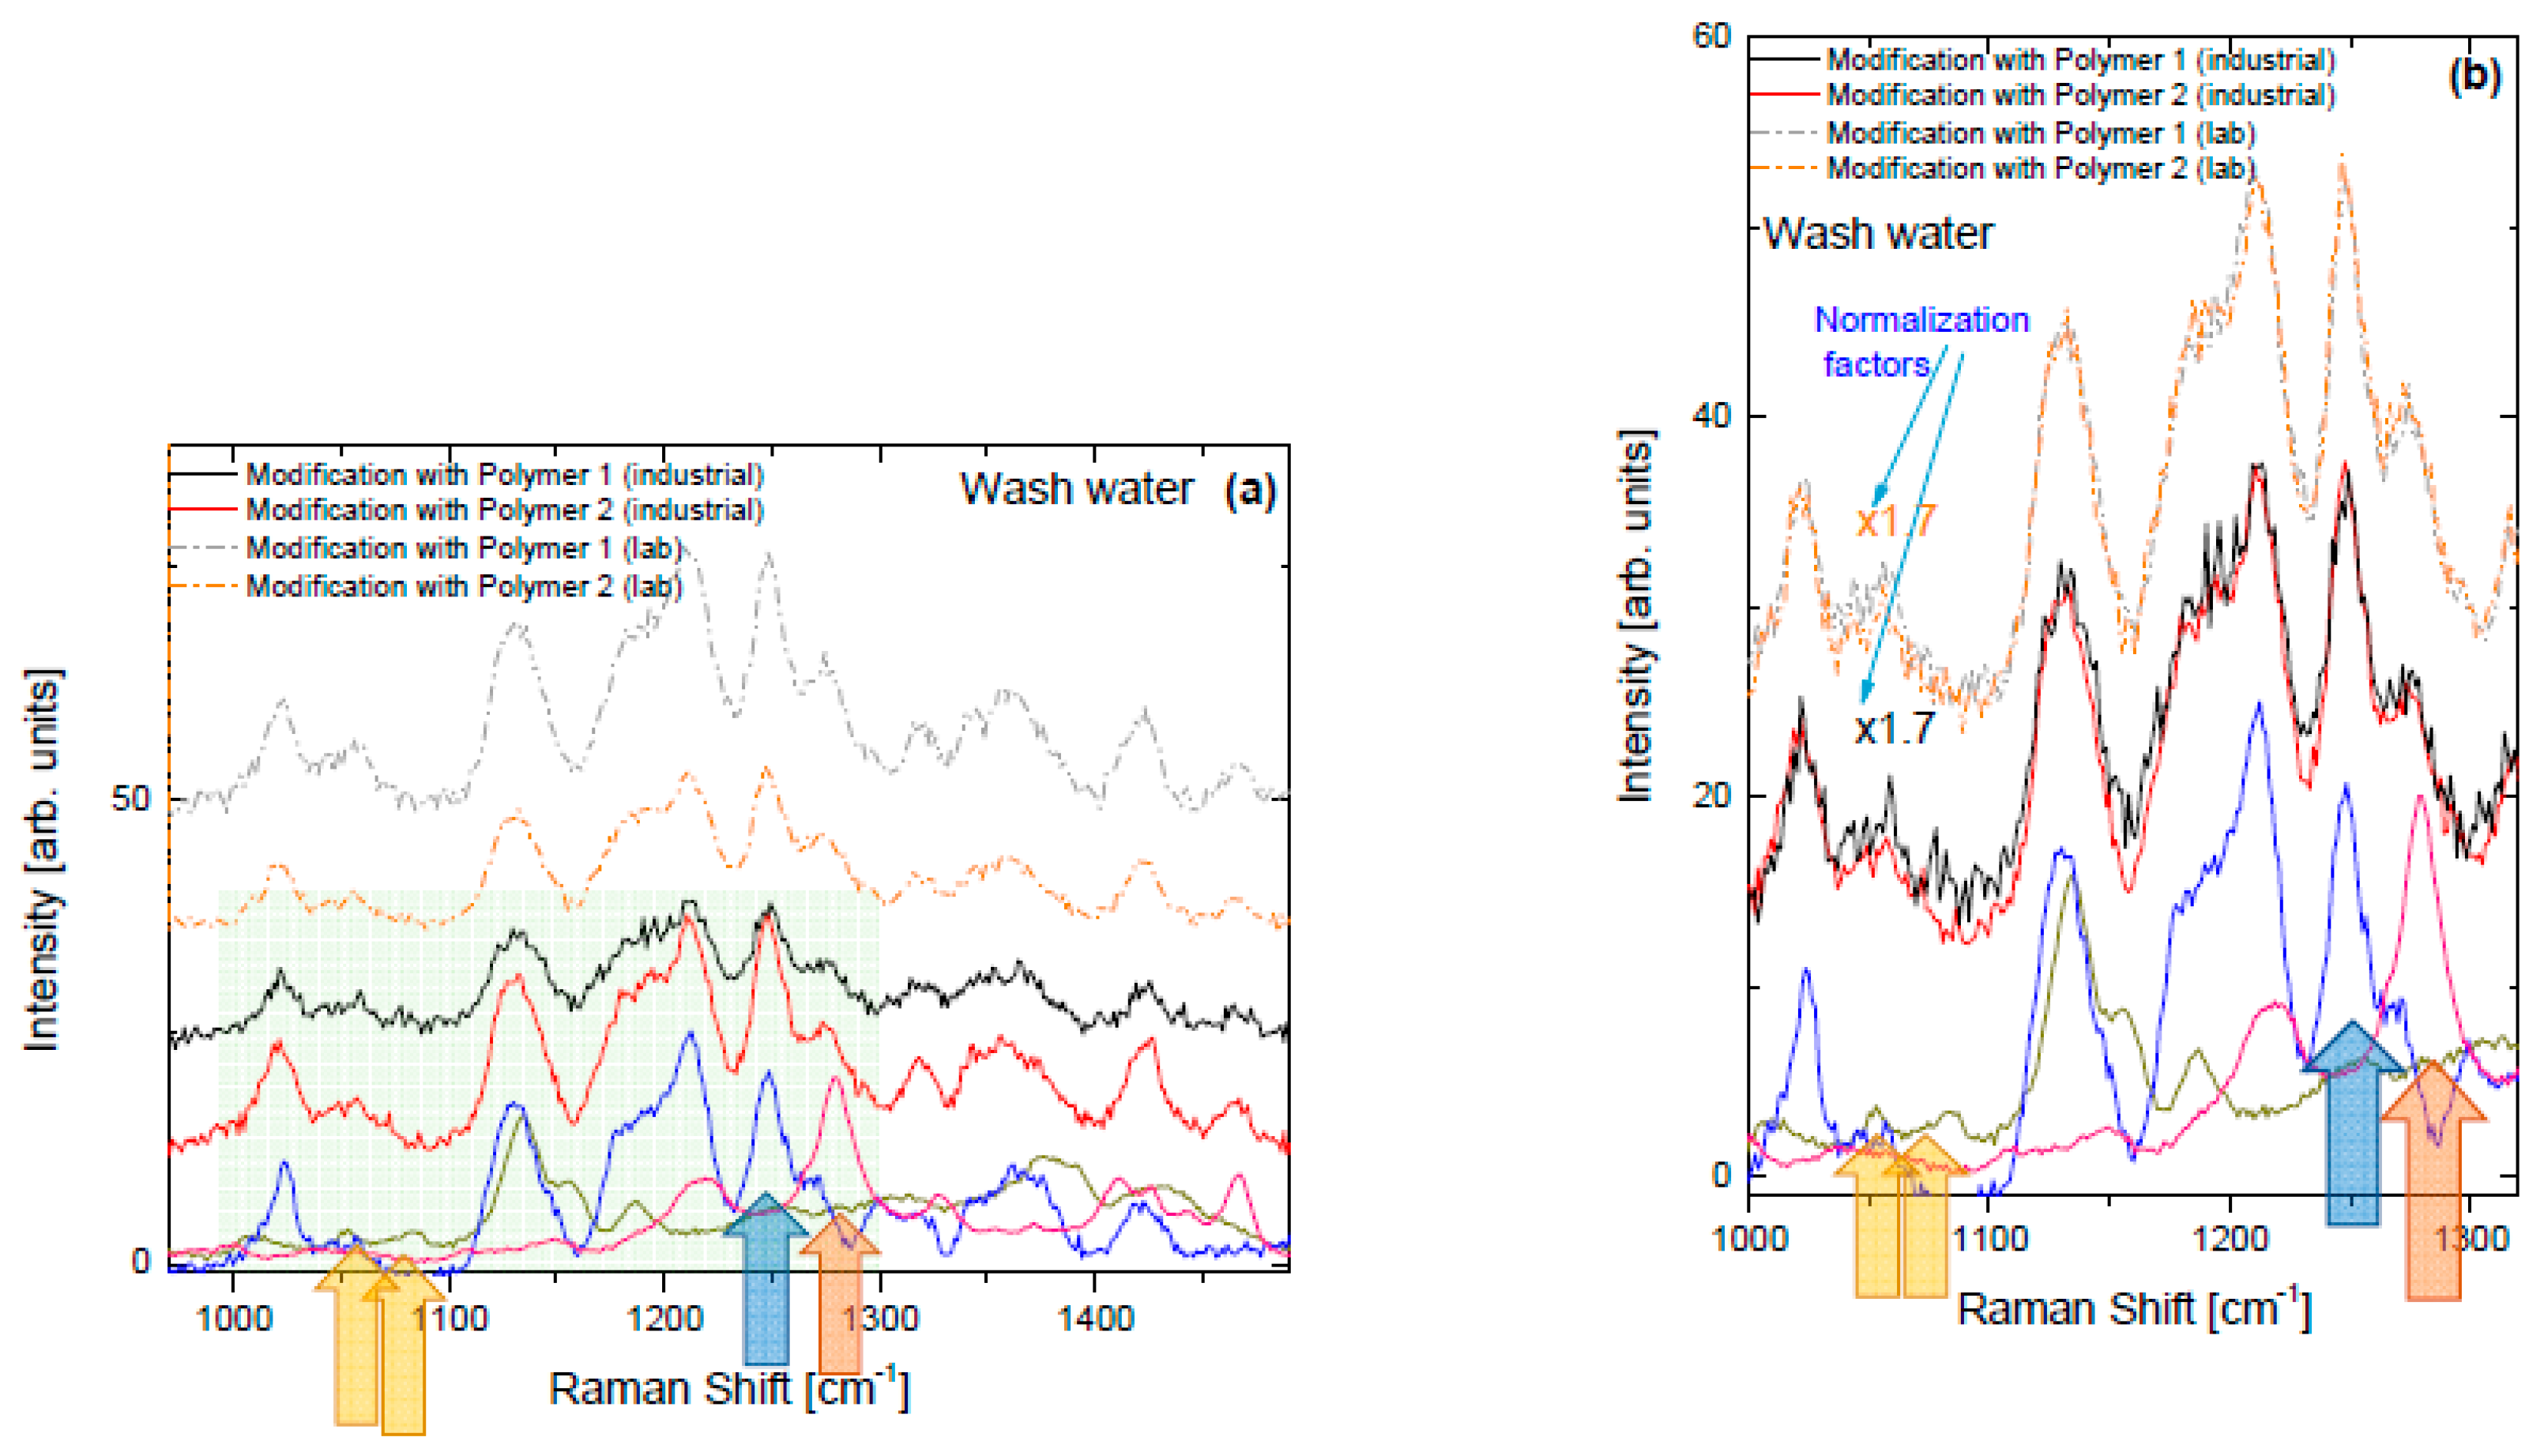
3.2.3. Evaluation at Industrial Scale

Wanting to further expand the study to realistic conditions, we performed the latter study to industrially prepared fabrics. In Table 5 the color coordinates (L, a*, b*) and the color intensity (K/S) and the color homogeneity factors for the industrially prepared unmodified and modified fabrics are presented.
Colorimetry measurements demonstrate significantly more efficient dyeing on the modified substrates than the unmodified substrate. No significant difference is observed between the two modified fabrics in terms of K/S color intensity. Here it is important to note that the color homogeneity indexes, especially for modified substrates, confirm that dyeing in industrial conditions leads to uniformly dyed fabrics. Indeed, both the values of the maximum ΔE* selected from different points of each sample, remain < 1.5 for the modified fabrics, significantly lower than the values recorded in the cases of the lab-prepared samples.
In Figure 3a the UV/Vis spectra of the wash water for the industrially prepared fabrics are presented along with the lab-scale fabrics for comparison. Based on the calibration curves, the concentration of the dye release for the fabric modified with Polymer 1 was 8.37 μg/mL, 5.28 μg/mL and 3.86 μg/mL for NR, NDB and NY, respectively, while for the fabric modified by Polymer 2 the corresponding values were 2.9 μg/mL, 2.3 μg/mL and 1.2 μg/mL (Table 6). We notice that the concentration of all dyes released in the wash water was high for the lab-scale fabric modified with Polymer 2, while it was much lower for the industrial scale one. On the other hand, in the case of modification with Polymer 1, the released concentration is for all dyes of moderate intensity, with similar values for lab and industrial scale samples. An analogous trend for the contribution of the yellow color, observed for the lab scale samples, is noticed for the industrially prepared samples as well (Figure 3b). It is encouraging that at the industrial scale, the modifiers promote the dye uptake on the fabric. Based on the concentration of the dye release during washing, Polymer 1 exhibited moderate release.

3.2.4. Evaluation of Washing Bath at Both Lab and Industrial Scale Samples

Surface enhanced Raman scattering (SERS) was implemented for the analysis of the washing baths. The main reason that SERS was also examined was to reveal any structural differences due to the co-existence of the dyes, but also because SERS has been established as a useful analytical method for the detection of species at very low detection limits (detection of dyes at pg/mL concentration level has been reported) [43,44]. Therefore, SERS could be useful in our study since reactive dyes are anticipated to interact intensely with cotton and subsequently a lower concentration of dye release during washing is anticipated to be recorded. The observations/interpretations of the UV/Vis analysis were also noticed through SERS. In particular, in the SERS spectra of the wash water (Figure 4) we can observe the contribution of all three dyes (based on the SERS spectra of separate solutions of each dye). In the spectral region 1000–1300 cm−1, a characteristic peak of NR is located at 1280 cm−1, of NDB at 1248 cm−1 and two weak peaks of NY at ~1050 cm−1. Higher dye release, for the industrially prepared fabric modified with Polymer 2, compared with the lab scale sample was also noticed through SERS, while moderate and similar releases were noticed for the fabrics modified with Polymer 1 (either in lab or industrial environment). Based on the calibration curves for the lab-prepared samples, the concentration of the dye release for the modified fabrics for NR and NDB were comparable with those deriving from UV/Vis. In addition, after the normalization of the spectra based on the contribution of NR, we observed with SERS that there was a more intense release for the yellow dye (NY), regardless of the preparation method or the modifier, though it was more intense for the lab-prepared sample modified with Polymer 2.
It is also important to note that the SERS spectra of wash water are more or less a combination of the SERS spectra of the individual dye solutions, probably indicating that the chemical composition of the dyes does not intervene on the dyeing process.

4. Conclusions

Colorimetric measurements revealed a significant increase in dye uptake for acid and especially reactive dyes, due to fabric modification. Analysis of the wash bath indicates a correspondingly low release for the reactive dyes, which appear to be closely bound to the modified cotton. However, in the case of the acid dye, a high concentration was recorded in the wash water (up to 28.5 μg/mL), due to its apparently moderate interaction with the modified cotton. In the case of the mixture of three reactive dyes (brown colored fabrics), along with the increased dye uptake being recorded for the modified fabrics (K/S up to 10.35 of the modified fabric compared to 4.68 of the unmodified fabric), a less intense dye release occurred (up to 10.5, 9.86 and 4.2 μg/mL for NY, NR and NDB, respectively) compared to the acid dye. A selectivity on the part of the Novacron yellow dye was revealed by its pronounced uptake increase during the dyeing process; a concurrent increase of its release was manifested during the wash bath, brought to light by UV/Vis and SERS analysis. The findings of this study highlight the importance of the cotton’s modification in promoting its interaction with dyes, while in parallel revealing the necessity to recognize the dye release problem that occurs during washing; this promotes the need for further research on the achievement of strong interactions between cotton fabrics and dyes for the reduction of the environmental fingerprint of the process.

Supplementary Materials

The following supporting information can be downloaded at: https://www.mdpi.com/article/10.3390/su15043144/s1, Figure S1: CIELAB colorimetry system; Figure S2: The three fabrics (unmodified, modified with Polymer 1 and modified with Polymer 2) colored by Acid Blue 281; Figure S3: The three fabrics (unmodified, modified with Polymer 1 and modified with Polymer 2) colored by the mixture of the three reactive dyes Novacron Yellow S-3R (NY) Novacron Ruby S-3B (NR) and Novacron Dark Blue S-GL (NDB); Figure S4: The three industrially prepared fabrics (unmodified, modified with Polymer 1 and modified with Polymer 2) colored by the mixture of the three reactive dyes Novacron Yellow S-3R (NY) Novacron Ruby S-3B (NR) and Novacron Dark Blue S-GL (NDB); Figure S5: Ahiba Polymat washing machine; Figure S6: Calibration curves of soap solutions at various concentrations of the different dyes through UV/Vis spectroscopy; Figure S7: Calibration curves of soap solutions at various concentrations of the different dyes through SERS spectroscopy.

Author Contributions

Z.G.L.: Conceptualization, methodology, validation, investigation, writing—original draft preparation; G.N.M.: Methodology, validation, investigation; S.P.: Methodology, validation, investigation; G.G.: Methodology, validation, investigation; C.A.: Methodology, validation, investigation; G.B.: Methodology, validation, project administration; K.S.A.: Conceptualization, supervision; project administration; G.A.V.: Conceptualization, supervision; project administration; funding acquisition. All authors have read and agreed to the published version of the manuscript.

Funding

This research has been co-financed by the European Union and Greek national funds through the Operational Program Competitiveness, Entrepreneurship and Innovation, under the call RESEARCH-CREATE-INNOVATE (project code: T1EDK-03073), project: “Development of Surface Coating Processes in Cotton Yarns/Fabrics for Single Stage Dyeing with Reduced Environmental Impact” with acronym: ChromaSurf.

Institutional Review Board Statement

Not applicable.

Informed Consent Statement

Not applicable.

Data Availability Statement

Not applicable.

Acknowledgments

The authors would like to acknowledge Antonios Soulis, CEO of Soulis-Kuehnis AG (http://soulis-kuehnis.com/) for helpful discussions and support.

Conflicts of Interest

The authors declare no conflict of interest.

References

  1. Chen, X.; Memon, H.A.; Wang, Y.; Marriam, I.; Tebyetekerwa, M. Circular Economy and Sustainability of the Clothing and Textile Industry. Mater. Circ. Econ. 2021, 3, 12. [Google Scholar] [CrossRef]
  2. Felgueiras, C.; Azoia, N.G.; Gonçalves, C.; Gama, M.; Dourado, F. Trends on the Cellulose-Based Textiles: Raw Materials and Technologies. Front. Bioeng. Biotechnol. 2021, 9, 608826. [Google Scholar] [CrossRef]
  3. Anam, W.; Ashraf, M.; Qadir, M.B.; Akhtar, K.S.; Ahmad, S.; Afzal, A.; Ullah, T. Influence of Yarn Manufacturing Techniques on Dyeing Behavior of Polyester/Cotton Blended Woven Fabrics. Fibers Polym. 2019, 20, 2550–2555. [Google Scholar] [CrossRef]
  4. Mijas, G.; Josa, M.; Cayuela, D.; Riba-Moliner, M. Study of Dyeing Process of Hemp/Cotton Fabrics by Using Natural Dyes Obtained from Rubia tinctorum L. and Calendula officialis. Polymers 2022, 14, 4508. [Google Scholar] [CrossRef] [PubMed]
  5. Chandanshive, V.; Kadam, S.; Rane, N.; Jeon, B.-H.; Jadhav, J.; Govindwar, S. In situ textile wastewater treatment in high rate transpiration system furrows planted with aquatic macrophytes and floating phytobeds. Chemosphere 2020, 252, 126513. [Google Scholar] [CrossRef]
  6. Arif, N.; Eka Mulya, A. A Review of Isocyanate Wood Adhesive: A Case Study in Indonesia. In Applied Adhesive Bonding in Science and Technology; Chapter 5; Halil, Ö., Ed.; IntechOpen: Rijeka, Croatia, 2017. [Google Scholar]
  7. Al-Tohamy, R.; Ali, S.S.; Li, F.; Okasha, K.M.; Mahmoud, Y.A.G.; Elsamahy, T.; Sun, J. A critical review on the treatment of dye-containing wastewater: Ecotoxicological and health concerns of textile dyes and possible remediation approaches for environmental safety. Ecotoxicol. Environ. Saf. 2022, 231, 113160. [Google Scholar] [CrossRef]
  8. Khatri, A.; Peerzada, M.H.; Mohsin, M.; White, M. A review on developments in dyeing cotton fabrics with reactive dyes for reducing effluent pollution. J. Clean. Prod. 2015, 87, 50–57. [Google Scholar] [CrossRef]
  9. Cai, Y.; Pailthorpe, M.T.; David, S.K. A New Method for Improving the Dyeability of Cotton with Reactive Dyes. Text. Res. J. 1999, 69, 440–446. [Google Scholar] [CrossRef]
  10. Lewis, D.M.; Vo, L.T.T. Dyeing cotton with reactive dyes under neutral conditions. Color. Technol. 2007, 123, 306–311. [Google Scholar] [CrossRef]
  11. Fang, L.; Zhang, X.; Sun, D. Chemical modification of cotton fabrics for improving utilization of reactive dyes. Carbohydr. Polym. 2013, 91, 363–369. [Google Scholar] [CrossRef] [PubMed]
  12. Cai, G.; Guo, L.; Ge, H.; Wang, J. A Facile Method for a Quantitative Study of the Mechanical Force Impact on Fabric Dye Loss During Domestic Washing. J. Surfactants Deterg. 2016, 19, 901–907. [Google Scholar] [CrossRef]
  13. Kamel, M.; Youssef, B.; Shokry, G. Dyeing of cationised cotton with acid dyes. J. Soc. Dye. Colour. 2008, 114, 101–104. [Google Scholar] [CrossRef]
  14. Yang, H.; Fang, K.; Liu, X.; An, F. High-Quality Images Inkjetted on Different Woven Cotton Fabrics Cationized with P(St-BA-VBT) Copolymer Nanospheres. ACS Appl. Mater. Interfaces 2019, 11, 29218–29230. [Google Scholar] [CrossRef]
  15. Toprak, T.; Anis, P.; Kutlu, E.; Kara, A. Effect of chemical modification with 4-vinylpyridine on dyeing of cotton fabric with reactive dyestuff. Cellulose 2018, 25, 6793–6809. [Google Scholar] [CrossRef]
  16. Acharya, S.; Abidi, N.; Rajbhandari, R.; Meulewaeter, F. Chemical cationization of cotton fabric for improved dye uptake. Cellulose 2014, 21, 4693–4706. [Google Scholar] [CrossRef]
  17. Montazer, M.; Malek, R.M.A.; Rahimi, A. Salt free reactive dyeing of cationized cotton. Fibers Polym. 2007, 8, 608–612. [Google Scholar] [CrossRef]
  18. Fu, S.; Hinks, D.; Hauser, P.; Ankeny, M. High efficiency ultra-deep dyeing of cotton via mercerization and cationization. Cellulose 2013, 20, 3101–3110. [Google Scholar] [CrossRef]
  19. Nallathambi, A.; Venkateshwarapuram Rengaswami, G.D. Salt-free reactive dyeing of cotton hosiery fabrics by exhaust application of cationic agent. Carbohydr. Polym. 2016, 152, 1–11. [Google Scholar] [CrossRef]
  20. Arivithamani, N.; Giri Dev, V.R. Characterization and comparison of salt-free reactive dyed cationized cotton hosiery fabrics with that of conventional dyed cotton fabrics. J. Clean. Prod. 2018, 183, 579–589. [Google Scholar] [CrossRef]
  21. Zhai, S.; Li, Y.; Dong, W.; Zhao, H.; Ma, K.; Zhang, H.; Cai, Z. Cationic cotton modified by 3-chloro-2-hydroxypropyl trimethyl ammonium chloride for salt-free dyeing with high levelling performance. Cellulose 2022, 29, 633–646. [Google Scholar] [CrossRef]
  22. Pruś, S.; Kulpiński, P.; Matyjas-Zgondek, E.; Wojciechowski, K. Eco-friendly dyeing of cationised cotton with reactive dyes: Mechanism of bonding reactive dyes with CHPTAC cationised cellulose. Cellulose 2022, 29, 4167–4182. [Google Scholar] [CrossRef]
  23. Wu, A.; Ma, W.; Yang, Z.; Zhang, S. Efficient Cationization of Cotton for Salt-Free Dyeing by Adjusting Fiber Crystallinity through Alcohol-Water-NaOH Pretreatment. Polymers 2022, 14, 5546. [Google Scholar] [CrossRef] [PubMed]
  24. Niu, T.; Wang, X.; Wu, C.; Sun, D.; Zhang, X.; Chen, Z.; Fang, L. Chemical Modification of Cotton Fabrics by a Bifunctional Cationic Polymer for Salt-Free Reactive Dyeing. ACS Omega 2020, 5, 15409–15416. [Google Scholar] [CrossRef]
  25. Zhang, F.; Chen, Y.; Lin, H.; Lu, Y. Synthesis of an amino-terminated hyperbranched polymer and its application in reactive dyeing on cotton as a salt-free dyeing auxiliary. Color. Technol. 2007, 123, 351–357. [Google Scholar] [CrossRef]
  26. Shindhal, T.; Rakholiya, P.; Varjani, S.; Pandey, A.; Ngo, H.H.; Guo, W.; Ng, H.Y.; Taherzadeh, M.J. A critical review on advances in the practices and perspectives for the treatment of dye industry wastewater. Bioengineered 2021, 12, 70–87. [Google Scholar] [CrossRef]
  27. Lada, Z.G.; Voyiatzis, G.A.; Aggelopoulos, C.A. A novel, green, low-cost regeneration method for surface enhanced raman scattering (SERS) solid substrates based on nanosecond pulsed cold plasma technology. Surf. Interfaces 2022, 34, 102330. [Google Scholar] [CrossRef]
  28. Meropoulis, S.; Rassias, G.; Bekiari, V.; Aggelopoulos, C.A. Structure-Degradation efficiency studies in the remediation of aqueous solutions of dyes using nanosecond-pulsed DBD plasma. Sep. Purif. Technol. 2021, 274, 119031. [Google Scholar] [CrossRef]
  29. Dutta, S.; Bhattacharjee, J. Chapter 1—A comparative study between physicochemical and biological methods for effective removal of textile dye from wastewater. In Development in Wastewater Treatment Research and Processes; Shah, M.P., Rodriguez-Couto, S., Kapoor, R.T., Eds.; Elsevier: Amsterdam, The Netherlands, 2022; pp. 1–21. [Google Scholar]
  30. Patil, R.; Zahid, M.; Govindwar, S.; Khandare, R.; Vyavahare, G.; Gurav, R.; Desai, N.; Pandit, S.; Jadhav, J. Chapter 8—Constructed wetland: A promising technology for the treatment of hazardous textile dyes and effluent. In Development in Wastewater Treatment Research and Processes; Shah, M., Rodriguez-Couto, S., Biswas, J., Eds.; Elsevier: Amsterdam, The Netherlands, 2022; pp. 173–198. [Google Scholar]
  31. Mudhoo, A.; Ramasamy, D.L.; Bhatnagar, A.; Usman, M.; Sillanpää, M. An analysis of the versatility and effectiveness of composts for sequestering heavy metal ions, dyes and xenobiotics from soils and aqueous milieus. Ecotoxicol. Environ. Saf. 2020, 197, 110587. [Google Scholar] [CrossRef]
  32. Aksu, Z. Reactive dye bioaccumulation by Saccharomyces cerevisiae. Process Biochem. 2003, 38, 1437–1444. [Google Scholar] [CrossRef]
  33. Carneiro, P.A.; Umbuzeiro, G.A.; Oliveira, D.P.; Zanoni, M.V.B. Assessment of water contamination caused by a mutagenic textile effluent/dyehouse effluent bearing disperse dyes. J. Hazard Mater. 2010, 174, 694–699. [Google Scholar] [CrossRef] [PubMed]
  34. Yaseen, D.A.; Scholz, M. Textile dye wastewater characteristics and constituents of synthetic effluents: A critical review. Int. J. Environ. Sci. Technol. 2019, 16, 1193–1226. [Google Scholar] [CrossRef]
  35. Arslan İlkiz, B.; Beceren, Y.; Candan, C. An Approach to Estimate Dye Concentration of Domestic Washing Machine Wastewater. Autex Res. J. 2019, 21, 172–181. [Google Scholar] [CrossRef]
  36. Franco, J.H.; da Silva, B.F.; Zanoni, M.V.B. Assessment of semi-permanent hair dyes in wash water from beauty salons by liquid chromatography-tandem mass spectrometry-selected reaction monitoring (LC-MS/MS-SRM). Anal. Methods 2020, 12, 5415–5423. [Google Scholar] [CrossRef] [PubMed]
  37. Tsimpouki, L.; Papapetros, K.; Anastasopoulos, C.; Sygellou, L.; Soto-Beobide, A.; Andrikopoulos, K.S.; Voyiatzis, G.A.; Bokias, G.; Kallitsis, J.K. Water-Soluble Quaternized Copolymers as Eco-Friendly Cationic Modifiers of Cotton Fabrics for Salt-Free Reactive Dyeing Applications. Res. Sq. 2022. [Google Scholar] [CrossRef]
  38. Nguyen, T.V.; Vu, C.D.; Pham, T.B.; Pham, V.H.; Bui, H.; Vu, T.H.H.; van Hai, P.H.A.M. Detection of Ultra-Low Concentration of Methylene Blue by Porous Silicon Photonic Crystals Covered With Siver Nanoparticles as Efficient Sers Substrate. Commun. Phys. 2021, 31, 381. [Google Scholar]
  39. Ly, B.C.K.; Dyer, E.B.; Feig, J.L.; Chien, A.L.; Del Bino, S. Research Techniques Made Simple: Cutaneous Colorimetry: A Reliable Technique for Objective Skin Color Measurement. J. Investig. Dermatol. 2020, 140, 3–12.e1. [Google Scholar] [CrossRef] [PubMed]
  40. Senthilkumar, M. Modelling of CIELAB values in vinyl sulphone dye application using feed-forward neural networks. Dye. Pigment. 2007, 75, 356–361. [Google Scholar] [CrossRef]
  41. Lee, P.C.; Meisel, D. Adsorption and surface-enhanced Raman of dyes on silver and gold sols. J. Phys. Chem. 1982, 86, 3391–3395. [Google Scholar] [CrossRef]
  42. Marsich, L.; Bonifacio, A.; Mandal, S.; Krol, S.; Beleites, C.; Sergo, V. Poly-l-lysine-Coated Silver Nanoparticles as Positively Charged Substrates for Surface-Enhanced Raman Scattering. Langmuir 2012, 28, 13166–13171. [Google Scholar] [CrossRef]
  43. Anastasopoulos, J.A.; Soto Beobide, A.; Manikas, A.C.; Voyiatzis, G.A. Quantitative surface-enhanced resonance Raman scattering analysis of methylene blue using silver colloid. J. Raman Spectrosc. 2017, 48, 1762–1770. [Google Scholar] [CrossRef]
  44. Mathioudakis, G.N.; Soto Beobide, A.; Anastasiadis, S.H.; Voyiatzis, G.A. Surface enhanced Raman scattering of brilliant green: Packing density and stabilizing effect of the cationic surfactant CTAB on the “hotspot” spacing. Colloids Surf. A Physicochem. Eng. Asp. 2021, 610, 125912. [Google Scholar] [CrossRef]
Scheme 1. The chemical structures of (a) Acid Blue 281 (AB) and the reactive dyes Novacron Yellow S-3R (NY), Novacron Ruby S-3B (NR) and Novacron Dark Blue S-GL (NDB), and of (b) the two polymeric modifiers indicated as Polymer 1 and Polymer 2.
Sustainability 15 03144 sch001
Figure 2. The UV/Vis spectra of the washing bath when (a) fabrics were modified with Polymer 1 and Polymer 2 and (b) the normalized UV/Vis spectra after normalization with red color contribution.
Sustainability 15 03144 g002
Figure 3. (a) The UV/Vis spectra of the wash water when industrially prepared fabric was modified with Polymer 1 and Polymer 2, and (b) the normalized UV/Vis spectra after normalization with red color contribution.
Sustainability 15 03144 g003
Figure 4. (a) The SERS spectra of the washing bath of fabrics prepared either in lab or industrial environments when the fabric was modified with Polymer 1 and Polymer 2 and (b) the normalized SERS spectra after normalization with red color contribution.
Sustainability 15 03144 g004
Table 1. Color coordinates (L, a*, b*), the color intensity (K/S) and the color difference (ΔΕ*) factors for the unmodified and modified lab prepared fabrics colored by an acid blue dye.
SampleColor IndexesΔΕ* for Each Modified/Unmodified Couple
La*b*K/S
Modified with Polymer 131.012.62−34.5614.7851.59
Unmodified75.64−4.74−9.750.39
Modified with Polymer 230.053.11−36.4917.1750.72
Unmodified73.71−4.85−11.940.48
Table 2. The concentration of the Acid Blue (AB) dye released into the wash water and after normalization with the K/S factor in the lab-prepared fabrics.
SampleConcentration (μg/mL)Κ/SNormalization of Release with K/S
Modified with Polymer 124.1614.781.63
Unmodified2.530.396.49
Modified with Polymer 228.517.171.66
Unmodified2.410.485.03
Table 3. Color coordinates (L, a*, b*) and the color intensity (K/S) and color difference (ΔΕ*) factors for the unmodified and modified lab-prepared fabrics colored by the three reactive dyes Novacron Yellow S-3R (NY) Novacron Ruby S-3B (NR), and Novacron Dark Blue S-GL (NDB).
SampleColor IndexesΔΕ* for Each Modified/Unmodified Couple
La*b*K/S
Modified with Polymer 129.247.732.969.0312.30
Unmodified41.197.610.073.93
Modified with Polymer 227.587.933.3910.3511.19
Unmodified38.396.530.884.68
Table 4. The concentration of the three reactive dyes (Novacron Yellow, Novacron Ruby and Novacron Dark Blue) release into the wash water.
SampleConcentration (μg/mL)
NYNRNDB
Modified with Polymer 13.277.204.2
Modified with Polymer 210.59.864.2
Table 5. Color coordinates (L, a*, b*), and the color intensity (K/S) and the color homogeneity factors (ΔΕ* and % st dev K/S) for the industrially prepared unmodified and modified fabrics colored by the three reactive dyes Novacron Yellow S-3R (NY) Novacron Ruby S-3B (NR), and Novacron Dark Blue S-GL (NDB).
SampleColor IndexesΔΕ* for Each Modified/Unmodified Couple
La*b*K/S
Modified with Polymer 133.855.357.957.911.34
Unmodified57.710.4217.252.301.63
Modified with Polymer 235.916.2010.157.461.32
Table 6. The concentration of the dyes released into the wash water.
SampleConcentration (μg/mL)
NYNRNDB
Modified with Polymer 13.868.375.28
Modified with Polymer 21.22.92.3
Disclaimer/Publisher’s Note: The statements, opinions and data contained in all publications are solely those of the individual author(s) and contributor(s) and not of MDPI and/or the editor(s). MDPI and/or the editor(s) disclaim responsibility for any injury to people or property resulting from any ideas, methods, instructions or products referred to in the content.

