
Transport Accessibility and Poverty Alleviation in Guizhou Province of China: Spatiotemporal Pattern and Impact Analysis


Abstract
:1. Introduction
2. Data and Methods
2.1. Study Area
2.2. Data Sources
2.3. Data Analysis
2.3.1. Measurement of Transport Accessibility
2.3.2. Measurement of Economic Potential
2.3.3. Measurement of the Poverty Index
2.3.4. Panel Data Regression Model
3. Results
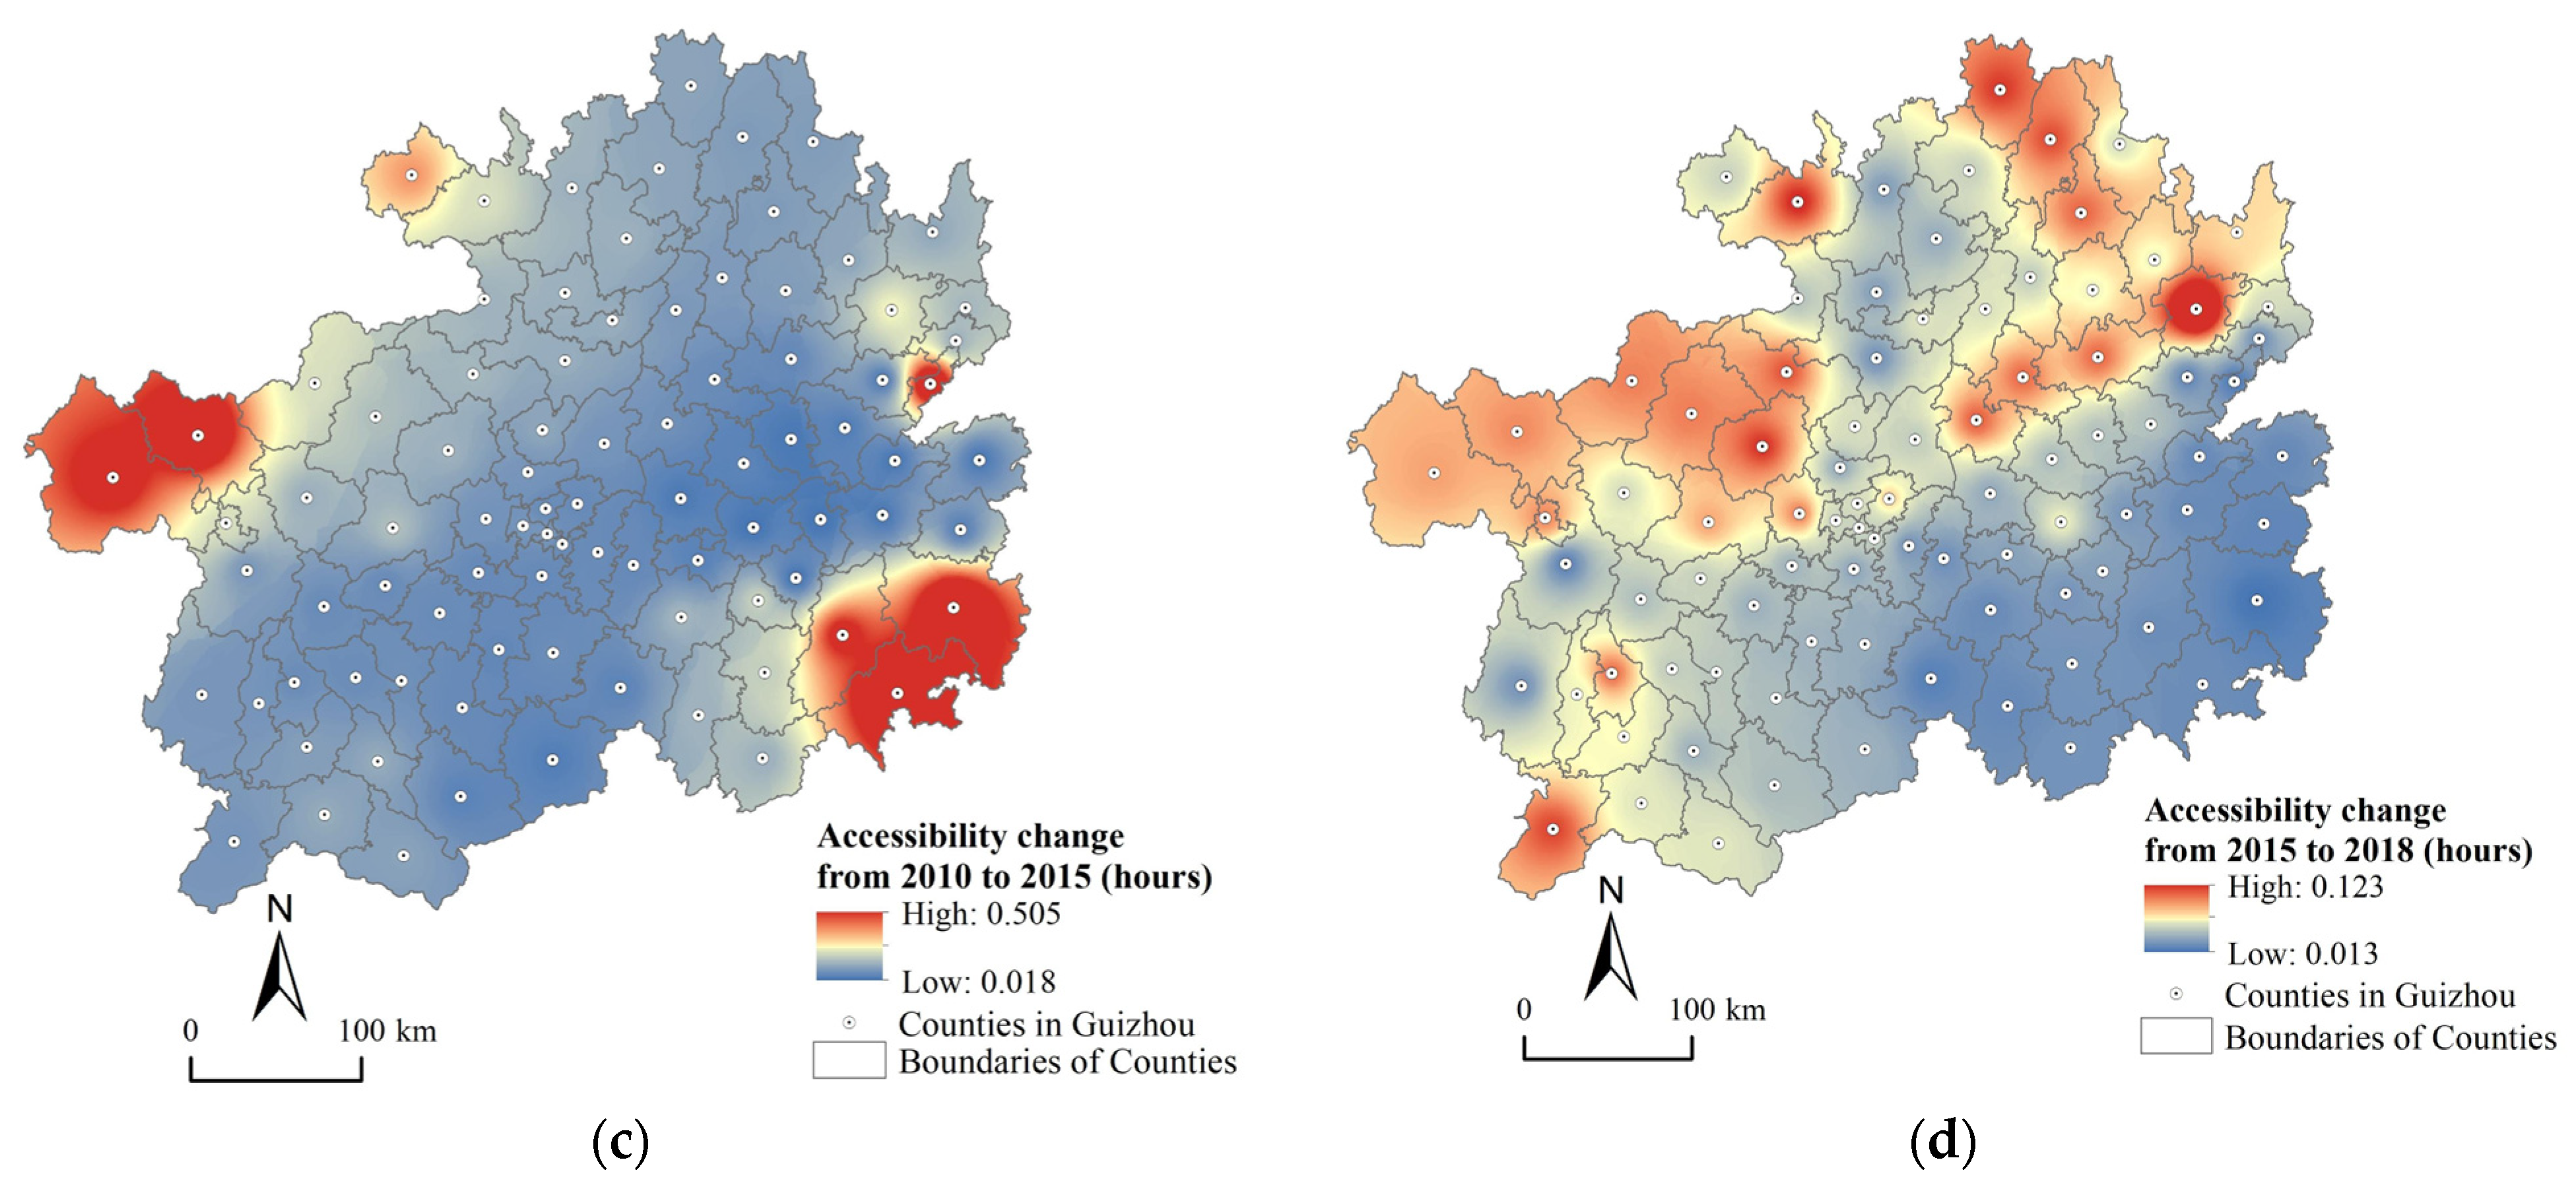
3.1. Spatiotemporal Pattern of Transport Accessibility
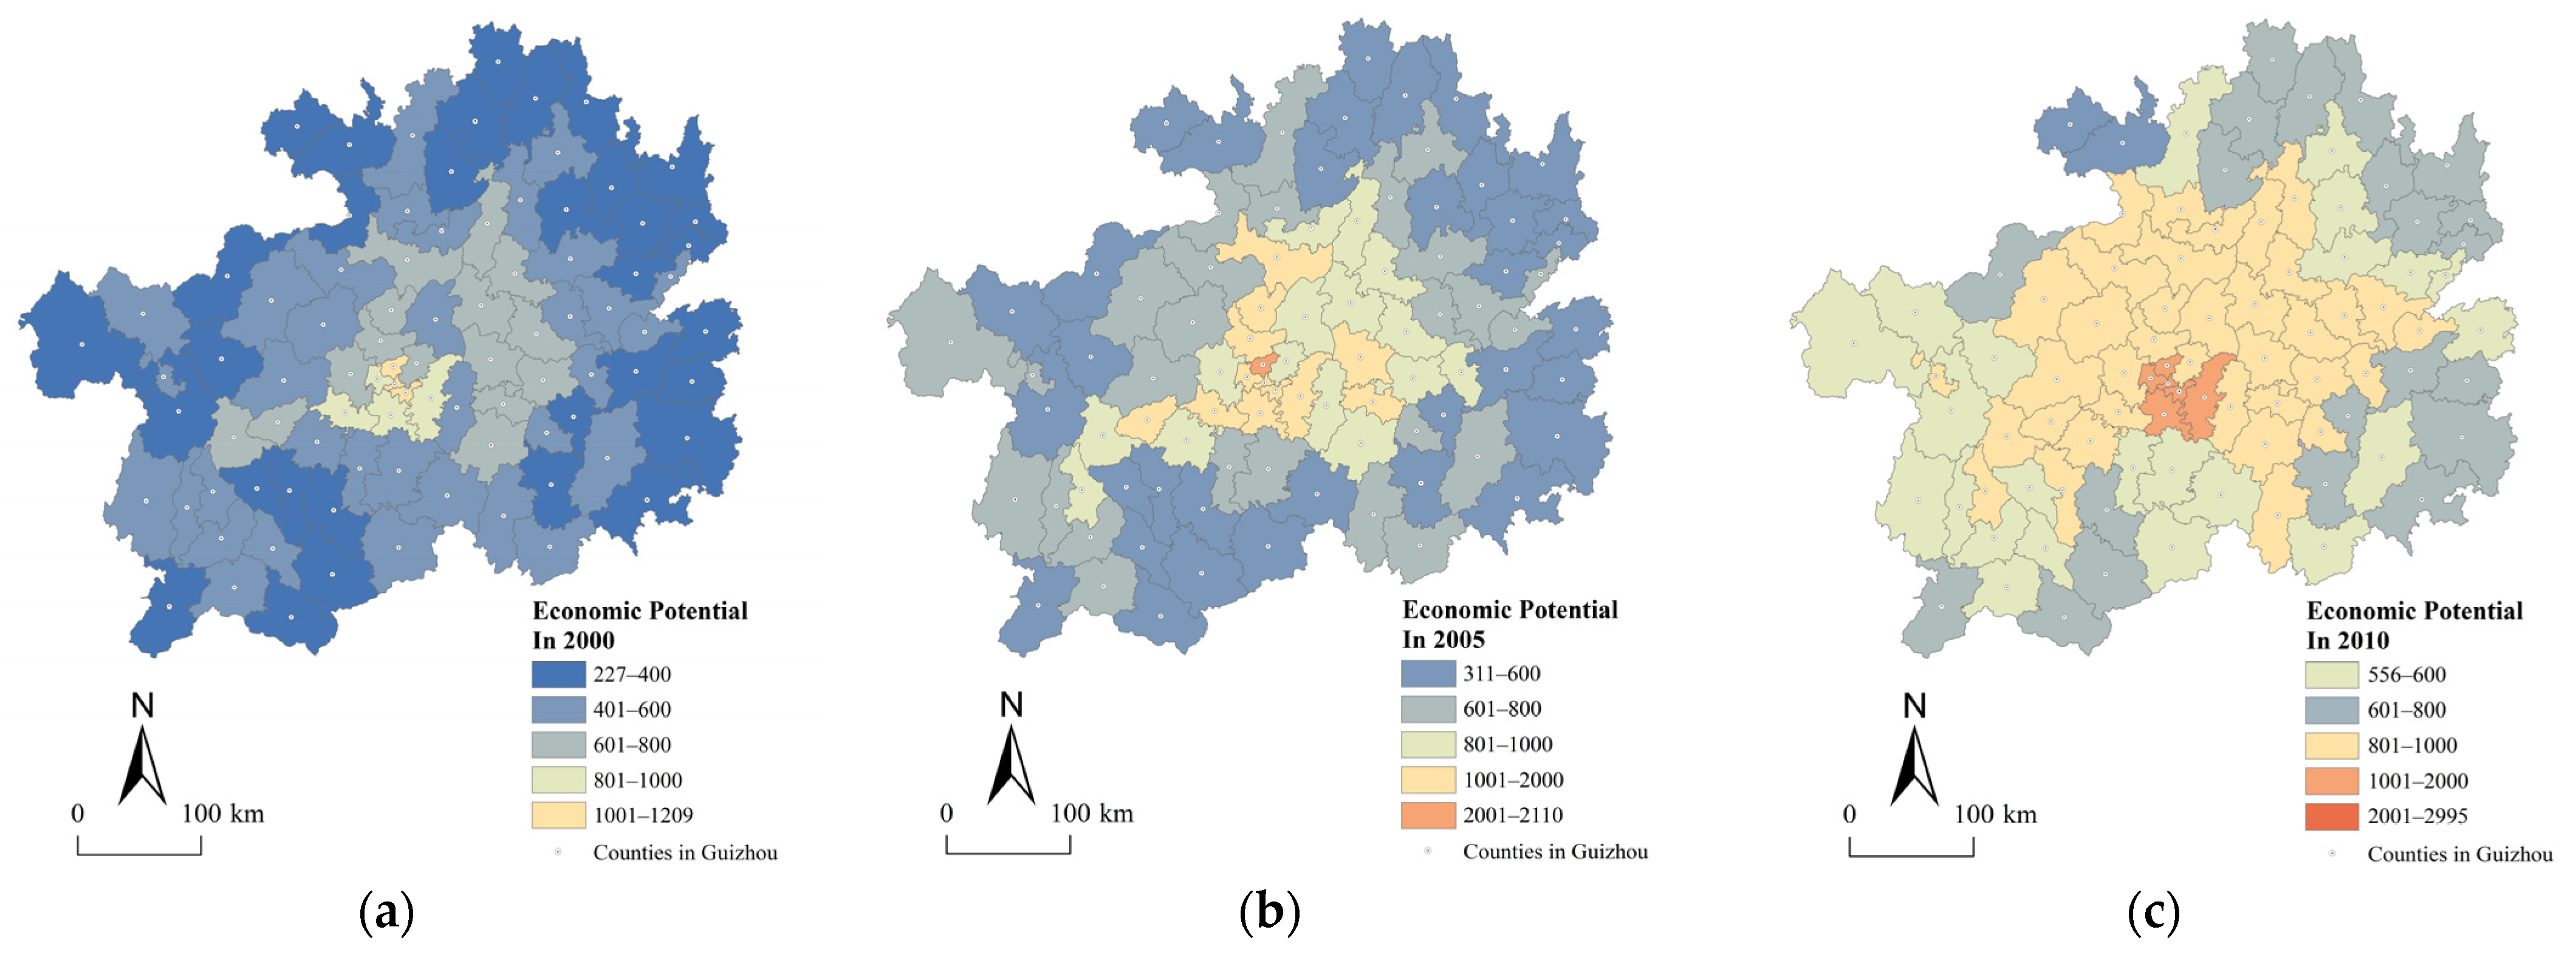
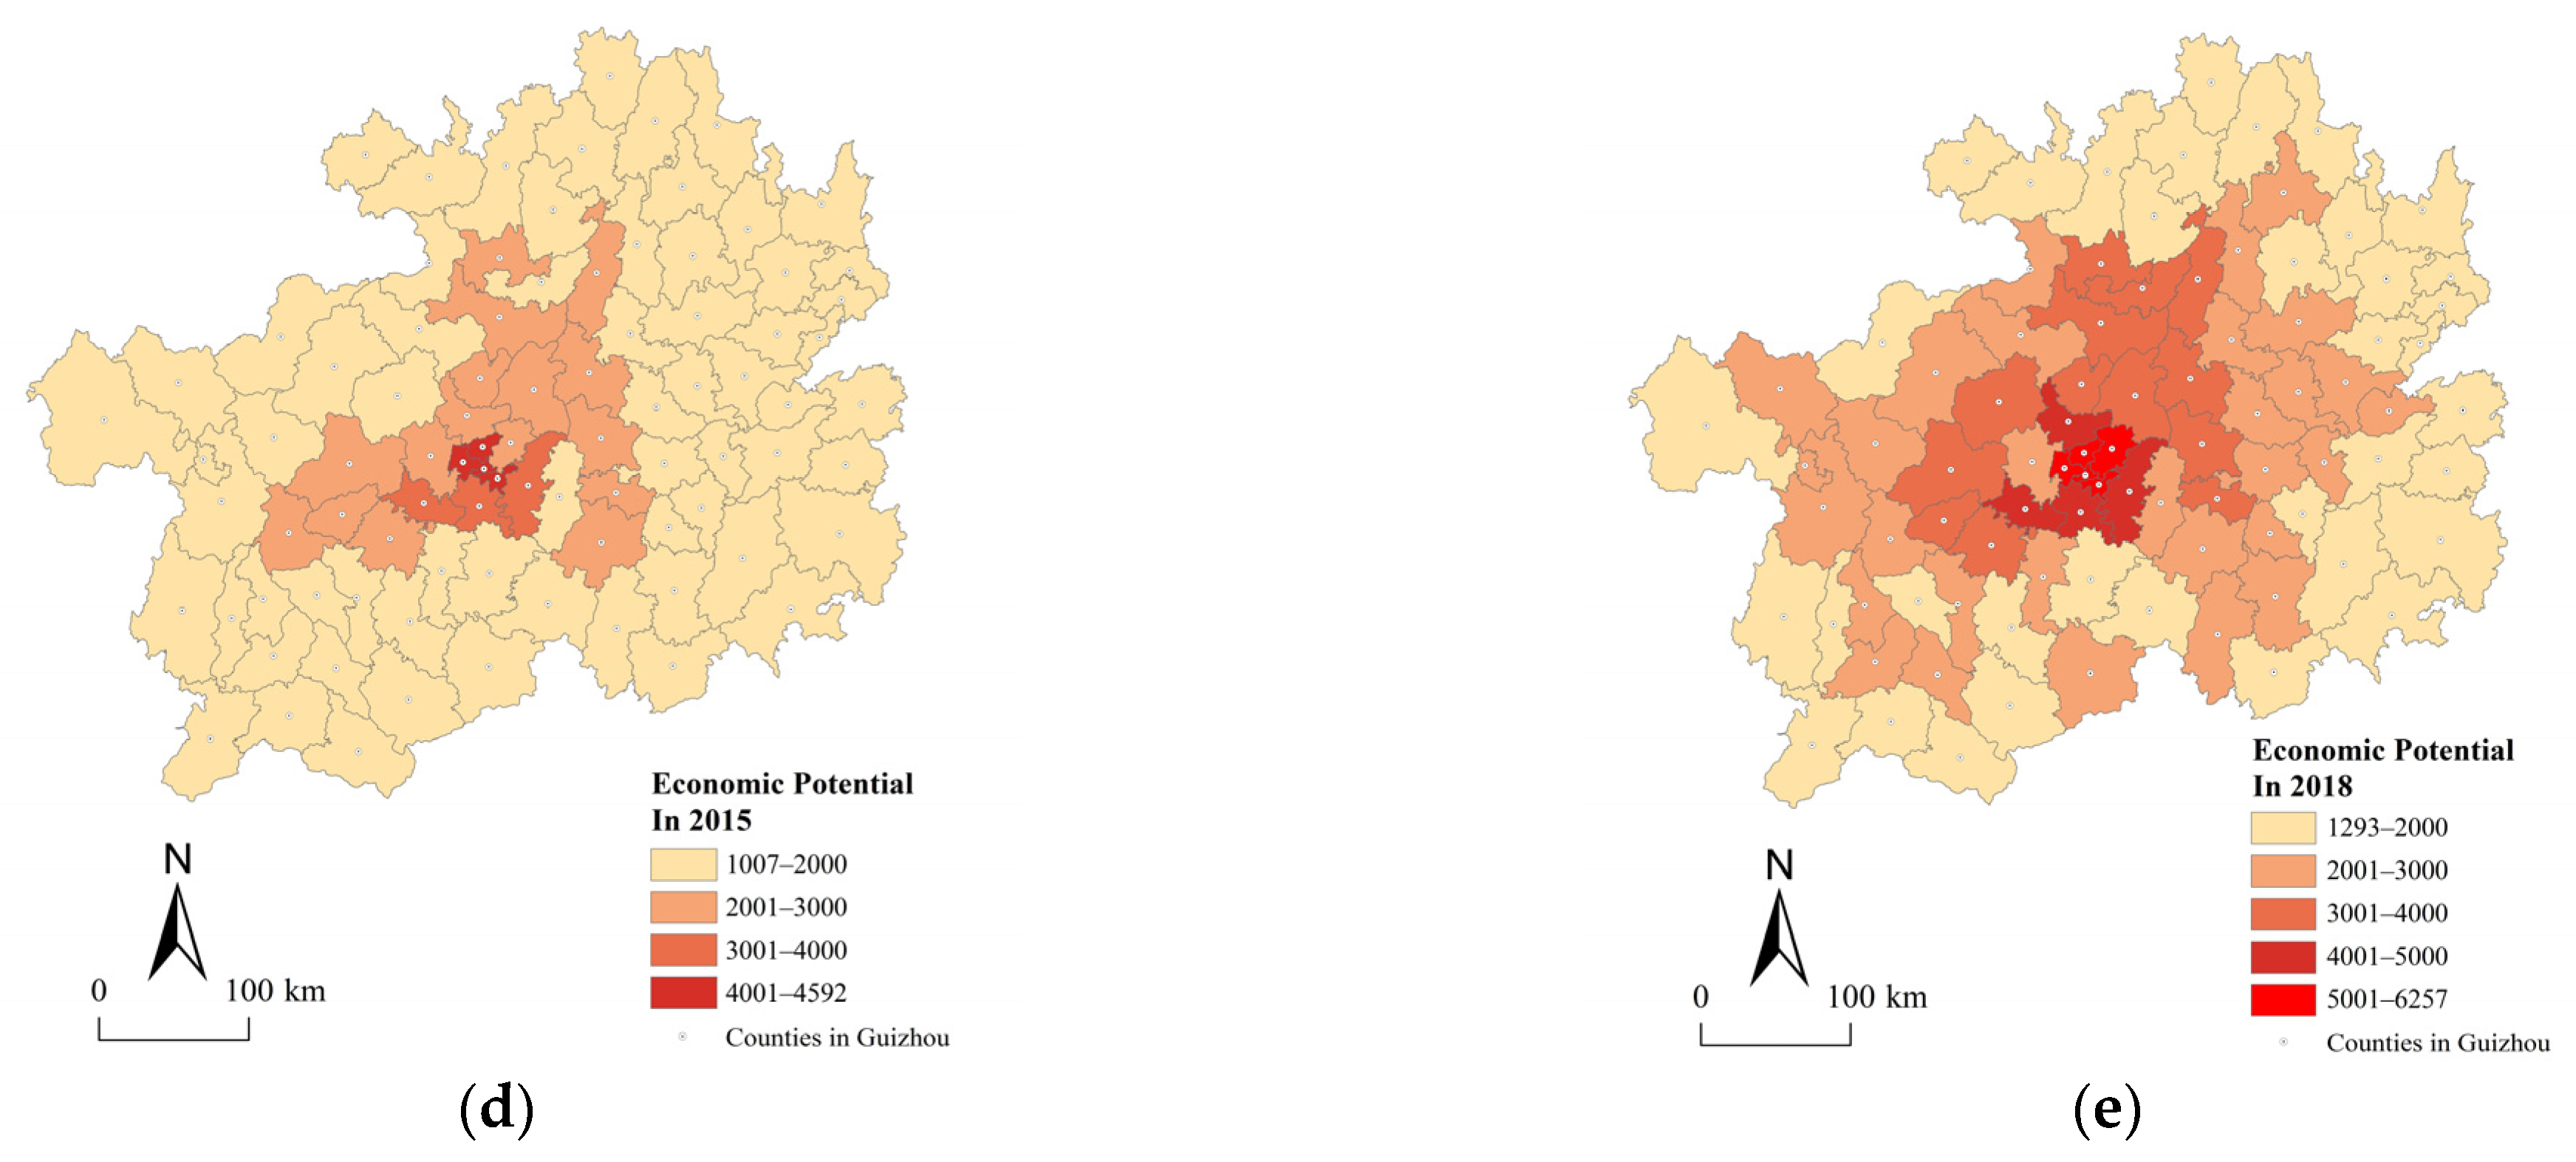
3.2. Spatiotemporal Pattern of Economic Potential
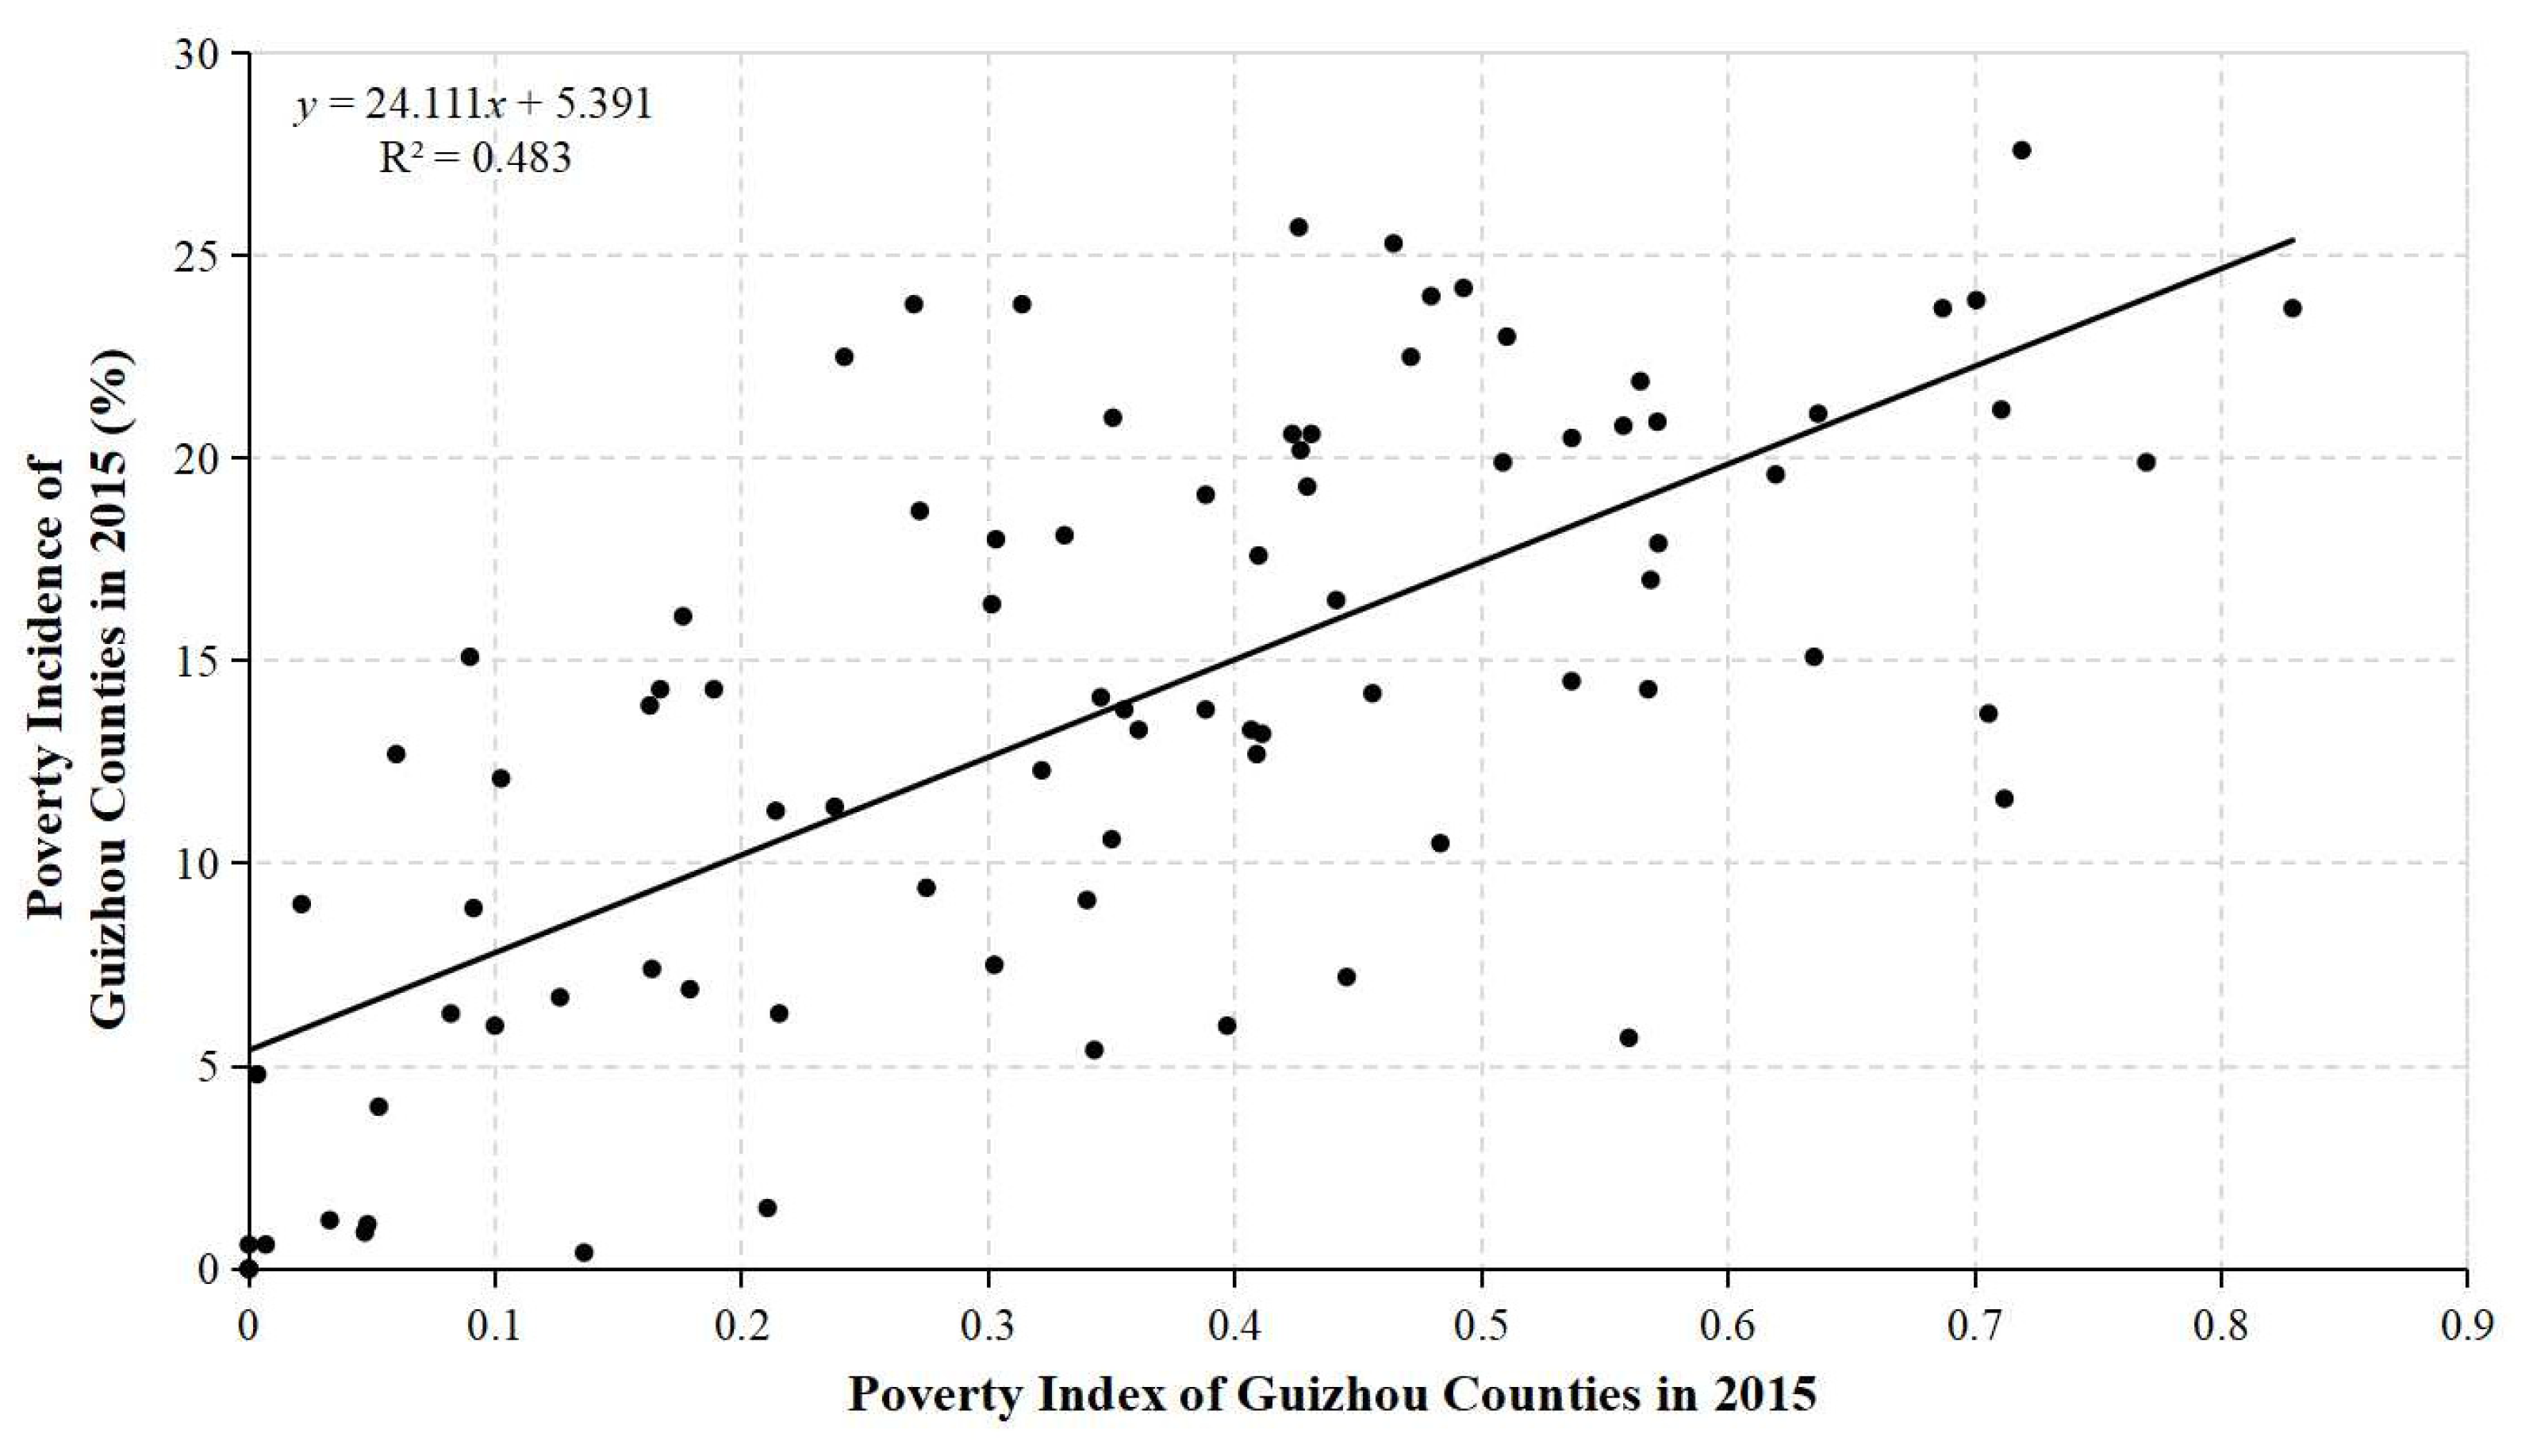
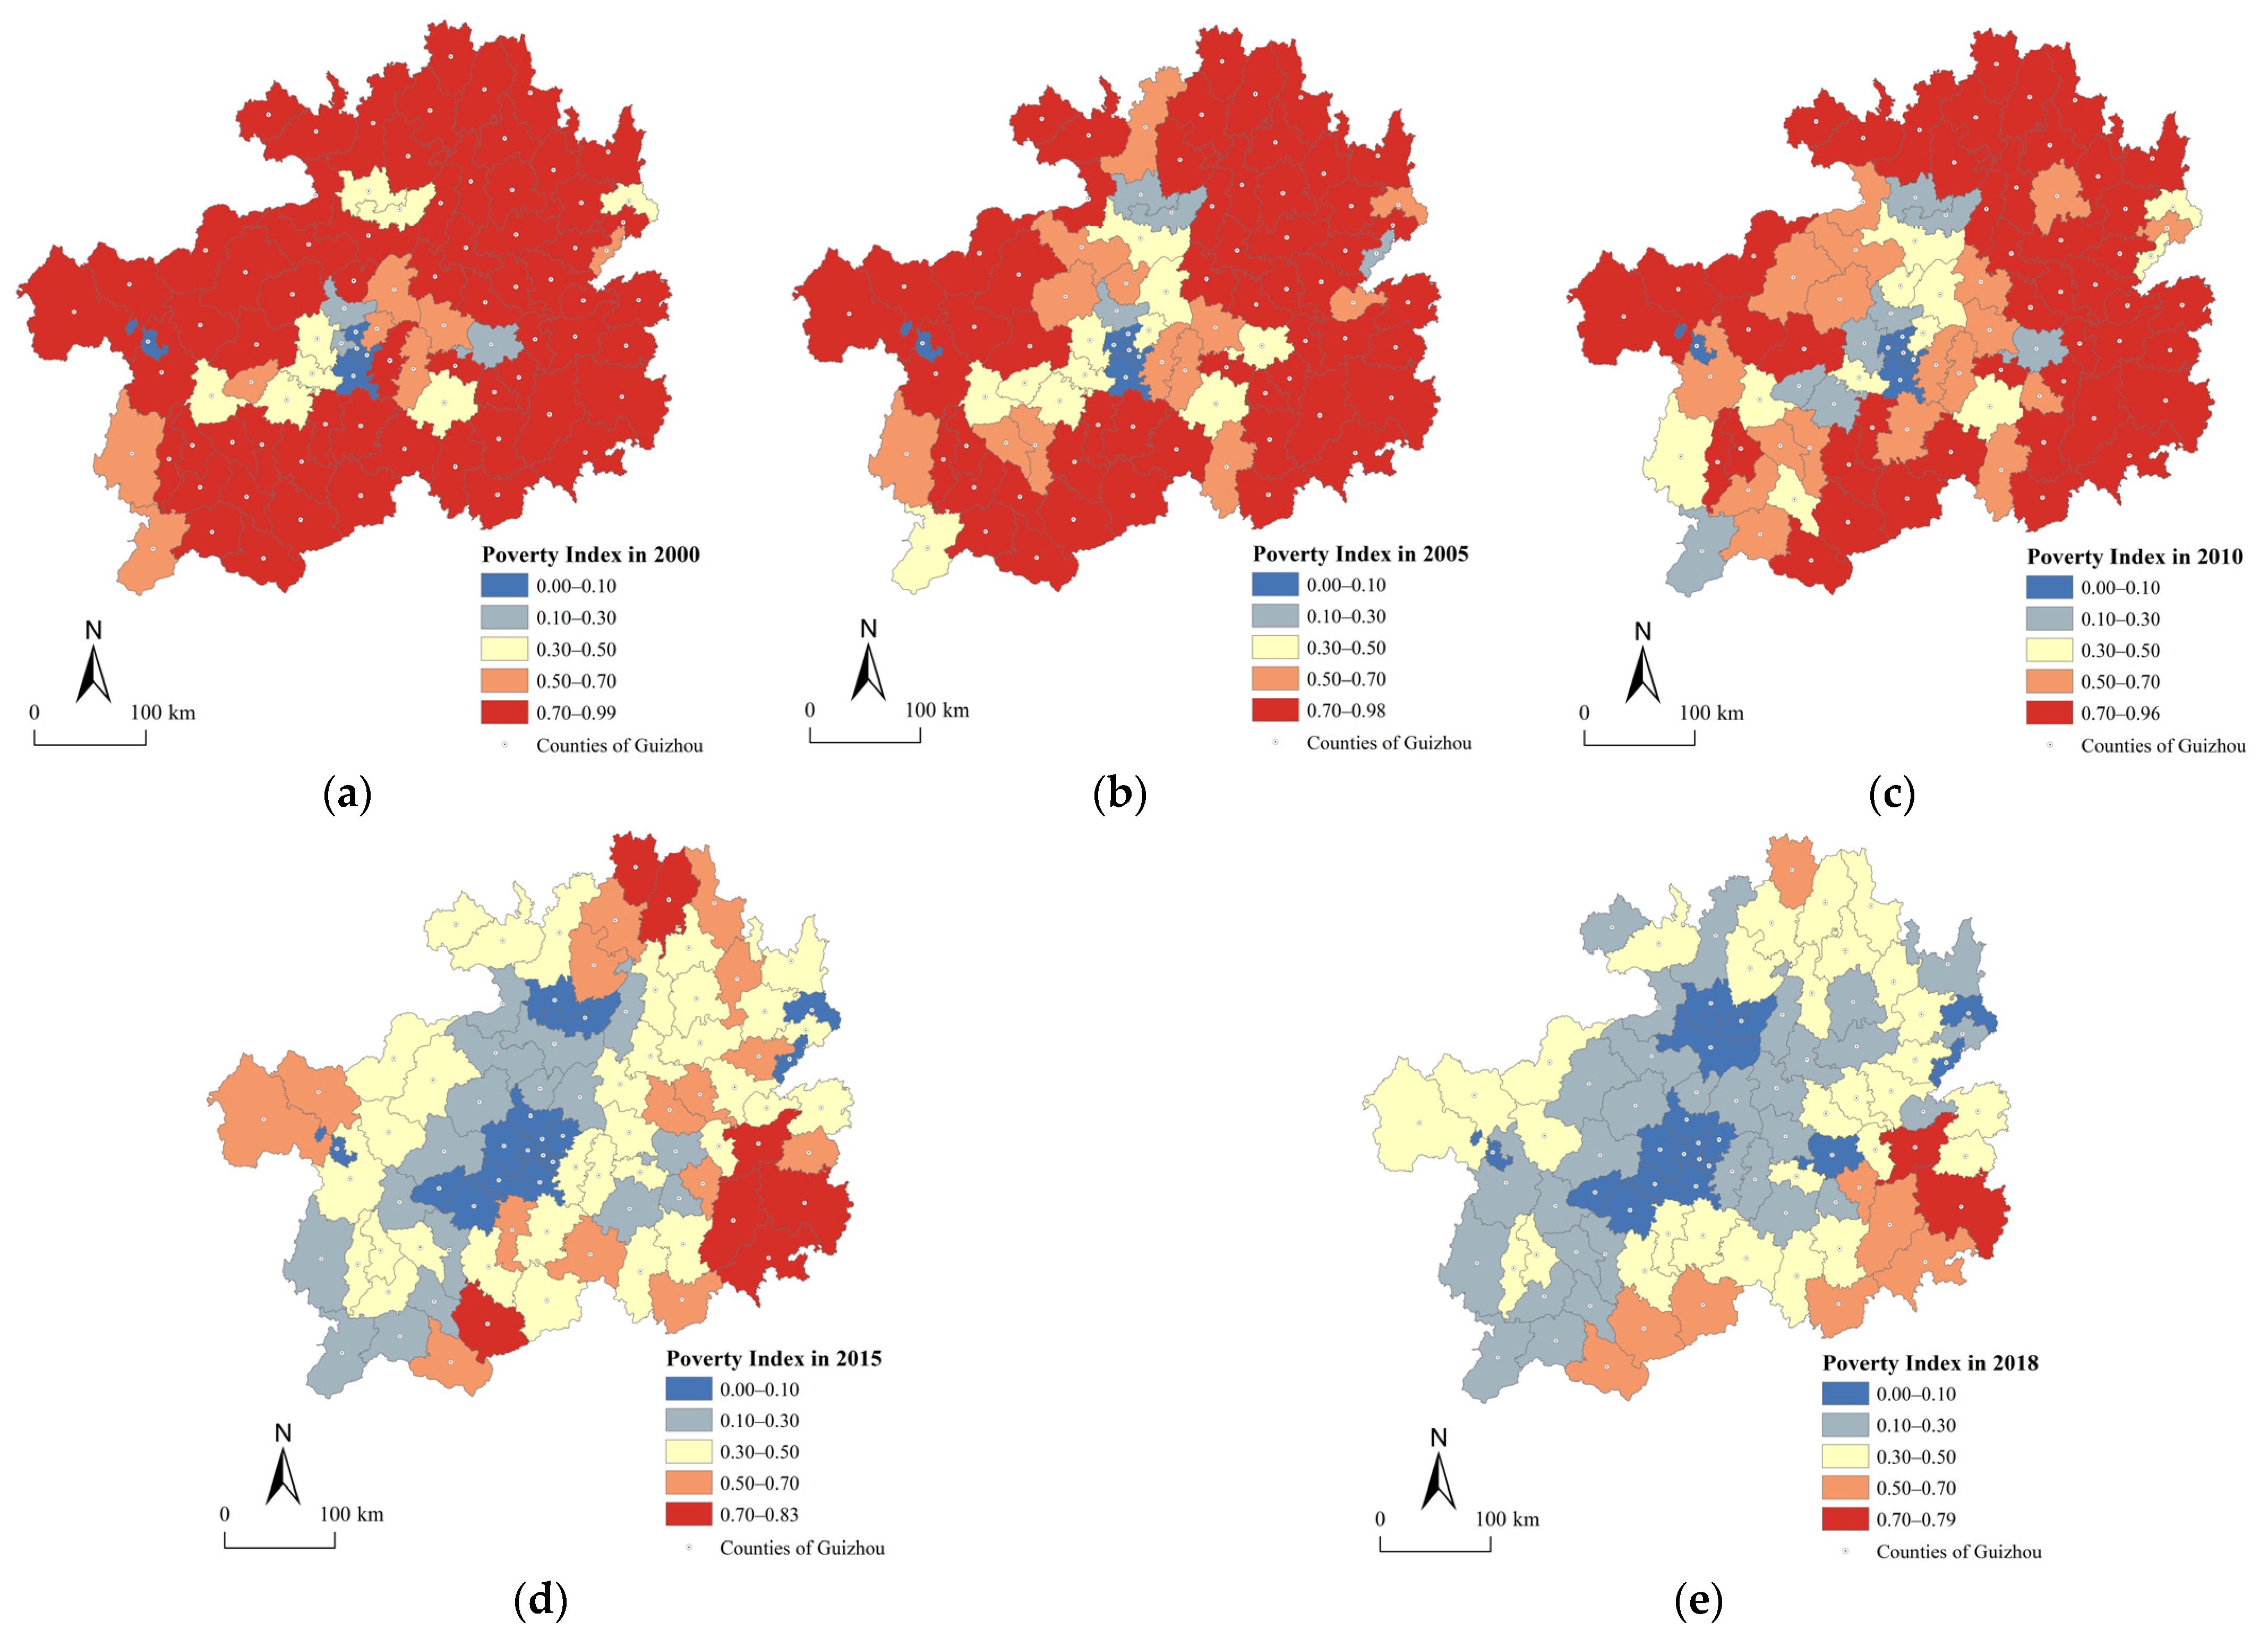
3.3. Spatiotemporal Pattern of the Poverty Index
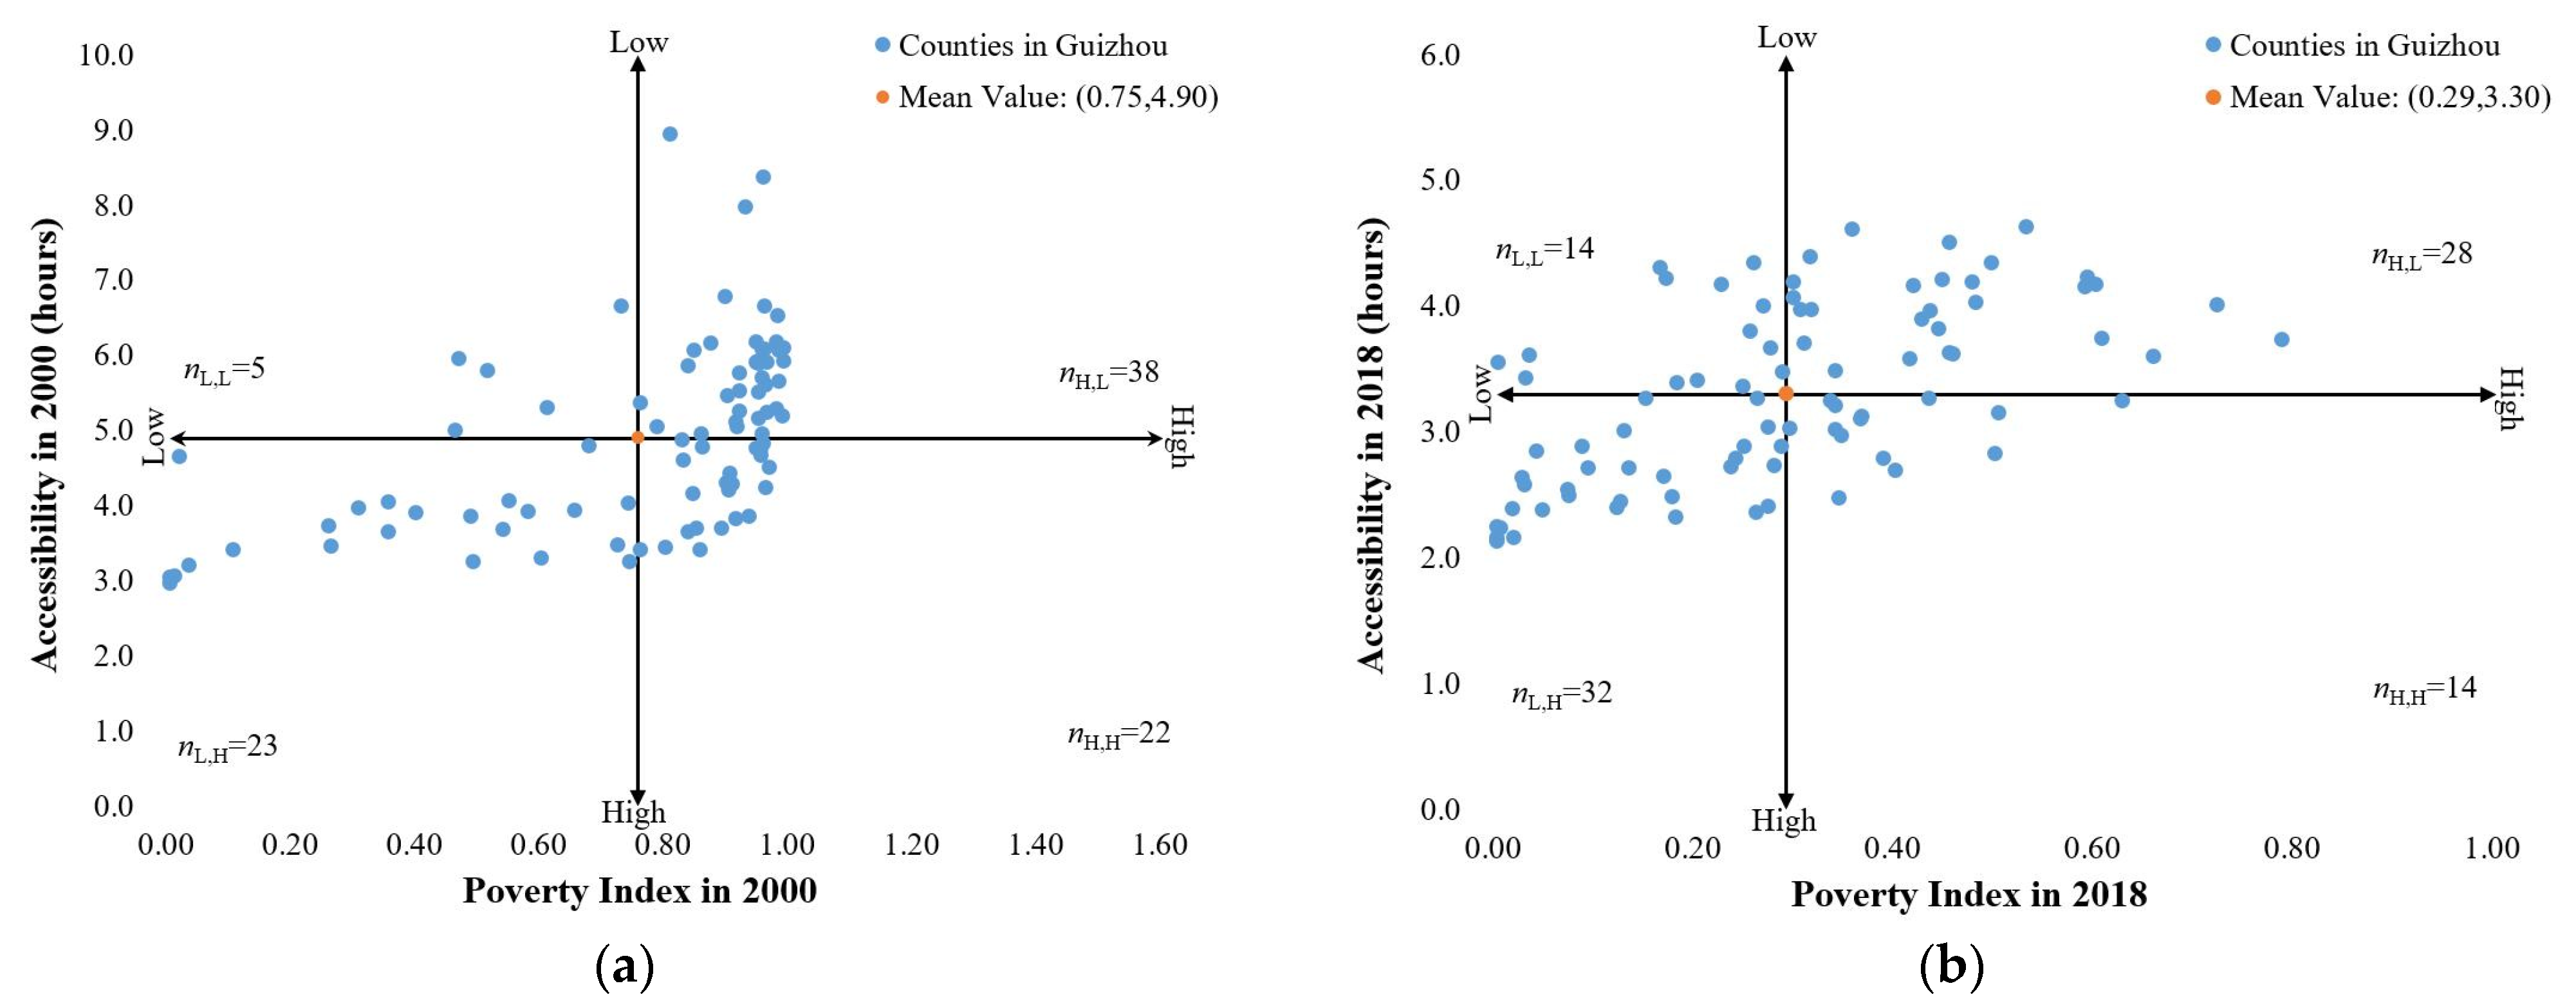
3.4. Impact of Transport Accessibility on Regional Poverty Alleviation
4. Discussion
4.1. Evolution of Transport Accessibility and Poverty Alleviation
4.2. Effect of Transport Accessibility on Poverty Alleviation
4.3. Policy Implications
5. Conclusions
Author Contributions
Funding
Institutional Review Board Statement
Informed Consent Statement
Data Availability Statement
Conflicts of Interest
References
- United Nations. Transforming Our World: The 2030 Agenda for Sustainable 637 Development; Division for Sustainable Development Goals: New York, NY, USA, 2015. [Google Scholar]
- United Nations. Sustainable Development Goals 1: End Poverty in All Its Forms Evertwhere. Available online: https://unstats.un.org/sdgs/report/2019/goal-01/html (accessed on 8 January 2023).
- China’s State Council Information Office. White Paper on China’s Practice in Poverty Reduction. Available online: http://www.gov.cn/zhengce/2021-04/06/content_5597952.htm (accessed on 8 January 2023).
- Li, P.; Lu, Y. A Review and Outlook of Reachability Studies. Prog. Geogr. 2005, 24, 69–78. (In Chinese) [Google Scholar]
- Cheng, C.; Zhang, W.; Chen, J.; Cai, J. Evaluation and analysis of subway accessibility based on space syntax: A case study of Beijing Metro Planning Map in 2008. Earth Inf. Sci. 2007, 9, 31–35. (In Chinese) [Google Scholar]
- Axhausen, K.; Froelic, P.; Tschopp, M. Changes in Swiss accessibility since 1850. Res. Transp. Econ. 2011, 31, 72–80. [Google Scholar]
- Huang, X.; Cao, X.; Li, T. Relationship between regional transportation superiority and economic development in Hainan province. Geogr. Res. 2011, 30, 985–999. (In Chinese) [Google Scholar]
- Jin, F.; Jiao, J.; Qi, Y.; Yang, Y. Evolution and geographic effects of high-speed rail in East Asia: An accessibility approach. J. Geogr. Sci. 2017, 27, 515–532. [Google Scholar] [CrossRef]
- Geurs, K.; Wee, B. Accessibility evaluation of land-use and transport strategies: Review and research directions. J. Transp. Geogr. 2004, 12, 127–140. [Google Scholar]
- Rode, P.; Cruz, N. Governing urban accessibility: Moving beyond transport and mobility. Appl. Mobilities 2018, 3, 8–33. [Google Scholar]
- Hamersma, M.; Heinen, E.; Tillema, T.; Arts, J. Residential moving intentions at highway locations: The trade-off between nuisances and accessibility in the Netherlands. Transp. Res. Part D 2015, 35, 130–141. [Google Scholar] [CrossRef]
- Li, S.; Shum, Y. Impacts of the National Trunk Highway System on accessibility in China. J. Transp. Geogr. 2001, 9, 39–48. [Google Scholar] [CrossRef]
- Bian, F.; Yeh, A. Spatial–economic impact of missing national highway links on China’s regional economy. Transp. Res. Part D 2020, 84, 102377. [Google Scholar] [CrossRef]
- Komikado, H.; Morikawa, S.; Bhatt, A.; Kato, H. High-speed rail, inter-regional accessibility, and regional innovation: Evidence from Japan. Technol. Forecast. Soc. Chang. 2021, 167, 120697. [Google Scholar]
- Wang, L. High-speed rail services development and regional accessibility restructuring in megaregions: A case of the Yangtze River Delta, China. Transp. Policy 2018, 72, 34–44. [Google Scholar] [CrossRef]
- Lessa, D.; Lobo, C.; Cardoso, L. Accessibility and urban mobility by bus in Belo Horizonte/Minas Gerais-Brazil. Journal of Transp. Geogr. 2019, 77, 1–10. [Google Scholar]
- Torzewski, M. Public transport accessibility and the prices of nearby properties: The case of the first metro line in Warsaw. Eur. J. Transp. Infrastruct. Res. 2020, 20, 41–59. [Google Scholar]
- Song, Y.; Lee, K.; Anderson, W.P.; Lakshmanan, T.R. Industrial agglomeration and transport accessibility in metropolitan Seoul. J. Geogr. Syst. 2012, 14, 299–318. [Google Scholar]
- Hong, Z.; Mittal, A.; Mahmassani, H. Effect of Bicycle-sharing on Public Transport Accessibility: Application to Chicago Divvy Bicycle-sharing System. In Proceedings of the TRB 95th Annual Meeting Compendium of Papers 2016, Washington, DC, USA, 10–14 January 2016. [Google Scholar]
- Caggiani, L.; Colovic, A.; Ottomanelli, M. An equality-based model for bike-sharing stations location in bicycle-public transport multimodal mobility. Transp. Res. Part A Policy Pract. 2020, 140, 251–265. [Google Scholar] [CrossRef]
- Nutley, S. Rural areas: The accessibility problem. Mod. Transp. Geogr. 1998, 2, 185–215. [Google Scholar]
- Guo, J. Research on Rural Poverty Reduction Effect of Traffic Infrastructure. Guizhou. Agric. Sci. 2013, 41, 213–217. (In Chinese) [Google Scholar]
- Kang, J.; Guo, M.; Fu, Y. To get rich, build roads?—An empirical study on transportation infrastructure construction, transportation industry development and poverty reduction. Inq. Into Econ. Issues 2014, 9, 41–46. (In Chinese) [Google Scholar]
- Chen, Y.; Wang, X.; Zhang, G. The Threshold effect of transport infrastructure on rural poverty reduction. J. China Univ. Geosci. (Soc. Sci. Ed.) 2021, 05, 110–123. (In Chinese) [Google Scholar]
- Hearn, D.H.; Halbrendt, C.K.; Gempesaw, I.C.M.; Conrado, M.; Webb, S.E.H. An Analysis ofTransport Improvements in China’s Corn Sector: A Hybrid Spatial Equilibrium Approach. J. Transp. Researvh Forum 1990, 31, 154–166. [Google Scholar]
- Aschauer, D.A. Is Public Expenditure Productive? J. Monet. Econ. 1989, 23, 177–200. [Google Scholar]
- Kwon, E. Infrastructure, Growth and Poverty Reduction in Indonesia: A Cross-sectional Analysis. In Transport Infrastructure and Poverty Reduction; Asian Development Bank: Manila, Philippines, 2005. [Google Scholar]
- Zhang, X.L. Regional Comparative Analysis on the Relationship between Transport Infrastructure and Economic Growth in China. J. Financ. Eco Nomics 2008, 33, 51–63. (In Chinese) [Google Scholar]
- Mao, Y.Y.; Li, B. Regional comparison of rural transportation infrastructure investment and farmers’ income: Based on the panal data within 30 provinces in China from 1999 to 2008. J. Hunan Agric. Univ. (Soc. Sci.) 2010, 11, 29–34. (In Chinese) [Google Scholar]
- Munnell, A.H. How does public infrastructure affect regional economic performance? N. Engl. Econ. Rev. 1990, 9, 11–32. [Google Scholar]
- Bougheas, S.; Demetriades, P.O.; Mamuneas, T.P. Infrastructure, specialization, and economic growth. Can. J. Econ. 2000, 33, 506–522. [Google Scholar] [CrossRef]
- Banerjee, A.; Duflo, E.; Qian, N. On the road: Access to Transportation Infrastructure and Economic Growth in China. In NBER Working Paper 2012; National Bureau of Economic Research: New York, NY, USA, 2012; pp. 24–33. [Google Scholar]
- Berndt, E.R.; Hansson, B. Measuring the Contribution of Public Infrastructure Capital in Sweden. Scand. J. Econ. 1992, 94, 151–168. [Google Scholar] [CrossRef]
- Juan, P.B.S.; Daniel, R.O.H. Transport accessibility and social inequities: A tool for identification of mobility needs and evaluation of transport investments. J. Transp. Geogr. 2012, 24, 142–154. [Google Scholar]
- Chatterjee, S.; Turnovsky, S.J. Infrastructure and inequality. Eur. Econ. Rev. 2012, 56, 1730–1745. [Google Scholar]
- Demurger, S. Infrastructure development and economic growth: An explanation for regional disparities in Vhina? J. Comp. Econ. 2001, 29, 95–117. [Google Scholar]
- Zou, W.; Zhang, F.; Zhuang, Z.; Song, H. Transport Infrastructure, Growth, and Poverty Alleviation: Empirical Analysis of China. Ann. Econ. Financ. 2008, 9, 345–371. [Google Scholar]
- Fan, S.G.; Zhang, L.X.; Zhang, X.B. Economic Growth, Regional Disparity and Poverty: A Study of Rural Public Investment in China; China Agriculture Press: Beijing, China, 2002; pp. 118–120. (In Chinese) [Google Scholar]
- Balisacan, A.M.; Pernia, E.M. Probing beneath crossnational averages: Poverty, inequality, and growth in the Philippines. Econ. Res. Depaetment Work. Pap. Ser. 2002, 7, 1–20. [Google Scholar]
- Li, H.L.; Xu, Y. Transport Infrastructure, Industrial Structure and Effect of Reducing Poverty: Based on the Panel VAR Model. Tech. Econ. Manag. Res. 2016, 8, 25–30. [Google Scholar]
- Marinho, E.; Campelo, G.; Franca, J.; Araujo, J. Impact of infrastructure expenses in strategic sectors for Brazilian poverty. EconomiA 2017, 3, 244–259. [Google Scholar]
- Li, W. Evaluation of poverty reduction effect of rural road construction by matching method. Agric. Econ. Probl. 2008, 8, 34–39. (In Chinese) [Google Scholar]
- Xie, S.; Liu, S.; Li, Q. Availability of Infrastructure and Rural Poverty Reduction: Empirical Analysis from Micro data in China. Chin. Rural. Econ. 2018, 05, 112–131. (In Chinese) [Google Scholar]
- China’s Department of Comprehensive Statistics of National Bureau of Statistics. China Compendium of Statistics 1949–2008; China Statistics Press: Beijing, China, 2010.
- China’ s Department of Household Surveys National Bureau of Statistics. Poverty Monitoring Report of Rural China; China Statistics Press: Beijing, China, 2020.
- Zhong, X.; Yan, Q.; Li, G. Long Time Series Nighttime Light Dataset of China (2000–2020). Digit. J. Glob. Change Data Repos. 2022, 6. [Google Scholar] [CrossRef]
- Hansen, W. How Accessibility Shapes Land-use. J. Am. Inst. Plan. 1959, 25, 73–76. [Google Scholar] [CrossRef]
- Wu, Q.; Zhang, H.; Ye, Y.; Su, Y. Spatial and temporal compression effect of Hong Kong-Zhuhai-Macao Bridge based on traffic accessibility. J. Geogr. Sci. 2012, 67, 723–732. (In Chinese) [Google Scholar]
- Wu, Q.; Fan, J.; Zhang, H.; Ye, Y. The spatial impacts model of trans-strait fixed links: A case study of the Pearl River Delta, China. J. Transp. Geogr. 2017, 63, 30–39. [Google Scholar]
- Elvidge, C.D.; Sutton, P.C.; Ghosh, T.; Tuttle, B.T.; Baugh, K.E.; Bhaduri, B.; Bright, E. A Global Poverty Map Derived from Satellite Data. Comput. Geosci. 2009, 35, 1652–1660. [Google Scholar]
- Mundlak, Y. Empirical productions free of management bias. J. Farm Econ. 1961, 43, 44–56. [Google Scholar]
- Balestra, P.; Nerlove, M. Pooling cross-section and time-series data in the estimation of a dynamiceconomic model: The demand for natural gas. Econometrica 1966, 34, 585–612. [Google Scholar]
- Wallace, T.D.; Hussain, A. The Use of Error Components Models in Combining Cross Section with Time Series Data. Econometrica 1969, 37, 55–72. [Google Scholar] [CrossRef]
- Zhang, X.; Shi, L. A comparative study of multilevel model and static panel data model. J. Stat. Inf. 2010, 03, 22–26. (In Chinese) [Google Scholar]
- Sieber, N.; Allen, H. Impacts of rural roads on poverty and equity. Transp. Commun. Bull. Asia Pac. 2016, 86, 23–40. [Google Scholar]


| Authors | Methods | Samples | Findings |
|---|---|---|---|
| Aschauer [26] | Estimate the Cobb—Douglas production function using the OLS model. | Time series data of the U.S. in 1949–1985. | The elasticity coefficient of the core infrastructure, including highway and electricity supply, to economic growth was 0.39 [26]. |
| Munnell [30] | Estimate the translog aggregate production function using the OLS model. | Panel data of 48 States in the U.S. in 1970–1986. | The output elasticity of highway capital was 0.04 [30]. |
| Berndt et al. [33] | Estimate the cost function using the OLS model and GLS model. | Time series data of Sweden in 1960–1988. | The elasticity of public infrastructure investment to production cost and profit was 0.289 [33]. |
| Bougheas et al. [31] | Estimate the aggregate production function using the OLS model. | Four-digit codes data of manufacture sectors in the U.S. in 1987 and 1997. | Core infrastructure, particularly transport, can reduce input costs and promote specialization [31]. |
| Demurger [36] | Estimate the aggregate production function using the fixed-effects model, random-effects model and 2SLS model. | Panel data of 24 provinces in China in 1985–1998. | Transport facilities were key factors in promoting economic growth [36]. |
| Fan et al. [38] | Based on the simultaneous equations model. | Provincial level data of China in 1970–1997. | Rural road investment can expand the non-agricultural employment opportunities of farmers, accelerate the pace of poverty alleviation and prosperity, and narrow the income gap between urban and rural residents. The output elasticity is 0.152 [38]. |
| Balisacan et al. [39] | Based on the simultaneous equations model estimated by the three stage least square (3SLS) method and quantile regression. | Provincial data of Philippine in 1980s–1990s. | For every 1% increase in rural road investment, the per capita income of farmers increased by 0.32% on average [39]. |
| Kwon [27] | Estimate the Cobb—Douglas production function. | Provincial level panel data on Indonesia in 1976–1996. | The investment of highway transport facilities can lead to poverty reduction by promoting regional economic growth and increasing farmers’ income [27]. |
| Zhang [28] | Estimate the Cobb—Douglas production function using the error correction model and Granger test. | Provincial data of China in 1993–2004. | The output elasticity of transportation infrastructure to economic growth was between 0.0563 and 0.2058 [28]. |
| Li [42] | Based on the p-score matching method. | Tracking survey data of China in 2001–2004. | Road construction has reduced the poverty rate in targeted rural areas by about 19 percent and increased the per capita net income of rural areas by 34 percent, benefiting the poor households more significantly [42]. |
| Zou et al. [37] | Based on the fixed-effects model. | Panel data of 1994–2022 as well as time series data of 1978–2002. | Highway construction was more conducive to promoting economic growth and reducing poverty than railway construction [37]. |
| Mao et al. [29] | Estimate the Cobb—Douglas production function using the individual fixed-effects model. | Panel data of 30 provinces in China in 1999—2008. | The contribution rate of rural transport infrastructure investment to farmers’ income in China was between 0.02 and 0.09 [29]. |
| Banerjee et al. [32] | Estimate the aggregate production function by the Granger test. | County data of China in 1986–2006. | Transport infrastructure was the Granger reason for economic growth [32]. |
| Juan et al. [34] | Estimate the cost function using regression method. | 2005 OD Travel Survey of Bogota. | Strong correlation existed between transport accessibility and regional poverty alleviation [34]. |
| Chatterjee et al. [35] | Estimate the CES production function using regression method. | Cross-section data of government including infrastructure investment and labor income. | Infrastructure investment had an impact on productivity and income distribution, which, in turn, affected poverty alleviation [35]. |
| Kang et al. [23] | Based on the dynamic panel model estimated by the generalized method of moments (GMM) in two steps. | Provincial data of China in 1998–2012. | Highway transport infrastructure and highway transport industry can significantly reduce the income gap between urban and rural areas, and the role of railway in promoting the economy had a lag [23]. |
| Li et al. [40] | Based on the VAR model. | Panel data of 30 provinces in China in 1988–2014. | The long-balanced one-way relationship existed between transport infrastructure construction and poverty reduction effect was long-term, and transport investment had a strong positive impact on farmers’ income [40]. |
| Marinho et al. [41] | Based on the dynamic panel model estimated by the GMM method. | Panel data of 26 States in Brazil in 19795–2011. | Significant negative relationship existed between public infrastructure investment and poverty [41]. |
| Xie et al. [43] | Based on the 2SLS model. | China family tracking survey data of 25 provinces in 2010 and 2014. | The availability of rural road infrastructure had a positive impact on rural poverty reduction and helped to reduce rural poverty incidence [43]. |
| Chen et al. [24] | Based on the threshold effect model. | Panel data of 30 provinces in China in 2010–2019. | Transport infrastructure had three threshold effects on rural poverty alleviation, and it showed an obvious “inverted U” trend overall [24]. |
| Elevation (m) | Slope (°) | Speed (km/h) |
|---|---|---|
| 0–1000 | 0–15 | 20 |
| 15–25 | 10 | |
| >25 | 1 | |
| >1000 | 0–15 | 20 |
| >15 | 1 |
| Variable | Description | Descriptive Statistics | |||
|---|---|---|---|---|---|
| Min. | Max. | Mean | SD | ||
| Poverty index (POV) | Ratio of the poverty-stricken population to the total residential population in each county. | 0.000 | 0.989 | 0.540 | 0.308 |
| Transport accessibility (ASTT) | ASTT of each county, (an inverse index). | 2.135 | 8.939 | 4.177 | 1.163 |
| Urbanization development (BUI) | Ratio of the urban construction land area to the total land area of the county. | 0.039 | 29.278 | 1.051 | 3.122 |
| Industrial structure (INS) | Ratio of the tertiary industry in the county GDP. | 0.000 | 83.123 | 38.765 | 12.747 |
| Social development (RAT) | Annual growth rate of per-capita GDP in each county. | −8.000 | 45.400 | 11.783 | 4.429 |
| Infrastructural investment (INV) | Fixed-asset investment in each county. | 1649 | 7,754,823 | 802,502.5 | 1,282,272 |
| Counties | Transport Accessibility | Poverty Index Values | Counties | Transport Accessibility | Poverty Index Values | ||||
|---|---|---|---|---|---|---|---|---|---|
| 2000 | 2018 | 2000 | 2018 | 2000 | 2018 | 2000 | 2018 | ||
| Yunyan | 2.97 | 2.13 | 0.01 | 0 | Huishui | 4.87 | 3.49 | 0.99 | 0.50 |
| Nanming | 3.04 | 2.14 | 0.90 | 0.18 | Pingtang | 4.95 | 3.89 | 0.83 | 0.20 |
| Baiyun | 3.05 | 2.16 | 0.82 | 0.34 | Tongxin | 4.96 | 4.00 | 0.76 | 0.07 |
| Huaxi | 3.20 | 2.24 | 0.96 | 0.61 | Huichuan | 5.00 | 2.88 | 0.99 | 0.79 |
| Longli | 3.25 | 2.32 | 0.91 | 0.50 | Qianxi | 5.04 | 2.72 | 0.84 | 0.36 |
| Pingba | 3.26 | 2.39 | 0.91 | 0.50 | Luodian | 5.05 | 3.15 | 0.74 | 0.18 |
| Fuquan | 3.29 | 2.36 | 0.86 | 0.27 | Xingren | 5.11 | 3.80 | 0.94 | 0.29 |
| Majiang | 3.41 | 2.48 | 0.95 | 0.42 | Puan | 5.17 | 4.16 | 0.85 | 0.40 |
| Guanshanhu | 3.41 | 2.24 | 0.84 | 0.22 | Sandu | 5.20 | 3.21 | 0.98 | 0.66 |
| Bozhou | 3.41 | 2.54 | 0.49 | 0.13 | Tianzhu | 5.24 | 3.62 | 0.96 | 0.30 |
| Wengan | 3.44 | 2.40 | 0.98 | 0.59 | Cengong | 5.26 | 3.63 | 0.96 | 0.34 |
| Kaili | 3.47 | 2.49 | 0.02 | 0 | Congjiang | 5.29 | 3.60 | 0.95 | 0.31 |
| Xifeng | 3.47 | 2.48 | 0.97 | 0.29 | Panzhou | 5.31 | 4.22 | 0.96 | 0.44 |
| Meitan | 3.65 | 2.65 | 0.95 | 0.43 | Zhenning | 5.37 | 3.26 | 0.95 | 0.60 |
| Duyun | 3.66 | 2.45 | 0.89 | 0.32 | Zhenfeng | 5.46 | 3.39 | 0.92 | 0.45 |
| Puding | 3.68 | 2.72 | 0.60 | 0.26 | Wangmo | 5.51 | 4.17 | 0.93 | 0.39 |
| Huangping | 3.70 | 2.69 | 0.87 | 0.15 | Suiyang | 5.53 | 4.51 | 0.86 | 0.29 |
| Yuqing | 3.70 | 2.74 | 0.81 | 0.26 | Sinan | 5.61 | 3.36 | 0.46 | 0.09 |
| Xiuwen | 3.74 | 2.38 | 0.95 | 0.63 | Wuchuan | 5.65 | 4.03 | 0.40 | 0.04 |
| Shibing | 3.83 | 2.83 | 0.98 | 0.48 | Zhengan | 5.71 | 3.96 | 0.61 | 0.17 |
| Taijiang | 3.85 | 2.79 | 0.03 | 0 | Weining | 5.77 | 4.21 | 0.79 | 0.13 |
| Liuzhi | 3.86 | 3.01 | 0.35 | 0.03 | Xingyi | 5.80 | 4.31 | 0.95 | 0.43 |
| Qingzhen | 3.91 | 2.85 | 0.30 | 0.03 | Anlong | 5.86 | 4.17 | 0.51 | 0.16 |
| Wudang | 3.91 | 2.16 | 0.98 | 0.48 | Ziyun | 5.89 | 4.61 | 0.90 | 0.27 |
| Kaiyang | 3.94 | 2.40 | 0.96 | 0.25 | Hezhang | 5.91 | 3.82 | 0.26 | 0.05 |
| Xixiu | 3.97 | 2.58 | 0.68 | 0.03 | Wanshan | 5.91 | 3.47 | 0.35 | 0.12 |
| Dushan | 4.03 | 2.97 | 0.80 | 0.27 | Yanhe | 5.92 | 4.34 | 0.90 | 0.24 |
| Honghuagang | 4.05 | 2.64 | 0.92 | 0.45 | Yinjiang | 5.92 | 3.58 | 0.76 | 0.26 |
| Guiding | 4.06 | 2.89 | 0.96 | 0.46 | Bijiang | 5.95 | 3.61 | 0.92 | 0.45 |
| Zhenyuan | 4.15 | 3.10 | 0.10 | 0 | Guanling | 6.06 | 4.07 | 0.95 | 0.33 |
| Qinglong | 4.21 | 3.27 | 0.26 | 0.07 | Liping | 6.07 | 4.01 | 0.74 | 0.34 |
| Fenggang | 4.24 | 3.01 | 0 | 0 | Leishan | 6.08 | 4.63 | 0.91 | 0.24 |
| Zhijin | 4.29 | 2.73 | 0.91 | 0.25 | Jiangkou | 6.08 | 3.97 | 0.73 | 0.27 |
| Sansui | 4.30 | 3.04 | 0.93 | 0.31 | Jianhe | 6.10 | 3.73 | 0.55 | 0.25 |
| Danzhai | 4.42 | 2.79 | 0.83 | 0.17 | Renhuai | 6.16 | 3.27 | 0.95 | 0.41 |
| Shiqian | 4.51 | 3.03 | 0.98 | 0.72 | Jinping | 6.17 | 4.19 | 0.90 | 0.43 |
| Jinsha | 4.60 | 3.41 | 0.89 | 0.28 | Nayong | 6.17 | 3.71 | 0.85 | 0.34 |
| Zhongshan | 4.65 | 3.55 | 0.95 | 0.30 | Ceheng | 6.53 | 4.23 | 0.99 | 0.34 |
| Dejiang | 4.66 | 3.25 | 0 | 0 | Daozhen | 6.65 | 4.15 | 0.84 | 0.30 |
| Changshun | 4.76 | 3.12 | 0.96 | 0.53 | Shuicheng | 6.66 | 3.67 | 0.72 | 0.18 |
| Rongjiang | 4.77 | 3.25 | 0.65 | 0.12 | Qixinguan | 6.79 | 3.97 | 0.96 | 0.59 |
| Dafang | 4.78 | 2.88 | 0.58 | 0.02 | Xishui | 7.98 | 4.39 | 0.49 | 0.02 |
| Yuping | 4.80 | 3.43 | 0.47 | 0.03 | Songtao | 8.38 | 4.20 | 0.54 | 0.09 |
| Libo | 4.82 | 3.74 | 0.95 | 0.37 | Chishui | 8.94 | 4.34 | 0.95 | 0.36 |
| Mean value | 4.90 | 3.30 | 0.75 | 0.29 | Standard deviation | 1.21 | 0.70 | 0.27 | 0.19 |
| Category | Variable | Collinearity Test | Unit Root Test | |
|---|---|---|---|---|
| VIF Value | LLC Test | ADF Test | ||
| Dependent | POV | / | −13.255 * (0.000) | 459.548 * (0.000) |
| Independent | ASTT | 1.371 | −28.994 * (0.000) | 759.597 * (0.000) |
| BUI | 1.275 | −18.731 * (0.000) | 796.275 * (0.000) | |
| INS | 1.280 | −81.920 * (0.000) | 473.494 * (0.000) | |
| RAT | 1.044 | −66.974 * (0.000) | 417.245 * (0.000) | |
| INV | 1.331 | −43.424 * (0.000) | 259.472 * (0.000) | |
| Independent Variable | Coefficient | Standard Error |
|---|---|---|
| Transport accessibility (ACC) | 0.839 *** | 0.314 |
| Urbanization (BUI) | −0.223 * | 0.120 |
| Industrial structure (INS) | −0.178 | 0.129 |
| Social development (RAT) | 0.230 *** | 0.055 |
| Infrastructural investment (INV) | −0.120 *** | 0.030 |
| Constant | 3.778 | / |
| R2 | 0.917 | / |
| Year | Document | Policy |
|---|---|---|
| 2001 | 10th Five-years Plan for Transportation Development | Support the transport development in the western region. |
| 2003 | Implementation Opinions on Reconstruction Project of Intercounty and Rural Highways | Solve the problem of township-to-village, county-to-country and intercounty access to asphalt or cement roads. |
| 2012 | Poverty Alleviation Plan Outline of Transportation Construction in Concentrated Contiguous Destitute Areas (2011–2020) | Focus on 11 concentrated contiguous destitute areas as key targets for transport poverty alleviation. |
| 2013 | Construction Plan of ‘Changing Rope to Bridge’ (2013–2015) | Convert ziplines in remote mountainous areas of Yunnan, Sichuan, Guizhou, Shaanxi, Gansu, Qinghai, and Xinjiang provinces into pedestrian or vehicular high bridges. |
| 2015 | Opinions of the Ministry of Transport on Promoting the Construction of ‘Four Good Rural Roads’ | Focus on the construction of rural roads in poverty alleviation areas for poverty alleviation. |
| 2016 | 13th Five-years Plan for Transport Poverty Alleviation | Expand the scope of transport poverty alleviation, including 1177 counties in contiguous poverty-stricken areas, old revolutionary areas, ethnic minority areas and border counties. |
| 2018 | Three-year Action Plan for Transport Poverty Alleviation (2018–2020) | Propose 12 key tasks, including trunk highway construction, rural highway safety life protection project construction, and “transport + industry” poverty alleviation. |
| 2020 | China’s Sustainable Development of Transportation | Promote high-quality development of transport in poor areas. |
| 2021 | Implementation Opinions of the Ministry of Transportation on Consolidating and Expanding the Achievements of Transport Poverty Alleviation and Promoting Rural Revitalization | Propose 13 specific implementation measures about the high-quality development of rural transportation and rural revitalization. |
Disclaimer/Publisher’s Note: The statements, opinions and data contained in all publications are solely those of the individual author(s) and contributor(s) and not of MDPI and/or the editor(s). MDPI and/or the editor(s) disclaim responsibility for any injury to people or property resulting from any ideas, methods, instructions or products referred to in the content. |
© 2023 by the authors. Licensee MDPI, Basel, Switzerland. This article is an open access article distributed under the terms and conditions of the Creative Commons Attribution (CC BY) license (https://creativecommons.org/licenses/by/4.0/).
Share and Cite
Cai, J.; Huang, C.; Deng, Z.; Li, L. Transport Accessibility and Poverty Alleviation in Guizhou Province of China: Spatiotemporal Pattern and Impact Analysis. Sustainability 2023, 15, 3143. https://doi.org/10.3390/su15043143
Cai J, Huang C, Deng Z, Li L. Transport Accessibility and Poverty Alleviation in Guizhou Province of China: Spatiotemporal Pattern and Impact Analysis. Sustainability. 2023; 15(4):3143. https://doi.org/10.3390/su15043143
Chicago/Turabian StyleCai, Jiayuan, Chunchun Huang, Zilin Deng, and Linna Li. 2023. "Transport Accessibility and Poverty Alleviation in Guizhou Province of China: Spatiotemporal Pattern and Impact Analysis" Sustainability 15, no. 4: 3143. https://doi.org/10.3390/su15043143
APA StyleCai, J., Huang, C., Deng, Z., & Li, L. (2023). Transport Accessibility and Poverty Alleviation in Guizhou Province of China: Spatiotemporal Pattern and Impact Analysis. Sustainability, 15(4), 3143. https://doi.org/10.3390/su15043143