

Measuring the Transit-Oriented Development (TOD) Levels of Pakistani Megacities for TOD Application: A Case Study of Lahore


Abstract
1. Introduction
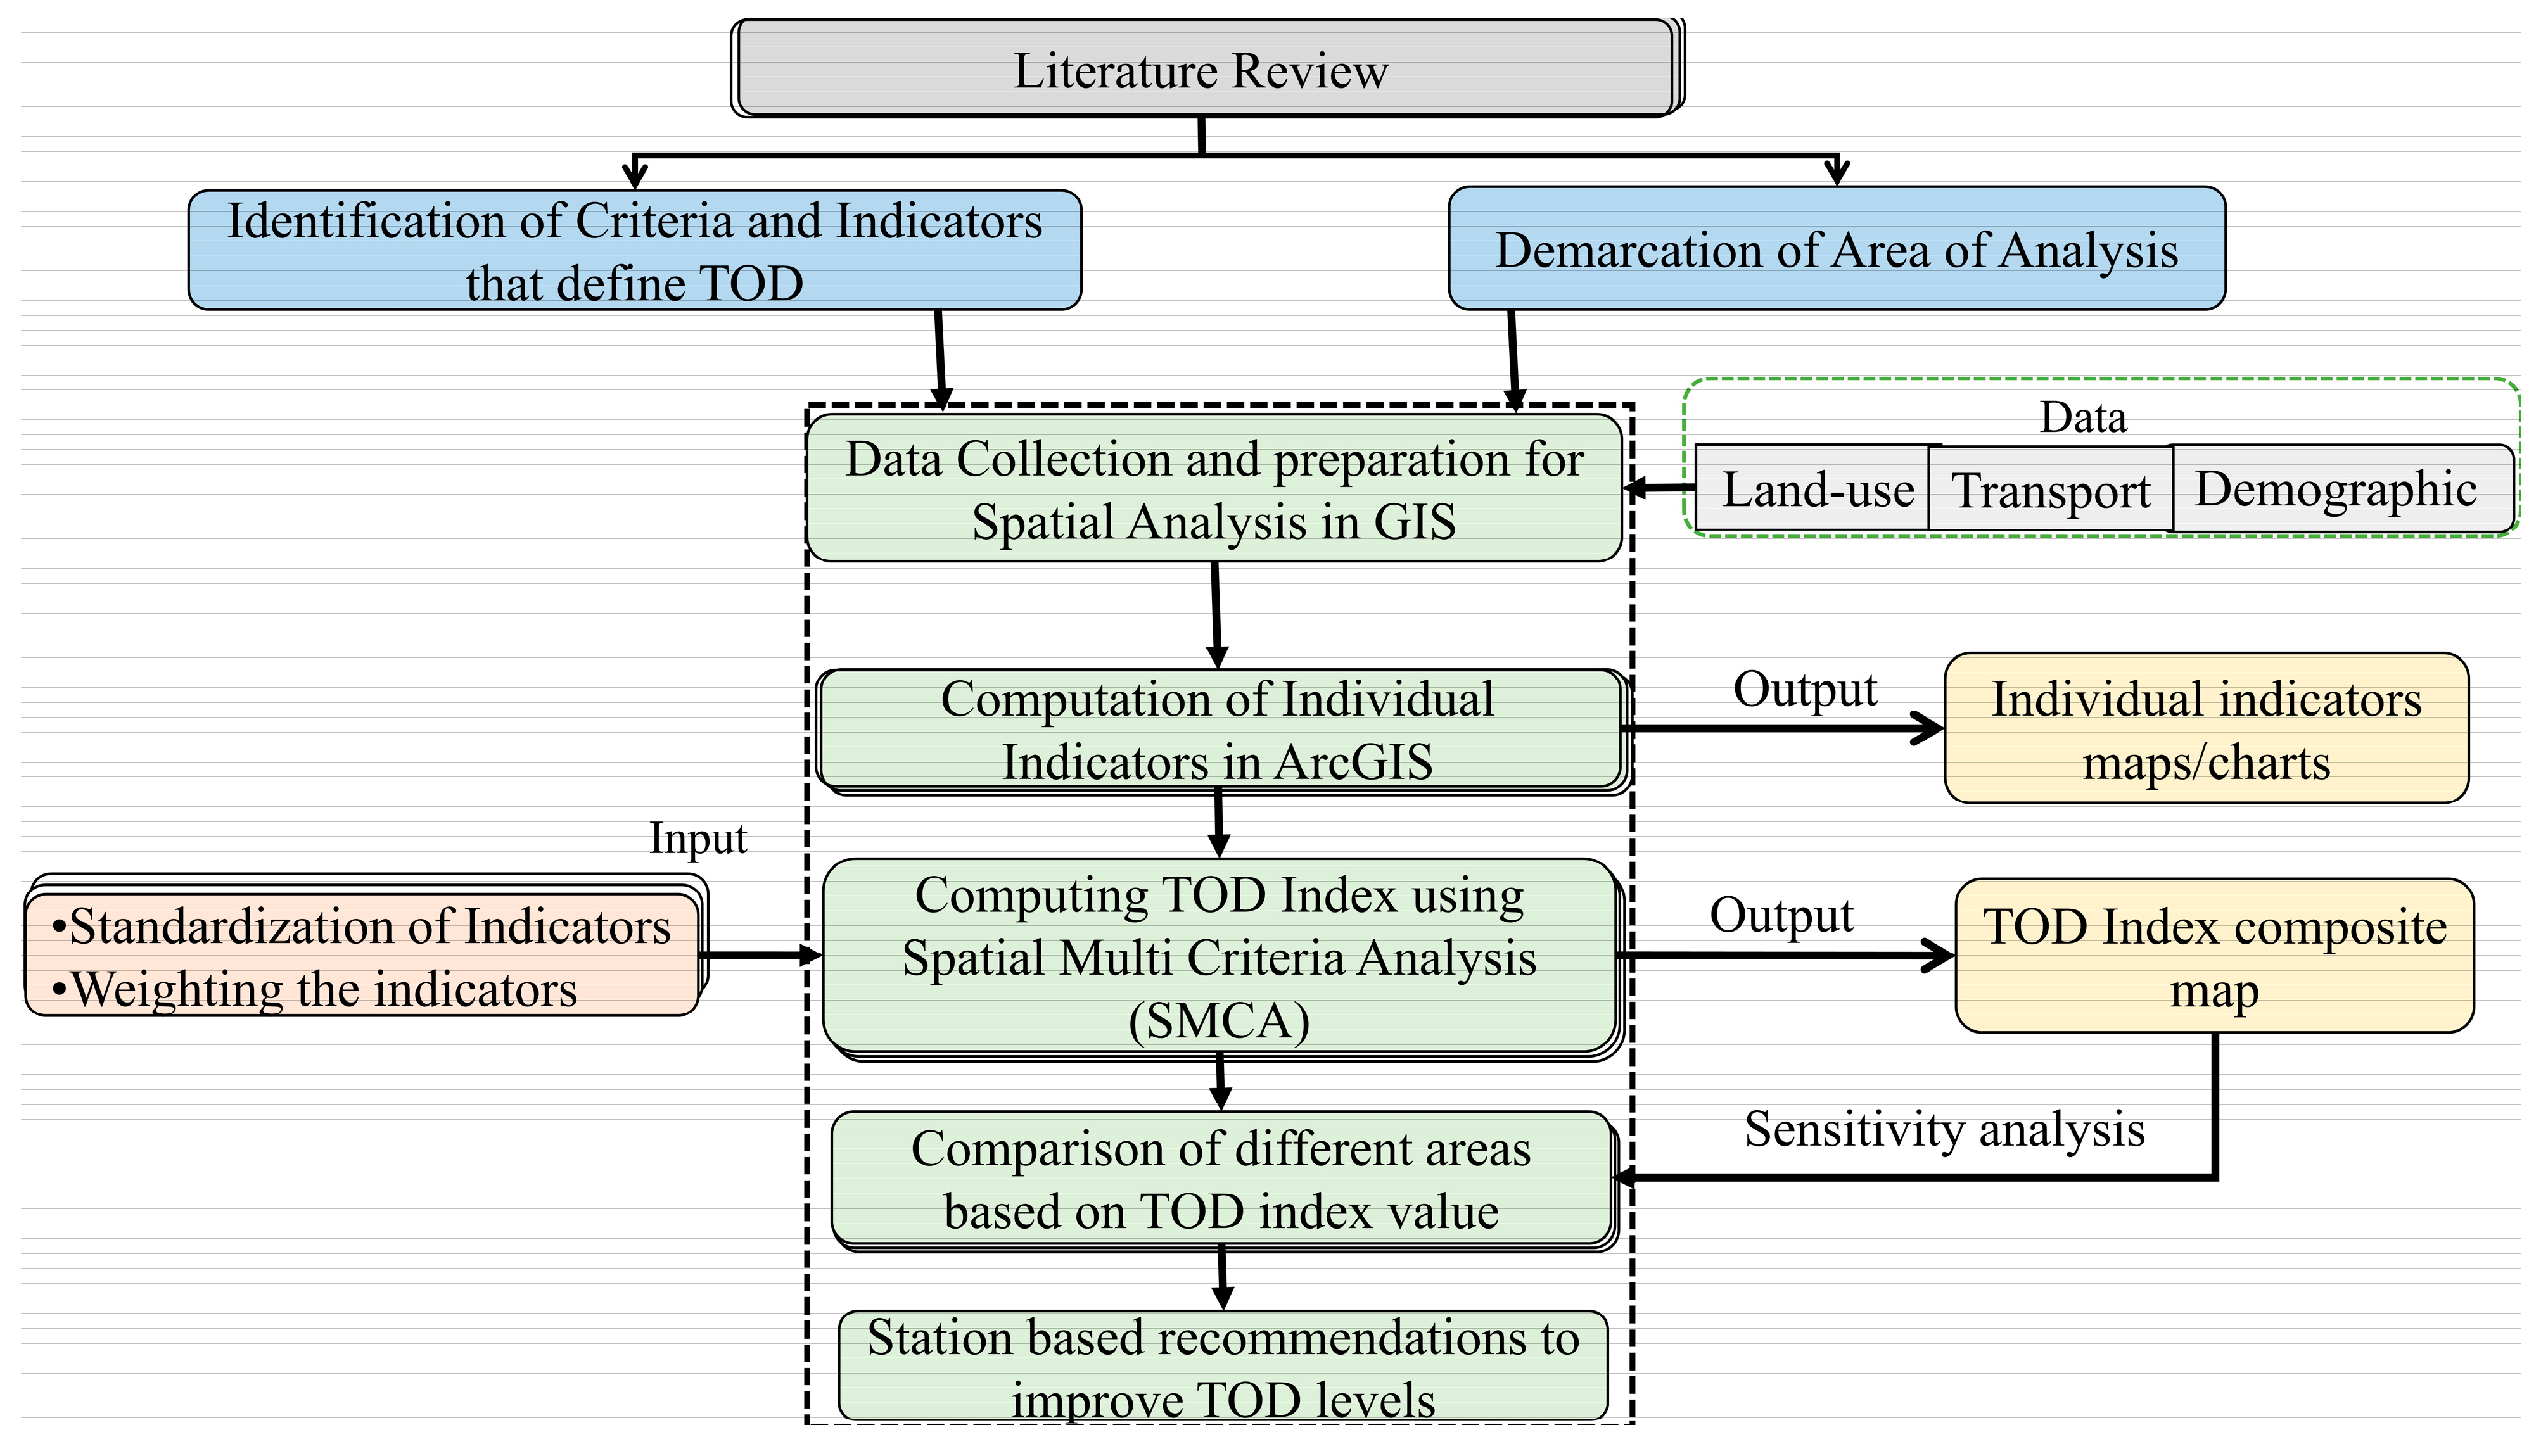
- Applying spatial and non-spatial analytical methods (ArcGIS and SMCA) to obtain the TOD index based on a set of indicators;
- Applying spatial statistical methods (sensitivity analysis) to analyze the obtained values of the TOD index;
- Guiding decision makers to recognize priorities for potential use.
2. Literature Review
3. Research Design
3.1. Demarcation of Area of Analysis
3.2. Identification of Indicators

| [48] | [13] | [37] | [49] | [50] | [51] | [52] | [15] | [53] | [11] | [33] | [54] | [35] | [55] | [56] | [44] | [27] | [57] | [58] | [59] | ||
|---|---|---|---|---|---|---|---|---|---|---|---|---|---|---|---|---|---|---|---|---|---|
| Case study area | Tehran, Iran | Shanghai, China | Dehli, India | Dehli, Bengaluru, Bhopal, Mumbai, India | China City-level examination | Kufa City, Iraq | Thessaloniki, Greece, | Addis Ababa, Ethiopia | Depok City, Indonesia | Arnhem-Nijmegen Netherlands | Ahmedabad, India | New York, USA | Wuhan, China | Shanghai, China | Beijing, Shanghai, Shenzhen, Wuhan, Hangzhou | Delhi, India | Ningbo, China | Singapore | Dhaka, Bangladesh | Kuala Lumpur, Malaysia | |
| No. of transit stations(cases) | 22 | 333 | 47 | 37 Chinese cities | 3 | 32 | 22 | 3 | 21 | 7 | 472 | 21 | 347 | 47 | 63 | 23 | 17 | 69 | |||
| Buffer Distance | 500 | 800 | 800 | 800 | 400–800 | 800 | 800 | 800 | 200 | 800 | 400 | 500 | 800 | 500 | 800 | 800 | |||||
| Criteria | TOD Indicators | ||||||||||||||||||||
| Density | Population density | * | * | * | * | * | * | * | * | * | * | * | * | * | * | * | * | * | |||
| Commercial density | * | * | * | * | * | * | * | * | * | * | |||||||||||
| Land use and built environment | Land use diversity | * | * | * | * | * | * | * | * | * | * | * | * | * | * | * | * | * | * | * | |
| Block Size | * | * | * | * | |||||||||||||||||
| Walkability and Cyclability | Land use Mixedness | * | * | * | * | * | * | * | * | * | * | * | * | * | * | * | |||||
| The total length of walkable/cyclable paths | * | * | * | * | * | * | * | * | * | * | * | * | * | ||||||||
| Intersection density | * | * | * | * | * | * | * | * | * | * | * | * | * | * | * | * | * | ||||
| Impedance pedestrian catchment area (IPCA) | * | * | |||||||||||||||||||
| Economic Development | The density of business establishments | * | * | * | * | * | * | * | * | * | |||||||||||
| Utilization of Transit Capacity | No. of entry and exits | * | * | * | * | * | |||||||||||||||
| Passenger load in peak hours | * | * | * | ||||||||||||||||||
| Passenger load in off-peak hours | * | * | * | * | |||||||||||||||||
| User-friendliness of transit facility | Safety of commuters at the transit stop | * | * | * | * | ||||||||||||||||
| Basic Amenities at the station | * | ||||||||||||||||||||
| Presence of information display systems (Yes/no) | * | * | * | ||||||||||||||||||
| Access and Accessibility | Frequency of transit service | * | * | * | * | ||||||||||||||||
| Interchange to different routes of the same transit | * | * | * | * | |||||||||||||||||
| Interchange to other transit modes | * | * | * | * | * | ||||||||||||||||
| Access to opportunities within a walkable distance from the train station | * | * | * | * | * | * | * | * | * | ||||||||||||
| Station Parking | Parking utilization for cars/4-wheelers | * | * | * | * | * | * | * | * | * | * | * | |||||||||
| Parking utilization for cycles | * | * | * | * | * | * | * | * | * | * | * | ||||||||||
| Open areas/green spaces | * | * | * | * | * | * | |||||||||||||||
| Sr. No. | Criteria | Icon | Indicators | Description | Data Source |
|---|---|---|---|---|---|
| 1 | Density |  | Population density PD | Number of people/sqkm | WorldPop |
| 2 | Land use diversity |  | Land use diversity LDI | Entropy index | Calculated using GIS |
| 3 | Walkability and cyclability |  | Land use mixedness (MI) | Mixedness of residential land use with other land uses | Calculated using GIS |
| Intersection density ID | Number of intersections/sqkm | Calculated using GIS | |||
| Walkable/cyclable paths (WCP) | Total length of walkable/cyclable paths (meters) | Calculated using GIS | |||
| 4 | Economic development |  | Business density BD | Number of business establishments/sqkm | Urban Unit |
| 5 | Capacity utilization of transit |  | Passenger load in peak hours (PLPH) Passenger load in off-peak hours (PLoPH) | Ridership data per station Transit frequency and capacity | Punjab Masstransit Authority (PMA) |
| 6 | Access and accessibility |  | Interchange to other transit modes (IoTM) Job Density (JD) | Interchange to other transit modes; access to opportunities within walkable distance from the transit station (No. of jobs/sqkm) | Survey (2023) Urban Unit |
3.3. Calculation of TOD Index
3.3.1. Standardization of Indicators
3.3.2. Weighting the Indicators
4. The Study Settings
4.1. Background Study of Lahore
4.2. The Lahore Rapid Mass Transit Rail Project (LRMTRP)
- Mass transit system (Green and Orange line) and feeder bus service, run by Punjab Masstransit Authority (PMA);
- Paratransit service (auto and Qingqi rickshaws) privately owned.
- Green line (BRT)—Ferozepur Road/Mall Road/Ravi Road/Shahdara (Launched as BRT, operational since 10 February 2013)
- Orange line (MRT)—Raiwind Road/Multan Road/Macleod Road/Railway Station/GT Road (operational since 25 October 2020)
- Blue line (MRT)—Township/Gulberg Boulevard/Jail Road
- Purple line (MRT)—Bhatti Gate/Allama Iqbal Road/Airport
4.2.1. The Metro Bus System (MBS) Lahore (Green Line)
4.2.2. Orange Line
4.2.3. Blue Line
4.2.4. The Purple Line
5. Results Derived from Indicator Calculations
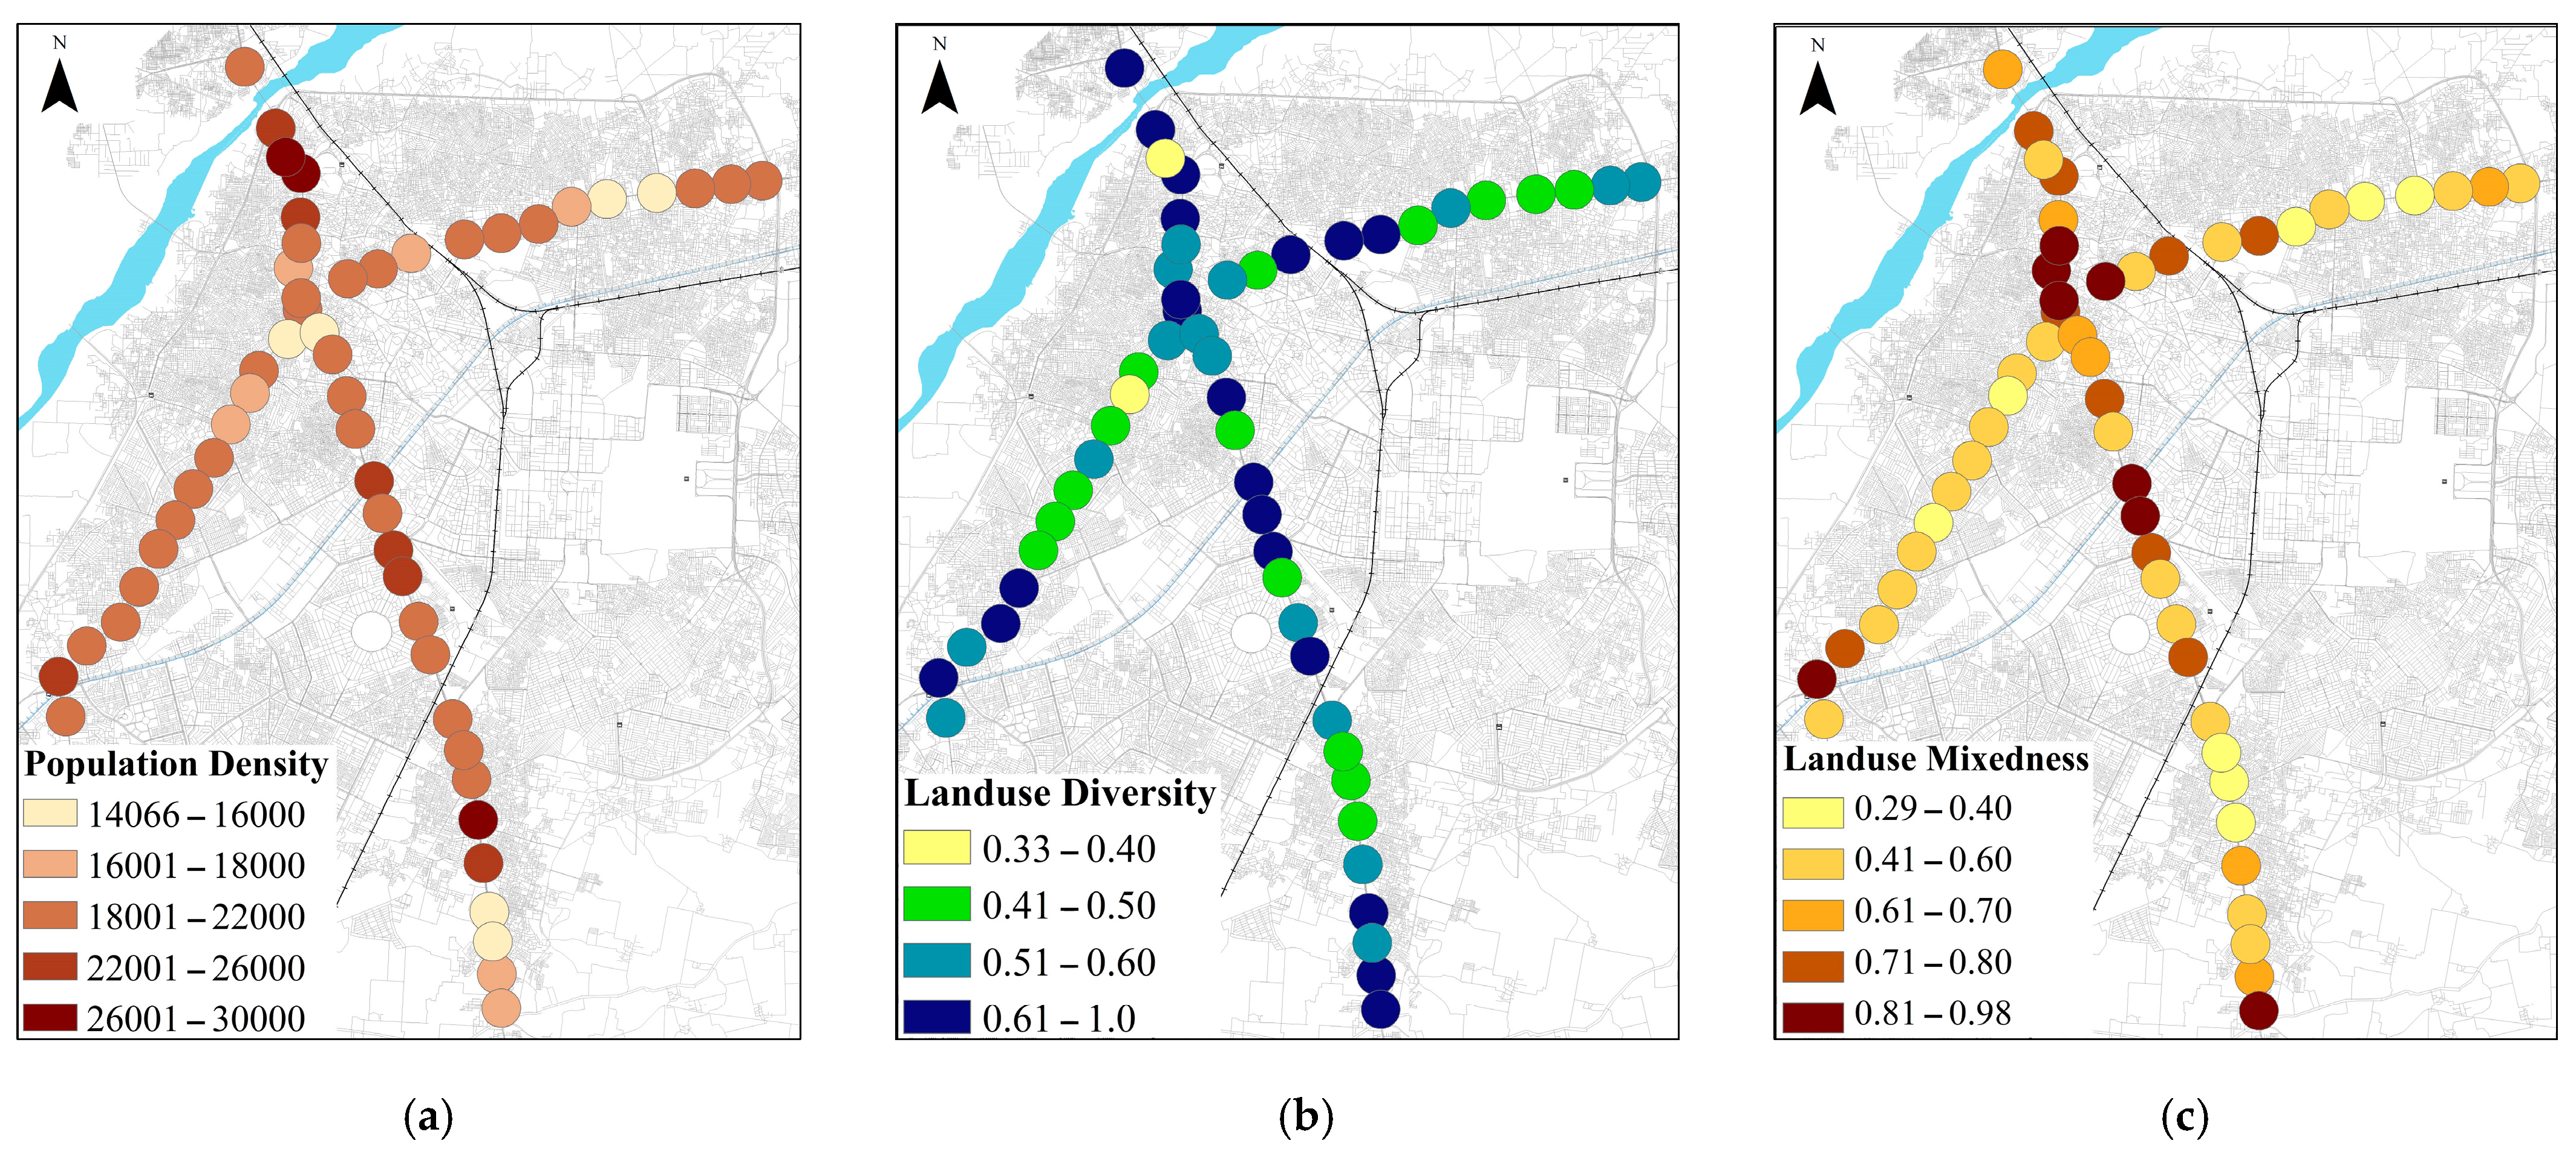
5.1. Population Density
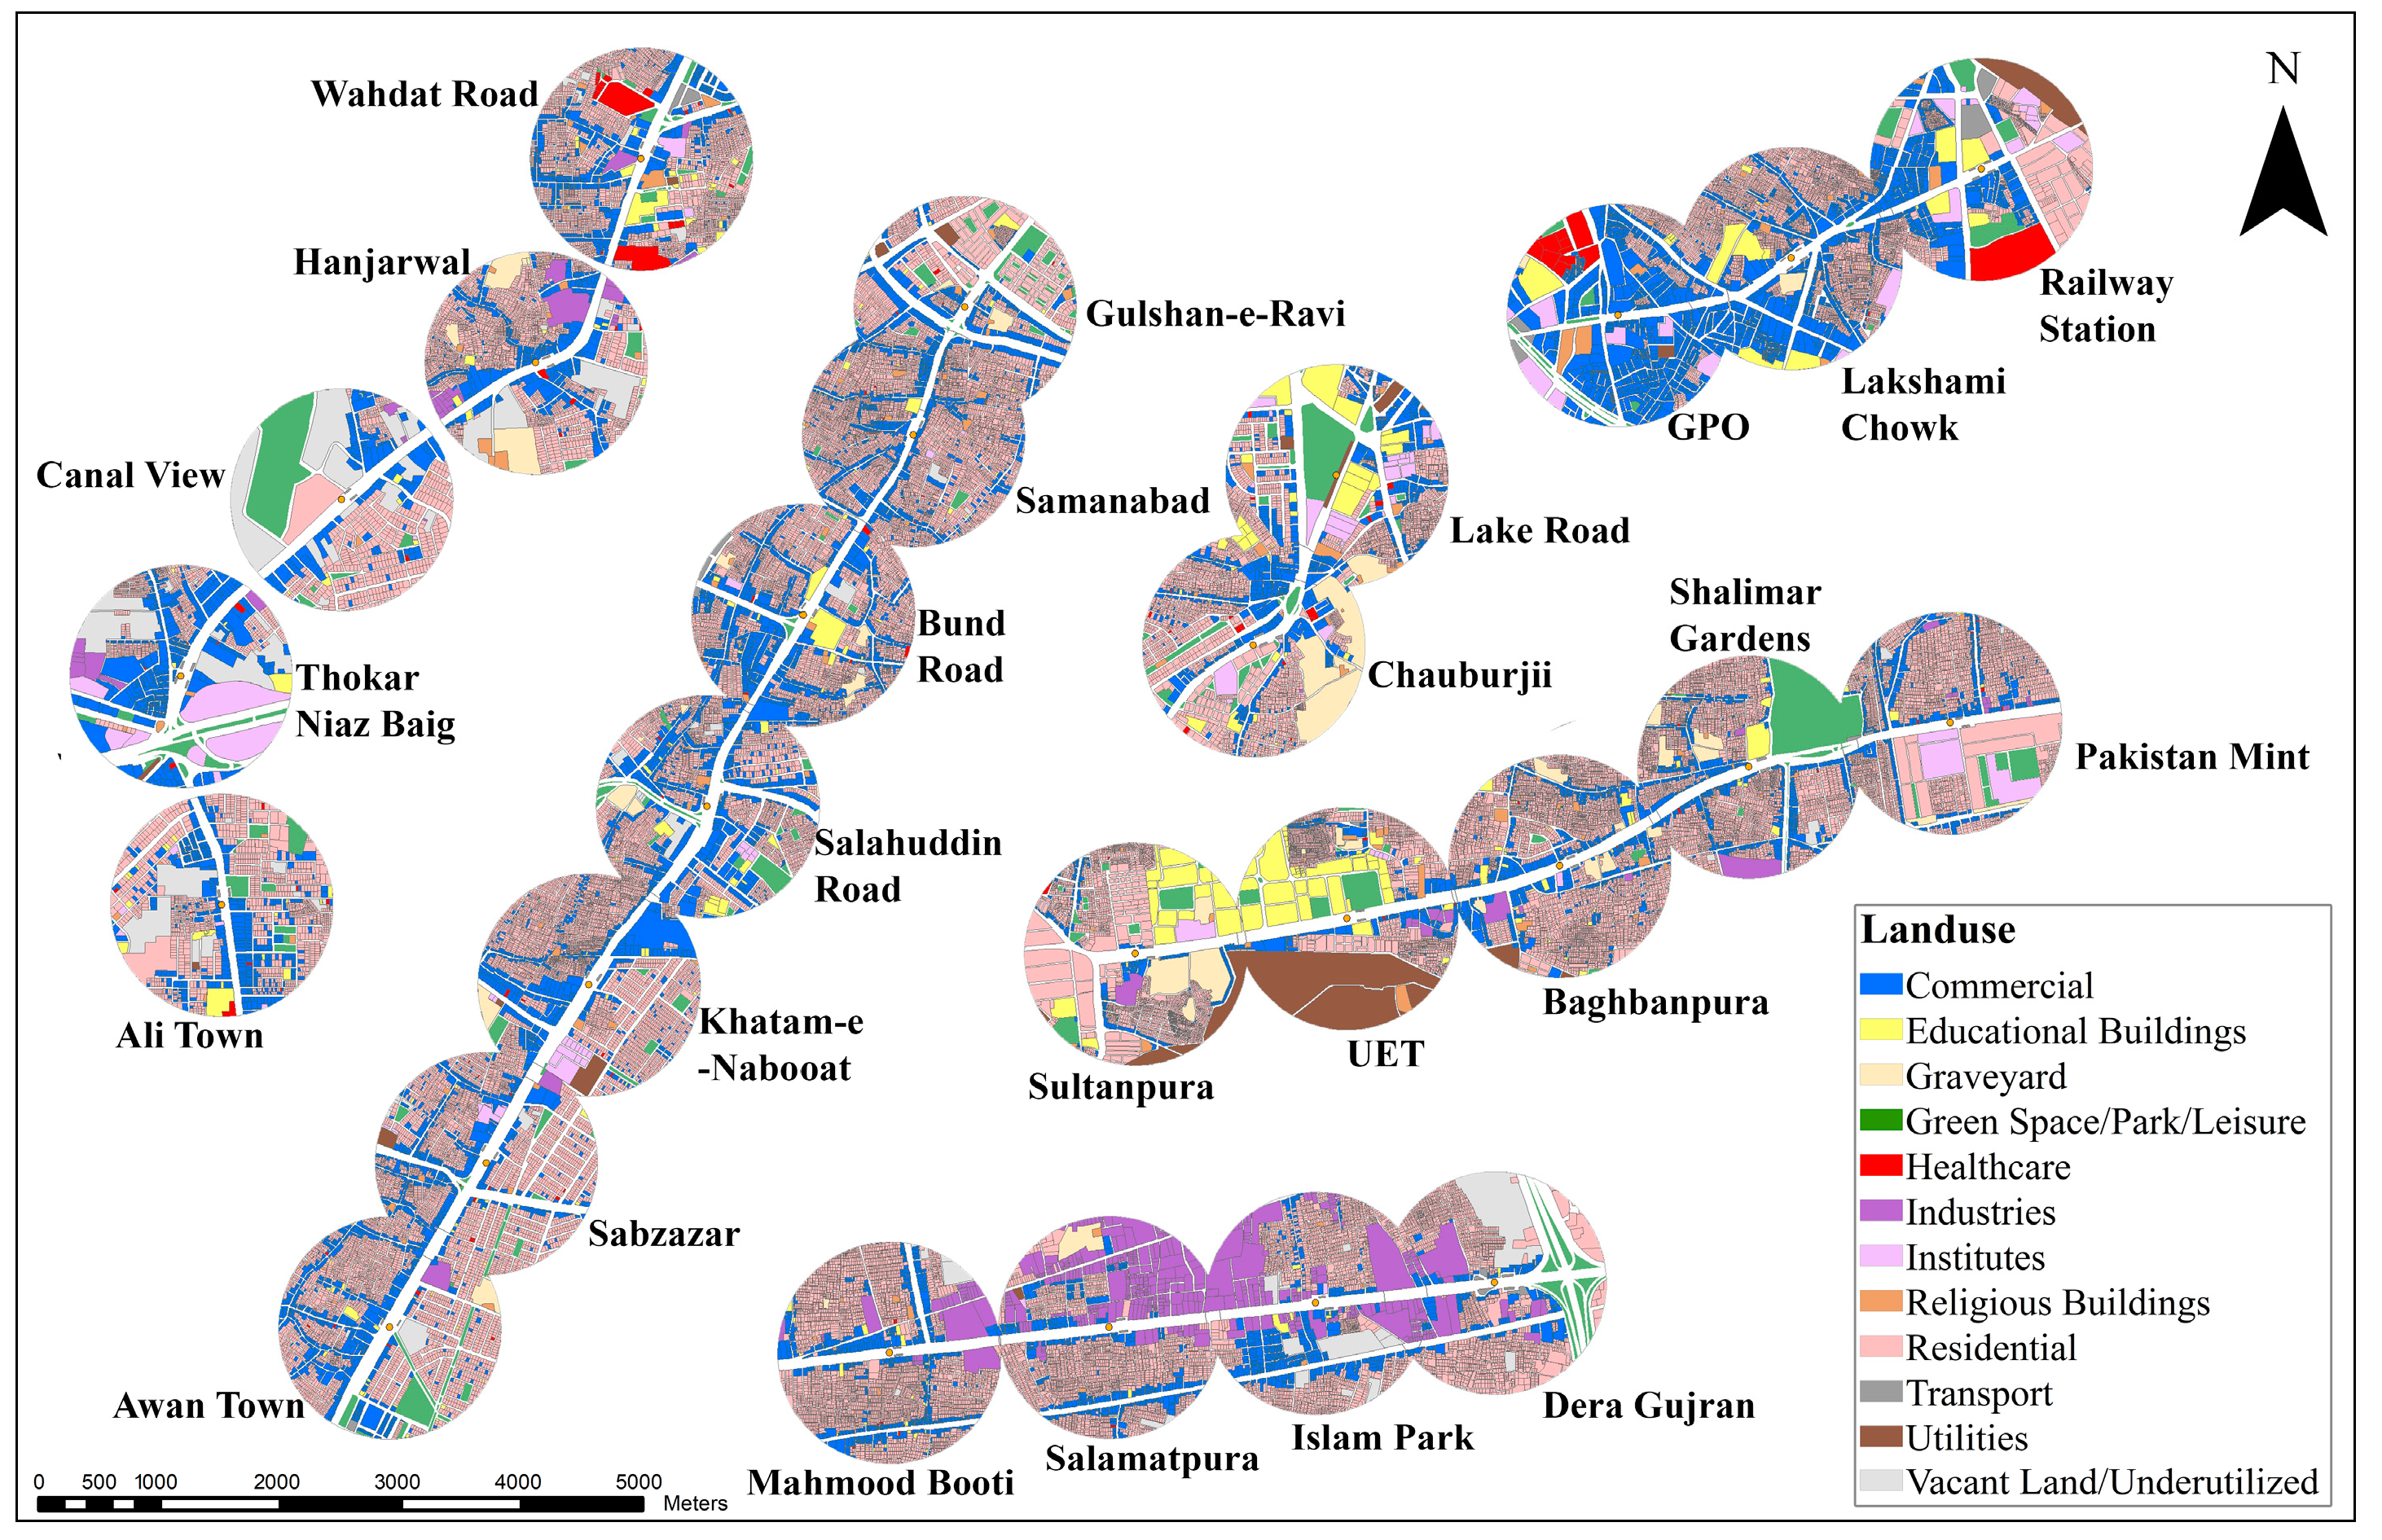
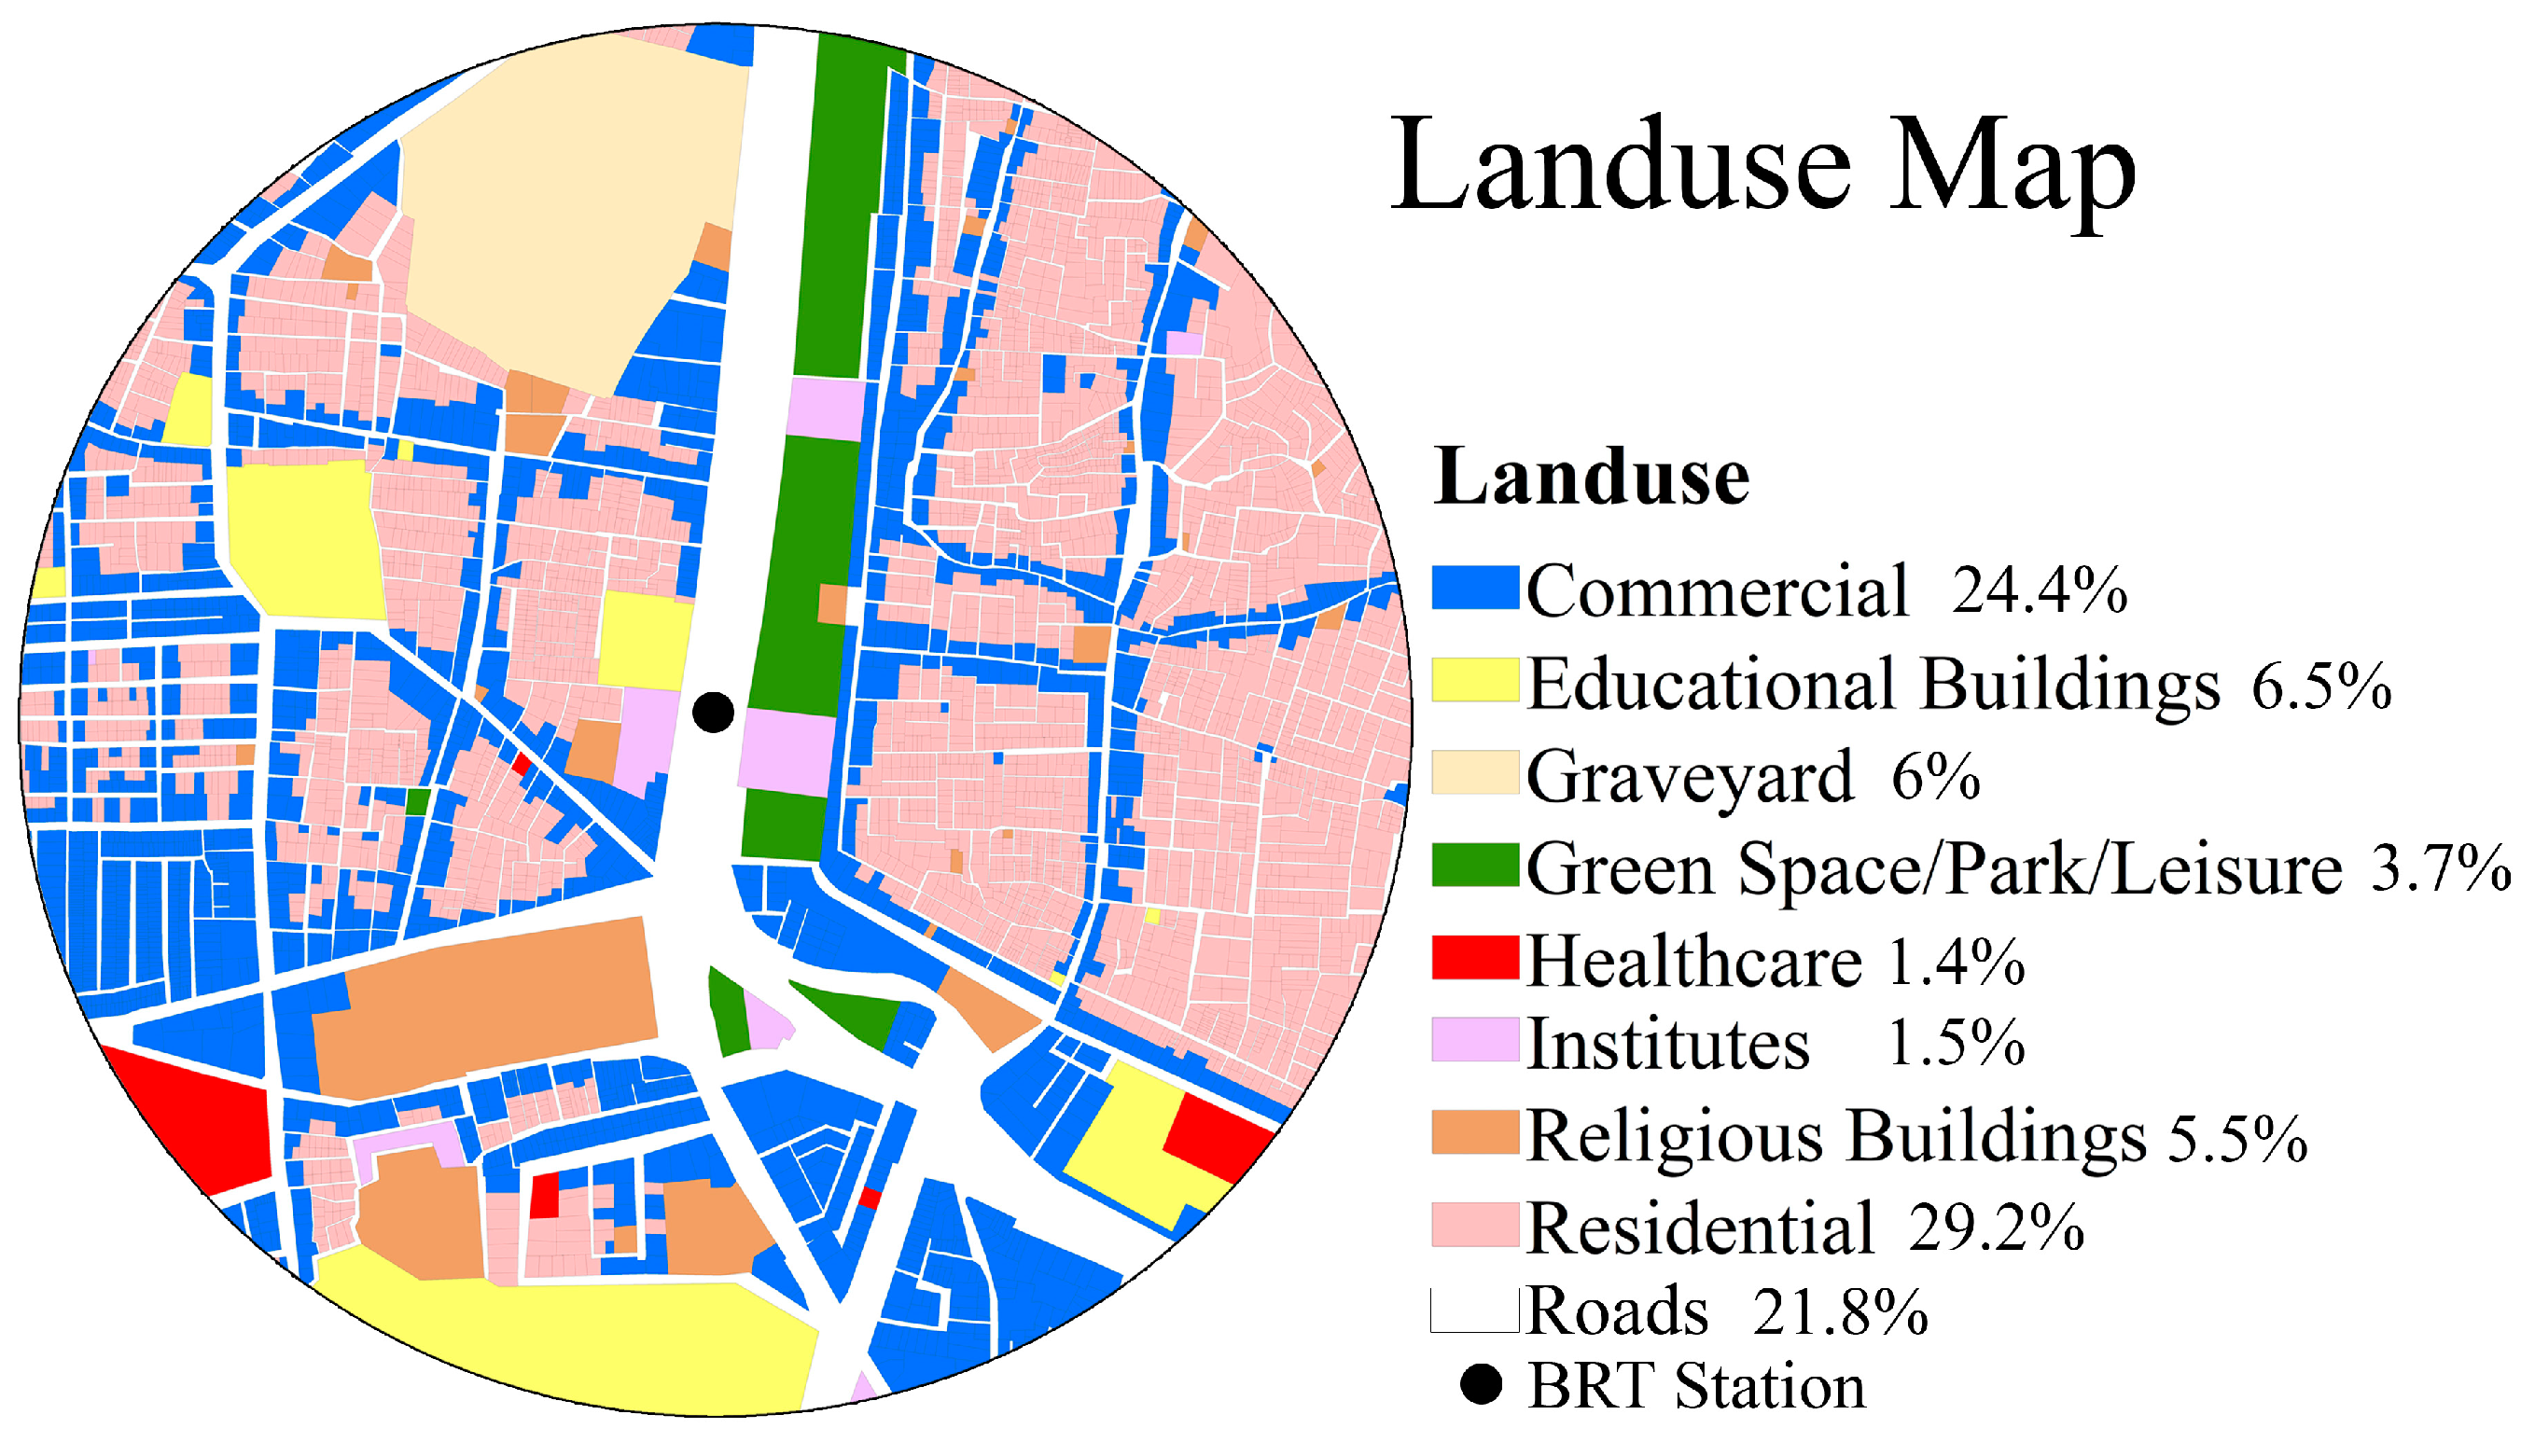
5.2. Land Use Diversity
- land use diversity in the area of analysis = (i)
- = land use class (1,2,…,n) within analysis area i
5.3. Land Use Mixedness
5.4. Intersection Density
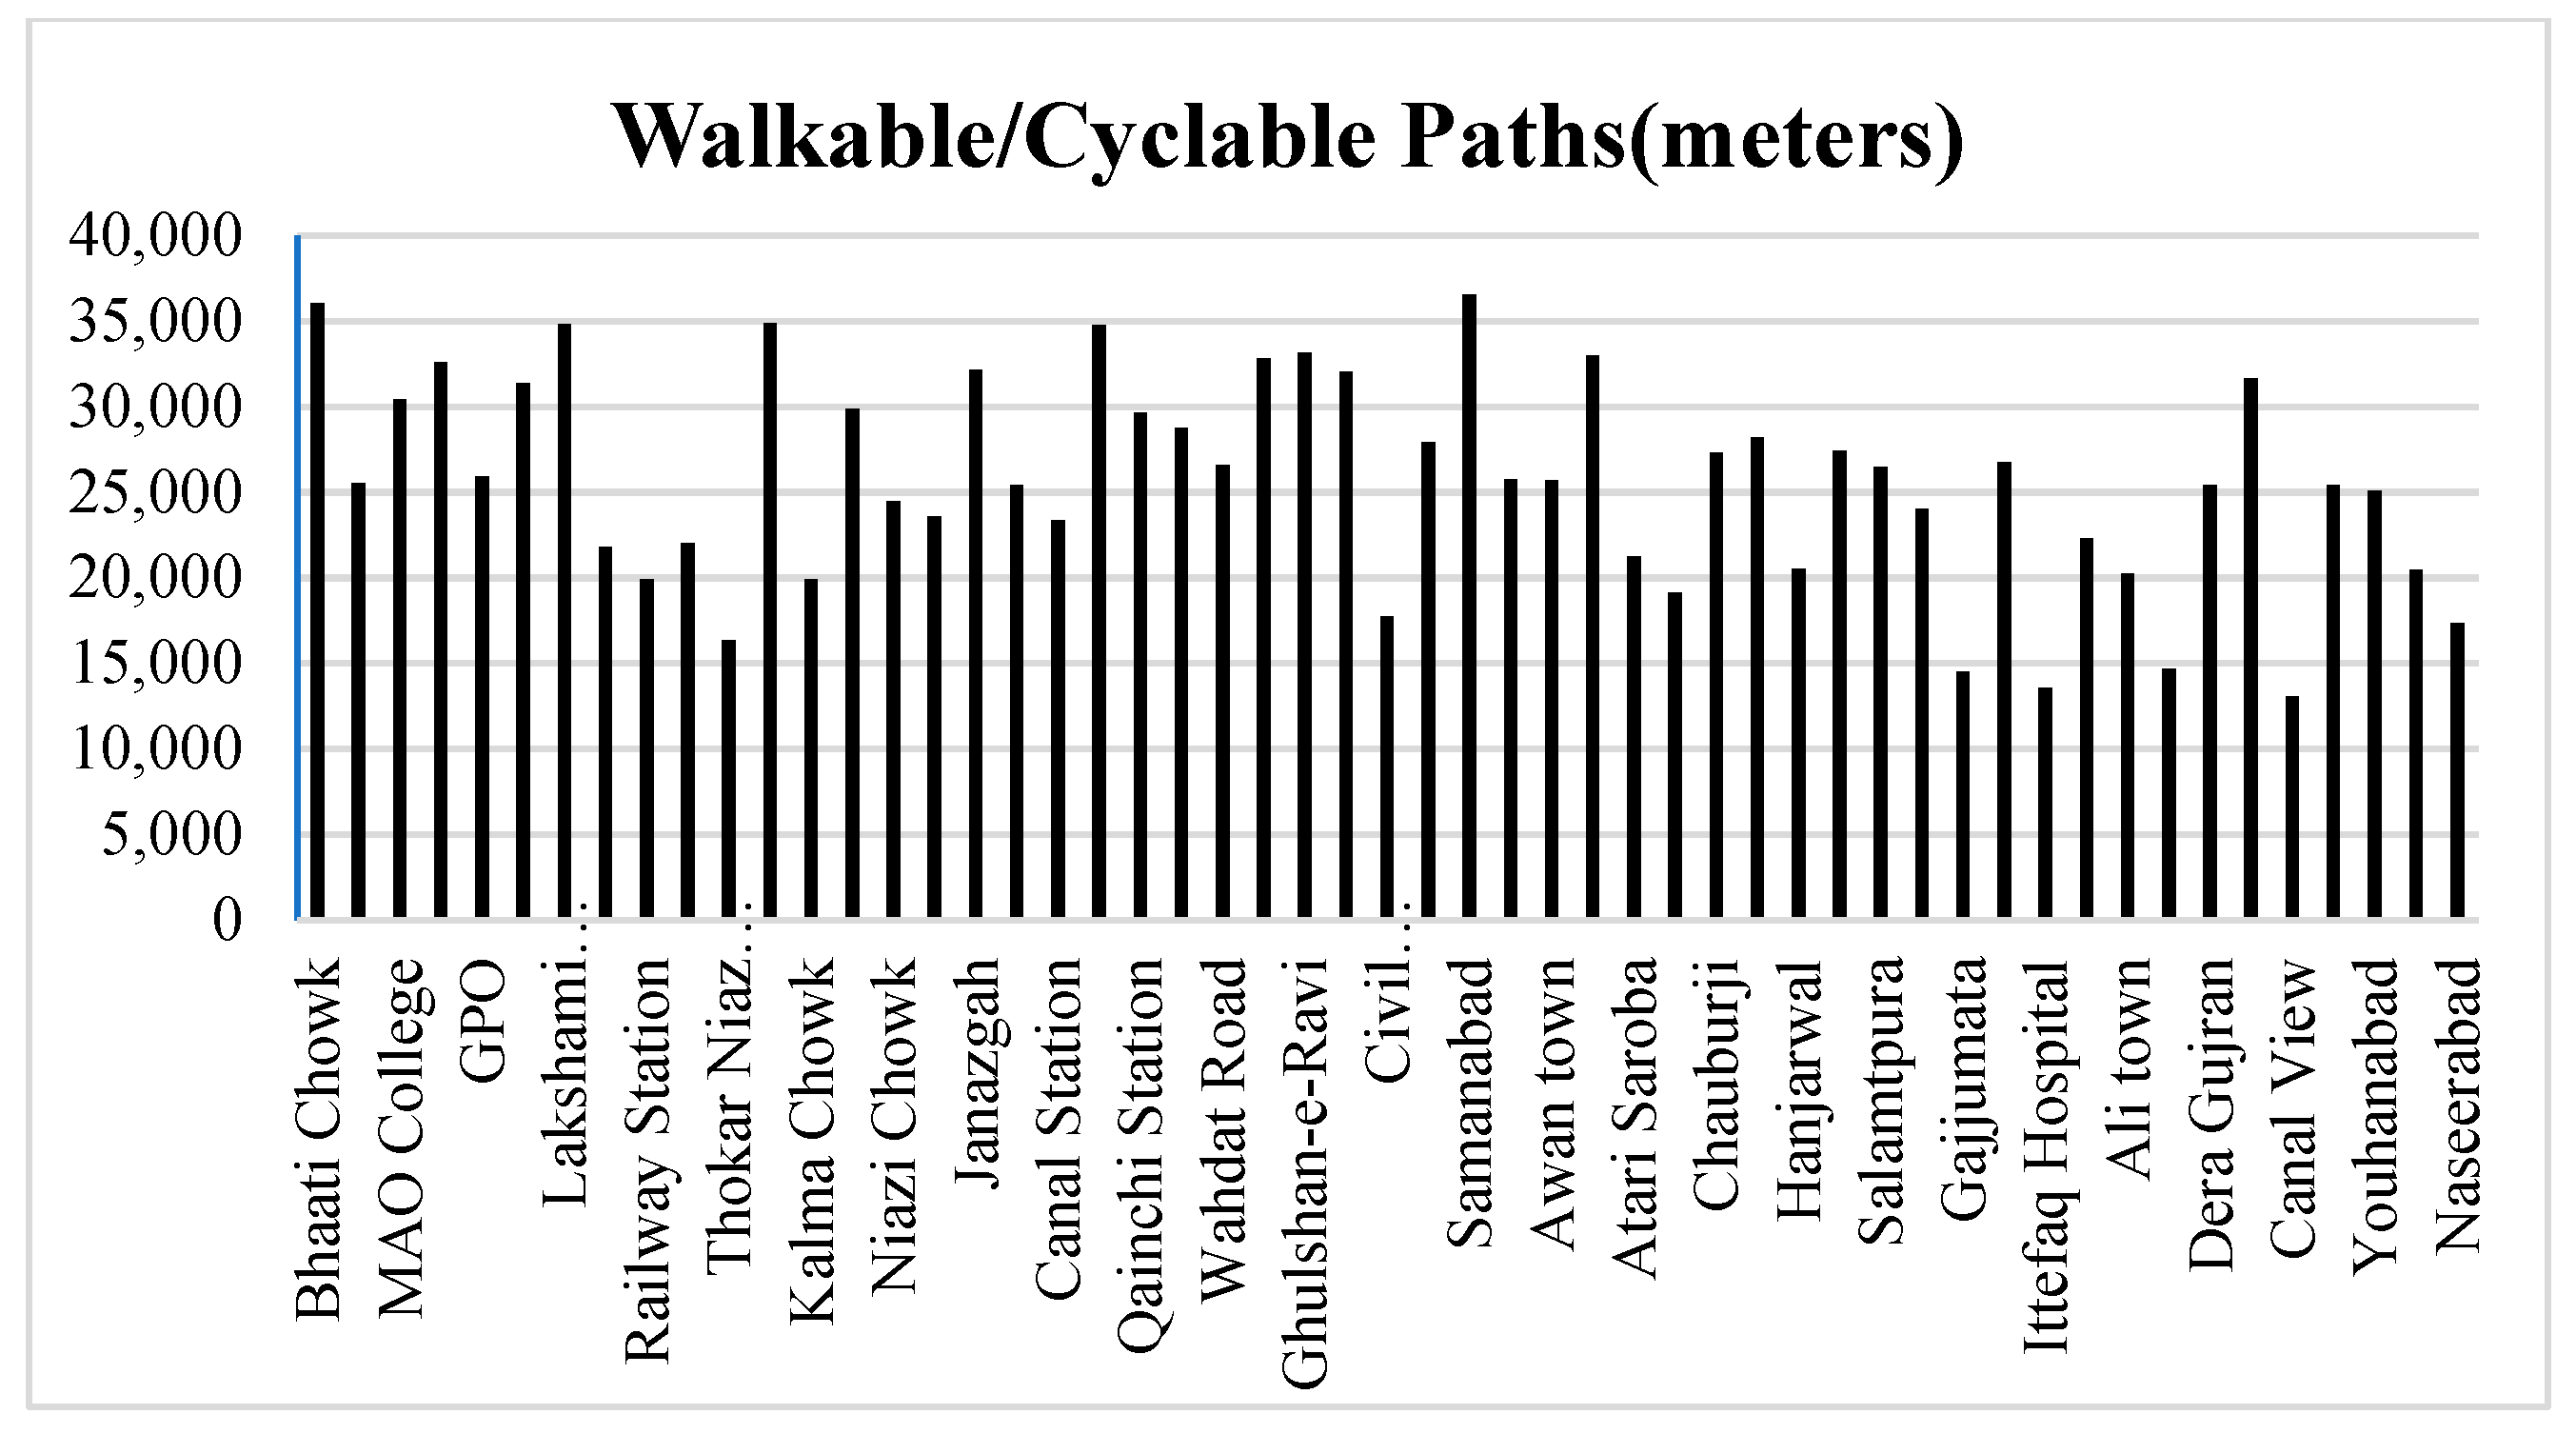
5.5. Total Length of Walkable/Cyclable Paths
5.6. Business Density
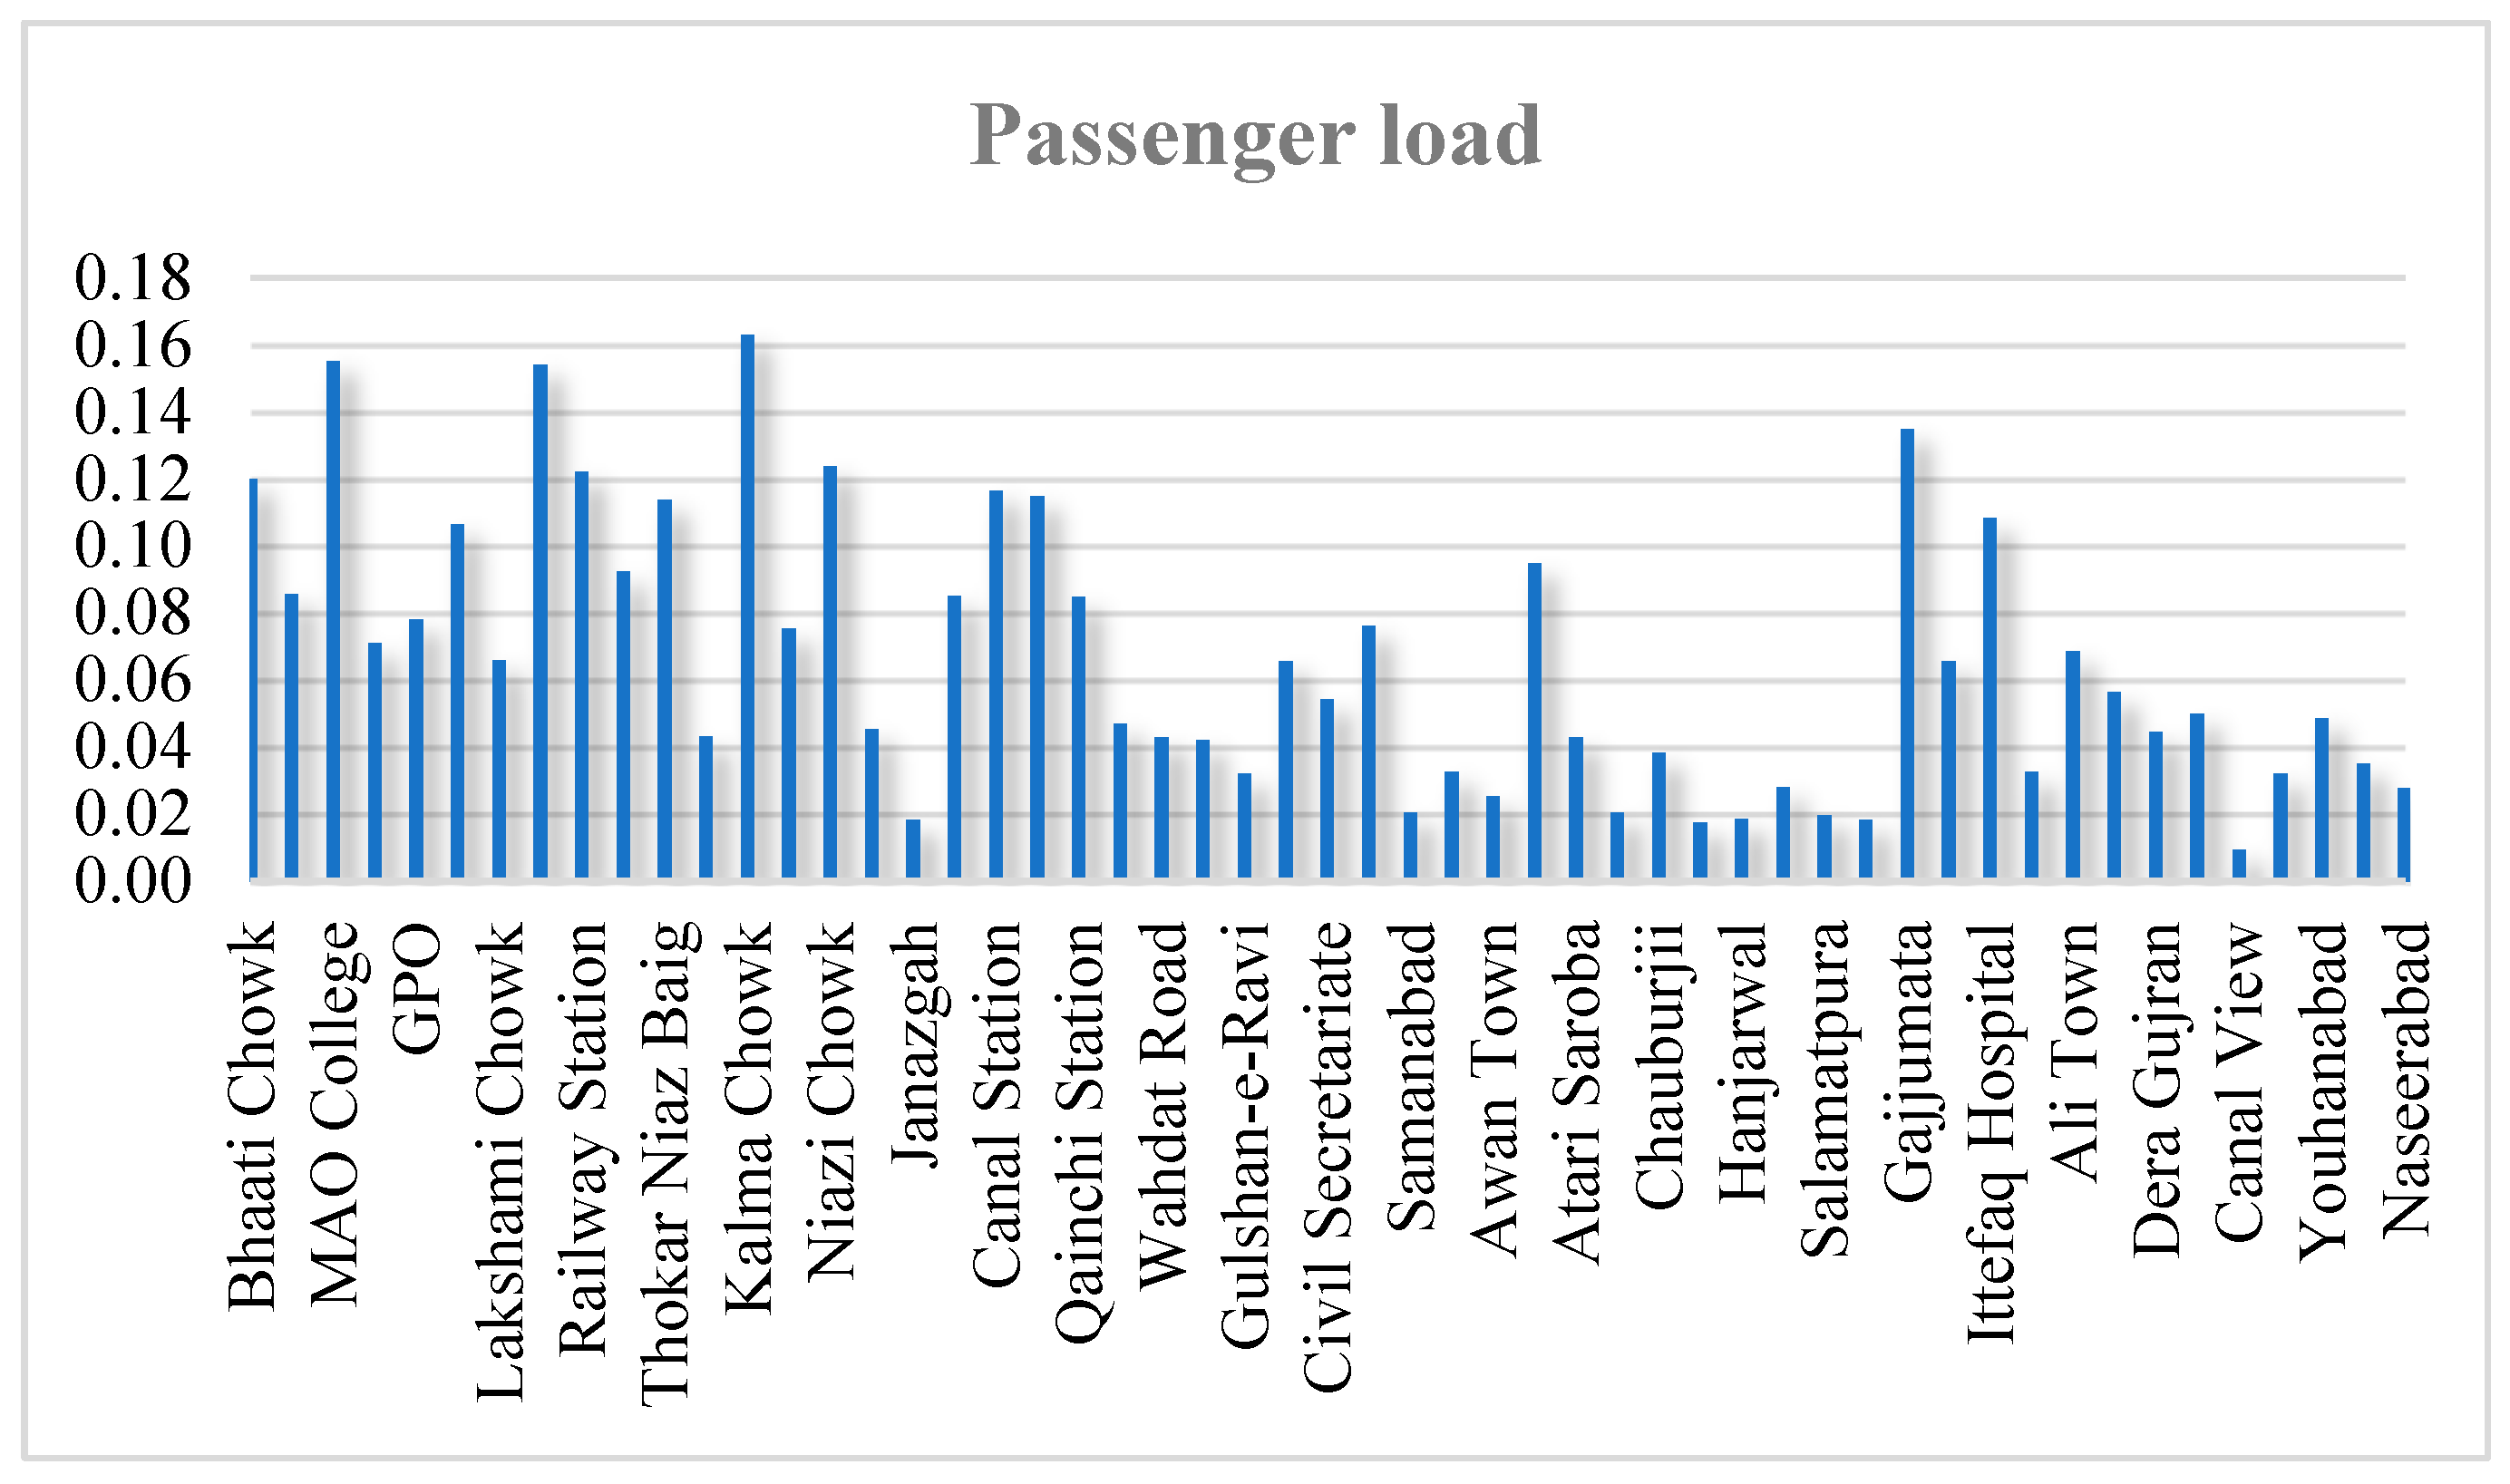
5.7. Passenger Load
5.8. Interchange to Other Transit Modes
5.9. Access to Opportunities
6. Results and Sensitivity Analysis
7. Inferences and Discussion
8. Conclusions and Policy Implications
8.1. Conclusions
8.2. Policy Implications
- Multi-modal integration for different modes comprising direct access among feeder buses, auto rickshaws, Qingqi, and transit stations;
- Improved pedestrian infrastructure encompassing footpaths, street furniture, specified waiting for spaces;
- Enhanced station facilities along with commuter services;
- Integrating bicycle lanes and supporting rental or sharing schemes near transit stations;
- Park-and-ride services at deliberate transit settings;
- Recognize resource person’s team for handling TOD plans.
Author Contributions
Funding
Institutional Review Board Statement
Informed Consent Statement
Data Availability Statement
Acknowledgments
Conflicts of Interest
Correction Statement
Appendix A

References
- OCDE. Compact City Policies: A Comparative Assessment; OECD Green Growth Studies; OCDE: Paris, France, 2012. [Google Scholar] [CrossRef]
- Calthorpe, P. The Next American Metropolis: Ecology, Community, and the American Dream; Princeton Architectural Press: New York, NY, USA, 1993; ISBN 1878271687. [Google Scholar]
- Schlossberg, M.; Brown, N. Comparing Transit-Oriented Development Sites by Walkability Indicators. Transp. Res. Rec. 2004, 1887, 34–42. [Google Scholar] [CrossRef]
- Cervero, R.; Murphy, S.; Ferrell, C.; Goguts, N.; Tsai, Y.-H.; Arrington, G.B.; Boroski, J.; Smith-Heimer, J.; Golem, R.; Peninger, P.; et al. TCRP Report 102—Transit-Oriented Development in the United States: Experiences, Challenges, and Prospects; Transportation Research Board: Washington, DC, USA, 2004; ISBN 030908795-3. [Google Scholar]
- Parker, T.; Arrington, G.B. Statewide Transit-Oriented Development Study Factors for Success in California; Department of Transportation: Sacramento, CA, USA, 2002; Volume 217. [Google Scholar]
- Dittmer, H.; Ohland, G. The New Transit Town: Best Practices in Transit-Oriented Development; Island Press: Washington, DC, USA, 2004; ISBN 1559631171. [Google Scholar]
- Singh, Y.J.; Fard, P.; Zuidgeest, M.; Brussel, M.; van Maarseveen, M. Measuring Transit Oriented Development: A Spatial Multi Criteria Assessment Approach for the City Region Arnhem and Nijmegen. J. Transp. Geogr. 2014, 35, 130–143. [Google Scholar] [CrossRef]
- Evans, J.E.; Pratt, R.H. Traveler Response to Transportation System Changes; Transportation Research Board: Washington, DC, USA, 2007. [Google Scholar]
- Renne, J.L.; Listokin, D. The Opportunities and Tensions of Historic Preservation and Transit Oriented Development (TOD). Cities 2019, 90, 249–262. [Google Scholar] [CrossRef]
- Papa, E.; Bertolini, L. Accessibility and Transit-Oriented Development in European Metropolitan Areas. J. Transp. Geogr. 2015, 47, 70–83. [Google Scholar] [CrossRef]
- Singh, Y.J.; Lukman, A.; Flacke, J.; Zuidgeest, M.; Van Maarseveen, M.F.A.M. Measuring TOD around Transit Nodes—Towards TOD Policy. Transp. Policy 2017, 56, 96–111. [Google Scholar] [CrossRef]
- Zhou, J.; Yang, Y.; Gu, P.; Yin, L.; Zhang, F.; Zhang, F.; Li, D. Can TODness Improve (Expected) Performances of TODs? An Exploration Facilitated by Non-Traditional Data. Transp. Res. Part D Transp. Environ. 2019, 74, 28–47. [Google Scholar] [CrossRef]
- Li, Z.; Han, Z.; Xin, J.; Luo, X.; Su, S.; Weng, M. Transit Oriented Development among Metro Station Areas in Shanghai, China: Variations, Typology, Optimization and Implications for Land Use Planning. Land Use Policy 2019, 82, 269–282. [Google Scholar] [CrossRef]
- Hamid, M.; Saadi, M.M. Development of a TOD Index through Spatial Analyses and HFIS in Tehran, Iran. J. Urban Plan. Dev. 2018, 144, 4018038. [Google Scholar] [CrossRef]
- Teklemariam, E.A.; Shen, Z. Determining Transit Nodes for Potential Transit-Oriented Development: Along the LRT Corridor in Addis Ababa, Ethiopia. Front. Archit. Res. 2020, 9, 606–622. [Google Scholar] [CrossRef]
- IQAir World Air Quality Report. 2022. Available online: https://www.iqair.com/air-quality-map/pakistan/punjab/lahore (accessed on 1 March 2024).
- Ilyas, H.; Nissar, H. Sectoral Emission Inventory of LAHORE; 2023. Available online: https://www.urbanunit.gov.pk (accessed on 1 March 2024).
- Anwar, A.; Hong, L.; Raja, A.Z. Effect of Transport Infrastructure in Changing the Urban Form of a Historical City: A Case Study of Lahore. In Proceedings of the 56th ISOCARP World Planning Congress ‘Post-Oil City: Planning for Urban Green Deals’, ISOCARP, Virtual, 8–12 November 2020; pp. 288–298. [Google Scholar]
- Basheer, M.A. Urban Transition as a Result of Transport Investment: The Case Bus Rapid Transit Lahore Pakistan; Ghent University: Ghent, Belgium, 2021. [Google Scholar]
- Adeel, A.; Notteboom, B.; Yasar, A.; Scheerlinck, K.; Stevens, J. Insights into the Impacts of Mega Transport Infrastructures on the Transformation of Urban Fabric: Case of BRT Lahore. Sustainability 2021, 13, 7451. [Google Scholar] [CrossRef]
- Nadeem, M.; Matsuyuki, M.; Tanaka, S. Impact of Bus Rapid Transit in Shaping Transit-Oriented Development: Evidence from Lahore, Pakistan. J. Asian Archit. Build. Eng. 2023, 22, 3635–3648. [Google Scholar] [CrossRef]
- Shakeel, N. Highlighting the Potentials of Transit Oriented Development: A Case Study of Orange Line Metro Train, Lahore. In Proceedings of the World Transport Convention, Beijing, China, 13–16 June 2019; pp. 1–12. [Google Scholar]
- Renne, J. Measuring the Performance of Transito; VTPI Victoria Transport Policy Institute: Victoria, BC, Canada, 2007. [Google Scholar]
- Higgins, C.D.; Kanaroglou, P.S. A Latent Class Method for Classifying and Evaluating the Performance of Station Area Transit-Oriented Development in the Toronto Region. J. Transp. Geogr. 2016, 52, 61–72. [Google Scholar] [CrossRef]
- Shirke, C.; Joshi, G.J.; Kandala, V.; Arkatkar, S.S. Transit Oriented Development and Its Impact on Level of Service of Roads & METRO: A Case Study of Mumbai Metro Line-I. Transp. Res. Procedia 2017, 25, 3035–3054. [Google Scholar] [CrossRef]
- CTOD. Transit-Oriented Development Typology Strategy for Allegheny County; CTOD: Washington, DC, USA, 2013. [Google Scholar]
- Yang, L.; Song, X. TOD Typology Based on Urban Renewal: A Classification of Metro Stations for Ningbo City. Urban Rail Transit 2021, 7, 240–255. [Google Scholar] [CrossRef] [PubMed]
- Salat, S.; Ollivier, G. Transforming the Urban Space through Transit-Oriented Development: The 3V Approach; World Bank Group: Washington, DC, USA, 2017. [Google Scholar]
- Nagari, B.K.; Suryan, S.; Pratiwi, W.D. TOD Tourism Heritage District Livability: User Satisfaction in Kali Besar Corridor in Jakarta, Indonesia. In Proceedings of the IOP Conference Series: Earth and Environmental Science, Bandung, Indonesia, 28–29 November 2019. [Google Scholar] [CrossRef]
- Mohamad, N.F.N.; Fahmy-Abdullah, M.; Masrom, M.A.N. Transit Oriented Development (TOD) Typology. In Proceedings of the International Conference on Biodiversity, Melaka, Malaysia, 4–5 November 2020. [Google Scholar] [CrossRef]
- Millard-Ball, A. Planning as Bargaining. J. Am. Plan. Assoc. 2021, 87, 556–569. [Google Scholar] [CrossRef]
- Liu, Y.; Nath, N.; Murayama, A.; Manabe, R. Transit-Oriented Development with Urban Sprawl? Four Phases of Urban Growth and Policy Intervention in Tokyo. Land Use Policy 2022, 112, 105854. [Google Scholar] [CrossRef]
- Maheshwari, R.; Grigolon, A.; Brussel, M. Evaluating TOD in the Context of Local Area Planning Using Mixed-Methods. Case Stud. Transp. Policy 2022, 10, 1015–1025. [Google Scholar] [CrossRef]
- Jones, C.E. Transit-Oriented Development and Suburban Gentrification: A “Natural Reality” of Refugee Displacement in Metro Vancouver. Hous. Policy Debate 2020, 33, 533–552. [Google Scholar] [CrossRef]
- Liu, L.; Zhang, M.; Xu, T. A Conceptual Framework and Implementation Tool for Land Use Planning for Corridor Transit Oriented Development. Cities 2020, 107, 102939. [Google Scholar] [CrossRef]
- Mirzahossein, H.; Rassafi, A.A.; Jamali, Z.; Guzik, R.; Severino, A.; Arena, F. Active Transport Network Design Based on Transit-Oriented Development and Complete Street Approach: Finding the Potential in Qazvin. Infrastructures 2022, 7, 23. [Google Scholar] [CrossRef]
- Patnala, P.K.; Parida, M.; Chalumuri, R.S. A Decision Framework for Defining Transit-Oriented Development in an Indian City. Asian Transp. Stud. 2020, 6, 100021. [Google Scholar] [CrossRef]
- ITDP. TOD Standard; ITDP: New York, NY, USA, 2017; Volume 3, Available online: www.itdp.org (accessed on 11 January 2022).
- Uddin, M.A.; Tamanna, T.; Adiba, S.; Bin Kabir, S. Revolutionizing TOD Planning in a Developing Country: An Objective-Weighted Framework for Measuring Nodal TOD Index. J. Adv. Transp. 2023, 2023, 9911133. [Google Scholar] [CrossRef]
- Ibrahim, S.M.; Ayad, H.M.; Turki, E.A.; Saadallah, D.M. Measuring Transit-Oriented Development (TOD) Levels: Prioritize Potential Areas for TOD in Alexandria, Egypt Using GIS-Spatial Multi-Criteria Based Model. Alex. Eng. J. 2023, 67, 241–255. [Google Scholar] [CrossRef]
- Ollivier, G.; Ghate, A.; Bankim, K.; Mehta, P. Transit-Oriented Development Implementation Resources and Tools, 2nd ed.; The World Bank: Washington, DC, USA, 2021. [Google Scholar]
- JICA. The Project for Lahore Urban Transport Master Plan in the Islamic Republic of Pakistan Final Report; The Government of Punjab Transport Department: Lahore, Pakistan, 2012; Volume 1. [Google Scholar]
- Ewing, R.; Cervero, R. Travel and the Built Environment. J. Am. Plan. Assoc. 2010, 76, 265–294. [Google Scholar] [CrossRef]
- Kumar, P.P.; Ravi, C.; Parida, M. Identification of Neighborhood Typology for Potential Transit- Oriented Development. Transp. Res. Part D 2020, 78, 102186. [Google Scholar] [CrossRef]
- Rahman, M.H.; Ashik, F.R.; Mouli, M.J. Investigating Spatial Accessibility to Urban Facility Outcome of Transit-Oriented Development in Dhaka. Transp. Res. Interdiscip. Perspect. 2022, 14, 100607. [Google Scholar] [CrossRef]
- Ashik, F.R.; Rahman, M.H.; Kamruzzaman, M. Investigating the Impacts of Transit-Oriented Development on Transport-Related CO2 Emissions. Transp. Res. Part D Transp. Environ. 2022, 105, 103227. [Google Scholar] [CrossRef]
- Jacobs, J. The Death and Life of Great American Cities; Randoms House: New York, NY, USA, 1961; Volume 21, pp. 13–25. [Google Scholar]
- Motieyan, H.; Mesgari, M.S. Towards Sustainable Urban Planning through Transit-Oriented Development (A Case Study: Tehran). ISPRS Int. J. Geo-Inf. 2017, 6, 402. [Google Scholar] [CrossRef]
- Jain, D.; Jha, B.; Singh, E. Evaluation of Measuring Criteria for the Success of Transit Oriented Development. Solid State Technol. 2020, 63, 4147–4159. [Google Scholar]
- Gu, P.; He, D.; Chen, Y.; Christopher Zegras, P.; Jiang, Y. Transit-Oriented Development and Air Quality in Chinese Cities: A City-Level Examination. Transp. Res. Part D Transp. Environ. 2019, 68, 10–25. [Google Scholar] [CrossRef]
- Alrobaee, T.R.; Al-Khafaji, A.S.; Al-Jawari, S.M. Measurement of Physical Environment Characteristics for Supporting Transit-Oriented Development Areas for the Kufa City-Iraq. Int. J. Sci. Eng. Res. 2021, 12, 635–642. [Google Scholar]
- Papagiannakis, A.; Vitopoulou, A.; Yiannakou, A. Transit-Oriented Development in the Southern European City of Thessaloniki Introducing Urban Railway: Typology and Implementation Issues. Eur. Plan. Stud. 2020, 29, 117–141. [Google Scholar] [CrossRef]
- Sulistyaningrum, S.; Subekti, J.S. Transit Oriented Development (TOD) Index at the Current Transit Nodes in Depok City, Indonesia. In Proceedings of the Friendly City 4 ‘From Research to Implementation For Better Sustainability’, Medan, Indonesia, 11–12 October 2017. [Google Scholar]
- Liu, Y.; Singleton, A.; Arribas-Bel, D. Considering Context and Dynamics: A Classification of Transit-Orientated Development for New York City. J. Transp. Geogr. 2020, 85, 102711. [Google Scholar] [CrossRef]
- Qiang, D.; Zhang, L.; Huang, X. Quantitative Evaluation of TOD Performance Based on Multi-Source Data: A Case Study of Shanghai. Front. Public Heal. 2022, 10, 820694. [Google Scholar] [CrossRef]
- Su, S.; Zhang, H.; Wang, M.; Weng, M.; Kang, M. Transit-Oriented Development (TOD) Typologies around Metro Station Areas in Urban China: A Comparative Analysis of Five Typical Megacities for Planning Implications. J. Transp. Geogr. 2021, 90, 102939. [Google Scholar] [CrossRef]
- Niu, S.; Hu, A.; Shen, Z.; Huang, Y.; Tod, G. Measuring the Built Environment of Green Transit-Oriented Development: A Factor- Cluster Analysis of Rail Station Areas In. Front. Archit. Res. 2021, 10, 652–668. [Google Scholar] [CrossRef]
- Uddin, M.A.; Hoque, M.S.; Tamanna, T.; Adiba, S.; Muniruzzaman, S.M.; Parvez, M.S. A Framework to Measure Transit-Oriented Development around Transit Nodes: Case Study of a Mass Rapid Transit System in Dhaka, Bangladesh. PLoS ONE 2023, 18, e0280275. [Google Scholar] [CrossRef]
- Khalid, N.S.; Samsudin, N.A. Evaluating the Tod Potential of Lrt Stations in Malaysia Using the Tod Index. Plan. Malays. 2023, 21, 242–265. [Google Scholar] [CrossRef]
- Ibraeva, A.; de Correia, G.H.A.; Silva, C.; Antunes, A.P. Transit-Oriented Development: A Review of Research Achievements and Challenges. Transp. Res. Part A Policy Pract. 2020, 132, 110–130. [Google Scholar] [CrossRef]
- PBS Pakistan Bureau of Statistics. Available online: http://www.pbs.gov.pk/content/population-size-and-growth-major-cities (accessed on 1 March 2024).
- Ali, S.; Xu, H.; Ahmed, W.; Ahmad, N.; Solangi, Y.A. Metro Design and Heritage Sustainability: Conflict Analysis Using Attitude Based on Options in the Graph Model. Environ. Dev. Sustain. 2020, 22, 3839–3860. [Google Scholar] [CrossRef]
- Leonard, J.B. Lahore. Cities 1986, 3, 12–23. [Google Scholar] [CrossRef]
- NESPAK, L. Integrated Master Plan for Lahore-2021 [R]. 2004, Volumn I. Available online: https://lda.gop.pk/website/images/final_report_volume_i.pdf (accessed on 1 March 2024).
- Naz, N.; Anjum, G.A. Transformation of main boulevard, gulberg, lahore: From Residential to Commercial. J. Res. Archit. Plan. 2007, 6, 49–61. [Google Scholar] [CrossRef] [PubMed]
- Abubakar, S.M. Lahore–A City of Gardens, Now a City of Concrete. Dawn 2016. Available online: https://www.dawn.com/news/1238407 (accessed on 11 January 2022).
- Rana, I.A.; Bhatti, S.S.; e Saqib, S. The Spatial and Temporal Dynamics of Infrastructure Development Disparity—From Assessment to Analyses. Cities 2017, 63, 20–32. [Google Scholar] [CrossRef]
- Alam, A.R. Failure of Urban Planning. Available online: https://tribune.com.pk/story/850425/failure-of-urban-planning (accessed on 20 September 2019).
- Laaly, S.; Jeihani, M.; Lee, Y.J. A Multiscale, Transit-Oriented Development Definition Based on Context-Sensitive Paradigm. Transp. Res. Rec. 2017, 2671, 31–39. [Google Scholar] [CrossRef]
- LRMTRP. Available online: https://www.railway-technology.com/projects/lahorerapidmasstrans/ (accessed on 3 March 2021).
- BRT Centre of Excellence. Available online: http://www.brt.cl/ (accessed on 9 June 2022).
- Malik, A.A. Policy Options for Financing Urban Transportation in Resource Constrained Environments: The Case of Lahore, Pakistan. Pak. Dev. Rev. 2013, 52, 139–155. [Google Scholar] [CrossRef]
- PMA Punjab Masstransit Authority. Available online: https://pma.punjab.gov.pk/ (accessed on 3 January 2021).
- Zhang, Y.; Guindon, B. Using Satellite Remote Sensing to Survey Transport-Related Urban Sustainability: Part 1: Methodologies for Indicator Quantification. Int. J. Appl. Earth Obs. Geoinf. 2006, 8, 149–164. [Google Scholar] [CrossRef]
- Bertolini, L. Spatial Development Patterns and Public Transport: The Application of an Analytical Model in the Netherlands. Plan. Pract. Res. 1999, 14, 199–210. [Google Scholar] [CrossRef]
- Rode, P.; Heeckt, C.; da Cruz, N. National Transport Policy and Cities: Key Policy Interventions to Drive Compact and Connected Urban Growth; 2019. Available online: http://newclimateeconomy.net/content/cities-working-papers (accessed on 1 March 2024).
- Guillen, M.D.; Ishida, H.; Okamoto, N. Is the Use of Informal Public Transport Modes in Developing Countries Habitual? An Empirical Study in Davao City, Philippines. Transp. Policy 2013, 26, 31–42. [Google Scholar] [CrossRef]
- Nikitas, A. How to Save Bike-Sharing: An Evidence-Based Survival Toolkit for Policy-Makers and Mobility Providers. Sustainability 2019, 11, 3206. [Google Scholar] [CrossRef]
- Nikitas, A.; Njoya, E.T.; Dani, S. Examining the Myths of Connected and Autonomous Vehicles: Analysing the Pathway to a Driverless Mobility Paradigm. Int. J. Automot. Technol. Manag. 2019, 19, 10–30. [Google Scholar] [CrossRef]


| Source | Case Study Area | Approach | Limitations |
|---|---|---|---|
| The Institute of Transportation and Development Policy (ITDP) 2017 [38] | Version3.0 released in 2017, following previous versions released in 2013 and 2014 | It aims to evaluate and score urban development plans and projects based on adherence to eight TOD design principles: walk, cycle, connect, transit, mix, densify, compact, and shift. | The scoring system in urban design has limitations because it is subjective and relies on primary data collection. This makes its pertinency to station areas broader and more challenging than for individual projects or developments. |
| M. Hamid et al., 2018 [14] | Tehran, Iran | The study uses spatial analyses and a hierarchical fuzzy inference system (HFIS) for indicator computation and aggregation | The research data are limited to the year 2005, potentially hindering the accuracy and relevance of the model outputs to present-day conditions. |
| Teklemariam et al., 2020 [15] | Addis Ababa, Ethiopia | TOD index calculation for 22 LRT stations using eight indicators and SMCA method | The research holds significance within the context of developing countries; however, it overlooks the crucial aspect of criteria weighting. |
| M. Uddin et al., 2023 [39] | Dhaka, Bangladesh | This work presents the nodal TOD index through eight indicators and objective-weighted spatial multi-criteria analysis (OSMCA) | The research addresses a substantial gap in the literature; however, it lacks a thorough sensitivity analysis for diverse scenarios. |
| Sara et al., 2023 [40] | Alexandria City, Egypt | Measured potential TOD using the SMCA method | The study has limitations as it evaluates based on only seven indicators. More precise results could be obtained by including additional indicators. |
| Sr. No. | Criteria | Equal Weight Scenario | Indicators | Contribution to Criteria | Standardization Method |
|---|---|---|---|---|---|
| 1 | Density | 0.166 | Population density | 100% | Maximum |
| 2 | Land use diversity | 0.166 | Land use diversity | 100% | - |
| 3 | Walkability and cyclability | 0.166 | Land use mixedness | 33.3% | Goal |
| Intersection density | 33.3% | Maximum | |||
| walkable/cyclable paths | 33.3% | Maximum | |||
| 4 | Economic development | 0.166 | Business density | 100% | Maximum |
| 5 | Capacity utilization of transit | 0.166 | Passenger load in peak hours Passenger load in off-peak hours | 50% 50% | - - |
| 6 | Access and accessibility | 0.166 | Interchange to other transit modes Job density | 50% 50% | - Maximum |
| Station Name | Line | Interchange Options |
|---|---|---|
| MAO college | Green line | Orange line (LRT) |
| Lake road | Orange line | Green line (BRT) |
| Railway station | Orange line | Lahore Junction railway station |
| Kalma chowk | Green line | Daewoo bus service |
| Thokar Niaz Beg | Orange line | Jinnah bus terminal, Daewoo bus service |
| Azadi Chowk | Green line | Lahore Badami Bagh bus terminal |
| Bund Road | Orange line | Lahore city bus terminal |
| Shahdara | Green line | Shahdara bus terminal |
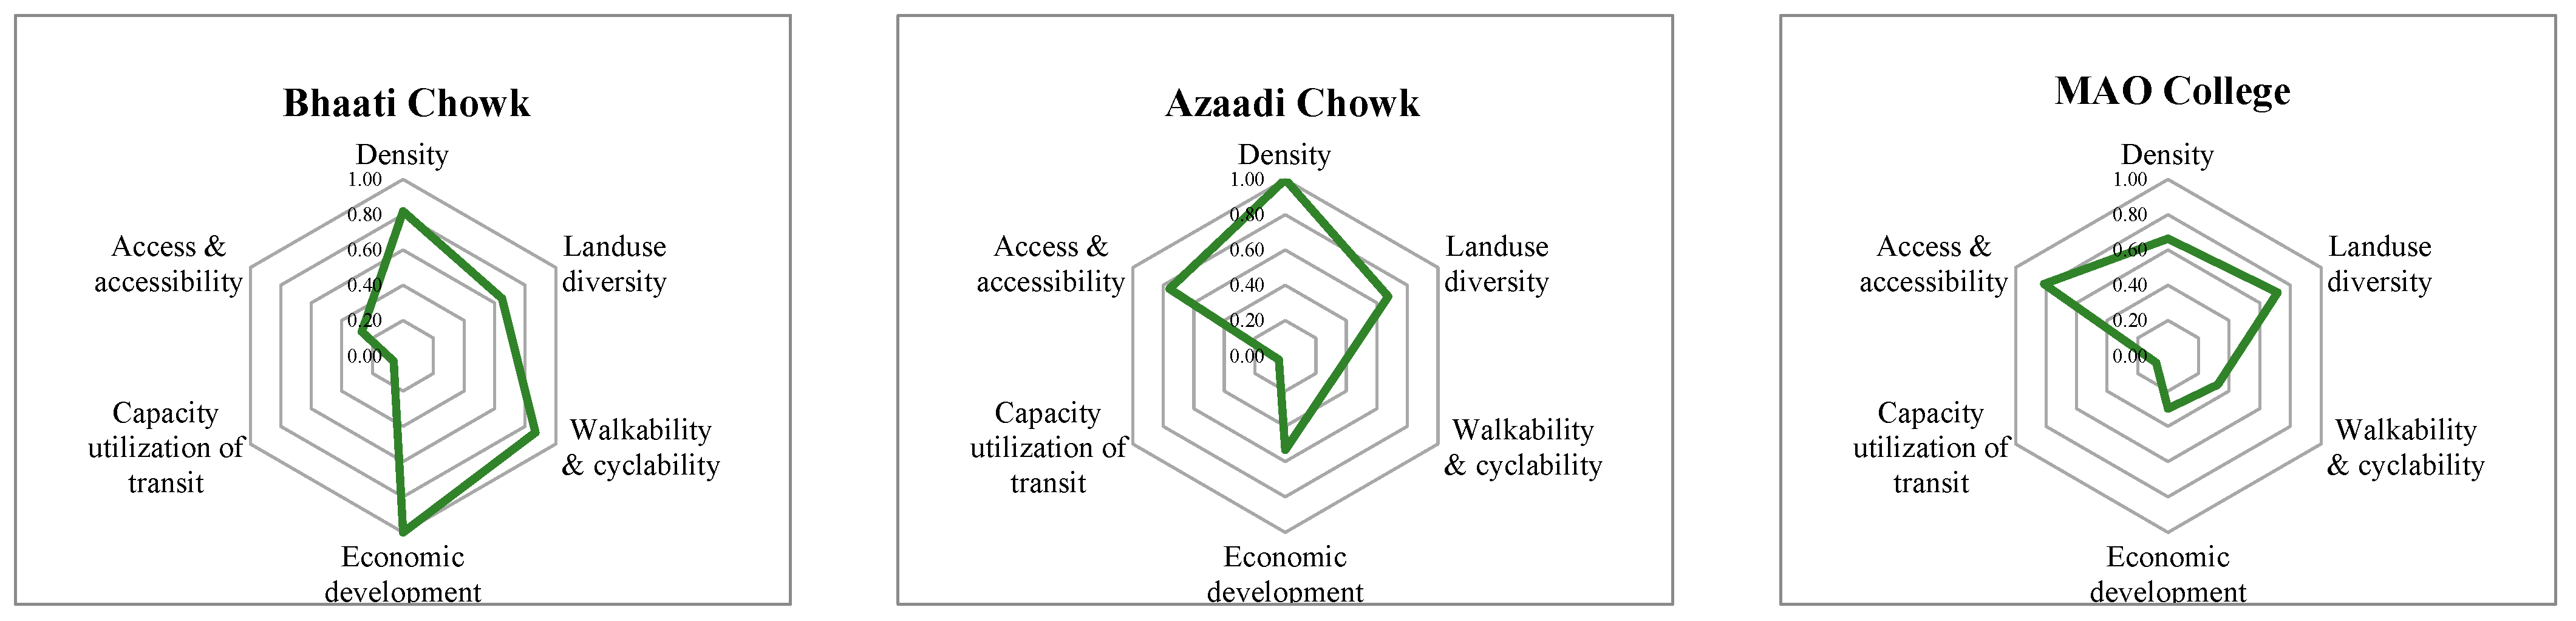
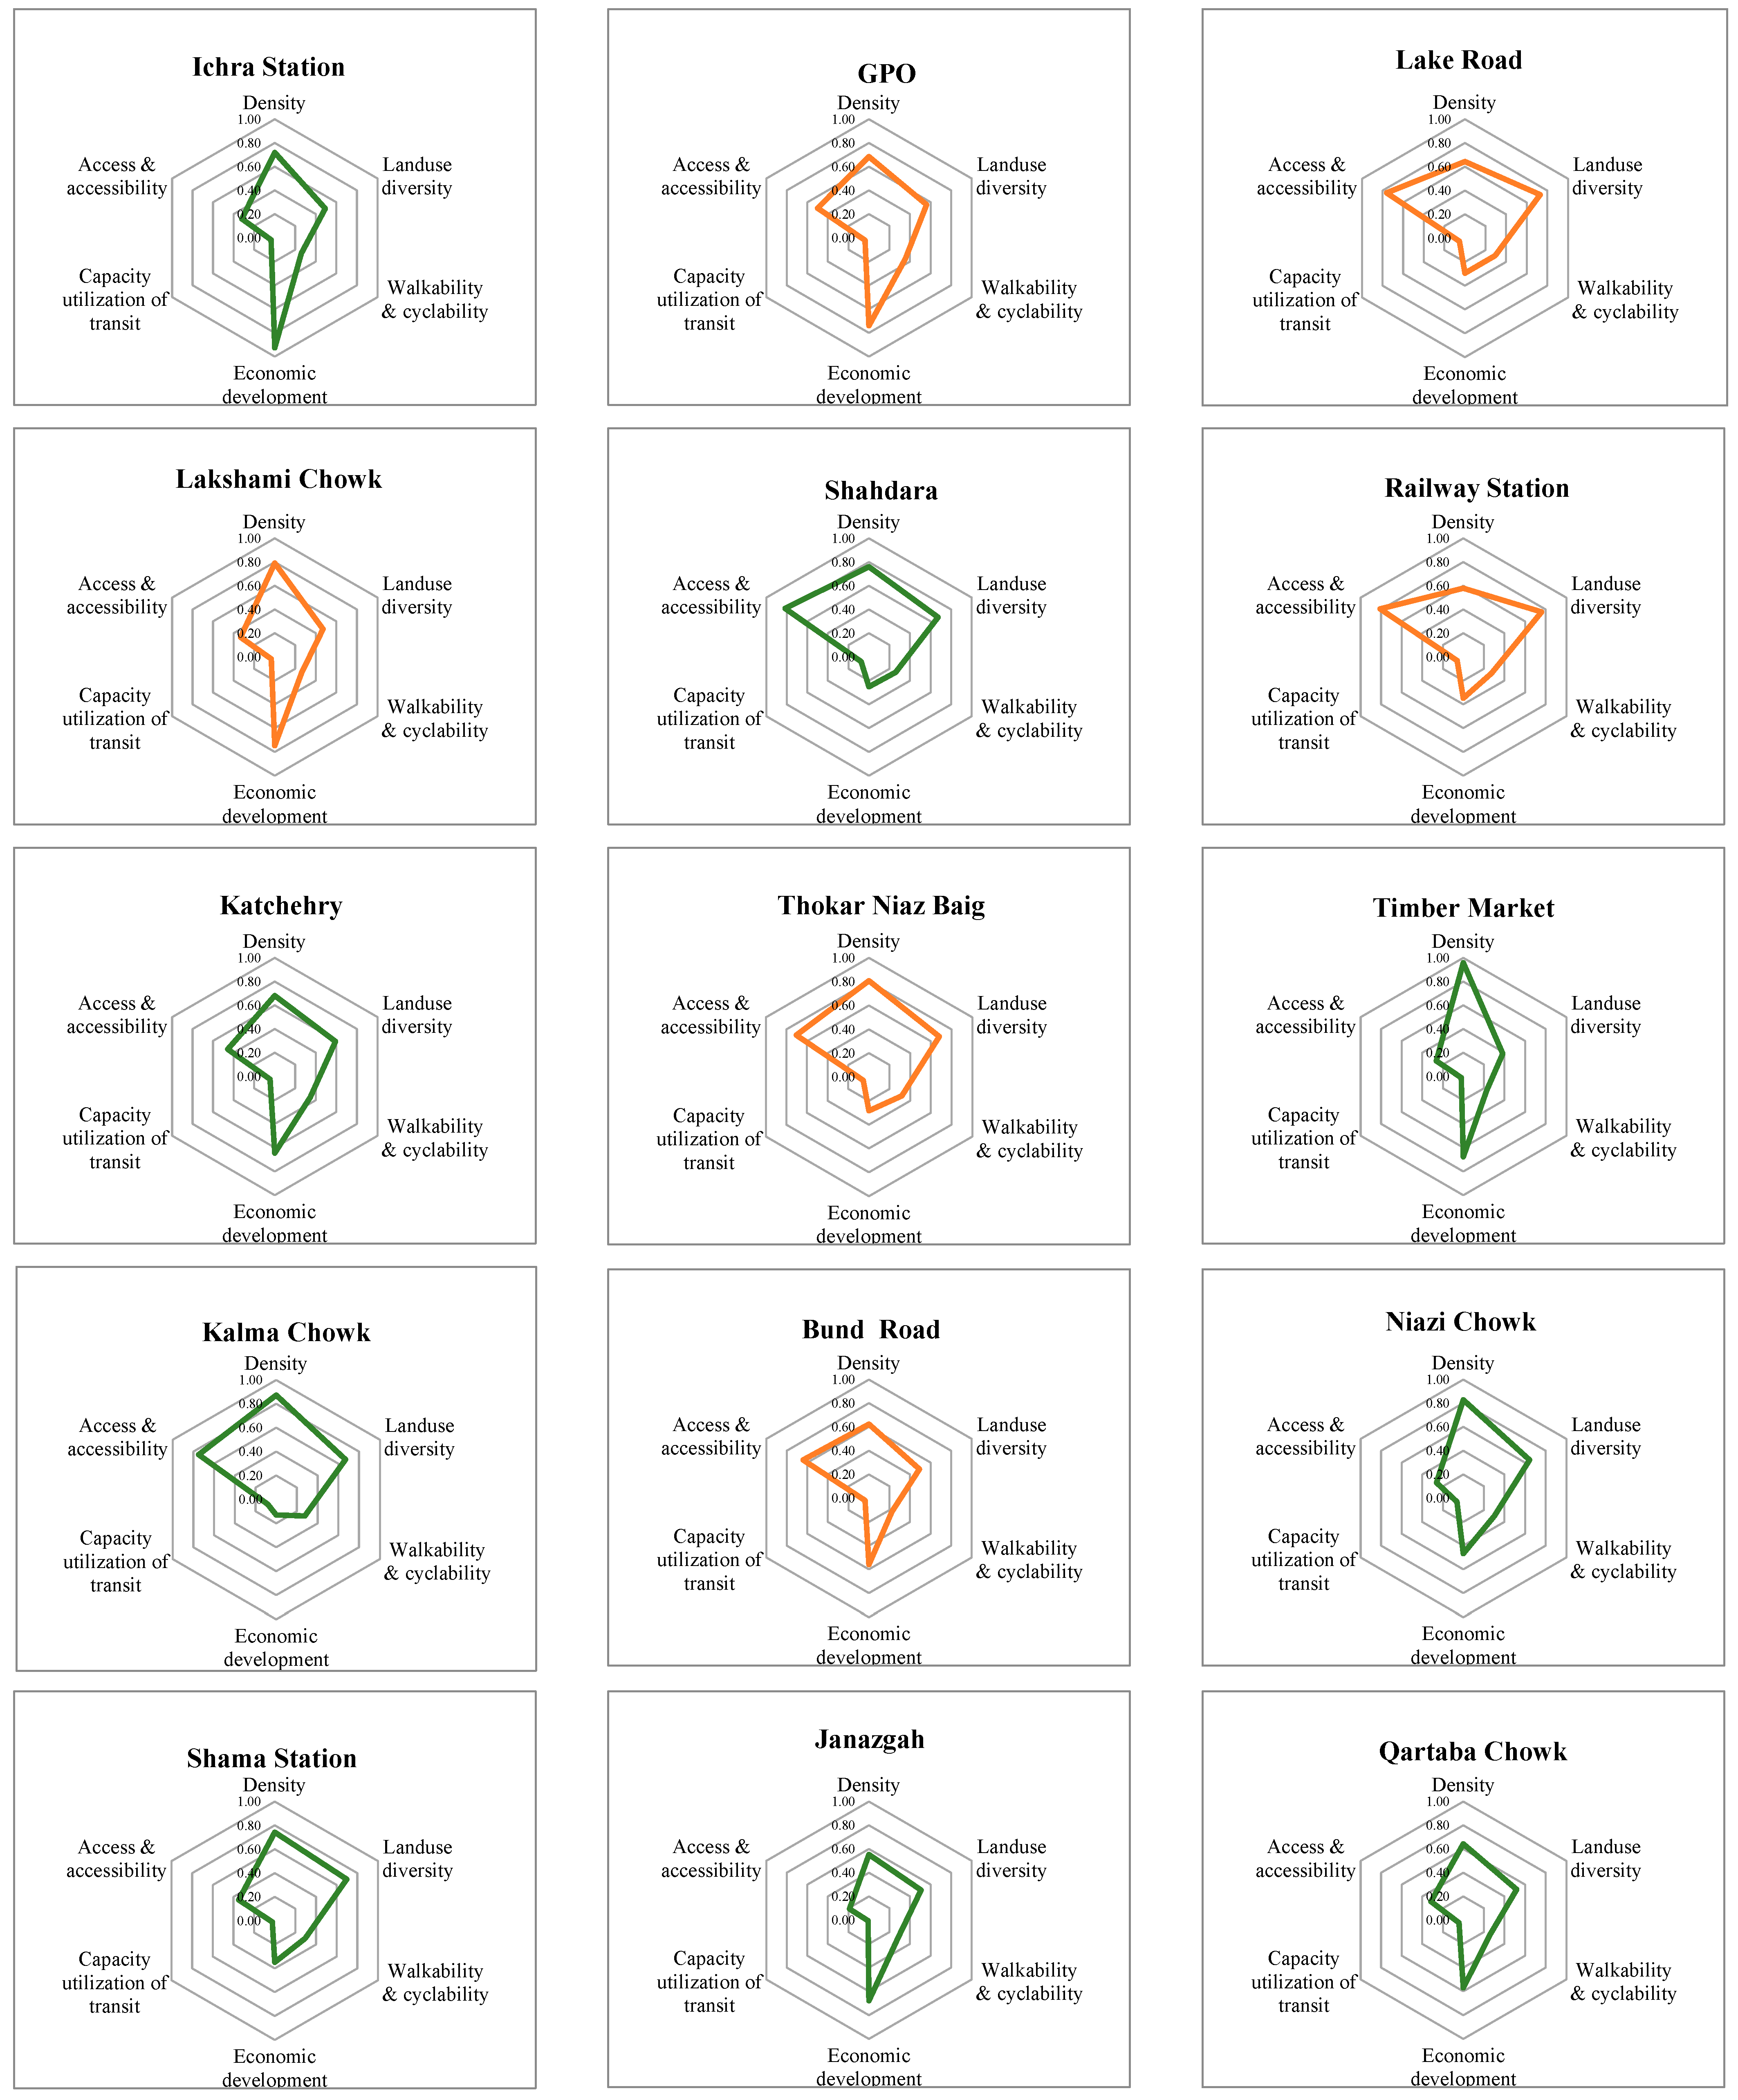
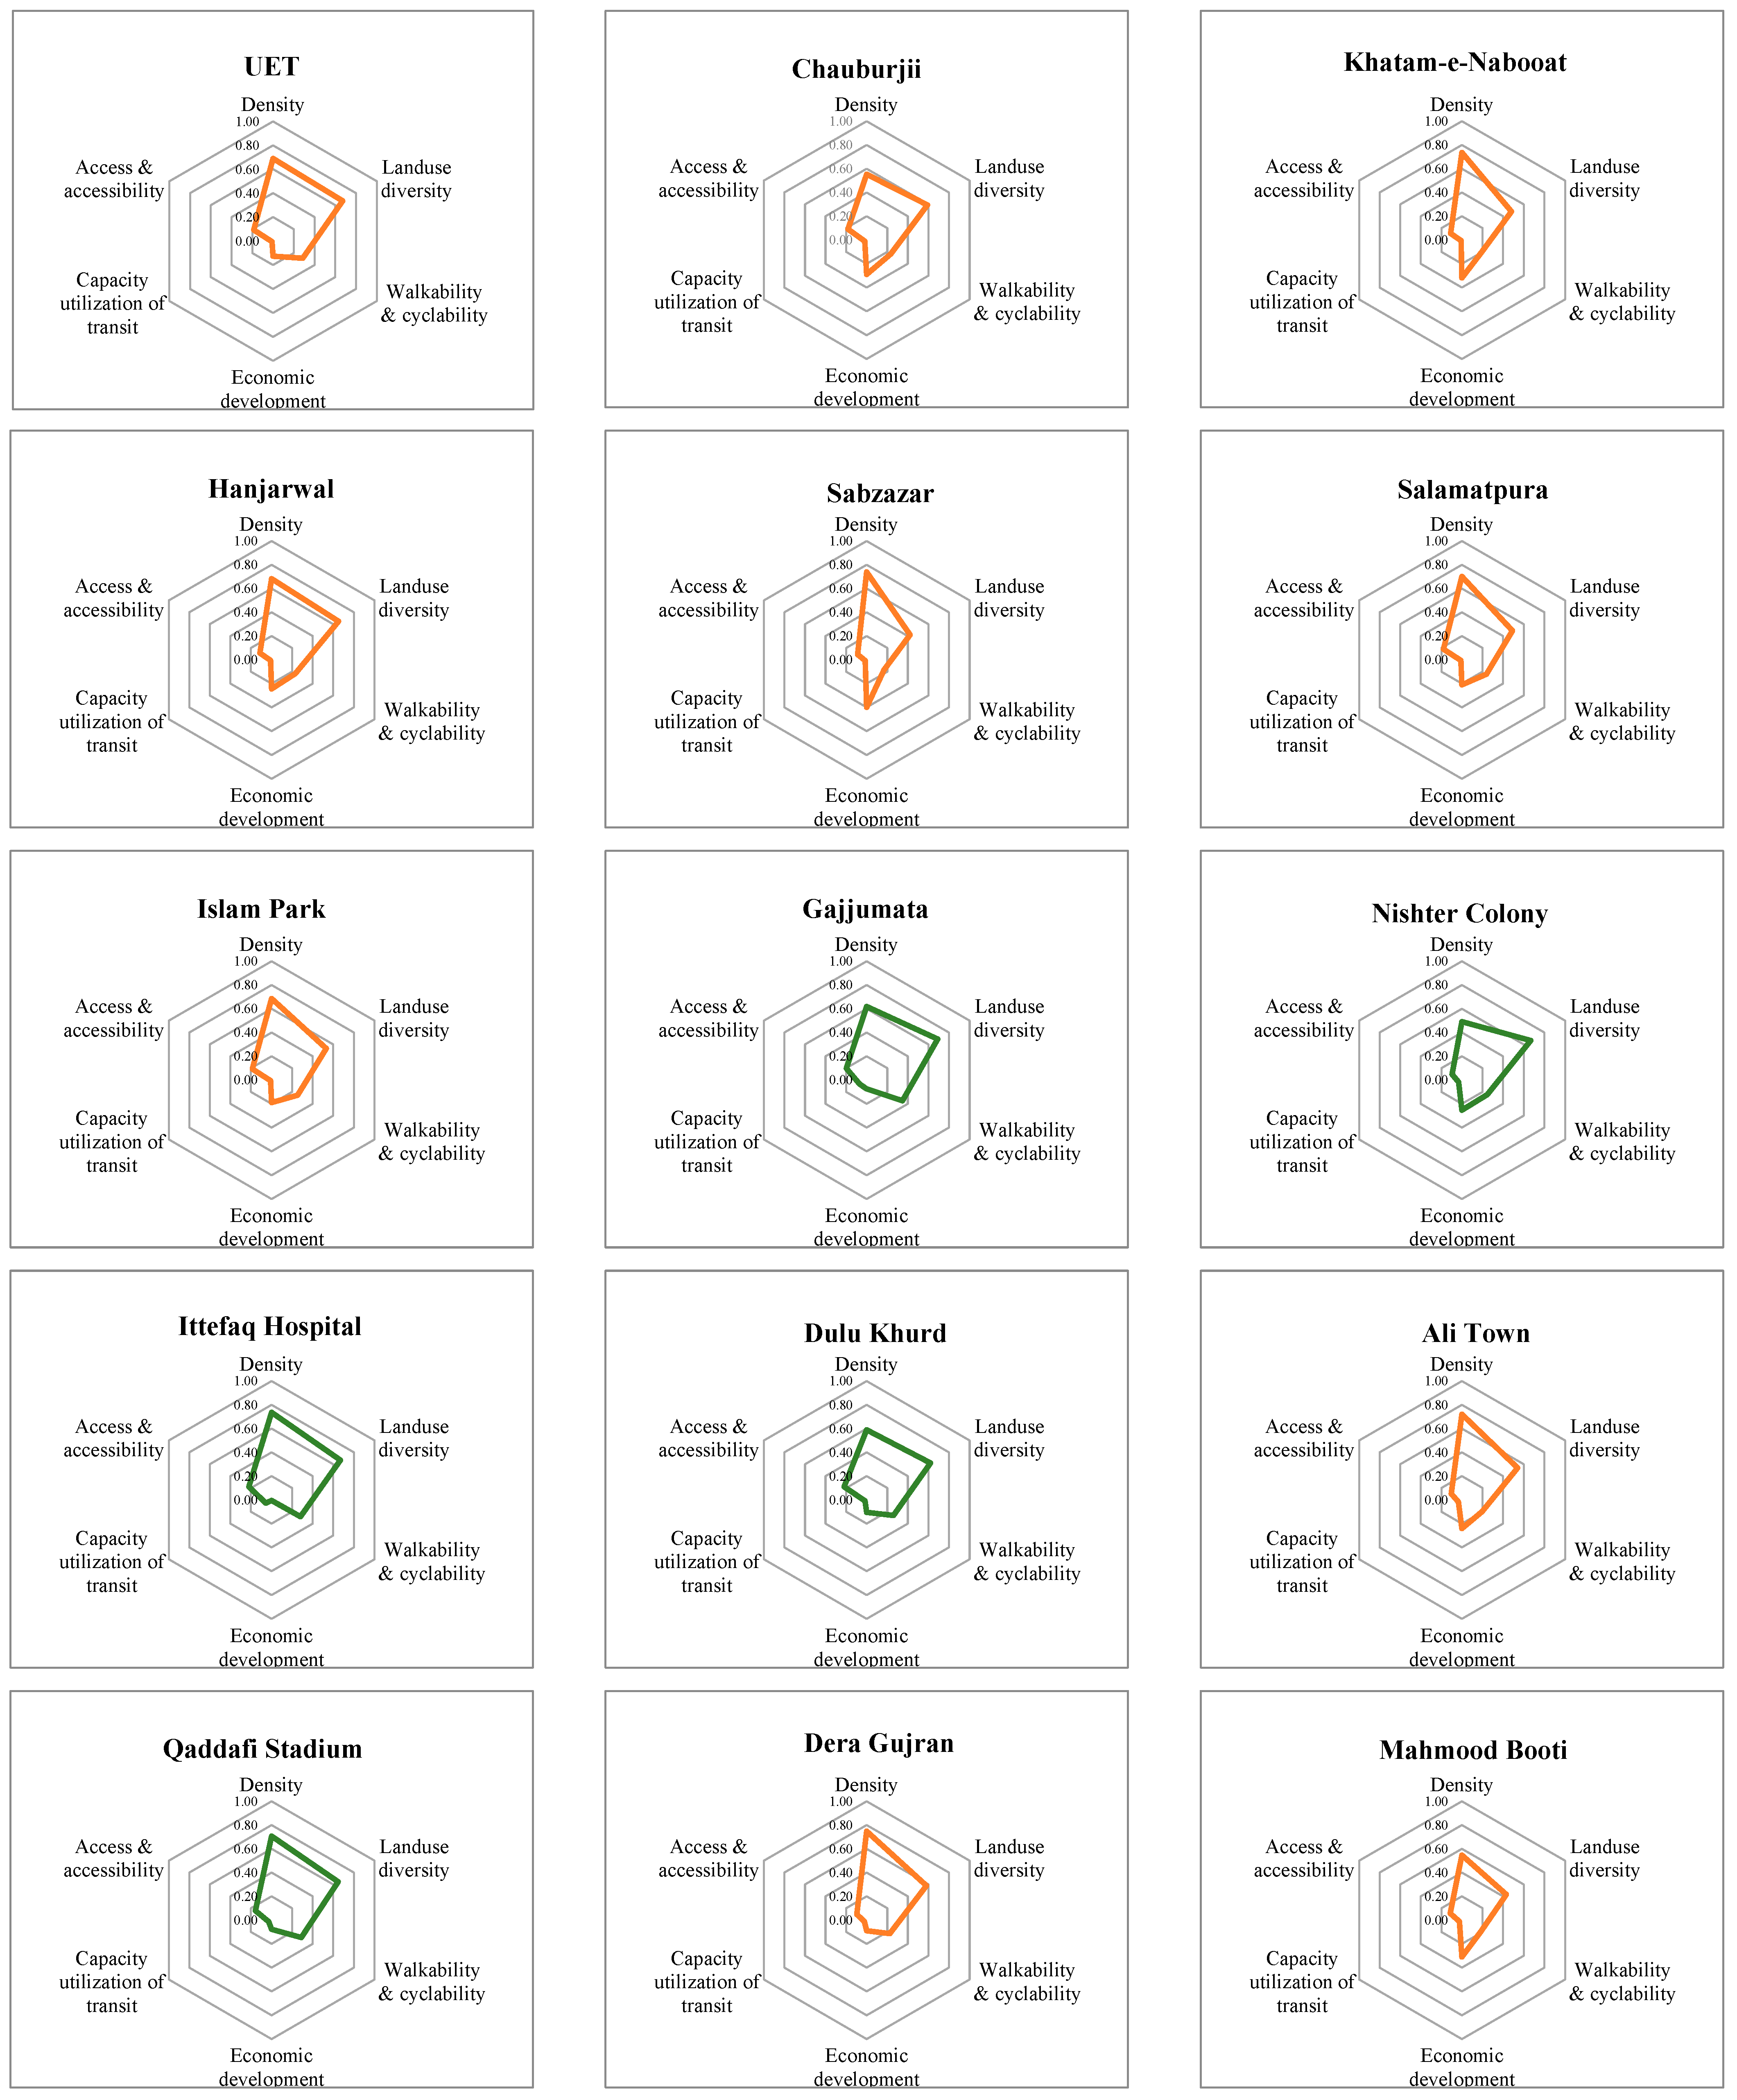
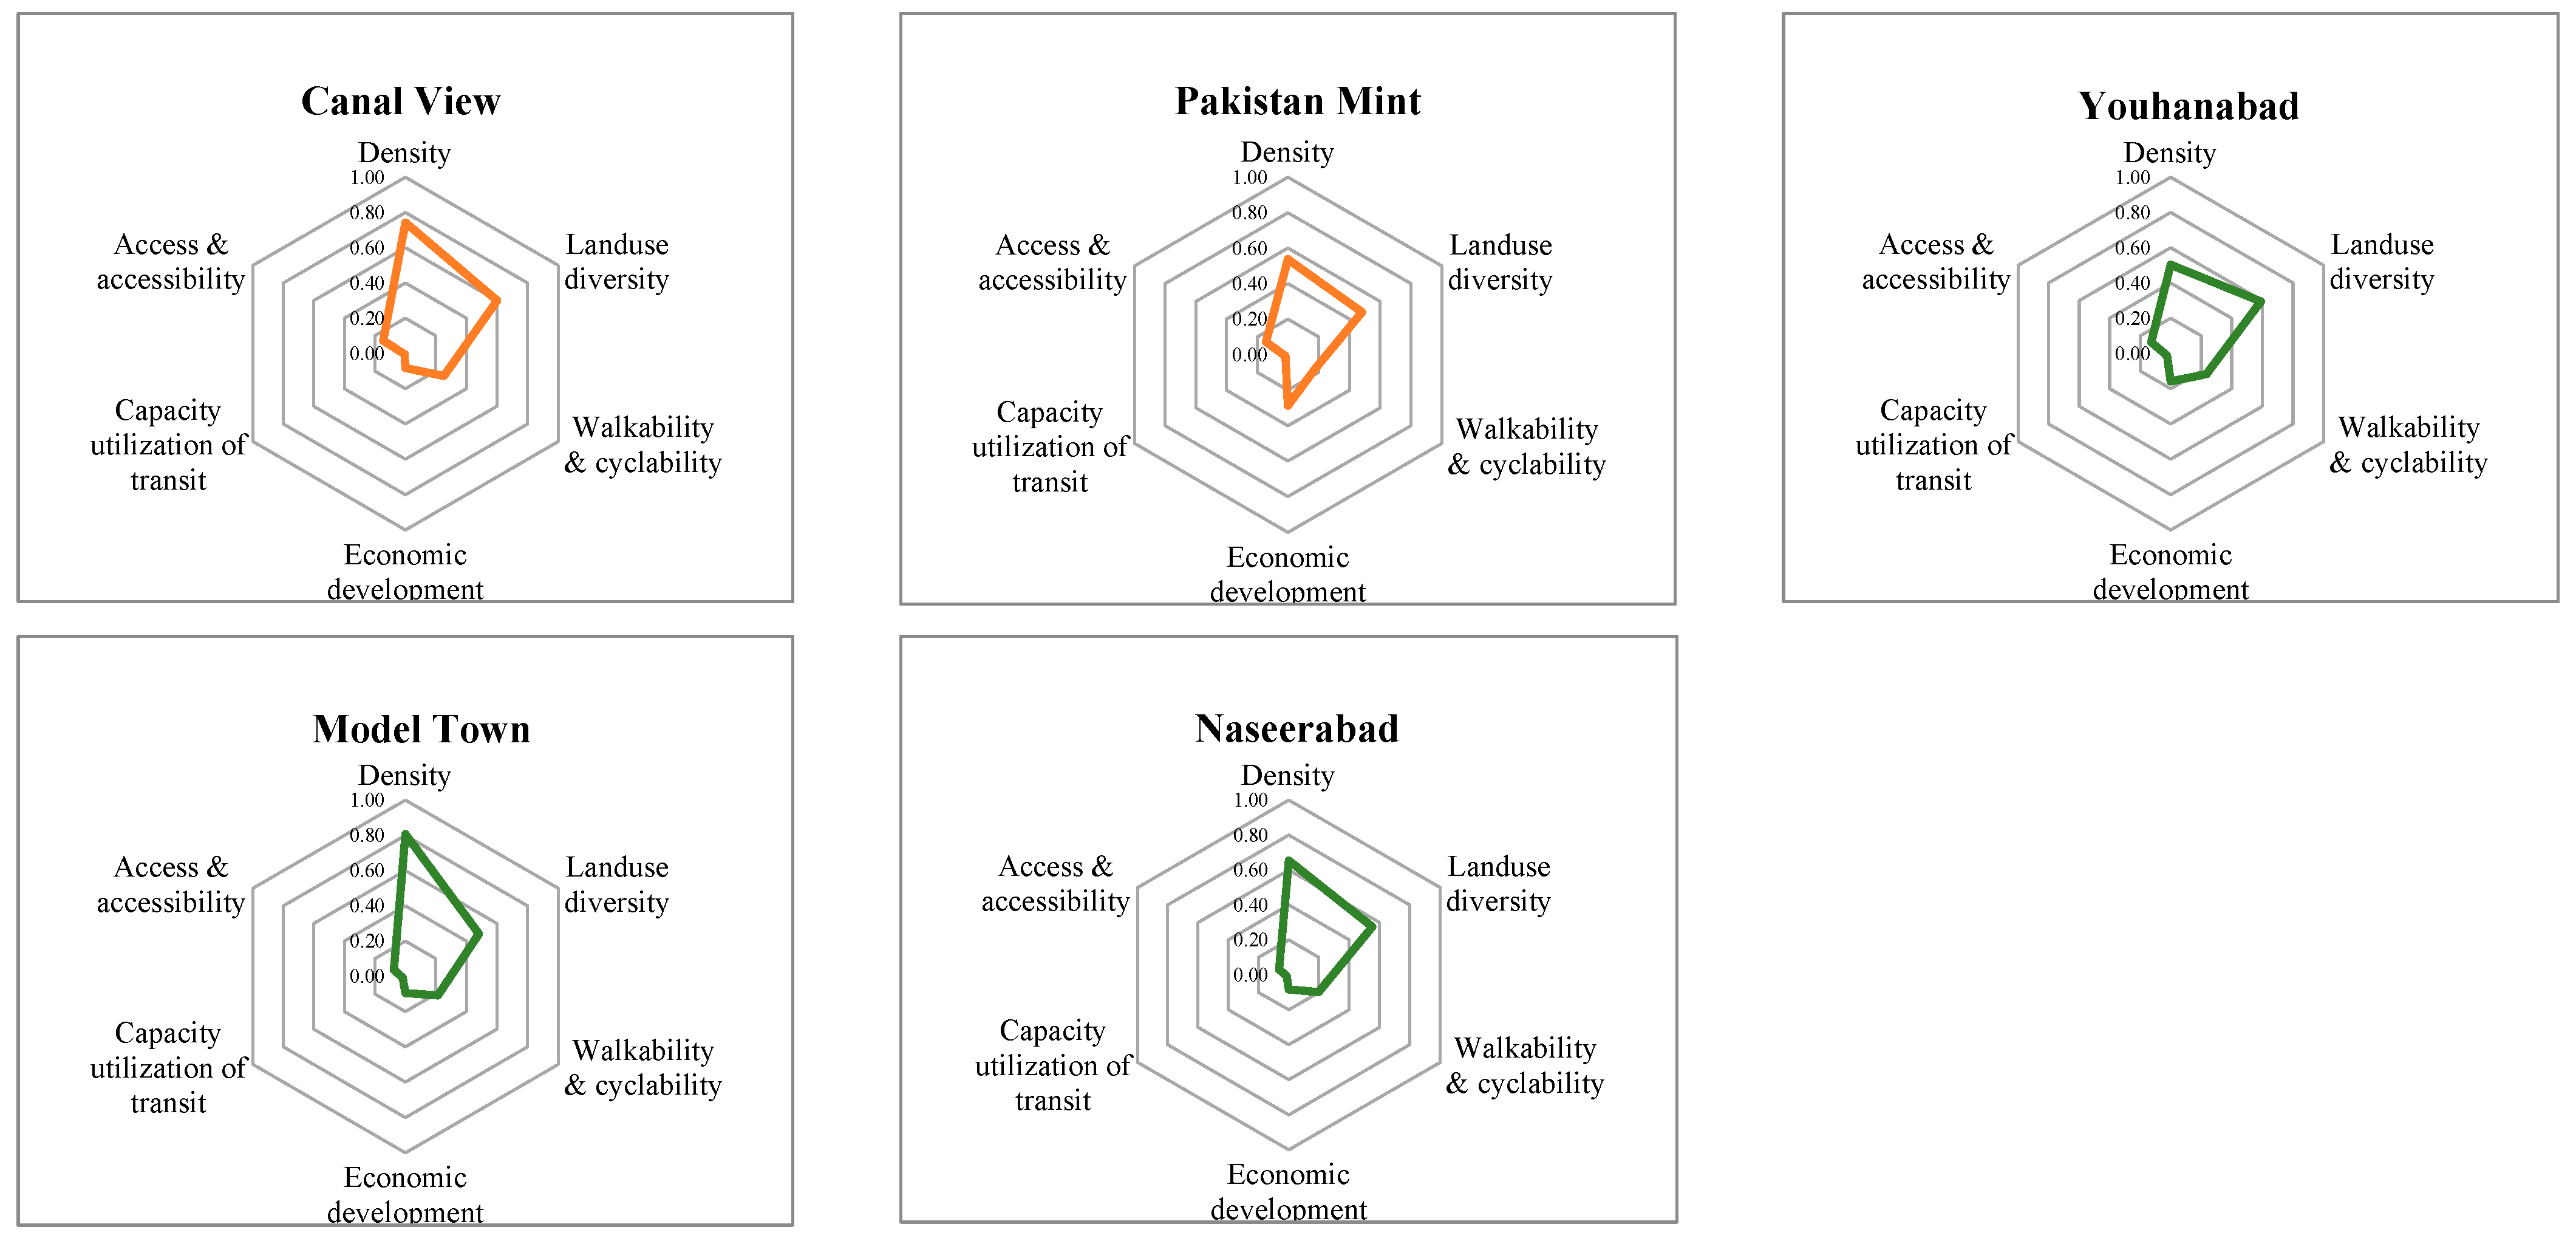
| S. No. | Station Name (Ranked by Their TOD Score) | TOD Index Score | Criteria | |||||
|---|---|---|---|---|---|---|---|---|
| Density | Land Use Diversity | Walkability and Cyclability | Capacity Utilization of Transit | Economic Development | Accessibility | |||
| 1 | Bhaati Chowk | 0.61 | 0.82 | 0.65 | 0.87 | 0.12 | 1.00 | 0.27 |
| 2 | Azaadi Chowk | 0.60 | 1.00 | 0.67 | 0.62 | 0.09 | 0.53 | 0.76 |
| 3 | MAO College | 0.54 | 0.66 | 0.72 | 0.69 | 0.16 | 0.30 | 0.81 |
| 4 | Ichra Station | 0.54 | 0.72 | 0.56 | 0.74 | 0.07 | 0.93 | 0.32 |
| 5 | GPO | 0.53 | 0.69 | 0.68 | 0.68 | 0.08 | 0.74 | 0.50 |
| 6 | Lake Road | 0.52 | 0.64 | 0.76 | 0.68 | 0.11 | 0.29 | 0.76 |
| 7 | Lakshmi Chowk | 0.52 | 0.79 | 0.67 | 0.77 | 0.07 | 0.75 | 0.33 |
| 8 | Shahdara | 0.51 | 0.76 | 0.67 | 0.52 | 0.15 | 0.25 | 0.82 |
| 9 | Railway Station | 0.51 | 0.58 | 0.73 | 0.52 | 0.12 | 0.35 | 0.81 |
| 10 | Katchehry | 0.51 | 0.68 | 0.59 | 0.63 | 0.09 | 0.64 | 0.46 |
| 11 | Thokar Niaz Baig | 0.50 | 0.81 | 0.49 | 0.49 | 0.11 | 0.28 | 0.70 |
| 12 | Timber Market | 0.50 | 0.96 | 0.47 | 0.73 | 0.04 | 0.68 | 0.26 |
| 13 | Kalma Chowk | 0.50 | 0.87 | 0.49 | 0.49 | 0.16 | 0.13 | 0.75 |
| 14 | Bund Road | 0.49 | 0.62 | 0.65 | 0.61 | 0.08 | 0.56 | 0.64 |
| 15 | Niazi Chowk | 0.48 | 0.83 | 0.67 | 0.60 | 0.12 | 0.47 | 0.26 |
| 16 | Shama Station | 0.46 | 0.74 | 0.72 | 0.58 | 0.05 | 0.35 | 0.35 |
| 17 | Janazgah | 0.45 | 0.55 | 0.49 | 0.78 | 0.02 | 0.68 | 0.19 |
| 18 | Qartaba Chowk | 0.44 | 0.64 | 0.56 | 0.58 | 0.08 | 0.57 | 0.32 |
| 19 | Canal Station | 0.44 | 0.80 | 0.73 | 0.56 | 0.12 | 0.18 | 0.38 |
| 20 | Chungi Amar Sidhu | 0.42 | 0.76 | 0.47 | 0.68 | 0.11 | 0.48 | 0.10 |
| 21 | Qainchi Station | 0.41 | 0.77 | 0.67 | 0.61 | 0.08 | 0.36 | 0.15 |
| 22 | Salahuddin Road | 0.41 | 0.72 | 0.76 | 0.58 | 0.05 | 0.47 | 0.13 |
| 23 | Wahdat Road | 0.40 | 0.73 | 0.59 | 0.55 | 0.04 | 0.38 | 0.14 |
| 24 | Baghbanpura | 0.40 | 0.74 | 0.68 | 0.66 | 0.04 | 0.37 | 0.17 |
| 25 | Gulshan-e-Ravi | 0.39 | 0.68 | 0.38 | 0.65 | 0.03 | 0.48 | 0.08 |
| 26 | Kamahan | 0.39 | 0.95 | 0.67 | 0.59 | 0.07 | 0.36 | 0.02 |
| 27 | Civil Secretariate | 0.38 | 0.63 | 0.49 | 0.55 | 0.05 | 0.11 | 0.43 |
| 28 | Shalimar Gardens | 0.38 | 0.56 | 0.64 | 0.60 | 0.08 | 0.36 | 0.19 |
| 29 | Samanabad | 0.38 | 0.59 | 0.70 | 0.70 | 0.02 | 0.60 | 0.09 |
| 30 | Sultanpura | 0.38 | 0.76 | 0.51 | 0.57 | 0.03 | 0.16 | 0.14 |
| 31 | Awan Town | 0.37 | 0.72 | 0.52 | 0.50 | 0.02 | 0.41 | 0.10 |
| 32 | Ghazi Chowk | 0.37 | 0.67 | 0.65 | 0.65 | 0.09 | 0.33 | 0.14 |
| 33 | Atari Saroba | 0.37 | 0.79 | 0.43 | 0.50 | 0.04 | 0.21 | 0.17 |
| 34 | UET | 0.37 | 0.69 | 0.54 | 0.53 | 0.02 | 0.13 | 0.19 |
| 35 | Chauburjii | 0.37 | 0.55 | 0.52 | 0.58 | 0.04 | 0.29 | 0.18 |
| 36 | Khatam-e-Nabooat | 0.37 | 0.74 | 0.62 | 0.56 | 0.02 | 0.32 | 0.11 |
| 37 | Hanjarwal | 0.36 | 0.68 | 0.46 | 0.48 | 0.02 | 0.24 | 0.11 |
| 38 | Sabzazar | 0.36 | 0.74 | 0.46 | 0.50 | 0.03 | 0.40 | 0.09 |
| 39 | Salamatpura | 0.36 | 0.70 | 0.41 | 0.56 | 0.02 | 0.21 | 0.18 |
| 40 | Islam Park | 0.36 | 0.69 | 0.58 | 0.54 | 0.02 | 0.19 | 0.19 |
| 41 | Gajjumata | 0.35 | 0.62 | 0.57 | 0.49 | 0.13 | 0.07 | 0.20 |
| 42 | Nishter Colony | 0.35 | 0.49 | 0.33 | 0.57 | 0.07 | 0.25 | 0.10 |
| 43 | Ittefaq Hospital | 0.35 | 0.74 | 0.65 | 0.41 | 0.11 | 0.00 | 0.22 |
| 44 | Dulu Khurd | 0.34 | 0.59 | 0.5 | 0.53 | 0.03 | 0.10 | 0.22 |
| 45 | Ali Town | 0.34 | 0.72 | 0.42 | 0.42 | 0.07 | 0.24 | 0.10 |
| 46 | Qaddafi stadium | 0.34 | 0.71 | 0.54 | 0.44 | 0.06 | 0.08 | 0.16 |
| 47 | Dera Gujran | 0.34 | 0.75 | 0.67 | 0.52 | 0.04 | 0.09 | 0.10 |
| 48 | Mahmood Booti | 0.34 | 0.55 | 0.59 | 0.59 | 0.05 | 0.31 | 0.12 |
| 49 | Canal View | 0.33 | 0.74 | 0.48 | 0.39 | 0.01 | 0.08 | 0.15 |
| 50 | Pakistan Mint | 0.32 | 0.54 | 0.65 | 0.49 | 0.03 | 0.29 | 0.14 |
| 51 | Youhanabad | 0.32 | 0.50 | 0.42 | 0.55 | 0.05 | 0.16 | 0.13 |
| 52 | Model town | 0.32 | 0.81 | 0.49 | 0.44 | 0.03 | 0.09 | 0.08 |
| 53 | Naseerabad | 0.29 | 0.66 | 0.53 | 0.38 | 0.03 | 0.08 | 0.06 |
Disclaimer/Publisher’s Note: The statements, opinions and data contained in all publications are solely those of the individual author(s) and contributor(s) and not of MDPI and/or the editor(s). MDPI and/or the editor(s) disclaim responsibility for any injury to people or property resulting from any ideas, methods, instructions or products referred to in the content. |
© 2024 by the authors. Licensee MDPI, Basel, Switzerland. This article is an open access article distributed under the terms and conditions of the Creative Commons Attribution (CC BY) license (https://creativecommons.org/licenses/by/4.0/).
Share and Cite
Anwar, A.; Leng, H.; Ashraf, H.; Haider, A. Measuring the Transit-Oriented Development (TOD) Levels of Pakistani Megacities for TOD Application: A Case Study of Lahore. Sustainability 2024, 16, 2209. https://doi.org/10.3390/su16052209
Anwar A, Leng H, Ashraf H, Haider A. Measuring the Transit-Oriented Development (TOD) Levels of Pakistani Megacities for TOD Application: A Case Study of Lahore. Sustainability. 2024; 16(5):2209. https://doi.org/10.3390/su16052209
Chicago/Turabian StyleAnwar, Ayesha, Hong Leng, Humayun Ashraf, and Alina Haider. 2024. "Measuring the Transit-Oriented Development (TOD) Levels of Pakistani Megacities for TOD Application: A Case Study of Lahore" Sustainability 16, no. 5: 2209. https://doi.org/10.3390/su16052209
APA StyleAnwar, A., Leng, H., Ashraf, H., & Haider, A. (2024). Measuring the Transit-Oriented Development (TOD) Levels of Pakistani Megacities for TOD Application: A Case Study of Lahore. Sustainability, 16(5), 2209. https://doi.org/10.3390/su16052209