Article

Modeling and Analysis of Driving Behaviour for Heterogeneous Traffic Flow Considering Market Penetration under Capacity Constraints

1
School of Traffic and Transportation Engineering, Changsha University of Science and Technology, Changsha 410114, China
2
College of Civil Engineering, Hunan City University, Yiyang 413000, China
3
Xiangtan Technology Research Center of Urban Planning Information, Xiangtan 411100, China
*
Author to whom correspondence should be addressed.
Sustainability 2023, 15(4), 2923; https://doi.org/10.3390/su15042923
Submission received: 11 January 2023 / Revised: 3 February 2023 / Accepted: 3 February 2023 / Published: 6 February 2023

Abstract

:
Based on analytical and simulation methods, this paper discusses the path choice behavior of mixed traffic flow with autonomous vehicles, advanced traveler information systems (ATIS) vehicles and ordinary vehicles, aiming to promote the development of autonomous vehicles. Firstly, a bi-level programming model of mixed traffic flow assignments constrained by link capacity is established to minimize travel time. Subsequently, the algorithm based on the incremental allocation method and method of successive averages is proposed to solve the model. Through a numerical example, the road network capacity under different modes is obtained, the impact of market penetration on travel time is analyzed, and the state and characteristics of single equilibrium flow and mixed equilibrium flow are explored. Analysis results show that the road network can be maximized based on saving travel time when all vehicles are autonomous, especially when the autonomous lane is adopted. The travel time can be shortened by increasing the market penetration of autonomous vehicles and ATIS vehicles, while the former is more effective. However, the popularization of autonomous vehicles cannot be realized in the short term; the market penetration of autonomous vehicles and ATIS vehicles can be set to 0.2 and 0.6, respectively, during the introduction period.

1. Introduction

In the context of the new era of profound integration and galloping burgeoning of artificial intelligence, big data, cloud computing, Internet of Things and other cutting-edge information technology with road traffic, the new generation of intelligent networked transportation systems featuring automatic driving has gradually converted to a major breakthrough to solve various traffic problems. In more specific terms, traffic operation efficiency [1], traffic congestion [2], road capacity [3], energy consumption [4], and safety performance [5] will be enormously improved. Through the intelligent vehicle-road cooperation system, communication and data fusion between vehicles and infrastructure will be realized [6], and the accuracy of the vehicle positioning system will be elevated [7], so that autonomous vehicles will come into reality. It is predicted that autonomous vehicles in the brand-new vehicle marketplace will account for approximately 25% of the global market by 2035 [8], which denotes that the prospective transportation will be “intellectualized” in a real sense. Under the assumption that autonomous vehicles are put into use, research into the distribution of mixed traffic flows composed of various types of vehicles provides a certain reference for the formulation of urban traffic planning adapted to the boost of autonomous vehicles [9].
The establishment of traffic flow assignment models is primarily based on the Wardrop principle [10]. The definition of traffic network balance lays a solid foundation for traffic flow assignment. The first principle is referred to as “User Equilibrium” (UE) and the second principle is “System Optimization” (SO). Under the principle of UE, all travelers are well aware of the traffic state of the network, and from the perspective of their own interests, they sort out the shortcut option individually. Under the SO principle, all travelers stick to the goal of “minimizing the average or total travel cost” to choose the route. The Stochastic User Equilibrium (SUE) model, based on the UE model, used the path travel time as a random variable and selected the path according to the minimum perceived travel time, which added a certain degree of uncertainty to travel information [11]. Since then, scholars have conducted a large number of in-depth studies on the traffic equilibrium model. Ben-Akiva [12] presented the dynamic traffic allocation simulation model and its corresponding solving algorithm. Cantarella et al. [13] studied the dynamic equilibrium process of the transportation network. Guo et al. [14] constructed a dynamic system model to represent the equilibrium evolution process based on relevant variables of link flow. Watling et al. [15] established a dynamic stochastic model considering variability and uncertainty and analyzed its effect on the transportation system.
As an integral part of the intelligent transportation system (ITS), the advanced traveler information system (ATIS) releases real-time traffic information to travelers through satellite positioning technology, communication technology and computer technology, and guides participants in the transportation system to avoid traffic congestion, thus saving travel time. Based on this, scholars have conducted some research work on ATIS, and analyzed the path choice behavior and traffic flow assignment under the action of ATIS. Yang [16] proposed a convex programming model and algorithm to solve the mixed behavior equilibrium problem for any given level of the market penetration of ATIS. Yin and Yang [17] investigated the interactions among the three classes of drivers in an ATIS environment using a multiple-behavior SUE model. Huang et al. [18] established a dynamic model to investigate the evolution process of travelers on route choice, ATIS compliance rate and ATIS adoption. Cheng et al. [19] proposed a mixed SUE model to describe the interactive route choice behaviors and equilibrium state considering whether ATIS is equipped or not.
As the future vehicle evolutionary orientation, automatic driving technology has been in the world spotlight. The driver’s improper behaviors, more often than not, tend to incur accidents. For instance, overspeeding, frequently switching lanes and other aggressive driving behaviors will raise the risk of collision [20]. To realize the driver’s complete liberation through automatic driving, more and more scholars choose it as a research subject. The existing research, mainly based on the mixed traffic flow composed of autonomous vehicles and ordinary vehicles, applied the traffic flow distribution model under the mixed traffic condition to the representation of the impact of the introduction of autonomous vehicles upon the traffic network [21,22,23]. Wang [24] constructed multi-user traffic assignment models based on user equilibrium and cross-nested randomness, respectively, and conducted a sensitivity analysis on the models, considering the difference in route selection behavior between autonomous vehicles and ordinary vehicles. Yao [25] probed into the improvement of traffic flow stability by autonomous vehicles and obtained stability conditions under different vehicle market penetration rates. Chen et al. [26] set up dedicated lanes for autonomous driving, with autonomous vehicles chosing routes in and out of the dedicated lanes according to the SO and UE principles separately. Ye et al. [27,28] analyzed the influence of dedicated lanes on traffic flow under varied permeability of autonomous vehicles by constructing a heterogeneous traffic flow model. Huang et al. [29] constructed a road network reserve capacity model in the autonomous driving environment, and investigated thoroughly the impact of market penetration of autonomous vehicles and route selection behavior on road network capacity. Levin and Boyles [30] developed a multiclass cell transmission model to assess the extent to which the proportion of AVs affect capacity improvements.
Contemporarily, there have been very mature theoretical research and application studies on traffic flow assignment; many scholars have carried out research on ATIS vehicles and autonomous vehicles from multiple perspectives [31,32,33]. However, there are still some deficiencies in the current research. First, most of the existing mixed traffic assignment models adopt the UE principle to select the shortest route for ordinary vehicles. Nevertheless, not all ordinary can fully grasp the road network information, and some travelers do not blindly pursue time-saving. Secondly, the traffic assignment problem in some literatures does not consider the constraint of traffic capacity, allowing the traffic flow to exceed the capacity of its links, and the distribution result is unreasonable, leading to excessive congestion in some links. Current research considers two types of mixed traffic flow, e.g., autonomous and ordinary vehicles, with and without ATIS vehicles, and the market penetration of autonomous vehicles and ATIS vehicles are also analyzed, respectively. Since there are a great variety of vehicles in the real road network, it is important to consider the influence of diverse vehicle market penetration of urban road networks comprehensively. In addition, the model parameter values are usually given directly, and the values of relevant parameters are not analyzed. For example, the travel demand and market penetration of different types of vehicles are directly given. Therefore, in this paper, road network vehicles will be sorted into three types, i.e., autonomous vehicles, ATIS vehicles, and ordinary vehicles. It should be noted here that the term ATIS vehicles is not merely confined to vehicles installed with ATIS but also includes the ones opting for the shortcuts through a variety of information platforms for real-time traffic information. It is assumed that autonomous vehicles select routes in correspondence with the SO mode and obey the unified scheduling management of traffic control departments to minimize the total travel time. In the model, ATIS vehicles comply with UE mode to elect routes, and travelers can have information on road traffic conditions at their command according to an ATIS device, to minimize personal travel time. Ordinary vehicles follow the SUE mode to select routes, and travelers cannot obtain real-time road condition information at random, based on which the traffic flow distribution model is constructed with restricted capacity. The incremental method and method of successive averages are adopted to solve the model. A numerical example is conducted to determine the road network capacity under SUE, UE, SO modes, obtain the market penetration of various sorts of vehicles suitable for the introduction period of autonomous vehicles, and discuss the evolution process of single equilibrium flow and mixed equilibrium flow states of traffic networks based on the determined parameter values. In this research, the capacity and equilibrium optimization of traffic networks is carried out for the intelligent network and mixed traffic environment, which is conducive to the promotion and application of autonomous vehicles in the urban road network and provides decision support for the layout optimization of intelligent networks.

2. Materials and Methods

2.1. Notation

For ease of reference, the appended nomenclature list summarizes the frequently-used notation. The other notations are explained when they are used.

2.2. Model

Consider the road network G = ( N , A ) , a bi-level programming model is established by taking the maximum travel demand of transportation network as the upper optimization objective and the minimum total travel time under mixed equilibrium as the lower optimization objective.

2.2.1. Upper Level Planning Model

The upper level planning is to maximize the reserve capacity of the road network under the constraint of link capacity, and the maximum demand that the road network can accommodate is predicted.
max   μ r , s q r s
s . t .     x a ( μ ) C a   , a A
In the above, the objective function is to maximize the reserve capacity of the road network. Equation (2) ensures the link flow is constrained by the link capacity.

2.2.2. Lower Level Planning Model

  • Single Traffic Flow Assignment Model
Case 1: All vehicles on the road network are ordinary vehicles that are not familiar with the road condition information so the travel has certain randomness, and the SUE model is constructed to allocate the traffic flow.
min Z ˜ ( X ˜ )   = a A 0 x ˜ a t a ( ω ) d ω + 1 θ r s k f ˜ k r s ln f ˜ k r s
s . t .     k f ˜ k r s = μ q ˜ r s , ( r , s ) W , k K
x ˜ a = r s k f ˜ k r s δ a , k r s , ( r , s ) W , k K , a A
f ˜ k r s 0 , ( r , s ) W , k K
where Z ˜ ( X ˜ )   is the total travel time of ordinary vehicles, ω is the integral variable symbol.
Assume that the probability of choosing routes for ordinary vehicles is determined by the Logit model, i.e.,
f ˜ k r s = q ˜ r s P k r s , P k r s = exp ( θ c k r s ) k K exp ( θ c k r s ) ( r , s ) W , k K
c k r s = a A t a ( x a ) δ a , k r s
Case 2: All vehicles on the road network are ATIS vehicles that can grasp the road network information in real-time. The shortest path is selected for travel, and the minimum personal travel time can be realized, so as a model is constructed through the UE principle to allocate the traffic flow.
min Z ^ ( X ^ )   = a A 0 x ^ a t a ( ω ) d ω
s . t .     k f ^ k r s = μ q ^ r s , ( r , s ) W , k K
x ^ a = r s k f ^ k r s δ a , k r s , ( r , s ) W , k K , a A
f ^ k r s 0 , ( r , s ) W , k K
where Z ^ ( X ^ )   is the total travel time of ATIS vehicles.
Case 3: All vehicles on the road network are autonomous vehicles that cannot choose their own paths to travel, and need to be dispatched uniformly by the control center, so that the SO assignment model is adopted to minimize the total travel time of the system. The model performs user optimal assignment according to the marginal travel time function, which can achieve system optimization, i.e., the traffic flow can be allocated through the marginal shortest path.
min Z ¯ ( X ¯ )   = a A x ¯ a t a ( x ¯ a ) = a A 0 x ¯ a t ¯ a ( ω ) d ω
s . t .     k f ¯ k r s = μ q ¯ r s , ( r , s ) W , k K
x ¯ a = r s k f ¯ k r s δ a , k r s , ( r , s ) W , k K , a A
f ¯ k r s 0 , ( r , s ) W , k K
where Z ¯ ( X ¯ ) is the total travel time of autonomous vehicles, t ¯ a ( x ¯ a )   is the marginal travel time of autonomous vehicles on link a corresponding to the traffic flow x ¯ a and the calculation formula is t ¯ a ( x ¯ a ) = t a ( x ¯ a ) + x ¯ a t a ( x ¯ a ) / x ¯ a .
  • Mixed Traffic Flow Assignment Model
There are three different types of vehicles in the road network, i.e., autonomous vehicles, ATIS vehicles, and ordinary vehicles. Among them, autonomous vehicles select the path according to the optimal system, and the flow of ATIS vehicles and ordinary vehicles is taken as the background traffic. The path chosen for ATIS vehicles is based on the user optimality principle and the traffic flow of autonomous vehicles and ordinary vehicles as the background traffic. Ordinary vehicles follow the stochastic user optimization to select the route, and the traffic of autonomous vehicles and ATIS vehicles is used as background traffic. Different types of vehicles are mixed in the road network, pursuing their respective optimization under their mutual influence, and finally forming a mixed equilibrium state of the road network, which the mixed traffic flow assignment model can be constructed.
min Z ( X ) = a A 0 x ¯ a t ¯ a ( x ^ a + x ˜ a + ω ) d ω + a A 0 x ^ a + x ˜ a t a ( x ¯ a + ω ) d ω + 1 θ r s k f ˜ k r s ln f ˜ k r s
s . t .     ( 4 ) ( 6 ) ,   ( 10 ) ( 12 )   and   ( 14 ) ( 16 )
q ¯ r s = α μ q r s   , q ^ r s = β μ q r s   , q ˜ r s = ( 1 α β ) μ q r s   ( r , s ) W
In the above, the objective function is to minimize the total travel time for different types of vehicles. Equations (4), (10) and (14) implies the relationship between path flow and OD pair travel demand for different types of vehicles. Equations (5), (11) and (15) imply the relationship between link flow and path flow for different types of vehicles. Equations (6), (12) and (16) are nonnegative constraints on path flow for different types of vehicles. Equation (7) is the path flow of ordinary vehicles under the path choice probability model. Equation (8) implies the relationship between the travel time of link and path under the background of traffic flow. Equation (18) implies the relationship between different types of vehicles and all vehicles in OD pairs travel demand.

2.3. Solution Algorithm

The bi-lever programming model proposed in this research is a nonlinear mixed integer programming issue, which allocates incremental traffic flow subject to capacity limits and combines the method of successive averages to solve the model. The algorithm steps are itemized below.
Step 1: In accordance with the given road network information, the fundamental travel demand for a given OD between ( r , s ) is q r s , ( r , s ) W . The demand multiplied by the sub-step size is set as Δ μ ; with μ initialized herein, let μ ( 1 ) = μ 0 , n = 1 .
Step 2: Build a virtual link. When the demand exceeds the link capacity, the road network fails to further assign traffic flow; a virtual link a ¨ can be complemented to the road network, with the link capacity C a ¨ = + , and the road free flow time t a ¨ 0 = + .
Step 3: Generate initial link flow by means of incremental allocation of travel volume through capacity limitation.
(1) Given parameters. Given that the flow on each link x a = 0 , the number of iterations h = 1 , then the free flow travel time of link t a 0 = t a ( 0 ) , the residual capacity of link C a ( h ) = C a and the unassigned travel flow q r s ( h ) = μ q r s are attained.
(2) Initial assignment. On the basis of the residual capacity of minimum link, the distributable flow q r s ( h ) = min [ q r s ( h ) , min C a ( h ) ] is determined, in which autonomous vehicle flow q ¯ r s ( h ) = α q r s ( h ) and ATIS vehicle flow q ^ r s ( h ) = β q r s ( h ) are assigned by the Method of All or Nothing; ordinary vehicle flow q ˜ r s ( h ) = ( 1 α β ) q r s ( h ) is randomly assigned according to the corresponding probability. Then the path flow f k ( h ) = f ¯ k ( h ) + f ^ k ( h ) + f ˜ k ( h ) and the link flow x a ( h ) = x ¯ a ( h ) + x ^ a ( h ) + x ˜ a ( h ) in this assignment stage are obtained. At length, the assigned path flow f k ( h ) = h f k ( h ) , the assigned link flow x a ( h ) = h x a ( h ) , the assigned traffic flow q r s ( h ) = h q r s ( h ) , the unassigned traffic flow q r s ( h ) = μ q r s q r s ( h ) , the residual capacity of link C a ( h ) = C a x a ( h ) are separately calculated; the link a is converted to the virtual link a ¨ when the residual capacity of link C a ( h ) = 0 .
(3) Judgment analysis. If the unassigned travel flow q r s ( h ) = 0 , it indicates that all traffic flow has been assigned to the road network and the cycle is terminated. Otherwise, set h = h + 1 , and return to Step 3.2 to resume traffic assignment.
(4) Output Results. Determine the link flow x a ( m ) = x ¯ a ( m ) + x ^ a ( m ) + x ˜ a ( m ) in accordance with the initial traffic assignment, with the number of iterations set as m = 1 .
Step 4: Calculate the link travel time. Calculate the new actual travel time of link t a ( m ) = t a ( x a ( m ) ) according to the link flow.
Step 5: Calculate the marginal travel time of link with the marginal cost function based on the autonomous vehicle link flow, i.e., t ¯ a ( m ) = t a [ x a ( m ) ] + x ¯ a ( m ) t a [ x a ( m ) ] / x ¯ a ( m ) .
Step 6: Determine the additional traffic flow. The travel flow is assigned in accordance with the capacity limit distribution method in step 3. As per the link marginal travel time calculated in step 5, autonomous vehicles perform all or nothing traffic flow assignment. The ATIS vehicles and ordinary vehicles are assigned with all or nothing traffic flow and random traffic flow, respectively, according to the link travel time calculated in step 4. Based on the above, the additional traffic flow of each link can be finally obtained, i.e., y a ( m ) = y ¯ a ( m ) + y ^ a ( m ) + y ˜ a ( m ) .
Step 7: Update link flow. Update the total link flow of all vehicles and the link flow of autonomous vehicles by the Weighted Average Method, i.e., x a ( m + 1 ) = x a ( m ) + [ y a ( m ) x a ( m ) ] / m and x ¯ a ( m + 1 ) = x ¯ a ( m ) + [ y ¯ a ( m ) x ¯ a ( m ) ] / m .
Step 8: Convergence test. If a [ x a ( m + 1 ) x a ( m ) ] 2 / a x a ( m ) ε , terminate the circulation. Otherwise, set m = m + 1 and return to Step 4 and extend the iterative calculation, with ε set as the predetermined iteration-precision value.
Step 9: If a A , x a ( μ ( n ) ) C a , set μ ( n + 1 ) = μ ( n ) + Δ μ , n = n + 1 and revert to Step 3. Otherwise, output the result and terminate the algorithm.

2.4. Simulation Software

In this paper, the research relies on computer simulations based on MATLAB software. MATLAB is a software that can be used for algorithm development, numerical calculation and data analysis. It has a friendly working platform and programming environment, which is convenient for the realization and visualization of traffic flow simulation, and greatly reduces the complexity of the programming language. The whole calculating process of the model proposed was implemented using MATLAB R2018b (MathWorks, Natick, MA, USA) on a 3.20 GHz Lenovo computer with 16 GB RAM and 64-bit operating system. The preset parameters are input, the data are output through programming and operation, and the determined parameters are input as new data. According to the MATLAB simulation experiment, the effectiveness and feasibility of the model and iterative algorithm are verified.
Figure 1 depicts the input data, output data and determined parameters of the traffic allocation model. Among them, the input data consist of three aspects, namely the demand side, the supply side and the model side. The supply side is fixed, including the link-path incidence matrix, free flow travel time of link and link capacity. The input of the demand side and model side is adjusted according to the simulation research task. The details are presented below:
  • Road network capacity analysis. The demand side input comprises the initial traffic demand, travel demand growth multiplier and demand multiplier step size. The model side input includes the convergence detection iteration accuracy and information quality level (familiarity of ordinary drivers with the road network). Through MATLAB software, the maximum road network capacity and corresponding travel time under the link capacity constraint are output, and the parameter of travel demand is determined.
  • Market penetration analysis. The demand side input is modified to the travel demand determined in the previous part, and other input data remain unchanged. Different types of vehicles are mixed in the road network, and the average travel time under different market penetration is output through simulation calculation, and the market penetration of autonomous vehicles and ATIS vehicles are determined.
  • Road network equilibrium analysis. The input data is based on the above, and the parameter of market penetration is added as input of the model side. The link flow and path flow in the equilibrium state and the corresponding travel time are obtained by MATLAB software.

3. Results and Discussion

In this section, a numerical example is given to illustrate the characteristics of the proposed models and discuss the specific applications.

3.1. Basic Information of Road Network

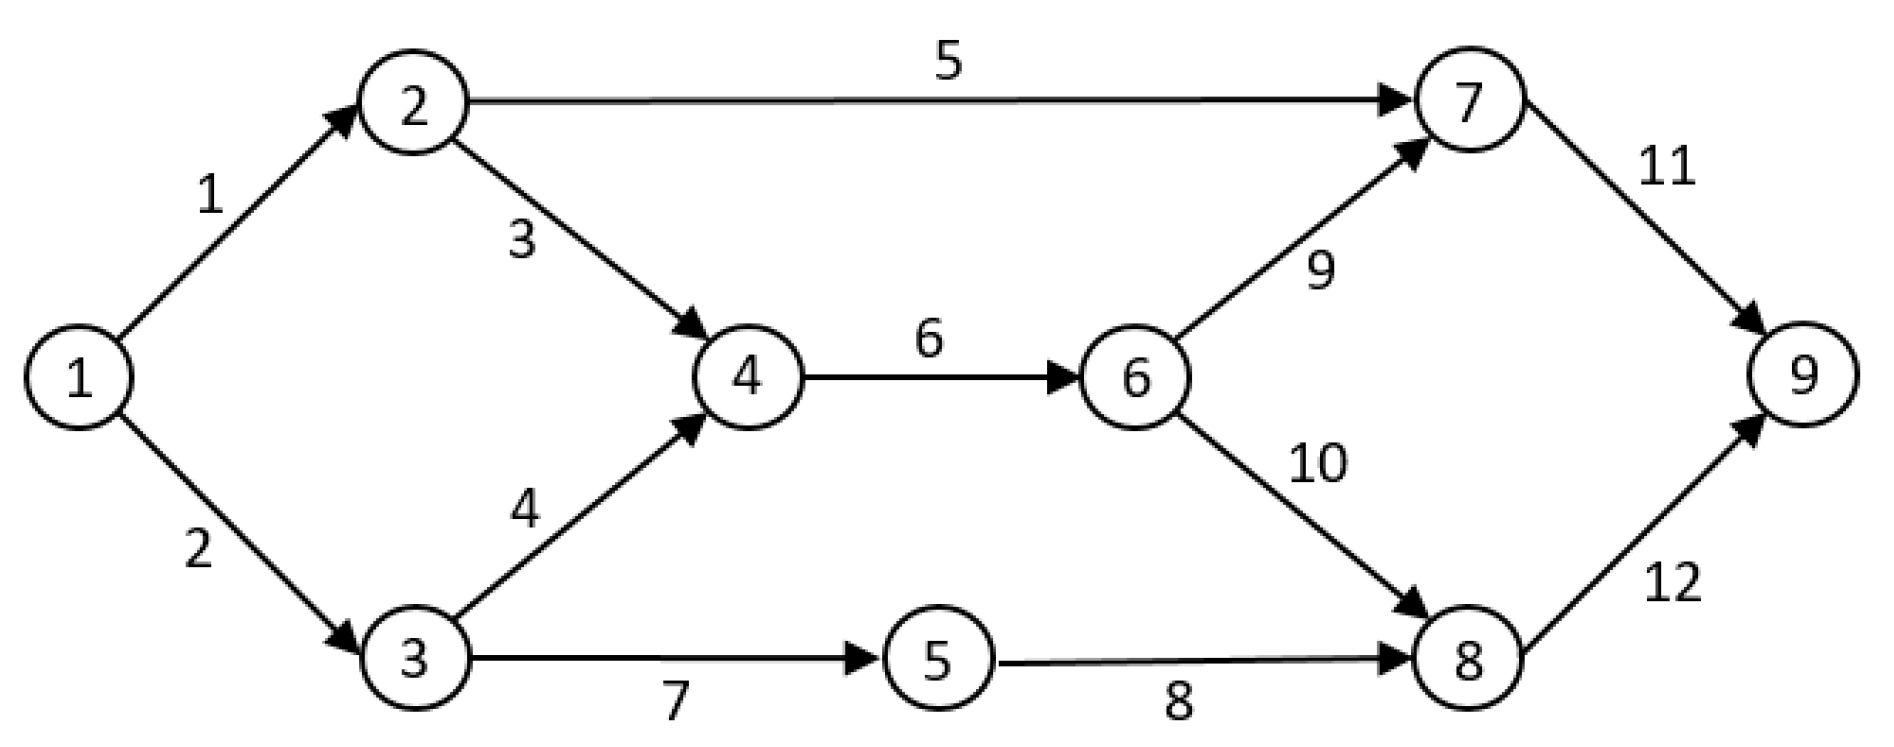
The test road network, as shown in Figure 2, includes 9 nodes, 12 links and one OD pair, with reference to the basic information of each link and path illustrated in Table 1 and Table 2. The BPR function proposed by the Federal Highway Administration of the United States and the recommended calibration parameter value is adopted as the link impedance function [34]. The link travel time can be represented as herein below.
t a ( x a ) = t a 0 [ 1 + 0.15 ( x a C a ) 4 ] , a A

3.2. Road Network Capacity Analysis

The amount of travel in the road network is limited by the link capacity. When the link flow reaches saturation, there will be a queuing phenomenon, and it is necessary to choose other roads to drive. With the increasing demand for travel, affected by capacity constraints, the distributed flow of the road network will not change after reaching a certain value, and some travel demands cannot be satisfied, which is referred to as excess demand, based on which it is necessary to analyze the road network capacity in a wide variety of modes, as follows.
Determine the road network flow and total travel time variation trend under the condition of increasing travel demand by MATLAB software programming through the calculation and analysis of the initial demand from node 1 to node 9 assumed as q = 1500 veh·h−1, initial traffic demand growth multiplier μ = 1 , increasing factor Δ μ = 0.02 , information quality level of common vehicles θ = 0.1 , and iteration accuracy ε = 1 × 10 4 . Among them, all vehicles in SO mode are autonomous vehicles, which are discussed in two cases: regular lanes and dedicated lanes, with the given link traffic capacity set as C a = 1.85 C a in the case of dedicated lanes [35,36].
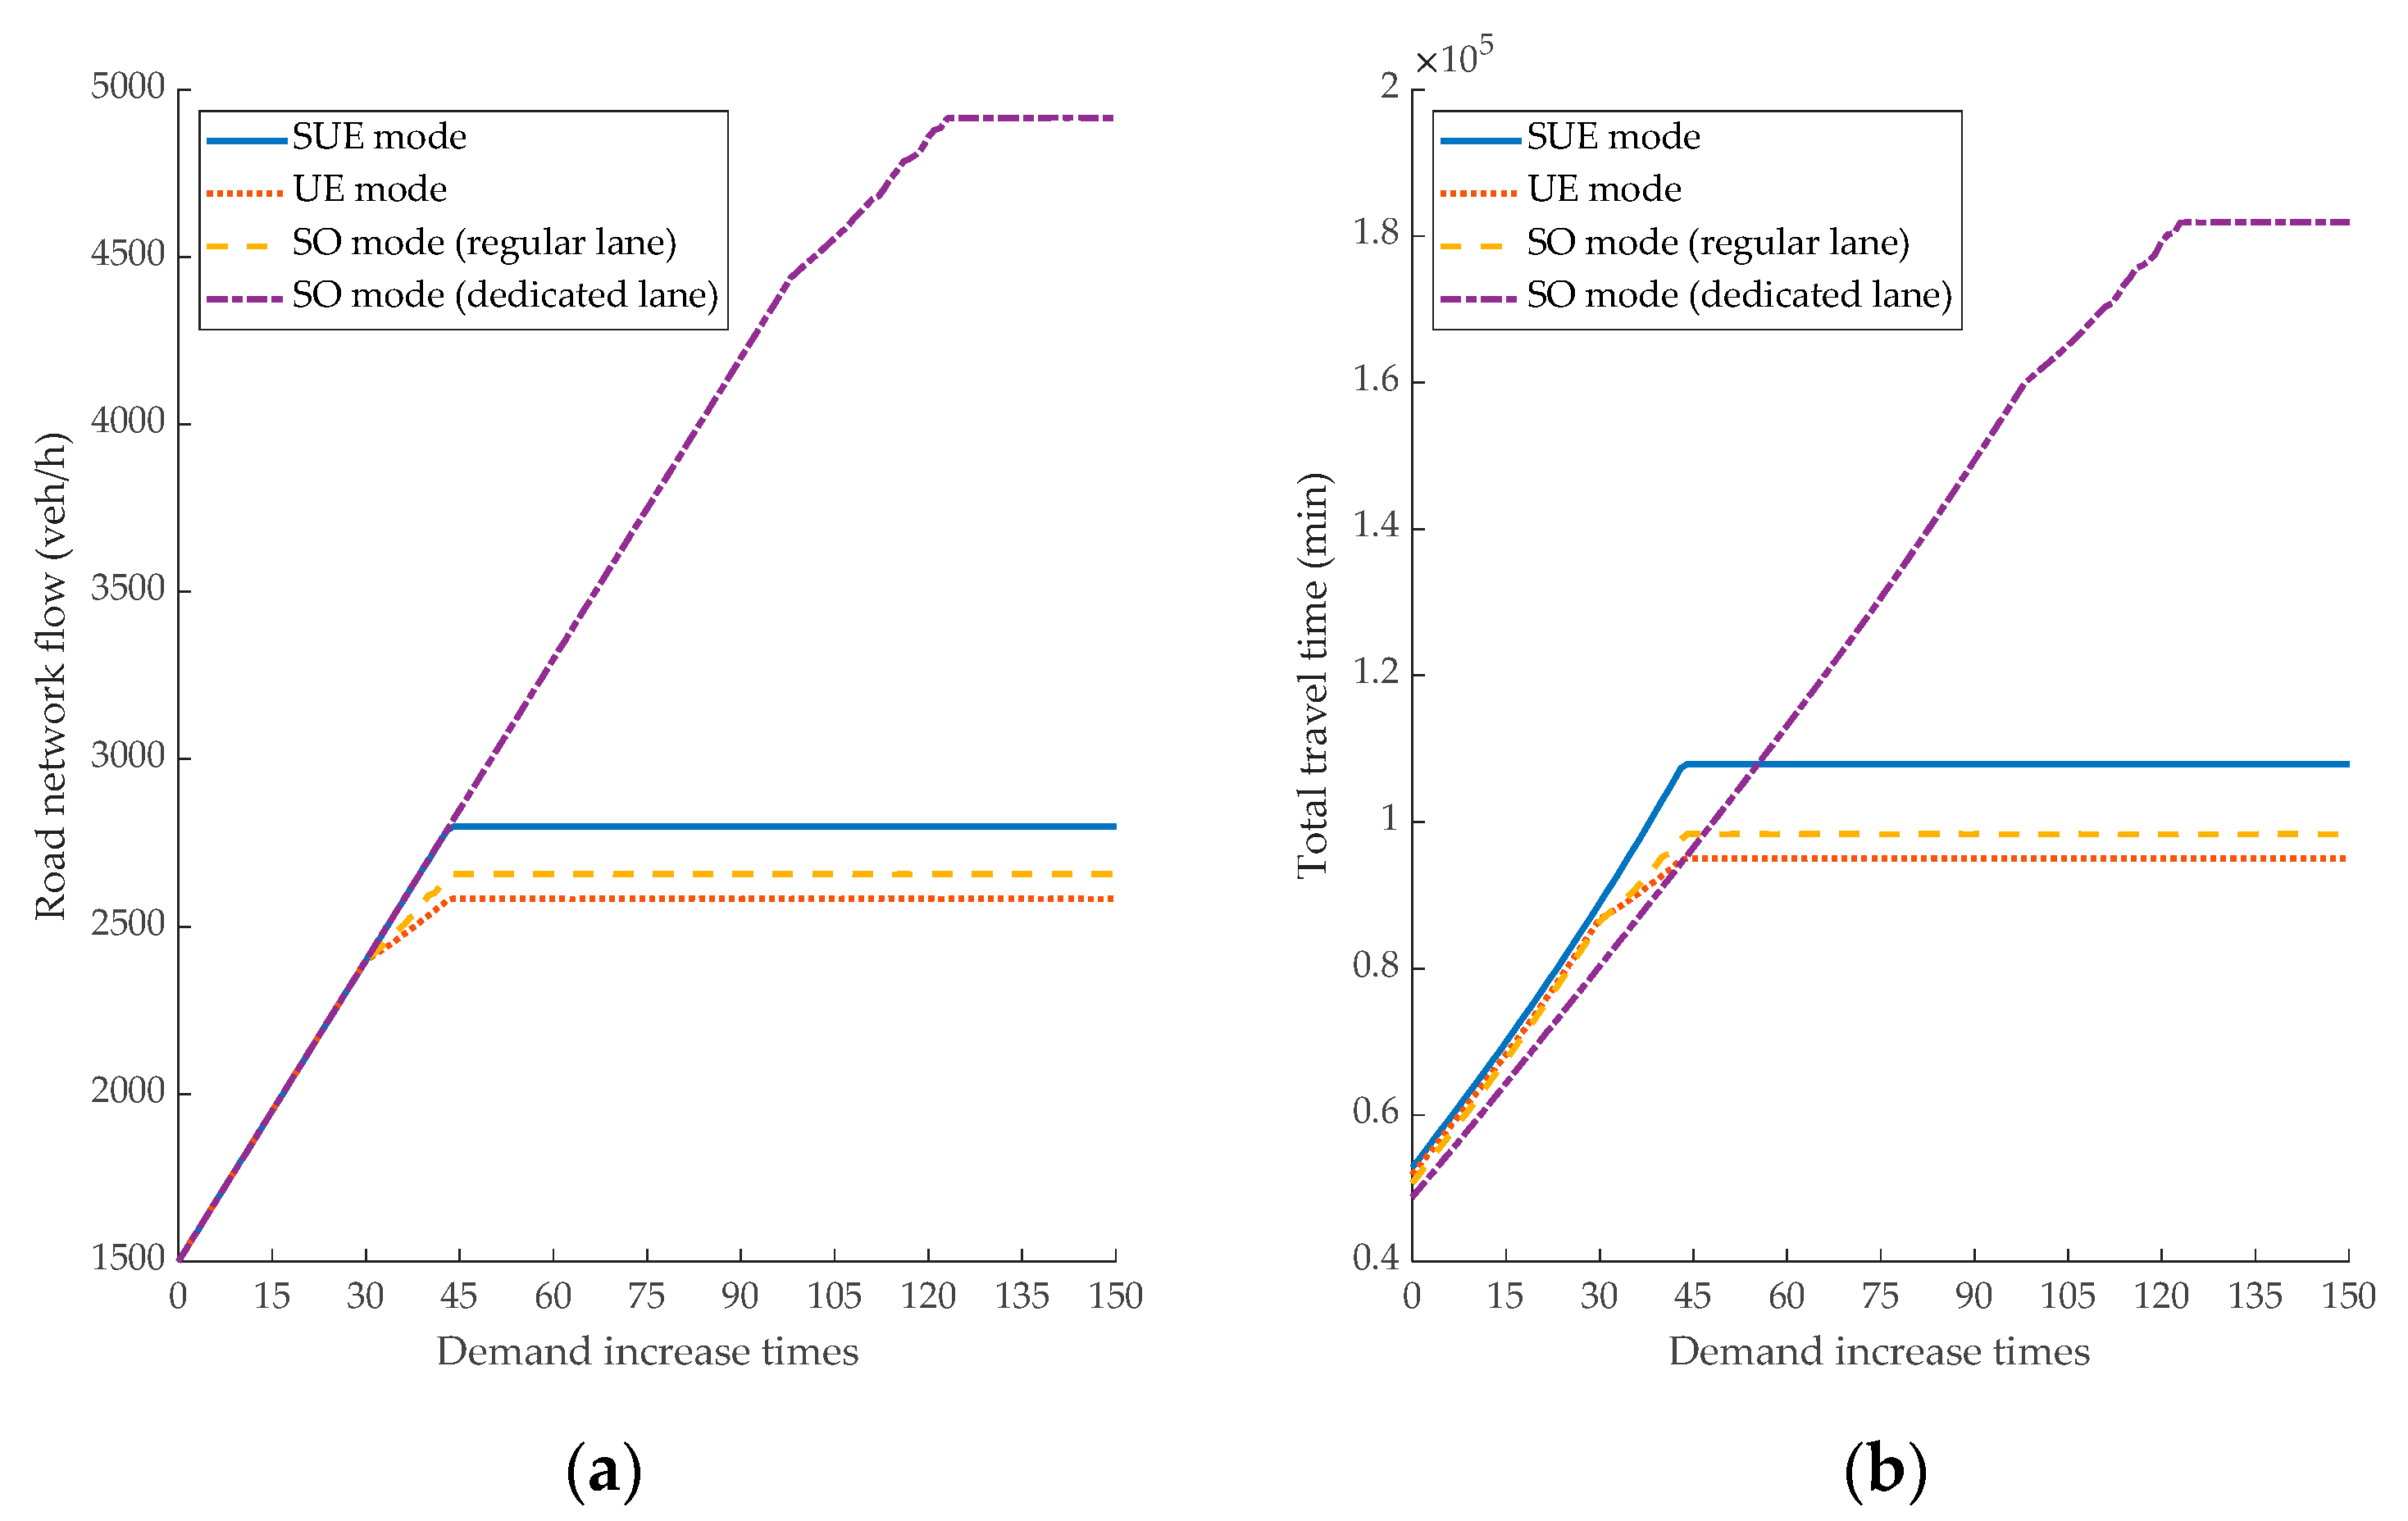
Figure 3a shows the changes of road network flow with increasing demand under different modes. Along with the increasing iteration times, the road network flow will gradually increase until the link flow reaches saturation and then remains stable. However, the maximum network capacity of each mode is different. All travelers choose paths randomly in SUE mode, with traffic distributed on each path, and large road network capacity. All travelers are familiar with the road network and the shortest path is selected to travel in UE mode, while the traffic is over-concentrated and the road network capacity is minimum. In SO mode with regular lanes, all travelers choose paths according to the system optimization principle and accept unified scheduling arrangements; road network capacity has increased compared with UE mode. The capacity of each link in SO mode with dedicated lanes has been improved, thus greatly increasing the capacity of the road network. Figure 3b shows the changes of total travel time with increasing demand under different modes. When the demand is little, the total travel time of SO mode with dedicated lanes is the smallest and SUE mode is the largest, while the SO mode with regular lanes is not significantly different from UE mode. With the increase of demand, total travel time will not stop changing until it reaches the road network capacity at the earliest. Owing to the increase of traffic flow in SO mode with regular lanes, the total travel time is higher than that in UE mode. While the road network capacity in the SUE model is enormous, the total travel time is relatively longer. With the increase of total traffic, the total traffic time in SO mode with dedicated lanes ascends progressively, and remains unchanged after the road network capacity is reached. With the increasing demand, road network flow gradually tends to be stable; then the values of road network capacity and corresponding travel time in various modes are available, as shown in Table 3.
The road network capacity in SUE mode, as indicated in Table 3, is relatively higher. Nevertheless, the maximum average travel time turns out to reduce travel efficiency and increase travel costs. While the road network capacity in UE mode is the lowest, however, the total travel time and average travel time are the smallest, since this mode only selects the shortest path from its own perspective without maximizing resource utilization. Compared with UE mode, SO mode with dedicated lanes increases road network capacity by 773 veh/h, and the average travel time increases by merely 12.6 s. Though the average travel time on dedicated lanes in SO mode does not change, the road network capacity increases by 2259 veh/h in comparison with that on regular lanes, indicating that SO mode with dedicated lanes maximizes the efficiency in utilization of road resources on the basis of saving travel time. When the travel demand is large, there will be excess demand under the constraint of road network capacity. These travelers need to adjust their travel plan or queue up, which makes it difficult to analyze the travel time. Hence, in the subsequent study on the equilibrium of the mixed road network, the travel demand from node 1 to node 9 will be set as 2000 veh/h.

3.3. Market Penetration Analysis

In a mixed mode with various types of vehicles, the change of average travel time with the increase of market penetration is analyzed.

3.3.1. SO-SUE Mixed Mode

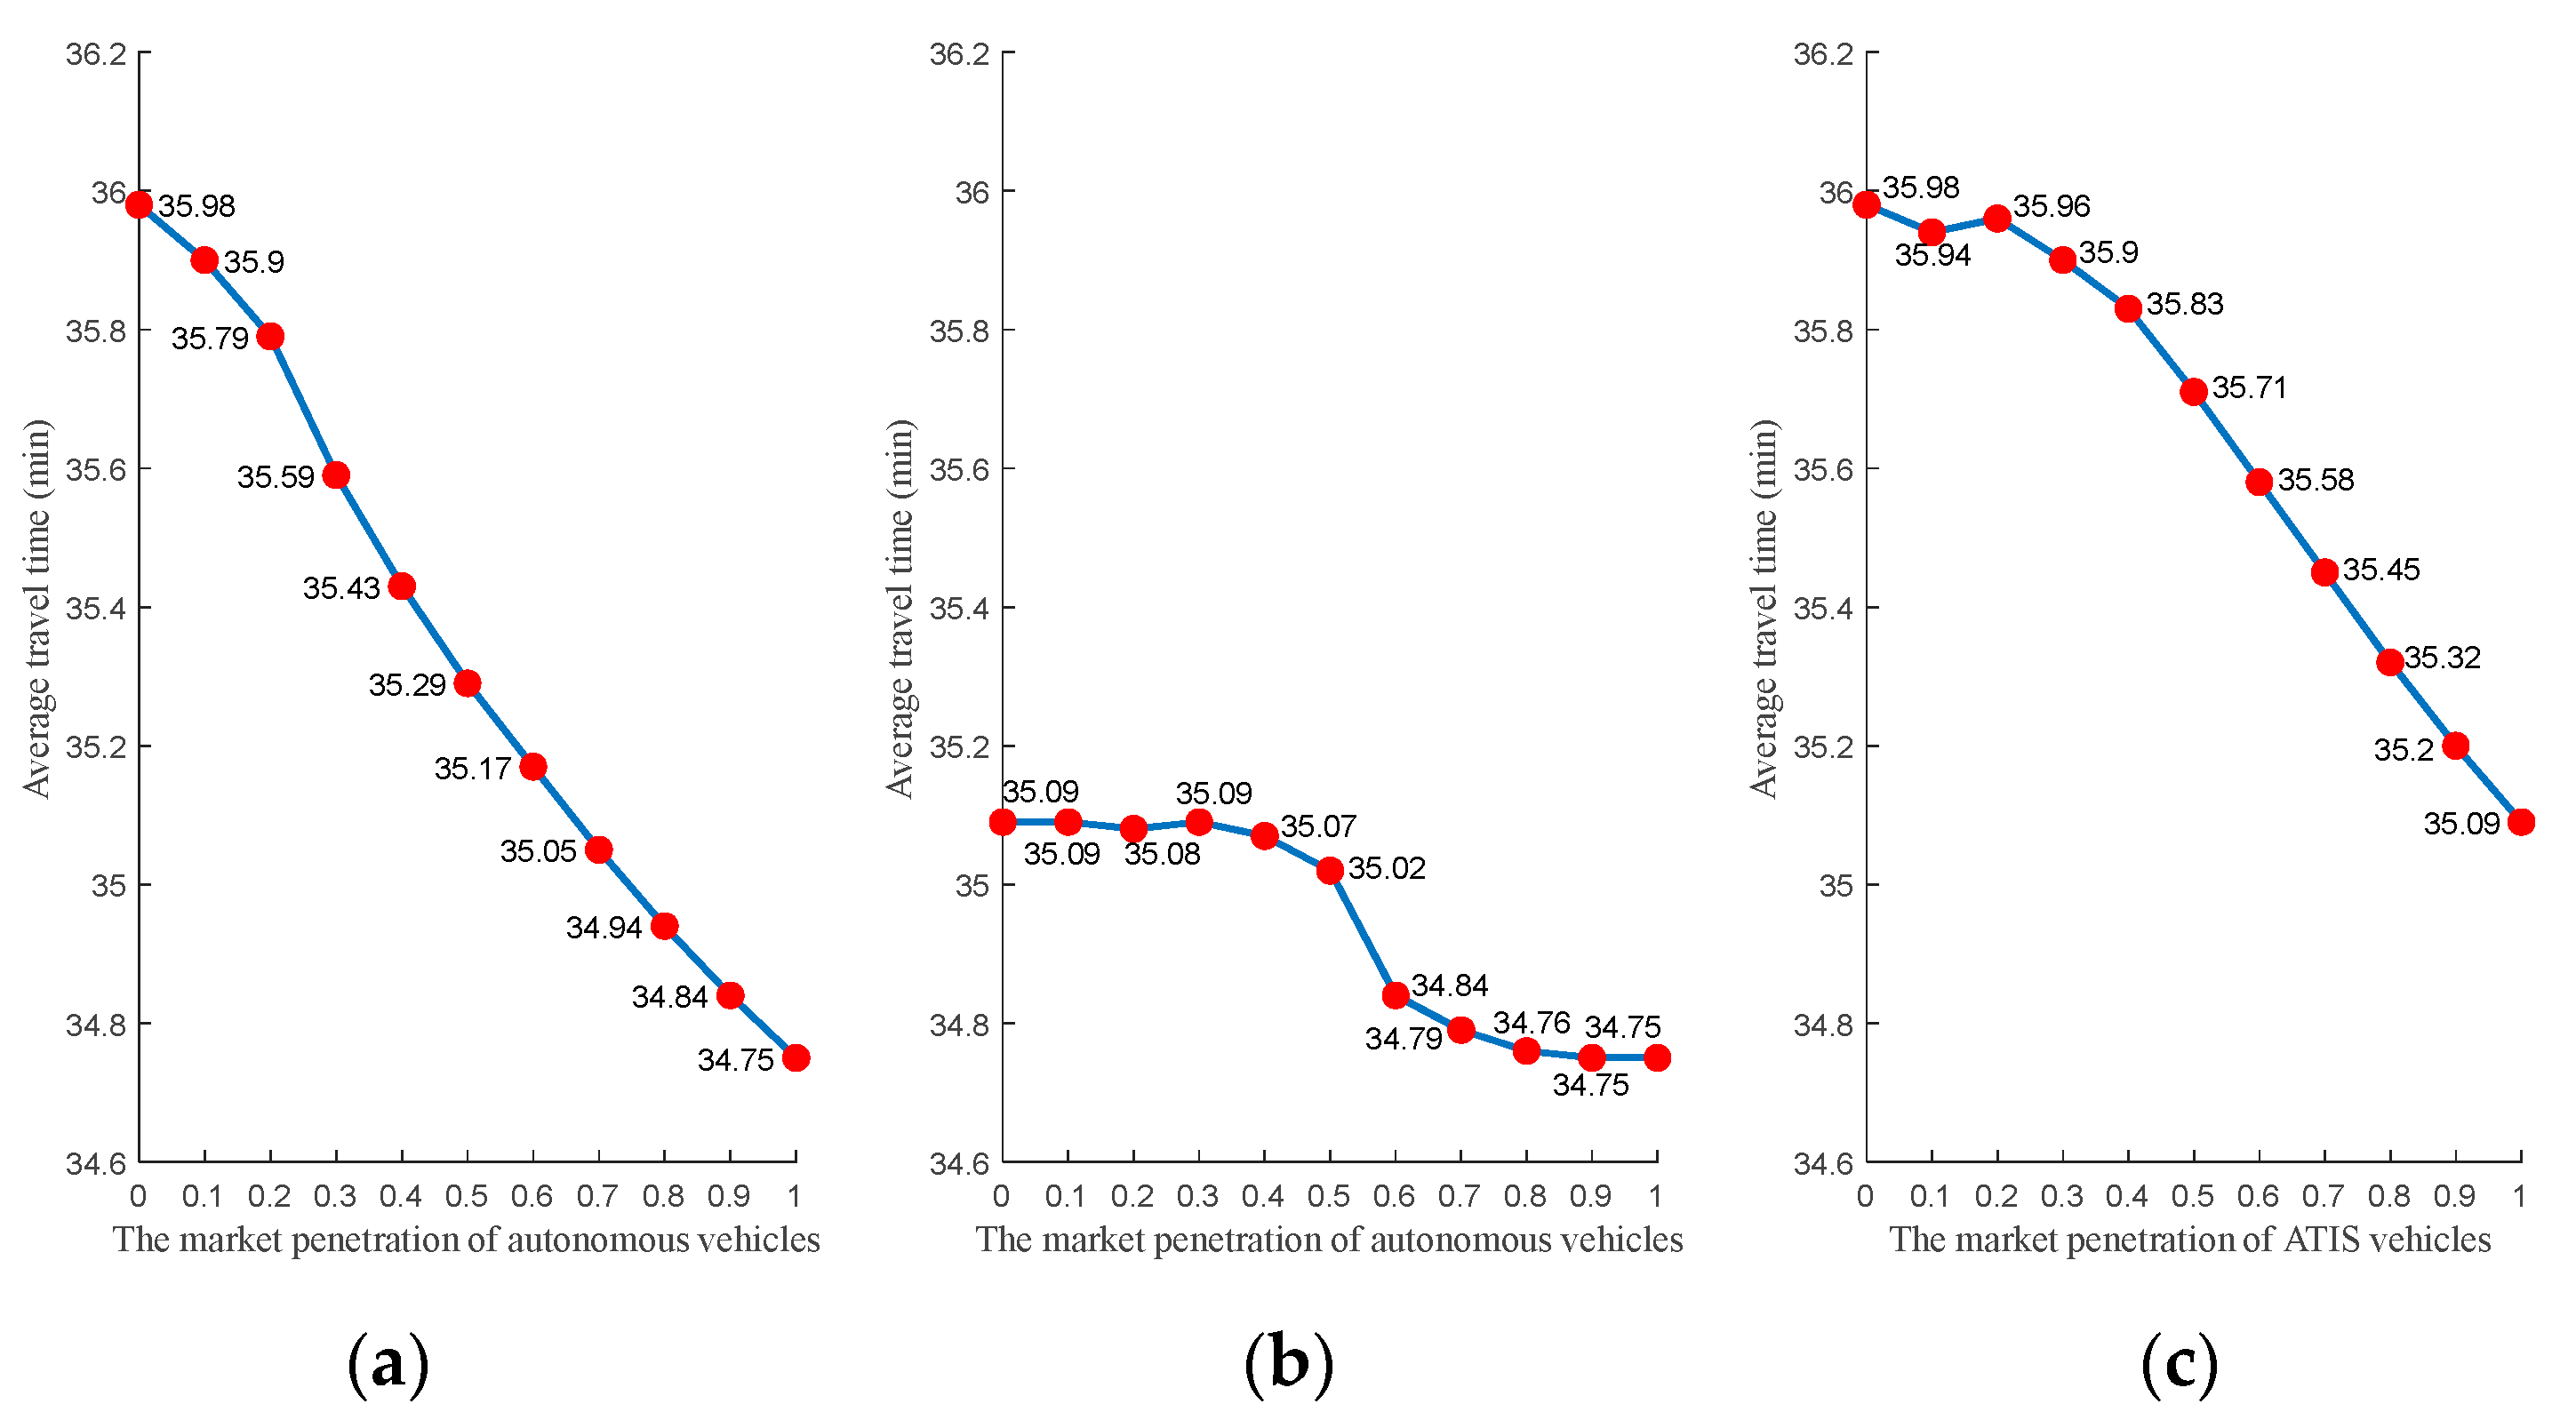
In this mode, autonomous and ordinary vehicles travel on the road network. It can be seen from Figure 4a that, with the increase of α , the randomness of travelers’ path selection decreases, the average travel time gradually decreases, and the decreasing range remains basically unchanged.

3.3.2. SO-UE Mixed Mode

In this mode, autonomous and ATIS vehicles travel on the road network. As can be seen from Figure 4b, when   α   is lower than 0.3, the proportion of autonomous vehicles is smaller, the route selection in SO mode is no different from that in UE mode, and the average travel time basically remains unchanged. After that, with the increase of autonomous vehicles, the path is selected from the global perspective and the total travel time of all travelers is the shortest, which makes the average travel time gradually decrease. When   α   is between 0.5 and 0.6, the average travel time decreases rapidly, indicating that the travel time can be greatly shortened when the ratio of autonomous vehicles reaches this level. When   α   is above 0.6, the average travel time obviously declines, indicating that the improvement effect on average travel time tends to decrease marginally when the market penetration of autonomous vehicles reaches a certain value. When   α   reaches 0.9, the average travel time no longer changes.

3.3.3. UE-SUE Mixed Mode

In this mode, ATIS and ordinary vehicles travel on the road network. It can be seen from Figure 4c that, when   β   is lower than 0.2, most travelers are unfamiliar with the road network and the paths are randomly chosen, fewer travelers choose ATIS vehicles, and the average travel time fluctuates slightly. When it is higher than 0.2, the proportion of ATIS vehicles on the road network becomes larger and larger, and the randomness of travel path selection decreases. Travelers can choose shortcuts according to the traffic conditions on the road sections. In the meantime, ordinary vehicles line up to a certain extent under the influence of ATIS vehicles, leading to a linear decrease in the average travel time.

3.3.4. SO-UE-SUE Mixed Mode

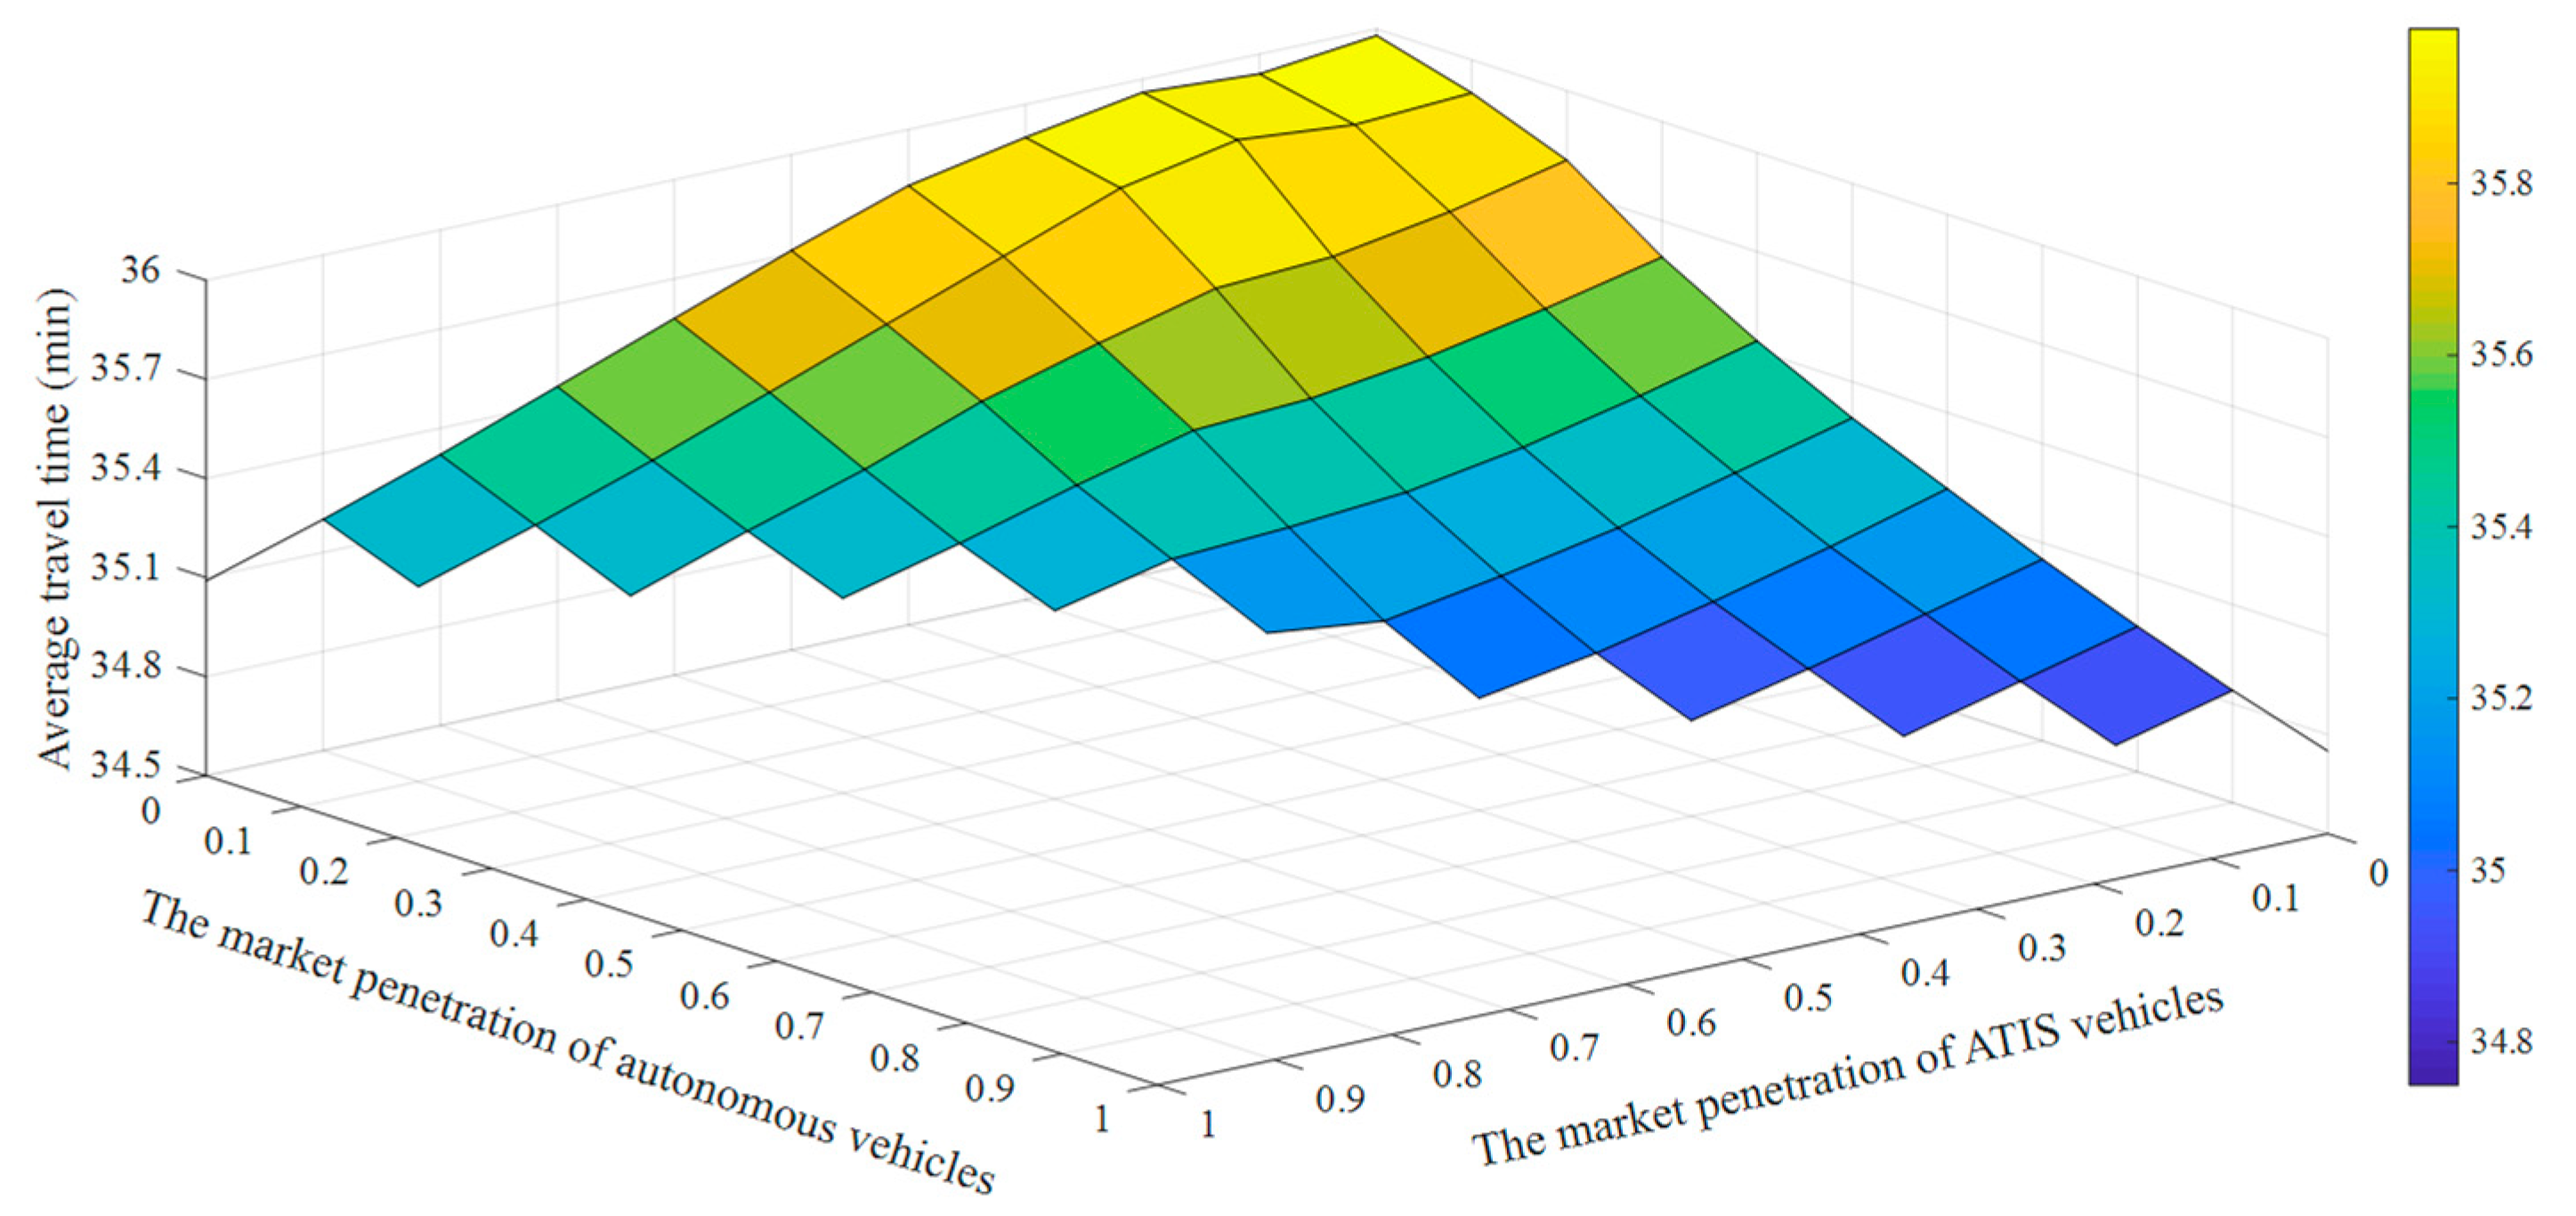
In this mode, autonomous, ATIS and ordinary vehicles travel on the road network. Table 4 and Figure 5 present the simulation results under different market penetration through MATLAB software. As the charts show, the improvement of the market penetration of autonomous and ATIS vehicles can both result in shortening travel time and reducing travel cost, and the increase in the proportion of autonomous vehicles obviously helps to reduce the average travel time. However, it takes a long time to popularize autonomous vehicles. Particularly during the introduction stage of automated driving, it needs running-in alongside use of other sorts of vehicles. Plus, only a relatively small proportion of autonomous vehicles are launched. Moreover, real-time traffic information is accessible to travelers on a wide variety of info platforms, which is akin to the shortcut option for ATIS vehicles. It has been calculated that the average travel time for different market penetration rates is 35.32 min. When   α = 0.2 , β = 0.6 , the three types of vehicles converge on the road network, and the average travel time is lower than the mean. Hence, the market penetration of autonomous and ATIS vehicles are evaluated herein as 0.2 and 0.6, respectively.

3.4. Road Network Equilibrium Analysis

3.4.1. SUE Mode Analysis

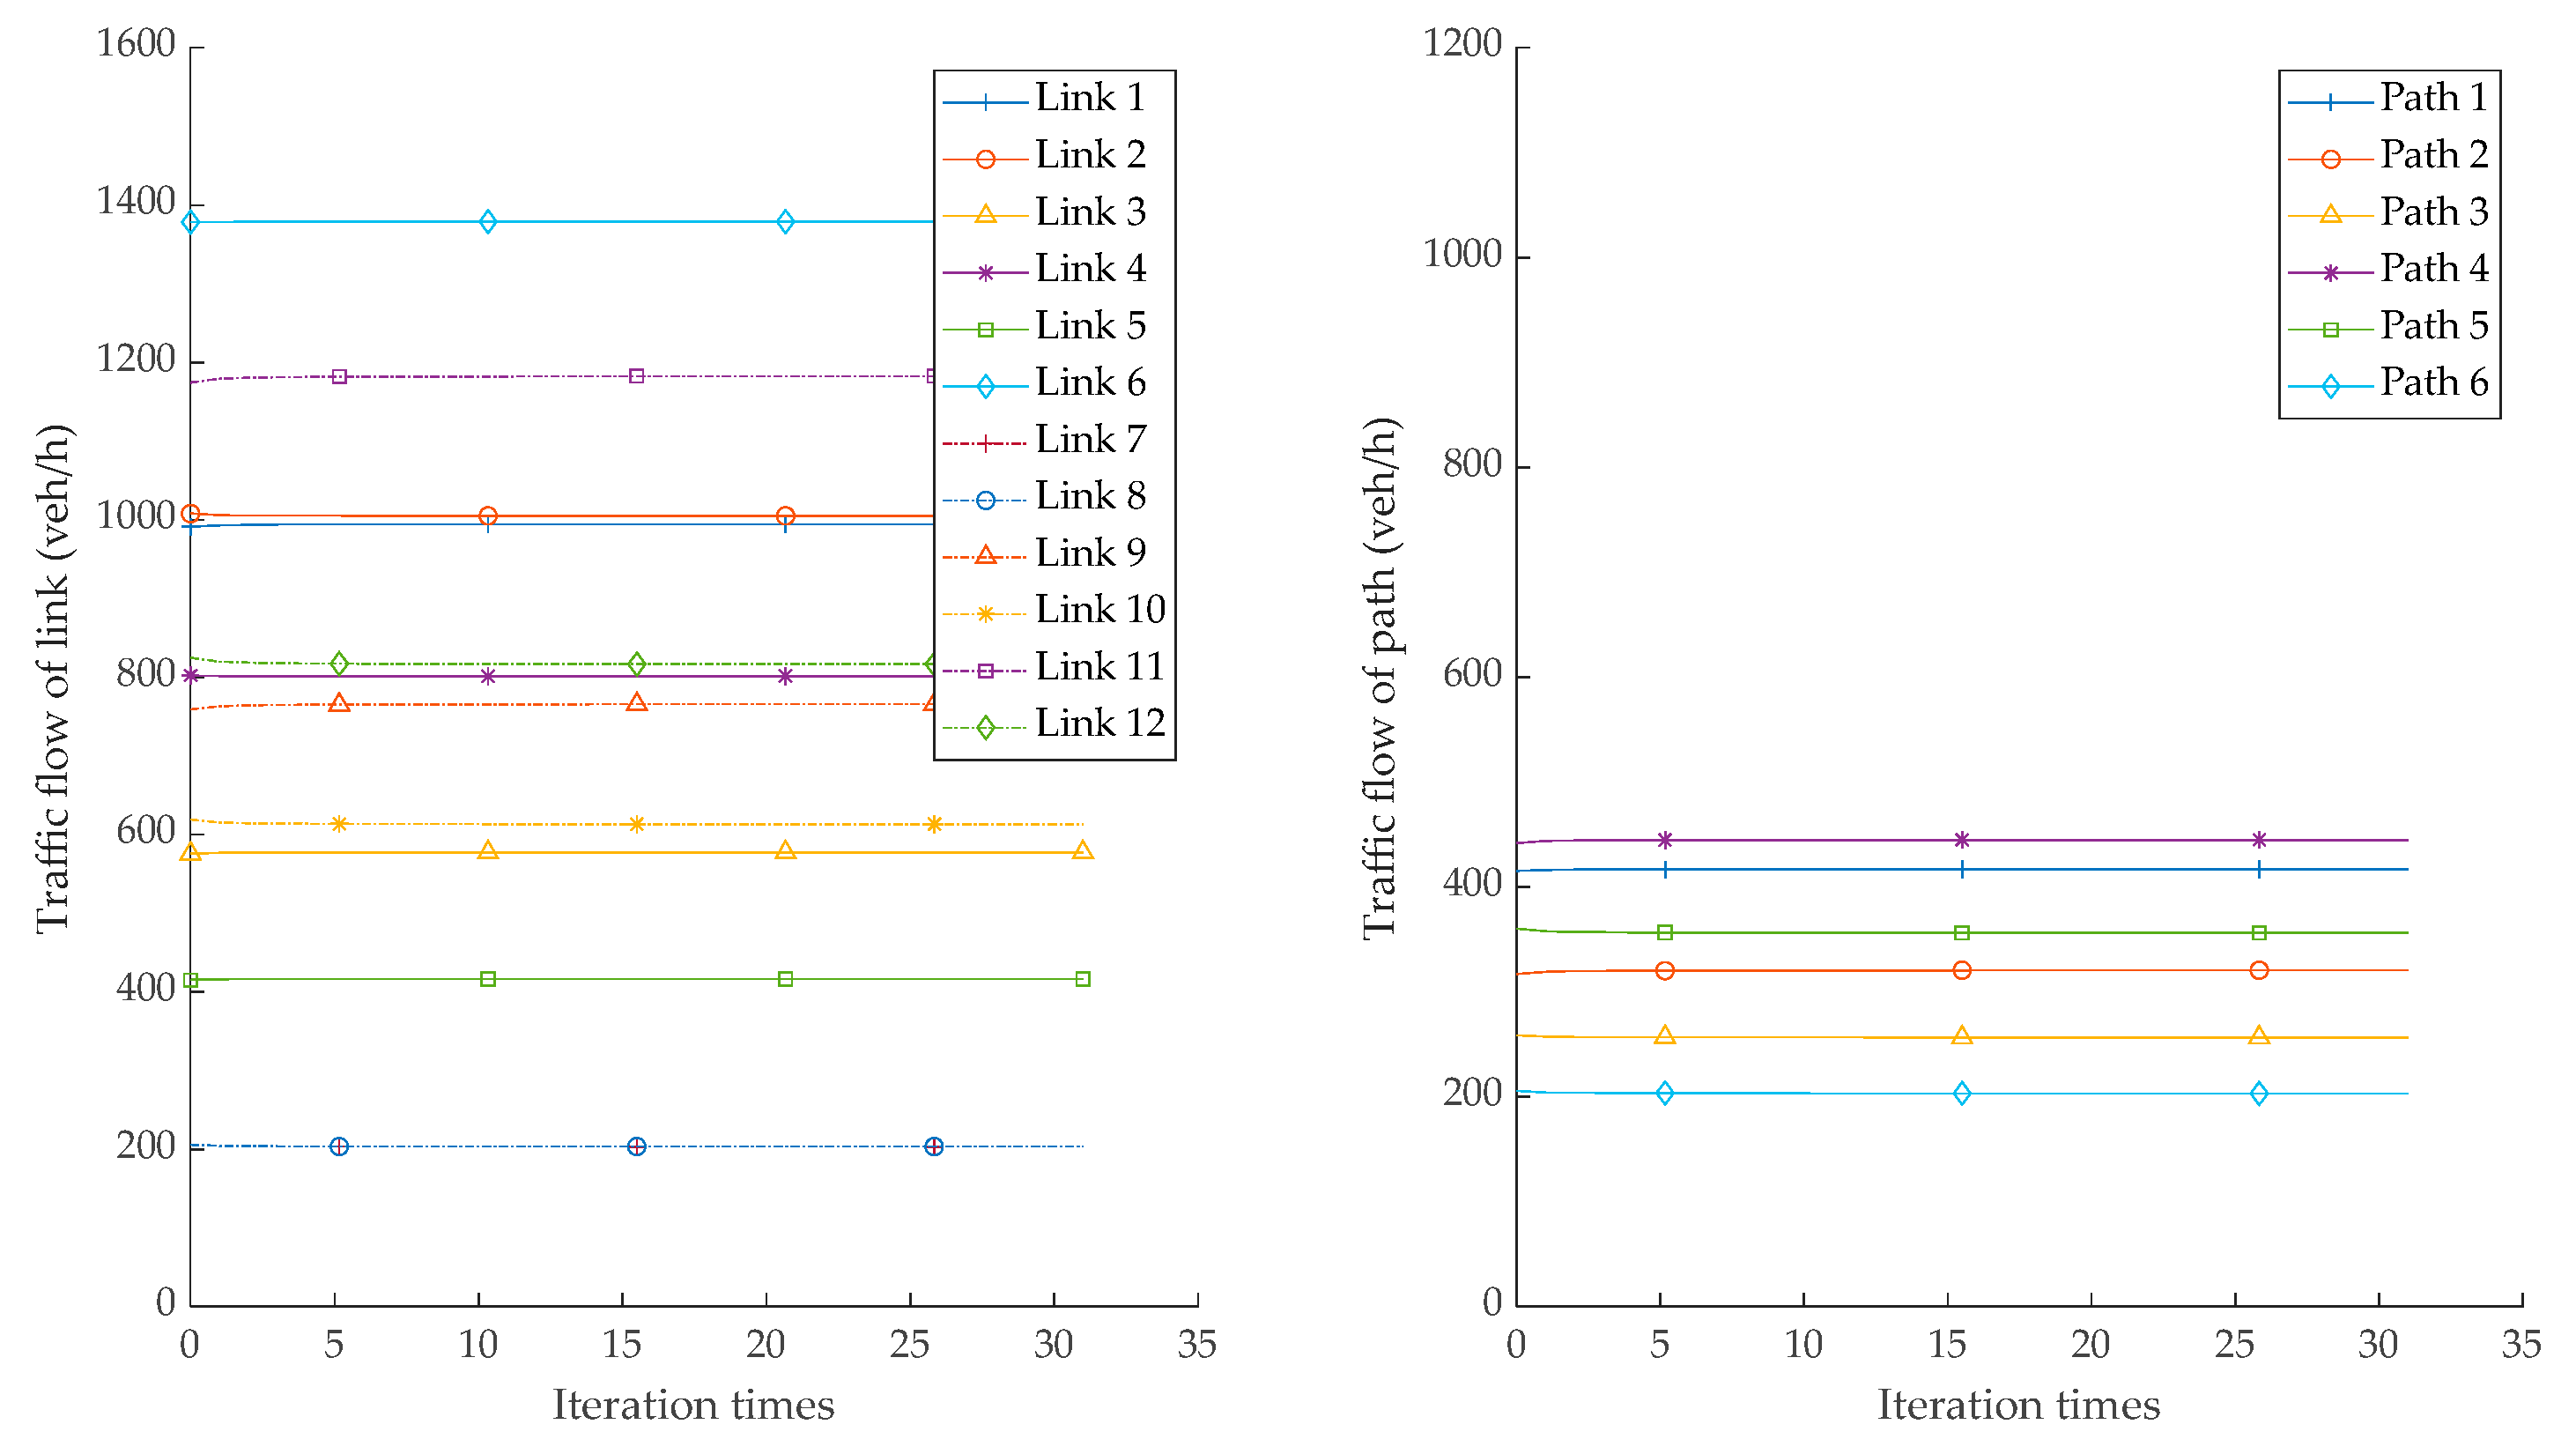
When all vehicles on the road network are ordinary vehicles, it is the stochastic user optimal mode. As shown in Figure 6, the evolution process of link flow and path flow rapidly reaches a stable state with the increase of iteration times. The relevant data of each link and path after the stabilization of the SUE mode are stated in Table 5 and Table 6. As can be seen from Table 5, in SUE mode, traffic flow is distributed to all links, and the saturation of each link is between 0.15 and 0.84. The saturation of links 1, 6, 9 and 11 is above 0.7, and that of links 7 and 8 is below 0.2. It can be seen from Table 6 that traffic is distributed on all paths in SUE mode, and the travel time of paths 3 and 6 is longer.

3.4.2. UE Mode Analysis

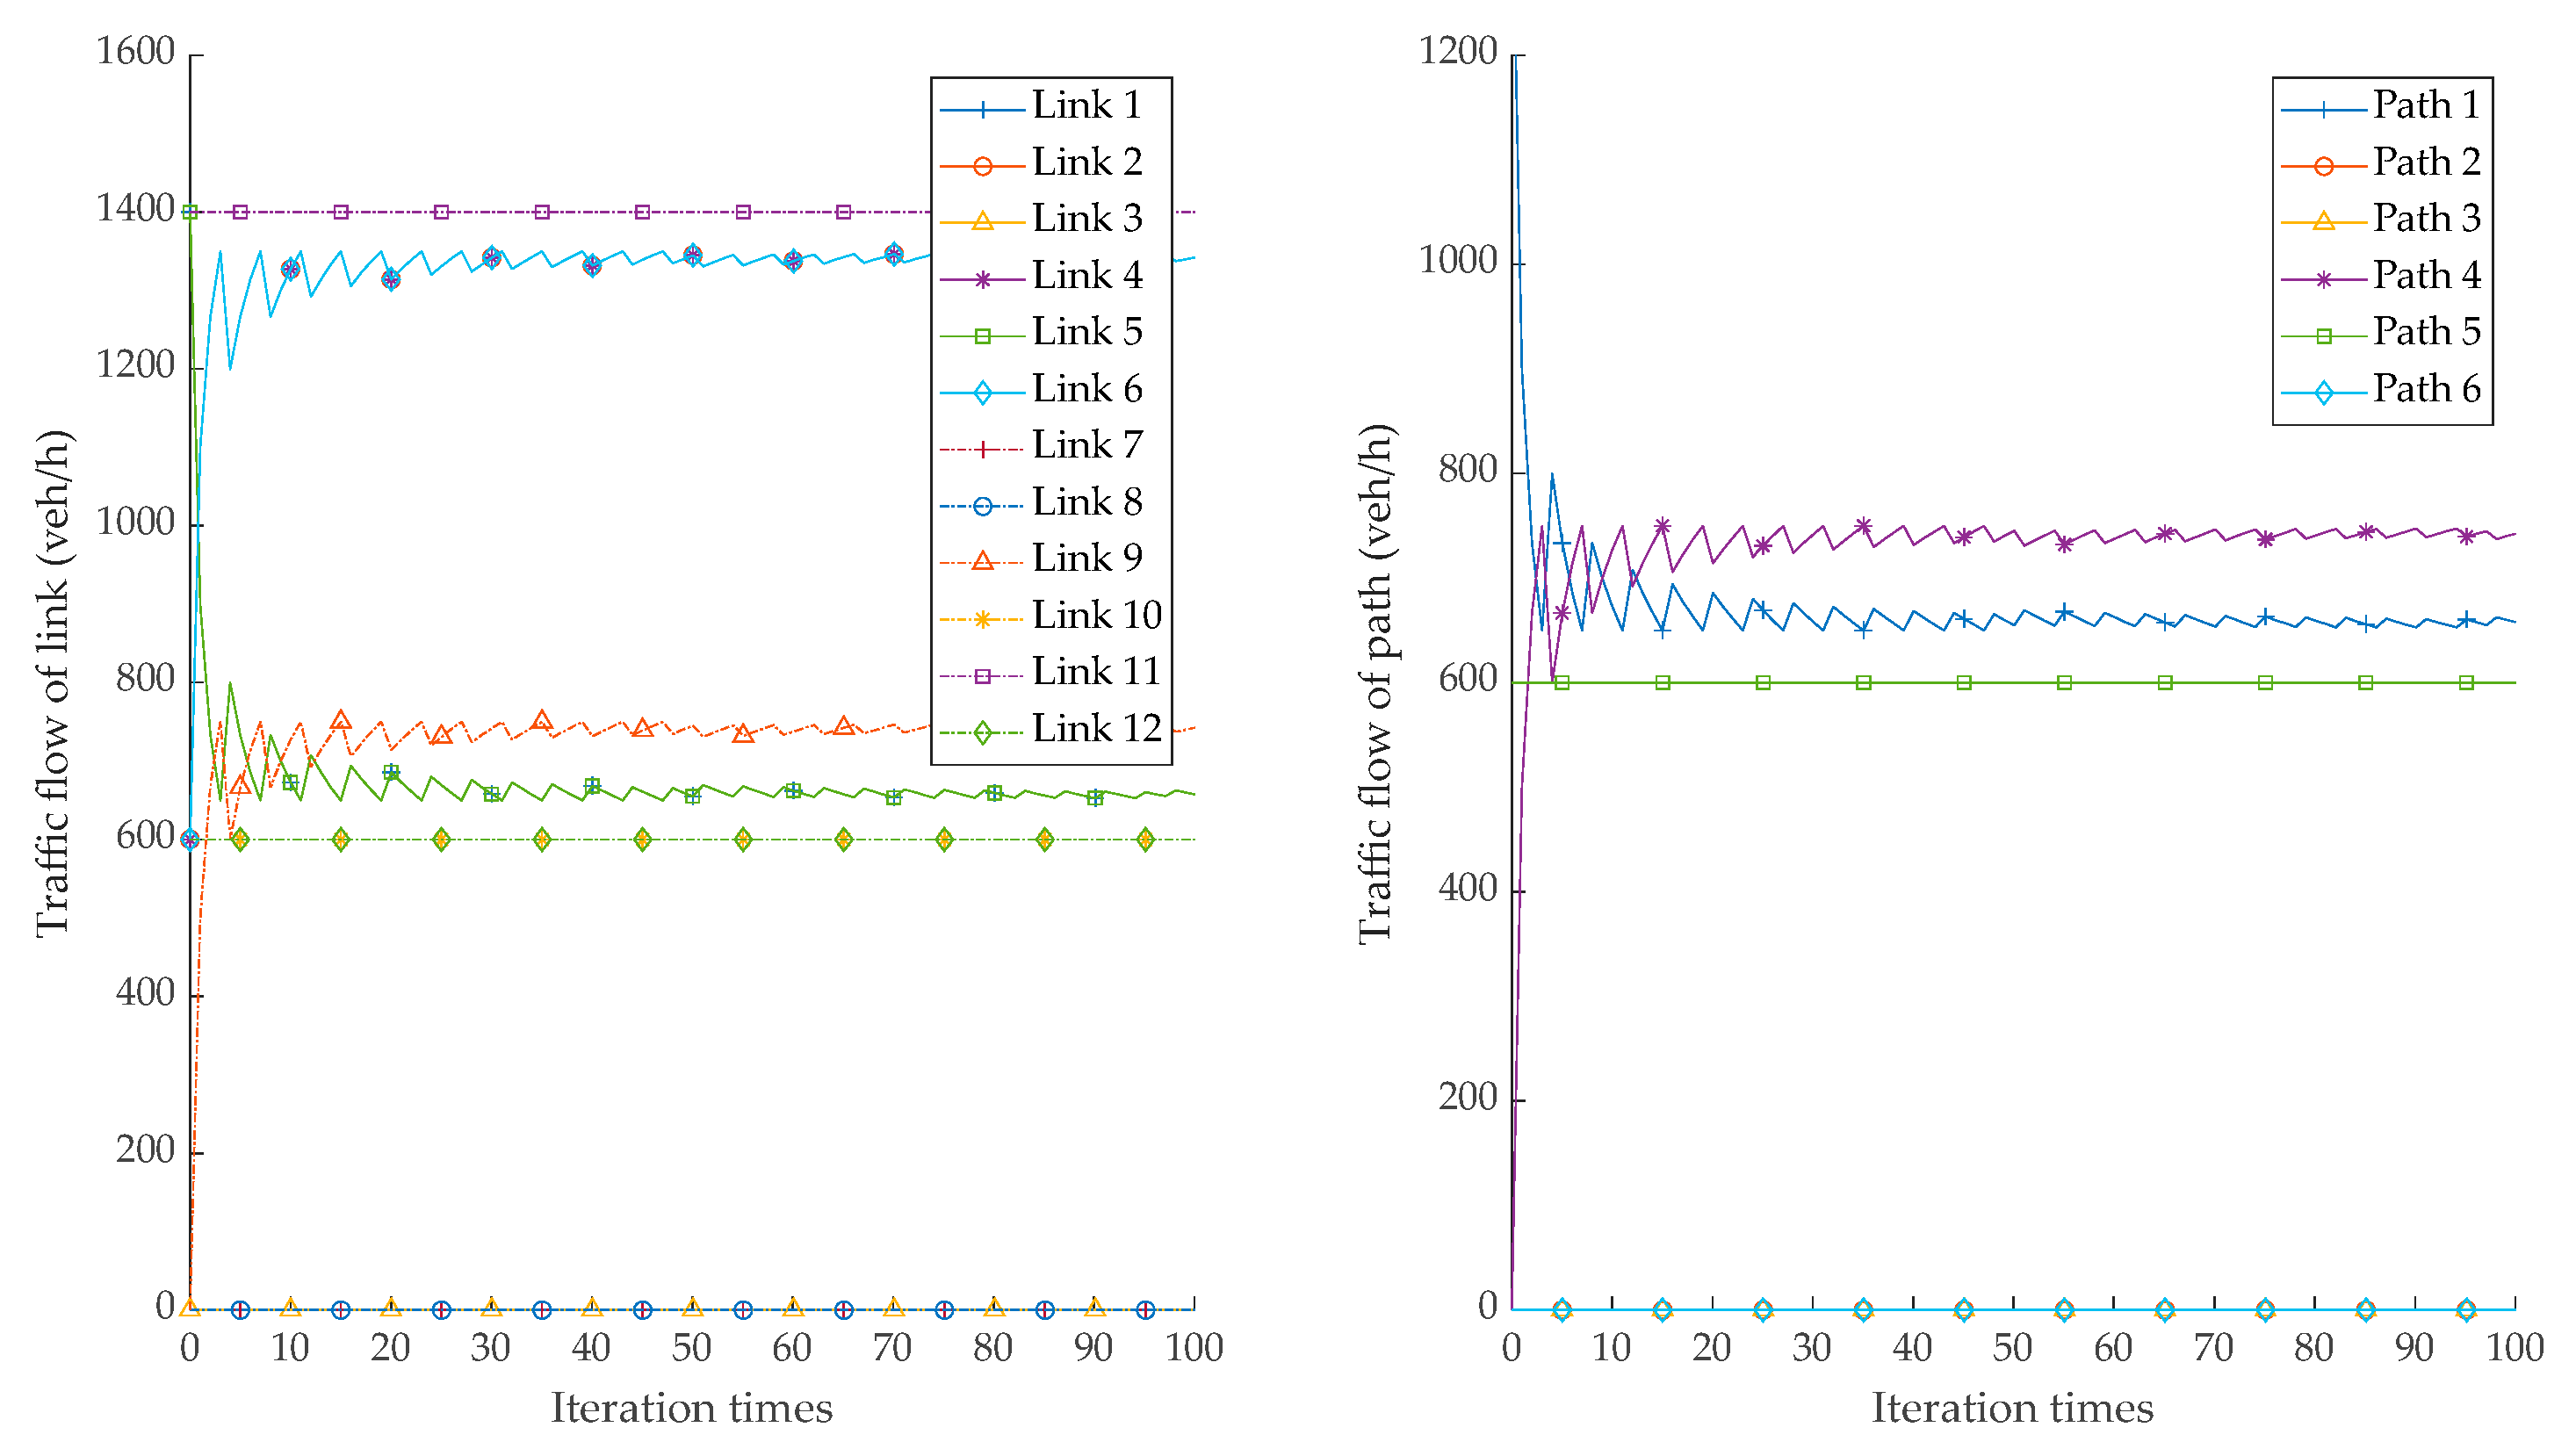
The user optimal mode is that all vehicles on the road network are installed with ATIS. As illustrated in Figure 7, the evolution process of link flow and path flow gradually reaches a stable state with the increase of iterations. The relevant data of each link and path after the stabilization of UE mode are shown in Table 7 and Table 8. As can be seen from Table 7, the saturation ratio of links 2, 4, 6, 9 and 11 is above 0.7, and that of link 11 reaches 1, resulting in congestion. Nevertheless, no traffic flow is distributed to links 3, 7 and 8, so that the road sources are wasted. It can be seen from Table 8 that the traffic is distributed in paths 1, 4, and 5, and the time costs of paths 1 and 4 are equal and minimum. Affected by link capacity limitation, the second short path is selected for traffic distribution when link 11 reaches the capacity.

3.4.3. SO Mode Analysis

  • Regular Lanes
The system optimal mode is that all vehicles on the road network are autonomous. Assuming that vehicles are running on regular lanes, the evolution process of link and path flow, as shown in Figure 8, will gradually reach a stable state with the increase of iterations. The relevant data of each link and path after the stabilization of SO mode are shown in Table 9 and Table 10. As can be seen from Table 9, there is still no flow distribution on links 3, 7 and 8, but the saturation of links 2, 4, 6, 9 and 11 all decrease to varying degrees. The saturation of link 9 drops from 0.74 to 0.42, with a decrease of 43.04%, and that of link 11 drops from 1.00 to 0.88, with a decrease of 11.66%. These data indicate that the conditions of link have been significantly improved. It can be seen from Table 10 that the traffic is distributed in paths 1, 4 and 5, among which the traffic in paths 1 and 5 is large, and the travel time of path 4 is the smallest, but the traffic distribution is relatively small.
  • Dedicated Lanes
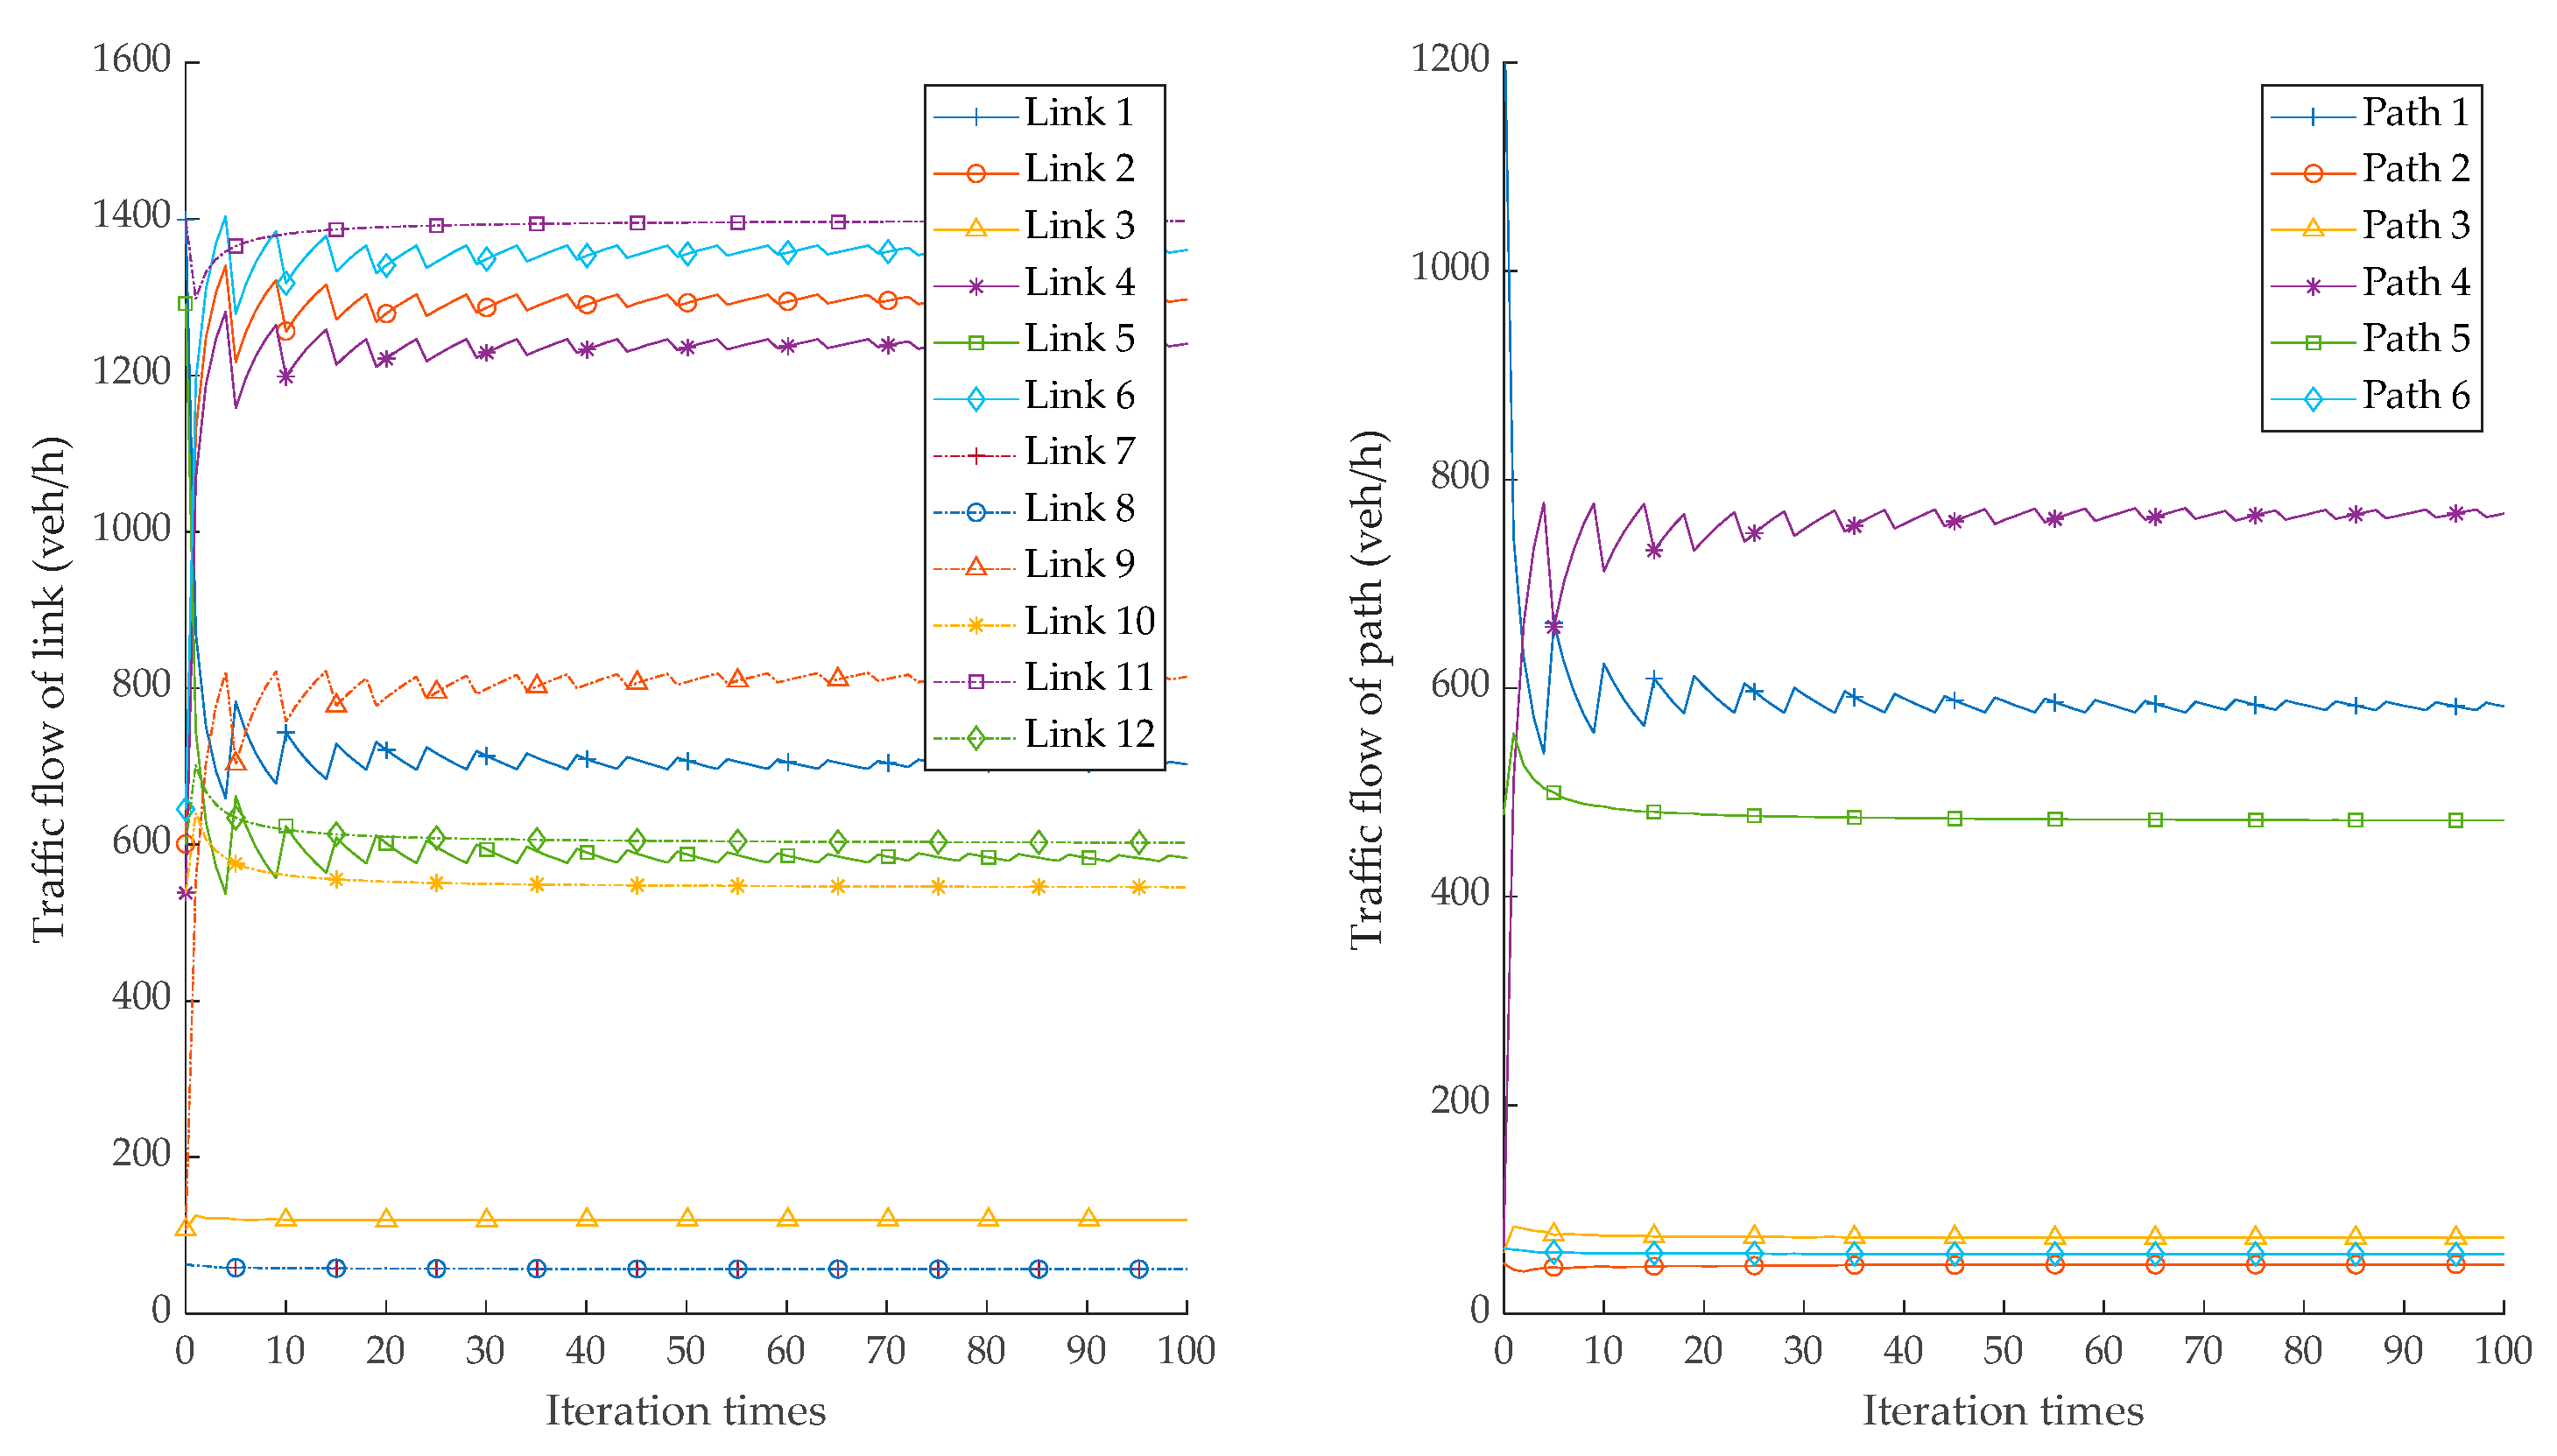
It is assumed that all vehicles on the road network are autonomous and drive on dedicated lanes, which is also the system optimal mode. As shown in Figure 9, the evolution process of link flow and path flow will gradually reach a stable state with the increase of iterations. The relevant data of each link and path after the stabilization of SO mode are shown in Table 11 and Table 12. As can be seen from Table 11, after the dedicated lanes of autonomous vehicles are set, the traffic is mainly distributed in links 2, 4, 6, 9 and 11, where the saturation ratio of link 9 and link 11 is above 0.6, and the saturation ratio of other links is below 0.5, so the vehicles run smoothly. As can be seen from Table 12, path 4 is the shortest path with the highest probability of selection. Path 1 and path 5 also have certain flow distribution.

3.4.4. Mixed Equalization Flow Analysis

The mixed mode is that the vehicles on the road network are composed of autonomous, ATIS and ordinary vehicles. Based on the research in the previous subsection, the market penetration of autonomous vehicles and ATIS vehicles are set to be 0.2 and 0.6, respectively. The evolution process of link and path flow, as shown in Figure 10, will gradually reach a stable state with the increase of iterations. The relevant data of each link and path after the stabilization of mixed mode are shown in Table 13 and Table 14. It can be seen from Table 13 that flow is distributed on all links, among which 5 links have a saturation ratio of above 0.7, 4 links are between 0.4 and 0.5, and 3 links are below 0.2. Table 14 shows that the traffic flow is mainly distributed in paths 1, 4 and 5, and the traffic of other paths is below 100 veh/h.

3.5. Discussion

3.5.1. Analysis of Results in Road Network Capacity

The maximum reserve capacity of the road network, to a large extent, is limited by the link capacity. Combined with the simulation results of different modes obtained above, the discussion and comparison are as follows:
  • When regular lanes are adopted, there is no distinct difference between the road network capacity of different modes. Specifically, the SUE mode has the largest road network capacity but the maximum travel time because of the random distribution of traffic flow in all paths. The flow in UE mode is concentrated on the shortest path, with the minimum travel time, but the road network capacity is the smallest. The road network capacity and travel time of SO mode are in a moderate state.
  • The capacity of a road network is significantly increased due to the improvement of the link capacity when dedicated lanes are adopted. In the actual road network planning, with the continuous use of autonomous vehicles, dedicated lanes can be set to increase the road network capacity and alleviate traffic congestion.

3.5.2. Analysis of Results in Market Penetration

It is necessary to analyze the market penetration of different types of vehicles in the heterogeneous traffic flow environment. Combined with the simulation results of different modes obtained above, the discussion and comparison are as follows:
  • If only two types of vehicles are mixed in the road network, the impact of changes in market penetration on average travel time is different. Among them, in SO-SUE mode and UE-SUE mode, with the increase of market penetration, the proportion of ordinary vehicles in the road network gradually decreases, making the average travel time significantly shorter, indicating that in this context, ordinary vehicles can be encouraged to be replaced by autonomous vehicles or ATIS vehicles. In SO-UE mode, with the increase of market penetration of autonomous vehicles, the average travel time also decreases, but it is not obvious, which means that it is not necessary to excessively pursue the improvement of market penetration of autonomous vehicles against this backdrop.
  • When there are three types of vehicles in the road network, increasing the market penetration of autonomous vehicles and ATIS vehicles can shorten the travel time, and the former effect is more obvious, indicating that the development of autonomous vehicles should be promoted.

3.5.3. Analysis of Results in Road Network Equilibrium

With the increase of iterations, the traffic flow in both single mode and mixed mode can quickly converge to a stable state. Table 15 shows total travel time after stabilization under different modes. Combined with the simulation results of different modes obtained above, the discussion and comparison are as follows:
  • The total travel time in SUE mode is the maximum. When it comes to traffic flow distribution by the stochastic user optimization principle, road sources can be utilized by travelers in consideration of random factors, equally distributed flow on each chosen section, moderate degree of saturation; however, the incorrect options made by some travelers lead to an increase in the travel cost.
  • When the principle of user optimization is adopted for traffic flow assignment, all travelers can fully grasp the road network situation and accurately identify the shortest path, and finally achieve UE equilibrium state, but the traffic is too concentrated, and some paths are not effectively utilized.
  • When the principle of system optimization is adopted for traffic flow assignment, most of the traffic flow is not allocated to the shortest path, resulting in an increase in the time cost of some travelers. However, from a global perspective, the total travel cost can be minimized, and the result is better than SUE and UE modes.
  • Further research on SO mode shows that when the dedicated lanes are adopted, there is a substantial increase in the traffic capacity and a drop in the traffic time on all the paths. In this case, the total travel time is further reduced. With the application of autonomous vehicles, setting dedicated lanes can bring positive benefits.
  • The SUE-UE-SO mode is based on the initial period of autonomous vehicles; the total travel time is reduced but this is not obvious. From the perspective of development, different types of traffic flow will choose paths according to corresponding principles, which not only improves the efficiency of using road resources but also reduces travel cost as much as possible. With the continuous improvement of informatization, the operation mode of mixed traffic flow in the future will be more in line with the actual situation, and achieve greater benefits with the continuous popularity of autonomous vehicles.

4. Conclusions

This paper takes the traffic flow composed of autonomous vehicles, advanced travel information system (ATIS) vehicles and ordinary vehicles as the research object. Different types of vehicles follow the corresponding path selection principles to allocate the traffic demand. The research focuses on investigating the impacts of heterogeneous traffic flow conditions on road network capacity and the travel time, aiming to promote the development of autonomous vehicles, and provide the theoretical basis for future urban traffic planning.
To determine road network capacity in different modes, to analyze the impact of market permeability on travel time, and to research the state characteristics of single equilibrium flow and mixed equilibrium flow, this paper considers the path choice behavior of different types of vehicles to discuss the characteristics of traffic flow. The bi-level programming model with the maximum travel demand and the minimum total travel time as the upper and lower objectives is constructed, and the incremental allocation method combined with the method of successive averages algorithm is used to solve the model.
This paper proposes the concept of mixed equilibrium mode for the heterogeneous traffic flow of autonomous and ordinary vehicles; the assignment model of SO-UE-SUE mixed traffic with capacity limitation is constructed, which makes the assignment result more reasonable. The simple road network is used to compare and analyze the road network capacity and travel time under different models. It shows that the road network capacity can be improved as much as possible on the basis of saving travel time under SO mode, especially when dedicated lanes for autonomous vehicles are adopted. With the increase of market penetration of autonomous vehicles and ATIS vehicles, the travel time decreases gradually, and the former have a greater impact. In addition, by analyzing the market penetration of different types of vehicles in mixed traffic flow, the appropriate placement ratio of autonomous vehicles in the initiation period is determined.
In this research, dedicated lanes for autonomous vehicles are only considered in the SO mode. As a matter of fact, dedicated lanes can be set up when the proportion of autonomous vehicles reaches a certain level. Therefore, appropriately dedicated lane laying will be determined according to the market penetration of autonomous vehicles in the future. In addition, the model proposed in this paper is based on the minimum travel time to select the path, only considering the convenience preference of travelers. Some travelers, in reality, will take comfort into account in path options. Thus, how to satisfy personalized travel demand for the sake of rapidity and comfort turns out to be a major research orientation in the future.

Author Contributions

Conceptualization, Z.Z. and J.Y.; methodology, J.C. and S.Z.; software, Z.Z.; validation, J.Y. and Q.L.; formal analysis, Z.Z. and L.Z.; investigation, J.C. and L.Z.; resources, Z.Z. and J.Y.; data curation, S.Z.; writing—original draft preparation, Z.Z.; writing—review and editing, Z.Z. and J.Y.; visualization, Z.Z. and S.Z.; supervision, Q.L. and J.Y.; project administration, Z.Z. and J.Y.; funding acquisition, Z.Z. and J.Y. All authors have read and agreed to the published version of the manuscript.

Funding

This research was funded by National Natural Science Foundation of China (Grant No. 51578080), Scientific Research Foundation of Hunan Provincial Education Department (Grant No. 20C0375, No. 20A093), Postgraduate Scientific Research Innovation Project of Hunan Province (Grant No. CX20210749), Hunan Provincial Natural Science Foundation of China (Grant No. 2021JJ40025), Open Fund of Engineering Research Center of Catastrophic Prophylaxis and Treatment of Road & Traffic Safety of Ministry of Education (Grant No. kfj190406).

Institutional Review Board Statement

Not applicable.

Informed Consent Statement

Not applicable.

Data Availability Statement

The data presented in this study are available on request from the corresponding author.

Conflicts of Interest

The authors declare no conflict of interest.

Nomenclature

NotationsExplanation
N set of nodes
A set of links
K set of paths
W set of origin-destination (OD) pairs
R set of origin nodes
S set of destination nodes
a index of link, a A
k index of path, k K
q r s travel demand between OD pair ( r , s )
q ˜ r s travel demand of ordinary vehicles between OD pair ( r , s )
q ^ r s travel demand of ATIS vehicles between OD pair ( r , s )
q ¯ r s travel demand of autonomous vehicles between OD pair ( r , s )
x a traffic flow on link a
x ˜ a traffic flow of ordinary vehicles on link a
x ^ a traffic flow of ATIS vehicles on link a
x ¯ a traffic flow of autonomous vehicles on link a
t a 0 free flow travel time on link a
t a ( x a ) travel time on link a corresponding to the traffic flow x a
t a ( x ˜ a ) travel time of ordinary vehicles on link a corresponding to the traffic flow x ˜ a
t a ( x ^ a ) travel time of ATIS vehicles on link a corresponding to the traffic flow x ^ a
t a ( x ¯ a ) travel time of autonomous vehicles on link a corresponding to the traffic flow x ¯ a
f k r s traffic flow on path k between OD pair ( r , s )
f ˜ k r s traffic flow of ordinary vehicles on path k between OD pair ( r , s )
f ^ k r s traffic flow of ATIS vehicles on path k between OD pair ( r , s )
f ¯ k r s traffic flow of autonomous vehicles on path k between OD pair ( r , s )
μ multiplier of travel demand growth between OD pair ( r , s )
C a capacity of link a on regular lanes
C a capacity of link a on dedicated lanes
θ level of information quality, which represents the familiarity of the vehicle driver with the road network
δ a , k r s link-path incidence that equals 1 if link a belongs to path k between OD pair ( r , s ) , and 0 otherwise
P k r s probability of ordinary vehicles choosing path k between OD pair ( r , s )
c k r s actual travel time for path k between OD pair ( r , s )
α market penetration of autonomous vehicles
β market penetration of ATIS vehicles

References

  1. Shladover, S.; Su, D.; Lu, X.Y. Impacts of cooperative adaptive cruise control on freeway traffic flow. Transp. Res. Rec. 2012, 2324, 63–70. [Google Scholar] [CrossRef]
  2. Sun, J.; Zheng, Z.; Sun, J. The relationship between car following string instability and traffic oscillations in finite-sized platoons and its use in easing congestion via connected and automated vehicles with IDM based controller. Transp. Res. Part B Meth. 2020, 142, 58–83. [Google Scholar] [CrossRef]
  3. Chen, D.; Ahn, S.; Chitturi, M.; Noyce, D.A. Towards vehicle automation: Roadway capacity formulation for traffic mixed with regular and automated vehicles. Transp. Res. Part B Meth. 2017, 100, 196–221. [Google Scholar] [CrossRef]
  4. Yao, Z.; Wang, Y.; Liu, B.; Zhao, B.; Jiang, Y. Fuel Consumption and Transportation Emissions Evaluation of Mixed Traffic Flow with Connected Automated Vehicles and Human-driven Vehicles on Expressway. Energy 2021, 230, 120766. [Google Scholar] [CrossRef]
  5. Xiao, G.; Lee, J.; Jiang, Q.; Huang, H.; Abdel-Aty, M.; Wang, L. Safety improvements by intelligent connected vehicle technologies: A meta-analysis considering market penetration rates. Accid. Anal. Prev. 2021, 159, 106234. [Google Scholar] [CrossRef] [PubMed]
  6. Jia, D.; Ngoduy, D. Enhanced cooperative car-following traffic model with the combination of V2V and V2I communication. Transp. Res. Part B Meth. 2016, 90, 172–191. [Google Scholar] [CrossRef]
  7. Wang, Y.; Duan, X.; Tian, D.; Chen, M.; Zhang, X. A DSRC-based vehicular positioning enhancement using a distributed multiple-model kalman filter. IEEE Access 2016, 4, 8338–8350. [Google Scholar] [CrossRef]
  8. Arakawa, T. Trial verification of human reliance on autonomous vehicles from the viewpoint of human factors. Int. J. Innov. Comput. Inf. Control. 2018, 14, 491–501. [Google Scholar]
  9. Yao, Z.; Wu, Y.; Wang, Y.; Zhao, B.; Jiang, Y. Analysis of the impact of maximum platoon size of CAVs on mixed traffic flow: An analytical and simulation method. Transp. Res. Part C Emerg. Technol. 2023, 147, 103989. [Google Scholar] [CrossRef]
  10. Wardrop, J.G. Some theoretical aspects of road traffic research. Proc. Inst. Civ. Eng. 1952, 1, 325–362. [Google Scholar] [CrossRef]
  11. Daganzo, C.F.; Sheffi, Y. On stochastic models of traffic assignment. Transport. Sci. 1977, 11, 253–274. [Google Scholar] [CrossRef] [Green Version]
  12. Ben-Akiva, M. Dynamic network equilibrium research. Transp. Res. Part A General. 1985, 19, 429–431. [Google Scholar] [CrossRef]
  13. Cantarella, G.E.; Cascetta, E. Dynamic processes and equilibrium in transportation networks: Towards a unifying theory. Transport. Sci. 1995, 29, 305–329. [Google Scholar] [CrossRef]
  14. Guo, R.Y.; Yang, H.; Huang, H.J.; Tan, Z. Link-based day-to-day network traffic dynamics and equilibria. Transp. Res. Part B Meth. 2015, 71, 248–260. [Google Scholar] [CrossRef]
  15. Watling, D.P.; Cantarella, G.E. Model representation and decision-making in an ever-changing world: The role of stochastic process models of transportation systems. Netw. Spat. Econ. 2015, 15, 843–882. [Google Scholar] [CrossRef]
  16. Yang, H. Multiple equilibrium behaviors and advanced traveler information systems with endogenous market penetration. Transp. Res. Part B Meth. 1998, 32, 205–218. [Google Scholar] [CrossRef]
  17. Yin, Y.; Yang, H. Simultaneous determination of the equilibrium market penetration and compliance rate of advanced traveler information systems. Transp. Res. Part A Policy Pract. 2003, 37, 165–181. [Google Scholar] [CrossRef]
  18. Huang, H.; Liu, T.; Yang, H. Modeling the evolutions of day-to-day route choice and year-to-year ATIS adoption with stochastic user equilibrium. J. Adv. Transp. 2008, 42, 111–127. [Google Scholar] [CrossRef]
  19. Cheng, L.; Lou, X.; Zhou, J.; Ma, J. A mixed stochastic user equilibrium model considering influence of advanced traveler information systems in degradable transport network. J. Cent. South Univ. 2018, 25, 1182–1194. [Google Scholar] [CrossRef]
  20. Ma, Y.; Zhang, Z.; Chen, S.; Yu, Y.; Tang, K. A comparative study of aggressive driving behavior recognition algorithms based on vehicle motion data. IEEE Access 2019, 7, 8028–8038. [Google Scholar] [CrossRef]
  21. Wang, J.; Zheng, Y.; Xu, Q.; Wang, J.; Li, K. Controllability analysis and optimal control of mixed traffic flow with human-driven and autonomous vehicles. IEEE. Trans. Intell. Transp. Syst. 2021, 22, 7445–7459. [Google Scholar] [CrossRef]
  22. Al-Turki, M.; Ratrout, N.T.; Rahman, S.M.; Reza, I. Impacts of autonomous vehicles on traffic flow characteristics under mixed traffic environment: Future perspectives. Sustainability 2021, 13, 11052. [Google Scholar] [CrossRef]
  23. Shiwakoti, N.; Stasinopoulos, P.; Fedele, F. Investigating the state of connected and autonomous vehicles: A literature Review. Transp. Res. Procedia 2020, 48, 870–882. [Google Scholar] [CrossRef]
  24. Wang, J.; Peeta, S.; He, X. Multiclass traffic assignment model for mixed traffic flow of human-driven vehicles and connected and autonomous vehicles. Transp. Res. Part B Meth. 2019, 126, 139–168. [Google Scholar] [CrossRef]
  25. Yao, Z.; Hu, R.; Wang, Y.; Jiang, Y.; Ran, B.; Chen, Y. Stability analysis and the fundamental diagram for mixed connected automated and human-driven vehicles. Phys. A 2019, 533, 1–16. [Google Scholar] [CrossRef]
  26. Chen, Z.; He, F.; Yin, Y.; Du, Y. Optimal design of autonomous vehicle zones in transportation networks. Transp. Res. Part B Meth. 2017, 99, 44–61. [Google Scholar] [CrossRef]
  27. Ye, L.; Yamamoto, T. Modeling connected and autonomous vehicles in heterogeneous traffic flow. Phys. A 2018, 490, 269–277. [Google Scholar] [CrossRef]
  28. Ye, L.; Yamamoto, T. Impact of dedicated lanes for connected and autonomous vehicle on traffic flow throughput. Physica A 2018, 512, 588–597. [Google Scholar] [CrossRef]
  29. Huang, Z.; Tang, Z.; Qin, D.; Kuang, A. A Road Network Reserve Capacity Model in the Autonomous Environment. China J. Highw. Transp. 2019, 32, 98–105. [Google Scholar] [CrossRef]
  30. Levin, M.W.; Boyles, S.D. A multiclass cell transmission model for shared human and autonomous vehicle roads. Transp. Res. Part C Emerg. Technol. 2016, 62, 103–116. [Google Scholar] [CrossRef]
  31. Bifulco, G.N.; Cantarella, G.E.; Simonelli, F.; Velonà, P. Advanced traveler information systems under recurrent traffic conditions: Network equilibrium and stability. Transp. Res. Part B Meth. 2016, 92, 73–87. [Google Scholar] [CrossRef]
  32. Zheng, F.; Liu, C.; Liu, X.; Jabari, S.E.; Lu, L. Analyzing the impact of automated vehicles on uncertainty and stability of the mixed traffic flow. Transp. Res. Part C Emerg. Technol. 2020, 112, 203–219. [Google Scholar] [CrossRef]
  33. Bagloee, S.A.; Sarvi, M.; Patriksson, M.; Rajabifard, A. A mixed user-equilibrium and system-optimal traffic flow for connected vehicles stated as a complementarity problem. Comput. Aided Civ. Inf. 2017, 32, 562–580. [Google Scholar] [CrossRef]
  34. Bureau of Public Roads. Traffic Assignment Manual; US Dept of Commerce, Urban Planning Division: Washington, DC, USA, 1964. [Google Scholar]
  35. Yang, B.; Cai, J.; Yang, Z.; Kuang, K.; Zhao, H.; Lu, K. Variable lane optimization and adaptive control of intercity arterial road. J. Hunan City Univ. Nat. Sci. 2021, 30, 29–32. [Google Scholar] [CrossRef]
  36. Zhou, Z.; Huang, Z.; Yuan, J.; Li, P. Traffic flow optimization of different lane modes based on autonomous vehicles. J. Chang’an Univ. Nat. Sci. 2021, 41, 103–115. [Google Scholar] [CrossRef]
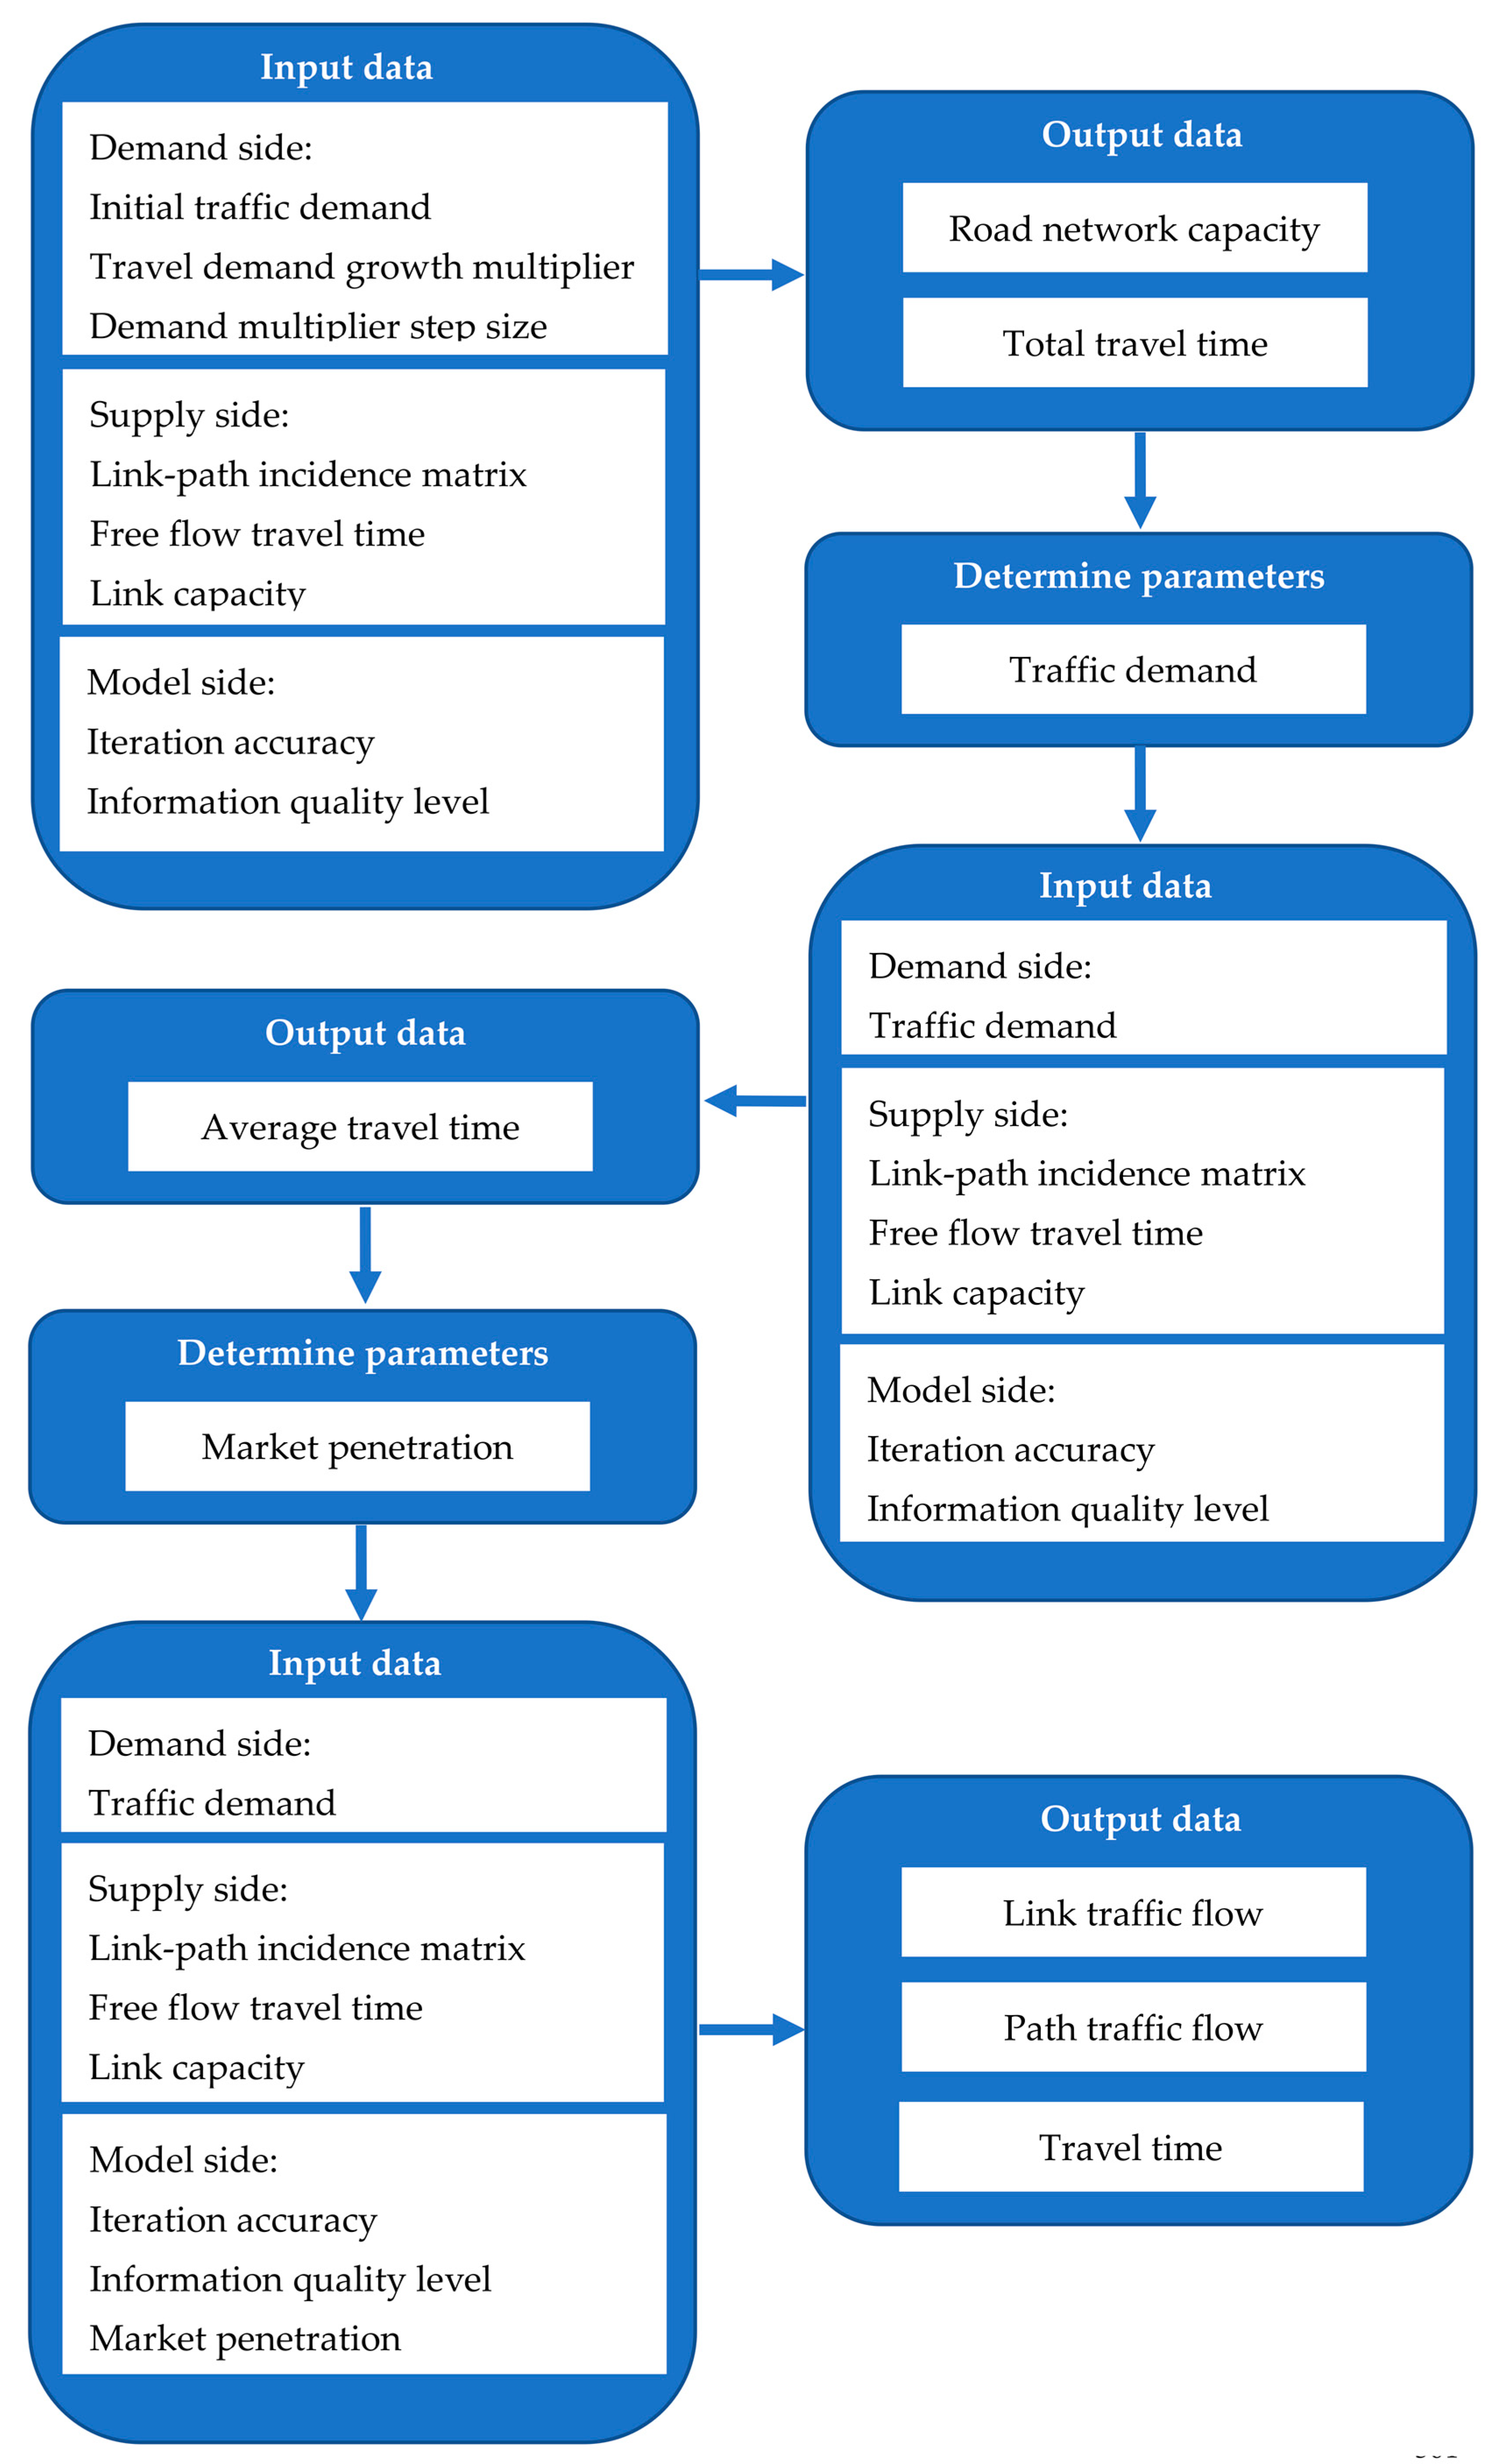
Figure 1. Relevant data and parameters of the model.
Sustainability 15 02923 g001
Figure 2. Test road network.
Sustainability 15 02923 g002
Figure 3. Changing diagram of road network flow and total travel time under different modes. (a) Road network flow. (b) Total travel time.
Sustainability 15 02923 g003
Figure 4. Changing diagram of average travel time under different market penetration. (a) SO-SUE mixed mode (b) SO-UE mixed mode (c) UE-SUE mixed mode.
Sustainability 15 02923 g004
Figure 5. Three-dimensional diagram of average travel time under different market penetration.
Sustainability 15 02923 g005
Figure 6. Evolutionary trajectories of link flow and path flow under stochastic user equilibrium mode.
Sustainability 15 02923 g006
Figure 7. Evolutionary trajectories of link flow and path flow under user equilibrium mode.
Sustainability 15 02923 g007
Figure 8. Evolutionary trajectories of link flow and path flow under system optimization mode (regular lane).
Sustainability 15 02923 g008
Figure 9. Evolutionary trajectories of link flow and path flow under system optimization mode (dedicated lane).
Sustainability 15 02923 g009
Figure 10. Evolutionary trajectories of link flow and path flow under mixed mode.
Sustainability 15 02923 g010
Table 1. Characteristic parameters of road network link.
No. of LinkFree-Flow Time (Min)Capacity (Veh/h)No. of LinkFree-Flow Time (Min)Capacity (Veh/h)
1814007121200
2718008131400
371000951000
4516001091200
515140011101400
6518001291400
Table 2. The index of road network path.
No. of PathIncluded LinksNo. of PathIncluded Links
11, 5, 1142, 4, 6, 9, 11
21, 3, 6, 9, 1152, 4, 6, 10, 12
31, 3, 6, 10, 1262, 7, 8, 12
Table 3. Road network capacity and travel time under different modes.
ModeRoad Network Capacity (Veh/h)Total Travel Time
(Min)
Average Travel Time (Min)
SUE2799107,88738.54
UE258495,046.9336.79
SO (regular lane)265798,325.4337.00
SO (dedicated lane)4916181,887.3237.00
Table 4. Distribution of average travel time under different market penetration.
β00.10.20.30.40.50.60.70.80.91.0
α
035.9835.9435.9635.9035.8335.7135.5835.4535.3235.2035.09
0.135.9035.8835.9135.8435.7135.5835.4535.3235.2035.09--
0.235.7935.7135.6535.6335.5435.4435.3135.2035.08----
0.335.5935.5135.4435.3935.3735.2835.1835.09------
0.435.4335.3435.2635.2035.1735.1535.07--------
0.535.2935.2035.1135.0434.9835.02----------
0.635.1735.0734.9834.9034.84------------
0.735.0534.9634.8734.79--------------
0.834.9434.8534.76----------------
0.934.8434.75------------------
1.034.75--------------------
Table 5. Link data after stabilization under stochastic user equilibrium mode.
LinkTraffic Flow
(Veh/h)
SaturationTravel Time (Min)LinkTraffic Flow
(Veh/h)
SaturationTravel Time (Min)
19940.718.3172030.1712.00
210050.567.1082030.1513.00
35780.587.1297660.775.26
48010.505.05106130.519.09
54170.3015.021111830.8410.76
613790.775.26128170.589.16
Table 6. Path data after stabilization under stochastic user equilibrium mode.
PathTraffic Flow
(Veh/h)
ProbabilityTravel Time (Min)PathTraffic Flow
(Veh/h)
ProbabilityTravel Time (Min)
1417 0.2085 34.09 4445 0.2225 33.43
2321 0.1605 36.70 53570.1785 35.66
3257 0.1285 38.93 6203 0.1015 41.26
Table 7. Link data after stabilization under user equilibrium mode.
LinkTraffic Flow
(Veh/h)
SaturationTravel Time (Min)LinkTraffic Flow
(Veh/h)
SaturationTravel Time (Min)
1655 0.47 8.06 70 0.00 12.00
21345 0.75 7.33 80 0.00 13.00
30 0.00 7.00 9745 0.74 5.23
41345 0.84 5.37 10600 0.50 9.08
5655 0.47 15.11 111400 1.00 11.50
61345 0.75 5.23 12600 0.43 9.05
Table 8. Path data after stabilization under user equilibrium mode.
PathTraffic Flow
(Veh/h)
ProbabilityTravel Time (Min)PathTraffic Flow
(Veh/h)
ProbabilityTravel Time (Min)
1655 0.3275 34.67 4745 0.3725 34.67
20 0.0000 37.02 5600 0.3000 36.07
30 0.0000 38.42 60 0.0000 41.37
Table 9. Link data after stabilization under system optimization mode (regular lane).
LinkTraffic Flow
(Veh·h−1)
SaturationTravel Time (Min)LinkTraffic Flow
(Veh·h−1)
SaturationTravel Time (Min)
18130.588.14700.0012.00
211870.667.20800.0013.00
300.007.0094240.425.02
411870.745.23107630.649.22
58130.5815.261112370.8810.91
611870.665.14127630.559.12
Table 10. Path data after stabilization under system optimization mode (regular lane).
PathTraffic Flow
(Veh/h)
ProbabilityTravel Time (Min)PathTraffic Flow
(Veh/h)
ProbabilityTravel Time (Min)
1813 0.4065 34.30 4424 0.2120 33.50
20 0.0000 36.22 5763 0.3815 35.91
30 0.0000 38.62 600.0000 41.32
Table 11. Link data after stabilization under system optimization mode (dedicated lane).
LinkTraffic Flow
(Veh/h)
SaturationTravel Time (Min)LinkTraffic Flow
(Veh/h)
SaturationTravel Time (Min)
16910.278.01700.0012.00
213090.397.03800.0013.00
300.007.00912290.665.15
413090.445.0310800.049.00
56910.2715.011119200.7410.45
613090.395.0212800.039.00
Table 12. Path data after stabilization under system optimization mode (dedicated lane).
PathTraffic Flow
(Veh/h)
ProbabilityTravel Time (Min)PathTraffic Flow
(Veh/h)
ProbabilityTravel Time (Min)
1691 0.345533.47412290.6145 32.67
20 0.0000 35.62580 0.0400 35.07
30 0.0000 38.02 600.0000 41.03
Table 13. Link data after stabilization under mixed mode.
LinkTraffic Flow
(Veh/h)
SaturationTravel Time (Min)LinkTraffic Flow
(Veh/h)
SaturationTravel Time (Min)
17010.508.087570.0512.00
212990.727.298570.0413.00
31200.127.0098180.825.34
412420.785.27105440.459.06
55810.4115.071113991.0011.50
613620.765.25126010.439.05
Table 14. Path data after stabilization under mixed mode.
PathTraffic Flow
(Veh/h)
ProbabilityTravel Time (Min)PathTraffic Flow
(Veh/h)
ProbabilityTravel Time (Min)
15810.290334.6447710.385434.64
2470.023737.1554720.235835.91
3720.036238.426570.028441.33
Table 15. Total travel time after stabilization under different modes.
ModeTotal Travel Time (Min)
SUE71,983.99
UE70,180
SO (regular lane)69,489.23
SO (dedicated lane)66,084.8
SUE-UE-SO ( α = 0.2 , β = 0.6 )70,650.9
Disclaimer/Publisher’s Note: The statements, opinions and data contained in all publications are solely those of the individual author(s) and contributor(s) and not of MDPI and/or the editor(s). MDPI and/or the editor(s) disclaim responsibility for any injury to people or property resulting from any ideas, methods, instructions or products referred to in the content.