Abstract
Anthropogenic activities and climate change have a profound impact on the urban environment. Therefore, energy conservation is an important subject for city planners. Green roofs can provide building insulation and mitigate against the urban heat island effect. This research was conducted in Cyprus, comparing different types of green roof vegetation against a control roof with no vegetation and their concomitant effects on indoor temperatures. The research project was performed at Near East University Campus for duration of twelve months. The experiment consisted of three different green roof types, and each hut with green roof had 3.5 m2 roof areas with a soil depth of 8 cm. In addition, one control green roof system was established without insulation, without soil, and without vegetation. In order to measure the indoor temperatures of the huts, Elitech RC-5 temperature data loggers were used. The research results showed that green roof huts provided lower mean temperatures than the control hut during the summer period. Most importantly, huts with shrub plants had the lowest temperatures during hot summer conditions. Our results indicated that green roofs perform an important role in terms of building insulation and its subsequent energy use.
1. Introduction
Due to the combined effects of human stressors, such as increasing urbanization and climate change, cities are now experiencing more severe environmental issues. Environmental hazards have been compounded by climate change, notably by an increase in the frequency, length, and severity of weather extremes, including heat waves, floods, and droughts, all of which have an impact on biodiversity and ecosystem services [1]. Stormwater drainage is typically accomplished in many metropolitan areas utilizing an impermeable infrastructure network, such as cast-iron catch pits, concrete lined gutters, pipe and manhole networks, and canalization with creeks. The volumes, flows, and flood peaks from stormwater runoff are necessarily increased as a result of these networks. Therefore, it is necessary to find measures that can lessen the hydrological danger that urbanization poses [2]. In addition to contributing to environmental issues in cities, rising urbanization also puts planners and designers under pressure to come up with solutions in increasingly limited contexts [3]. The abuse of fossil fuels over the last few decades has resulted in rapid surface warming throughout the biosphere, which, combined with other human pressures, is devastating ecosystems and biodiversity [4,5,6]. Energy conservation is one of the forms of alternative methods that humanity is now looking into because of this issue. Together with other energy-intensive industries and sectors, such as transportation, buildings utilize around a third of all energy and contribute significantly to CO2 emissions. For instance, almost 40% of all energy used in the US in 2012 came from residential and commercial structures [7].
Due to the demand for more efficient energy use, recent approaches by city planners in many parts of the world are adopting more efficient and sustainable infrastructures [8]. At present, the construction industry is increasingly focused on the sustainability of environmentally friendly building methods and materials, and certain European and American industrialized countries have turned to using green-roof systems as they have an important role in sustainable development. Several development actors, including building owners, governments, and industry, influence the long-term viability of green roofs [9,10].
Green roofs are vegetated roofs or decks that provide urban greening for buildings or the environment [11]. Increased urbanization is linked to a loss of urban green space, as new or infill projects frequently destroy natural areas and parks, and this, in turn, is reducing urban biodiversity [12]. It is known that the Mysteries villa’s green roof uses an antiquated Roman architectural technique to create a space that promotes collaboration, group activities, and celebrations. It was utilized in the hanging gardens of Semiramis (Syria) and also called The Hanging Gardens of Babylon, one of the Seven Wonders of the Ancient World listed by Hellenic culture. Since the 1990s, buildings have changed to include green roofs as an expression of wealth, particularly in private homes. They have also started to be used in public buildings and institutions as user-interactive spaces. Germany adopted green roofs at the beginning of the 1960s. They made use of it to lower the structure’s energy usage. Germany later emerged as a global leader in green roof technology as a result of the design, implementation, and development of sizable green roof projects. In 1980, green roof technology became more widespread and was used in more than 10% of German buildings. Due to the proper design and specifications being used today, the green roof is more efficient and effective, and every year Germany adds about 13.5 million m2 of green roofs [13].
However, green roofs are a novel and higher form of urban green space that are rapidly expanding in many cities. Green roofs have already taken up a significant amount of space in several cities. Stuttgart, for example, has more than 200 hectares of green roofs, with Düsseldorf having 73 hectares, Zurich 87 hectares, Tokyo 55 hectares, and Paris 44 hectares [14].
Though the success of green roof projects at a pilot (or small) scale as well as on a large scale has been reported globally, there is still a long way to go toward global acceptance and implementation of this innovative type of roof. This can be the outcome of an uneven emphasis on green roofs between industrialized and developing nations. According to an Australian assessment, the US, Europe, and other wealthy nations account for the majority of the 102 papers on green roofs. In the past ten years, green roofs have been put in place in nations such as Australia, China, Hong Kong, and Italy. According to recent surveys, the USA is currently a world leader in green roof research [15]. Green roof research and development has been ongoing throughout Europe for over the past 50 years. The technology’s diverse experiences in Europe eventually led to rules and standards that were backed up by university-led research, field observations, and product or component development. The FLL rules (FLL refers to the Forschungsgesellschaft Landschaftsentwicklung Landschaftsbau [The German Landscape Development and Design Research Institute]) are the most frequently utilized set of green roof guidelines in Europe. The ability to communicate German guidelines open to discussion and adaptable to diverse locations and climate circumstances was a key criterion for this direction. For the past 25 years, FFL has been working on green roof technology standards. Green roof technologies are increasingly aiding in the application of green roofs in many cities, even if they do not provide concrete solutions to several issues [16]. UK research estimates that the retrofitting of already-existing, eligible buildings might result in the addition of 3 square kilometers, or around 2% of the developed area in Central London and about 1% outside of it [17]. Surveys and experiments conducted in Greece and Singapore revealed the use of green roofs efficiently decreased internal temperatures, reducing the cooling burden of the area by between 17–79%, [18].
Many recent studies on green roofs have been focused on interior energy usage, with less attention paid to thermal variability. According to an experimental study conducted throughout the summer in Los Angeles in southern California, green roofs utilized as thermal mass, when paired with night-time ventilation, help to regulate the indoor thermal environment. Within this research, it underlined that green roofs and ventilation were two methods for improving the indoor thermal climate and lowering energy consumption, and combining the two will yield even higher energy savings [19].
The two fundamental types of green roofs are extensive (soil layer less than 200 mm), requiring minimal care, or intense (soil layer more than 200 mm) with longer root length plants [20]. Green roof applications lower the roof’s life cycle costs, and green roofs are about three times more durable than conventional roofs; there is less construction waste, resulting in lower construction costs. Buildings with green roofs will probably attract greater rent and occupant retention due to the improved amenity. There are also a number of environmental benefits. By acting as a medium that can hold moisture and water content, green roofs reduce the passage of stormwater, thereby reducing erosion. Moreover, they improve air quality and reduce the urban heat island effect, which occurs when urban areas have higher temperatures than rural areas, especially during the hot summer months [21].
Green roofs also provide educational possibilities, job opportunities, room for food production, and green space for recreational usage, among other social advantages [22]. On large green roofs, crops such as tomatoes, cucumbers, chives, chilies, radishes, lettuce, basil, etc., have been grown [23]. Therefore, by fostering urban agriculture, green roofs can also advance food sustainability and safety in urban areas [24].
Green roofs also attract biodiversity, including beneficial insects such as pollinators [25]. Finally, green roofs preserve and extend the life of the roof by insulating it from high swings in temperatures; they can also help to enhance air quality by collecting carbon dioxide and pollutants [26]. Green roofs often increase energy efficiency and indoor thermal comfort by lowering solar heat gain conducted through the roof assembly in summer (due to water evaporation and plant shading) and providing heat insulation in winter (because of raised thermal mass). In Mexico’s summer and transition seasons, green roofs are said to reduce indoor air temperature by 2.1 °C and 4.2 °C, respectively [27]; in China’s hot summer climes, green roofs are said to produce an annual energy savings of 14.7% [28].
In an experiment conducted over three summers on a large green roof in the Mediterranean coastal climate zone, it was found that dense vegetation reduced the heat gain entering the roof by 60% compared to a roof without vegetation. The energy consumption of wide green roofs (rubber crumbs and pozzolana) was compared to a standard gravel roof at Puigverd de Lleida in Spain. Within this research, the pozzolana green roof cubicles were able to lower electrical energy usage by 1.6 and 21.8% in the rubber crumbs cubicle during a week in July. However, the same cubicles used 6.8 and 11.8% more electrical energy than the reference cubicles in December, with a slightly lower proportion in January [29].
Finally, within this current research conducted in Nicosia (Cyprus), different types of green roof vegetation were compared on thermal performance effect using different huts. A review of the literature was undertaken to discover the importance of green roof systems and their effect on the indoor temperatures of buildings in dry climate conditions. An experimental study was conducted, and different green roof vegetation’s impact on the indoor critical air temperature is discussed. Considering the interest in green roof systems in semi-arid urban areas, there is a lack of experimental data available from Cyprus; this study aims to help fill the gap in the existing knowledge regarding suitable green roof vegetation types. The hypothesis of this research is that, in the Mediterranean country of Cyprus, green roofs (especially green roofs with dense vegetation consisting of shrubs) can keep indoor spaces cooler during the hot summer months. To test this, a trial using wooden huts was established in the city of Nicosia.
2. Materials and Methods
A suitable place on campus was determined for the experimental setup, and a total of four wooden huts were erected. Insulation materials for the green roof system were established on three of the huts. After the insulation materials were placed, three different vegetation types were created. Finally, temperature data loggers were placed inside each hut, and temperatures were recorded every two hours for 12 months.
2.1. Experimental Site
The green roof experiments were carried out at the Near East University (Nicosia, North Cyprus) Near East Kindergarten between 1 August 2021 and 1 August 2022 (twelve months), within the scope of Scientific Research Projects with the code FEN 201-2-007 (BAP). The climate of the region is typical of the Mediterranean coastal regions with mild winters and hot/dry summers. Cyprus is the third largest island in the Mediterranean after Sicily and Sardinia. It is located between 30.33- and 35.41-degrees latitude and 32.23- and 34.55-degrees longitude. Turkey is 65 km to the north, Syria is 100 km to the east, and Egypt is 420 km to the south of North Cyprus [30]. Whereas daily mean temperatures range from 9 to 12 degrees Celsius during the winter months (January–February). The average annual precipitation is 397.6 mm, and the average sunshine is five hours during the winter period. The great variance between day and night is a key element of the Cypriot climate. In the winter, the predominant winds are usually southwesterly and easterly, and in the summer, westerly and northerly [31,32].
2.2. Description of the Experimental Roof System
For this research, an extensive green roof system was used. Due to its light weight, thin growing material, minimal to no care requirements, low cost, and broad potential for use over new or existing lightweight structures, extensive green roof systems are frequently used [33]. Green roof tests were conducted outdoors on four ground-level wooden huts on the east façade of NEU Kindergarten School. These three huts were covered with all the necessary green roof insulation layers (Figure 1), while one was left bare as the control. The layers used for the green roof construction were determined by CEE (Cyprus Environmental Enterprises) Ltd. The roof system consisted of:
- (a)
- Plants: The plants selected were in accordance with the Mediterranean climate conditions, and additionally, we also considered the plants’ contribution to the aesthetic value of the building. Preferred plants were sun- and drought-resistant ground-cover and shrub-type plants;
- (b)
- Plant Carrier Layer: Lava; pumice-based materials synthesized using various processes in the plant carrier layers of the garden roof system; and natural tile crumbs used as substitute, frost resistant, non-combustible infrastructures, meet all of the nutritional requirements of the chosen plants. The Red Mediterranean soil type is ideal for green roofs (Terra Rossa). In the Mediterranean climate zone, these soils are developed on limestone (limestone). Its color is red due to its strong iron oxide content. Red soil, pumice stone, tile fracture, and shrub soil are the most suited soil mixtures for forming the plant carrier layer that was produced for the layer of green application [34];
- (c)
- Filter and Drainage Layer: Rainwater from the upper layers is collected and filtered by a filter layer for rainy days. If the buildup becomes excessive, the plants are drained and discarded to avoid rot;
- (d)
- Protective and Moisture Retaining Layer Against Mechanical Effects: This layer is for any mechanical impacts on plant roots. The protecting layers must be compressive-strength resistant;
- (e)
- Root Holder Layer: The waterproofing layers should not be damaged by plant roots. Special root-holding layers or waterproofing that guard against roots should be utilized for this reason;
- (f)
- Waterproofing and Roof Construction: The presence of appropriate waterproofing and solid roof construction with sufficient weight-bearing ability is the most crucial prerequisite for roof greening. There is no need for a root retaining layer if the waterproofing materials are resistant to plant roots.
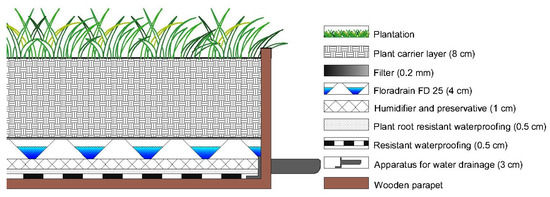
Figure 1.
Extensive green roof layers.
The roof size of each hut used in the experiment was 3.5 m2. A total of 143 plants were used by calculating the diameters of each hut separately. Of these plant species, eight different species were used, five of which were shrubs and three of which were ground-cover species (Figure 2). Three of the four wooden huts with the same conditions were planted in June for the green roof experiment. While only the ground-cover species were planted in the first hut, both ground-covers and shrubs were planted in the second hut. In the third hut, only shrubs were planted. The distance between the plants was adjusted considering the growth diameter of the plants. All plants were planted in mixed order. While ponding was done every day during the first week, plants were generally irrigated twice a week.
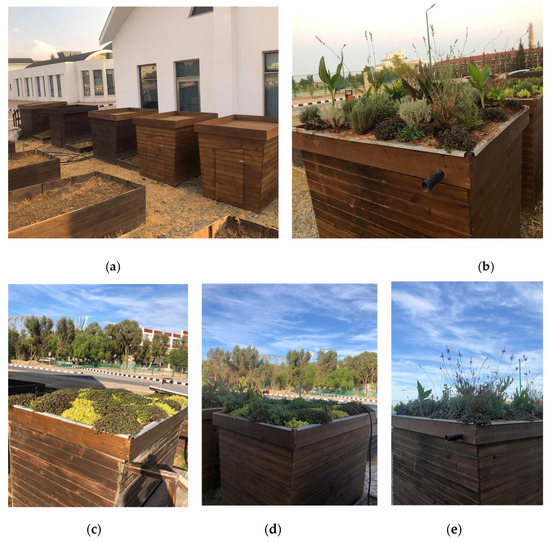
Figure 2.
(a) The huts used in the green roof; (b) all green roof huts, including the control hut used in the comparison; (c) green roof with ground-covers; (d) green roof with mixed vegetation; (e) green roof with shrubs.
The sprinkle irrigation method was used as the irrigation method. Thermometers were placed in all green-roofed huts, including the control hut, and the experiment was fully set up to determine their indoor temperature. In this process, while all the ground-cover plants continued to grow without wilting, a few of the shrub species could not withstand exposure to excessive heat and perished.
2.3. Plant Material
All the plants were selected in accordance with the Mediterranean climatic conditions. In this context, plants that are resistant to sun exposure and do not require excess water were used in the green roof experiment. Green roofs were installed on three of the four huts provided for the experiment, and each hut was planted with different species of plants. One of the huts was planted with only ground-cover plants, the other with shrubs, and the third with both ground-covers and shrubs. Preferred ground-covers: Sedum angelina, Sedum spurium, Santolina spp. The bush types were: Gaura lindheimeri, Thymus vulgaris, Lavandula officinalis, Canna indica, Pelargonium spp. With 420 species, Sedum is the largest and most widespread genus in the Crassulaceae family. This genus includes annual and perennial herbs with succulent leaves and stems that are mostly found in arid climates from temperate to subtropical regions. The Mediterranean Sea, Central America, the Himalayas, and East Asia have the most species diversity [35].
The results of a Spanish study support the use of succulent species as effective green roofs to enhance the thermal conditions of buildings in Mediterranean cities. This shows that green roofs could be made more attractive without sacrificing their energy efficiency by using a variety of succulent species (i.e., not just Sedum spp.) [36].
Thymus vulgaris L., known as garden thyme or common thyme, is a Lamiaceae family perennial aromatic plant used for ornamental, culinary, and medicinal purposes [37]. Thymus vulgaris is native to the Mediterranean and adjacent countries, northern Africa, and parts of Asia. Thyme has been used as a flavoring agent, culinary herb, and herbal medicine for millennia. The plant can be used as an infusion to treat coughs, diabetes, colds, and chest infections, as well as syrup to treat stomach ailments. Thyme is beneficial for sore throats since it has antibacterial, antibiotic, and antifungal properties [38].
Canna indica is a perennial herb in the Cannaceae family. It has long been used in traditional medicine to treat a variety of ailments [39]. The Lamiaceae family includes the genus Lavandula, which grows natively throughout the Mediterranean basin from the North Atlantic to the Middle East. Plants in this family are distinguished by quadrangular stems with opposing, decussate leaves. Fine lavender and lavender aspic are herbaceous biennial plants that thrive in dry, sunny, calcareous (fine lavender and lavender aspic), or siliceous (lavender stoechas) soils [40].
2.4. Cultural Practices
During this experiment, manual weed controls were implemented once a week in order not to hinder the root growth of the chosen plants. Irrigation was provided twice weekly in August, September, and October, which were the first months of planting. However, due to the rains in November, December, January, and February, irrigation frequency was reduced to once a week. During some weeks when there was heavy rainfall, no irrigation was provided. Irrigation was carried out once a week in the spring season, and in the summer months of June and July, due to the very hot weather, drip irrigation was applied twice a week in some weeks. The excess water was discharged with a water drainpipe (Figure 3). This water drain is placed at the bottom of all layers before the insulation phase of green roofs.
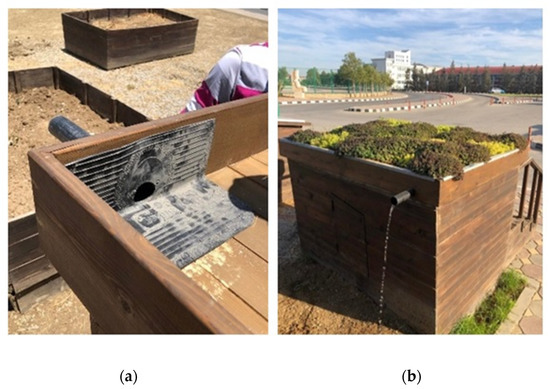
Figure 3.
(a) Water discharge apparatus; (b) draining excess water accumulated on the green roof.
2.5. Temperature Data Logger
A data logger (Model RC-5 Elitech) was placed in each of the four huts to measure the internal temperatures (Figure 4).
The dataloggers were programmed to record temperatures at 2 h intervals for a complete year. Detailed information about these huts is shown in Table 1. At the end of each month, thermometers were taken out of the huts, one month’s data were taken, adjusted for the new month, and then placed again into the huts to obtain new measurements. This process continued uninterruptedly every month for twelve months, from 1 August (2021) to 1 August (2022).

Table 1.
Detailed information about the huts.

Figure 4.
RC-5 Elitech data logger.
2.6. Statistical Method
The quantitative analysis was based on the following process:
- (1)
- Each hut data was checked for normality. If data were normally distributed, step 2 was skipped;
- (2)
- Multiple data transformations (outlier check, log, square-root, and reciprocal transformation) were applied separately to test for normal distribution. If data were still not normally distributed, a robust test against main assumptions was applied;
- (3)
- Levene’s Test for Homogeneity of Variances was applied to each group sample. If Levene’s test failed, a robust post hoc test was applied;
- (4)
- If both main assumptions were not violated, a simple Anova test was applied. However, if there were violations on main assumptions, a One-Way Anova was applied because of robustness against normality and homogeneity of variance.
Based on this process, a One-way Anova was used in the pursuance of concerning the significant differences between the control hut (control group) and experimental groups (ground-cover plants, mixed vegetation, shrubs), and also between experimental groups themselves;
- (1)
- Additionally, a T-test was applied for the correlated data.
3. Results
3.1. Descriptive Statistics
Summary statistics and figures are used for explaining and comparing temperatures of different hut types between 1 August 2021 and 1 August 2022, both seasonally and monthly.
3.1.1. Seasonal Comparisons
As shown in Table 2, during the summer months, there was a slight difference in minimum temperatures at night between the different hut types. However, as expected, large differences were seen in maximum temperatures during the daytime. The control hut experienced the highest temperature, 60.6 °C. The temperature difference between the control group and shrubs and ground-cover plants was 4.2 °C, whereas mixed vegetation had a difference of 11.2 °C. In addition, mixed vegetation and shrubs have an average temperature of around 30.5 °C, and ground-cover plants and the control hut had 31.2 °C and 31.6 °C, respectively. Table 2 and Figure 5 also show that the control hut was warmer, on average, than the huts in the experimental groups between August 2021 and 2022. All data were statistically analyzed using T-tests and One-Way Anova tests.
During the winter months, the lowest temperature (1.0 °C) was recorded in the control hut, and the highest minimum temperature among groups was 2.82 °C from the shrub-planted hut. The mean temperatures among groups had small differences (Figure 5). It should be noted that the mixed vegetation hut had a lower average temperature than the control hut by 0.12 °C between August 2021 and August 2022. Although spring and autumn seasonal maximum temperatures were similar, the main difference observed was in the minimum temperatures. There was a difference of around 6–7 °C between spring and autumn minimum temperatures for each group. Even though the highest temperature in autumn was recorded in the control hut, it also had the lowest maximum temperature at 44.14 °C in spring among all hut groups. Ground-cover and control huts showed very close mean temperatures in autumn between 25 °C and 26 °C. On the other hand, average temperatures for all groups in spring were between 20 °C and 21 °C.
Table 2.
Descriptive statistics by seasons.
Table 2.
Descriptive statistics by seasons.
| N | Minimum | Maximum | Mean | Std. Deviation | ||
|---|---|---|---|---|---|---|
| Summer | Ground-cover plants Mix vegetation Shrubs Control Hut | 1584 1584 1584 1584 | 12.10 14.00 13.90 13.00 | 56.00 49.40 56.41 60.61 | 31.238 30.565 30.498 31.617 | 8.520 7.834 7.748 10.105 |
| Winter | Ground-cover plants Mix vegetation Shrubs Control Hut | 1019 1019 1019 1019 | 1.90 2.40 2.82 1.00 | 27.19 27.90 29.03 30.00 | 13.08 12.64 13.41 12.76 | 4.95 4.98 5.13 5.54 |
| Spring | Ground-cover plants Mix vegetation Shrubs Control Hut | 1161 1161 1161 1161 | 3.25 3.00 2.52 1.30 | 56.00 48.90 44.90 44.14 | 21.01 20.31 20.10 20.01 | 10.31 9.03 8.91 9.72 |
| Autumn | Ground-cover plants Mix vegetation Shrubs Control Hut | 1075 1075 1075 1075 | 11.15 9.80 9.50 7.70 | 45.80 46.00 43.60 53.83 | 25.94 24.34 23.9 25.56 | 7.60 7.54 7.51 10.43 |
3.1.2. Monthly Comparisons
According to the monthly results, it was observed that the green-roofed huts reduced the indoor temperature by ~10 °C, compared to the control hut, while the maximum temperature difference was 12.1 °C and was never less than 4.2 °C. At the same time, when the three huts with green roofs were compared among themselves, it was determined that the hut with bush species lowered the indoor temperature more than the other huts with green roofs. As the plants grew, the green roof hut with the bushes that grew the most showed the greatest difference (Figure 5).
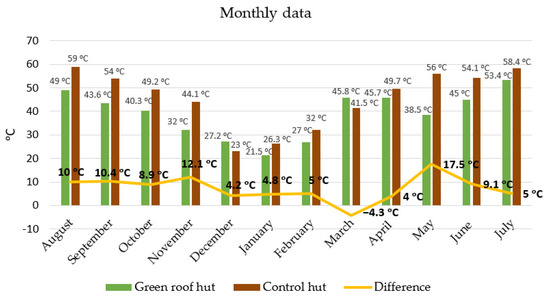
Figure 5.
Temperature variation and difference between the green-roofed hut and the control hut.
Eight months of data from the control hut show that the temperature was measured at its highest at 59 °C in August, and at its lowest at 23 °C in December. In August (2021), the monthly maximum temperature recorded was 59 °C in the control hut without a green roof, while the maximum recorded was 49 °C in the green-roofed hut. The hut where the temperature was reduced the most was the hut with mixed vegetation (Figure 6).
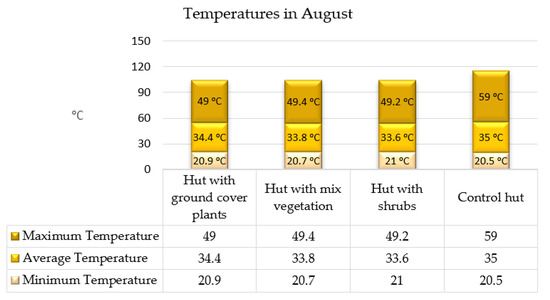
Figure 6.
Temperature data for four huts in August.
While the maximum recorded temperature in the control hut in September was 54 °C, the maximum indoor temperature of the green-roofed hut where shrubs were planted was 43.6 °C. In October, data could not be measured because there was a problem with the thermometer on the green roof with shrubs. Therefore, it could not be compared with other huts in October.
The temperature data of the green-roofed hut with bush plants were thus unavailable. Therefore, the monthly maximum temperature of the control hut was 49.2 °C, while it was 40.3 °C in the ground-cover planted hut which reduced the temperature the most. In November, when the plants were fully grown and in bloom, and the highest temperature occurred, the monthly maximum temperature in the control hut was 44.1, while it was 32 °C in the hut with bushes. Except for August and October, the hut where the temperature dropped the most in all other months was the green roof hut with bush plants. In May, it was observed that the temperature difference was the highest in the hut with ground-cover plants.
Recorded temperatures for December, which is the beginning of the winter months, showed a striking difference compared with other months. The data reveals that the temperature inside the three huts with green roofs is higher than that of the hut without a green roof.
While the highest indoor temperature was 23 °C in the control hut, it was 27.2 °C in the green-roofed huts. In other words, huts with green roofs maintained a higher indoor temperature by 4.2 °C compared to the control hut (Figure 7).
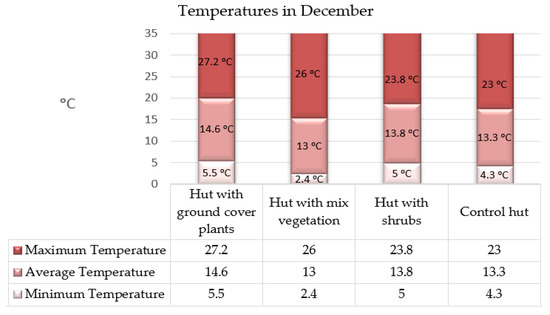
Figure 7.
Temperature data for four huts in December.
The January results showed a monthly maximum temperature of 26.3 °C in the control hut. Among the green-roofed huts, the hut that lowered the temperature the most was that with bushes planted, at 21.5 °C. According to the data results in February, while the maximum temperature in the control hut was 32 °C, the bush green-roofed hut had the highest temperature difference. Moreover, as in other months, it was the hut that experienced the lowest temperature at 27 °C.
3.2. Inferential Statistics
This section consists of statistical tests that were used for drawing inferences from the sample data. T-Tests, One-Way Anova tests, and multiple assumption tests were used for hypothesis testing to draw conclusions about differences in temperature in different hut types.
3.2.1. T-Test
As all vegetation groups were strongly correlated with each other, paired T-tests were conducted using SPSS software. According to the T-test results, the mean temperature difference between the control group and mixed vegetation was –0.16 °C. The control group mean temperatures were significantly higher than mixed vegetation and shrubs, 0.59 °C and 0.48 °C, respectively. According to the 95% confidence interval of difference, the mean temperature differences of pair 2 (control vs. mixed vegetation) and pair 3 (control vs. shrubs) were between 0.44 °C and 0.73 °C and 0.34 °C and 0.62 °C. Therefore, the control hut was slightly cooler than ground-cover plants and warmer than mixed vegetation and shrubs. However, when we compared the ground-cover hut with the control hut only for the summer period, results indicated that the control hut was on average 1 °C warmer than the ground-cover hut.
On the contrary, the mean difference between ground-cover plants and other experimental groups was higher than the mean difference between the control hut and other experimental groups. The estimate for the mean temperature difference in ground-cover plants and mixed vegetation was 0.76 °C, whereas it was 0.61 °C for shrubs. Accordingly, the main results state that the mixed vegetation hut and shrub-covered hut was cooler than the ground-cover plant-covered hut (Table 3).
Table 3.
Paired T-test for correlated data.
3.2.2. Normality Test
The normality of temperature of different groups was assessed. According to Table 4, results for both the Kolmogorov–Smirnov and Shapiro–Wilk tests indicated the violation of normality assumption for both control and experimental groups. Results for the Kolmogorov–Smirnov test suggest the statistically significant test results for the control hut (W (4431) = 0.064, p < 0.001); Ground-cover Plants (W (4431) = 0.051, p < 0.001); Mixed Vegetation (W (4431) = 0.044, p < 0.001); and Shrubs (W (4067) = 0.054, p < 0.001). On the other hand, similarly, the Shapiro–Wilk test results demonstrate the rejection of the null hypothesis for the control hut (W (4431) = 0.963, p < 0.001); Ground-cover Plants (W (4431) = 0.979, p < 0.001); Mixed Vegetation (W (4431) = 0.979, p < 0.001); and Shrubs (W (4067) = 0.978, p < 0.001). Furthermore, Q–Q (Quantile–Quantile) Plots and Histograms under Figure 8 support the normality tests’ claim.
Table 4.
Normality test for each sample.
Figure 8 shows the distribution of each hut type. The top row of the Figure shows the Quantile−Quantile plots which is used to compare the sample distribution to normal distribution. The normal distribution represented by straight line is the base distribution. Its quantiles are plotted along x−axis as “Theoretical Quantiles” whereas each sample’s quantiles are plotted along y−axis as “Sample Quantiles”. As it can be seen from the top row, although points match at most of the quantiles, there are deviations from the straight line on the most higher and lower quantiles for each sample. This shows the non−normality of the data for each sample. On the other hand, the bottom row of Figure 8 represents the histograms of each sample. Even though all samples except Shrubs look like a bell shaped, upper and lower side of histograms represents the deviation from the normal distribution, as in the top row. Therefore, both Q−Q plots and histograms are in line with the result of Table 4.
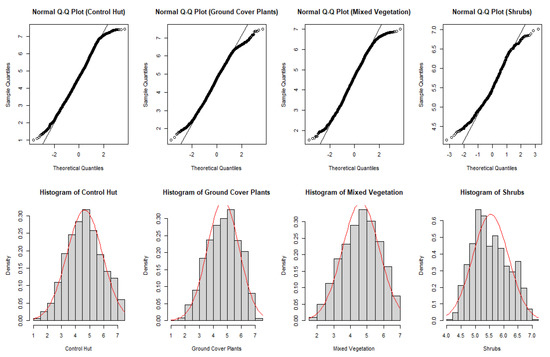
Figure 8.
Q–Q Plots and histograms.
3.2.3. Levene’s Test for Homogeneity of Variances
Table 5 has shown the results of Levene’s Test. According to the results based on means, the null hypothesis is rejected, F (3.17356) = 39.313, p < 0.001. In addition, even though optimal choice depends on the mean, Levene’s test based on median provides better robustness against non-normal data. Similar to results based on mean, results based on median indicate the rejection of null hypothesis at α = 0.00. Thus, an alternative hypothesis which indicates heteroskedasticity is accepted.
Table 5.
Levene’s test for homogeneity of variances for checking homoskedasticity.
3.2.4. One-Way Anova
Since assumptions of normality and homogeneity of variances were violated, One-Way Anova with Welch and Brown–Forsythe tests were performed to check whether there were any statistically significant differences between the mean temperature of different hut types. According to the results of One-Way Anova on Table 6, there is a statistically significant difference in the average temperature according to hut type, F (3) = 6.905, p < 0.001. Although One-Way Anova proves the statistically significant difference in means of temperatures of different hut types, Welch and Brown–Forsythe post hoc tests were applied to compare all possible combinations of group differences.
Table 6.
One-way Anova.
3.2.5. Games-Howell Post Hoc Test
According to Table 7, the Games-Howell test revealed that the mean temperature (°C) is statistically significantly lower in the shrub experimental group than in the control hut by 0.704 °C (p < 0.05). On the other hand, even though the results indicate that mixed vegetation provides almost 0.6 °C lower mean temperature for that hut, the p value is close to being statistically significant (p = 0.06). For the comparison between multiple experimental groups, results suggest that the mean temperature (°C) of the ground-cover plant hut is statistically significantly higher than both mixed vegetation and shrubs by 0.76 °C (p < 0.05) and 0.87 °C (p < 0.05), respectively.
Table 7.
Games-Howell post hoc test for multiple comparisons.
4. Discussion
The current study measured the temperature effect of green roofs on the interior of the island of Cyprus, which has a semi-arid climate. Observations were made continuously over twelve months. We found that the hut containing shrubs was the most effective at regulating temperature, and the least effective was the control hut without any vegetation. This was clearly seen during the month of November, when the maximum temperature was 44.1 °C in the control hut and 32 °C in the hut with planted shrubs. Additionally, as our data covers the hottest and coldest months of the year, the most striking result was that green roofs regulated the temperature far more effectively than the control hut. This reveals that in a climate with extremely high summer temperatures, such as occurs in Cyprus, green roofs can play a vitally important role in thermal regulation and possibly even partially mitigate the urban ‘heat island’ effect. The application of green roofs is increasingly being considered as a solution against several anthropogenic environmental problems in urban areas, such as global warming, climate change, rapidly increasing population growth, and biodiversity loss [41,42].
In addition to the many benefits of green roofs, such as contributing to biodiversity and creating an aesthetically pleasing environment, urban heat island control in city centers provides thermal insulation to buildings, energy savings, and thermal comfort across the whole year. A recent study in Mexico compared the performance of traditional simulations used in the study, which were validated using experimental data from two test boxes using the Energy Plus software (TR and GR). The interior surface temperature and heat flow of the roof of the test boxes were measured for simulation validation, and the interior surface temperature had a maximum error of 3.55 and 2.17% for the traditional and green roofs, respectively [43]. In another investigation, in situ temperature and humidity data were taken throughout the winter months. During the day, the surface temperature of the standard concrete roof floor was found to be up to 21.9 °C higher than that of the planted area, whereas the surface temperature of the green roof looked to be up to 1.6 °C higher than that of the cement roof floor in the morning. The surface temperatures of the various plants on the green roof were measured, and an optimal selection among them was proposed for the greatest performance of such a green roof system. Furthermore, the Energy Plus application was used to perform simulations for this building. The inside air temperature of a non-air-conditioned building was calculated to be reduced by up to 1.1 °C during a normal summer day and increased by up to 0.7 °C during a typical winter day. Lastly, an overall saving of 15.1% for a whole year on the energy consumption of the building was calculated [44]. Dense green roofs with a deeper substrate depth are predicted to contribute more to building heat insulation [45].
According to the results of an experimental study conducted at the University of Calabria in Italy, in winter, green roofs had a smaller impact on regulating roof temperature than during the summer. Even in the winter, the green roof helped to reduce the effects of colder weather. The temperature beneath the green roof was greater in the winter, with variances ranging from 4.6 to 0.2 °C, according to the monthly average figures. The temperature under the green roof was cooler in the summer, with variances ranging from 5 to 11.3 °C. The measured roof temperature swings in the conventional roof ranged from 20 to 48.5 °C, and the research revealed that green roofs greatly reduced average roof temperature fluctuations, with temperature fluctuations in all three green roofs being less than 2 °C [20].
In the construction industry, both passive and active solutions are required to achieve high energy efficiency. Green roofs are a sustainable alternative when it comes to passive solutions since they allow buildings to save energy while also minimizing the collateral effect of the urban heat island (UHI) phenomena. An extended measuring effort was used to investigate a roof-lawn system, which monitored heat transmission across the roof. In order to evaluate the performance of the roof-lawn system to that of a standard roof, heat-flow meters and air- and surface-temperature probes were installed in a real building. To quantify the varied thermal responses of the building components, it used an experimental approach. Furthermore, an equivalent thermal model of the roof-lawn system was investigated in order to determine the roof’s equivalent thermal qualities, which may be used to create building models for yearly energy simulations. The roof-lawn system demonstrated its benefits by demonstrating higher thermal inertia with no overheating in the summer and a lower thermal transmittance with energy savings in the winter, resulting in better indoor conditions for the building’s occupants [46].
Another long-term study in Australia investigated conditions on two identical buildings, where one was a control and the other had a green roof installed. This study included in situ thermal monitoring and surface temperature measurements. Over the course of three seasons, field data were used to calculate the green roof’s thermal buffer potential in comparison to a nearly identical conventional roof. When ambient temperatures exceeded 40 °C, rooftop surface temperatures were reduced by up to 20 °C, and heat flow was improved by up to 55.54%. These findings suggest that green roofs could help to relieve overheating and the expenses associated with the urban heat island effect by contributing to a reduction in ambient city temperature [47].
Mandavgade et al. (2022) carried out green roof research in India over the course of seven days during summer. In the middle of the day, the inside room temperature of the green roof and the conventional roof is at its highest. In the afternoon, the room air temperatures (Indoor) for the conventional and green roofs reached 39.36 °C and 34.64 °C, respectively. Throughout the experiment, the peak temperature of the green roof was consistently lower than the peak temperature of the conventional roof, with a maximum difference of 7.1 °C. The temperature of the outer roof slab on conventional and green roofs reached 46.79 °C and 36.2 °C, respectively. The green roof’s external surface temperature was always lower during the trial, with a maximum reduction of 14.2 °C. The green roof had a lower internal temperature than the concrete roof. The temperature readings for the experiment were 39.12 °C and 30.53 °C, respectively. Green roofs have been found to reduce the temperature of the inside surface of the concrete roof slab by up to 10.1 °C when compared to conventional roofs [48].
Existing research is primarily based on micro-scale field trials or small-scale simulations, which may differ from the reality produced by the actual full-scale projects because practical installation of green roof projects is uncommon. The cooling effect of green roof projects on an urban scale demands new techniques, as opposed to the simulation of green roofs’ cooling effect at the micro or local scale. It has been acknowledged and used in published studies that remote sensing is an effective tool for completely defining the thermal environment on an urban scale at any given time [49]. Dong et al. found that the implementation of green roofs reduced the average land surface temperature by 0.91 °C based on the retrieval of remote sensing images in China [50].
5. Conclusions
Our results reaffirm the findings of other studies showing that there are significant seasonal and thermal benefits to the implementation of green roofs. The main conclusion was that high dense vegetation cover reduced the indoor temperature during summer months. Cyprus has an arid Mediterranean climate, characterized by extremely hot summers, so the thermal benefits of green roofs in cities like Nicosia are clearly evident. In recent years, green roofs have an important place in sustainable living and environmentally friendly urban planning. Our study has shown us that on the island of Cyprus, which has a Mediterranean climate, green roofs can help keep the interiors of living spaces cooler, especially during summer. We also observed that it can keep interiors warmer during the cold winter months (December and January). The results are also important in terms of sustainable energy use for future cities in the Mediterranean region. Due to anthropogenic climate change and concomitant warming, the insulation of buildings has been included in the agenda of modern architecture and green city initiatives. Therefore, the positive effects of green roofs in regulating urban climate and as building insulation in semi-arid or arid countries will play an important role in future sustainable planning.
Author Contributions
S.Y., contributed to the establishment of the experiment, methodology, data collection, analysis, and writing up results. Ç.Ö. contributed to the establishment of the experiment and methodology. Ö.Ö. contributed to the establishment of the experiment, methodology, data collection, and writing up results. All authors have read and agreed to the published version of the manuscript.
Funding
This project was funded by the Near East University. Project number FEN-2019-2-007.
Institutional Review Board Statement
Not applicable.
Informed Consent Statement
Not applicable.
Data Availability Statement
All data are available publicly as explained in the full article.
Conflicts of Interest
The authors declare no conflict of interest.
References
- Morss, R.E.; Wilhelmi, O.V.; Meehl, G.A.; Dilling, L. Improving Societal Outcomes of Extreme Weather in a Changing Climate: An Integrated Perspective. Annu. Rev. Environ. Resour. 2011, 36, 1–25. [Google Scholar] [CrossRef]
- Fleck, R.; Westerhausen, M.; Killingsworth, N.; Ball, J.; Torpy, F.; Irga, P. The hydrological performance of a green roof in Sydney, Australia: A tale of two towers. Build. Environ. 2022, 221, 109274. [Google Scholar] [CrossRef]
- Knaus, M.; Haase, D. Green roof effects on daytime heat in a prefabricated residential neighbourhood in Berlin, Germany. Urban For. Urban Green. 2020, 53, 126738. [Google Scholar] [CrossRef]
- Willis, K.J.; Bhagwat, S.A. Biodiversity and climate change. Science 2009, 326, 806–807. [Google Scholar] [CrossRef]
- Bellard, C.; Bertelsmeier, C.; Leadley, P.; Thuiller, W.; Courchamp, F. Impacts of climate change on the future of biodiversity. Ecol. Lett. 2012, 15, 365–377. [Google Scholar] [CrossRef] [PubMed]
- Solecki, W.; Marcotullio, P.J. Climate change and urban biodiversity vulnerability. In Urbanization, Biodiversity and Ecosystem Services: Challenges and Opportunities; Springer: Dordrecht, The Netherlands, 2013; pp. 485–504. [Google Scholar]
- Movahed, Y.; Bakhtiari, A.; Eslami, S.; Noorollahi, Y. Investigation of single-storey residential green roof contribution to buildings energy demand reduction in different climate zones of Iran. Int. J. Green Energy 2021, 18, 100–110. [Google Scholar] [CrossRef]
- Kuo, H.-F.; Tsou, K.-W. Application of Environmental Change Efficiency to the Sustainability of Urban Development at the Neighborhood Level. Sustainability 2015, 7, 10479–10498. [Google Scholar] [CrossRef]
- Bianchini, F.; Hewage, K. How “green” are the green roofs? Lifecycle analysis of green roof materials. Build. Environ. 2012, 48, 57–65. [Google Scholar] [CrossRef]
- Yuliani, S.; Hardiman, G.; Setyowati, E. Green-Roof: The Role of Community in the Substitution of Green-Space toward Sustainable Development. Sustainability 2020, 12, 1429. [Google Scholar] [CrossRef]
- Shafique, M.; Kim, R.; Rafiq, M. Green roof benefits, opportunities and challenges—A review. Renew. Sustain. Energy Rev. 2018, 90, 757–773. [Google Scholar] [CrossRef]
- Sushinsky, J.R.; Rhodes, J.R.; Possingham, H.P.; Gill, T.K.; Fuller, R.A. How should we grow cities to minimize their biodiversity impacts? Glob. Chang. Biol. 2013, 19, 401–410. [Google Scholar] [CrossRef] [PubMed]
- Ma’Bdeh, S.N.; Ali, H.H.; Rabab’Ah, I.O. Sustainable assessment of using green roofs in hot-arid areas—Residential buildings in Jordan. J. Build. Eng. 2022, 45, 103559. [Google Scholar] [CrossRef]
- Dromgold, J.R.; Threlfall, C.G.; Norton, B.; Williams, N.S.G. Green roof and ground-level invertebrate communities are similar and are driven by building height and landscape context. J. Urban Ecol. 2020, 6, juz024. [Google Scholar] [CrossRef]
- Nguyen, C.N.; Muttil, N.; Tariq, M.A.U.R.; Ng, A.W.M. Quantifying the Benefits and Ecosystem Services Provided by Green Roofs—A Review. Water 2022, 14, 68. [Google Scholar] [CrossRef]
- Dvorak, B.; Volder, A. Green roof vegetation for North American ecoregions: A literature review. Landsc. Urban Plan. 2010, 96, 197–213. [Google Scholar] [CrossRef]
- Simpson, C.; Brousse, O.; Heaviside, C. The Potential of Green Roofs in London (No. EGU22-7671). In Proceedings of the EGU General Assembly 2022, Vienna, Austria, 23–27 May 2022; Copernicus: Göttingen, Germany, 2022. [Google Scholar]
- Ran, J.; Tang, M. Effect of Green Roofs Combined with Ventilation on Indoor Cooling and Energy Consumption. Energy Procedia 2017, 141, 260–266. [Google Scholar] [CrossRef]
- La Roche, P.; Berardi, U. Comfort and energy savings with active green roofs. Energy Build. 2014, 82, 492–504. [Google Scholar] [CrossRef]
- Maiolo, M.; Pirouz, B.; Bruno, R.; Palermo, S.A.; Arcuri, N.; Piro, P. The Role of the Extensive Green Roofs on Decreasing Building Energy Consumption in the Mediterranean Climate. Sustainability 2020, 12, 359. [Google Scholar] [CrossRef]
- Rizwan, A.M.; Dennis, L.Y.; Chunho, L. A review on the generation, determination and mitigation of Urban Heat Island. J. Environ. Sci. 2008, 20, 120–128. [Google Scholar] [CrossRef]
- Zhang, G.; He, B.-J. Towards green roof implementation: Drivers, motivations, barriers and recommendations. Urban For. Urban Green. 2021, 58, 126992. [Google Scholar] [CrossRef]
- López-Silva, D.; Méndez-Alonzo, R.; Sauceda-Carvajal, D.; Sigala-Meza, E.; Zavala-Guillén, I. Experimental comparison of two extensive green roof designs in Northwest Mexico. Build. Environ. 2022, 226, 109722. [Google Scholar] [CrossRef]
- Ackerman, K.; Conard, M.; Culligan, P.; Plunz, R.; Sutto, M.P.; Whittinghill, L. Sustainable food systems for future cities: The potential of urban agriculture. Econ. Soc. Rev. 2014, 45, 189–206. [Google Scholar]
- Kratschmer, S.; Kriechbaum, M.; Pachinger, B. Buzzing on top: Linking wild bee diversity, abundance and traits with green roof qualities. Urban Ecosyst. 2018, 21, 429–446. [Google Scholar] [CrossRef]
- Rasul, M.G.; Arutla, L.K.R. Environmental impact assessment of green roofs using life cycle assessment. Energy Rep. 2020, 6, 503–508. [Google Scholar] [CrossRef]
- Shi, D.; Gao, Y.; Zeng, P.; Li, B.; Shen, P.; Zhuang, C. Climate adaptive optimization of green roofs and natural night ventilation for lifespan energy performance improvement in office buildings. Build. Environ. 2022, 223, 109505. [Google Scholar] [CrossRef]
- Tang, M.; Zheng, X. Experimental study of the thermal performance of an extensive green roof on sunny summer days. Appl. Energy 2019, 242, 1010–1021. [Google Scholar] [CrossRef]
- Bevilacqua, P.; Bruno, R.; Arcuri, N. Green roofs in a Mediterranean climate: Energy performances based on in-situ experimental data. Renew. Energy 2020, 152, 1414–1430. [Google Scholar] [CrossRef]
- Nadiri, H.; Hussain, K. Perceptions of service quality in North Cyprus hotels. Int. J. Contemp. Hosp. Manag. 2005, 17, 469–480. [Google Scholar] [CrossRef]
- Isik, B.; Tulbentci, T. Sustainable housing in island conditions using Alker-gypsum-stabilized earth: A case study from northern Cyprus. Build. Environ. 2008, 43, 1426–1432. [Google Scholar] [CrossRef]
- Philokyprou, M.; Michael, A. Environmental Sustainability in the Conservation of Vernacular Architecture. The Case of Rural and Urban Traditional Settlements in Cyprus. Int. J. Arch. Heritage 2020, 15, 1741–1763. [Google Scholar] [CrossRef]
- Tariku, F.; Hagos, S. Performance of green roof installed on highly insulated roof deck and the plants’ effect: An experi-mental study. Build. Environ. 2022, 221, 109337. [Google Scholar] [CrossRef]
- Kassir, L.N.; Darwish, T.; Shaban, A.; Olivier, G.; Ouaini, N. Mobility and bioavailability of selected trace elements in Mediterranean red soil amended with phosphate fertilizers: Experimental study. Geoderma 2012, 189–190, 357–368. [Google Scholar] [CrossRef]
- Ito, T.; Yu, C.-C.; Nakamura, K.; Chung, K.-F.; Yang, Q.-E.; Fu, C.-X.; Qi, Z.-C.; Kokubugata, G. Unique parallel radiations of high-mountainous species of the genus Sedum (Crassulaceae) on the continental island of Taiwan. Mol. Phylogenet. Evol. 2017, 113, 9–22. [Google Scholar] [CrossRef] [PubMed]
- Gurrea-Ysasi, G.; Blanca-Giménez, V.; Fernández de Córdova, P.; Cortés-Olmos, C.; Rodríguez-Burruezo, A.; Fita, I.C. Comparative Study of Different Crassulaceae Species for Their Potential Use as Plant Covers to Im-prove Thermal Performance of Green Roofs. Horticulturae 2022, 8, 846. [Google Scholar] [CrossRef]
- Shmeit, Y.H.; Fernandez, E.; Novy, P.; Kloucek, P.; Orosz, M.; Kokoska, L. Autopolyploidy effect on morphological variation and essential oil content in Thymus vulgaris L. Sci. Hortic. 2020, 263, 109095. [Google Scholar] [CrossRef]
- Kuete, V. Thymus vulgaris. In Medicinal Spices and Vegetables from Africa; Elsevier: Amsterdam, The Netherlands, 2017; pp. 599–609. [Google Scholar]
- Al-Snafi, A.E. Bioactive components and pharmacological effects of Canna indica-An Overview. Int. J. Pharmacol. Toxicol. 2015, 5, 71–75. [Google Scholar]
- Héral, B.; Stierlin, É.; Fernandez, X.; Michel, T. Phytochemicals from the genus Lavandula: A review. Phytochem. Rev. 2020, 20, 751–771. [Google Scholar] [CrossRef]
- Williams, N.S.; Lundholm, J.; Scott MacIvor, J. Do green roofs help urban biodiversity conservation? J. Appl. Ecol. 2014, 51, 1643–1649. [Google Scholar] [CrossRef]
- Barriuso, F.; Urbano, B. Green Roofs and Walls Design Intended to Mitigate Climate Change in Urban Areas across All Continents. Sustainability 2021, 13, 2245. [Google Scholar] [CrossRef]
- Ávila-Hernández, A.; Simá, E.; Xamán, J.; Hernández-Pérez, I.; Téllez-Velázquez, E.; Chagolla-Aranda, M. Test box experiment and simulations of a green-roof: Thermal and energy performance of a residential building standard for Mexico. Energy Build. 2020, 209, 109709. [Google Scholar] [CrossRef]
- Foustalieraki, M.; Assimakopoulos, M.; Santamouris, M.; Pangalou, H. Energy performance of a medium scale green roof system installed on a commercial building using numerical and experimental data recorded during the cold period of the year. Energy Build. 2017, 135, 33–38. [Google Scholar] [CrossRef]
- Kotsiris, G.; Nektarios, P.A.; Ntoulas, N.; Kargas, G. An adaptive approach to intensive green roofs in the Mediterranean climatic region. Urban For. Urban Green. 2013, 12, 380–392. [Google Scholar] [CrossRef]
- Guattari, C.; Evangelisti, L.; Asdrubali, F.; De Lieto Vollaro, R. Experimental Evaluation and Numerical Simulation of the Thermal Performance of a Green Roof. Appl. Sci. 2020, 10, 1767. [Google Scholar] [CrossRef]
- Fleck, R.; Gill, R.L.; Saadeh, S.; Pettit, T.; Wooster, E.; Torpy, F.; Irga, P. Urban green roofs to manage rooftop microclimates: A case study from Sydney, Australia. Build. Environ. 2022, 209, 108673. [Google Scholar] [CrossRef]
- Mandavgade, N.K.; Mungle, N.P.; Mandavgade, S.K.; Mungle, A.N.; Muley, M.D. Experimental analysis on roof construction. Mater. Today Proc. 2022, 49, 1395–1400. [Google Scholar] [CrossRef]
- Zuo, J.; Ma, J.; Lin, T.; Dong, J.; Lin, M.; Luo, J. Quantitative valuation of green roofs’ cooling effects under different urban spatial forms in high-density urban areas. Build. Environ. 2022, 222, 109367. [Google Scholar] [CrossRef]
- Dong, J.; Lin, M.; Zuo, J.; Lin, T.; Liu, J.; Sun, C.; Luo, J. Quantitative study on the cooling effect of green roofs in a high-density urban Area—A case study of Xiamen, China. J. Clean. Prod. 2020, 255, 120152. [Google Scholar] [CrossRef]
Disclaimer/Publisher’s Note: The statements, opinions and data contained in all publications are solely those of the individual author(s) and contributor(s) and not of MDPI and/or the editor(s). MDPI and/or the editor(s) disclaim responsibility for any injury to people or property resulting from any ideas, methods, instructions or products referred to in the content. |
© 2023 by the authors. Licensee MDPI, Basel, Switzerland. This article is an open access article distributed under the terms and conditions of the Creative Commons Attribution (CC BY) license (https://creativecommons.org/licenses/by/4.0/).