Article

Strategies for Environmental Protection and Optimization of Ecological Business Economic Growth from the Perspective of Sustainable Development

School of Economics and Management, Harbin University, Harbin 150086, China
*
Author to whom correspondence should be addressed.
Sustainability 2023, 15(3), 2758; https://doi.org/10.3390/su15032758
Submission received: 21 November 2022 / Revised: 16 January 2023 / Accepted: 19 January 2023 / Published: 2 February 2023

Abstract

:
The concept of ecological commercial economy refers to the use of ecological economics principles and system engineering methods to change production and consumption patterns within the scope of the carrying capacity of the ecosystem in order to tap into all of the available resource potential. It develops some economically developed and ecologically efficient industries and builds a culture with reasonable systems, a harmonious society, and a healthy ecological environment. This paper aims to use deep learning algorithms to study environmental protection and the optimization of ecological business economic growth from the perspective of sustainable development. In this regard, this paper proposes a theoretical model of environmental regulation, which aids in the study of the sustainable development of the ecological economy. Through experimental analysis, this study determined that the non-renewable resources of the two cities designated M and N dropped from 82% and 99% in 2017 to 78% and 79% in 2021, a decrease of 3% and 20%, respectively. This shows that the non-renewable resources of the four cities in area A generally showed a downward trend. The experimental results show that the deep learning theory and the environmental regulation model play a specific and effective role in the researching of the ecological business economy.

1. Introduction

After entering the age of industrialized society, although the economy has developed rapidly, the protection of the ecological environment has been neglected. The exhaustion of resources, the deterioration of the ecological environment, and the extinction of species have all become problems that need to be solved urgently. Developing an ecological business economy for the sustainable development of the global economy is one of the ways to solve our current problems. This research is from the perspective of sustainable development and takes sustainable development as its aim. In addition, environmental protection is conducted through the environmental regulation model, which refers to the various laws, regulations, and policies formulated by the government to protect the environment and people’s health. These regulations can take various forms in order to reduce pollution, protect natural resources, and protect the environment from damage. Aiming at the sustainable development of the regional economic system and the local economic environment complex system in Region A and using deep learning methods to analyse and discuss it helps in solving the current environmental protection problems to a certain extent. Therefore, this paper took area A as an experimental object to study the relationship between the ecological resources, consumption, economic growth, and the environmental quality in this area.
There are many research studies on the eco-business economy available at present. Asad has identified the sequential mediating role of sustainable human resource practices and sustainable innovation in the relationship between transformational leadership and SME performance using theoretical support from a resource-based view and competency-based motivational opportunities [1]. Asad examined the mediating role of psychological safety in the relationship between sustainable leadership and sustainable performance in SMEs. In addition, the moderating role of employee empowerment was further analysed considering its importance as the main resource for employee performance [2]. Qalati investigated the impact of technological-organisational-environmental factors on social media adoption and its effect on SME performance. The findings revealed that relative advantage, cost-effectiveness, compatibility, interactivity (technological), entrepreneurial orientation (organisational), and customer pressure (environmental) factors had a significant impact, while top management support (organisational) and competitive pressure (environmental) determinants had a negligible impact on social media adoption [3]. Sulaiman, while elucidating the important elements of organised retailing, found that visual merchandising would not only attract customers to the shop, but also prompt them to make impulse purchases [4]. Sosenko proposed an experimental study in the form of an ecological model to predict and analyse food safety issues [5]. These scholars have carried out research on the development of the ecological business economy, but because this literature does not disclose and explain the relevant data, the level of credibility for the content of these articles is not high.
At present, there are also many research studies available on deep learning algorithms and environmental protection. Habib used deep learning algorithms to classify the disease examination images from left-behind children in remote areas [6]. Ji’s research found that the clinical diagnosis of keratitis is highly dependent on medical images, so he proposed the use of deep learning algorithms for the automatic diagnosis of keratitis [7]. Yang proposed an improved algorithm based on a deep learning network to remove road image redundancy. The experimental results show that this method improves the speed and the accuracy of road recognition [8]. Bonardel proposed the introduction of a new licensed software using deep learning algorithms to acquire clinical CT images [9]. Li proposed a weakly supervised segmentation loss based on graph cuts to solve the problem of implementing deep networks, and in experiments, good performance was achieved on a dataset based on this method, proving its effectiveness [10]. However, the application field of the above research lacks research that is combined with an analysis of the ecological economy, which is analysed in this paper.
By referring to the above literature, we can understand sustainable human resources practices, the relationship between sustainable innovation in transformational leadership and the performance of small and medium-sized enterprises, the ecological model for the prediction and analysis of food safety, and also know the role a deep learning algorithm can play in the automatic diagnosis of keratitis. These articles have put forward effective research directions for the research content of this paper and have inspired the research methods chosen for this paper, which has accepted the research on the ecological environment obtained through the deep learning and environmental regulation model. The research on the eco-business economy in this paper is helpful for the harmonious coexistence of the economy and the ecological environment, and it can aid the economy and the environment in developing sustainably. It is innovative in that it uses deep learning, environmental regulation models, etc., to conduct empirical research on the development of ecological economy in a designated region, termed region A, which provides a reference for the data analysis of the ecological environment and ecological economics.
The innovation points of this paper are as follows: (1) Using the deep learning theory and the environmental regulation model, this paper analyses the relevant problems concerning the economic growth of ecological enterprises from the perspective of sustainable development and puts forward corresponding countermeasures. (2) The ESR value, EEYR value, energy value of renewable resources, energy value of non-renewable energy, and the value of waste and renewable energy are all compared with the value of non-renewable energy, so as to understand whether the cities in the region use their resources for economic development excessively.

2. Optimizing Ecological Business Economic Growth Methods from the Perspective of Sustainable Development

2.1. Ecological Business Economy
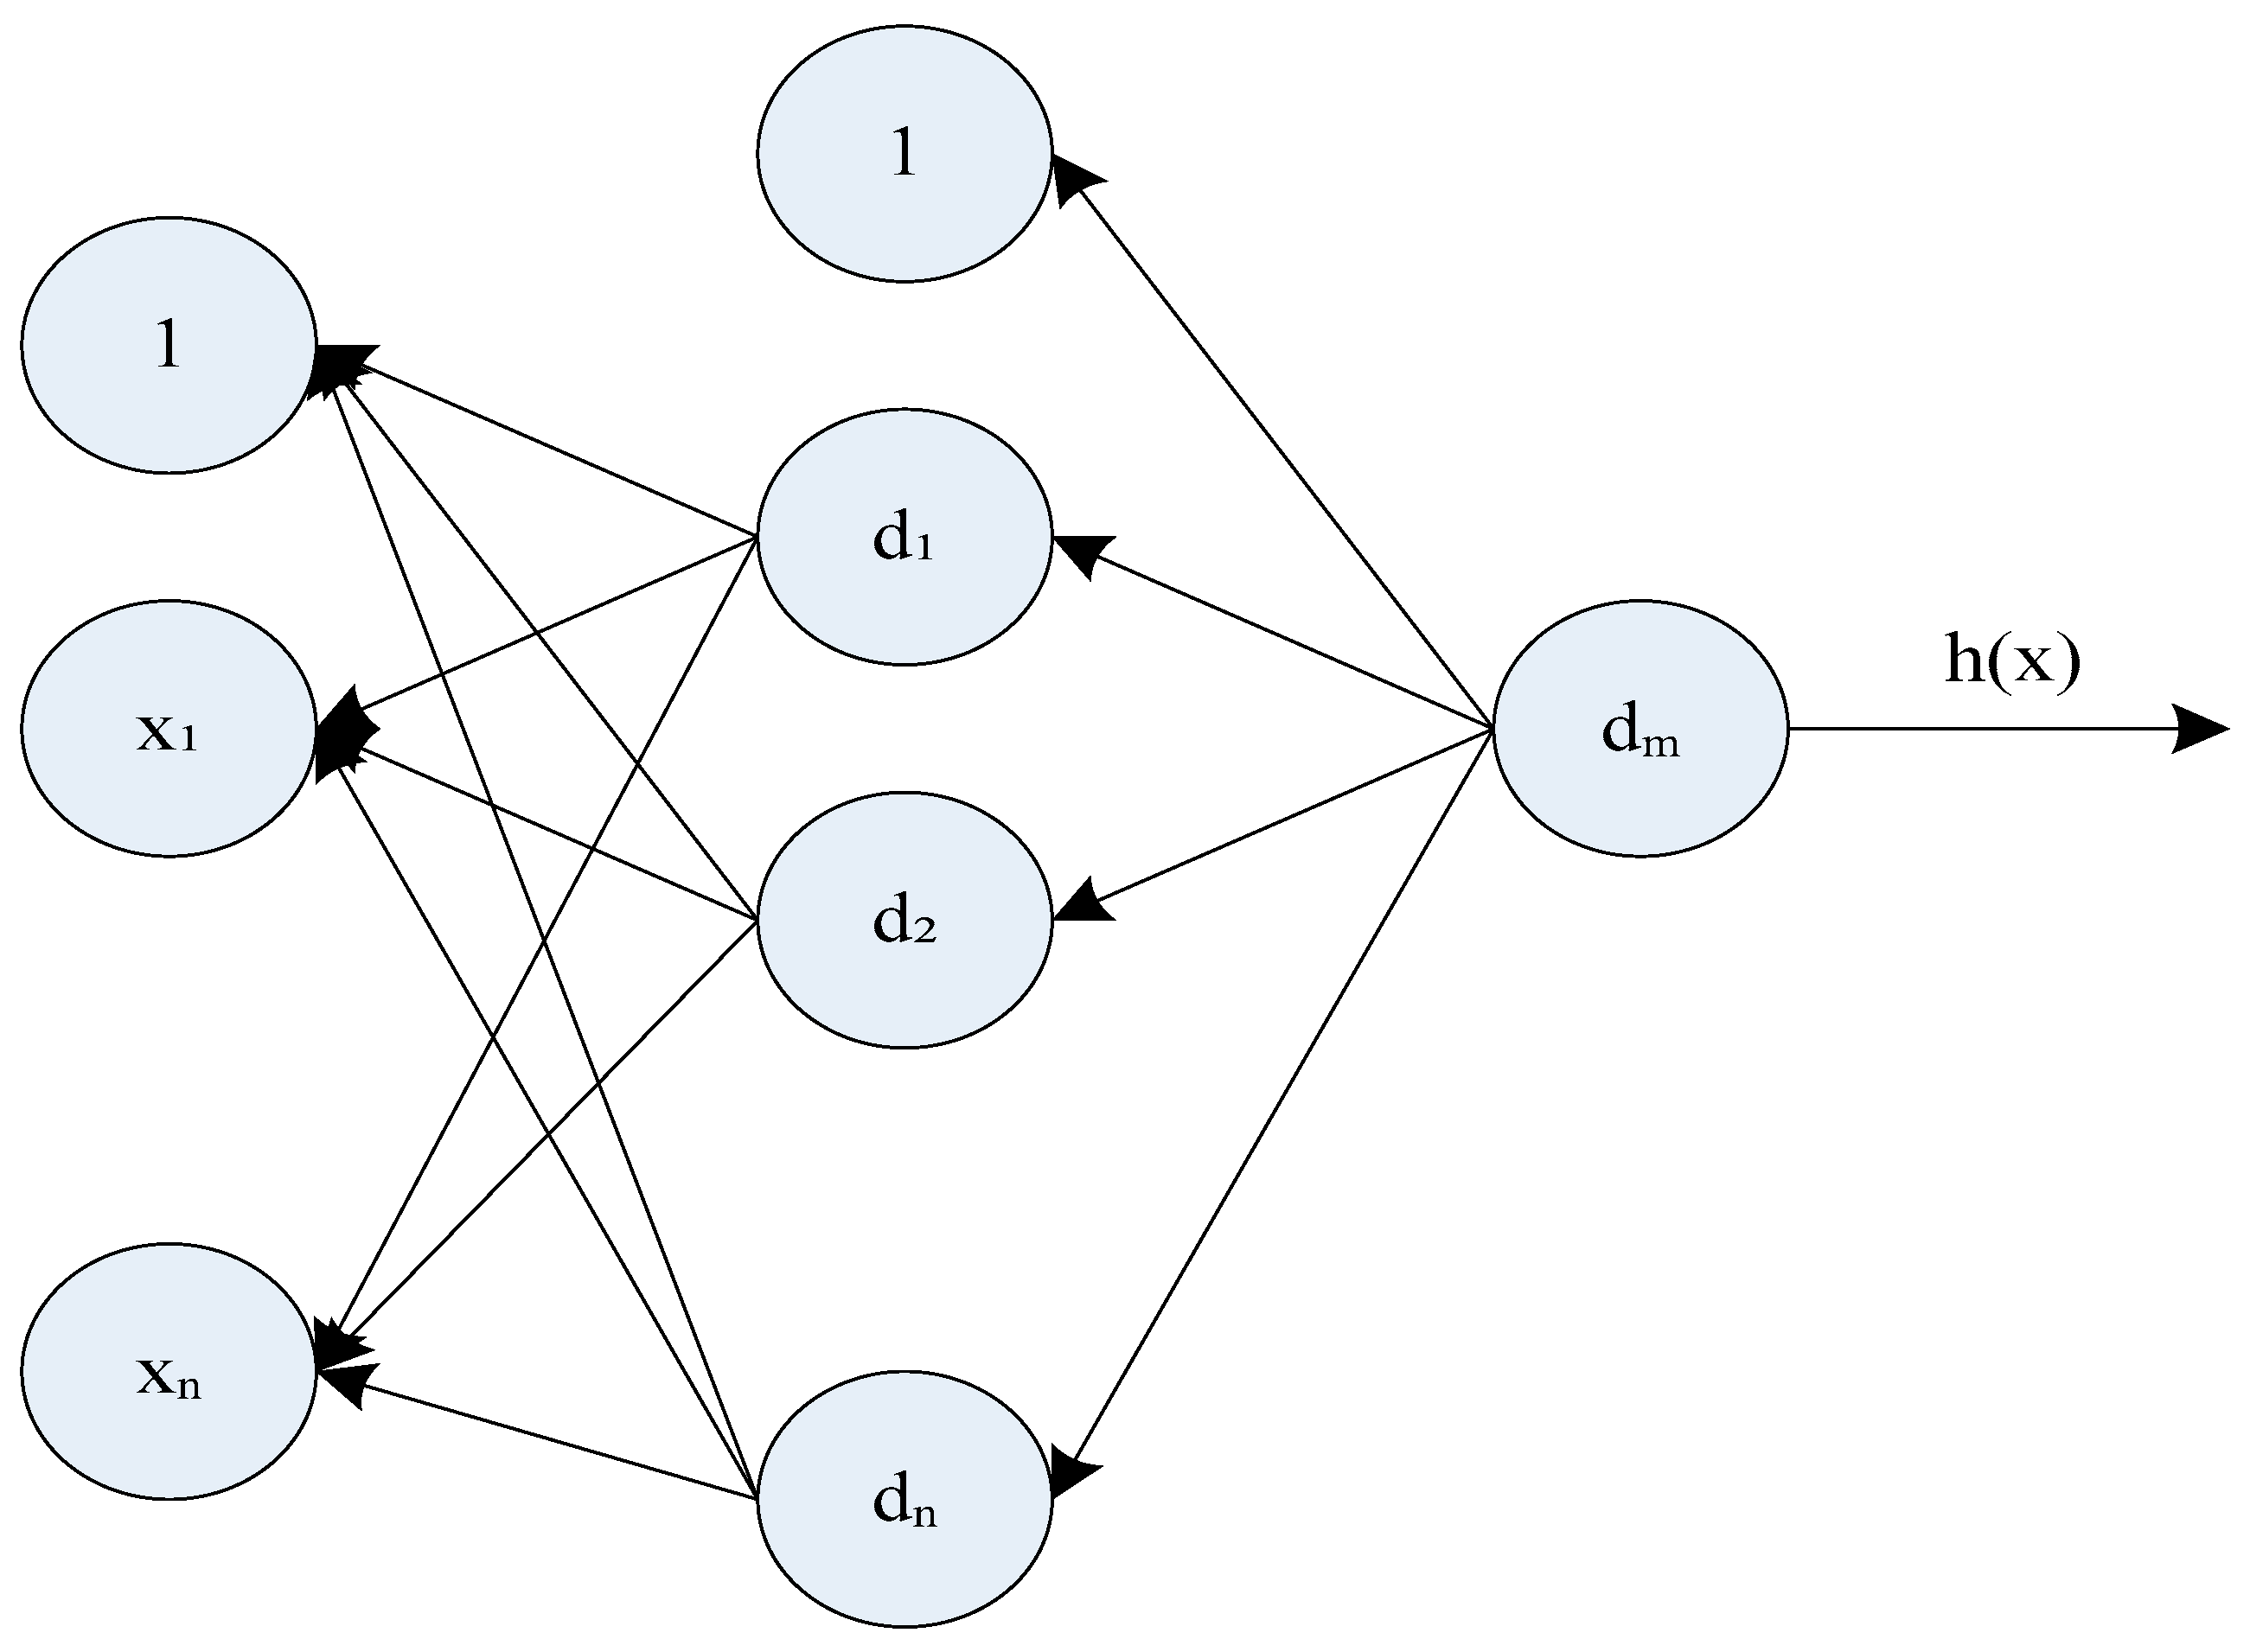
In the industrial age, in order to vigorously develop the economy, people neglected environmental protection. Nowadays, resources are exhausted, per capita resources are relatively insufficient, and the ecological environment foundation is even weaker; sustainable development is a necessary choice for human beings at present [11]. The impact of each stage of economic development is shown in Figure 1.
It can be seen from Figure 1 that A represents the starting point of the heavy chemical industry era, B represents the basic completion of the industrialization era, Q represents the beginning of the middle and late industrialization and the advanced industrial structure, and A—B represents the pollution era. It can be seen in the figure that in the pollution era, industrial pollution reaches its peak.
The ecological business economy is an economy that achieves a high degree of unity and the sustainable development of rapid economic development and environmental protection [12,13]. In order to study the growth strategy of the ecological business economy, this paper uses deep learning algorithms and theoretical models of environmental regulation to conduct research. A classic picture related to the ecological business economy is shown in Figure 2.
As can be seen from Figure 2, the ecological business economy can develop agriculture, fishery, animal husbandry, etc., while relying on the environment to develop the economy; this would also protect the environment.

2.2. Deep Learning

Deep learning is a complex machine learning algorithm whose goal is to enable machines to have the ability to analyse and learn like humans and to recognize data such as text, images, and sounds [14,15,16]. Deep learning has a wider application in economic and environmental analysis. A deep-learning-related model is shown in Figure 3:
In a deep network, the convolutional layer usually uses multiple different convolution kernel input feature values to obtain multiple output feature maps. These feature maps express the characteristics of different aspects of the input feature map, and compared with a single feature map, their expressive power can be maximized [17,18]. If the i layer is a two-dimensional convolutional layer, the obtained pixel value of the i feature map at 1 ( m , n ) is:
W i j m n = ( x p = 0 p i 1 q = 0 Q i 1 v i j x p q w ( i 1 ) x ( m + p ) ( n + q ) ) + r i j
Among these, r i j represents the bias, v i j x p q represents the weight corresponding to the input feature map at position ( p , q ) in the convolution kernel, and p i and Q i represent the height and width of the convolution kernel.
The convolutional layers mentioned in deep learning usually refer to convolutional layers with activation functions [19]. At this point, the value after two-dimensional convolution can be written as:
w i j m n = δ ( ( x p = 0 p i 1 q = 0 Q i 1 v i j x p q b w ( i 1 ) x ( m + p ) ( n + q ) ) + r i j )
Among these, δ ( ) represents the nonlinear activation function. The most commonly used nonlinear activation functions are the sigmoid function, the hyperbolic tangent function, and the modified linear unit, which are expressed as follows:
δ ( m ) = { 1 1 + exp ( m ) e m e m e m + e m max ( 0 , m )
Therefore, the main feature of deep learning algorithms is the use of local connections and weight sharing, which greatly reduces the weight parameters that need to be learned [20].

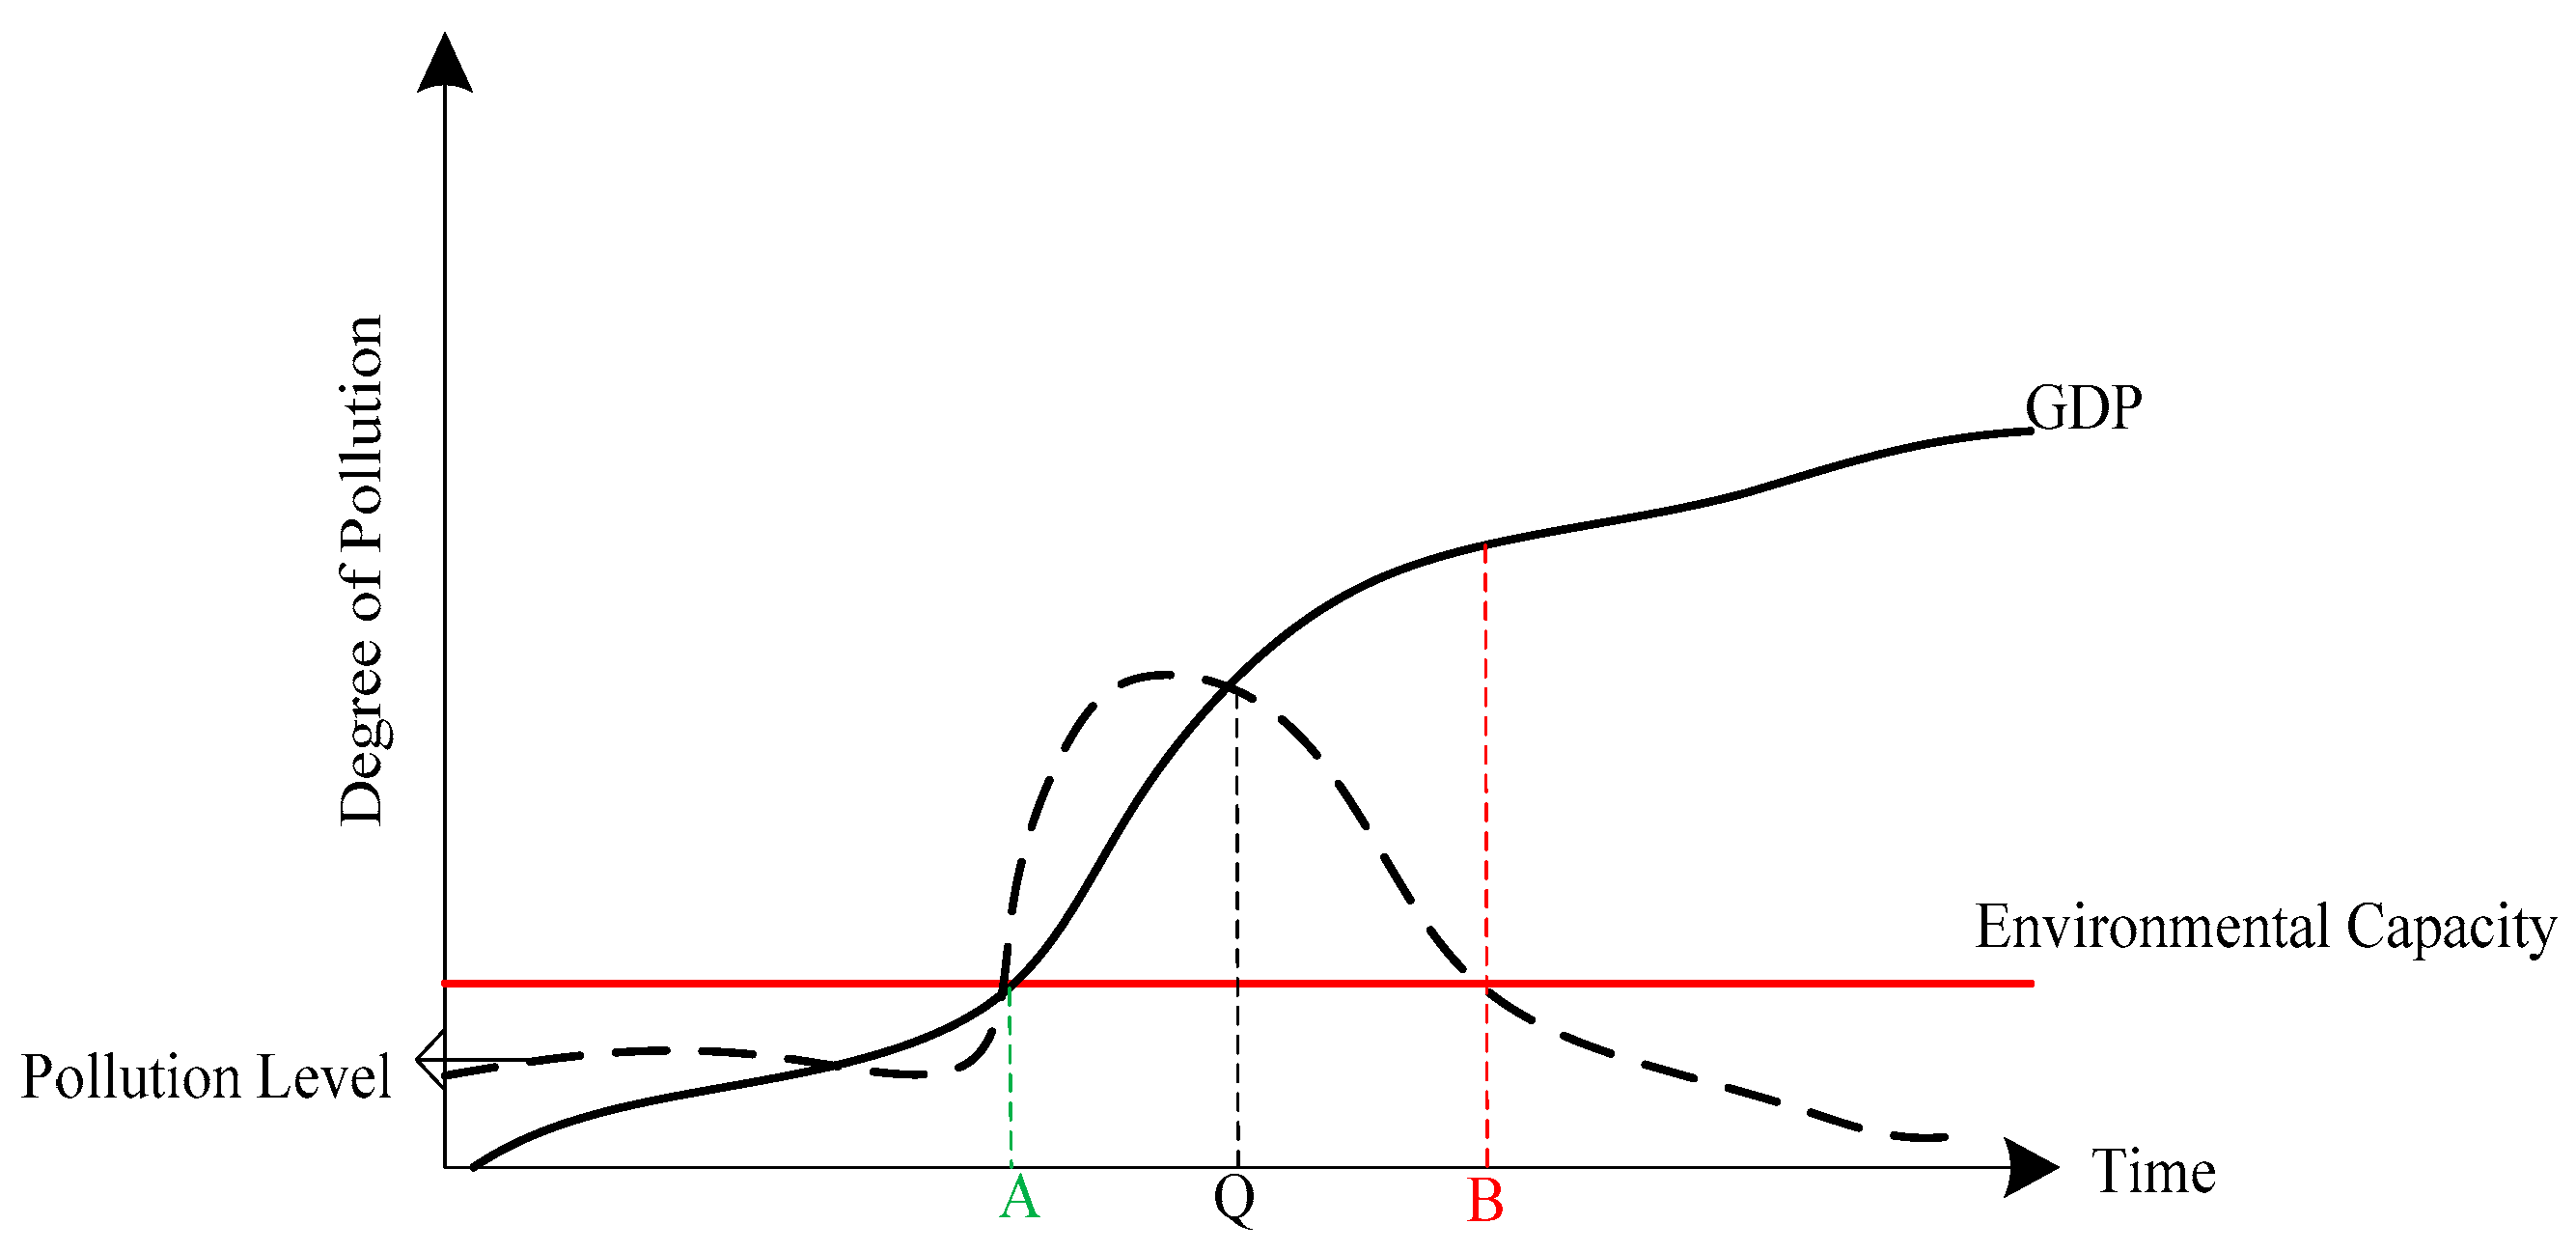
2.3. Theoretical Model of Environmental Regulation

Assuming that the representative firm i conforms to the Cobb–Douglas production function, its functional form is:
g ( H i t , S i t , E P i t ) = H i t α S i t β E P i t χ
Among these, 0 < α , β , χ < 1 represent the output elasticity of labour, capital, and environmental pollution factors, respectively.
According to the above assumptions, the production function of representative firms in region i and period t is:
N i t = A i t g ( H i t , S i t , E P i t ) = A i t H i t α S i t β E P i t χ
Since 0 < α < 1 , so 0 < 1 α < 1 .
Among these, the price level, technology level, and employment level are positively related, and the capital and environmental regulation are related to β and χ , respectively [21]. Therefore, in order to further examine the relationship between environmental regulation and the ecological business economy, the function is used to perform partial differentiation on environment λ i t , and it is able to obtain:
ε i t E P i t = 0 , τ i t A i t g ( H i t , S i t , E P i t ) E P i t = λ i t
In the formula: is the environmental coefficient. Using Equation (6) to partially differentiate E P i t , it is able to obtain:
g ( H i t , S i t , E P i t ) E P i t = χ H i t α S i t β E P i t χ 1
In the formula: χ denotes the technical element.
χ τ i t A i t H i t α S i t β E P i t χ 1 = λ i t
In the formula: α represents the price level parameter.
This conforms to the law of the price elasticity of normal commodities, so it can construct the price elasticity 𝜑 e p of environmental pollution as:
𝜑 e p = λ i t E P i t E P i t λ i t
As the intensity of environmental regulation increases, the input of pollution factors would inevitably decrease, so 𝜑 e p = λ i t E P i t E P i t λ i t < 0 .
Therefore, it is only necessary to discuss the magnitude of elasticity 𝜑 e p and 1 to determine the relationship between the magnitude of environmental regulation and employment.

3. Experiments Based on Eco-Commerce Economic Growth

3.1. Experimental Data

The experiment in this paper takes the area of Guangdong, Shenzhen (marked as A) as the experimental object. Area A is close to the sea, rich in natural resources, possesses numerous ports, is developed in shipping, and relatively mature in its development of foreign trade industry [22].
This paper assumes that the ESR value, EEYR value, renewable resource energy, non-renewable resource energy, the waste and renewable energy value, and the non-renewable energy values for four cities (H, K, M and N) can be measured at the same time.
The economic system energy flow indicators in region A include land environment energy, marine environment energy, external input energy, and regional output energy. This paper uses the relevant data from the statistical yearbooks of the provinces and cities in the A region to calculate the energy flow indicators of the four cities (H city, K city, M city, and N city, namely, Futian District, Nanshan District, Yantian District, and Longgang District) in the five years from 2017 to 2021. The specific conditions are shown in Table 1, Table 2, Table 3 and Table 4, which show the environmental energy flow index tables in the A area.
It can be seen from Table 1 that when calculating the coastal environmental energy in the ring A area, the average value of the local average illumination time, wind speed, precipitation, etc. is processed. Among these, the annual average sunshine time is 2300 h, the annual average wind speed is 7 m per second, the annual average precipitation is 600 mL, and the annual average tide height and wave height are 2.6 m and 0.6 m, respectively.
Taking the energy flow of city H as an example, calculations are made, and the specific data is shown in Table 2.
It can be seen from Table 2 that when calculating the possible values that cannot be updated in all provinces and cities, since the specific input of other mineral resources except energy projects cannot be obtained, this paper only calculates the solar value input corresponding to the three basic production materials of crude oil, natural gas, and electricity. The energy value of various mineral resources input are represented through this method.
Based on the annual energy flow indicators for each city, the energy evaluation indicators of each province and city are calculated, and the sustainable development analysis is carried out in combination with the local economic development status and industrial structure characteristics [23,24].
It can be seen from Table 3 that during the five years from 2017 to 2021, the energy/currency ratio of Ring A continued to decline. It shows that the economic and technological level of the Ring A area is on a continuous upward trend, and its development process includes not only the expansion of economic scale, but also the improvement of the economic and technological level. At the same time, the continuous downward trend of the energy self-sufficiency rate (ESR) and the continuous upward trend of the energy investment rate (EIR) indicate that the level of economic export in Ring A continues to increase. Regional economic development no longer only pays attention to the utilization of the environment and resource elements in the region, and the utilization level of the environment and resources outside the region and even in the world is increasing day by day. This reflects from one side that the internationalization of the economic development of the Ring A area is increasing day by day. At the same time, although the energy exchange rate EER increased slightly, its absolute level of approximately 0.21 shows that Ring A is in a disadvantageous position of net energy outflow in foreign trade. Although international trade has brought about the growth of GDP and the input of the external environment and the energy value of economic factors, the persistently low EER will inevitably have an adverse impact on the sustainable development of the region.
On the demand side of regional economic development, the economic energy output rate EEYR shows a slight upward trend, which indicates that the economic development in this region is less dependent on the environmental and economic factors provided by its own regional environmental system. However, considering the rapid decline of the energy value ratio of renewable energy and the continuous downward trend of the energy value/currency ratio, it can be inferred that the slight upward trend of the EEYR index is due to the decline of the input ratio of the renewable energy value in the economic development of Area A. The dependence of regional economic development on non-renewable resource elements in the region has actually increased rather than decreased [25,26,27]. For the change trend of energy flow in H city, the specific situation is shown in Table 4.
It can be seen from Table 4 that the input amount of renewable energy value E m R basically did not change, while the input energy value E m I outside the area and the regional energy value output E m Y basically showed the same trend of change, and only the input of non-renewable energy value E m N showed a rapid growth trend. That is to say, the rapid growth of E m N is the main driving force behind the continuous expansion of the economic scale of the region. This trend directly reflects that the region’s growth model is still an extensive growth model dominated by scale expansion, and the sustainability of regional economic development is low. On the emission side of regional economic development, a continuous downward trend can be seen, which can be understood as the reason why the comprehensive environmental load rate IELR also shows an upward trend. However, its increase is obviously smaller than the trend of ELR, and the reason is that the ratio of waste and renewable energy is introduced, which is an indicator for describing the pollution pressure of regional economic development on the regional environmental system. The indicators of the pollution pressure of wastewater discharge in H city can be seen from the environmental statistical yearbooks from each year. It can be seen in the Environmental Statistical Yearbook from 2017 to 2021 that the discharge compliance rate of wastewater in this area is gradually increasing, and the discharge of solid waste is also decreasing year by year. This reflects the great investment in environmental protection and emission control in various regions, which is undoubtedly beneficial to the sustainable development of the regional environmental economic system. The original ELR indicator does not reflect this, and it is also an imperfect determinant, and the IELR indicator undoubtedly reflects the results more comprehensively in this regard. In addition, the ratio of waste to total energy also shows a downward trend year by year, which reflects the gradual increase in the level of resource utilization in the region, which contributes to the sustainable development of the ecological business economy.
In terms of the regional sustainable development index, in 2021, both the ESI and EISD indicators in the H city have dropped to only about one-fifth of their levels in 2017. This shows that the overall sustainability of regional development presents a rapid downward trend. For the two indicators EIRSD and EIRSD × EER, the rate of decline is significantly slower. This also shows that the two factors of increasing regional extroversion and increasing environmental protection investment have a positive effect on optimizing the ecological business economy. The latter is not reflected in the ESI and EISD indicators, which is also the reason for the slower decline of EIRSD and EIRSD × EER.

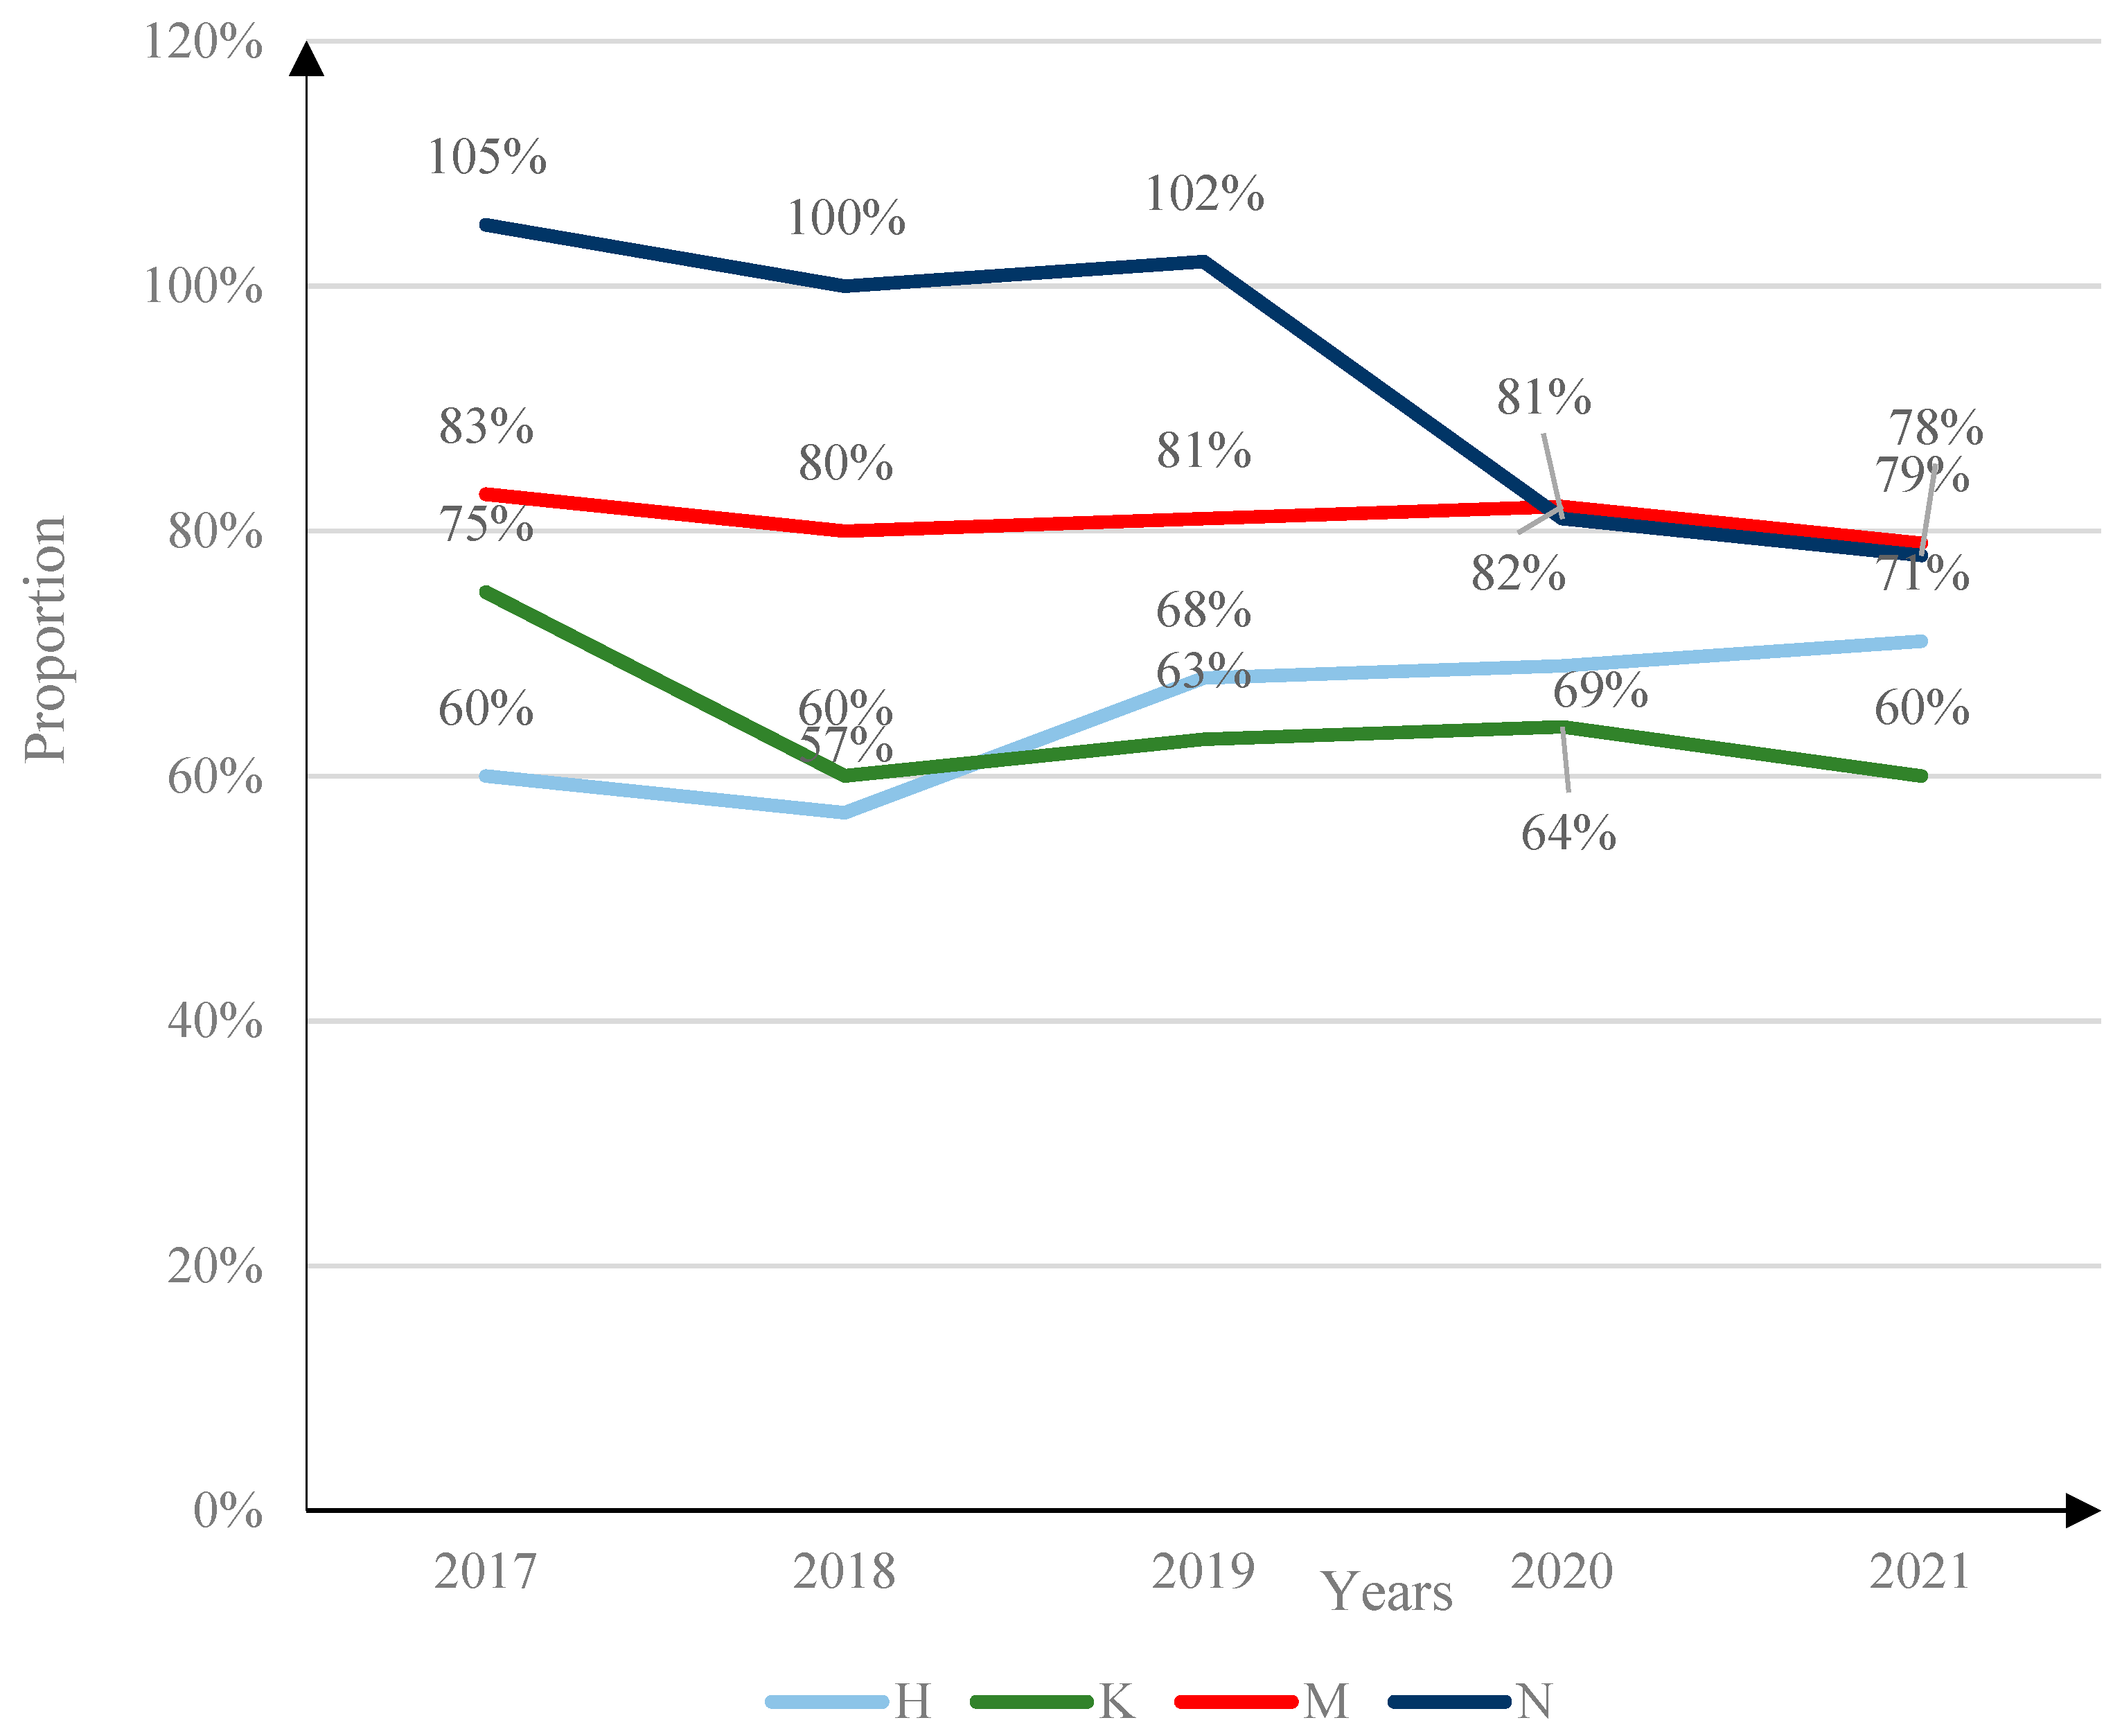
3.2. Evaluation of Various Indicators of Ecological Business Economy

Region A is rich in natural resources. In order to adapt to the development of the local economy, its energy self-sufficiency is adequate. The specific situation is shown in Figure 4.
It can be seen from Figure 4 that the ESR trend of the four cities in the region is generally flat, but there is a downward trend. Among these, the N city showed a decreasing trend, especially after 2019, from 102% to 81% in 2020, a decrease of 21%. This shows that the urban energy storage in N city is declining, and the energy self-sufficiency is declining. To sum up, each city’s own environment and resource elements, especially non-renewable resource elements, cannot meet its own development needs, and each must rely on imported resources to provide for its own development.
The statistics for renewable and non-renewable resources in the city are shown in Figure 5.
It can be seen from Figure 5a that the non-renewable resources of the four cities in Area A generally show a downward trend. Especially in cities M and N, where the non-renewable resources of the two cities dropped from 82% and 99% in 2017 to 78% and 79% in 2021, a decrease of 3% and 20%. It can be seen from Figure 5b that the renewable resources in Area A show a downward trend, from an overall rate of about 25% in 2017 to about 5% in 2021, a decrease of about 20%. It can be seen that the renewable resources in the A area are declining year by year, and the pattern for the non-renewable resources is similar, but the H and K cities are in a state of fluctuation. This shows that the cities in Region A are increasing the utilization of resources, and the degree of export-oriented economic development is increasing. This trend has an irreversible impact on the sustainable development of the ecological business economy.
As far as the ratio of ESR and non-renewable resources energy is concerned, except for H city, the ratio levels of other cities tend to be the same, and H city is obviously lower, which is directly related to the industrial structure of H city. City H used to be an old industrial base; its industrial structure is dominated by high energy consumption, and the supply capacity of non-renewable resources is saturated. However, its economic development is in a transitional stage, and it has not shifted from scale-expanding growth to technologically progressive growth, which makes it necessary to rely heavily on imported resources to maintain economic development, which also makes the ESR value lower than that of other regions.
If we want to analyse the degree of dependence of the cities in the region A on the environment in the process of economic development, we need to look at the economic output rate of region A [28,29]. The specific situation is shown in Figure 6.
It can be seen from Figure 6 that in terms of the economic energy output rate EEYR, the K city and N city are in a state of fluctuation, but the whole is declining. The EEYR value of K city in 2017 was 1.1, the EEYR value in 2021 was 1, and the EEYR value of N city in 2017 was 2, and in 2021, it dropped to 1.7. The EEYR values for the H and M cities are gradually increasing. This reflects the fact that cities K and N have a gradually increasing demand and dependence on their own environmental systems in optimizing the ecological business economy, while the demand and dependence of the H and M cities on their own environmental systems showed a downward trend in the process.
Concerning the statistics for waste in area A, they show a certain relationship with the renewable energy value and also have a certain relationship with the total energy value. The specific situation is shown in Figure 7.
Figure 7a is a comparison chart for the municipal waste and renewable energy values in area A. It can be seen from Figure 7a that the ratio of waste to renewable energy value in cities in this region first decreased and then increased, while the ratio of waste to total energy value showed a downward trend year by year. Taking N city as an example, the waste and renewable energy value ratio of N city in 2017 decreased from 13 to 6.6 in 2019, and then rose to 9 in 2021. Figure 7b shows the ratio of municipal waste to total energy in area A, and the overall trend is decreasing year by year. This reflects that from 2017 to 2021, the waste discharge in each city dropped to a relatively stable level, which is closely related to the continuous strengthening of environmental protection and the control of pollution discharge and governance. However, due to the large-scale expansion of regional economic systems and the increasing demand for extension, the effect had by the investment in environmental protection is far from the expected requirements.

3.3. Issues and Suggestions on the Sustainable Development of the Ecological Business Economy in Region A

This chapter combines deep learning theory and environmental regulation theory to analyse and research the sustainable development of the ecological business economy in four cities in Region A. In view of the problems determined by the above analysis, some relevant suggestions are put forward here, as follows:
(1)
In Region A, resources are used blindly for economic development. It is suggested that the regional government of A should effectively change their guiding ideology for economic development, not to blindly pursue the development method of indicators, but to establish the idea of insisting on promoting the development of the ecological business economy with technological progress and industrial optimization and upgrading as the driving forces.
(2)
Because the cities in Region A focus on the development of heavy industry, their demand for resources is large, and the pressure on the environment is also relatively large. In this regard, the government and enterprises should also focus on improving the industrial level and resource utilization level of resource-based cities, pay attention to environmental protection, and make the city’s economic development and environmental protection coexist in harmony.

4. Conclusions

This study starts from the perspective of sustainable development, taking sustainable development as the goal. The research contained in this paper refers to many materials in the literature, and the research results obtained also confirm the intermediary role of psychological safety in the relationship between sustainable leadership and the sustainable performance of enterprises; it also verifies the role of the improved algorithm of the deep- learning network in eliminating the redundancy of road images. However, this study also has some limitations. Due to the short time frame for the experimental research and the low accuracy of the experimental results, the experiment needs further improvement. However, there is reason to believe that with the progress of science and technology, there will be more intelligent deep learning algorithms created to improve and optimize the environmental monitoring model, so as to promote the research of enterprises on environmental protection and the optimization of ecological and commercial economic growth.

Author Contributions

L.M. and X.L. designed and performed the experiment and prepared this manuscript. All coauthors contributed to manuscript editing. All authors have read and agreed to the published version of the manuscript.

Funding

This research received no external funding.

Institutional Review Board Statement

Not applicable.

Informed Consent Statement

Not applicable.

Data Availability Statement

The data that support the findings of this study are available from the corresponding author upon reasonable request.

Conflicts of Interest

The authors declare no conflict of interest.

References

  1. Asad, M.; Asif, M.U.; Bakar, L.J.A. Transformational Leadership, Sustainable Human Resource Practices, Sustainable Innovation and Performance of SMEs. In Proceedings of the International Conference on Decision Aid Sciences and Application (DASA), Sakheer, Bahrain, 7–8 December 2021; pp. 797–802. [Google Scholar]
  2. Asad, M.; Asif, M.U.; Allam, Z. A Mediated Moderated Analysis of Psychological Safety and Employee Empowerment between Sustainable Leadership and Sustainable Performance of SMEs. In Proceedings of the International Conference on Sustainable Islamic Business and Finance, Sakheer, Bahrain, 5–6 December 2021; pp. 33–38. [Google Scholar]
  3. Qalati, S.A.; Ostic, D.; Sulaiman, M.A.B.A. Social Media and SMEs’ Performance in Developing Countries: Effects of Technolog-ical-Organizational-Environmental Factors on the Adoption of Social Media. SAGE Open 2022, 12, 1–13. [Google Scholar] [CrossRef]
  4. Sulaiman, M.A.; Ahmed, M.N. The Essential Elements of Organized Retail Stores in Influencing Customers to Stores. Int.-Natl. J. Appl. Bus. Econ. Res. 2017, 15, 1–21. [Google Scholar]
  5. Sosenko, F.; Bramley, G.; Bhattacharjee, A. Understanding the post-2010 increase in food bank use in England: New qua-si-experimental analysis of the role of welfare policy. BMC Public Health 2022, 22, 1363. [Google Scholar]
  6. Habib, A.R.; Crossland, G.; Patel, H.; Wong, E.; Kong, K.; Gunasekera, H.; Richards, B.; Caffery, L.; Perry, C.; Sackset, R.; et al. An Artificial Intelligence Computer-vision Algorithm to Triage Otoscopic Images From Australian Aboriginal and Torres Strait Islander Children. Otol. Neurotol. 2022, 43, 481–488. [Google Scholar]
  7. Ji, Q.; Jiang, Y.; Qu, L.; Yang, Q.; Zhang, H. An Image Diagnosis Algorithm for Keratitis Based on Deep Learning. Neural Process. Lett. 2022, 54, 2007–2024. [Google Scholar] [CrossRef]
  8. Yang, S.; Wang, H.; Chen, Q. An improved algorithm based on deep learning network for road image redundancy removal. J. Supercomput. 2022, 78, 10385–10404. [Google Scholar] [CrossRef]
  9. Bonardel, G.; Dupont, A.; Decazes, P.; Queneau, M.; Modzelewski, R.; Coulot, J.; Le Calvez, N.; Hapdey, S. Clinical and phantom validation of a deep learning based denoising algorithm for F-18-FDG PET images from lower detection counting in comparison with the standard acquisition. EJNMMI Phys. 2022, 9, 1–23. [Google Scholar] [CrossRef]
  10. Li, M.; Chen, D.; Liu, S. Weakly Supervised Segmentation Loss Based on Graph Cuts and Superpixel Algorithm. Neural Process. Lett. 2022, 54, 2339–2362. [Google Scholar] [CrossRef]
  11. Zhang, W.; Liu, X.; Zhang, Z. Mechanical, expansion and rheological properties of circulating fluidized bed fly ash based ecological cement: A critical review. Int. J. Miner. Metall. Mater. 2022, 29, 1670–1682. [Google Scholar] [CrossRef]
  12. Bichi, B.Y.; Islam, S.U.; Kademi, A.M.; Ahmad, I. An energy-aware application module for the fog-based internet of military things. Discov. Internet Things 2022, 2, 1–14. [Google Scholar] [CrossRef]
  13. Kostylev, P.I.; Ladatko, M.A.; Krasnova, E.V.; Zeleneva, I.A.; Aksenov, A.V. Ecological trial of the rostov rice varieties in the Krasnodar territory. Grain Econ. Russ. 2021, 1, 44–51. [Google Scholar]
  14. Chaitanya, B.K.; Yadav, A.; Pazoki, M. Wide area monitoring and protection of microgrid with DGs using modular artificial neural networks. Neural Comput. Appl. 2020, 32, 2125–2139. [Google Scholar] [CrossRef]
  15. Meng, F.; Zheng, Y.; Bao, S.; Wang, J.; Yang, S. Formulaic language identification model based on GCN fusing associated information. PeerJ Comput. Sci. 2022, 8, e984. [Google Scholar] [CrossRef]
  16. Xu, Z.; Kamruzzaman, M.M.; Shi, J. Method of generating face image based on text description of generating adversarial network. J. Electron. Imaging 2022, 31, 051411. [Google Scholar]
  17. Novello, C. Ecological Destruction and Consumerism: A critique of modern society through the works of the contemporary German author Ilija Trojanow. Exch. Interdiscip. Res. J. 2021, 8, 28–46. [Google Scholar]
  18. Panpakdee, C.; Palinthorn, F. Does the COVID-19 pandemic affect social-ecological resilience of organic rice production system in Chiang Mai Province, Thailand? For. Soc. 2021, 15, 209–223. [Google Scholar] [CrossRef]
  19. Veral, E.S. The Circular Economy: Barriers, Strategies and Business Models. Ank. Üniv. Çevrebilimleri Derg. 2021, 8, 7–18. [Google Scholar]
  20. Jiang, Y.; Chen, M.; Zhang, J.; Sun, Z.; Sun, Z. The improved coupling coordination analysis on the relationship between climate, eco-environment, and socio-economy. Environ. Ecol. Stat. 2021, 29, 77–100. [Google Scholar] [CrossRef]
  21. Wang, S.; Wang, J.; Fan, F. The hidden mediating role of innovation efficiency in coordinating development of economy and ecological environment: Evidence from 283 Chinese cities. Environ. Sci. Pollut. Res. 2021, 28, 47668–47684. [Google Scholar] [CrossRef]
  22. Ning, J.; Liu, J.; Kuang, W.; Xu, X.; Zhang, S.; Yan, C.; Li, R.; Wu, S.; Hu, Y.; Du, G.; et al. Spatiotemporal patterns and characteristics of land-use change in China during 2010–2015. J. Geogr. Sci. 2018, 28, 547–562. [Google Scholar] [CrossRef]
  23. Goh, C.L. Will digitization, big data and artificial intelligence- and deep learning–based algorithm govern the practice of medicine? J. Eur. Acad. Dermatol. Venereol. 2022, 36, 947. [Google Scholar] [CrossRef]
  24. Park, H.J.; Choi, S.Y.; Lee, J.E.; Lim, S.; Lee, M.H.; Yi, B.H.; Cha, J.G.; Min, J.H.; Lee, B.; Jung, Y. Deep learning image reconstruction algorithm for abdominal multi-detector CT at different tube voltages: Assessment of image quality and radiation dose in a phantom study. Eur. Radiol. 2022, 32, 3974–3984. [Google Scholar] [CrossRef]
  25. Atassi, R.; Yang, K. An Integrated Neutrosophic AHP and TOPSIS Methods for Assessment Renewable Energy Barriers for Sustainable Development. Int. J. Neutrosophic Sci. 2022, 18, 157–173. [Google Scholar] [CrossRef]
  26. Romero, C.A.T.; Castro, D.F.; Ortiz, J.H.; Khalaf, O.I.; Vargas, M.A. Synergy between circular economy and industry 4.0: A literature review. Sustainability 2021, 13, 4331. [Google Scholar] [CrossRef]
  27. Wisesa, O.; Andriansyah, A.; Khalaf, O.I. Prediction Analysis for Business To Business (B2B) Sales of Telecommunication Services using Machine Learning Techniques. Majlesi J. Electr. Eng. 2020, 14, 145–153. [Google Scholar] [CrossRef]
  28. Chen, D.; Miao, D.; Zhao, C.; Zhou, H. Candidate region acquisition optimization algorithm based on multi-granularity data en-hancement. Int. J. Mach. Learn. Cybern. 2022, 13, 1847–1860. [Google Scholar]
  29. Balamurugan, R.; Ratheesh, S.; Venila, Y.M. Classification of heart disease using adaptive Harris hawk optimization-based clus-tering algorithm and enhanced deep genetic algorithm. Soft Comput. 2022, 26, 2357–2373. [Google Scholar] [CrossRef]
Figure 1. Effects of various stages of economic development.
Sustainability 15 02758 g001
Figure 2. Classic pictures related to the eco-commerce economy.
Sustainability 15 02758 g002
Figure 3. Deep-learning-related models.
Sustainability 15 02758 g003
Figure 4. The ESR trend of the four cities in Area A. H, K, M and N refer to the four cities in Region A respectively.
Sustainability 15 02758 g004
Figure 5. Trends in the ratio of renewable and non-renewable resources in cities. (a) Trend chart of the urban non-renewable resources energy ratio; (b) Trend chart of the ratio of energy value of urban renewable resources. H, K, M and N refer to the four cities in Region A respectively.
Sustainability 15 02758 g005
Figure 6. EEYR trend graph of the economic energy output rate in Region A. H, K, M and N refer to the four cities in Region A respectively.
Sustainability 15 02758 g006
Figure 7. Trend diagram for the ratio of waste to renewable energy value and total energy value in Region A. (a) Trend chart for the ratio of waste and renewable energy in each city in Region A. (b) Trend diagram for the ratio of urban waste and total energy value in each city in Region A. H, K, M and N refer to the four cities in Region A respectively.
Sustainability 15 02758 g007
Table 1. Coastal Environmental energy Flow Index Table in Ring A Region.
ProjectSolar Value
Renewable Energy ValueSolar Energy5.93 × 1023
Wind Energy7.16 × 1023
Rainwater Chemical Energy3.83 × 1020
Tidal Energy2.89 × 1020
Wave Energy1.77 × 1021
Total3.27 × 1023
Non-Renewable Energy ValueOil4.23 × 1023
Natural Gas2.40 × 1022
Total4.45 × 1023
Resource Energy OutputOil5.20 × 1022
Total5.20 × 1022
Table 2. H market energy flow index table.
Project20172018201920202021
Terrestrial Renewable Energy ValueSolar Energy1.54 × 10221.57 × 10221.55 × 10221.60 × 10221.42 × 1022
Wind Energy1.74 × 10221.74 × 10221.74 × 10221.74 × 10221.74 × 1022
Freshwater Fishing1.25 × 10226.41 × 10216.80 × 10216.44 × 10216.90 × 1021
Total1.03 × 10239.29 × 10227.25 × 10229.63 × 10228.19 × 1022
Ocean Renewable Energy ValueOcean Fishing2.77 × 10223.29 × 10222.91 × 10222.91 × 10222.88 × 1022
Crude Salt3.24 × 10224.32 × 10225.11 × 10223.89 × 10224.12 × 1022
Total6.03 × 10227.33 × 10228.03 × 10226.80 × 10227.01 × 1022
E m R 1.64 × 10231.65 × 10231.52 × 10231.63 × 10231.51 × 1023
Non-renewable Energy ValueCrude1.19 × 10231.16 × 10231.12 × 10231.18 × 10231.37 × 1023
Natural Gas6.96 × 10219.60 × 10211.09 × 10221.23 × 10221.21 × 1022
Electricity4.62 × 10212.80 × 10212.08 × 10212.56 × 10213.29 × 1021
Fertilizer7.27 × 10227.57 × 10227.80 × 10228.11 × 10228.53 × 1022
E m N 2.03 × 10242.20 × 10242.96 × 10244.53 × 10246.11 × 1024
Foreign ExchangeInput Crude Oil3.01 × 10227.02 × 10226.39 × 10229.26 × 10221.26 × 1022
Input Natural Gas8.68 × 10211.00 × 10219.80 × 10211.13 × 10215.98 × 1021
Input Power1.02 × 10221.21 × 10221.19 × 10222.06 × 1022-
Export Crude Oil6.15 × 10201.81 × 10221.91 × 1022-2.92 × 10²²
Export Natural Gas3.28 × 10215.30 × 10216.36 × 10215.61 × 10216.98 × 1021
Output Power1.36 × 10223.23 × 10224.00 × 1022--
Foreign Tourism1.13 × 10211.55 × 10211.99 × 10212.28 × 10212.91 × 1021
E m I 2 1.19×10231.19 × 10231.19 × 10231.19 × 10231.19 × 1023
E m I M 1.33×10221.82 × 10222.48 × 10225.01 × 10226.82 × 1022
E m E X 1.54 × 10231.73 × 10232.34 × 10235.12 × 10237.11 × 1023
E m U 2.56 × 10242.87 × 10243.73 × 10245.63 × 10248.13 × 1024
WasteWaste water7.69 × 10226.35 × 10227.43 × 10228.85 × 10229.57 × 1022
Exhaust gas3.42 × 10223.54 × 10224.58 × 10227.81 × 10221.39 × 1022
Solid waste2.41 × 10239.89 × 10225.62 × 10222.98 × 10223.18 × 1022
E m W 3.52 × 10231.88 × 10231.76 × 10231.96 × 10232.68 × 1023
Table 3. The overall energy table evaluation index table of the coastal area of the Ring A area.
Indicator Item20172018201920202021
Energy/currency ratio4.71 × 10134.45 × 10134.41 × 10134.48 × 10134.21 × 1013
EYR1.941.361.641.281.07
ESR86.92%80.27%83.57%78.28%72.76%
EER0.160.190.200.210.21
ELR6.427.5710.1313.2417.29
ESI0.290.170.150.090.05
EISD0.040.030.020.010.01
Renewable energy ratio13.45%11.64%8.97%6.93%5.06%
Ratio of waste to renewable energy1.100.600.610.620.84
Waste-to-total energy-value ratio13.96%11.62%8.93%6.92%5.01%
Energy per capital usage4.93 × 10165.54 × 10166.59 × 10169.28 × 10161.26 × 1017
Energy density1.49 × 1013168 × 10132.01 × 10132.85 × 10133.97 × 1013
EEYR0.280.330.310.330.38
IELR6.566.498.9111.0214.27
EIRSD0.04340.05110.03620.03010.0267
EIRSD × EER0.007510.010410.007540.006770.00581
Table 4. H market energy flow trend table.
E m R E m N E m I E m Y E m U R O
20172.34 × 10136.45 × 10223.41 × 10173.45 × 10151.06 × 10241.21 × 1012
20182.46 × 10147.21 × 10223.63 × 10183.51 × 10161.99 × 10242.06 × 1013
20192.51 × 10147.96 × 10233.95 × 10183.63 × 10182.39 × 10252.19 × 1014
20202.96 × 10158.11 × 10234.04 × 10193.73 × 10192.98 × 10252.61 × 1015
20213.32 × 10158.56 × 10244.24 × 10205.64 × 10223.67 × 10262.92 × 1016
Disclaimer/Publisher’s Note: The statements, opinions and data contained in all publications are solely those of the individual author(s) and contributor(s) and not of MDPI and/or the editor(s). MDPI and/or the editor(s) disclaim responsibility for any injury to people or property resulting from any ideas, methods, instructions or products referred to in the content.

