1. Introduction
Microgrid (MG) systems’ proliferation has significantly increased in recent years. The penetration of renewable energy resources, the limitation of carbon dioxide emissions, and the broad deployment of smart power systems have contributed to the wide spread of MG applications.
An MG is a smart small-scale power system comprising a mix of generating resources, controllable loads, energy storage units, transmission lines, transformers, and a point of common coupling (PCC) [
1]. The PCC is the main circuit breaker installed in the MG system to control the operation mode of the network. The MG system’s operation modes can be grid-connected or grid-islanded [
2]. Various research projects have been directed toward the MG topic as a promising field in the electrical energy world [
3,
4].
The main and critical feature of the MG system is the ability to work in two operation modes: connected or islanded. The potential complexity of such a network is caused by the transition between operation modes while maintaining a stable operation [
5].
MG systems have several benefits to different sides of the community, including environmental aspects [
6], economic aspects [
7], and trading aspects [
8]. In addition, the control part of the MG includes energy management [
9], stability and resiliency [
2], decentralized monitoring [
10], real-time monitoring [
11], and system protection [
12].
The control side of power systems has countless articles highlighting diverse fields and techniques that help to maintain a stable operation. Advanced transactive control strategies have been developed to optimally utilize the installed distributed energy resources and storage units in the energy community [
13]. The proposed techniques have been built based on the game theoretical control scheme. In addition, two other innovative control techniques have been established, the whale optimization algorithm (WOA) and the artificial neural network (ANN). They are utilized to control the power flow of power systems comprised of a mix of renewable energy resources.
The availability of software simulations of the MG systems have contributed to its broad deployment worldwide. However, it still needs more accurate and intensive simulators to help in monitoring, and to analyze several cases and scenarios. In this context, Real-Time Simulation (RTS) is considered a valuable and vital tool to test and configure the proposed models before their actual implementation.
The RTS has been revolutionized in recent years; it returns valuable and significant results that are highly considered before the implementation phase of the studied systems. Generally, RTS is a promising technique to test and validate the complex and latest control approaches applied in MGs. Furthermore, it also helps specify the control and management parameter values for the best implementation of the model.
A complete RTS of an MG case study has been introduced in [
11]. The authors proposed and studied a reactive power coordination control scheme in a real-time state. Also, they discussed the transition between the operation modes of the MG case study. The voltage and frequency evaluation of an MG system using RTS during islanded mode has been studied in [
14].
In MGs, and power systems in general, electrical faults can cause unstable operation of the systems. These faults could occur by failures in the devices or due to human errors [
15]. Moreover, the operation of the MG in islanded mode may lead to voltage sag occurrence and hence unstable operation [
16]. One of the vital and effective techniques that can be utilized in abnormal operation and voltage sag cases is Fault Ride Through (FRT) [
17]. FRT is one of the effective techniques that is applied to the generation units during fault cases. It can be defined as “the ability of the generation units to stay connected and available in case of voltage sag occurrences without interruptions” [
18].
Reference [
19] has utilized the OPAL-RT simulator to validate dynamic test cases of two test systems. These dynamic test cases have been examined and validated under several disturbances, such as a single line-to-ground fault, line shortage, load changes, and other disturbances. Furthermore, a four-level fault current hierarchical limitation has been proposed in [
20] to analyze and resolve the problem of high fault current during FRT. Furthermore, an enhancement of MG models has been proposed in [
21], using droop control virtual impedance and secondary power reference generation. It mainly aims to improve the FRT capability of the inverter-based MG system.
A centralized MG system has been designed in [
22] to apply the controller Hardware in the Loop (HIL) test. This test is applied for the proposed control algorithm, showing the system’s functionality on the power management side and reducing the needed load shedding.
FRT implementation in MG during the islanded mode of operation has been discussed in [
23]. Islanded mode operation of the MG refers to the operation of the MG as an independent power system. This can be effected by opening the PCC breaker. Intensive research and efforts are going on to study the different and most important factors of MG operation to support a stable system operation during islanded mode. However, maintaining reliable, stable, and robust operation of the MG, regardless of the current operation mode, is one of the highest priorities of the MG network. Hence, an algorithm is utilized in this paper to perform the load-shedding, which aims to maintain the stability and the power balance factor.
A complete review of load-shedding implementation in MG networks is introduced in [
24]. This reference covered a large number of applied intelligent methods, as well as different load-shedding classes. The authors of [
25] proposed a new load-shedding algorithm for Inverter-based MGs. The proposed algorithm is based on frequency changes to specify the power shortage in the MG. Compensation for the power shortage is applied in the MG using the proposed load-shedding scheme. The generation side of the studied MG in this reference is generally based on several renewable energy units, including PV systems, solid oxide fuel cells, and energy storage systems.
The research presented so far focuses on MG’s characteristics, control systems, protections, management, and optimization issues. However, implementing an RTS of MG is an attractive and promising research avenue that has been given attention recently. Moreover, there is still a significant gap in studying MG control techniques in real-time, especially during the islanding mode operation. This paper emphasizes the implementation of many algorithms and scenarios in a real-time state. Two innovative algorithms are demonstrated for power loss reduction and power balance.
The main objective of this work is the implementation of an RTS, using the OPAL-RT simulator, to study and analyze an MG case study with different cases. Furthermore, the detailed steps of the model transformation into a real-time model in the RT-LAB environment are introduced in this paper. Even though many researchers have worked on the RTS of MG, very few pieces of research were reported on implementing two control techniques that covered both operation modes (connected and islanded modes) of the MG in a real-time state. Hence, as an energy management process, the two operation modes of the MG have been covered in this work by implementing FRT and Load curtailment algorithms.
The rest of the paper is organized as follows:
Section 2 presents the proposed MG model that has been created in this work. The detailed RTS part using the OPAL-RT simulator, and the MG modeling in the RT-LAB platform, are addressed in
Section 3. Simulation and results analysis are presented in
Section 4. Finally,
Section 5 summarizes the findings and conclusion of this study.
2. Microgrid Model Understudy
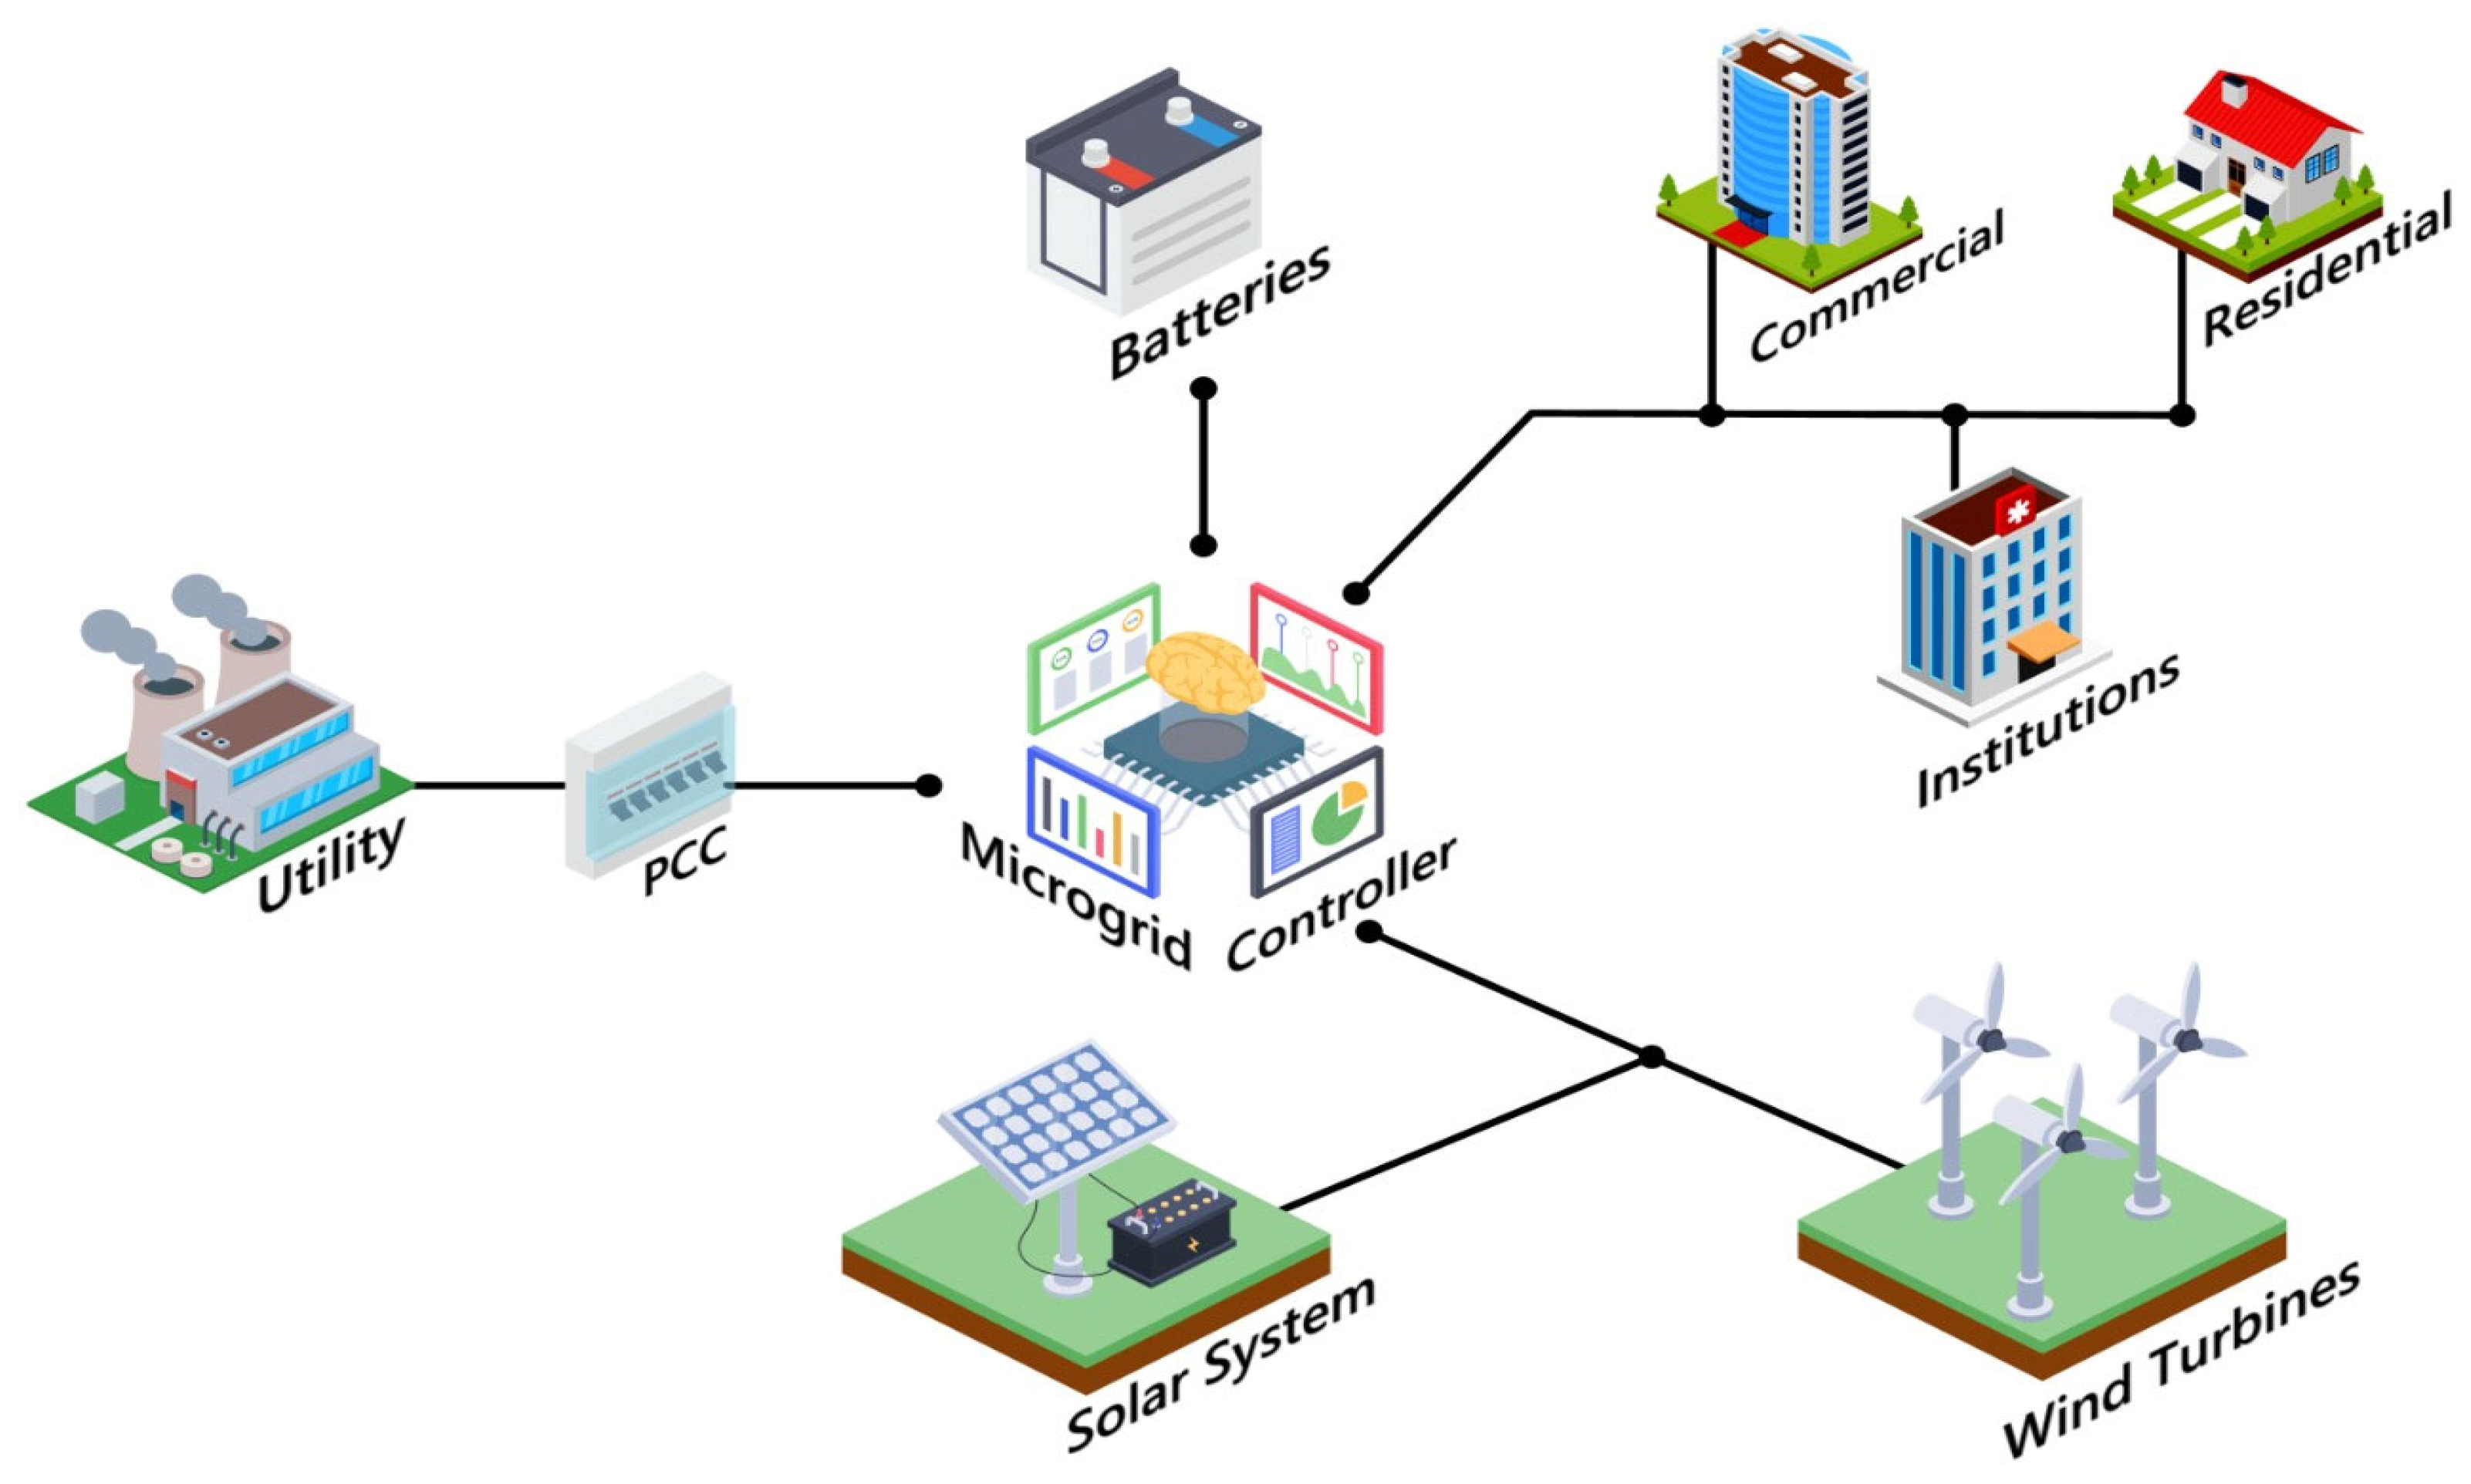
An MG, as defined previously, is represented by a small-scale power network consisting of different generating units, loads (residential, institutions, commercial), transmission lines, transformers, controllers, and a PCC.
Figure 1 represents a general MG diagram.
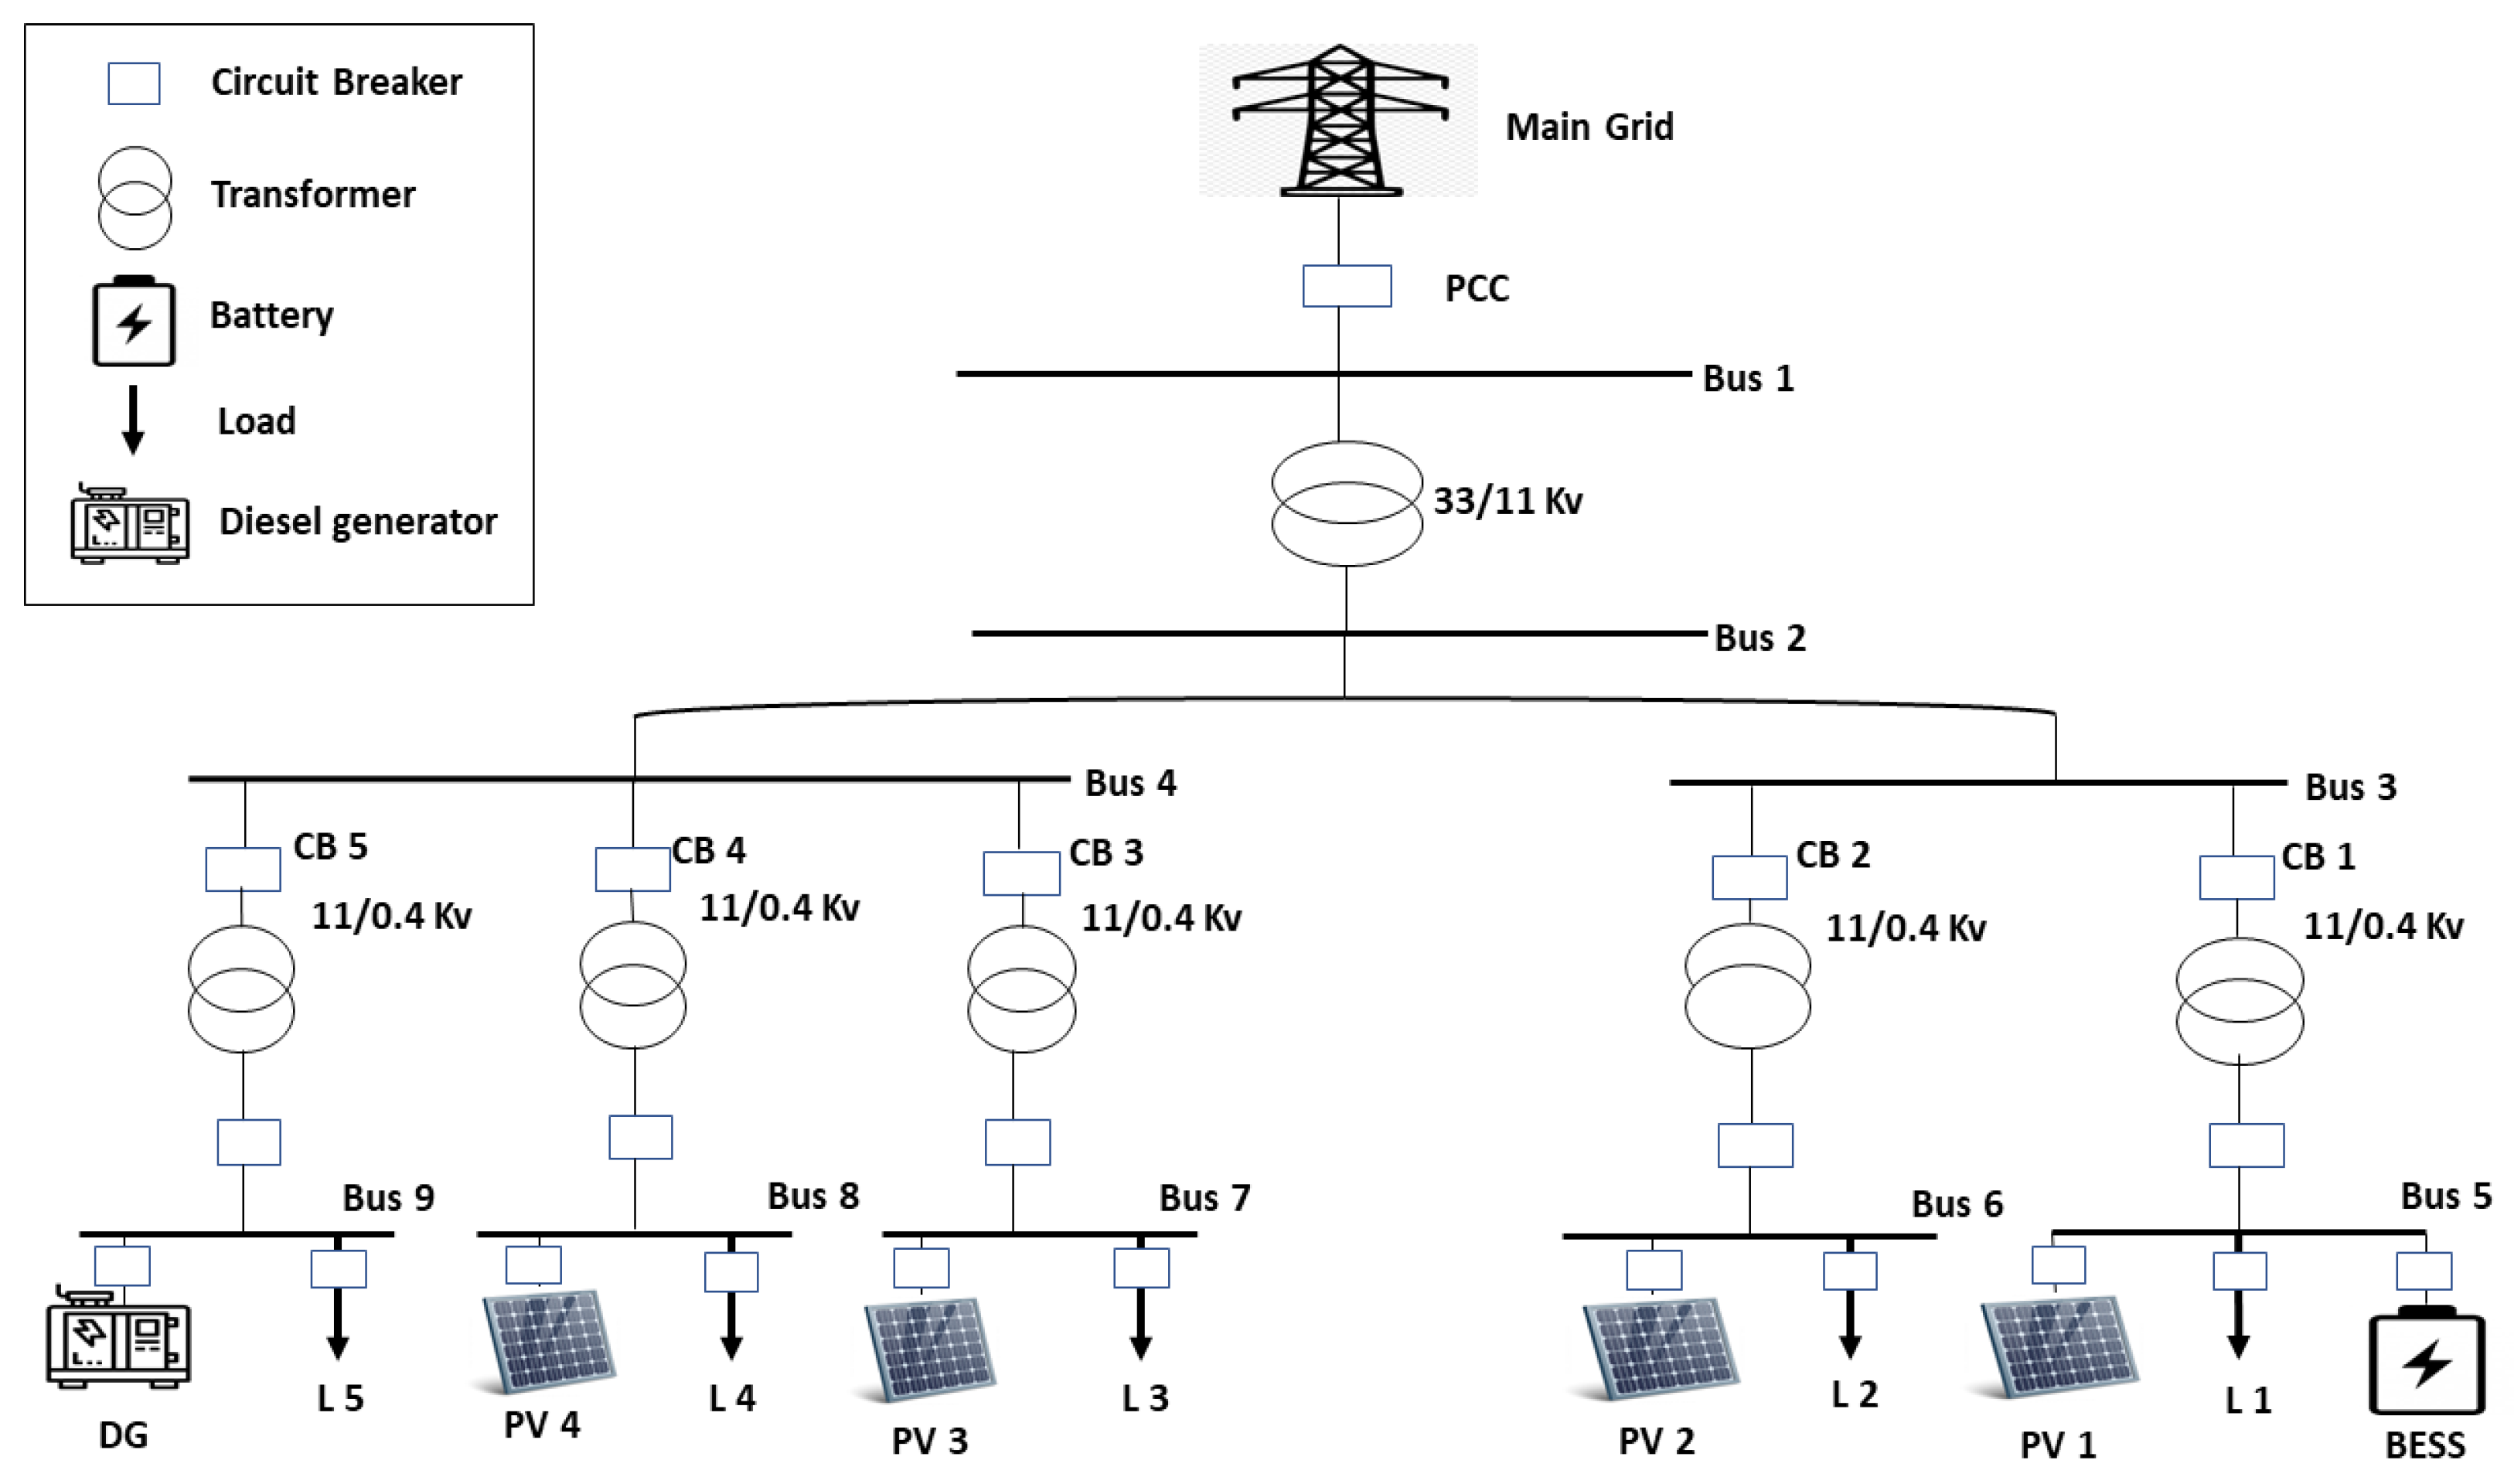
This paper studies different scenarios of an MG case study in real-time mode. The MG model studied in this work comprises several components: PV systems, load units, battery energy storage systems (BESS), diesel generators (DGs), and the main utility grid.
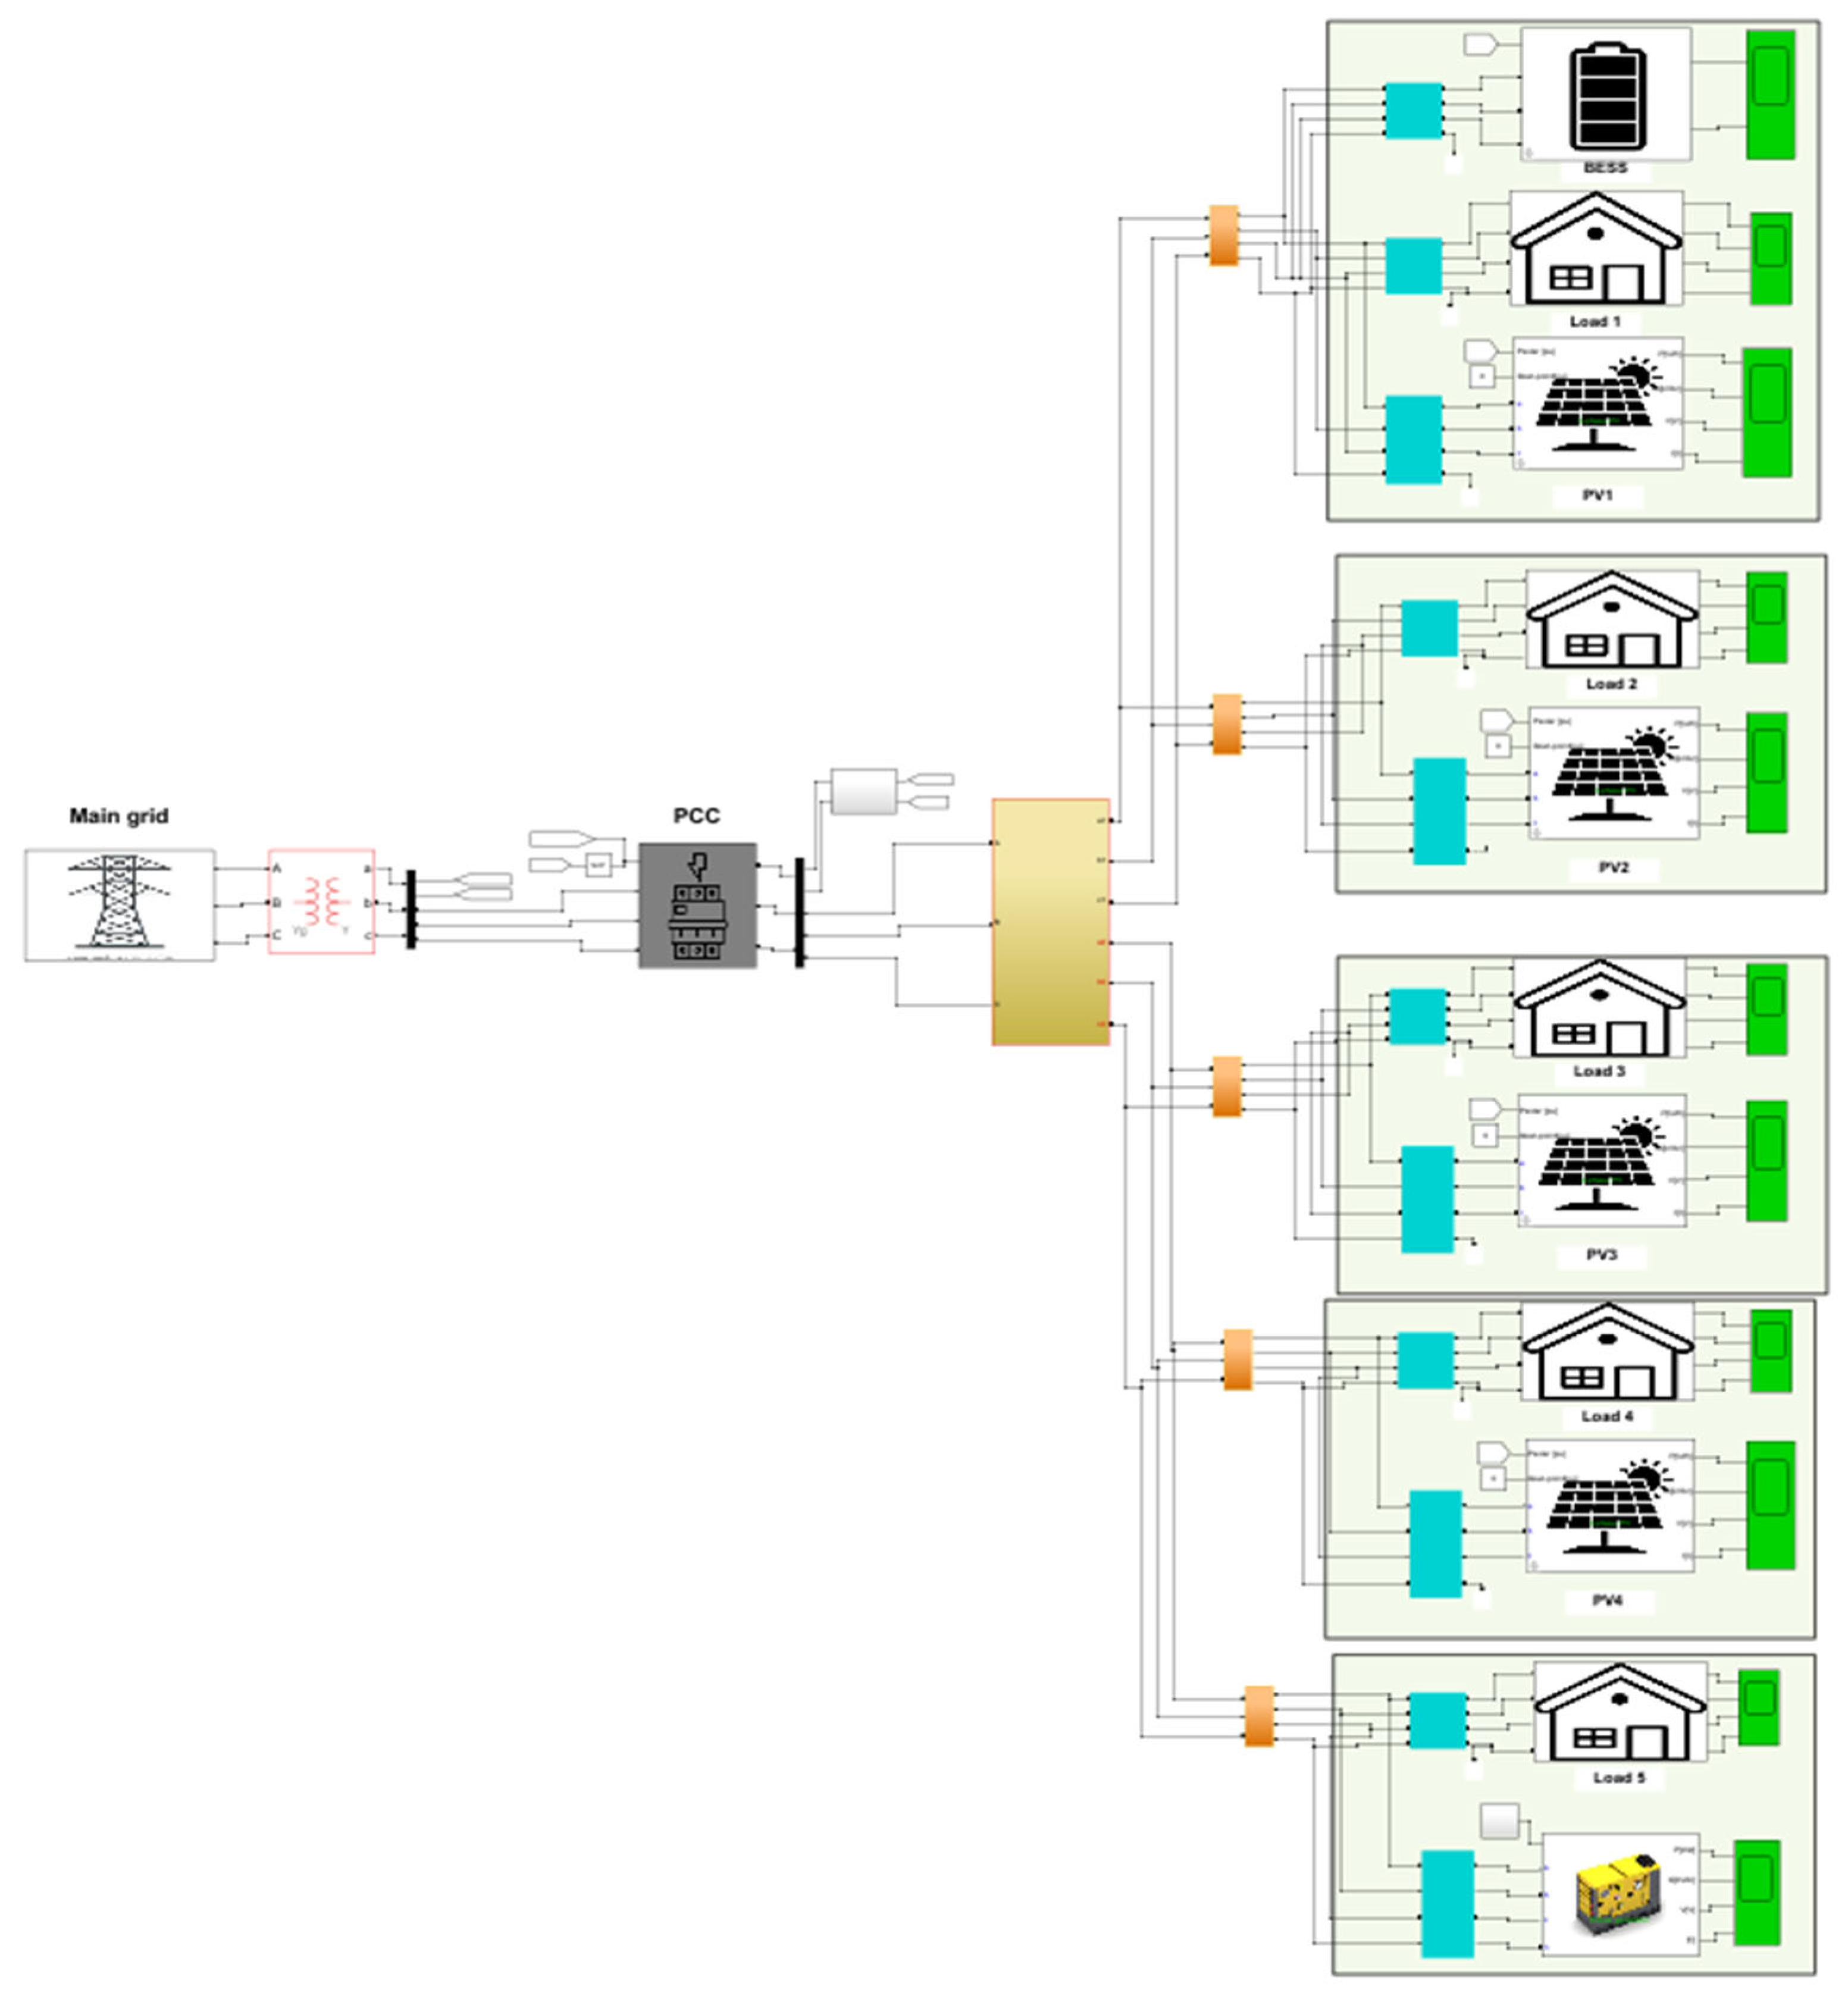
Figure 2 shows the single-line diagram of the MG case study.
The installed PV system consists of four PV areas with a total capacity of around 1.8 MW. The five installed loads are varied in their capacity and priority, which have been considered in performing several algorithms in case of blackout occurrence. The load priority of the loads has been defined as 25%, 21%, 11%, 13%, and 30% for the installed loads 1, 2, 3, 4, and 5, respectively.
The utility grid usually controls the MG operation during the connected mode phase. The main grid follows the voltage and frequency parameters required to maintain the MG’s stable and reliable operation. The control scheme of the MG during the islanded mode depends on providing and absorbing the active and reactive power difference between the generation and load units. Hence, the voltage and frequency parameters can be maintained at stable values during the islanded operating mode.
Regarding the operation of the MG during the islanded mode, or any fault cases, the installed resources must have voltage or frequency ride-through capabilities. These capabilities help maintain the MG’s continuous operation during voltage anomalies.
The modeling of the system has been performed on MATLAB SIMULINK, as shown in
Figure 3. The model’s left side represents the utility grid and its connection with step-down transformers and a PCC. While the right side of the MG model illustrates the model classification into five areas, as explained previously in the single-line diagram.
The energy storage system is built with a battery control system that manages its operation. It helps provide power to the MG system in case of any power shortage. Moreover, inside the PV and BESS subsystems, a control system has been included to manage and organize the system’s operation. As both systems are DC power supplies, inverters have been inserted to convert their output into AC power.
3. Developed Microgrid Model for RTS
RTS is a promising step in testing several scenarios and technologies. It has contributed considerably to the evolution of several research communities, especially in the power systems field. RTS platforms have significantly contributed to analyzing and studying power system performance issues.
The simulation part in an RTS is strictly based on a discrete-time model with a fixed-step size. The RT-LAB software is an OPAL-RT real-time simulation platform that meets the RTS objectives and improves the user’s access experience. It enables the model to perform its real-world implementation, allowing Hardware-In-Loop (HIL) simulations, for instance.
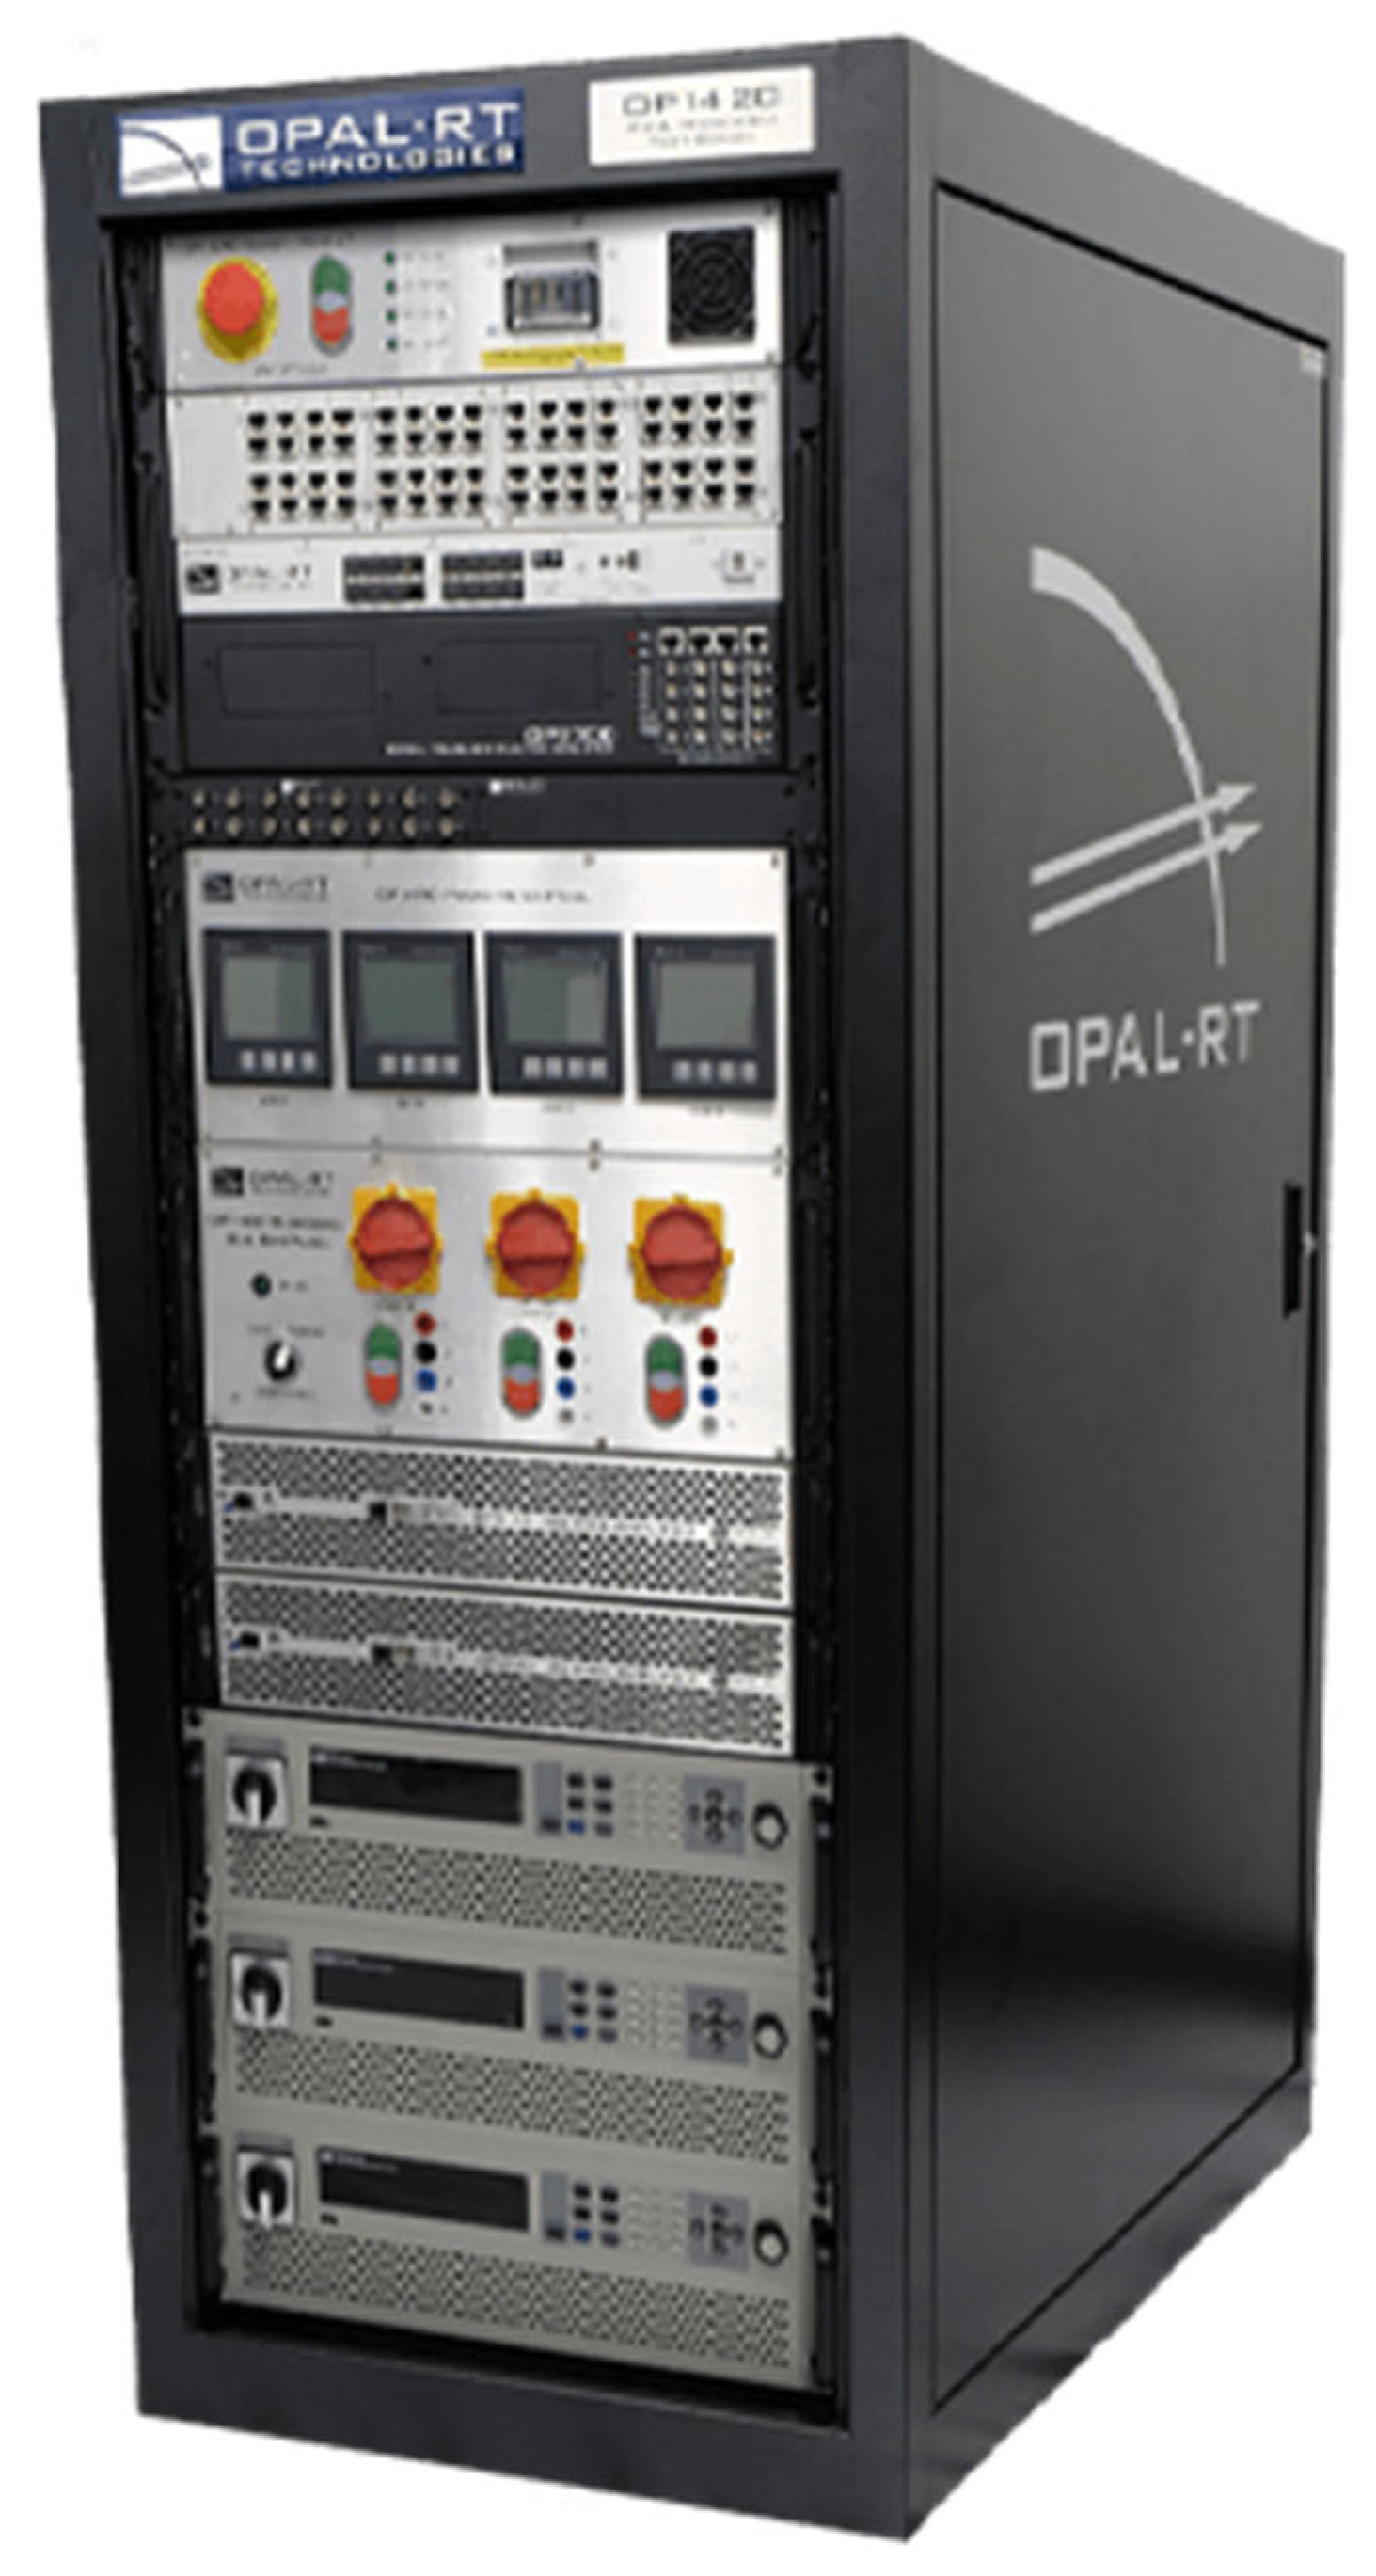
The OPAL-RT is a cutting-edge technology that combines distributed processing software and hardware to obtain a high parallel speed and RTS.
Figure 4 represents the OPAL-RT simulator (OP1420 PHIL Microgrid test bench) used in this study. The RT-LAB software is used in the second stage of the simulation part. The use of the fixed-step solver in RT-LAB software is mandatory. The system structure and interaction between the Real-time target and the software platform (Host PC) are represented in
Figure 5.
Generally, and regarding the RTS part, the applied process of the RTS can be briefly summarized into four main steps. In the first step, the Simulink model has to be opened through the RT-LAB software, where RT-LAB version 2021.3.4.320 has been used in this stage. Then, the base model will be reconstructed, to be composed of three subsystems called master, slave, and console subsystems. The master subsystem is the main subsystem in the real-time model, and its prefix is “SM_”. Therefore, it cannot be accessed after starting the simulation.
On the other hand, users can access the console subsystem during the simulation running time. The console subsystem contains all the scope blocks and other variables that need to be modified during the running time. Finally, the slave subsystem is an optional component in the RT-LAB model, which can be inserted in the case of large and complex models. Real-time models can include many slave subsystems based on the model structure.
The second step of the RTS is the compilation of the real-time model. This stage involves the model’s conversion into a real-time application based on the C language. The time utilized in this stage depends on the model’s complexity and the predefined configurations of the real-time process. The compiling step involves six stages: separate model, generate code, clean target directory, transfer files to target, compile and link generated code, and retrieve files from the target.
The third stage of the RTS process is “Execute.” As shown in
Figure 5, the host contains the model construction and the platform where the results will be illustrated. The number of cores used has to be specified before the execution stage, to perform the simulation part in less computational time and enhance the allocation of the resources. The interact step is the final step of the RTS. This stage refers to the utilization of the graphical interface in order to perform the available features, such as data aggregation and control implementation. The flow chart shown in
Figure 6 represents the main steps in the RTS phase.
ARTEMIS and RT-Events are modeling tools available in the RT-LAB platform. These tools help in simulating complex power systems with high-performance improvement. ARTEMIS is a fixed-time solver applied in the real-time simulation of Simscape power systems. It allows users to benefit from the available algorithms that help provide reliable, stable, and accurate simulation. The utilization of the ARTEMIS tool allows the users to perform parallel execution of the circuits on different cores. Additionally, it enables the real-time simulation of models that consist of a large number of switches.
RT-Event block-set enables the simulation of systems that contain both continuous and discrete systems. Moreover, it supports fixed-step size simulation models and works with RT-LAB to perform real-time simulations.
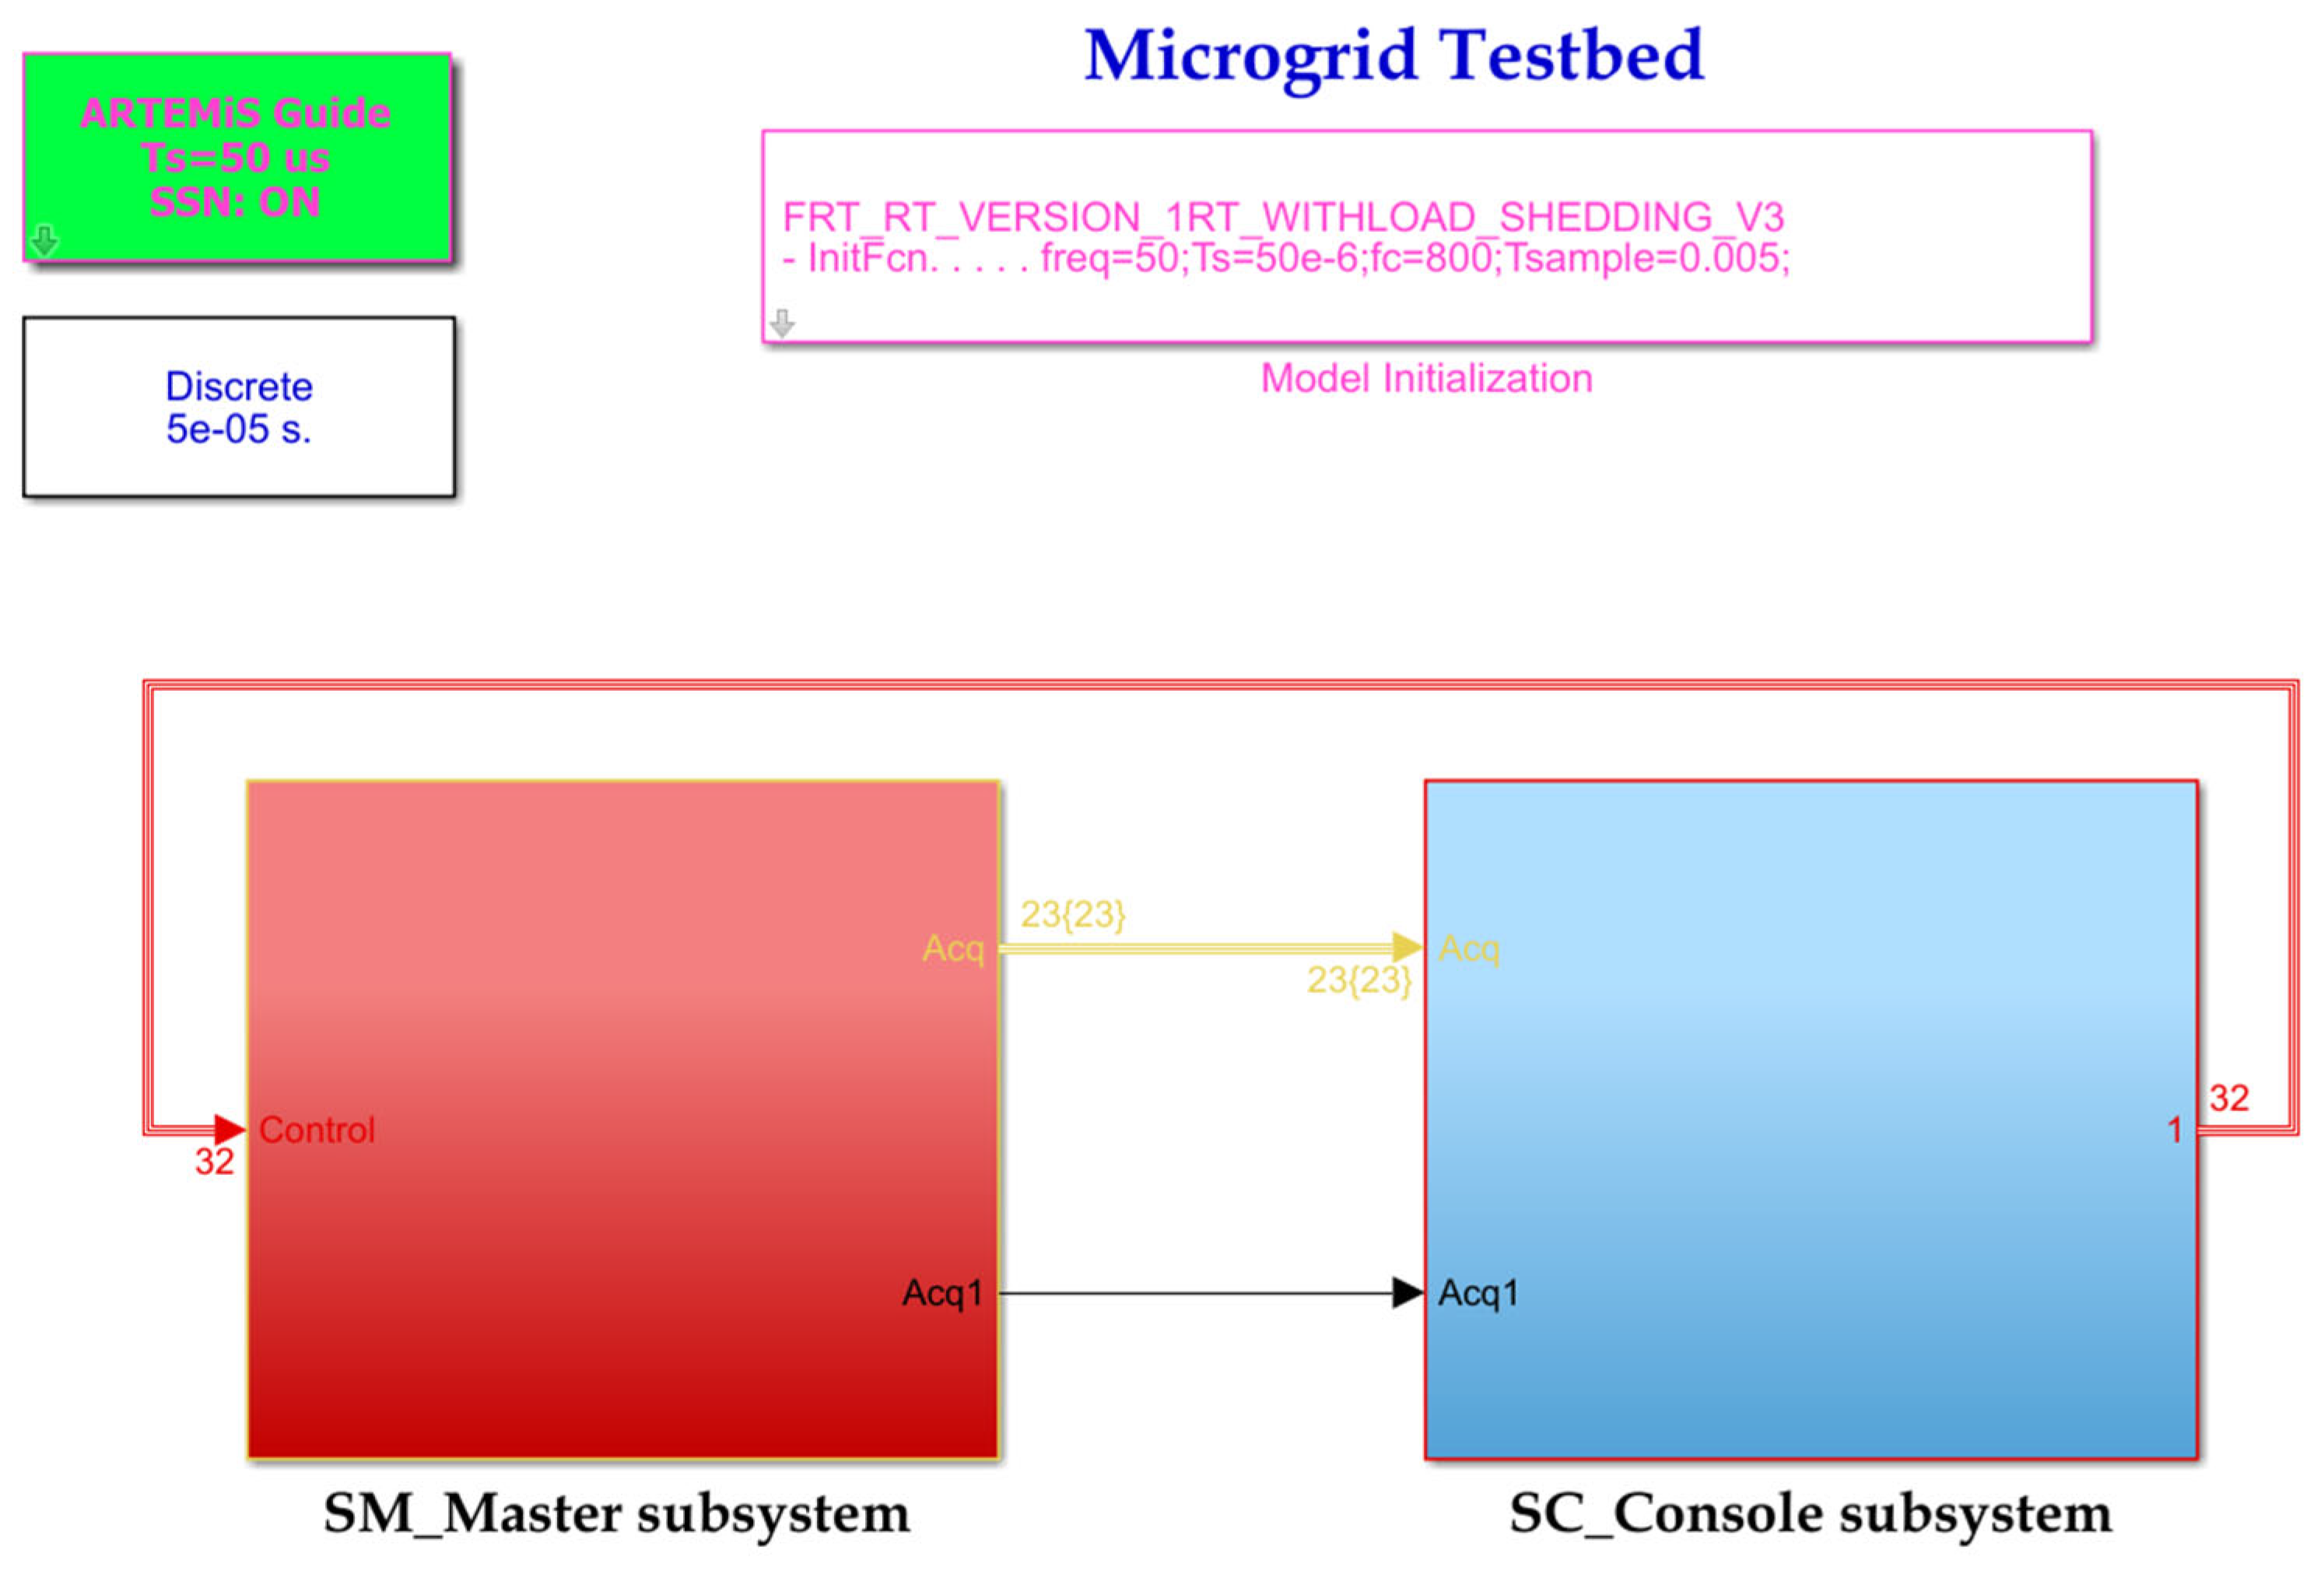
In the initial stage of the RTS, the MG model has to follow specific modifications to meet the RTS considerations. One of these conditions is that the model’s upper view must be composed of two or three subsystems, as mentioned in the previous section. After the first stage modifications, the MG model is represented in
Figure 7, where the red subsystem is the master subsystem, while the blue one is the console subsystem. The ‘powergui’ block is the same as the conventional models. It performs its functions represented by choosing the simulation solver type, obtaining steady-state values, adjusting the initial state, FFT (Fast Fourier Transform) analysis, etc. Moreover, the “ARTEMIS” block is a fixed step solver utilized as an RTS optimization tool. It is fully compatible with MATLAB and the “SimPowerSystems” library.
The “OpComm” block is a critical component in the model during the RTS part. It can be installed from the RT-LAB library. It is responsible for providing the communication infrastructure between the subsystems and the communication between the GUI subsystem and other computational subsystems. The essential condition in the RTS process is that the model has to be run well in the MATLAB platform without any errors. After performing the required modifications, we can open the MG model through the RT-LAB platform and start the RTS by building the model, loading the model on the target, executing the model, and acquiring the needed results from the console window. The specifications applied through this simulation are shown in
Table 1.
4. Simulation and Results
This section presents the proposed mechanisms: FRT and Load curtailment algorithms, and their implementation in the MG case study.
4.1. Fault Ride through
The first technique that has been studied in the real-time state through this paper is FRT. The operational principle of the FRT technique is represented in the flowchart in
Figure 8. It is mainly based on the injection of the reactive current. The FRT algorithm starts with sensing the voltage sag. Based on the regulations, the voltage limits measured at the PCC must be in the range of 0.9–1.1 pu. This indicates the normal operation of the MG system. However, if the voltage value differs from the acceptable limits, the FRT will start its operation based on the specified K factor. This factor can be calculated using the following equations:
where K is the FRT gain, I
Q is the reactive current,
V is the voltage difference, V
N is the nominal voltage (1 pu), and V
PCC is the voltage value at the PCC point.
If the voltage parameter exceeds acceptable limits, FRT will start operating by injecting the reactive current from the Grid Side Converter (GSC) to the PCC side to oppose the voltage sag. Generally, the operational process of the applied FRT is composed of three stages:
The first stage involves the sensing operation of the voltage parameter, in which a comparison between the measured voltage and the nominal voltage occurs. Referring to the output of this comparison, the model continually monitors any voltage sag cases and recovers the system by the proposed FRT.
The second step indicates the moving state of the reactive current IQ parameter to be 1 pu as the system faced a voltage sag.
The third phase is responsible for adjusting the reactive power reference factor fed to the PV area block, to control the reactive power injected into the grid side.
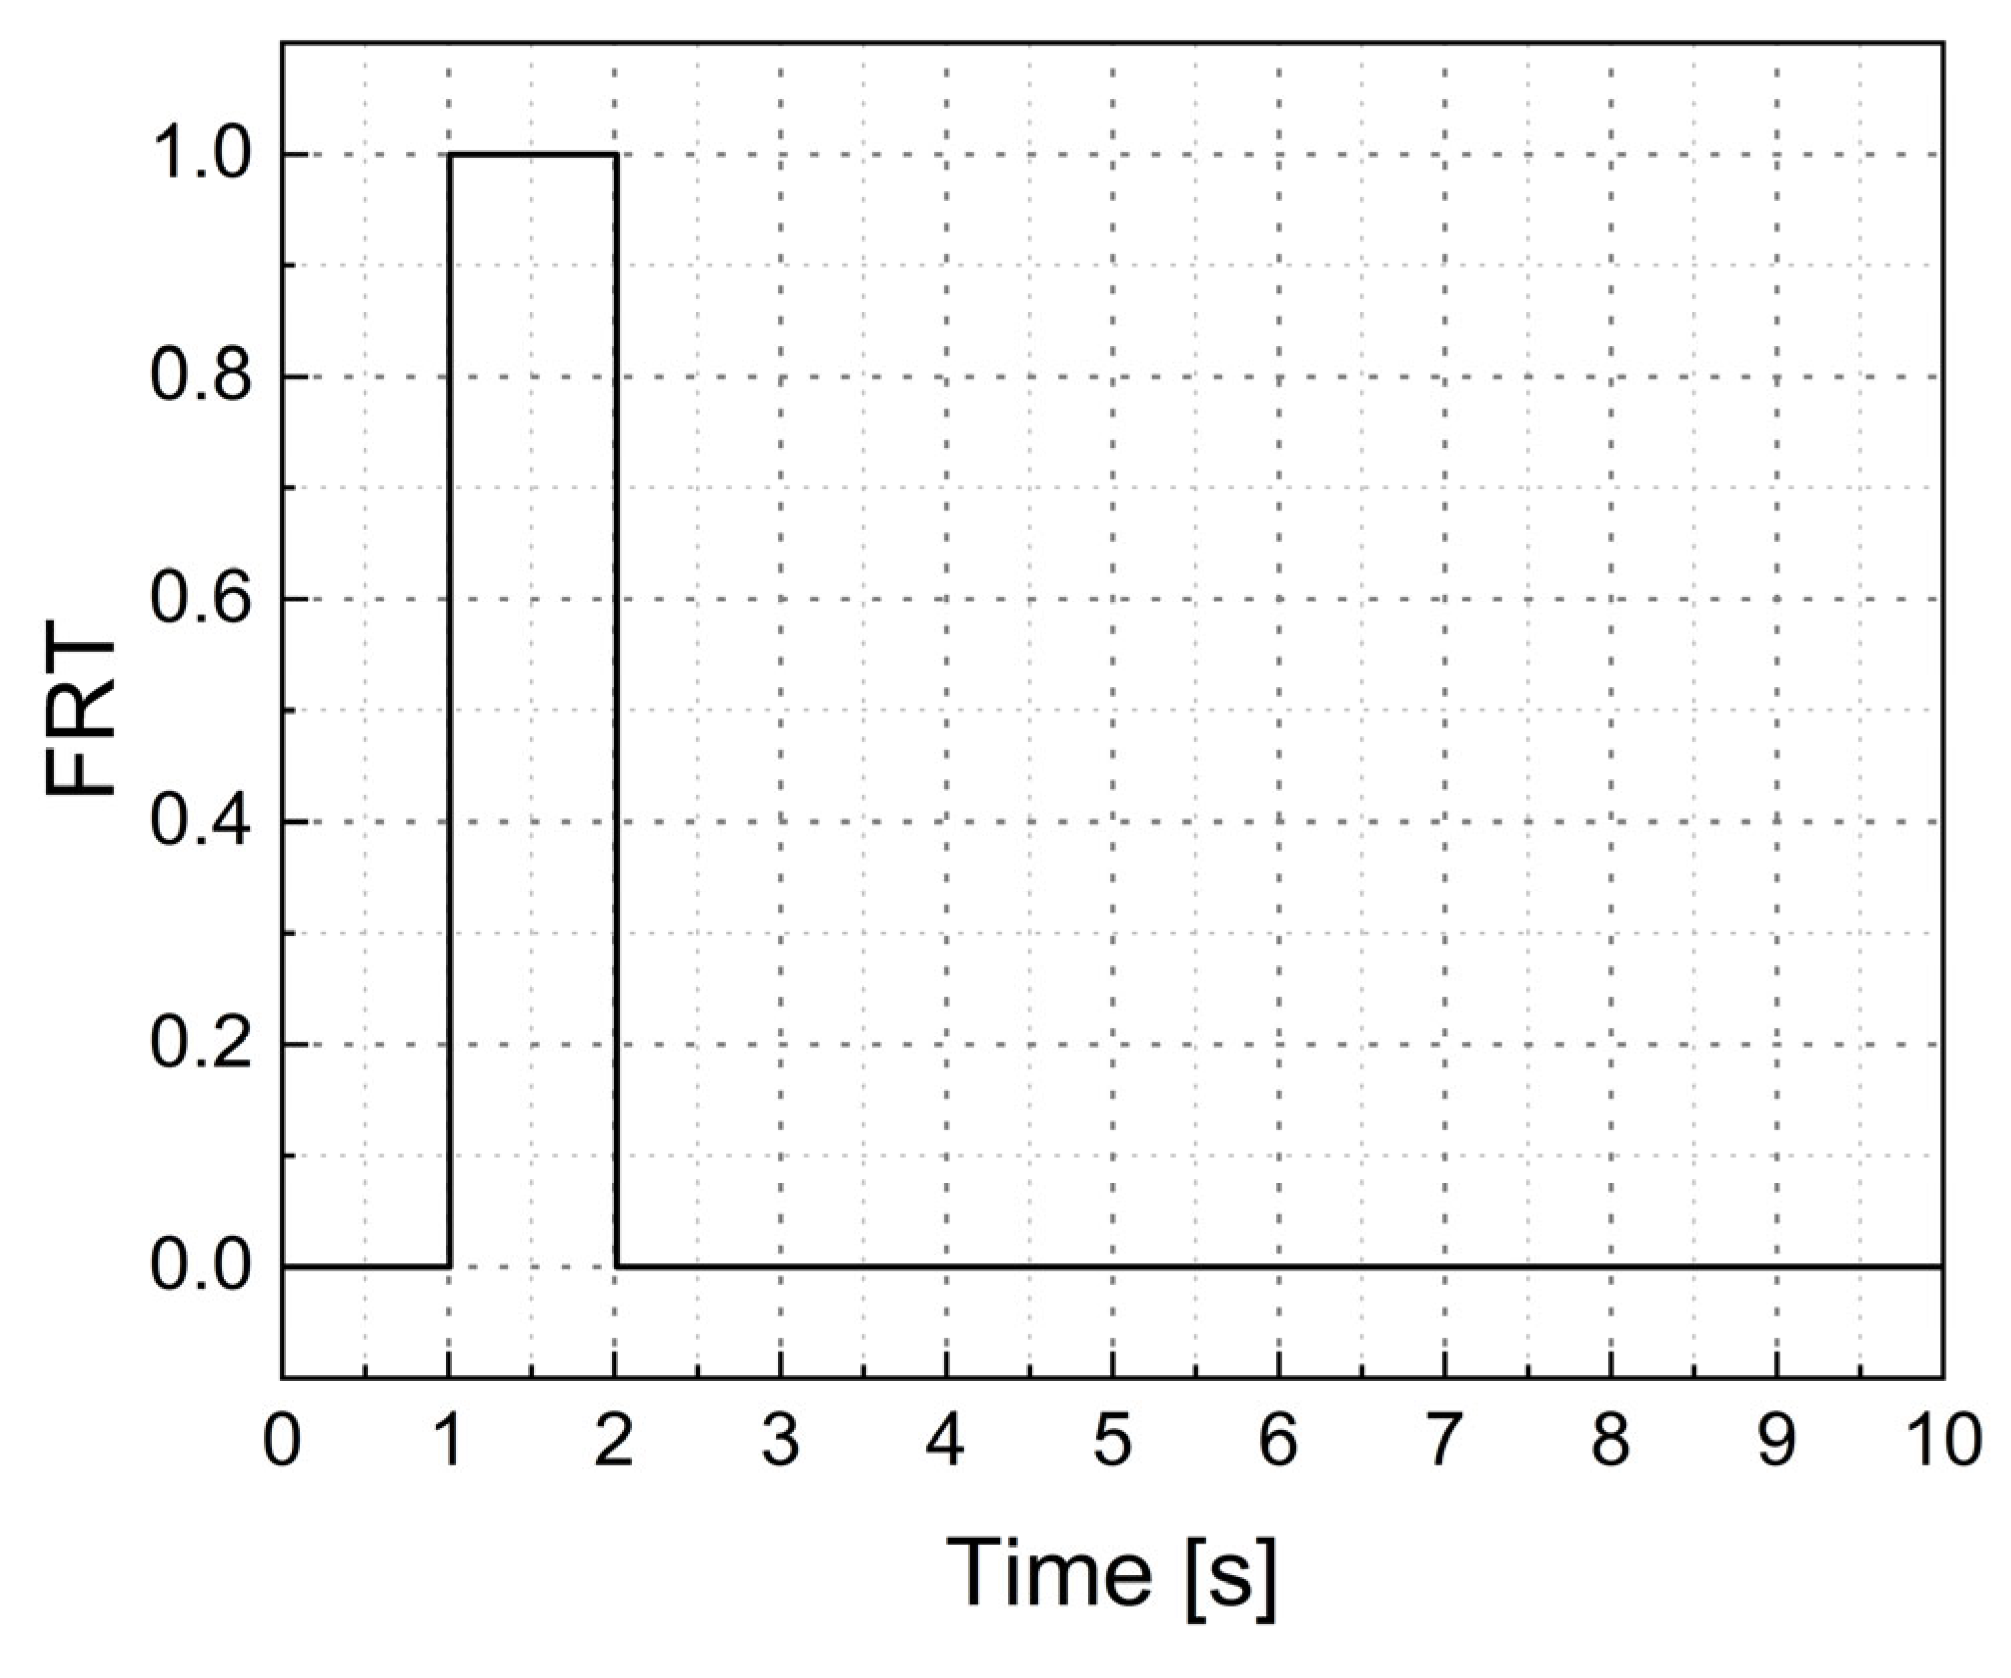
The FRT technique will be studied on the MG model during the connected mode by inserting a fault at t = 1 s. As the fault occurs, the system will monitor a voltage sag case, and the FRT algorithm will start to be triggered. It is worth noting that the running time of the MG simulation is 10 s.
Figure 9 shows the FRT triggering signal in a real-time state, representing the FRT’s starting operation at t = 1 s. The reactive current (I
Q) signal and the changing state of its value at the FRT operation are shown in
Figure 10. The PV block’s reactive power setpoint, considered a reference factor, will be adjusted during the FRT operation.
Figure 11 displays the MG system’s reactive power signal at the GSC and PCC. The first signal involves a negative value of the reactive power, showing the flow of the reactive power in the opposite direction, toward the main grid. Further, the second signal represents the increasing change of the reactive power value injected from the GSC towards the grid side, to oppose the voltage sag.
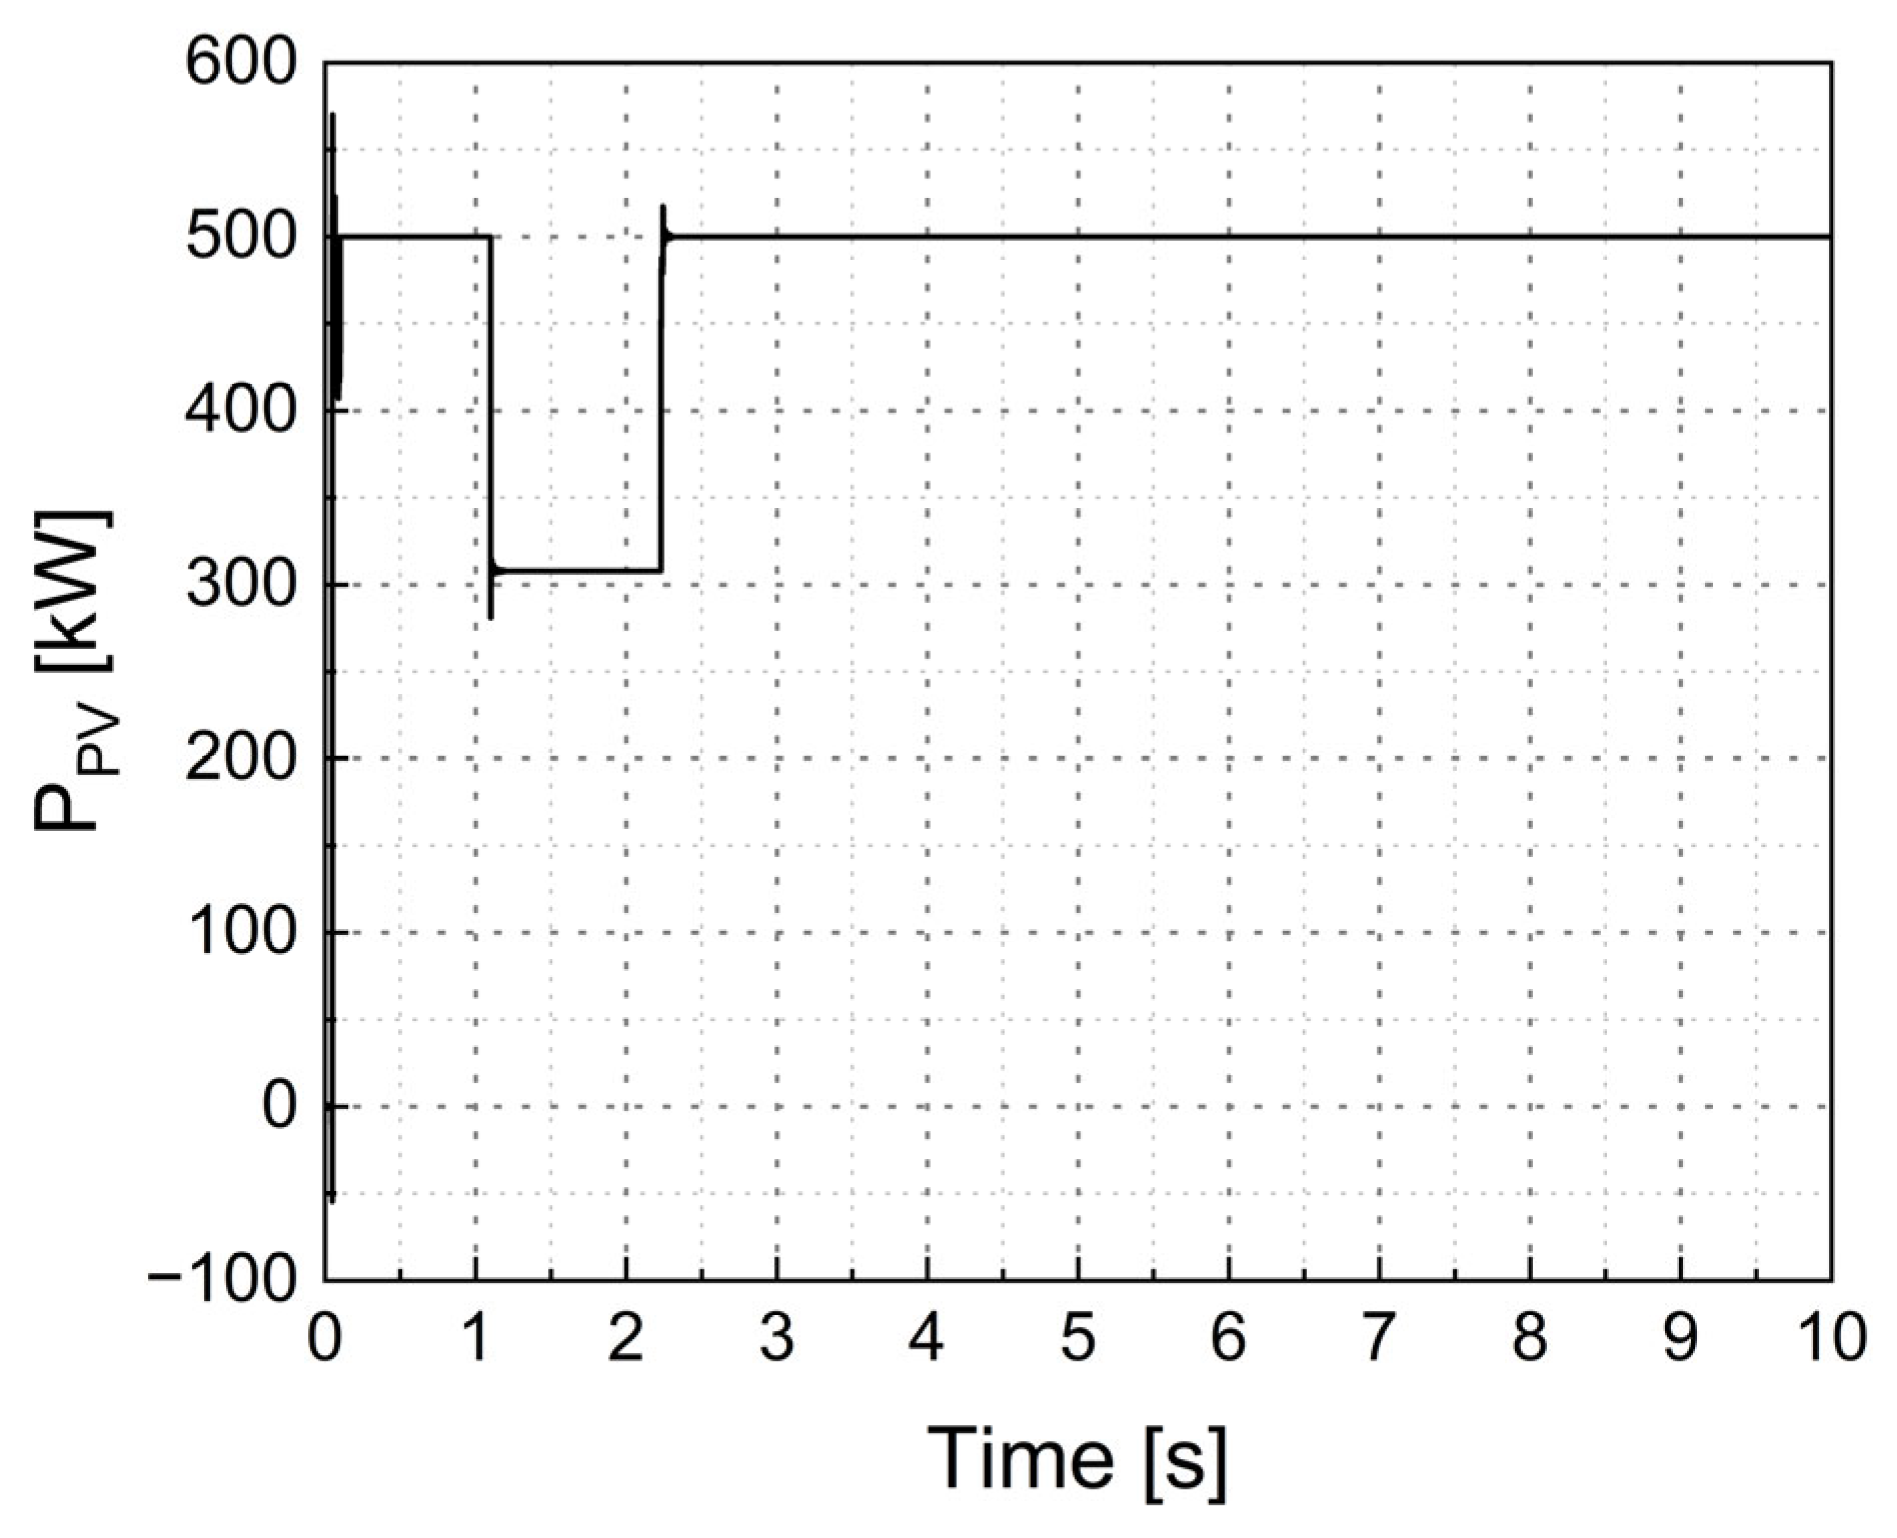
Figure 12 shows the Active power signal at the first PV area. The spikes generated in the figures above are due to the loads associated with the PV systems. Furthermore, the applied maximum point power tracking (MPPT) technique in the PV subsystem can generate oscillations in some cases, especially in inductive load cases. Load switching and fault clearness can also create transients, due to the interaction between the mechanical energy stored in rotating machines and the energy stored in the inductance and capacitance when connecting and disconnecting the generation units.
Equation (3) represents the power losses of the PV system in the two cases: utilizing the FRT technique, and without FRT. The losses in the output power of the PV system at area “A” reached about 190 kW. While in the case of the MG, without applying the FRT technique, the PV system will be disconnected as the fault occurs, leading to a cut of the output power from the PV side.
where,
is the losses percentage in the PV output power,
is the measured output PV power in ordinary cases,
is the measured output PV power in fault cases.
Based on the results, the output power of the PV is decreased by about 190 kW, resulting in power losses of about 38%. However, comparing this result with the losses in case of the total disconnection of the PV system in case of voltage sag, the output power will reach zero. The achievement of power loss reduction by the FRT technique leads to a significant reduction in the economic losses and the operational cost of the system. A minimization function (f
1) of the cost factor of the studied MG is represented below by implementing the FRT algorithm.
Closses is the cost of the losses, and Cp is the price of the energy use in kWh in Jordan, which is USD 0.123. The MG’s power losses factor with FRT implementation is 192 kW, while it is 500 kW in the case of the absence of the FRT implementation. These results lead to a cost reduction of USD 22,447.5 to 8619.84 per year by applying FRT. So a minimization factor of about USD 13,827.66 is achieved out of the f1 function.
4.2. Load Curtailment
Power losses and power balance keys are considered vital factors in the energy management of power systems. They have a direct impact on the system’s performance and economical operation. Power balance relies on the generation and demand levels. It is based on the power difference parameter. The generation side of the MG is classified based on the installed generation units. RES (PV, wind, etc.), DGs, grid sources, and other units are examples of the generation side. In addition to the case of BESS installation, Equations (6) and (7) present the power balance condition:
The problem formulation of this scenario started in the MG’s islanded mode operation. During the islanded mode of the MG, the generation side relies on the installed types of generation, including intermittent generation units such as PV systems and dispatchable generation units such as diesel generators. Moreover, the installed intermittent generation units and load demand units vary depending on several factors, such as weather forecasts and human activities. This leads to the need for continuous monitoring of the generation/demand balance in the MG system.
The power difference parameter (P
Diff) is the key to achieving power balance. It has to be within a specified range, as shown in Equation (8). A zero value of P
Diff indicates the power balance state. Several strategies have to be exploited in the case of P
Diff values that are more or less than zero. Values greater than zero indicate cases of surplus power. The surplus power can be stored in an energy storage system, or injected into the main grid, or sold to other utilities. Values below zero represent the cases of generation failures covering the installed load. Load curtailment techniques can be exploited in these cases. They rely on load minimization through a gradual disconnection process of the load.
where
A second minimization function (f
2) of the power difference factor of the studied MG is represented below by implementing the Load curtailment algorithm.
The f2 mainly manages the balance state of the system by decreasing the Pdiff parameter in the case of islanded mode operation. The main constraints of this function are the generated and demand power, which together specify the Pdiff parameter. Based on equation 9, Pdiff is considered an inequality constraint with several active, inactive, and violated cases at the design point (zero).
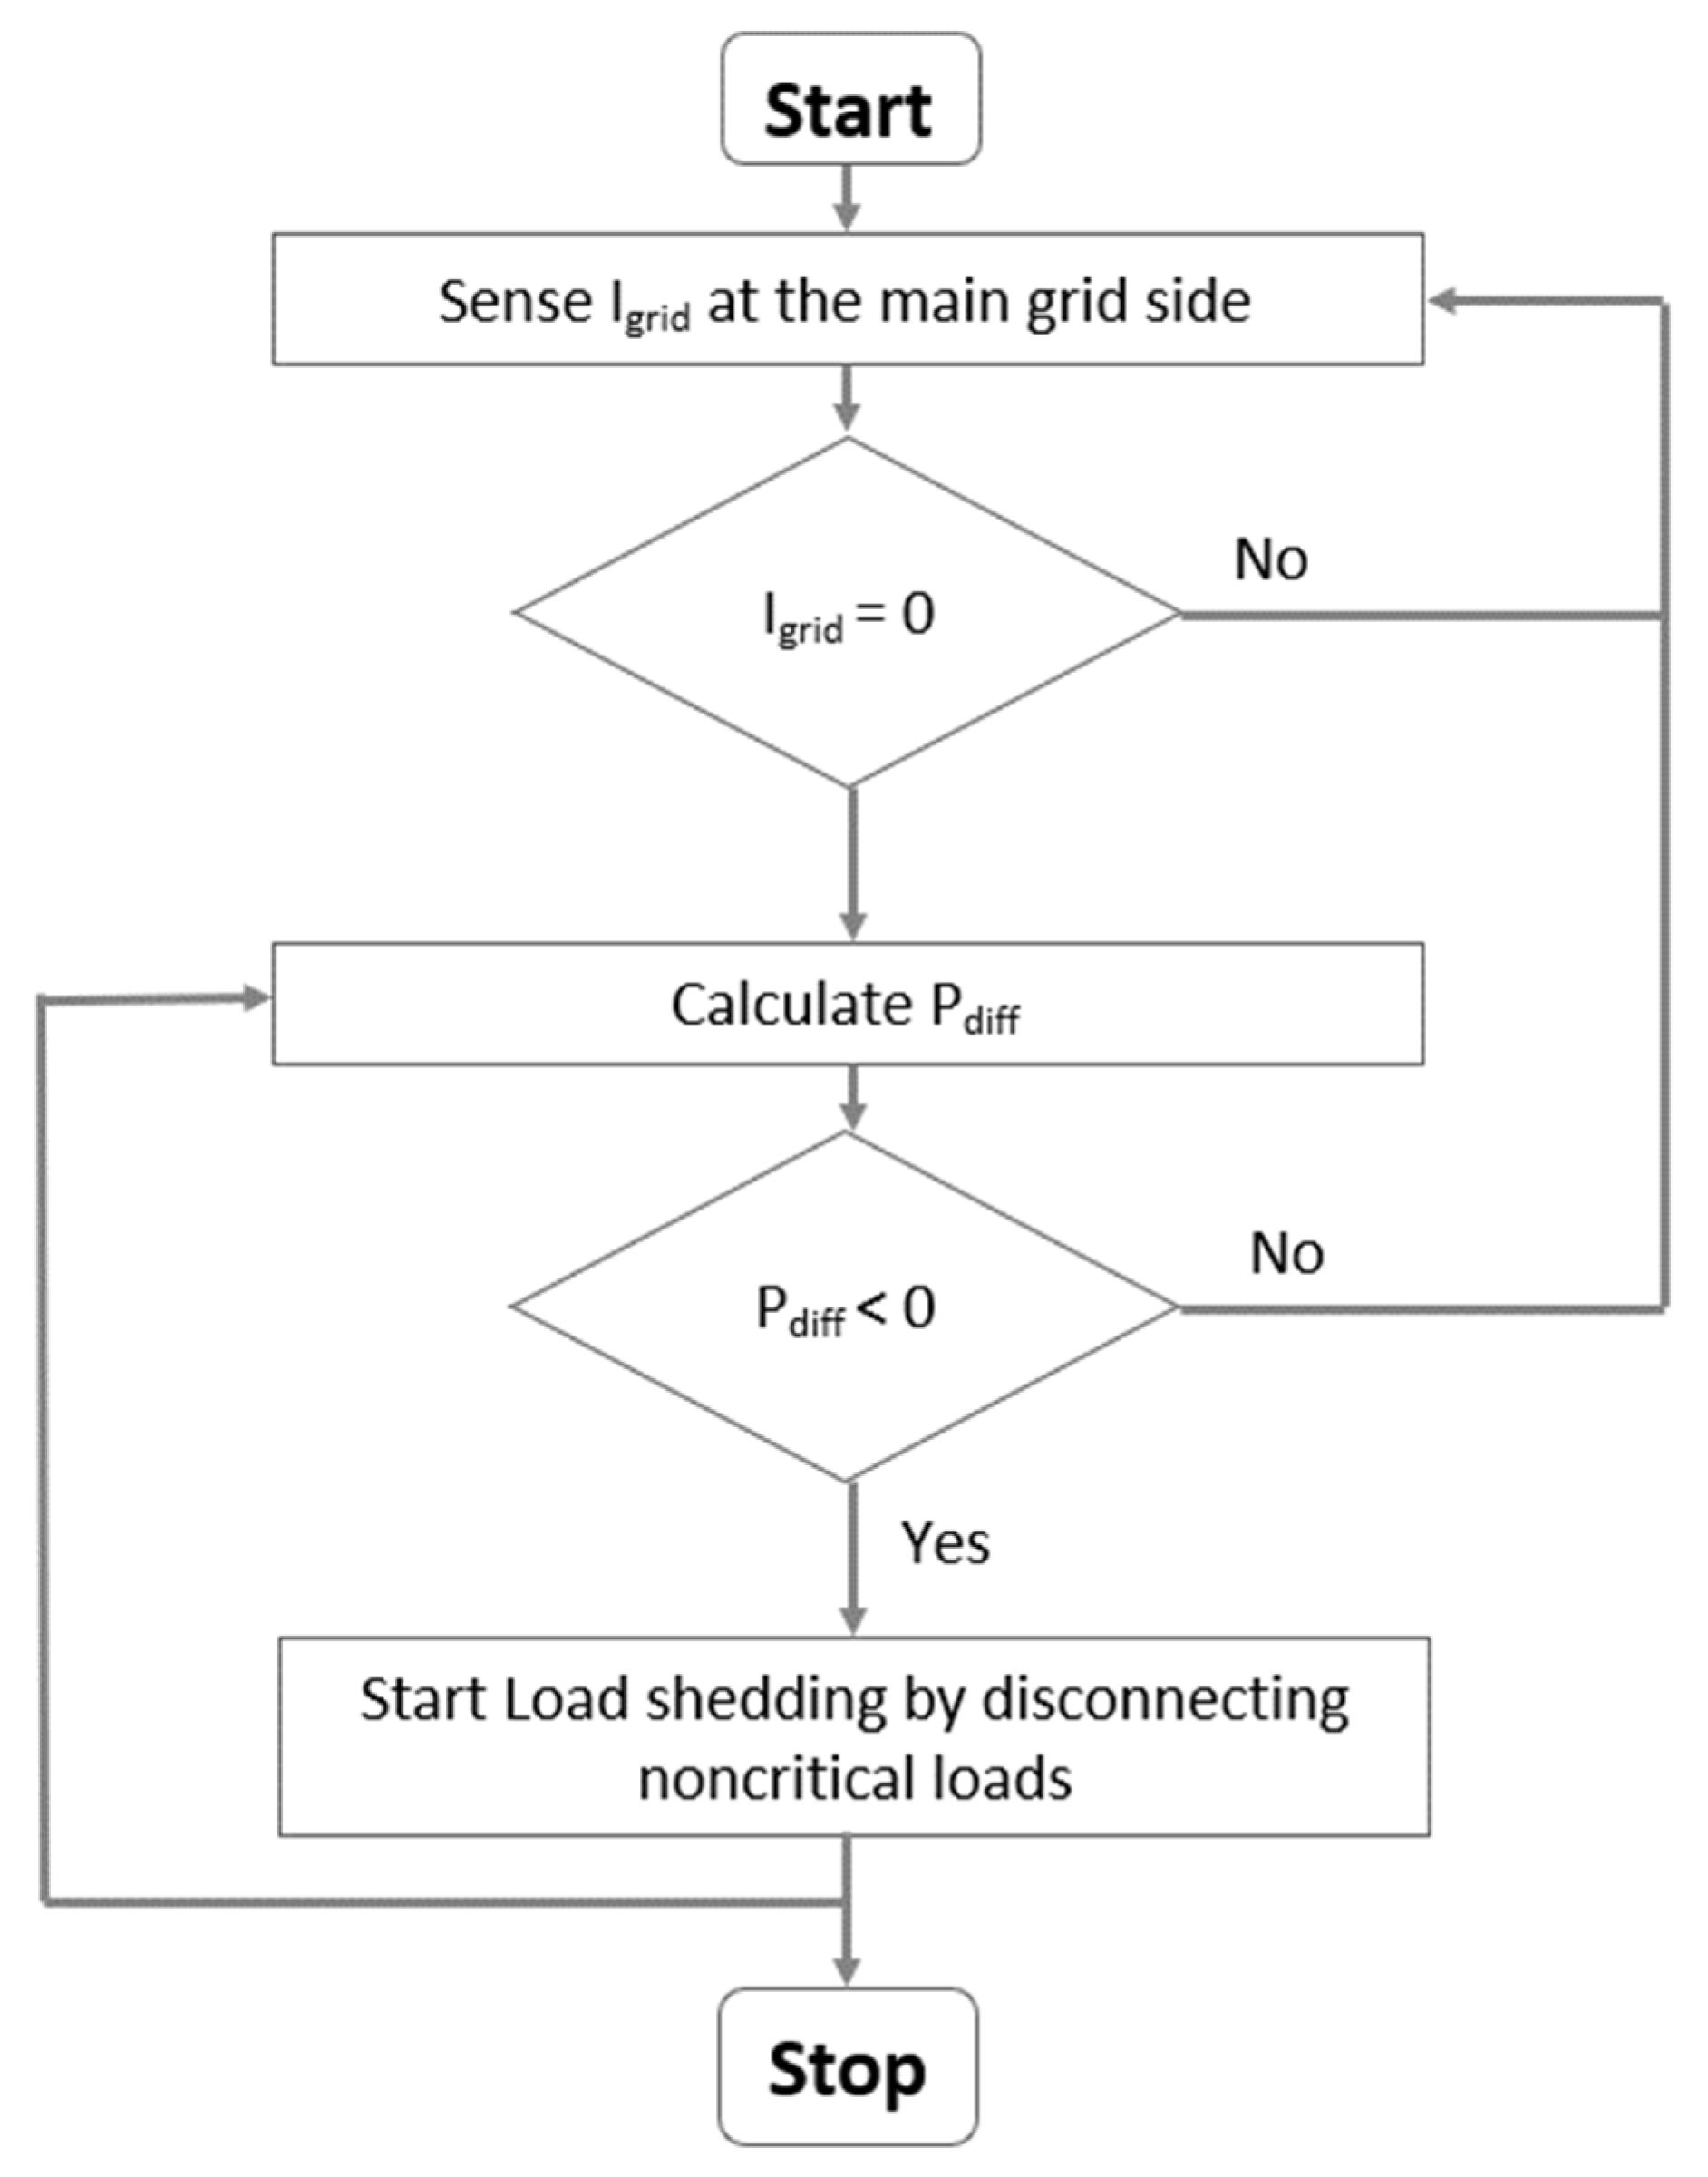
As the Pgenerated depends on the installed generation units, f2 decreases the demand side as the Pgrid is zero (islanded mode operation). The shedding process of the installed load depends mainly on the priority of the load. Therefore, the load with the lowest priority is considered the first choice in the shedding stage. The disconnecting loads decrease the overall demand, and the algorithm recalculates the PDiff parameter. In the MG case study, the load priority of the installed loads 1, 2, 3, 4, and 5 are ordered as follows: 25%, 21%, 11%, 13%, and 30%, respectively.
In this case study, the MG will operate in islanded mode at t = 3 s.
Figure 13 represents the power difference signal of the MG. The power significantly decreases when the MG operates in islanded mode.
The Load curtailment algorithm starts its operation as it senses the value of the grid current I
grid. The zero value of I
grid indicates the MG is operating in islanded mode.
Figure 14 represents the operation principle of the proposed mechanism. As the value of I
grid reaches zero, and the P
diff factor is negative, Load curtailment will start its operation automatically. Load 3 (L3) will be the first choice to be disconnected since it has the lowest priority. At about t = 3.2, L3 has disconnected, increasing the P
diff factor, as shown in
Figure 13. However, the P
diff signal is still a negative value, which means that the demand side still exceeds the generation side. Hence, the Load curtailment algorithm continues its operation by disconnecting load 4. This process proceeds automatically by the Load curtailment model, based on a sensing system and logical blocks to send ON/OFF signals to the demand side. Moreover, in RTS, RT-LAB allows the users to manually send the ON/OFF signal during the running simulation, using control signals from the console subsystem. After the disconnection of load 4, the P
diff signal becomes positive, and this indicates the elimination of the unbalanced case.
Generally, as the implementation of FRT and Load shedding techniques leads to cost reduction, and demand scheduling maintaining a stable and reliable operation, both techniques can be considered as a simplified approach of the power flow scheme. One of the future directions of this study is to develop an Optimal power flow of the MG system to enhance several factors. An example of these factors is the enhancement of the voltage stability using the demand response management system, referring to [
26].
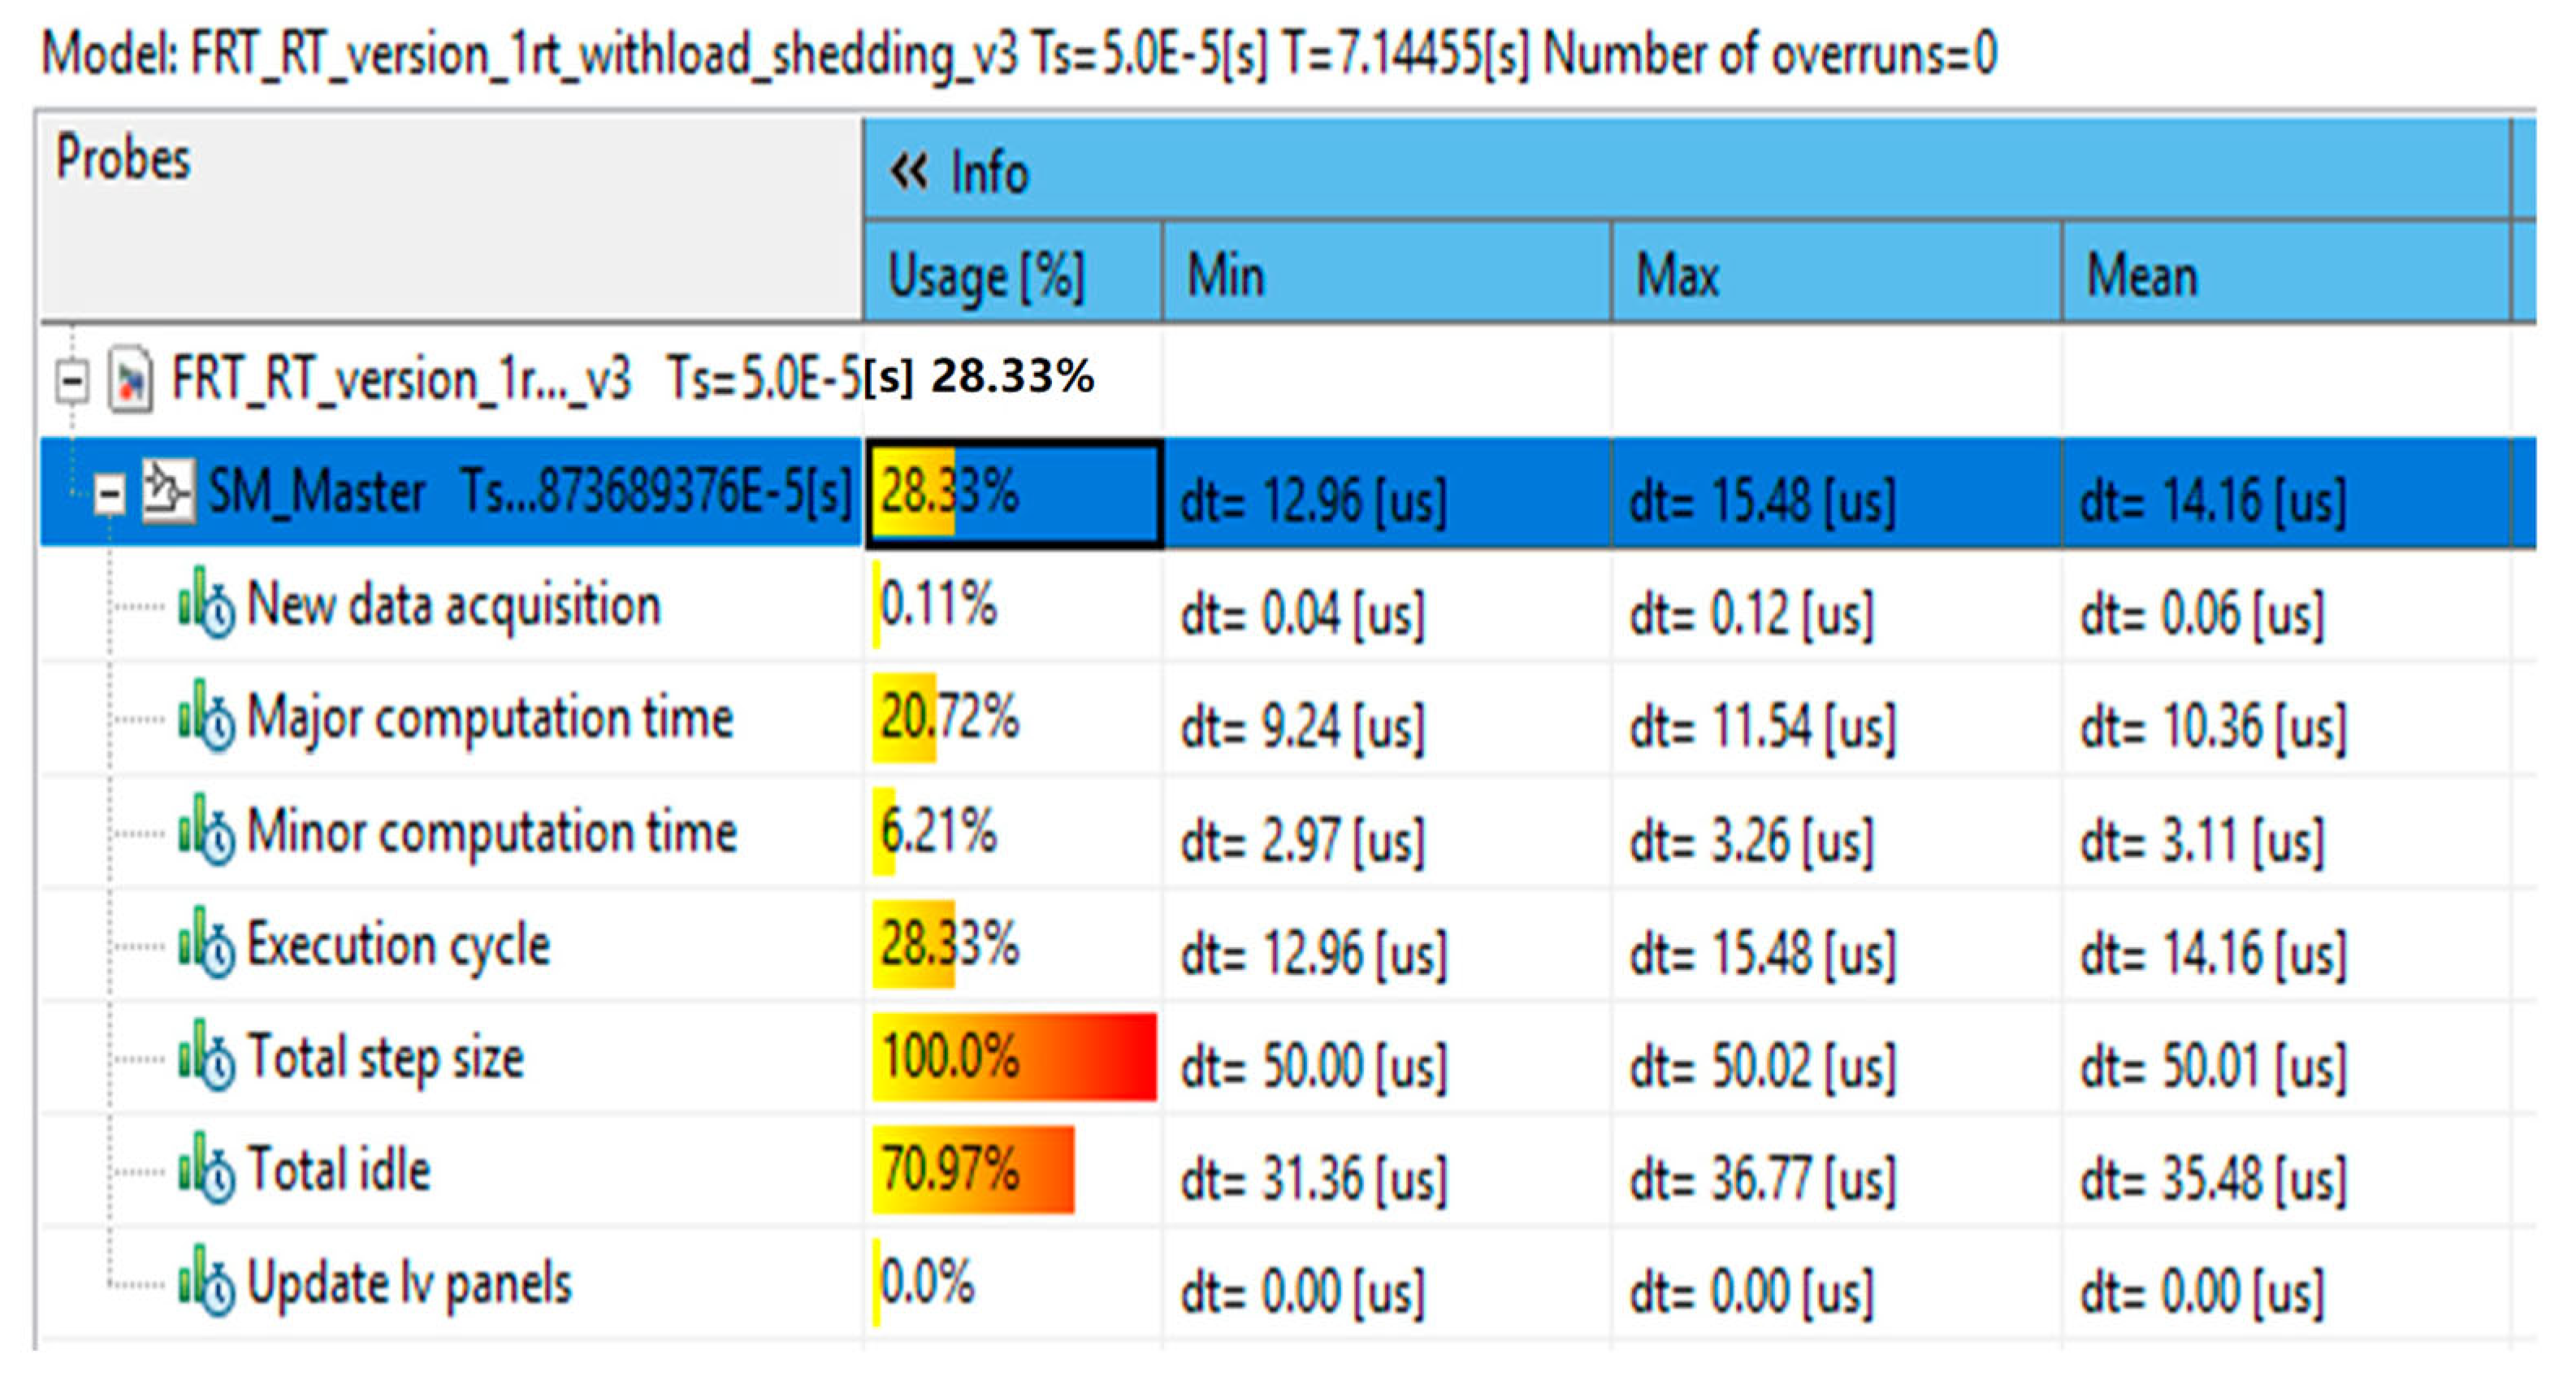
The monitoring view window in
Figure 15 presents the CPU usage for the tasks implemented in a real-time state. It helps to monitor overrun cases, in which our simulation shows that the number of overruns is zero. Furthermore, this tab can specify each task’s duration by identifying the task’s start and stop times.


