Abstract
The expansion of global tourism development has led to an increase in environmental burdens. This study aimed to assess the operational performance and the environmental impacts associated with food service establishments in Phuket, an international tourist island in Thailand. A joint application of life cycle assessment and data envelopment analysis was employed to evaluate environmental burdens and calculate the efficiency scores encompassing several inputs and outputs of each food service establishment. There are several characteristics of food service establishments that affect their operational and environmental performance. The results showed that location, opening hours, and surrounding conditions are key factors driving the performance of air-conditioned food service establishments, while the performance of non-air-conditioned ones is mainly decided by opening hours. However, these factors are not significant for the performance of street food service establishments. It is advised to carefully consider the characteristics of the included food service establishments based on their products and services to enhance their performance. As an effort to achieve a balanced connection between environmental quality and economic growth, it is essential to evaluate both operational and environmental performance. Attaining maximum operational efficiency does not necessarily ensure the same for eco-efficiency.
1. Introduction
The global population has been constantly and rapidly growing since the 1950s, rising by one billion people between 2010 and 2022. It is expected to continuously increase in the future, reaching almost 10 billion people by 2050 [1]. This increase not only results in the higher exploitation of natural resources to produce adequate goods and services for human survival [2] but could also lead to severe environmental damage due to massive amounts of resource use, waste, and emissions. In this context, meeting human needs within the Earth’s carrying capacity is a vital challenge requiring a change in existing production and consumption patterns [3].
Over the last decades, tourism has been considered one of the fastest-developing industries in the world [4]. As the global population has grown significantly, this has also fueled the development of tourism, leading to the expansion of essential components such as industries related to accommodation or food and beverage supply. Among them, food services, one of the largest contributors to tourism development, has also become a thriving industry. However, it is also a significant source of greenhouse gas (GHG) emissions. Food supply and services have been found to be responsible for 30% of man-made GHG emissions [5]. Even though not regarded as substantial a pollution contributor as the chemical or metallurgical industries, the hospitality industry, including food and drink services, still requires environmentally sustainable operations because of its extent and rapid development. In addition, food service establishments are one of the largest contributors to food waste. In Europe, approximately 14% of food waste (12–28 million tonnes per year) comes from hotels, restaurants, and other beverage and food businesses [6]. China, the most crowded and biggest developing country, has been facing this challenging problem over the past 20 years [7]. Restaurant operations also consume a large amount of energy. As the population and demand for dining out are increasing, all of these problems are becoming more serious. However, it is possible to mitigate these environmental burdens without negatively impacting economic benefits. A few studies have already started identifying hotpots that could be modified inside the operations [8], but there is still the need to take a further step to find appropriate modifications for the operational process.
Toward sustainable development, there is an effort to understand the relationship between economic growth and the environment. The Environmental Kuznets Curve (EKC) theory suggests that environmental quality can be upgraded after economic development has attained a sufficient level. During the period of development of economies, there is a positive association between economic growth and environmental deterioration [9]. Also, it has been conventionally believed that profit maximization determines optimal production; therefore, any added exertions placed on the improvement of environmental performance will inevitably result in a lower benefit [10]. This opinion has changed recently. There are various studies demonstrating the feasibility of achieving the harmonization between environmental quality and economic growth throughout the developmental phases of an economy [11]. There are suggestions that several mechanisms could provide better environmental performance while raising economic benefits. For instance, it is possible to attain higher profits while reducing the burden on the environment using cleaner production [12] or circular economy [13]. This creates a positive relationship between economic and environmental performance. Appropriate methods of identifying how to obtain higher economic benefits without harming the environment are required. Furthermore, this relationship could be used to raise awareness of environmental performance among firms’ managers or owners without adding to existing regulations. It also provides incentives for owners or managers to adopt environmentally friendly production methods that reduce the interventions required by the government to protect the environment [14]. Authorities should then make an effort to promote this positive relationship [15].
In light of these circumstances, thorough practical methods are needed to grasp the current situation, construct imminent scenarios, and establish proper procedures and plans that support designing sustainable production and consumption patterns [16]. It is generally accepted that the synergistic application of the life cycle method with other non-life cycle approaches could improve the decision-making process in support of sustainable development [17]. In particular, there is growing interest in scientific research engaging the combination of life cycle assessment (LCA) and data envelopment analysis (DEA) in the assessment of similar establishments (called decision-making units, DMUs) such as farms [18] and fisheries [19]. A joint investigation applying LCA, an integrated impact assessment, and DEA, a nonparametric method to calculate the efficiency of similar establishments, could provide reasonable suggestions for operational improvement and for the sustainability management of the establishment. In addition, the results of LCA and DEA could be used to raise awareness of the positive relationship between the economy and environment, consistent with sustainable development. The available literature shows that the existing studies applying LCA tertiary sectors DEA are mainly from the primary sector [8], especially the energy sector [20]. In contrast, there have been few LCA and DEA studies applied to the tertiary sector including service industries such as hospitality and tourism, healthcare, and education. It is recognized as a knowledge gap [21] and there is a lack of studies on the benchmarking of retail food shops toward filling this gap.
Consequently, the goal of this study is to perform a combined analysis of operational efficiency and environmental consequences for food service establishments in Phuket, a globally prominent tourist island in southern Thailand, a developing country. The study used the synergistic application of LCA and DEA. The results show the achievable target for operational processes that would transform inefficient food service establishments into fairly efficient ones, and the quantification of economic and environmental credits they could gain. This work focuses on the internal operating processes of food service establishments and the subsequent environmental impacts, as well as the solutions to improve these processes. The framework of this study could also be used as an example for other similar entities to find an appropriate and feasible benchmark for their operational and environmental performance. This study also contributes to the literature on the EKC, showing that it is possible to create a harmonized relationship between environmental quality and economic growth during the developmental stages.
2. Material and Methods
2.1. Study Area
Phuket is an island in the Andaman Sea located on the west coast of Thailand. It is administratively divided into three districts: Thalang (6 sub-districts), Kathu (3 sub-districts), and Mueang (8 sub-districts) as presented in Figure 1. It was the first city in the Association of Southeast Asian Nations (ASEAN) to be awarded “Creative City of Gastronomy” by UNESCO in 2015 [22].

Figure 1.
Administration map of the Phuket study area.
The beaches on the west coast of Phuket favor tourism activities while those in the eastern areas are mostly harbors employed as the main points for boat departures heading to the nearby islands [23]. Therefore, many sub-districts on the west coast, including Cherngtalay, Kamala, Patong, and Karon, have high tourist influx. Others including Rawai and Chalong in the south are also popular among tourists. These tourist magnet sub-districts have infrastructure and facilities primarily designed for tourism, including accommodation such as hotels (as partly shown in Figure S1 in the Supplementary Materials), dining, and entertainment facilities such as restaurants, cultural and arts venues, parks, and shopping centers [24]. On the other hand, the eastern and central parts have a higher density of offices, schools, and hospitals than the west and south coastal parts, which are tourist magnet areas. The infrastructure and facilities in these areas are built for official operation and residential living. They include residential buildings, official blocks, hospitals, roads, treatment plants, and so on [25]. In Phuket, 75% of the schools, hospitals, and offices are in the eastern and central areas (based on the data in Table S1 in Supplementary Materials).
2.2. Research Method
This study applied both DEA and LCA in the assessment process. In order to make a fair assessment and provide an achievable benchmark, the food service establishments in Phuket were segregated into three categories based on the facilities and services provided, i.e., air-conditioned, non-air-conditioned, and street food service establishments. Data were extracted from an inventory study [26] presenting the inputs and outputs of nearly 850 food service establishments.
Figure 2 shows the framework of this study. The first step was refining data regarding the internal operations of the food service establishments. The data included the food service establishments’ characteristics (air-conditioning, non-air-conditioning, and street food), typical cuisine (Thai/Phuket food, international food, beverages, and desserts), operating costs (expenses for electricity, tap water, liquefied petroleum gas (LPG), fuels, and solid waste disposal), monthly income, and other background information for the analysis as presented in the Supplementary Materials.
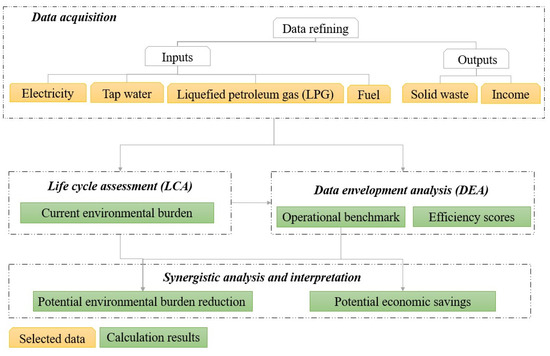
Figure 2.
Framework of this study.
The following steps involved the utilization of LCA and DEA techniques. LCA is dedicated to evaluating the environmental impacts attributed to food service establishments. Therefore, the LCA results represent the extent of the resource consumption and environmental effects caused directly and indirectly by food service establishments. Impact assessment takes into consideration the consequences of the production of electricity, tap water, fuel, and cooking gas used and the disposal of general waste and food waste generated. The impact categories included in the assessment are climate change, fossil fuel depletion, acidification, eutrophication, and water use. This study applied the ReCiPe 2016 life cycle impact assessment method [27] at the midpoint level to quantify the environmental burdens caused by food service establishments.
DEA, on the other hand, focuses on assessing the operational and ecological effectiveness of these establishments. It presents the results through efficiency scores and establishes the benchmark for inefficient food service establishments. Based on the gap between the current performance of each DMU and its optimal potential, DEA also offers suggestions on input reduction to achieve efficient performance.
For the process of DEA calculation where the DMU in this study is the food service establishment in Phuket, the efficiency score (q) of multiple inputs and outputs is calculated as Equation (1) [28]:
in which and are the inputs and outputs, respectively;
and are the multiplier weights of inputs and outputs, respectively;
m and s are the number of inputs (t = 1, 2, …, m) and outputs (r = 1, 2, …, s), respectively;
j denotes the order of a DMU (j = 1, 2, …, n).
This study chooses to use the Banker, Chames, and Cooper (BCC) model with variable returns to scale (VRS) that allows the results to show the modification of inputs and unexpected outputs in operational processes while retaining the economic gain for each DMU.
There are two efficiency scores presented in this study. The first is operational efficiency, focusing on assessing how productive the processes are inside the DMUs. The operational efficiency takes electricity (kWh), tap water (m3), fuel (L), and cooking gas (kg) as inputs ; general waste (kg) and food waste (kg) as unexpected outputs, therefore treated as an input ; and income (Thai baht—with the exchange rate of USD 1 = THB 33.94 in 2017) [29] as the expected output for DEA. The second is eco-efficiency, focusing on examining the environmental performance of DMUs. The inputs of the eco-efficiency calculation include climate change, fossil resource consumption, acidification, eutrophication, and water use while the output is the income of each establishment. The efficiencies then separate the efficient food service establishments (efficiency score = 1) from the inefficient ones (0 ≤ efficiency score < 1). and were calculated through maximization processes.
Benchmarks based on the operational efficiency calculated in this step were then used as operational targets to transform inefficient food service establishments into efficient ones. With this, the smallest reduction in inputs and unexpected outputs compared to the current value would be on the same scale as efficient ones while maintaining economic well-being. In this way, food service establishments can receive benefits in both economic and environmental aspects and develop more sustainably.
The final step included analysis and interpretation processes. Besides the efficiency scores, this study also analyzed the elements that impact the performance of each DMU category. These elements could then be utilized in recommendations for enhancing the efficiency of each specific food service establishment type.
3. Results and Discussion
The results of efficiency scores, environmental impacts, and suggested measures are presented for each sub-district in Mueang (Chalong, Karon, Ko Kaeo, Ratsada, Rawai, Talat Nuea, Talat Tai, Wichit), Kathu (Kamala, Kathu, Patong), and Thalang (Cherngtalay, Maikhao, Pa Khlok, Sakhu, Sisunthon, Thep Krasattri) in the percentile range of 25 and 75 by the rectangle boxes, and percentile 5 and 95 by the bars. The median values are symbolized by diamonds. Detailed information about the sample sizes for each respective area can be found in Table S2 (Supplementary Materials).
Since the main classification of this study in applying DEA and LCA is the type of food service establishment (air-conditioned, non-aired-conditioned, and street food), the data were randomly collected in geographic areas, predominantly driven by availability. Consequently, the samples were not obtained from every sub-district. Nevertheless, adhering to the intended classification, the sample size of each category met a fundamental statistical criterion stating that the sufficient numbers of samples for an unknown population is at least 30 [30].
3.1. Air-Conditioned Food Service Establishments
3.1.1. Efficiency Assessment of the Air-Conditioned Food Service Establishments
The provincial average operational and eco-efficiency scores of the air-conditioned DMUs in Phuket were 0.81 and 0.65, respectively. In all, 42.7% of the air-conditioned DMUs were assessed as efficient DMUs by operational efficiency while those assessed by eco-efficiency were 14.7%. This is normal since their primary target in doing business is to minimize expenses and maximize financial gains, while an environmental issue is not the major consideration.
On the other hand, based on the findings, it is evident that all DMUs with an eco-efficiency of 1 attained an operational efficiency of 1, while DMUs with an operational efficiency of 1 did not always correspond to an eco-efficiency of 1, as depicted in Figure 3a,b. This underlines the notion that the attention paid to the environment by efficiently using resources while running a business helps guarantee monetary profit.
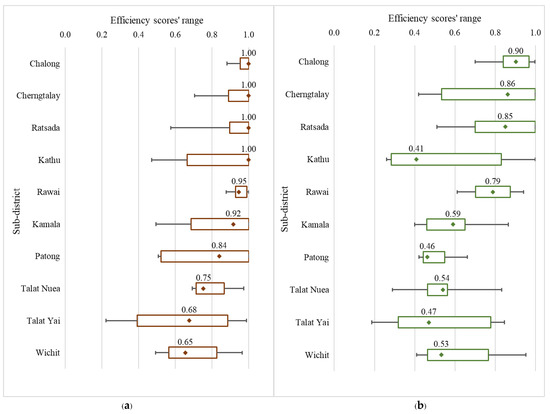
Figure 3.
Performance efficiencies of air-conditioned food service establishments in Phuket. (a) Operational efficiency; (b) Eco-efficiency.
There was a similar pattern of results between the operational efficiency and eco-efficiency in the case of the air-conditioned food service establishments in each sub-district in Phuket, as shown in Figure 3, except in the case of Kathu. The results from the analyzed data also indicated that the performance of air-conditioned DMUs in Phuket was notably impacted by their locations, their operational hours, and the surroundings—particularly the presence of high-end restaurants and elite hotels in the vicinity of the DMU location.
Concerning the impact of locations on efficiency score, differences were observed between the efficiency scores of the tourist magnet sub-districts (Cherngtalay, Kamala, Chalong, and Rawai) with more destinations and facilities for tourism, compared to eastern and central areas with a higher density of offices, schools, and hospitals. Kathu was the only sub-district in the eastern and central areas with a higher operational efficiency score compared to the magnet tourist sub-districts such as Rawai and Kamala. Locations also influenced other important factors including business hours and neighboring environment, with the evidence in Figure 1 and Figure S1, and Table 1 and Table 2 indicating that DMUs with high performances were in the sub-districts having elite hotels. The location of a food service establishment, whether in the tourist magnet regions or other parts, profoundly influenced the operational efficiency score of air-conditioned food service establishments.

Table 1.
Operational efficiency based on the opening time of air-conditioned food service establishments.

Table 2.
Opening duration and average price per best seller of air-conditioned food service establishments in Phuket.
As illustrated in Figure 3a, air-conditioned food service establishments in tourist magnet sub-districts such as Cherngtalay generally tended to score better in efficiency with a smaller variation range, while other sub-districts, such as Talat Yai and Talat Nuea, exhibited worse efficiency scores with greater fluctuations. This is partly due to differences in business hours, with establishments in the tourist magnet parts generally having shorter business hours compared to those in other areas. Ratsada—a sub-district in the eastern part—also had a shorter open duration compared to the average business hours of all sub-districts. The data presented in Table 2 indicate that the average daily business hours of establishments in tourist magnet sub-districts are half an hour shorter than those in eastern and central sub-districts. This variation arises due to the distinct timing of the daily activities of the primary target customers, which is contingent upon the locations of DMUs.
It was observed that the majority of the establishments in tourist magnet areas that opened after 9 a.m. had higher efficiency scores compared to those that opened before 9 a.m., as shown in Table 1. A total of 88% of the most efficient establishments in tourist magnet areas typically began their operations from 9 or 10 in the morning and onwards. Prolonged business hours during periods having low occupancy rates could result in increased resource utilization, such as the electricity consumed for air-conditioning and lighting. On the other hand, the establishments in eastern and central sub-districts also tended to have higher efficiency when they opened before “office time”, which is before 9 in the morning. Opening hours can be considered one of the influential factors in the efficiency of air-conditioned DMUs. Focusing on hours of high occupancy can help improve the performance of these establishments.
The surrounding conditions of areas can also have substantial impacts on the efficiency scores, considering the income earned by the establishments with the supporting data provided in Table 2. As an illustration, the data of Cherngtalay gathered from Laguna Road, an area known for high-end restaurants and hotels that are more popular with international tourists, show that food service establishments in this area mostly set higher prices compared to others. The average price of a dish there is three to four times higher than in Chalong and Rawai. The price of the best-selling dishes of a restaurant here could be fivefold greater compared to similar food in other locations. The higher income leads to higher efficiency scores, even though the establishments there might have fewer customers compared to Ratsada and Kamala.
Since there were difficulties in gaining information on the most visited air-conditioned food service establishments in Patong, the efficiency score of food service establishments in this well-known area of tourism surprisingly fell in the lower half of the list. In this area, the big range of percentiles 25 and 75 can be clearly observed, indicating the difference in performance among shops for operational efficiency, while its median for eco-efficiency is almost the last of all sub-districts, implying the inefficiency in resource use.
As shown in Figure 4, the highest-score sub-districts such as Chalong and Cherngtalay had lower resource consumption and waste discharge per THB 1000 compared to the others. However, in the case of Cherngtalay, the comparatively low values depicted in Figure 4 are the results of the substantial earnings of the establishments, not necessarily indicative of the low resource consumption and waste generation itself. The examination of overall resource consumption and waste discharge, supported by Table S3 in the Supplementary Materials, reveals that Cherngtalay actually consumed more resources and discharged a larger amount of waste.
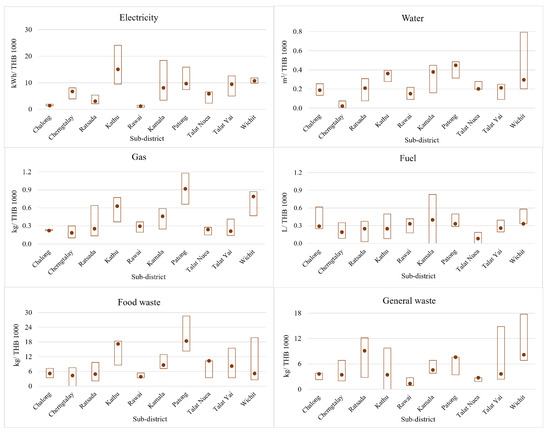
Figure 4.
Resource consumption and waste discharge originating from the air-conditioned food service establishments in Phuket.
The efficiency score calculated by DEA measures the relative efficiency based on the comparison of a DMU’s factual performance to its maximum possible performance, given its inputs and outputs. In other words, the efficiency score represents the extent to which a DMU is using its inputs effectively to produce outputs. The higher an efficiency score is, the closer a DMU is to its maximum possible level and the less reduction is required. In the case of Talat Nuea, its efficiency score was lower than that of Kathu and Kamala even on average; the daily customer number of an establishment in Talat Nuea was 4–6 times higher than that in Kamala and Kathu (Table 2). This suggests that Talat Nuea required improvement in order to reach an efficient performance in comparison to Kathu and Kamala, despite using less resources and generating less waste per THB 1000, as depicted in Figure 4 and Table 1.
Higher consumption led to higher environmental burdens. As demonstrated in Figure 5, Chalong, Rawai, and Cherngtalay used lower resources; hence, they had the lowest environmental impact per THB 1000 earned. Electricity consumption occupied the largest proportion of both climate change and fossil resource scarcity. The second biggest contributor to climate change was food waste, while that to fossil resource consumption was gas consumption. Food waste also occupied the biggest shares of acidification and eutrophication. The presentation of the environmental burden’s contribution from each type of resource consumption and waste discharge can be found in Table S4.

Figure 5.
Environmental burden attributed to the air-conditioned food service establishments in Phuket.
3.1.2. Improvement Suggestions for the Air-Conditioned Food Service Establishments
Generally, there were significant differences in the reduction suggestions for the sub-districts with higher efficiency scores compared to those with lower efficiency scores, as indicated by Figure 6. If air-conditioned food service establishments follow the reduction in numbers (given based on all DMUs having an operational efficiency of 1) suggested in Figure 6, the environmental impact could be relieved by at least 25% in each category, while the expenses on resources such as electricity and water could be decreased by approximately THB 4500 per DMU per month.
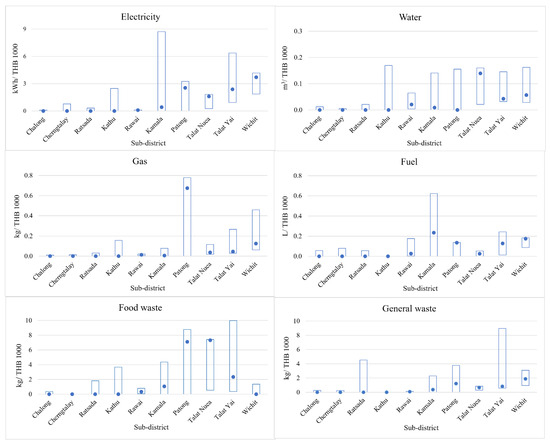
Figure 6.
Reduction targets for resource use and waste from air-conditioned food service establishments in Phuket.
In terms of environmental considerations, electricity consumption plays a considerable role in determining the performance of air-conditioned DMUs in Phuket. Thus, adjusting business hours, which directly impacts electricity consumption, is one of the ways to significantly enhance the performance of air-conditioned DMUs. Reducing business hours in periods with few customers when expenses on facilities such as electricity are high could improve the performance of the DMUs. In tourist magnet sub-districts that are popular with tourists, the efficient DMUs usually begin their operating hours at 9 a.m. or later. For instance, an establishment serving beverages and desserts in Chalong that opened later at 10 a.m. with a shorter duration (9 h per day) achieved an efficient performance, while one that opened at 8 a.m. with a longer duration (13–15 h per day) had inefficient performances. Similar cases were also discovered in Rawai and Cherngtalay. In eastern and central sub-districts where the residents and officers accounted for the majority of the customers, the efficient DMUs tended to start operating from 7–8 a.m. onward (one or two hours prior to office hours) but closed earlier.
3.2. Non-Air-Conditioned Food Service Establishments
3.2.1. Efficiency Assessment of Non-Air-Conditioned Food Service Establishments
The non-air-conditioned DMUs in Phuket displayed an average operational efficiency score of 0.41, with a mere 9.08% of them classified as efficient. In terms of eco-efficiency, the average score for non-air-conditioned DMUs in Phuket was 0.30, and only 2.2% of them had an eco-efficiency score of 1. Similar to the air-conditioned DMUs, the non-air-conditioned DMUs achieving an eco-efficiency score of 1 also had operational efficiency scores of 1. On the other hand, DMUs with an operational efficiency score of 1 did not consistently exhibit an eco-efficiency score of 1. Achieving good efficiency in operational performance does not automatically secure the same outcome for environmental performance.
As depicted in Figure 7, on average, the highest efficiency scores were found in three sub-districts, including Karon, Pla Khlok, and Sakhu, while the lowest scores were in the other three sub-districts, Maikhao, Patong, and Ko Kaeo.
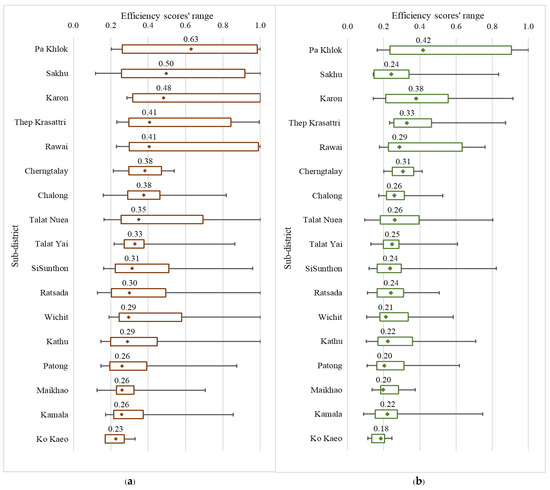
Figure 7.
Performance efficiencies of non-air-conditioned food service establishments in Phuket. (a) Operational efficiency; (b) Eco-efficiency.
The primary element affecting the effectiveness of non-air-conditioned food service establishments was their operating hours. For tourist magnet areas, the DMUs opening after 9 a.m. mostly had higher efficiency scores compared to those opening before 9 a.m. (Table S5 in Supplementary Materials), while in eastern and central sub-districts, the appropriate opening time depended on the cuisine that the food service establishments sell. Hence, in those areas, the efficiency scores were not significantly influenced by the opening time before or after 9 a.m., as indicated in Table S6 of the Supplementary Materials, but by the specific times for different types of food. For example, the efficient establishments selling Thai papaya salad or Thai fried chicken often open at 11 a.m. to serve lunches while the establishments selling Thai buffets usually open at 6:30 p.m. to serve dinners.
Different from air-conditioned food service establishments, the length of business hours and the surrounding environments did not primarily influence the operational efficiency scores of non-air-conditioned DMUs. As shown in Figure 7, the efficiency scores of tourist magnet sub-districts were not higher compared to other sub-districts. Also, Cherngtalay, the sub-district with elite hotels and high-end restaurants, did not achieve a superior efficiency score. The duration of business hours of efficient DMUs varied from 4.8 h to 16.5 h for all DMUs having low to high scores.
The low values presented in Figure 8 for Cherngtalay compared to other areas were not due to low resource consumption and waste disposal but rather to the high income of the food service establishments in the area, comprising high-end hotels and restaurants. The operational performance of non-air-conditioned DMUs was mainly influenced by food waste and cooking gas.
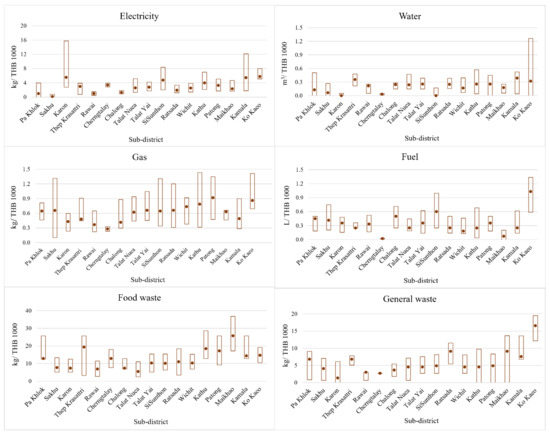
Figure 8.
Resource consumption and waste discharge originating from non-air-conditioned food service establishments in Phuket.
As presented in Figure 9, the area of Ko Kaeo made the most significant contribution to climate change and fossil resource consumption due to its significantly high consumption of gas and fuel per THB 1000. On the other hand, Maikhao had the highest contribution to acidification and eutrophication, primarily due to its substantial waste discharge. Food waste emerged as the primary driver of climate change for non-air-conditioned food service establishments, while fuel consumption occupied the most significant part of fossil resource depletion. Food waste also remained the foremost contributor to acidification and eutrophication. Details regarding the contribution of each input to the environmental burden are shown in Table S4 in the Supplementary Materials.
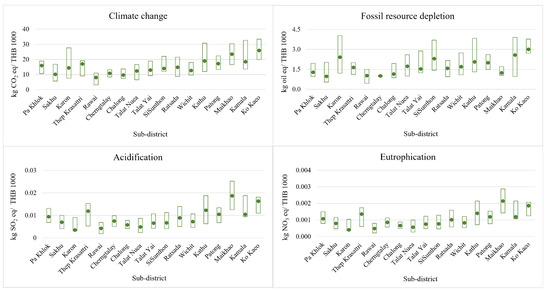
Figure 9.
Environmental impacts attributed to non-air-conditioned food service establishments in Phuket.
3.2.2. Improvement Suggestions for Non-Air-Conditioned Food Service Establishments
Figure 10 suggests a reduction in resource consumption and waste discharge for non-air-conditioned DMUs. The suggested reduction in all resource consumption (all DMUs have an eco-efficiency of 1) could bring about a potential decrease of nearly THB 4700 in expenditure on resource consumption and at least nearly 50% in environmental burdens in each category on average.
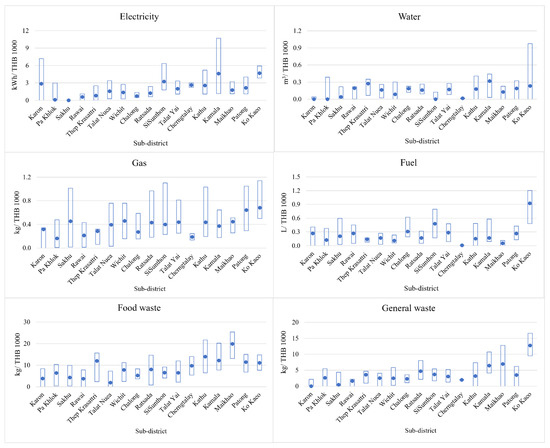
Figure 10.
Reduction targets for resource use and waste from non-air-conditioned food service establishments in Phuket.
Food waste was the factor that was decisive in both the operational and environmental performances of non-air-conditioned DMUs. In Phuket, where waste can be managed through either landfills or combustion, reducing the amount of food waste and managing waste properly can have a great impact in mitigating the environmental impacts. By separating food waste from other types of waste, the creation of methane in landfills can be reduced, and combustion can be made more energy efficient. Composting food waste to create a natural fertilizer for plants and gardens is also an option, especially for the farms in tourism-based communities. Another option could be food waste-to-energy biodiesel, which is preferred over incineration [31]. In 2013, the Wichit Municipality in Phuket took its first steps toward this by launching a program to convert used cooking oil into biodiesel [32].
Another approach that could be beneficial to non-air-conditioned DMUs would be to schedule their operating hours based on their location and the type of cuisine they serve. In tourist magnet sub-districts, the opening hours remain from 9 a.m. onward while in other sub-districts, they would strongly depend on the types of food that the dining unit serves. There are menus that are preferred for dinner, such as hotpot.
3.3. Street Food Service Establishments
3.3.1. Efficiency Assessment of Street Food Service Establishments
The average operational efficiency score of street food service establishments in Phuket was 0.45. In all, 9.67% of them were assessed as efficient street DMUs. On the other hand, the mean eco-efficiency rating of street food establishments in Phuket was 0.6, and 5.81% of these establishments received a score of 1 for eco-efficiency.
As shown in Figure 11, Talat Nuea, Wichit, and Talat Yai were the three sub-districts that had the highest operational efficiency scores, while Chalong, Pa Khlok, and Patong had the lowest scores. This was the same as in the cases of air-conditioned and non-air-conditioned food service establishments, where the DMUs that had operational efficiency scores of 1 had higher chances of being eco-efficient. It suggested that if food service establishments aim to raise their eco-efficiency to 1, they should begin by being operationally efficient.
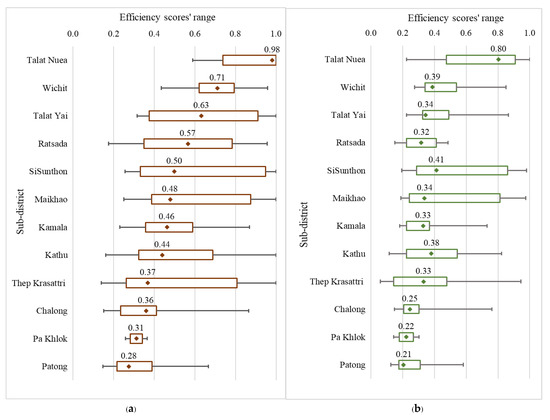
Figure 11.
Performance efficiencies of street food service establishments in Phuket. (a) Operational efficiency; (b) Eco-efficiency.
As shown in Figure 12, the tourist magnet sub-districts also did not have higher efficiency scores compared to other sub-districts. Even in tourist magnet sub-districts, the DMUs that opened from 10 a.m. onward for all types of cuisine also did not have efficient performances. The open hours of DMUs in other sub-districts varied from the morning until the afternoon. This result displays a distinctive trait of the street food service establishments, which is location flexibility. For instance, various establishments are in markets that are open over the weekends or twice a week; hence, they open other locations on the other days. As a result, the opening hours and customers also vary according to the locations. Since all factors vary, it is difficult to identify the important elements in the efficiency of street food DMUs.
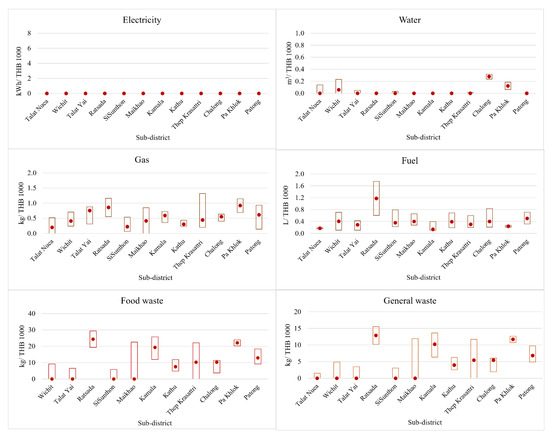
Figure 12.
Resource consumption and waste discharge originating from the street food service establishments in Phuket.
As can be seen from Figure 12, the electricity consumption of street food establishments was zero. There could be several reasons. Since this study focused on the operational processes inside the shops, some processes happening outside of the selling sites, such as preparation and cleaning, were not presented. Another reason is that these DMUs are open in the daytime when it is not required to use electricity for lighting. The exclusion of preparation and cleaning is also a reason for the zero water consumption and waste discharge of various street food service establishments. Another explanation for zero waste is that the menu offered in these units is normally take-away food, and thus there was no record of food waste or general waste in numerous DMUs. This is different from the other types of DMUs, where every step from preparation to completion typically occurs within the establishments themselves. These differences in the unit’s operational processes should be considered when using DEA to assign appropriate classifications regarding the aims of the study. Different from the above types of food service establishments, the operational performance of street food service establishments was primarily influenced by fuel and cooking gas (LPG).
Since the waste of street food establishments is normally taken away with the customers, the records for eutrophication and acidification presented in Figure 13 were insignificant. Not only did consuming higher cooking gas and fuel lead to a more significant effect on climate change and fossil resource consumption, but Ratsada also contributed a greater load to the acidification and eutrophication caused by waste disposal.
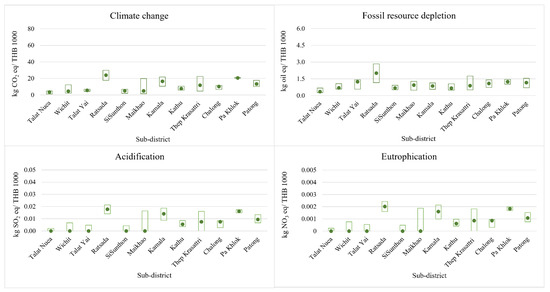
Figure 13.
Environmental impacts attributed to street food service establishments in Phuket.
3.3.2. Improvement Suggestions for the Street Food Service Establishments
Figure 14 depicts the reduction suggested (all DMUs have an eco-efficiency of 1) for street food service establishments. The exclusion of the preparing and cleaning processes as explained above led to the zero reduction required for numerous units in the consumption of electricity and water, as well as waste discharge. A potential average savings of nearly THB 1600 and a reduction of at least 30% in the environmental burden in each category could be achieved in cases where street food establishments in Phuket improve their operational process. Rastasa—the sub-district that generated more significant environmental impacts—also required a higher reduction compared to other sub-districts.
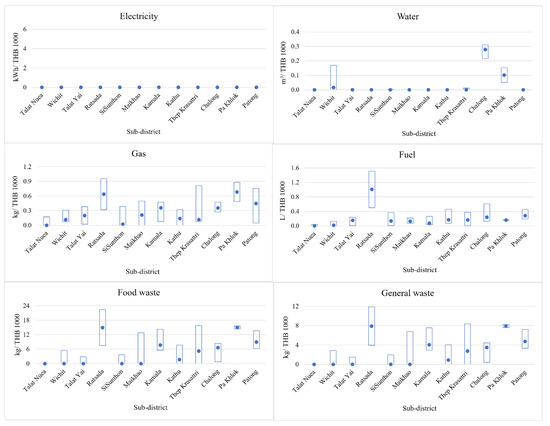
Figure 14.
Reduction targets for resource use and waste from street food service establishments in Phuket.
4. Conclusions
This study investigated the performances of food service establishments in Phuket, an international tourist island, using LCA and DEA methods. Not only does it contribute to the literature on the application of LCA and DEA in a tertiary industry, but this research also provides a positive example of how to create a harmonized relationship between the environment and the economy during the developmental stage of a country.
There is an important suggestion for later studies, which is to carefully contemplate the characteristics of all the included entities in the research to assign an appropriate classification to perform a fair assessment and give feasible reduction targets and solutions. The efficiency scores calculated by DEA show the magnitude of an inefficient DMU compared to an efficient one and then set the benchmarks for that DMU based on the ideal efficient model, which was built based on the data of the relatively efficient DMUs. Hence, the benchmark of a DMU should be established based on the ideal model that also provides the same services. For instance, for this study, it was unfeasible to consider a street food service establishment as a suitable model for an air-conditioned one since the air-conditioned DMUs provide several services that street food service establishments do not, such as air-conditioning, decorative lights, and music. All these services strongly affect the resource consumption of a DMU, causing a great impact on the efficiency score calculation. A food establishment should draw its ideal models from within its own category. Hence, as an example applied to the service industry, this research classified the subgroups based on the services provided by each type of food service establishment.
There are differences between the two types of efficiency scores. Operational efficiency pertains to the operational effectiveness of the resource consumption and waste discharge of each DMU, while eco-efficiency focuses on the environmental effects of that DMU. The result reveals that if a DMU achieves an eco-efficiency of 1, it also demonstrates an operational efficiency of 1. Nevertheless, achieving an operational efficiency of 1 for DMUs did not guarantee that they would also have an eco-efficiency of 1. This suggests that in an effort to establish a harmonized relationship between the environment and the economy during the developmental stages of moving toward sustainability, it is necessary to consider assessments of both operational and environmental aspects. Merely being operationally efficient does not ensure good environmental efficiency.
The analysis findings suggest that the efficiency of distinct DMU types was predominantly shaped by several different factors. Among all the factors, the most influential one on DMU efficiency scores was the location. In consideration of inputs, general waste and electricity were found to be the primary inputs influencing performance for air-conditioned DMUs, whereas food waste and cooking gas were the major contributors for non-air-conditioned DMUs. The performance of street food service establishments was considerably affected by fuel and cooking gas.
Appropriate business hours could improve operational performance and reduce the environmental burden from air-conditioned and non-air-conditioned food service establishments. It is suggested that air-conditioned and non-air-conditioned food service businesses located in tourist magnet parts where tourism has been significantly developed start their operations from 9–10 in the morning. An earlier opening time might result in unnecessary resource utilization costs, especially during hours when the customer number is not worth the operation, particularly for air-conditioned establishments where electricity consumption is heavily influenced by the length of operating hours. For air-conditioned food service establishments located in the sub-districts surrounded by government buildings and schools, it is recommended to open before office hours, around 7 or 8 a.m. onward. For non-air-conditioned establishments, the recommended operating hours depend on the type of cuisine offered.
Supplementary Materials
The following supporting information can be downloaded at: https://www.mdpi.com/article/10.3390/su152416820/s1, Figure S1: Operating hotels with the size that require an environmental impact assessment (EIA) in Phuket; Table S1: Locations of schools, offices and hospitals in Phuket; Table S2: Numbers of samples in each area (DMUs); Table S3: The average total resource consumption and waste generation of one air-conditioned DMU in each sub-district in Phuket; Table S4: Contribution (%) of each input and undesired output to each environmental category; Table S5: Operational efficiency based on opening time of non-air-conditioned food service establishments in ”tourist magnet areas”; Table S6: Operational efficiency based on opening time of non-air-conditioned food service establishments in ”other areas”.
Author Contributions
Conceptualization, H.A.T.N., S.H.G. and K.P.; Methodology, H.A.T.N. and K.P.; Software, H.A.T.N.; Validation, S.H.G. and K.P.; Formal analysis, H.A.T.N., S.H.G. and K.P.; Investigation, K.P.; Resources, K.P., S.K., J.T. and P.R.; Data curation, H.A.T.N., K.P., S.K., J.T. and P.R.; Writing—original draft, H.A.T.N.; Writing—review & editing, H.A.T.N., S.H.G. and K.P.; Visualization, H.A.T.N.; Supervision, S.H.G. and K.P.; Project administration, K.P.; Funding acquisition, S.H.G. and K.P. All authors have read and agreed to the published version of the manuscript.
Funding
The authors acknowledge the funding from by The Joint Graduate School of Energy and Environment (JGSEE), King Mongkut’s University of Technology Thonburi (KMUTT) and the National Science and Technology Development Agency (NSTDA) under the project “An analysis of green gross provincial product (GPP) of Phuket, a tourist city” (P-16-50628).
Institutional Review Board Statement
Not applicable.
Informed Consent Statement
Not applicable.
Data Availability Statement
Data are contained within the article and Supplementary Materials.
Acknowledgments
We would like to thank Tip Sophea and Papaporn Pinitsuwan for their help in the graphic presentation of this paper.
Conflicts of Interest
The authors declare no conflict of interest.
References
- United Nations. World Population Prospects 2022: Summary of Results; United Nations: New York, NY, USA, 2022. [Google Scholar]
- Khan, S.A.R.; Ponce, P.; Yu, Z.; Ponce, K. Investigating economic growth and natural resource dependence: An asymmetric approach in developed and developing economies. Resour. Policy 2022, 77, 102672. [Google Scholar] [CrossRef]
- Wang, X. Managing Land Carrying Capacity: Key to Achieving Sustainable Production Systems for Food Security. Land 2022, 11, 484. [Google Scholar] [CrossRef]
- Nguyen, L.Q.; Fernandes, P.O.; Teixeira, J.P. Analyzing and Forecasting Tourism Demand in Vietnam with Artificial Neural Networks. Forecasting 2022, 4, 36–50. [Google Scholar] [CrossRef]
- Crippa, M.; Solazzo, E.; Guizzardi, D.; Monforti-Ferrario, F.; Tubiello, F.N.; Leip, A. Food systems are responsible for a third of global anthropogenic GHG emissions. Nat. Food 2021, 2, 198–209. [Google Scholar] [CrossRef]
- Cerrah, S.; Yigitoglu, V. Determining the effective factors on restaurant customers’ plate waste. Int. J. Gastron. Food Sci. 2022, 27, 100469. [Google Scholar] [CrossRef]
- Lang, L.; Wang, Y.; Chen, X.; Zhang, Z.; Yang, N.; Xue, B.; Han, W. Awareness of food waste recycling in restaurants: Evidence from China. Resour. Conserv. Recycl. 2020, 161, 104949. [Google Scholar] [CrossRef]
- Vázquez-Rowe, I.; Iribarren, D. Review of Life-Cycle Approaches Coupled with Data Envelopment Analysis: Launching the CFP + DEA Method for Energy Policy Making. Sci. World J. 2015, 2015, 813921. [Google Scholar] [CrossRef] [PubMed]
- Kaika, D.; Zervas, E. The Environmental Kuznets Curve (EKC) theory—Part A: Concept, causes and the CO2 emissions case. Energy Policy 2013, 62, 1392–1402. [Google Scholar] [CrossRef]
- Omisore, A.G. Attaining Sustainable Development Goals in sub-Saharan Africa; The need to address environmental challenges. Environ. Dev. 2018, 25, 138–145. [Google Scholar] [CrossRef]
- Sadik-Zada, E.R.; Gatto, A. Grow First, Clean Up Later? Dropping Old Paradigms and Opening Up New Horizons of Sustainable Development. Sustainability 2023, 15, 3595. [Google Scholar] [CrossRef]
- Tanackov, I.; Badi, I.; Stević, Ž.; Pamučar, D.; Zavadskas, E.K.; Bausys, R. A Novel Hybrid Interval Rough SWARA–Interval Rough ARAS Model for Evaluation Strategies of Cleaner Production. Sustainability 2022, 14, 4343. [Google Scholar] [CrossRef]
- Banjerdpaiboon, A.; Limleamthong, P. Assessment of national circular economy performance using super-efficiency dual data envelopment analysis and Malmquist productivity index: Case study of 27 European countries. Heliyon 2023, 9, e16584. [Google Scholar] [CrossRef] [PubMed]
- Orlitzky, M.; Schmidt, F.; Rynes, S. Corporate Social and Financial Performance: A Meta-Analysis. Organ. Stud. 2003, 24, 403–441. [Google Scholar] [CrossRef]
- Jan, P.; Dux, D.; Lips, M.; Alig, M.; Dumondel, M. On the link between economic and environmental performance of Swiss dairy farms of the alpine area. Int. J. Life Cycle Assess. 2012, 17, 706–719. [Google Scholar] [CrossRef]
- Sala, S.; Farioli, F.; Zamagni, A. Progress in sustainability science: Lessons learnt from current methodologies for sustainability assessment: Part 1. Int. J. Life Cycle Assess. 2013, 18, 1653–1672. [Google Scholar] [CrossRef]
- Berlin, J.; Iribarren, D. Potentials and limitations of combined life cycle approaches and multi-dimensional assessment. In Designing Sustainable Technologies, Products and Policies; Springer: Cham, Switzerland, 2018; pp. 313–316. [Google Scholar]
- Payandeh, Z.; Jahanbakhshi, A.; Mesri-Gundoshmian, T.; Clark, S. Improving Energy Efficiency of Barley Production Using Joint Data Envelopment Analysis (DEA) and Life Cycle Assessment (LCA): Evaluation of Greenhouse Gas Emissions and Optimization Approach. Sustainability 2021, 13, 6082. [Google Scholar] [CrossRef]
- Vázquez-Rowe, I.; Iribarren, D.; Moreira, M.T.; Feijoo, G. Combined application of life cycle assessment and data envelopment analysis as a methodological approach for the assessment of fisheries. Int. J. Life Cycle Assess. 2010, 15, 272–283. [Google Scholar] [CrossRef]
- Martín-Gamboa, M.; Iribarren, D.; García-Gusano, D.; Dufour, J. A review of life-cycle approaches coupled with data envelopment analysis within multi-criteria decision analysis for sustainability assessment of energy systems. J. Clean. Prod. 2017, 150, 164–174. [Google Scholar] [CrossRef]
- Álvarez-Rodríguez, C.; Martín-Gamboa, M.; Iribarren, D. Enhancing Life Cycle Management Through the Symbiotic Use of Data Envelopment Analysis: Novel Advances in LCA+ DEA. In Towards a Sustainable Future-Life Cycle Management; Springer: Cham, Switzerland, 2022; pp. 257–263. [Google Scholar]
- Chaopreecha, J.; Tovankasame, N.; Limbut, P. Reconsidering the Chinese Identity: Cultural Reproduction in Phuket Gastronomy. In Transnational Chinese Diaspora in Southeast Asia: Case Studies from Thailand, Malaysia, and Singapore; Springer Nature: Singapore, 2022; pp. 81–104. [Google Scholar]
- Akkajit, P.; Tipmanee, D.; Cherdsukjai, P.; Suteerasak, T.; Thongnonghin, S. Occurrence and distribution of microplastics in beach sediments along Phuket coastline. Mar. Pollut. Bull. 2021, 169, 112496. [Google Scholar] [CrossRef]
- The Tourism & Transport Forum. Tourism Infrastructure Policy & Priorities. 2008. Available online: https://www.ttf.org.au/wp-content/uploads/2016/06/TTF-Tourism-Infrastructure-Priorities-2012.pdf (accessed on 15 September 2022).
- International Electrotechnical Commission. The White Paper of Orchestrating Infrastructure for Sustainable Smart Cities. 2022. Available online: https://www.ceps.eu/wp-content/uploads/2015/01/iecWP-smartcities-LR-en.pdf (accessed on 15 September 2022).
- Thaweechot, J.; Raksa, P. Environmental Inventory of Food Shops in Phuket. Bachelor’s Thesis, Prince of Songkla University, Hat Yai, Thailand, 2016. [Google Scholar]
- Huijbregts, M.A.J.; Steinmann, Z.J.N.; Elshout, P.M.F.; Stam, G.; Verones, F.; Vieira, M.; Zijp, M.; Hollander, A.; van Zelm, R. ReCiPe 2016: A Harmonized Life Cycle Impact Assessment Method at Midpoint and Endpoint Level Report I: Characterization; National Institute for Public Health and the Environment: Utrecht, The Netherlands, 2016. [Google Scholar]
- Copper, W.W.; Seiford, M.L.; Tone, K. Data Envelopment Analysis: A Comprehensive Text with Models, Applications, References and DEA-Solver Software, 2nd ed.; Springer: Berlin/Heidelberg, Germany, 2007. [Google Scholar]
- World Bank. Official Exchange Rate (LCU per US$, Period Average)—Thailand. 2023. Available online: https://data.worldbank.org/indicator/PA.NUS.FCRF?locations=TH (accessed on 22 October 2023).
- Chang, H.J.; Huang, K.; Wu, C. Determination of sample size in using central limit theorem for weibull distribution. Int. J. Inf. Manag. Sci. 2006, 17, 153–174. [Google Scholar]
- Ahamed, A.; Yin, K.; Ng, B.J.H.; Ren, F.; Chang, V.W.-C.; Wang, J.-Y. Life cycle assessment of the present and proposed food waste management technologies from environmental and economic impact perspectives. J. Clean. Prod. 2016, 131, 607–614. [Google Scholar] [CrossRef]
- The Phuket News. Phuket Recycling Network Set Up. 2013. Available online: https://www.thephuketnews.com/phuket-recycling-network-set-up-38903.php#vuRYbHkDAzHEsjuF.97 (accessed on 15 September 2019).
Disclaimer/Publisher’s Note: The statements, opinions and data contained in all publications are solely those of the individual author(s) and contributor(s) and not of MDPI and/or the editor(s). MDPI and/or the editor(s) disclaim responsibility for any injury to people or property resulting from any ideas, methods, instructions or products referred to in the content. |
© 2023 by the authors. Licensee MDPI, Basel, Switzerland. This article is an open access article distributed under the terms and conditions of the Creative Commons Attribution (CC BY) license (https://creativecommons.org/licenses/by/4.0/).