1. Introduction
Broccoli (
Brassica oleracea L. var
italica) is one of the most popular and widely cultivated vegetables worldwide. This plant belongs to the Brassicaceae family and originated in the Mediterranean region, specifically in ancient Italy. Some of the major broccoli producers worldwide include China, India, the United States, Spain, and Mexico [
1]. According to the data, broccoli production has significantly increased in Mexico in the last few years. Specifically, the states of Guanajuato, Michoacán, and Baja California are the largest broccoli producers in Mexico. For example, in 2017, a total production of 567,000 tons was reached. Herein, the main contributor was the state of Guanajuato with 320,268 tons of broccoli [
2]. This number represents approximately 65% of the national production. Currently, about 32,000 hectares of land are planted with broccoli. At harvesting, only the flower is used and counted. Thus, approximately 75% of the total weight of the plant is discarded. This means that broccoli waste is generated in numbers of 1.5 million tons per year in this country. At present, in Mexico, remnants from broccoli cultivation persist in the fields, resulting in operational expenses, particularly for sizable enterprises. In contrast, smaller producers often repurpose the residue for livestock feed or reintegrate it into the soil as fertilizer. However, this recycling practice is not adopted by large-scale producers, who must allocate significant financial resources to eliminate the remnants from the soil.
Broccoli plants are divided into four main parts: a pivoting root, dark green leaves, and a greenish stem where, at the end of it, a globular mass called flower buds (flower) develops. In this vegetable, only the flowers are marketed; the rest is usually disposed of in landfills. It has been reported that broccoli stems and leaves contain high amounts of (a) bioactive compounds (BAC) such as carotenoids, sulforaphane, glucosinolates, and polyphenols; (b) the vitamins A, B6, B12, C, D, E, K, thiamine, riboflavin, niacin, folate, and small amounts of pantothenic acid, and (c) other nutrients including choline, betaine, minerals, amino acids, and trace elements [
1,
3]. These molecules and elements are of interest to the food and pharmaceutical industry [
1,
3]. Compared to other plant parts, broccoli leaves contain higher levels of carotenoids, chlorophylls, vitamins E and K, calcium and manganese, polyphenols, and other antioxidants [
4]. Several of these molecules can be derived from agricultural waste and can be categorized as chemical building blocks (CBBs). The National Renewable Energy Laboratory has recognized twelve specific compounds as particularly significant. These compounds include succinic acid, lactic acid, itaconic acid, 3-hydroxypropionic acid, isoprene, farnesene, glycerol, sorbitol, xylitol, levulinic acid, glucaric acid, hydroxymethyl furfural, and furfural [
5,
6].
Some of these biomolecules are found naturally as part of cell structures. By harnessing these waste materials to extract valuable BACs, the residues could transform into a reservoir of organic chemical precursors, applicable in the food and pharmaceutical sectors. BACs are extracted from plant tissues using different techniques including maceration, ultrasound-assisted extraction, supercritical fluids, and subcritical fluids, among others [
7,
8,
9,
10]. Traditionally, maceration has been a widely practiced and cost-effective method. In addition, this approach has been used in the extraction of essential oils and bioactive components from various plant materials [
11]. Extraction using static maceration is the most inefficient technique for BAC recovery as it is performed in a tank at room temperature. In this case, extraction occurs as a result of molecular diffusion. For this reason, the mixture is maintained in the tank for several days, resulting in low reproducibility rates [
12,
13].
Maceration can be carried out through a process called dynamic maceration (DM), which involves the application of mechanical homogenization and temperature. In this case, a forced convection phenomenon allows a more efficient extraction in less time than static maceration. It has been reported that temperature and time are the most important parameters in the extraction process. In addition, the utilization of solvent mixtures such as ethanol–water increases the efficiency and reproducibility of biomolecule extraction [
13]. Different authors have reported on the maceration process, proposing various solvents and concentrations. Nonetheless, the maceration process is often described as uncontrolled, with evaluations conducted at different exposure times to the solvent, primarily at room temperature. These processes involve ethanol:water or methanol:water mixtures with ratios ranging from 5%
v/
v to 80%
v/
v, along with exposure times ranging from 15 h to one week [
14,
15,
16]. As far as we know, the dynamic maceration process has not been explored in a wide range of times, temperatures, and solvent concentrations (ethanol in our case) on broccoli leaves. With this in mind, and once the optimal point has been identified, DM can be mathematically modeled to determine different kinetic parameters, which play a key role in the scale-up of BAC and CBB extraction [
17].
Furthermore, to meet the goals outlined in the United Nations 2030 Sustainable Development Agenda, it is crucial to assess and measure the environmental consequences of these processes [
18]. Life cycle assessment (LCA) is a tool used to evaluate the environmental impacts of different processes. Moreover, it provides information useful to design new options, which are expected to reduce the negative impacts of those processes on the environment [
19]. In this context, researchers have used life cycle analysis (LCA) as a tool to determine the environmental impact when large quantities of products are generated. During LCA, every input and emission generated in each stage of the process is considered. For this reason, LCA facilitates decision-making, as the information is used to find alternatives with reduced environmental impact [
20].
The objective of the present research was to systematically evaluate the dynamic maceration process on broccoli leaves to obtain the maximal extraction point of total polyphenol content with minimal environmental impact. As far as we know, there has not been a published study evaluating dynamic maceration on broccoli leaves and offering appropriate parameters for comparing this technology with unconventional methods. The effect of solvent concentration, temperature, and time were evaluated. A confirmation experiment was performed using the optimal parameters and the specific extraction velocity was identified. At this point, BACs and CBBs were identified with gas chromatography–electron impact mass spectrometry. We also evaluated the direct energy consumption (kW-h) of the process to perform a life cycle analysis (LCA) to determine different environmental impact indicators including freshwater eutrophication, global warming, land use, and water consumption for 10 g of product (dry broccoli extract). With this information, we will be able to scale up the extraction process. Our results will help in identifying the variables that favor the extraction process of bioactive molecules and chemical building blocks reducing energy consumption and environmental impacts using DM.
2. Materials and Methods
2.1. Chemicals
In the present research, Folin–Ciocalteu’s phenol (2N) (analytical grade, Sigma-Aldrich, St Louis, MO, USA), sodium carbonate anhydrous—Na2CO3 (99.5%) (analytical grade, Meyer, Guangzhou, China), gallic acid (97.5–102.5%) (analytical grade, Sigma-Aldrich, St Louis, MO, USA), and ethanol (96%) (Alcoholera del Centro S.A. de C.V.”, Irapuato, Guanajuato, Mexico), were used as reagents.
2.2. Plant Material
Broccoli agro-waste (leaves and stems) was obtained immediately after harvesting from regional farms located in Dolores Hidalgo, Guanajuato, México in March 2022. Separate stems and leaves were dried at 50 °C for 24 h (Chincan, DHG-9145A, Hangzhou, China), ground, and stored at room temperature until later use. In this research, only broccoli leaves were processed. The particle size of milled leaves was 0.5 to 1 mm. The following parameters for broccoli leaves were also calculated: total solids (TSs); volatile solids (VSs); total carbohydrates (TCHs); moisture content (H). These parameters were analyzed according to standard methods [
21].
2.3. Extraction Process (Dynamic Maceration, DM)
For molecule extraction, ethanol–water solutions were prepared at different ratios according to the experimental design selected for our investigation (See
Table 1). A total of 50 mg of broccoli samples was placed in a conical tube (Eppendorf, conical tube, 15 mL, Hamburg, Germany) containing 3 mL of the ethanol–water solution according to our experimental design (
Table 1). Samples were stirred using a carousel (Labnet, LabRoller II, Woodbridge, NJ, USA). The parameters evaluated were temperature, time, and ethanol:water ratio. A temperature of 4 °C was maintained by placing the rack inside a temperature-controlled refrigerator (Mabe, RMA300FYMRE0, Mexico City, Mexico). In addition, temperatures of 37 °C and 70 °C were achieved by the aid of a forced convection oven (Chincan, DHG-9145A, Hangzhou, China). An experimental design based on a central composite design was developed to evaluate the maximal extraction point (
Table 1).
2.4. Experimental Design (Central Composite Design)
A central composite design (CCD) was chosen to evaluate the effect of temperature (
X1), ethanol:water ratio (
X2), and residence time (
X3) on BAC extraction. These parameters were selected according to information found in the literature.
Table 1 shows the combinations of independent variables and their corresponding coded values. As this table indicates, temperature levels of 4, 37, and 70 °C were evaluated. In addition, ethanol:water ratios of 30:70, 50:50, and 70:30 (%
v/
v) were considered. In the case of time, selected values included 15, 37.5, and 60 min. Experimental data were fitted to the quadratic model displayed in Equation (1):
Minitab 16 was used for statistical analysis. Surface plots were developed with Sigma plot 13.0. Herein, a p-value < 0.05 was selected. According to DoE, experiments were run in triplicate. Likewise, samples were analyzed in triplicate.
The parameters were selected in accordance to those published previously by several authors. The ethanol–water ratio was selected in order to evaluate the range between 5 and 80 ethanol %(
v/
v) which has been published by other authors obtaining several yield values for total polyphenol content in uncontrolled conditions. The time parameter was chosen strategically to generate a value that could be compared with the outcomes of unconventional techniques, typically limited to one hour of operation. This aligns with findings in publications. Temperature selection was based on a comparison with the temperature ranges investigated in publications covering a spectrum from 4 °C to 80 °C [
14,
15,
16].
2.5. Total Polyphenol Content
We followed the procedure reported by [
8]. Gallic acid was used as standard, and the results are expressed as mg of gallic acid equivalents per 100 g of dried biomass (mg GAEs/100 g of db). Briefly, three milliliters of distilled water was placed in a tube test following 40 µL of standard samples. Two hundred microliters of Folin–Ciocalteu (FC) reagent (2 N) was added, and samples were maintained for 10 min before a 15 min incubation followed. Samples were read in a multiplate reader at 760 nm (Thermo Scientific™ Multiskan™ GO Microplate Spectrophotometer, Waltham, MA, USA). The calibration curve and its correlation value can be found in
Figure A1 (See
Appendix A).
2.5.1. Gas Chromatography with Electron Impact Mass Spectrometry (GC-EIMS) Analysis for BAC and CBB Detection
A gas chromatography (GC) system (Perkin Elmer 580) coupled to an electron impact ionization mass spectrometer (EIMS) (Perkin Elmer 560S) was used to analyze the bioactive compounds present in two extraction samples. The data were processed using TurboMass software v. 5.4.2.1617 (Perkin Elmer, Inc., Waltham, MA, USA). Retention time and mass spectra components were determined with AMDIS (
http://www.amdis.net/) software. In addition, compound identification was performed with the aid of the mass spectra library software and the database NIST MS Search version 2.0 (National Institute of Standards and Technology, Gaithersburg, MD, USA). For analysis, samples of 0.5 µL were injected into an Agilent J&W DB-1MSUI capillary column (60 m × 250 µm × 0.25 µm; Santa Clara, CA, USA)) using the pulsed splitless injection mode at an injector temperature of 280 °C. Helium was used as the carrier gas at a constant flow rate of 1 mL/min. The GC oven program began at an initial temperature of 45 °C and held for 5 min. Then, the temperature increased at a rate of 6 °C min
−1 to 170 °C, held for 1 min. A second temperature ramp of 10 °C min
−1 to 305 °C was applied and held for 10 min. The transfer line temperature was set at 230 °C. Mass spectra were obtained at 70 eV. Measurements were performed in SCAN mode with the m/z range set to 40–550. The ion source and quadrupole temperature were 190 °C and operated at 2.9 scans per second. The results are presented as relative abundance.
2.5.2. Sample Derivatization
Extracts obtained at the optimal conditions were subjected to derivatization and further analyzed with GC-EIMS to determine the biomolecules presented. Briefly, solvent was eliminated from the samples. Later, 80 µL of BSTFA + 1% TMCS (Sigma-Aldrich, Inc.) and 20 µL of pyridine (Sigma-Aldrich, Inc.) were added to the reaction mixtures. Samples were placed on a MultiTherm Incubator (Benchmark Scientific, Inc., Sayreville, NJ, USA) and allowed to react for 25 min at 85 °C. Subsequently, mixtures cooled down to room temperature before 100 µL of isooctane (Sigma-Aldrich, Inc.) was added. Each derivatized sample was transferred to a vial and stored at room temperature until GC-EIMS analysis was performed (no more than 3 h).
2.6. Confirmation Experiment (Optimal Conditions) for Dynamic Maceration
The confirmation experiment aimed to validate whether the optimal parameters achieved in the dynamic maceration conducted in the carousel could be replicated on a larger scale. This trial will furnish the study with information for mathematical modeling, facilitating its future upscaling.
Experiments on a 300 mL scale were performed in a 500 mL flask (Proculture Spinner Flasks, 500 mL, Corning®, Tewksbury, MA, USA) placed on a hot plate equipped with a temperature controller (Stirring Hot Plate, Corning®, Model PC-420D, Tewksbury, MA, USA). In this part of the research, the optimal conditions determined in the batch section were used. Herein, ethanol:water mixture was first placed in the flask until the optimal temperature was reached (49 °C). Subsequently, 5 g of dried and ground broccoli leaves was added. Experiments were performed in triplicate and samples were taken every 30 s for 15 min. Each sample was analyzed thrice.
2.7. Kinetics of the Optimal Solid–Liquid Extraction Experiment
Extraction efficiency depends on the type of solvent, temperature, extract concentration, and surface area of the solid subjected to extraction, among others. According to Fick’s Law, a high extraction rate is expected at the beginning of the process because of the significant difference in the concentrations of solute in the mixture and the solvent. As extraction proceeds, the concentration gradient decreases. This leads to a gradual reduction in the extraction rate until equilibrium is reached [
17].
In the confirmation experiment (solid–liquid extraction), first-order and second-order kinetic models were used to determine the kinetic parameters of the extraction process. The methodology was previously reported by [
17] who stated that the first-order kinetic model considered the rate of leaching
as proportional to a driving force
[
17] (See Equation (2)):
where
Ct (mg GAEs/100 g db) refers to the extraction capacity (concentration of BACs) at a given extraction time t; C
S (mg GAEs/100 g db) is the concentration of BACs at the saturation point; and
k is the first-order extraction rate coefficient (min
−1). Equation (2) was integrated considering the boundary conditions
Ct = 0 at
t = 0 and
Ct =
Ct at
t =
t. The first-order extraction rate constant was determined as the slope of ln values against
t (Equation (3)):
The second-order extraction rate constant was obtained using Equation (4) [
17]:
Integration of Equation (4) was carried out according to [
17]. In this case, boundary conditions were
Ct = 0 at
t = 0 and
Ct =
Ct at
t =
t. The integration of Equation (4) resulted in Equations (5) and (6):
Afterwards, Equation (6) was rearranged to provide the linearized forms Equations (7) and (8):
where m (C
s2 k) represents the initial extraction rate coefficient. To obtain the second-order extraction rate coefficient, Equation (8) was plotted, and the rate coefficient was calculated as the intercept of
t/
Ct vs.
t. A detailed description of the methodology is found in [
17].
2.8. Energy Consumption
Energy consumption was calculated as described by López-Sandin et al. [
22]. The energy consumption data were extracted from the equipment used during the process, facilities, supplies, and labor in each state of the batch experiment (drying, milling, extraction process). The energy consumption (
Econs) was determined using Equation (9) and is expressed as MJ:
where
ECD corresponds to the energy used to dry the BLs (MJ);
ECM is the energy consumed during milling (MJ);
ECEP is the energy spent in the extraction process (MJ);
ECF is the energy used for filtration;
ECSS is the energy consumed during solvent separation;
ECSD is the energy spent in spry drying;
EER indicates the energy consumed as electricity (MJ);
EHL is the energy consumed by human work (MJ);
ECR is the energy used in chemical reagents (MJ); and
EEO corresponds to the energy spent by other inputs such as water (MJ). It is important to note that
ECR and
EEO were not quantifiable.
The quantification of energy consumption considers the direct intake of consumption in kW/h per equipment. In the present research, two electric meters (STEREN® CAJ-HER-432, DF, Shanghai, China) and an uninterruptable power supply (UPS) (Smartbitt SBAVR1200S 1200VA in, 120 V out, Miramar, FL, USA) were used to quantify energy consumption. The first electric meter was placed in the electrical installation, then an UPS was connected to the first electric meter. A second electric meter was connected to UPS and finally, the equipment to be measured was connected. Measurements were performed for periods of 15, 30, and 60 min, according to the experimental conditions.
2.9. Life Cycle Assessment
The process’s life cycle assessment (LCA) was performed using Open LCA software v. 11. In addition, the ReCiPe method was selected to conduct the life cycle impact assessment (LCIA). The inputs included raw materials (broccoli leaves), electricity, water, and ethanol. The specific electricity consumption of each equipment was determined based on the information previously described in
Section 2.8.
Since the environmental impacts of allocation in similar extractions were relatively low compared to other inputs (i.e., chemicals and electricity), no allocation was considered in the present research [
19]. In this analysis, the functional unit (FU) was set as 10 g of dry broccoli leaf extract. It is important to note that the FU remained constant throughout the seventeen experiments.
The aim of the optimization step was to maximize BAC extraction considering the defined functional unit. Experimental conditions to calculate the yield and estimate the environmental impacts for each run were determined based on the prediction model. Furthermore, particular attention was given to environmental indicators relative to planetary boundaries framework that considered global warming, freshwater, land use, nitrogen, and phosphorous.
3. Results and Discussion
3.1. Broccoli Leave Characterization
The Average of the percentages of TSs, VSs, FSs, and H determined for broccoli leaves were determined, obtaining % of TSs = 89.5856 ± 0.8842, % of VSs = 67.4611 ± 0.5389, % fixed solids = 22.1244 ± 0.4087, and % of moisture = 8.9818 ± 0.0993.
3.2. Optimization of Extraction Process Using the CCD
A 3-factor, 3-level central composite experimental design (CCD) with a 95% confidence level was used to optimize the extraction of BACs from broccoli leaves.
Table 2 shows the data for BAC concentration and energy consumption observed during the experiments. According to
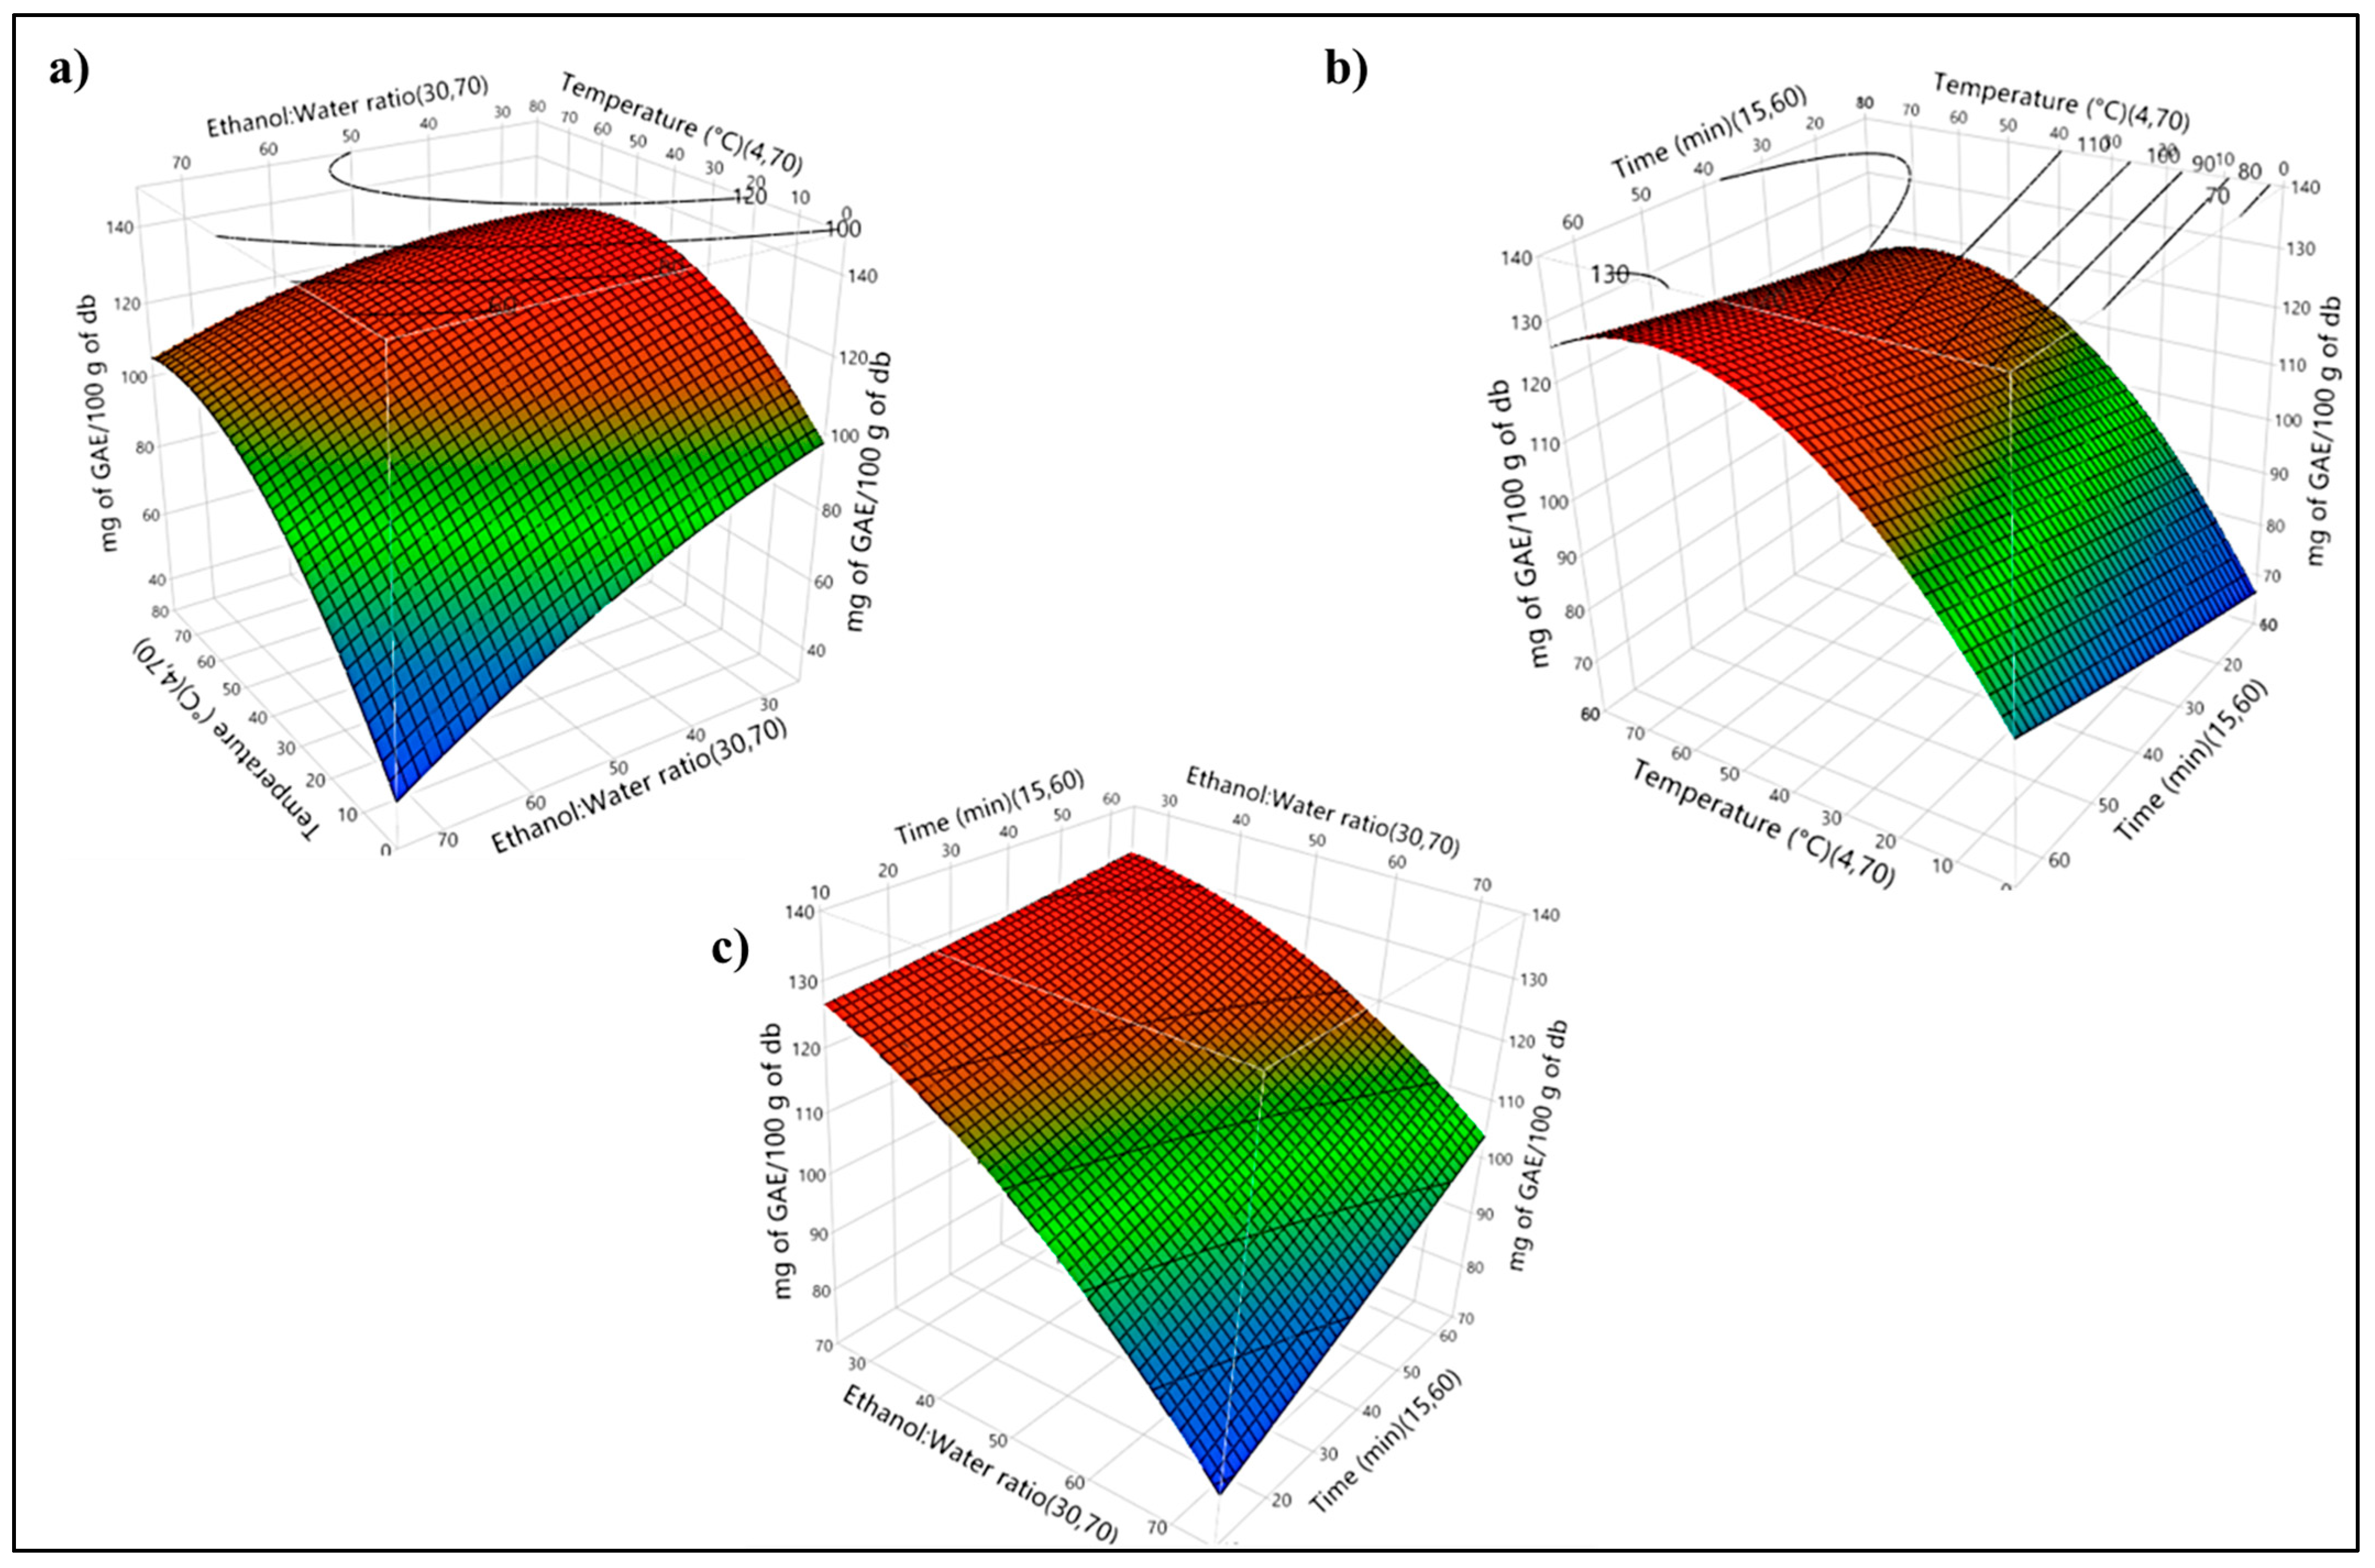
Figure 1a–c, the optimal BAC value was obtained at a temperature of 49 °C, an ethanol:water (
v/
v %) ratio of 30:70, and 36.96 min with a predicted BAC concentration of 133.20 mg of GAEs/100 g db. Later, another experiment was carried out using the optimal parameters to test the model.
Figure 1a depicts the combined effect of temperature and ethanol:water ratio on BAC recovery. According to the results, BAC recovery increased from 45.98 ± 6.90 to 130.75 ± 3.82 mg of GAEs/100 g db when the temperature rose from 4 to 50 °C. Moreover, when the temperature went from 50 to 70 °C, BAC extraction decreased from 130.75 ± 3.82 to 121.34 ± 4.6 mg of GAEs/100 g db. In addition, BAC recovery increased when the organic phase ratio decreased from 70:30 to 30:70 (ethanol:water). According to the results, BAC recovery increased from 102.33 ± 2.32 to 130.75 ± 3.82 mg of GAEs/100 g db when the ethanol:water ratio rose from 70:30 to 30:70 (ethanol:water).
Figure 1b depicts the combined effect of temperature and time on BAC recovery. According to the results, when the temperature was maintained at 4 °C, BAC recovery increased from 45.98 ± 6.9 mg of GAEs/100 g db to 89.42 ± 8.5 mg of GAEs/100 g db as time increased from 15 to 60 min.
In this case, BAC recovery increased when the organic phase ratio decreased from 70:30 to 30:70 (ethanol:water). Our results were similar to those reported by [
23] who extracted BACs from steam-processed broccoli using methanol concentrations of 0, 10, 50, 80, and 100% (
v/
v) in water. These researchers determined that as the methanol concentration increased from 0 to 50% (
v/
v), BAC extraction increased [
23]. Conversely, a reduction in BAC extraction occurred as the methanol concentration increased from 50 to 100% (
v/
v). Moreover, Withouck et al. (2023) reported a similar behavior when BACs were recovered from applewood using ultrasound and ethanol [
24]. These investigators found that the optimal ethanol:water ratio for BAC extraction was 30:70 (%
v/
v). Also, ref. [
14] indicated that the highest concentration of phenolic compounds extracted from young broccoli leaves was 130 mg/100 g DB when methanol:water was used at a ratio of 5:95 (%
v/
v). This result and those obtained in the present investigation are alike. In addition, [
25], determined the optimal extraction point of TPC of carob pods using microwave-assisted extraction by finding a point with a concentration of 35% ethanol (
v/
v), a temperature of 80 °C, and 29.5 min [
25]. It can be observed that the ethanol concentration achieved in their study (35% ethanol, (
v/
v)) closely resembled the one obtained in this current research (30% ethanol, (
v/
v)).
Several authors have reported diverse findings in the context of static maceration. These findings reveal a lack of control over both the duration of biomass exposure to the solvent and the fact that the process typically occurs at room temperature. Data show a significant variability in time and amount of biomass used in the extraction as time of exposition varied between 15 h and one week, while the alcohol:water ratios went from 5% to 80% (
v/
v). As other authors present, BACs were recovered in concentrations between 171 and 647 mg GAEs/100 g db after 15 h to 1 week [
4,
10,
15,
16].
A regression analysis was performed using the statistical software using the data in
Table 2. The resulting second-order polynomial equation (Equation (10)) was used to determine BAC (mg of GAEs/100 g db) concentrations as follows:
According to the ANOVA analysis (
p < 0.0001), a significant effect of ethanol:water concentration, temperature, time, the interaction between temperature and ethanol:water concentration, and the quadratic term of temperature (T
2) were observed. The determination coefficient (R
2) showed a value of 93.48 and the adjusted R
2 presented a value of 92.30. The root mean square error was 5.99. Models with adjusted R
2 values greater than 70% are considered to have a good prediction quality [
26]. The graphical results are shown in
Appendix B.
3.2.1. Confirmation Experiment: Result (Optimal Conditions)
Figure 2 depicts the kinetics of BAC extraction for a period of 15 min. The experiment was carried out using the parameters that maximized BAC extraction, which according to the RSM were 50 °C, and 30:70 (ethanol:water ratio). Samples were taken every 30 s for 15 min. The highest concentration was 112.95 ± 0.92 mg of GAEs/100 g db. The statistical prediction model provided a value of 111.8685 mg of GAEs/100 g db. This represents a maximal error of 1.75%. This value was achieved employing the upper limit of the standard deviation obtained (113.87 mg of GAEs/100 g db).
The trajectory of the curve presented in
Figure 2 describes the behavior of Fick’s law. The process presents an increase in BAC concentration during the first 4 min of extraction. Between 4 and 15 min the process slowed down. This occurred because of saturation according to Fick’s Law [
17]. Similarly, [
17], demonstrate the extraction of bioactive compounds, exhibiting similar behavior when employing dynamic maceration with various substrates and varying concentrations of solvents [
17].
The duration of exposure significantly influences the dynamic maceration process. As indicated by the results, prolonged exposure leads to an increase in extraction. However, a saturation point is observed during the process, wherein an extended exposure period results in a decrease in the concentration of total phenolic content (TPC), as depicted in
Figure 2. This phenomenon aligns with findings from other authors who studied the TPC extraction process in different biomasses [
17]. By employing this approach, it becomes feasible to ascertain the optimal point for concluding the process, thereby minimizing operational time and directly influencing the associated operational costs.
3.2.2. First- and Second-Order Kinetic Model of Confirmation: Result
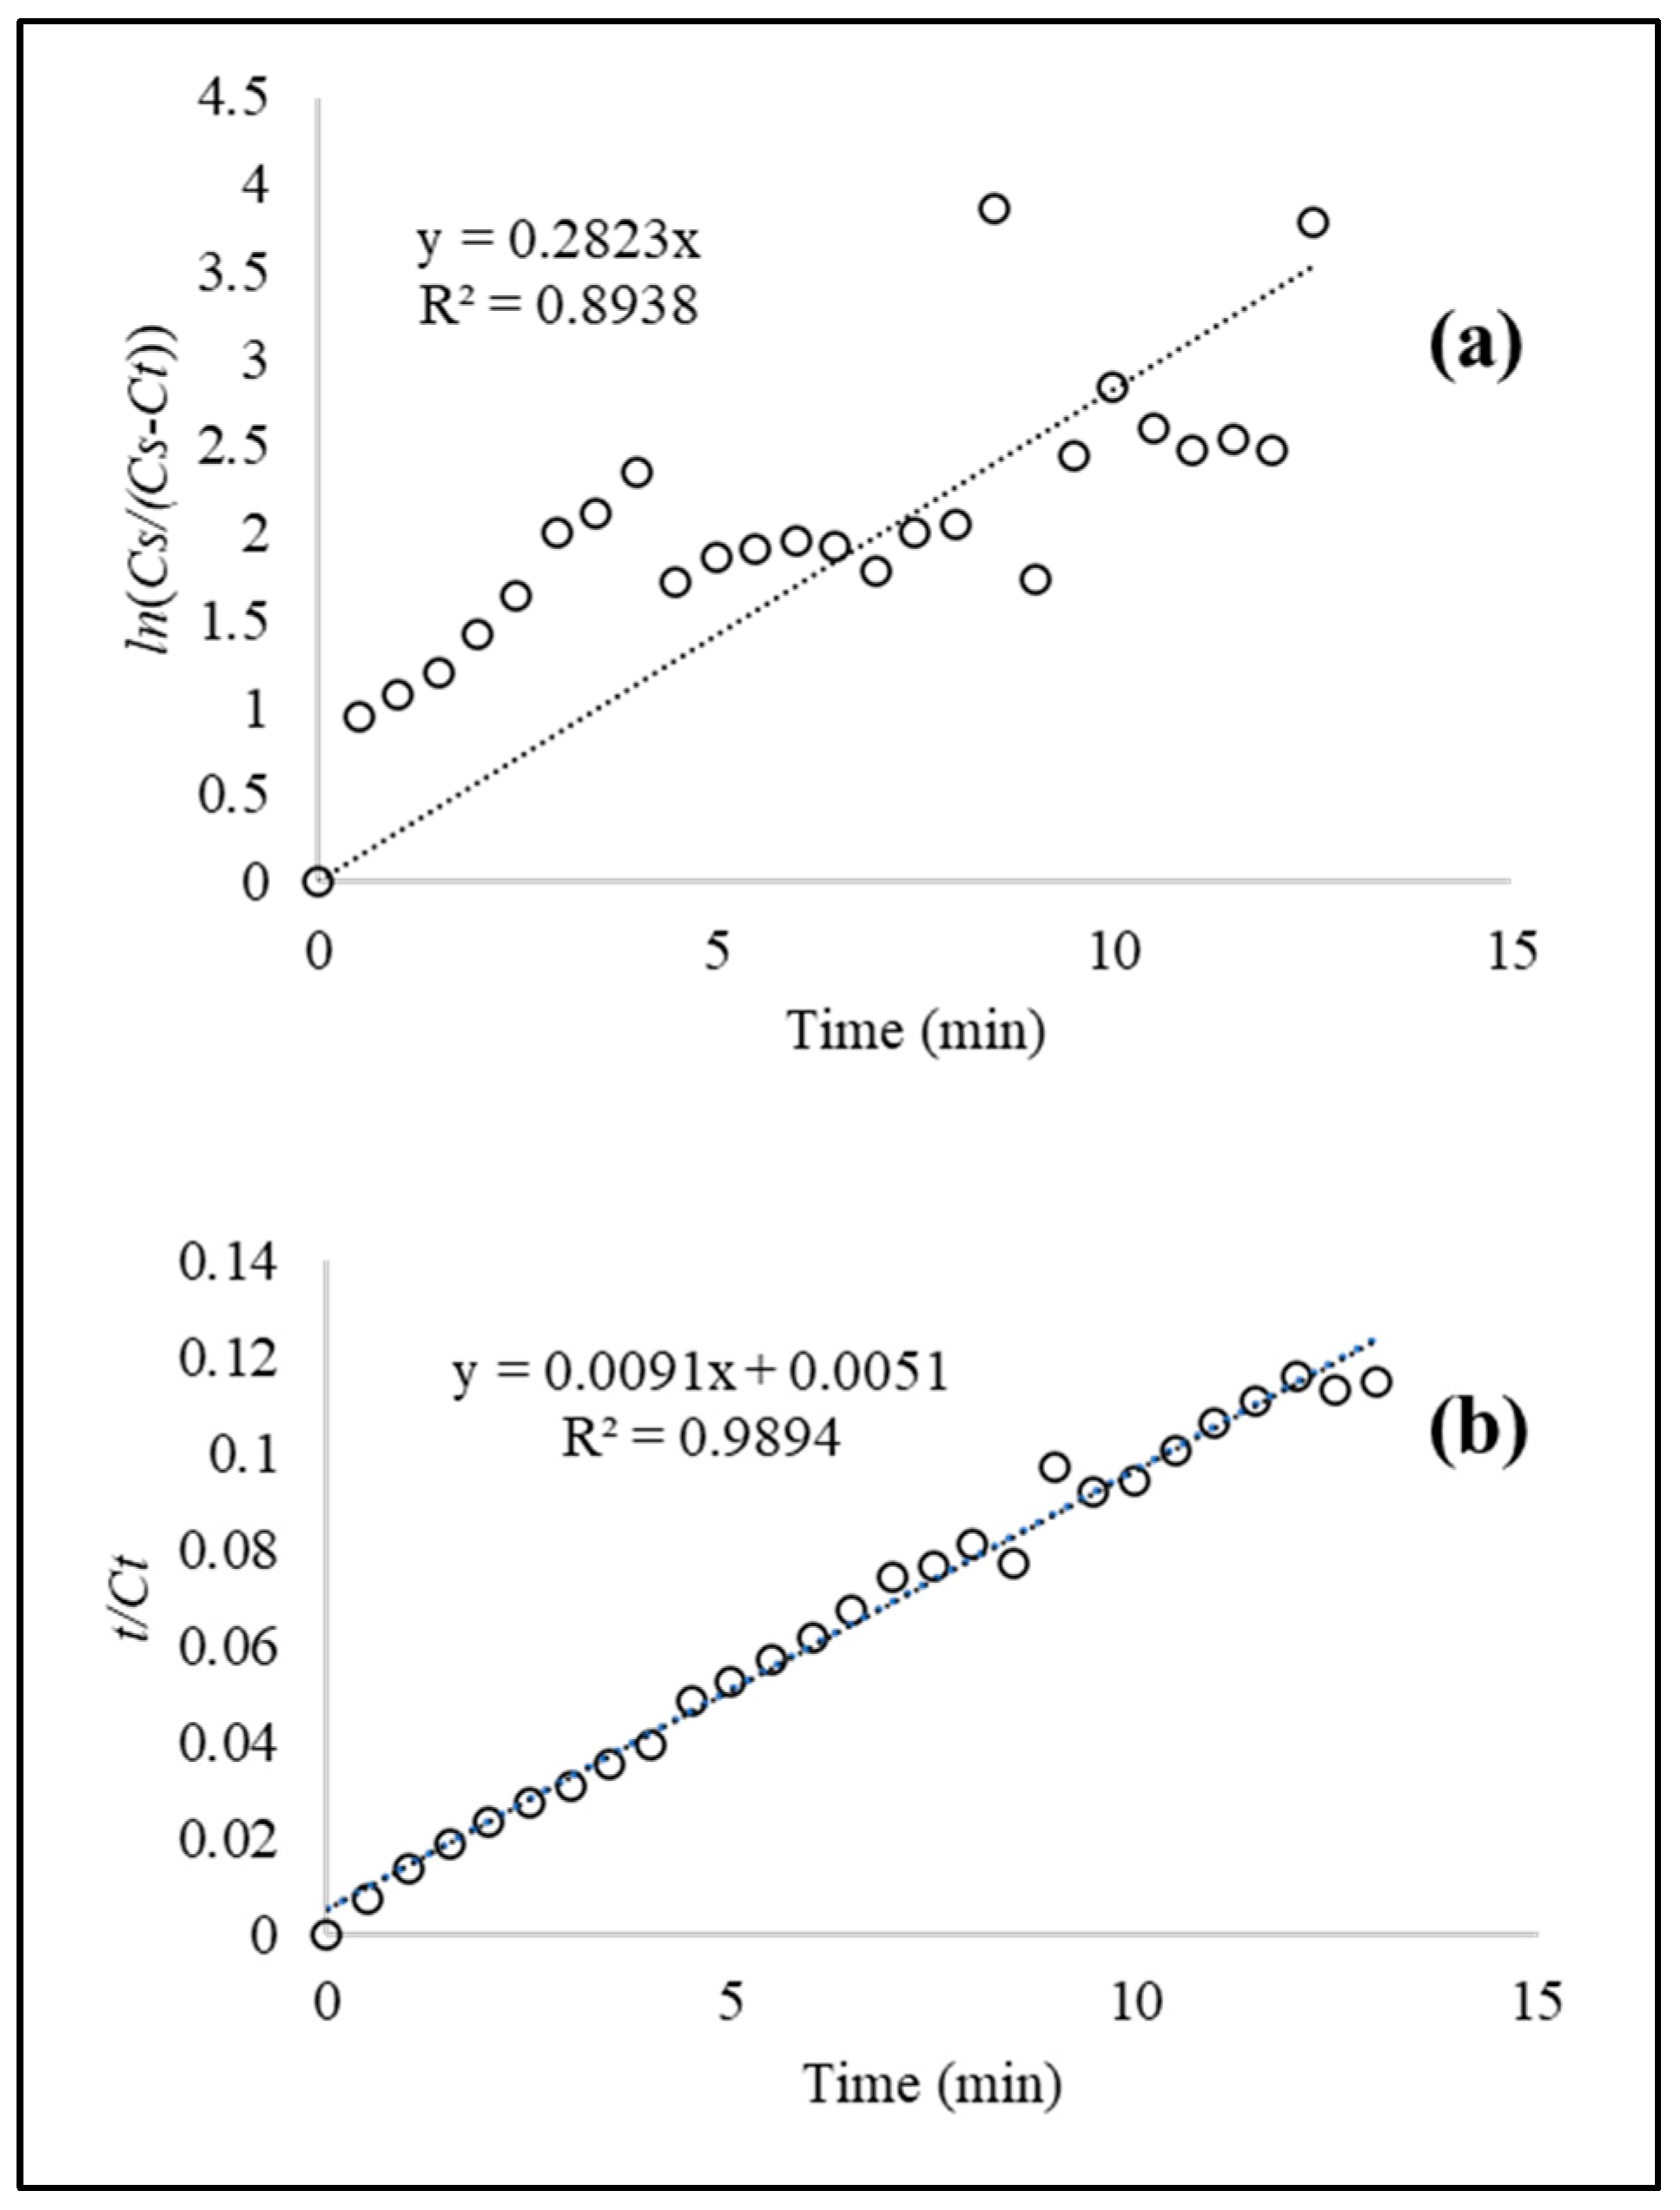
In order to determine the kinetic parameters, the data obtained during the solid–liquid extraction process were adjusted to first- and second-order models. In the first-order model, the values of ln (
Cs/((
Cs −
Ct))) versus
t were plotted to obtain the rate constant (
k) and the coefficient of determination (R
2) with values of
Ct = 112.952 ± 0.921 (mg GAEs/100 g db) and
t = 13 min; Equation (3) (see
Figure 3a). A
k value of 0.2823 min
−1 was achieved at a temperature of 50 °C, 30:70 ethanol:water ratio, and
t = 15 min. A relatively low R
2 value of 0.8938 indicated that the first-order model partially describes the behavior of the extraction process.
The second-order model was used to fit the experimental data of the BAC extraction from BLs using the optimal parameters calculated in the batch experiments. The rate constant (k) and the coefficient of determination (R
2) were obtained by plotting
t/
Ct versus
t with values of
Ct = 112.952 ± 0.921 (mg GAEs/100 g db) and
t = 13 min (See
Figure 4). In this case, the second-order model provided a better fit as compared to the first-order model. Herein, a
k value of 0.0154 mg/g min was obtained at a temperature of 50 °C, 30:70 ethanol:water ratio, and
t = 15 min. In addition, a high coefficient of determination (R
2 = 0.9894) indicated that the second-order model can be used to study the BAC extraction process in broccoli leaves under the evaluated conditions.
3.2.3. Identification of Secondary Metabolites using GC-EIMS Results after Confirmation Experiment
In order to identify the secondary metabolites present in the extracts recovered at the optimal conditions, ethanol extract (ethanol–water ratio of 30:70) of dry
Brassica oleracea leaves (16 mg.mL
−1) were analyzed using GC-EIMS.
Table 3 presents the results of the GC-EIMS analysis performed on BL extracts using an ethanol–water ratio of 30:70. Data showed methylmalonic acid, l-leucine, l-isoleucine, and glyceric acid. It is well known that the content and metabolic profile of extracts depend on different aspects including the phenological stage of the plant, environmental factors (e.g., soil features, soil water, temperature, and light), developmental factors, and extraction methods [
27,
28,
29,
30]. Under the experimental conditions used in this investigation, the amino acids l-leucine, l-isoleucine, and l-threonine were identified (
Table 3). Ref. [
31] reported the presence of these amino acids in inflorescences (florets) and stems from
B. oleracea L. var.
italica extracted with ethanol:water (75:25). It has also been reported that 80:20 ethanol:water recovered l-leucine, l-isoleucine, and l-threonine from broccoli florets [
32,
33].
The significance of the identified compounds l-isoleucine and I-leucine is that they are both essential amino acids, which means that the human body cannot produce them naturally, and they must be obtained through the diet [
34]. These amino acids play crucial roles in various physiological processes, making them important for overall health. Both l-isoleucine and l-leucine are essential components in the synthesis of proteins, which are fundamental for the structure and function of cells, tissues, and organs in the body. L-leucine, in particular, is well known for its role in promoting muscle protein synthesis. It is often considered the most critical amino acid for muscle growth and repair [
35]. Amino acids, including l-isoleucine and L-leucine, are essential for maintaining a healthy immune system. They contribute to the production of antibodies and support immune cell function [
21]. In the context of extraction of bioactive compounds (BACs) and chemical building blocks (CBBs), understanding the presence and significance of l-isoleucine and L-leucine in the raw material or source can be crucial. These amino acids may influence the overall composition and quality of the extracted compounds, impacting the potential applications of the extracted substances in various industries, such as pharmaceuticals, food, or biotechnology.
Apart from amino acids, the organic acids methylmalonic acid, malonic acid, phenylacetic acid, succinic acid, glyceric acid, and L-threonic acid (
Table 3) were recovered from the BLs used in our experiments. Ref. [
33] reported similar results, as they mainly extracted malic acid from broccoli florets. Ref. [
10] reported the presence of the phenolic acids caffeic, chlorogenic, feluric, beochlorogenic, p-coumaric, and sinapic acid in BL extracts [
10]. This part of the plant is a source of valuable nutritional compounds (glucosinolates, phenolic, and lipophilic compounds). For this reason, BLs may be used to improve food quality [
36]. In the past, valorization of broccoli leaves as a source of compounds for medical applications has been proposed [
15]. Also, ref. [
32], reported the recovery of l-leucine and l-isoleucine from broccoli leaves using methanolic extraction.
Five of the identified metabolites have been classified as chemical building blocks or chemical precursors to produce other important molecules. Chemical building blocks are of great economic importance as they are used to create a wide range of products [
37].
Table 3 shows that BL extracts contain malonic acid, succinic acid, glyceric acid, fumaric acid, and malic acid. These compounds are on the top list of the thirty most important substances for industry [
37]. The chromatographic results demonstrated that BL extracts contained 67.4% (relative abundance) malic acid at the optimal point. Malic acid is important in the food industry as a flavoring agent and is found naturally in broccoli [
38]. Also, in the pharmaceutical industry, this organic acid is used to produce different drugs and personal care products. It also serves as an intermediate in the synthesis of polymers, resins, and solvents [
38].
Furthermore, we observed the presence of succinic acid and glyceric acid, which are very valuable for different industry sectors [
39]. Succinic acid and glyceric acid are found naturally in broccoli [
40,
41]. A succinic acid concentration of 7.57% (relative abundance), and a glyceric acid percentage of 2.53% were recovered at the optimal point. Succinic acid can be applied as a flavoring agent, acidulant, and pH regulator in food and beverage products. It also serves to produce different pharmaceutical drugs including sedatives, anticonvulsants, and cancer treatments, among others. This acid is also used for the manufacture of cosmetics and personal care commodities such as hair care and skin care products. Succinic acid is also used as a chemical intermediate in the production of polymers, resins, and solvents [
39]. Glyceric acid is used in the production of certain types of polymers including polyesters and polycarbonates, and as an intermediate compound in the synthesis of pharmaceuticals and agrochemicals [
42].
3.3. Energy Consumption (kW-h) Quantification
Figure 4 shows the response surface analysis of the combined effects of temperature and time on total energy consumption. The results indicated a positive trend in energy consumption as the temperature increased from 37 °C to 70 °C. Similarly, the energy consumption increased as the temperature decreased from 37 to 4 °C. A potential explanation indicates that, in order to achieve the thermal conditions required for BAC extraction, work has to be added. A regression analysis was applied to the data in
Table 2 and the resulting second-order polynomial equation describing energy consumption (kW-h) is shown in Equation (11):
According to the R2 value, the kW-h model explains 95.73% of the variability. Also, the adjusted R2 statistic indicated that the kW-h model explained 94.97% of the variability. The root mean square error was 0.021. According to the ANOVA analysis (p < 0.0001), a significant effect of temperature, time, the interaction between temperature and time, and the quadratic term of temperature (T2) were observed. The greatest effect regarding energy consumption is associated with exposure time and temperature.
According to the results, if the temperature rises above 37 °C, it produces an increase in CO2 generation. This is associated with energy consumption, which is also linked to the burning of fossil fuels, thereby resulting in CO2 emissions. On the other hand, when the temperature drops below 37 °C, energy consumption also increases due to the use of cooling systems. These cooling systems require energy to remove heat.
Regarding the temperature associated with lower energy consumption (37 °C), during the experiments, the average temperature in the city of León, Guanajuato, Mexico, was 37 °C (March to June 2023). This temperature serves as a reference point for heating or cooling, so attempting to exceed it or reduce it leads to an increase in energy consumption. In summary, the temperature of 37 °C acts as a balance point, and any deviation from this temperature results in an increase in energy consumption, whether trying to raise or lower the temperature.
3.4. Life Cycle Assessment
The life cycle analysis was conducted based on the energy consumption data acquired in
Section 3.3.
Figure 5 present the results of LCA for water consumption (WC), global warming (GW), and land use (LU) for a functional unit of 10 g of broccoli leaf extract.
Figure 5a displays the response surfaces of the effect of temperature and ethanol concentration on water consumption. According to the data shown in
Figure 5a, the increase in temperature from 37 to 70 °C elevated water consumption (upper temperature range, UR). The same trend was also observed when the temperature increased from 4 to 37 °C (lower temperature range, LR). It is likely that, when the UR temperature limit was reached, a smaller BAC concentration was extracted compared to that of the optimal point. A similar effect was observed when the lower limit of the LR was reached. At this point, a smaller BAC concentration was obtained as compared to that at the optimal temperature of 50 °C. A higher level of water consumption was observed at UR compared to LR.
The response surface in
Figure 5b displays the effect of time and temperature on greenhouse gas emissions (CO
2 eq). The data indicated that the increase in temperature in the UR promoted the generation of CO
2 eq. In addition, a decrease in temperature in the LR affected CO
2 eq production. This is related to the energy required for the experiments performed at temperatures below environmental temperature. In addition, the increase in exposure time promoted CO
2 generation. In addition, the exposure time generates effects on CO
2 emissions. Above or below ambient temperature, CO
2 is emitted, so with longer exposure times, the generation of CO
2 increases.
Figure 5c depicts the effect of temperature and ethanol concentration on the extent of land required to grow the crop of interest. As
Figure 5c shows, when the ethanol concentration increases, greater amounts of BLs will be needed. Therefore, more land extension will be required.
4. Conclusions
In the present research, the extraction of BACs and CBBs from BLs using dynamic maceration was characterized. Moreover, the effects of temperature, time, and solvent concentration on BAC extractions were evaluated. The data indicated that ethanol:water concentration, temperature, time, the interaction between temperature and ethanol:water concentration, and the quadratic term of temperature (T2) were the most influential factors affecting BAC and CBB extraction. It was also observed that BAC and CBB extraction was more efficient when water was present in higher ratios compared to ethanol (ethanol:water 30:70 %v/v). At this point, the chromatographic analysis detected BACs such as l-isoleucine and l-leucine and CBBs such as malonic acid and succinic acid which are very valuable for different industry sectors. The environmental impacts of BAC and CBB extraction on freshwater eutrophication (ETP), global warming (GW), land use (LU), and water consumption (WC) for a functional unit of 10 g of broccoli leaf extract were performed using LCI. The data indicated that an increase in temperature in the upper range (37 to 70 °C) promoted ETP, LU, and WC. The same phenomenon was observed when the temperature decreased in the lower range from 37 to 4 °C. Moreover, as the exposure time increased, the emissions of P, N, CO2, and water consumption were also augmented. Relatively high concentrations of ethanol promoted P, N, and CO2 emissions. In addition, the results indicated that as the temperature increased, CO2 eq emissions also increased. The lowest CO2 eq emissions were observed at 37 °C. Finally, in Mexico, the persistent issue of leftover residues from broccoli cultivation in fields currently leads to operational costs, particularly for larger enterprises. By utilizing these waste materials to extract valuable BACs and CBBs, the residues could be transformed into a reservoir of organic chemical precursors applicable in the food and pharmaceutical sectors. The methodology introduced in this study holds the potential to drive the adoption of a circular bioeconomy in the central region of Mexico.


