1. Introduction
As customer demands are becoming increasingly diverse, personalized, and dynamic, the global manufacturing industry continues to develop and evolve. This trend presents manufacturers with significant challenges due to the demand for increased flexibility and sustainability in their production and logistics processes to establish a sustainable manufacturing system [
1]. In this process, sustainability has become a central focus of the manufacturing industry, especially in the field of material delivery scheduling, which directly affects production efficiency and overall sustainability [
2]. Sustainable material distribution systems emphasize the use of intelligent logistics scheduling systems developed through digital technologies. Manufacturers can efficiently meet customer demands while simultaneously enhancing production efficiency, optimizing resource utilization, reducing energy consumption, and minimizing waste generation. This not only helps manufacturers maintain their core competitiveness but also contributes to the achievement of sustainability objectives (e.g., including economic and environmental sustainability), thus propelling the manufacturing industry forward [
3].
With the rapid development of digital technologies such as the Internet of Things (IoT) [
4], digital twins (DTs) [
5], and big data (BD) [
6], manufacturers have begun to adopt a flexible and dynamic mixed-flow assembly production mode. This approach not only enhances their economic benefits but also helps reduce environmental impact, thereby maintaining their core competitiveness. However, under this production mode, traditional material delivery scheduling faces challenges due to backward information methods (e.g., relying on paper and electronic spreadsheets for recording operational data) and unscientific decision-making schemes, leading to unreasonable material delivery task assignments and inefficient route planning. These issues not only delay the progress of logistics delivery but also increase operating costs, energy consumption, and carbon emissions, challenging the economic and environmental sustainability of manufacturers [
7].
Furthermore, unavoidable uncertainties during execution, such as new demands and equipment failures, further degrade the performance of the logistics system, limiting the overall sustainability of the system [
8]. Therefore, there is an urgent need to achieve comprehensive state awareness and real-time dynamic decision-making and control of the material delivery system, forming a strategy that is both flexible and sustainable. One of the main challenges facing the traditional material delivery scheduling and control strategy is the difficulty in comprehensively collecting and sharing the real-time operational status data of the logistics system. IoT technology, by transforming traditional manufacturing resources, endows them with identification, perception, and communication capabilities, making real-time information visibility possible. In recent years, a DT-based information sharing model has emerged, aimed at achieving real-time information sharing in production and logistics [
9].
Although real-time information visibility technology is highly regarded for enhancing the transparency of the manufacturing system, it cannot fully achieve dynamic material delivery scheduling and control on its own. Thus, innovative methods are urgently needed to combine real-time information visibility with dynamic decision-making to optimize material delivery. DT, as a high-fidelity virtual simulation technology, has begun to attract attention due to its real-time information-driven dynamic delivery scheduling optimization [
10,
11,
12,
13,
14,
15]. However, the theoretical foundation in this area still needs further exploration. Therefore, this study will delve into how to better optimize dynamic material delivery scheduling.
Firstly, previous material delivery scheduling optimization models often focused on economic sustainability indicators such as fixed distribution costs and variable travel costs but ignored the satisfaction levels of workstations with distribution service quality, limiting the efficiency and effectiveness of the system. Therefore, we will incorporate workstation satisfaction and also consider carbon emission indicators to respond to the approaching “carbon neutrality” target, constructing a more comprehensive and reasonable material delivery scheduling optimization model to enhance the economic and environmental sustainability of the system. Secondly, as many manufacturing enterprises are still in the early stages of informatization, it is challenging to obtain operational data for material delivery systems. This study will explore how to collect and integrate various types of data in real time and comprehensively, using DT technology to build multi-scale digital twin models and providing a solid foundation for dynamic decision-making. Additionally, we will improve existing intelligent optimization algorithms to enhance their solving speed, quality, and stability.
This study proposes a DT-based material delivery scheduling optimization method, which, by considering workstation satisfaction and carbon emissions, constructs a model that comprehensively reflects minimizing total delivery costs, maximizing workstation satisfaction, and considering carbon emissions. Additionally, based on the standard DT architecture, we designed a material delivery scheduling optimization decision-making framework and dynamic scheduling optimization strategy for intelligent and adaptive scheduling in complex, dynamic environments. We also proposed an improved ant colony algorithm, which optimizes path node selection probability and pheromone update rules and enhances the solution speed and quality of optimal solutions. Using real data from a cooperative assembly workshop, it is demonstrated that the proposed material distribution optimization model and strategy can not only reduce the material distribution cost but also enhance resource utilization, reduce resource consumption and carbon emissions, and thus promote the sustainable development of manufacturing enterprises at both the economic and the environmental level.
The rest of this paper is organized as follows:
Section 2 introduces the related work on enabling technologies for production logistics management and material distribution scheduling models and algorithms.
Section 3 describes the problem under consideration and the corresponding material distribution scheduling models.
Section 4 presents the proposed solutions, including a DT-based material distribution scheduling optimization decision framework, the composition and operation mechanism of the DT-based material distribution system, a DT-based dynamic material distribution scheduling optimization strategy, and an improved intelligent scheduling optimization algorithm.
Section 5 provides a numerical case study to validate the proposed methods.
Section 6 further elaborates the discussion. Finally,
Section 7 offers the main conclusions and limitations of this research.
2. Related Work
This section comprehensively reviews work closely related to the research topic, mainly involving applications of IoT and DT in logistics distribution management, material distribution scheduling optimization problems, and the application of intelligent algorithms.
2.1. Applications of IoT and DT in Logistics Distribution Management
With the continuous development of industrial internet technologies, the application of IoT and DT in smart production logistics management is increasingly being enhanced [
5]. IoT technology, through the use of intelligent tools, efficient data utilization, and enhanced mobile productivity, has profoundly impacted the manufacturing industry. It connects various smart devices to physical resources, creating intelligent entities with sensing, positioning, and communication capabilities, thus enabling communication and data exchange between objects and opening new possibilities for logistics distribution management [
16]. For instance, Li et al. proposed an intelligent logistics management system based on IoT technology, showing significant advantages in addressing complex processes, inefficiency, and vehicle management chaos in logistics companies [
17]. Lei et al. introduced an IoT-based intelligent distribution model that effectively solved the problems of decision-making time and speed in a large-scale information interaction environment [
10]. Qing et al. developed an IoT-based emergency logistics vehicle dispatch model that effectively addressed vehicle scheduling challenges in post-disaster emergency logistics [
18]. Additionally, Ren et al. created an IoT-based recycling logistics information management system, solving integrated management and operational control issues in recycling logistics [
19].
Digital twin technology, by creating virtual replicas of physical systems, provides a real-time visible and traceable digital information environment for simulation, prediction, analysis, and optimization of processes. This technology has shown significant application value in real-time tracking and process optimization in the field of material distribution. For example, Zhang et al. proposed an optimal state control method based on DT to address real-time goal setting and optimal execution control problems in synchronized production operation systems [
20]. Yao et al. introduced an IoT-enhanced DT model, significantly improving the scheduling efficiency of AGVs and machinery in flexible manufacturing systems and supporting decision-making during production interruptions [
11]. Kaoud et al. utilized DT-based discrete event simulation to address the synchronous scheduling of AGVs and machinery in flexible manufacturing systems, aiming to determine schedules for each task to minimize the total completion time [
12]. Farooq et al. proposed a multi-AGV path optimization framework based on an improved genetic algorithm for the intelligent cyber-physical production environment in the textile spinning industry, effectively reducing the total path distance [
13]. Vlachos et al. studied the integration of AGVs and IoT technology in flexible manufacturing systems, exploring how they jointly transform traditional manufacturing systems [
14]. Monek and Fischer created an IIoT-based “physical–digital” synchronized DT solution. This solution, utilizing DT for discrete event simulation, achieved accurate identification and tracking of materials during the production process and optimized production flow decisions [
15]. Wang et al. developed a material distribution system based on DT to optimize in-factory material distribution decisions [
21]. Fang et al. introduced an innovative job shop scheduling method based on DT to reduce scheduling deviations [
22]. These studies demonstrate that DT technology not only optimizes material distribution processes but also increases transparency and flexibility in manufacturing processes, positively impacting economic and environmental sustainability.
2.2. Material Distribution Scheduling Problems and Intelligent Algorithms
Material distribution scheduling optimization represents a pivotal issue in the production logistics management of manufacturing enterprises, directly impacting the operational costs and service levels of the production logistics system [
23]. The essence of this problem lies in finding vehicle routing plans that not only meet customer demands but also optimize the objective function within specific material distribution networks and constraints [
24]. Depending on its complexity and practical characteristics, this problem can be categorized into various types, such as the basic vehicle routing problem (VRP), VRP with time windows (VRPTW), and VRP with pickup and delivery (PDPTW) [
25].
For instance, Klen et al. proposed a milk-run material transportation scheduling model for multi-assembly stations’ real-time material distribution needs, adaptable to dynamic disturbances [
26]. To address these optimization challenges, a multitude of intelligent algorithms have emerged, including particle swarm optimization (PSO), simulated annealing (SA), and ant colony optimization (ACO). These algorithms exhibit unique advantages in diverse application scenarios. For example, Tao et al. enhanced the PSO algorithm to effectively solve the path planning issues of AGVs in workshop production lines [
27]. Wang et al. proposed the self-learning non-dominated sorting genetic algorithm II (SNSGA-II), addressing the integrated path optimization problem [
28].
Furthermore, Chaudhry et al. designed a proprietary genetic algorithm for AGV assignment and production scheduling in flexible job shop environments [
29]. Chen et al. introduced an improved hybrid ant colony algorithm, enhancing the precision in pathfinding and reducing the frequency of path selection decisions [
30]. Emde et al. designed a taboo search algorithm, addressing the material supply issue of delivering parts efficiently and in a timely manner to automatic assembly lines using tow trains within the factory, achieving a zero-defect state in assembly lines while minimizing work-in-process inventory to meet just-in-time targets [
31]. Lyu et al. developed an algorithm combining a genetic algorithm with Dijkstra’s algorithm, addressing the optimal number of AGVs, shortest transport time, path planning, and conflict-free routing of machines and AGVs in flexible manufacturing systems [
32]. Liu et al. proposed a knowledge-guided distribution estimation algorithm based on delivery satisfaction evaluation, addressing the AGV scheduling problem in general manufacturing workshops with matrix-layout stations, uncertain station replenishment times, and dynamic AGV unloading efficiency [
33].
Synthesizing the existing research, we identified several pressing issues in the field of material distribution. Firstly, traditional material distribution models typically focus solely on fixed distribution costs and variable travel costs, neglecting the satisfaction level of workstations towards the delivery service. This practice limits the overall efficiency and outcomes of the logistics system. Moreover, with the growing emphasis on environmental protection, incorporating sustainability indicators such as carbon emissions into material distribution scheduling optimization models is becoming increasingly crucial to create more comprehensive and rational optimization models. Secondly, most research concentrates on static distribution planning within workshops. Although some manufacturing enterprises have begun utilizing IoT technology to acquire real-time physical resource information, these data are often singular, localized, and heterogeneous, originating from different information systems and making it challenging to form a unified global view. In contrast, research on dynamic material distribution scheduling optimization based on DT technology remains relatively scarce. This is primarily manifested in the lack of a unified DT-based scheduling decision framework encompassing various scheduling rules and its operating mechanism. Additionally, traditional intelligent algorithms still need improvement in terms of the quality, speed, and stability of material distribution scheduling solutions to meet practical enterprise needs. These gaps in the field, especially regarding the incorporation of environmental sustainability and DT technology, point towards future research directions. Future research should include the design of dynamic material distribution scheduling models that integrate environmental factors and the exploration of more efficient and adaptable intelligent algorithms. Moreover, case studies based on real industrial applications will aid in understanding the practical applications and effects of these new technologies in real-world settings.
In light of this, our study proposes a DT-based dynamic material distribution scheduling optimization model, strategy, and corresponding improved algorithms. Our objective is to address the limitations of existing material distribution models by integrating the latest DT technology and enhanced intelligent algorithms, considering environmental sustainability, and providing manufacturing enterprises with more efficient, transparent, and flexible material distribution solutions.
3. Problem Analysis and Description
3.1. Material Distribution Operational Process and Operational Problems
3.1.1. Material Distribution Operational Process
This work was motivated by collaboration with a well-known home appliance company. The company manufactures hundreds of different products, each with varying order quantities. Different product categories may have distinct production processes. To meet the demand for high product variety and small batch production, they have implemented a mixed-model production approach in the air-conditioning final assembly workshop. Currently, the company’s workshop is gradually transitioning to smart manufacturing and has deployed automated guided vehicles (AGVs) in the assembly workshop to handle material transport and distribution tasks within the assembly line workstations. These AGVs are coordinated by an automatic guidance system for material distribution across the assembly lines.
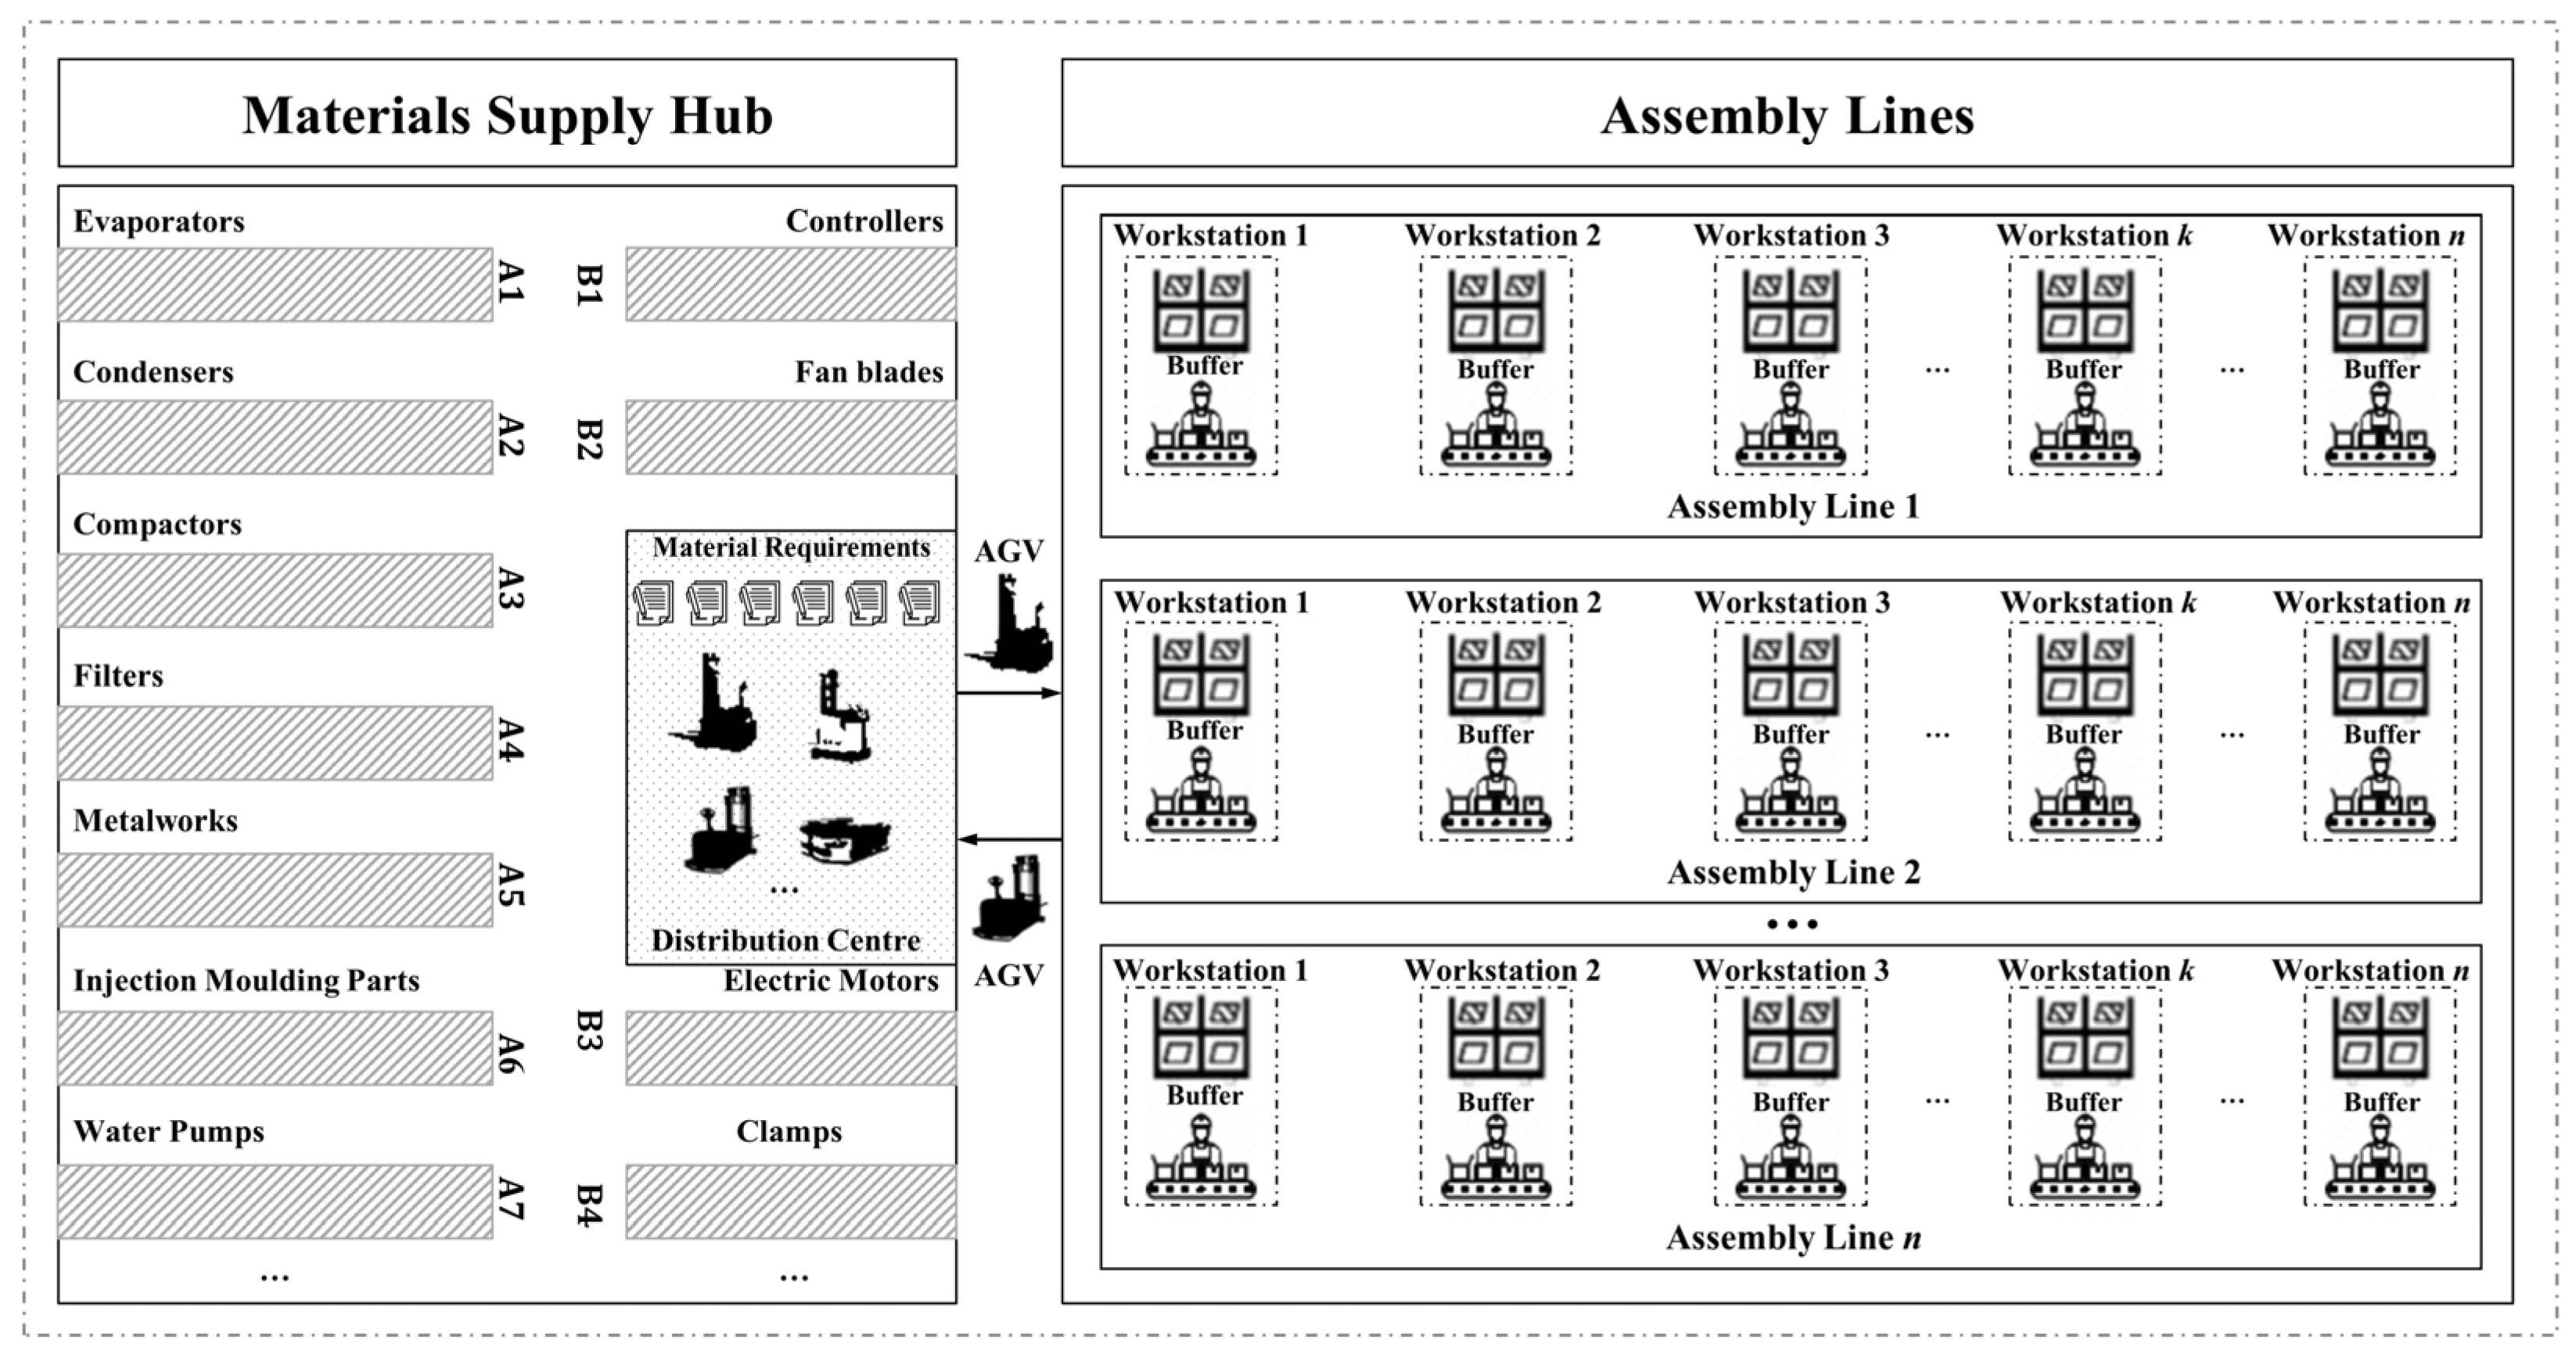
The study focuses on dynamic material distribution scheduling optimization within the mixed-model assembly workshop. As illustrated in
Figure 1, the principle of material demand-driven distribution involves workstations continuously consuming materials from their workstation buffer areas. When the inventory level drops below a reorder trigger threshold, material replenishment orders are generated and sent to the material distribution system. Within each specific production cycle, the material distribution system aggregates material demands from each workstation buffer area, creating a material distribution task list. These tasks are then grouped into a material distribution batch order and sent to the material supply center to arrange available logistics resources for the required distribution tasks. Consequently, the material distribution process can be divided into two main phases:
Planning phase: The production planning department generates daily production distribution schedules and daily material demand order lists based on customer orders and scheduling rules. These schedules and order lists are transmitted to the material distribution management department through the material distribution system. The material distribution management department, based on this timetable and material demand order list, allocates distribution demand orders among available logistics resources (e.g., AGVs) to formulate the daily material distribution plan to ensure the timely distribution of required materials.
Execution phase: On the day of execution, the material distribution management department assigns AGVs to carry out pre-allocated tasks and routes according to the established material distribution plan. AGVs travel to the warehouse of the material supply center to retrieve various required materials and deliver them to the workstation buffer areas. After completing the designated distribution orders, AGVs return to the warehouse of the material supply center.
3.1.2. Analysis of Material Distribution Operation Problems
Through the analysis of the operational processes described above, we drew the following conclusions: In the mixed-model manufacturing mode, due to the diversity and complexity of materials, efficient, accurate, and timely material distribution is required in the workshop. However, the material distribution process is often influenced by dynamic factors such as demand, resources, and processes, which can lead to inadequate coordination between material distribution and assembly production. Through the investigation of a mixed flow assembly shop (MFAS), we identified the following research questions:
Optimizing workstation material distribution presents certain difficulties. Handling various types and quantities of materials with limited logistics resources, without adequately considering the impact of production speed on material distribution, results in inefficient material distribution and increased costs. Additionally, with limited buffer capacity, there is a need for frequent, appropriately sized material replenishments. However, traditional material distribution strategies rely on manual experience lacking scientific planning, which often leads to early deliveries, causing material accumulation, or late deliveries, causing assembly line downtime, thereby reducing workstation satisfaction.
Manufacturing companies face the challenge of comprehensive information acquisition. Due to the variety of products, material distribution becomes complex. Achieving precise and efficient material distribution requires advanced information technology support. However, the current level of enterprise informatization is relatively low, capable of collecting only certain key performance indicators of the material distribution system but unable to acquire real-time comprehensive operational status information required for the material distribution system. The lack of transparency in production logistics information within the workshop and inefficient information transmission pose challenges to material distribution scheduling optimization.
Designing effective dynamic distribution scheduling optimization strategies presents a challenge. Traditional material distribution schedules are typically based on static planning without considering disruptive factors during the execution of production logistics. However, unexpected dynamic changes often occur during execution. The absence of real-time information-driven material distribution scheduling optimization strategies to effectively address these disruptions results in significant deviations between on-site execution and planned expectations, presenting a significant challenge to management.
3.2. Description of Material Distribution Scheduling Optimization Problem (MDSOP)
The scenario consists of a logistics transportation system comprising K AGVs, each capable of material distribution for N workstations on multiple assembly lines. The maximum carrying capacity of each AGV is denoted as Q, covering a range of materials, including evaporators, controllers, sheet metal parts, and both in-house and outsourced components. Since each workstation has specific time window requirements for materials, the material distribution scheduling optimization problem can be categorized as the vehicle routing problem with time windows (VRPTW) [
25]. In this problem, the concept of soft time windows is introduced, incurring a penalty cost if the soft time window is exceeded.
Specifically, the problem can be summarized as follows: AGVs depart from the distribution center, deliver loaded materials to the workstation buffer areas on the assembly lines, and return to the distribution center. The material load of each AGV must not exceed its maximum carrying capacity while adhering to other constraints. The objective is to deliver materials to the workstations within soft time windows while ensuring delivery completion within hard time windows. The ultimate goal of the entire process is to minimize the number of AGVs and path lengths required for material distribution, and consider environmental impacts (e.g., carbon emissions) while reducing workstation dissatisfaction, thus minimizing the total material distribution cost, with the constraint of finite AGV resources [
34]. Initially, all AGVs are available for use. However, during the execution of distribution, dynamic disruptions such as rush orders and vehicle breakdowns are encountered, necessitating adjustments to the distribution plan based on the actual circumstances to achieve optimal material distribution performance. Furthermore, DT-based material distribution scheduling must meet the following requirements:
Each workstation buffer area can only be serviced by a single AGV.
Each AGV can serve multiple workstation buffer areas.
All AGVs have the same priority and cannot be interrupted once they start serving a workstation buffer area unless there is a vehicle breakdown.
When the AGV shows a power warning during the distribution process, it needs to be replenished.
The distribution capacity on each distribution path does not exceed the AGV’s maximum payload.
Both the starting and ending points of AGVs are at the distribution center (material storage area), and AGVs travel along the planned path at a fixed speed.
3.3. The Formulation of MDSOP
According to the description provided above, the relevant symbol definitions for the problem model under consideration are presented in
Table A1 of
Appendix A.
The mathematical model for the research problem considered in this paper is represented as follows:
Equation (1) represents the three objective functions of the material distribution scheduling optimization problem; Equation (2) minimizes the number of distribution vehicles used; Equation (3) minimizes the length of distribution vehicle routes; Equation (4) maximizes workstation satisfaction in light of the direct correlation between workstation satisfaction and penalty costs associated with AGV delivery delays, which can be quantified by minimizing penalty costs associated with early or late vehicle arrivals; Equation (5) represents the carbon emissions generated during the use of distribution vehicles; Equation (6) ensures that each distribution vehicle’s load does not exceed its maximum capacity; Equation (7) specifies that each workstation can only be serviced by one distribution vehicle; Equation (8) ensures that distribution vehicles start from the distribution center, complete their deliveries, and return to the distribution center; Equation (9) dictates that distribution vehicle k must arrive at workstation j after time ; and Equation (10) enforces time window constraints, incurring penalty costs if materials are delivered outside the specified time window.
The mathematical model constructed in this article belongs to the domain of multi-objective optimization [
35]. According to the theory of quantitative comparison, it is often challenging to directly compare different types of objectives, such as time, distance, satisfaction, and carbon emissions, due to the diversity in their units of measurement. Furthermore, based on the theory of decision consistency in business and engineering decisions [
36], cost factors are frequently considered the primary quantifiable indicators.
To simplify the original multi-objective problem without losing its essence, this study transforms it into a single-objective optimization problem centered on cost minimization. Specifically, the increased purchase and maintenance costs due to the additional use of delivery vehicles are quantified as cost factors. Similarly, an increase in delivery route length implies higher fuel consumption and potential time costs, which are also converted into monetary costs. Regarding workstation satisfaction, failure to meet the time requirements of a workstation may lead to production being either advanced or delayed, and the associated penalty costs should also be included in the total cost. As for carbon emissions, they can be converted into carbon emissions costs based on the current carbon pricing mechanism.
Therefore, the objective function defined in this study (as shown in Equation (11)) aims to minimize the comprehensive total cost, which includes the fixed cost of delivery vehicles, the transportation cost, the penalty cost for workstation time windows, and the cost of carbon emissions.
4. Proposed Methodology
4.1. DT-Based Decision-Making Architecture for Material Distribution Scheduling Optimization
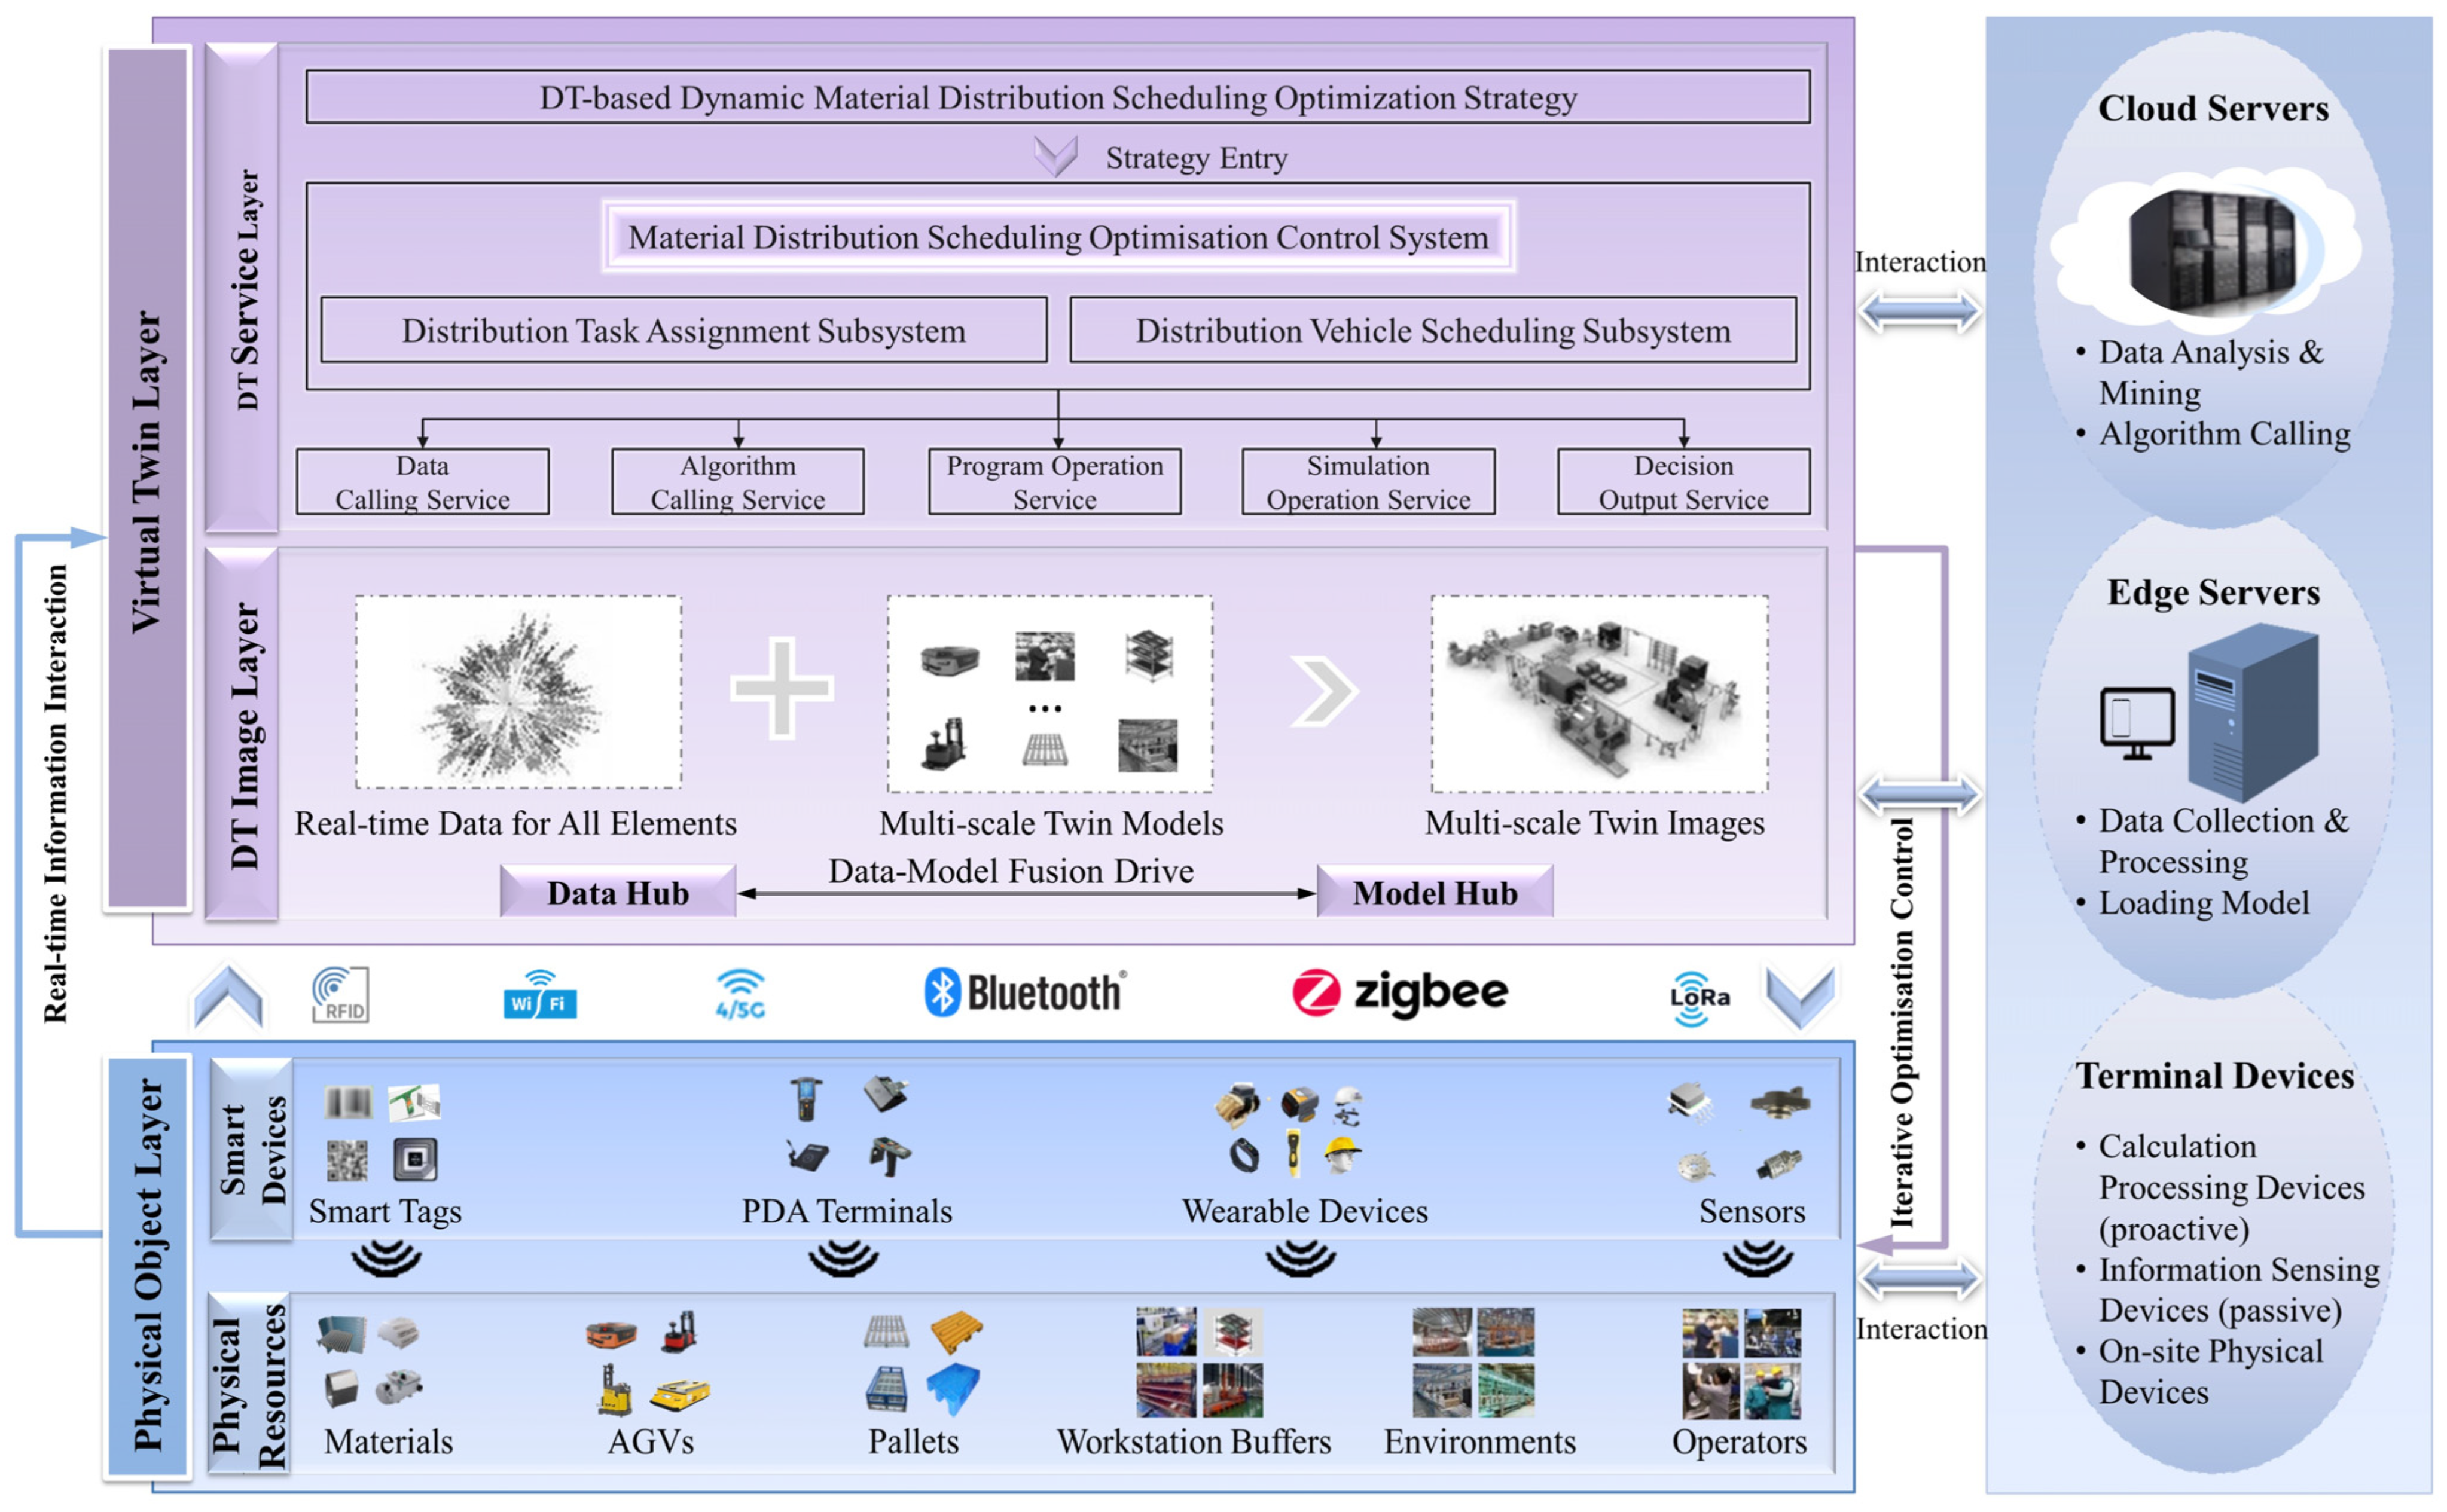
This section primarily introduces a decision-making architecture for material distribution scheduling optimization based on DT, as illustrated in
Figure 2. This architecture comprises two key levels: the physical object layer and the virtual twin layer. Each layer plays a specific role in enhancing the efficiency and accuracy of material distribution scheduling. This innovative decision-making framework offers a novel and efficient material distribution solution for manufacturing enterprises.
4.1.1. Physical Object Layer
The physical object layer is divided into the physical resources layer and the smart devices layer.
This layer encompasses various on-site physical entities in the mixed-flow assembly workshop, such as materials, pallets, AGVs, workstation buffers, workshop environments, and operational personnel.
This layer consists of various smart IoT sensing devices. Active sensing devices include handheld PDA terminals, wearable devices, sensors, etc., whereas passive sensing devices encompass 1/2D tags, RFID tags, etc. These devices are responsible for collecting information related to materials, vehicles, task execution, orders, and the environment. The collected data are then transmitted to the upper layer of the decision-making architecture through heterogeneous networks such as RFID, Wi-Fi, 4/5G, Bluetooth, ZigBee, and LoRa.
4.1.2. Virtual Twin Layer
The virtual twin layer can be further subdivided into the DT image layer and the DT service layer.
The DT image layer comprises two critical components: the data hub and the model hub. The data hub is tasked with collecting, storing, and managing multi-source, multi-dimensional heterogeneous real-time data from the physical object layer (such as the status of AGVs, workstation information, and material tasks). It then performs data fusion and analysis, providing a comprehensive and accurate real-time status foundation for the material distribution system.
The model hub is responsible for constructing and updating DT models (such as DT models of physical resources, processes, and operations) and integrating models of different scales (like device level, system level, etc.). This layer, driven by the “data–model fusion” of DT technology, generates multi-scale virtual images reflecting the actual material distribution system based on real-time operational data from the data hub and multi-scale static twin models from the model hub to support decision simulation.
In the DT-based material distribution scheduling system, the DT service layer plays a pivotal role. It integrates various services and modules to create a comprehensive decision-support environment. This includes the material distribution scheduling optimization strategy, control systems, and service modules within the application system. Notably, the material distribution scheduling optimization strategy (see
Section 4.3) is seamlessly integrated into the material distribution scheduling control system (including subsystems for material delivery task allocation and vehicle scheduling). This integration supports real-time data-based dynamic decision-making and execution control, enhancing the overall efficiency and responsiveness of the material delivery process.
Upon the arrival of material distribution tasks, the virtual twin layer analyzes the material flow, vehicle status, and production requirements. Using the embedded intelligent algorithm module within the control system, it generates optimal task allocation and vehicle scheduling plans. These decision plans are then transformed into commands for the execution control of the physical system. Moreover, the control system encompasses various services: data calling, algorithm calling, program operation, simulation operation, and decision output. These services ensure the smooth and efficient operation of the system and provide simulation assessments of the scheduling plans.
To meet the real-time requirements of the material distribution scheduling system, an innovative “cloud–edge” computing architecture is adopted (as shown in the right half of
Figure 2). This architecture effectively allocates computational needs between cloud and edge servers [
37], balancing the optimization of computing resources and real-time performance. The cloud servers handle historical operational data, conducting large-scale data analysis and mining. Based on these analyses, decision models are constructed and intelligent algorithms are invoked to generate decision schemes. The edge servers, located closer to data sources, are responsible for initially collecting and processing simple distribution operation data and loading digital models. They also monitor the system’s execution in real time, ensuring rapid responses to dynamic changes on site.
The implementation of the “cloud–edge” computing architecture not only ensures the efficiency and smoothness of production within the mixed-flow assembly workshop but also maximizes the strengths of both cloud computing and edge computing. This application significantly enhances the overall computational efficiency of the system and strengthens its capabilities for real-time data processing and rapid response. Consequently, the overall performance of the material distribution scheduling system is greatly optimized.
4.2. DT-Based Composition and Operation Mechanism for Material Distribution System
The material distribution system is a crucial component of the mixed-model assembly workshop, and the DT-based material distribution system forms the foundation of the overall scheduling optimization mechanism, significantly impacting the application of scheduling strategies.
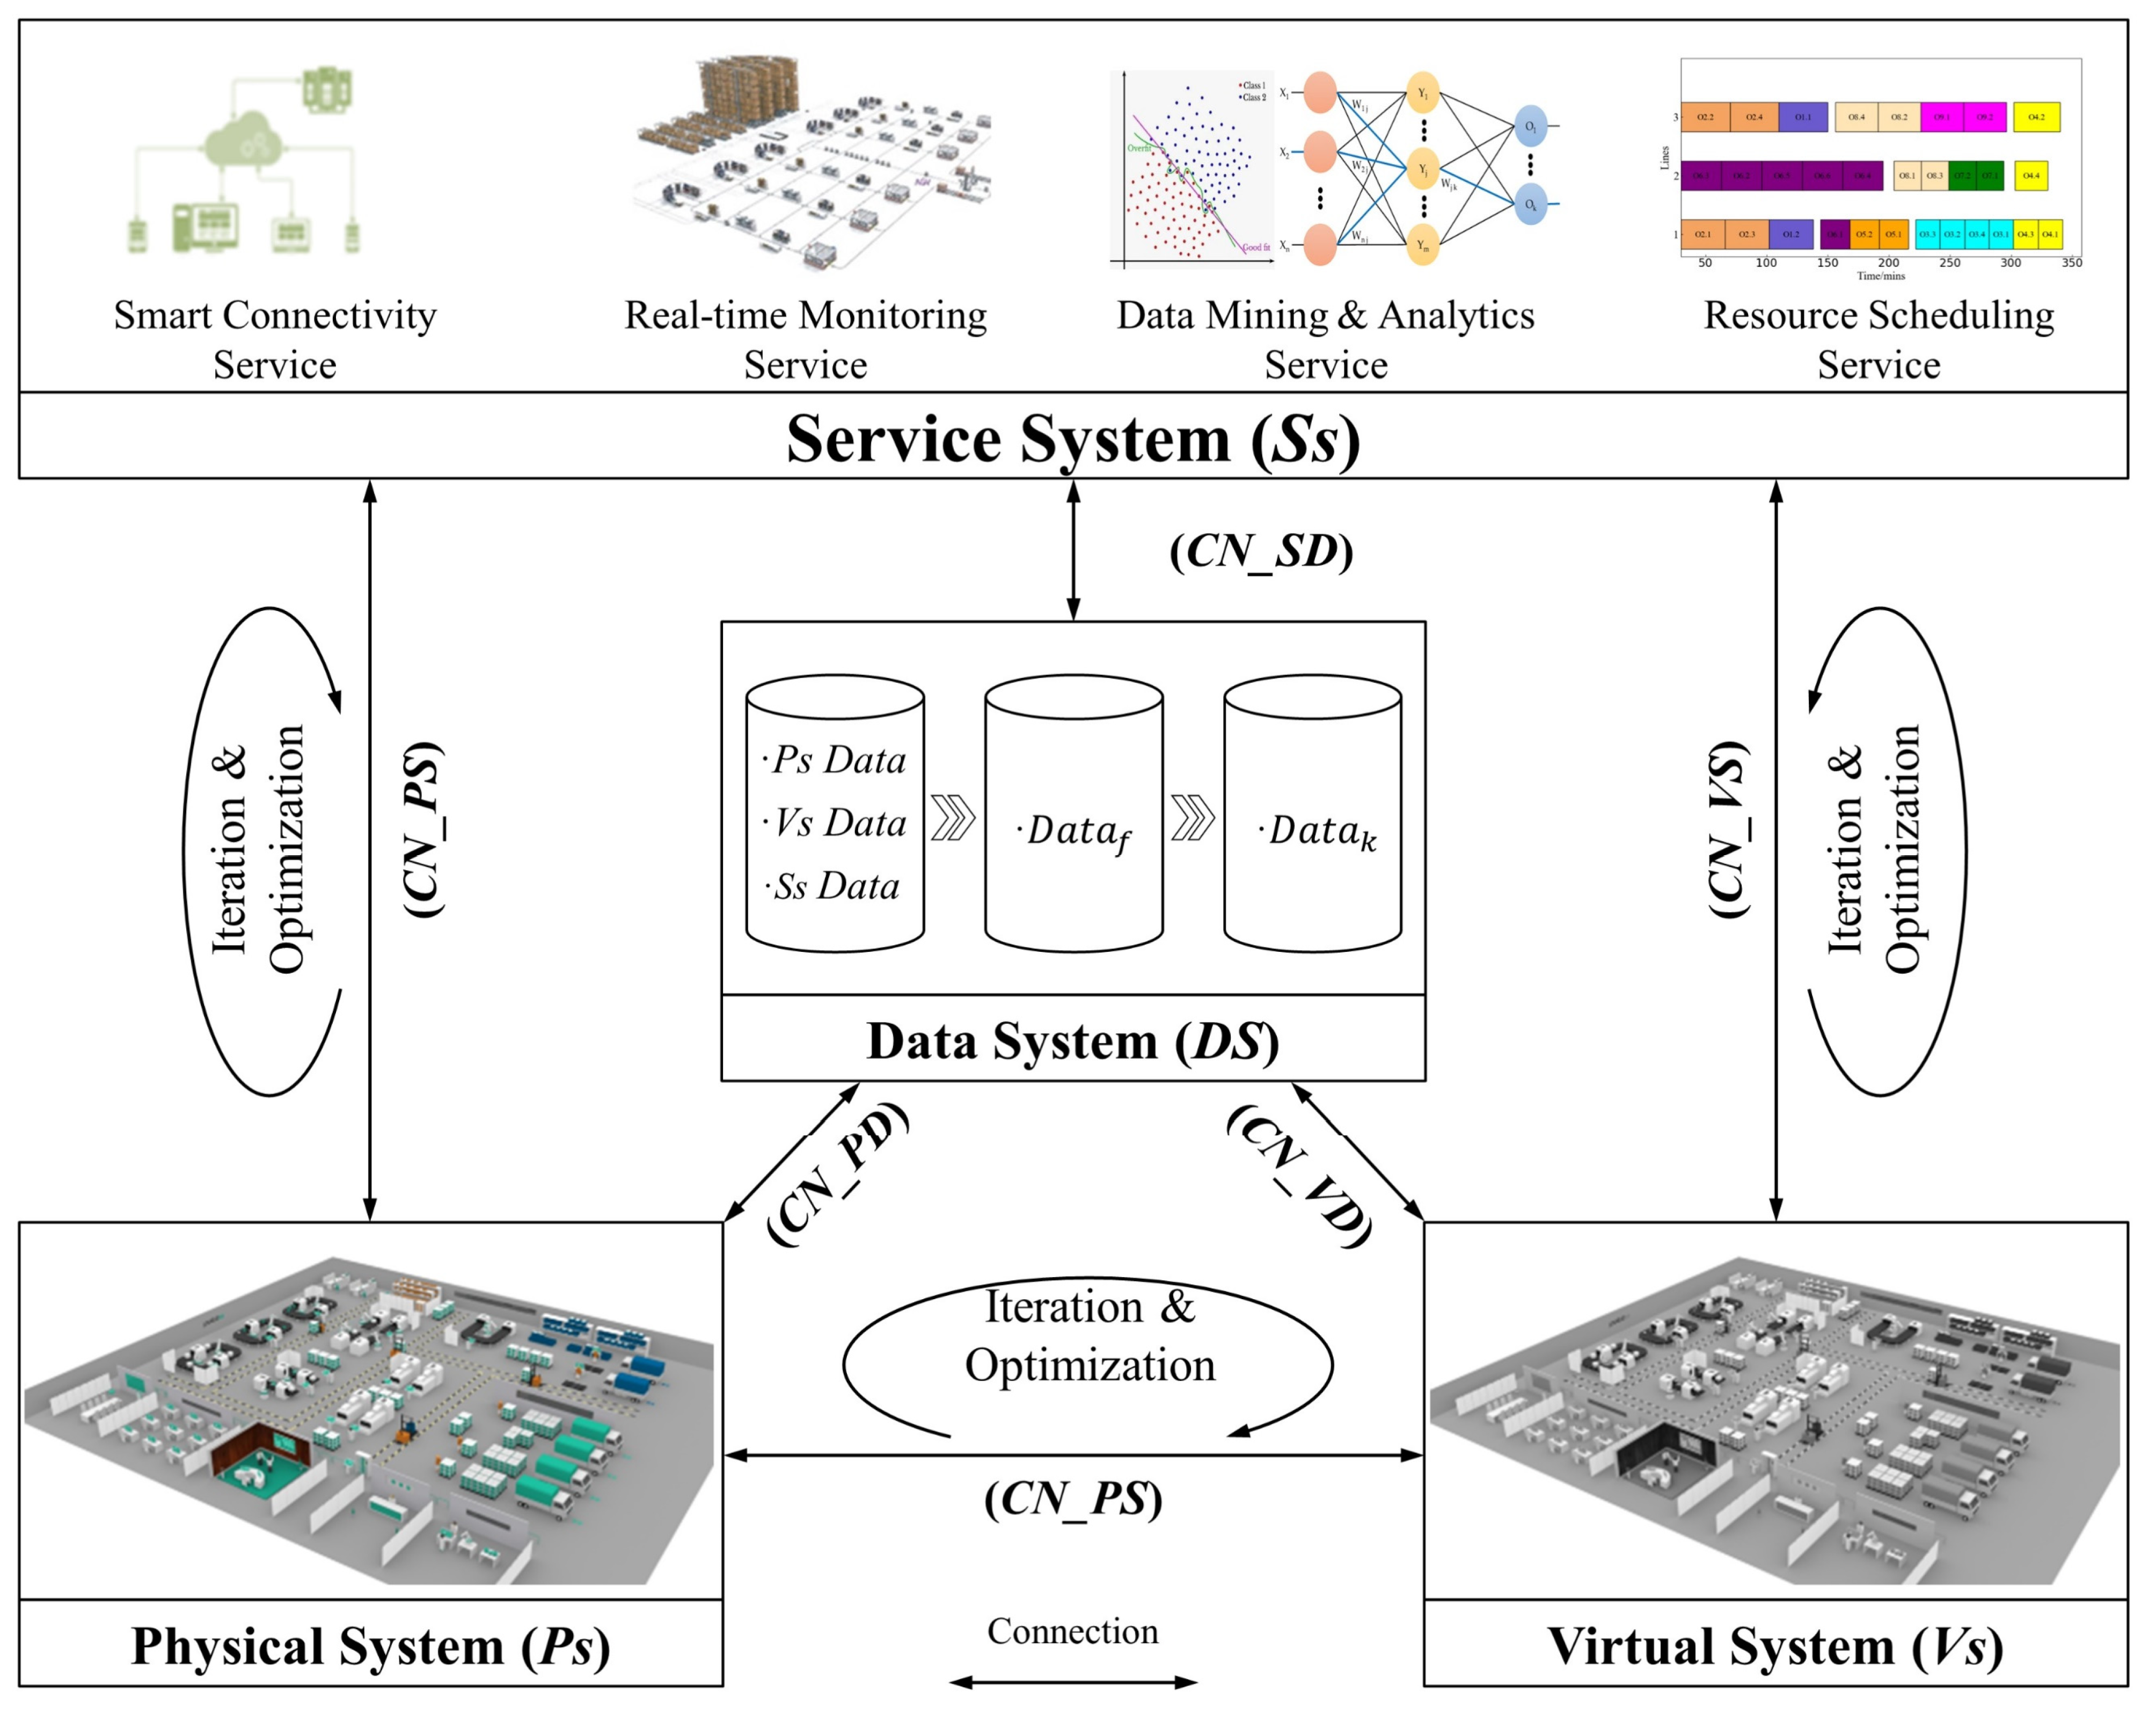
This section describes the composition and operational mechanism of the DT-based material distribution system. According to the five-dimensional DT model proposed by Tao et al. [
38], the composition of the DT-based material distribution system can be described as:
where
represents the physical distribution system,
is the virtual distribution system,
denotes the distribution service system,
supports the distribution decision-making data system, and
signifies their interactive connections.
Figure 3 illustrates the relationships between these components.
includes AGVs, materials, operators, and smart IoT devices, which are primarily responsible for receiving material distribution tasks dispatched by the production plan and executing material transport based on the distribution plan. is mainly used for simulation, evaluation, prediction, and visualization, serving as a digital image of . It involves multi-dimensional “geometric–physical behavior rules”, multi-domain “mechanical–hydraulic–electrical,” and multi-scale “unit–subsystem–system” models.
represents a collection of various intelligent service functions that provide management and control support for the DT-based material distribution optimization system. comprises data from , , and , along with fused information data () and knowledge data (). The data system also acts as a driving force for , , and . is a critical link and foundation for establishing the DT-based material distribution system, enabling interaction connections among the various components.
When distribution tasks are executed, the collaborative process among different components unfolds as follows. Initially, generates an initial plan that satisfies task requirements and constraints based on the system’s multi-dimensional fused data (). Subsequently, simulates, evaluates, and optimizes the initial plan, eliminating potential conflicts, and uploads the optimized best initial plan to . then sends the validated best initial plan to for logistics preparation.
Once the distribution begins, the validated best initial plan is transmitted to , which sends instructions to control the logistics operations of . provides real-time feedback on the status of material distribution to . During the distribution process, predicts changes in ’ performance trends and continuously simulates, evaluates, and optimizes logistics based on DT data. continues to evolve until the tasks are completed.
If discrepancies are found between the execution status of
Ps and the initial plan instructions (referred to as the interference intensity, defined in
Section 4.3), an interference response service is automatically triggered.
rapidly identifies the cause of the interference and adjusts it based on dynamic response strategies to achieve optimal logistics operations.
Furthermore, , as the “core engine” of DT operation, is indispensable for , and , as they all rely on to drive the system.
4.3. DT-Based Dynamic Material Distribution Scheduling Optimization Strategy
With the support of DT-based decision architecture for material distribution scheduling optimization, this section proposes a DT-based dynamic material distribution scheduling optimization strategy.
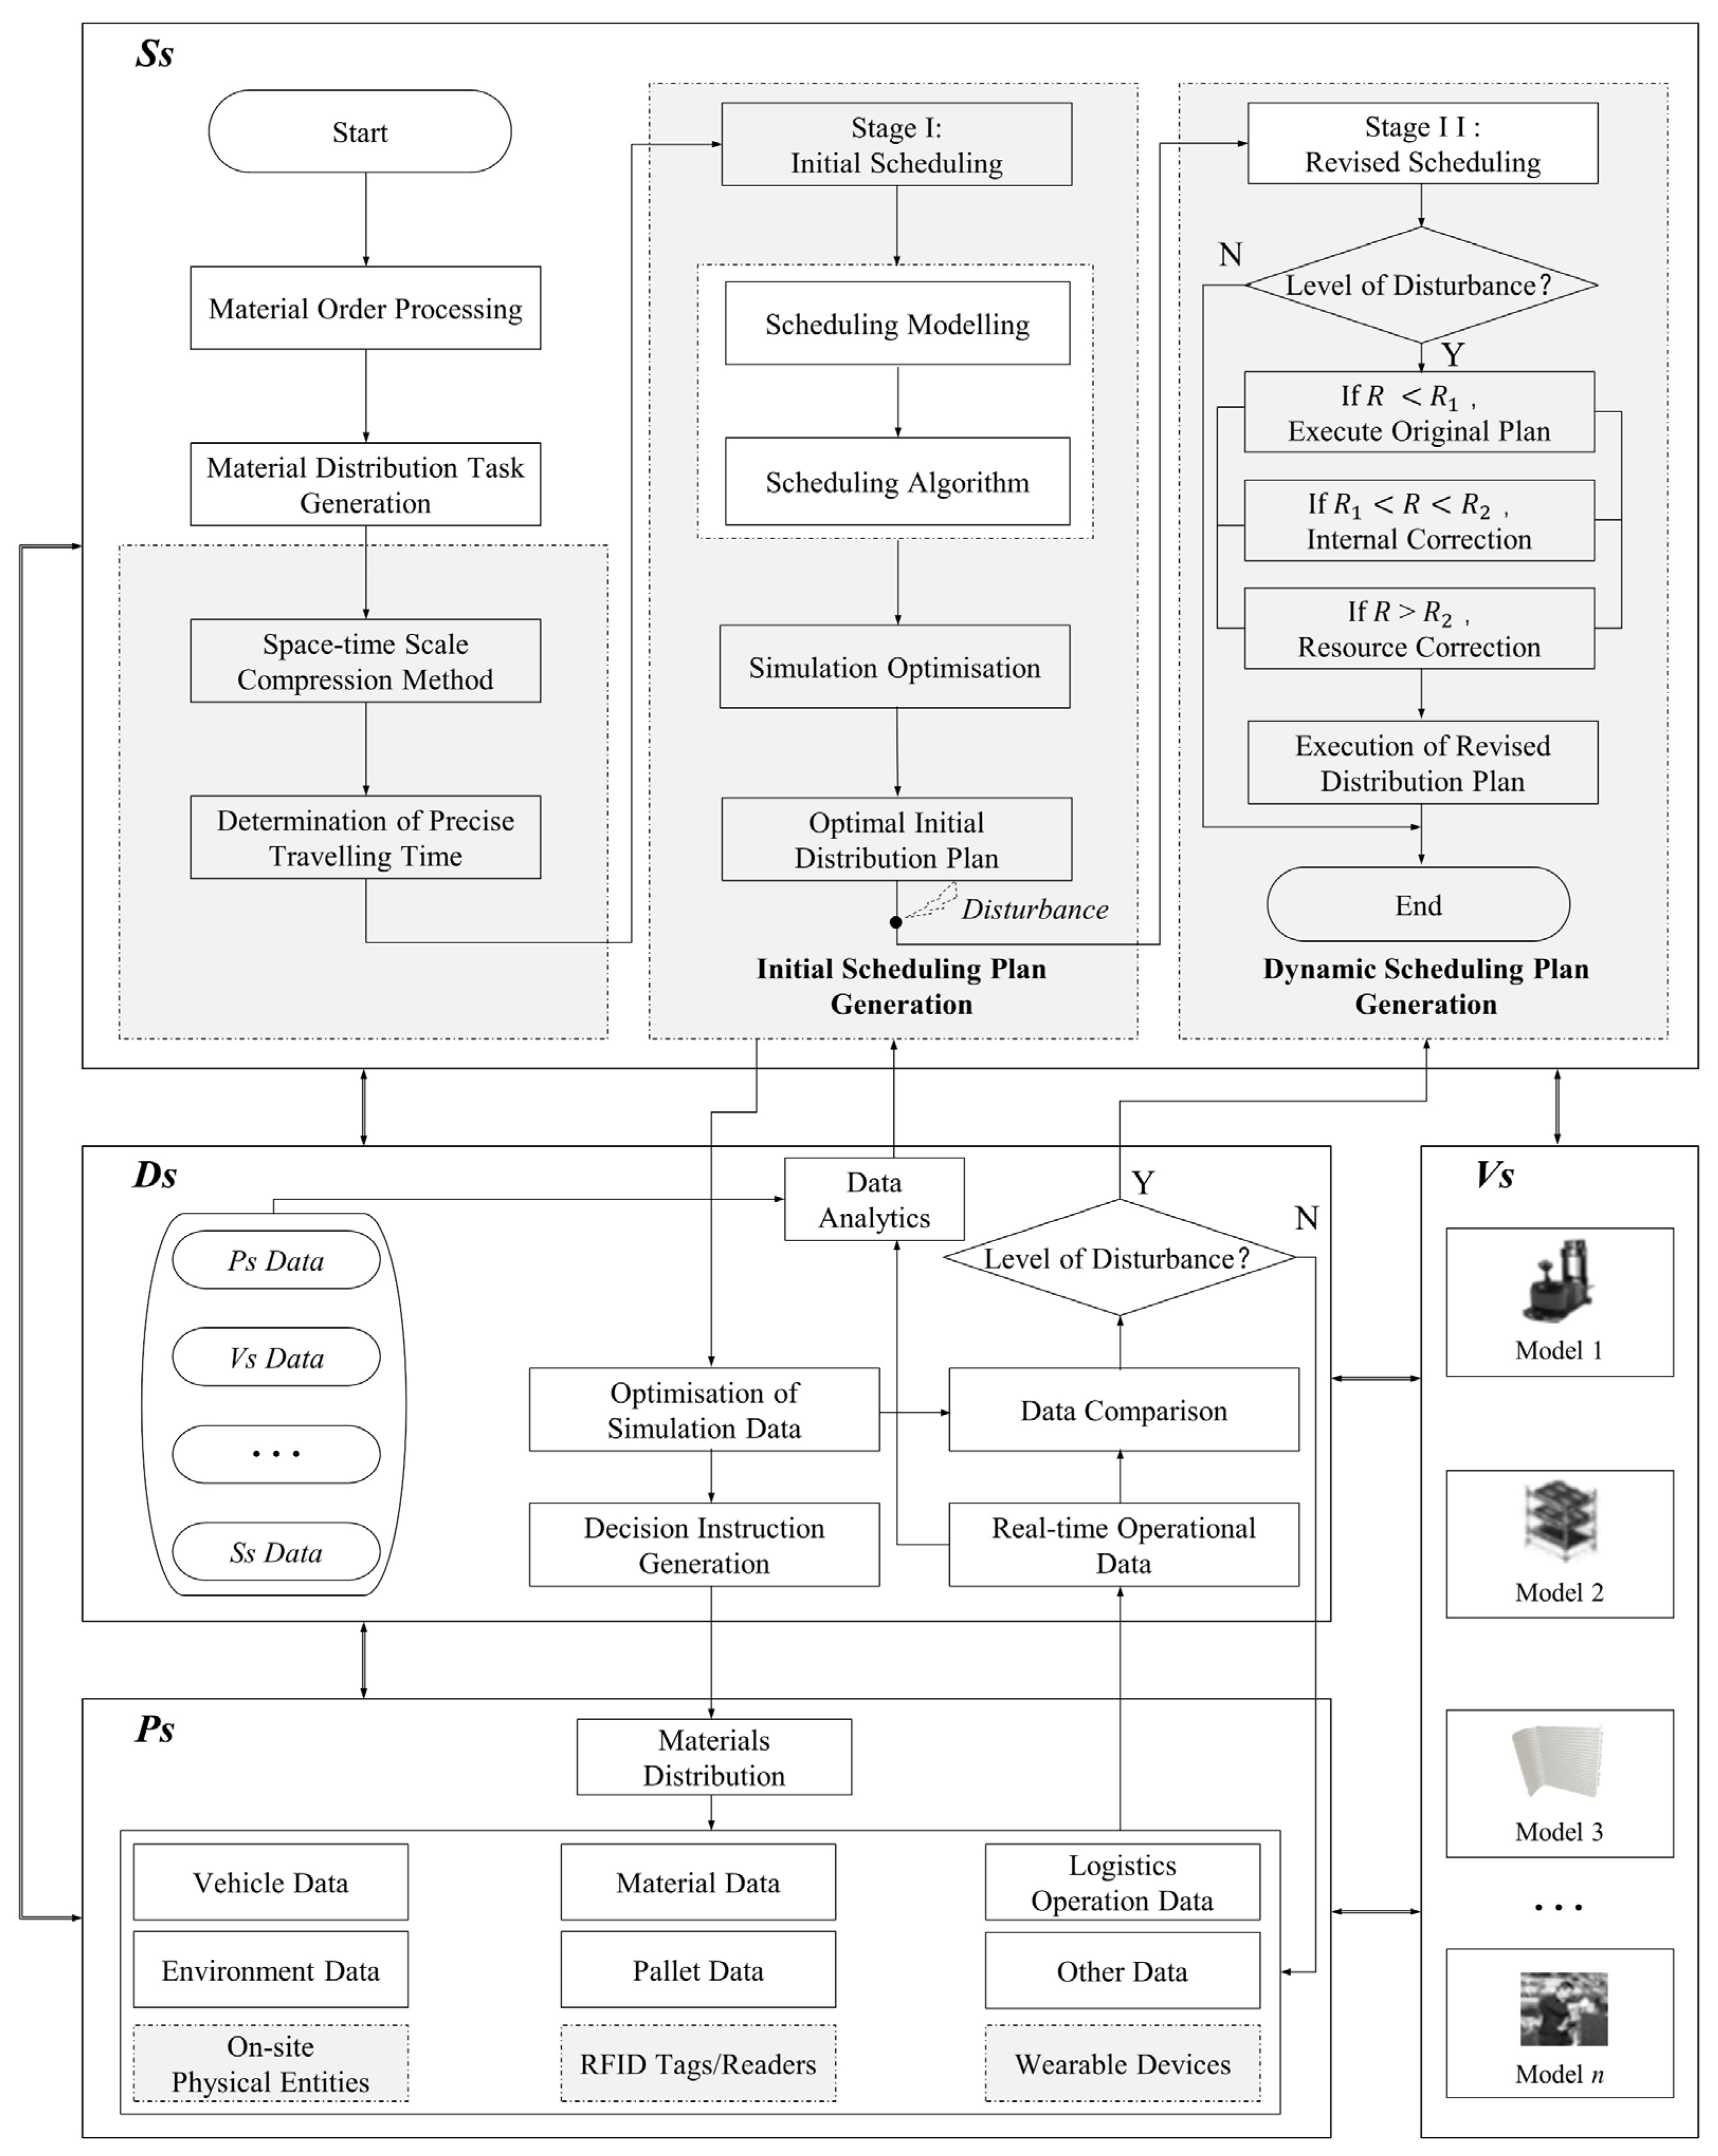
Figure 4 illustrates the overall scheduling optimization strategy. Initially, material distribution task instructions are generated based on the material distribution order demands from the production plan. This entails generating a set of distribution vehicles for each material batch in
, along with the collection of routes for each vehicle.
defines the eligible vehicles for each type of material and employs a compression spatiotemporal ratio method [
39] to determine the precise average travel speed of the distribution AGVs. Subsequently, the scheduling optimization model established in the initial scheduling phase is solved using the embedded improved ACO (IACO). Next, the solved scheduling plan is imported into
for simulation and verification to mitigate potential risks within the scheduling plan. After iterative optimization, the best initial distribution plan results are transformed into decision instructions to control and guide the logistics operations of
.
In the actual production logistics execution process, the comprehensive and robust data collection capability of the DT-based material distribution system allows for real-time operational data, including AGVs, materials, logistics operations, personnel, and environmental data, to be monitored and uploaded to . The collected real-time operational data are compared with the results simulated in to determine whether disturbances exceed predefined thresholds. If such thresholds are surpassed, dynamic revised scheduling is employed to address the disturbances.
During the dynamic corrective scheduling phase, the material distribution system inevitably encounters various disruptive factors, such as emergency order insertion, vehicle breakdowns, material shortages, etc. This study categorizes these disturbances into three levels based on their impact on system operations, denoted as
, and
, with varying levels of intensity. The definition of disturbance intensity is as follows:
Building upon our research group’s prior work [
20], different dynamic response strategies are proposed for various disturbance intensities. When
, it is categorized as level one dynamic response, i.e.,
. In this case, although the material distribution plan for the mixed-flow workshop is affected by disturbances, the impact is not significant enough to disrupt normal execution. Therefore, deliveries can proceed according to the original plan without the need for adjustment. When
, it is categorized as level two dynamic response, i.e.,
. At this stage, the material distribution plan can no longer meet dynamic requirements, but internal corrections can be made to adjust the material distribution plan by modifying and configuring other available distribution vehicles to meet the material distribution needs. When
, it is categorized as level three dynamic response, i.e.,
. In this stage, the planned corrections are insufficient to meet the high dynamic requirements of the material distribution plan in the mixed-flow workshop, requiring the introduction of external logistics resources for resource adjustments. Revised material distribution planning schemes are then issued as instructions to the execution site to meet the high dynamic production logistics requirements.
4.4. Intelligent Optimization Algorithm
In a DT-based material distribution system, the generation of scheduling plans relies on the support of intelligent optimization algorithms. These algorithms are encapsulated within and integrated with DT. The scheduling optimization algorithm, as the core technology of the DT-based material distribution system, has a direct impact on the performance of the logistics system. Therefore, this section explores an improved intelligent optimization algorithm.
The ant colony optimization (ACO) algorithm, inspired by the foraging behavior of ants in nature, has demonstrated outstanding performance in finding optimal paths. It is a probabilistic algorithm with good parallelism, robustness, and positive feedback properties. ACO algorithms have been widely applied in various fields, including machine learning, graph theory problems, logistics planning, and production scheduling. However, traditional ACO algorithms often suffer from problems such as low solution precision, slow convergence speed, and susceptibility to local optima.
In this research, we employed an IACO to address the material distribution scheduling optimization problem in the DT-based framework. This algorithm is inspired by the behavioral patterns and pheromone communication mechanisms of ants, effectively identifying the optimal distribution pathways while simultaneously considering cost, efficiency, and environmental impacts.
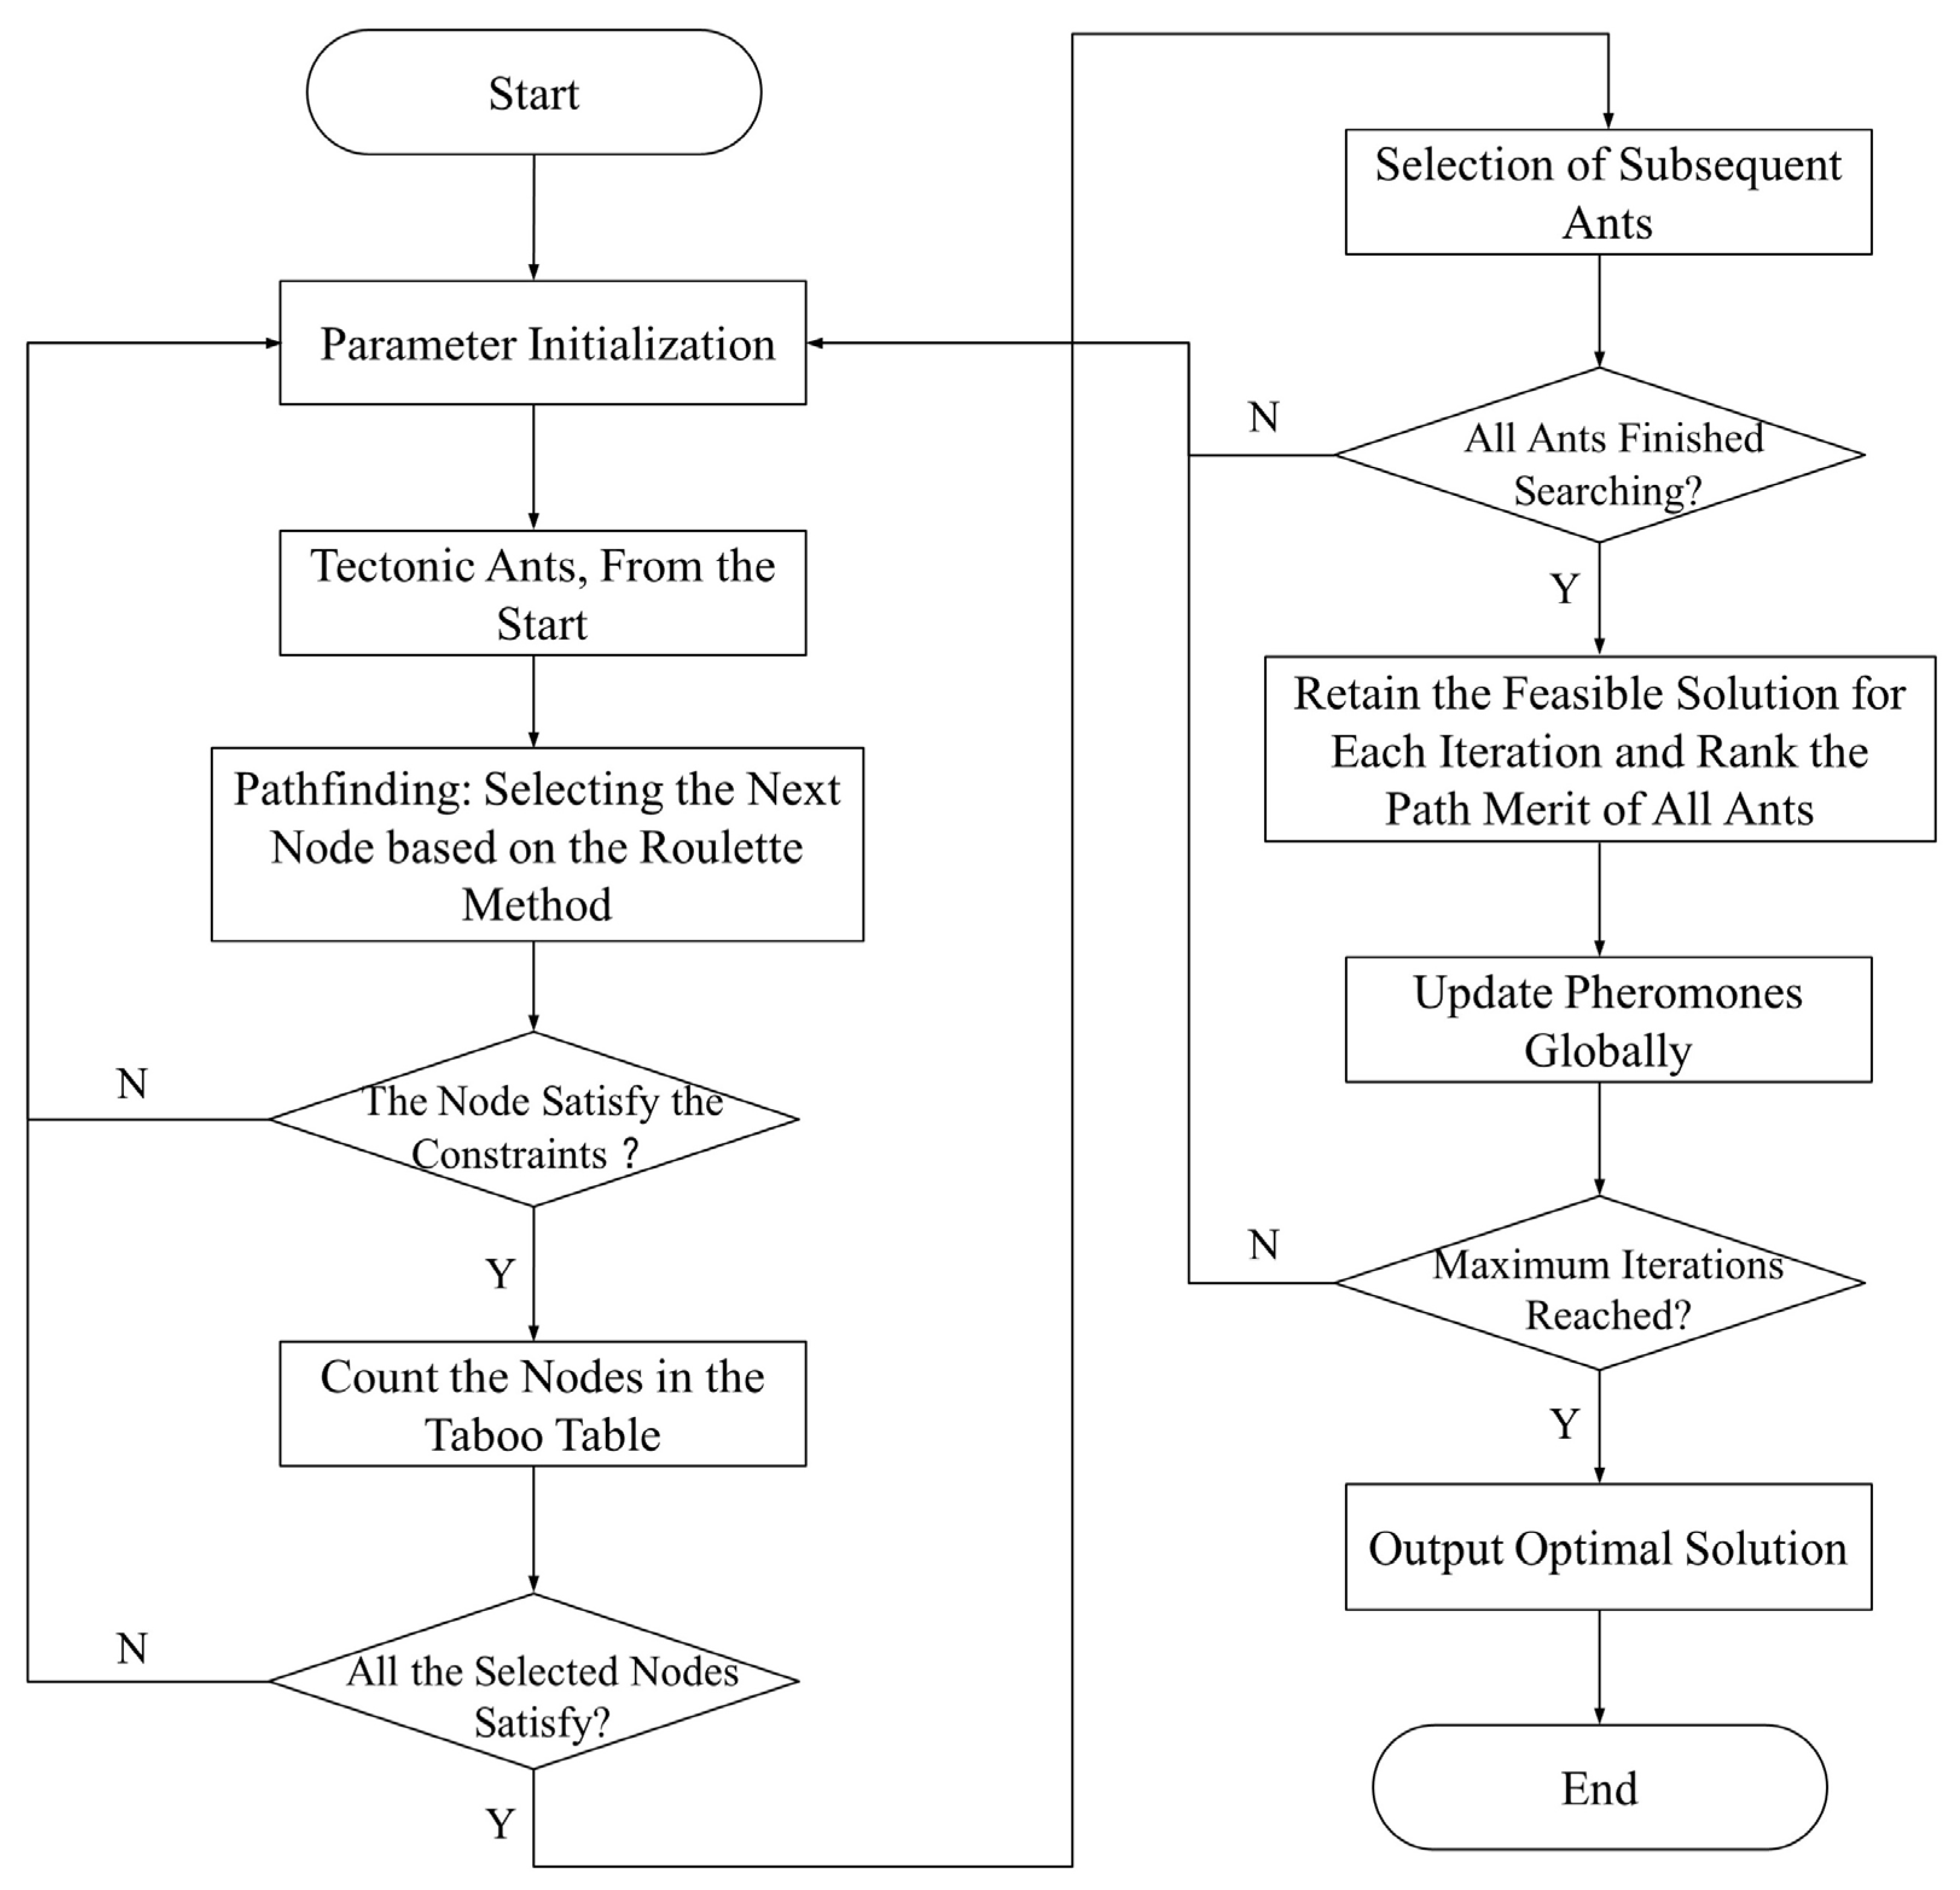
Figure 5 provides a comprehensive flowchart illustrating the operational logic of the IACO algorithm. The diagram distinctly outlines the algorithm’s essential stages, including parameter initialization, pathfinding, task completion assessment, the selection of subsequent ants, and the crucial steps of pheromone renewal and iteration cessation.
The algorithm’s methodology unfolds as follows: Step 1 involves initializing the parameters, which encompasses setting the maximum number of iterations, ants (vehicles), and workstations. It also includes initializing algorithmic parameters like the pheromone factor, the heuristic function factor, and its volatilization factor, along with the initial pheromone concentration and the construction of a taboo table. Step 2 engages in pathfinding from the origin point (O), calculating transition probabilities for path selection and applying the roulette wheel method to determine the subsequent node. Step 3 focuses on assessing task fulfillment, examining whether all demand points are met by the ant; if incomplete, the process returns to Step 2 for continued searching. Step 4 entails the selection of the next ant, ensuring all ants have completed their pathfinding. Finally, Step 5 updates pheromones based on the ants’ path performance, terminating the iteration upon reaching the maximum iteration count and consequently deriving the optimal solution.
A notable aspect in Step 2 is the implementation of the roulette wheel method, which assigns probabilities to each path choice proportional to their respective advantages, thus maintaining a balance. This implies that, although paths with higher pheromone concentration are more likely to be selected (exploitation), other paths also stand a chance of being chosen (exploration). This randomized selection mechanism aids the algorithm in swiftly identifying effective solutions while preventing premature convergence on local optima, thereby enhancing the probability of discovering the globally optimal solution.
To delve into the workings and specific implementation details of the IACO algorithm, Algorithm 1 presents the pseudocode when applying this algorithm to material distribution scheduling problems. This table provides a clear and systematic framework for the algorithm’s execution, meticulously detailing the process from parameter initialization, through the core loop of ant path searching and task completion assessment and up to the pheromone update and the termination of iterations based on predetermined maximum iteration counts.
| Algorithm 1 Pseudocode of the IACO |
1 Input: maximum number of iterations itermax, pheromone factor α,
2 heuristic function factor β, pheromone constant U, pheromone evaporation
3 factor ρ, number of ants (vehicles) m, number of workstations n
4 Process:
5 Step 1—Parameter Initialization:
6 Set itermax, α, β, U, ρ.
7 Define the number of ants m.
8 Set the number of stations n.
9 Initialize the initial pheromone concentration τij (t).
10 Initialize the taboo list to record visited nodes.
11 Initialize the list of accessible nodes (allowed).
12 Step 2—Pathfinding:
13 For each ant:
14 Start from the origin point (O) and add it to the taboo list.
15 Calculate path node selection transition probabilities using
16 Equations (15) and (18).
17 Use roulette wheel selection to choose the next node for path
18 searching.
19 Add the selected node to the taboo list for the current iteration.
20 Repeat the above steps until the task is completed or all demand service
21 points are satisfied.
22 Step 3—Task Completion Check:
23 For each ant:
24 Check whether all demand service points have been satisfied.
25 If the task is completed, return to the origin point (O).
26 If the task is not completed, return to step 2.
27 Step 4—Selection of Subsequent Ants:
28 Check whether all ants have completed their path searches.
29 If all ants have completed them, proceed to step 5.
30 If some ants have not completed them, select the next ant and return to
31 step 2.
32 Step 5—Pheromone Update and Iteration Termination:
33 Update the pheromones on the paths based on Equations (22)–(24).
34 Check whether the current iteration exceeds itermax.
35 If it does, terminate the algorithm and output the current best
36 solution.
37 If it does not, clear the taboo list and return to step 2 for continued
38 iteration.
39 Output the optimal solution. |
Within the IACO algorithm, significant enhancements have been made to the rules governing route node transitions and pheromone updates, markedly improving the efficiency and accuracy of pathfinding. The specific improvements are as follows.
4.4.1. Improved Route Node Selection Transition Rules
The savings technique is introduced, incorporating a quantity
to enhance the ant’s transition probability selection.
is introduced into the ant’s path node transition probability formula, optimizing the selection of path nodes while favoring higher vehicle load rates. The improved node selection transition probability formula is as follows:
where Equation (15)
represents the improved path node selection transition probability formula, indicating the probability of ant k selecting node i to node j at time t. This probability is influenced by the pheromone concentration
, the heuristic function
, the pheromone increment
, and whether node i belongs to the accessible node set allowed. Equation (16) represents the heuristic function, denoting the visibility between nodes
and
, which is usually the reciprocal of the distance between nodes. In Equation (17),
represents the distance function, denoting the Euclidean distance between nodes
and
, and Equation (18) is the savings function
, which is the sum of route lengths for separate deliveries to two workstations minus the route length when visiting both workstations simultaneously. Here,
α is the pheromone factor,
β is the heuristic function factor, and
ρ is the pheromone evaporation factor.
4.4.2. Improved Pheromone Update Rules
The core idea behind this rule is that ants update pheromones along their path as they search, guiding them in choosing paths to find the best solutions based on specific problem constraints and objectives. The standard pheromone update formula is as follows:
where, in Equation (19),
represents the pheromone concentration function for nodes
and
at time
, influenced by the pheromone concentration
at the previous time
and the pheromone increment
(as shown in Equation (20)). Pheromone concentration gradually evaporates
while being influenced by rewards and penalties from ant paths. In Equation (21),
is calculated based on the traveling path length
of a single ant
and the pheromone constant
, representing the increase in pheromone concentration from node
to node
.
In this study, we introduced an improved pheromone update rule that accelerates the algorithm’s convergence by using a reward and penalty strategy. Specifically, during the process of ants searching for paths, ants that fail to complete routes correctly are eliminated, and only ants that successfully reach the target endpoint with a valid path are retained. For these qualified paths, we introduced a reward and penalty strategy for pheromone updates. Assuming there are
ants in total, for the top
ants with the shortest travel path lengths, we increased the pheromone concentration released by these ants, i.e., rewarding them. For the remaining
m − n ants (i.e., those ranked below the top
ants), we reduced the pheromone concentration on their paths, i.e., penalizing them. The specific formula for the improved pheromone update rule is shown in Equations (22) and (23), where
represents the current iteration’s best solution, and
represents the worst solution of the current iteration. To ensure that the pheromone concentration fluctuates within a certain range, avoiding excessive growth or reduction, as well as preventing the algorithm from getting stuck in local optima prematurely or stagnating during the search process, we set the pheromone concentration
as shown in Equation (24).
5. Case Study
5.1. Case Background and Parameter Setting
To validate the excellence and effectiveness of the DT-based material distribution scheduling strategy, we implemented a DT-based material distribution system in a collaborative enterprise. This material distribution system fully utilizes AGVs to execute distribution tasks, with the average travel time of AGVs determined through DT simulation, an average speed of 1 m/s, and a maximum vehicle load of 180 kg. We calculated the fixed costs of AGVs and the distribution costs per unit transportation distance based on historical operating data within the workshop. The assembly workshop comprises three mixed-model assembly lines, and we incorporated actual site data, including the coordinates of material storage areas and various workstations.
Table A2 provides vehicle-related data and basic parameters of IACO.
Table A3 displays the coordinates of the workstations. In this study, we selected the material demand data for different workstations during one cycle of material distribution in the mixed-model assembly workshop, as shown in
Table A4, the sources of which are shown in
Table A2,
Table A3 and
Table A4 in
Appendix A.
5.2. Results Analysis
5.2.1. Verification of Algorithm Superiority
Traditional material distribution scheduling schemes rely on manual experience and often fall short of achieving optimal operations, especially in highly dynamic mixed-model production environments. Hence, this study employed an IACO algorithm to address the material distribution scheduling optimization problem. Numerical simulation experiments were conducted using MatLab R2016a on Alibaba cloud servers, with real data sourced from our collaborative enterprise. We conducted coding and problem-solving with a genetic algorithm (GA), particle swarm optimization (PSO), ACO, and IACO to evaluate the performance of each algorithm. Each algorithm was run 50 times for each test case to ensure the stability of the results, and the average of the best values obtained from these 50 runs was taken as the final outcome.
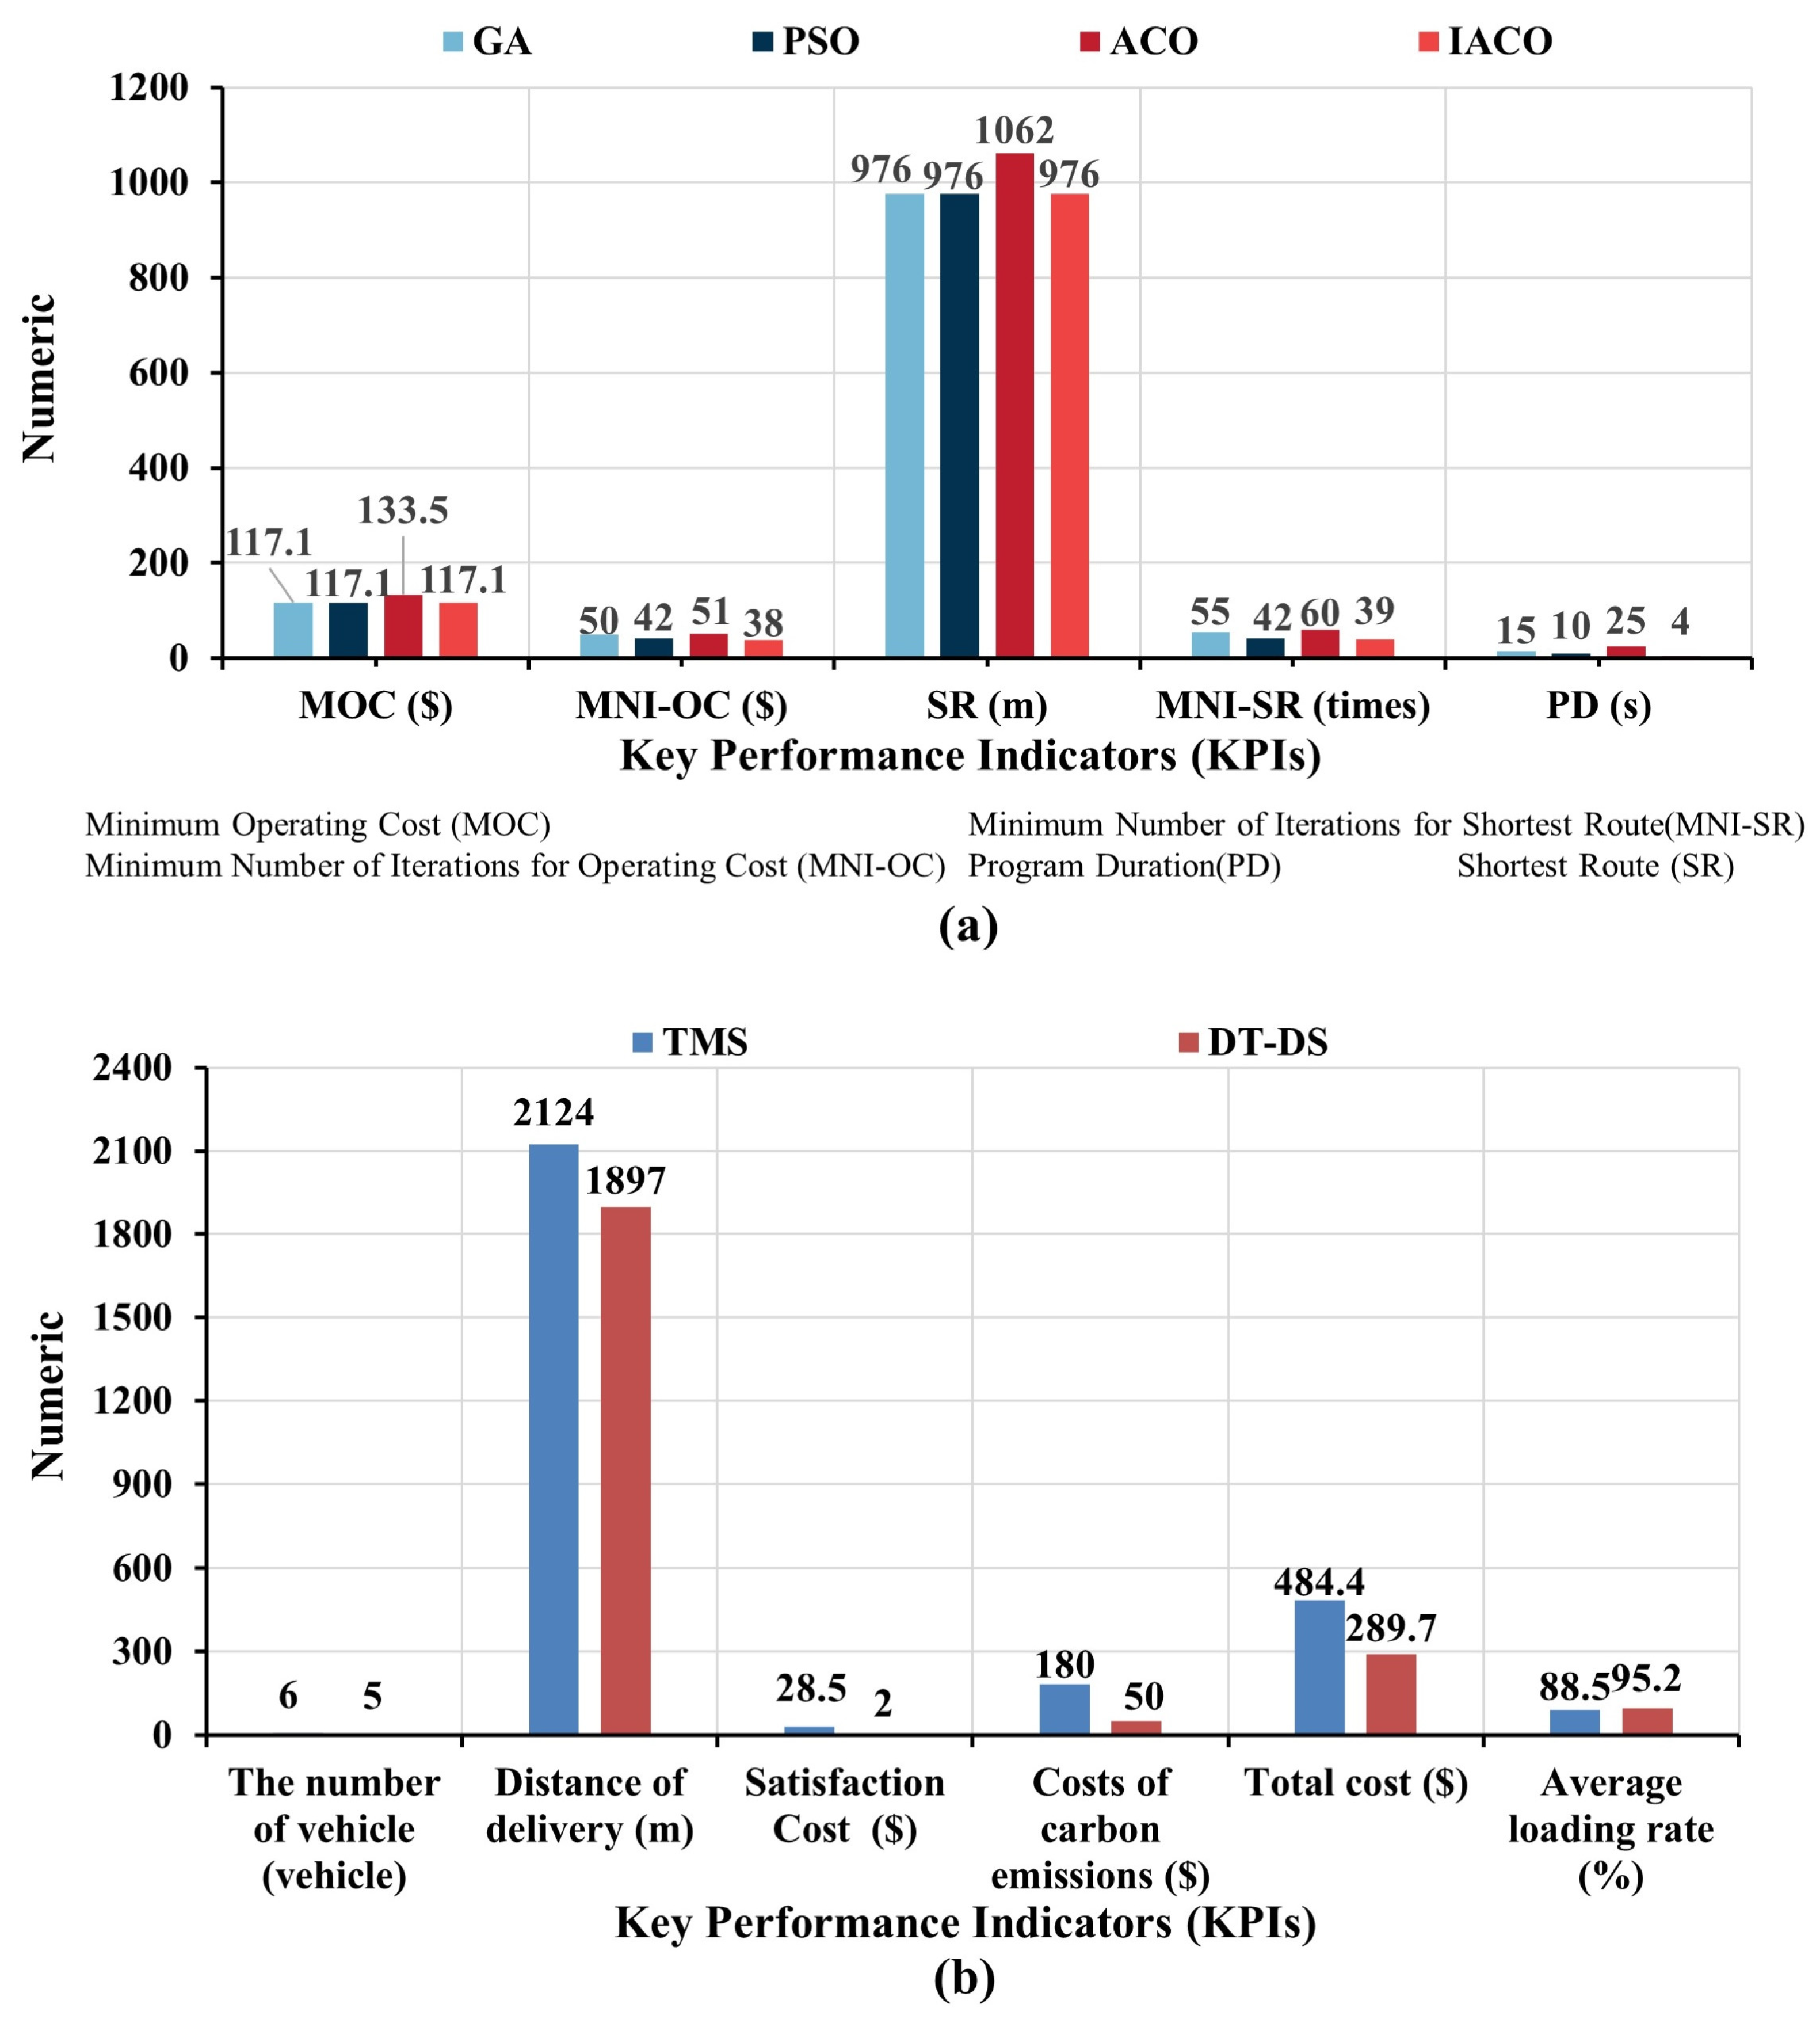
Figure 6a presents a comparative simulation result of these algorithms. We observed that GA, PSO, ACO, and IACO required 50, 42, 51, and 38 iterations, respectively, to converge to the optimal operational cost, with costs of 117.1, 117.1, 133.5, and 117.1 (unite:
$), respectively. In terms of running time, these algorithms required 15, 10, 25, and 4, respectively. Furthermore, to achieve the shortest distribution route, they required 55, 42, 60, and 39 iterations, with travel distances of 976, 976, 1062, and 976, respectively.
These results reveal a key finding: Compared to the ACO, our proposed IACO algorithm demonstrated significant advantages in terms of problem-solving quality. More importantly, IACO exhibited a similarity with GA and PSO in converging to the same optimal solutions, which validates the effectiveness of our proposed algorithm. Meanwhile, in the critical metric of solution speed, our IACO algorithm showed a remarkable lead. These results not only confirm the superiority of our algorithm in the stability of its solving quality but also highlight its efficiency in terms of solution speed. These findings provide essential guidance for algorithm selection and performance optimization.
5.2.2. Scheduling Results Comparison
To comprehensively evaluate the excellence and effectiveness of the DT-based dynamic scheduling (DT-DS) strategy proposed in this paper, we introduced a traditional manual scheduling (TMS) strategy as a comparative benchmark. Under the TMS strategy, material distribution plans are manually devised by planners based on their expertise. In contrast, the DT-DS strategy proposed in this paper makes use of an improved ACO algorithm to make decisions within the DT environment.
Figure 6b displays a comparison of the two scheduling optimization results. Using the TMS strategy, six AGVs were required, covering a total distance of 2124, with a total cost of 484.4 and an average AGV load rate of only 88.5%. In contrast, by adopting the DT-DS strategy, the number of AGVs was reduced to five, the total travel distance decreased to 1897, and the total distribution cost was significantly lowered to 289.7. Additionally, the average load rate of AGVs improved markedly to 95.2%. Compared to the TMS strategy, the DT-DS approach resulted in a reduction of one AGV, a 10.7% decrease in travel distance (227), an improvement of about 93% in station satisfaction (saving 26.5), a 72% reduction in carbon emissions costs (saving 130), and a 40% decrease in total distribution costs (saving 194.7), while enhancing the average load rate of AGVs by approximately 7.6%.
These findings clearly demonstrate that our proposed DT-DS strategy significantly outperformed the TMS strategy in enhancing resource utilization efficiency, reducing operating costs, and mitigating environmental impact. Notably, in supporting cleaner production, this strategy offers substantial benefits in reducing resource consumption and carbon emissions, thus making a significant contribution to sustainable production practices.
5.3. Sensitivity Analysis
To delve into the impact of changes in logistics resources and emerging demand on the performance of material distribution scheduling systems, this study considered three relevant and typical scenarios related to the context of sustainable development and cleaner production: sensitivity analysis under different vehicle load (type) configurations, various vehicle quantity configurations, and different dynamic distribution demand volumes. These sensitivity analyses offer valuable insights into logistics management in mixed-model assembly workshops of similar enterprises, including the reduction of operational costs, resource and energy consumption, and carbon emissions, in order to enhance the economic and environmental sustainability of manufacturing companies.
5.3.1. Scenario 1—Sensitivity Analysis of Different Vehicle Model Configurations
Based on real distribution vehicles in a specific workshop and baseline distribution demand data for a given period, three different vehicle model configurations were considered: a lightweight vehicle (LV, 140), a mediumweight vehicle (MV, 180), and a heavyweight vehicle (HV, 230).
Figure 7a presents an analysis of simulation results based on different vehicle configurations, focusing on three main aspects:
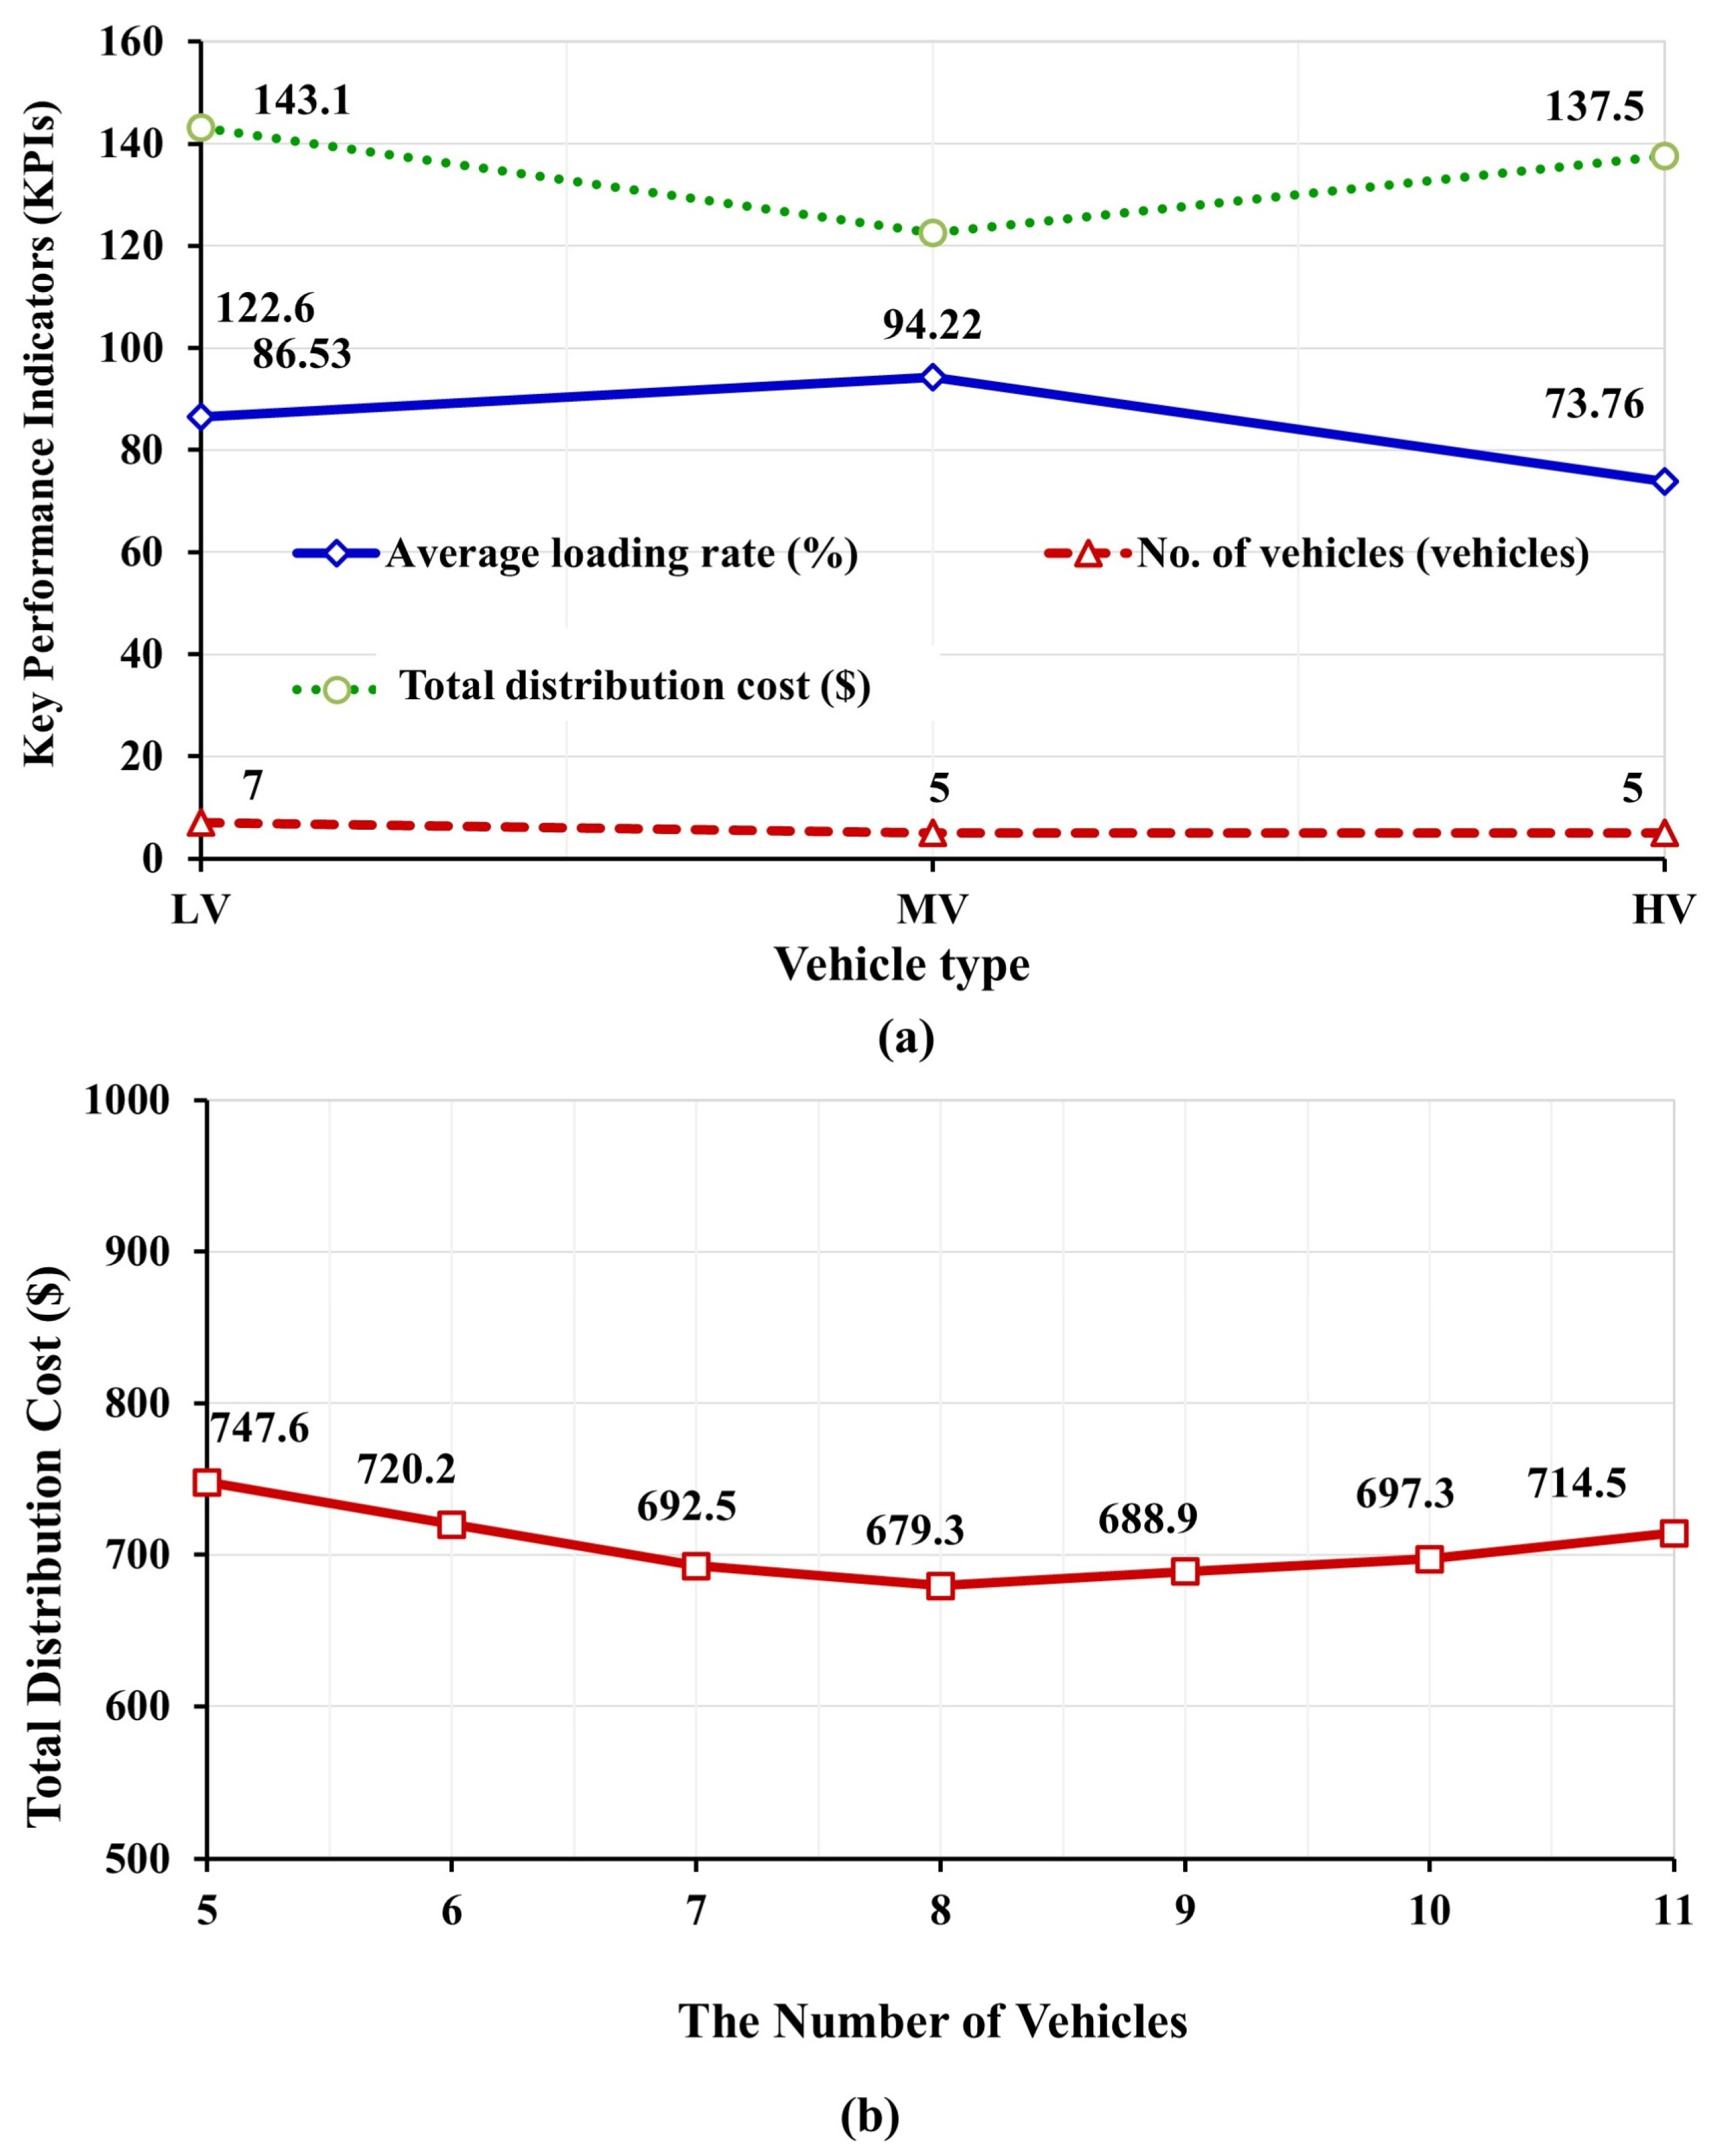
Impact of different vehicle configurations on average loading rate: As depicted by the blue line in
Figure 7a, the mediumweight vehicles, owing to their higher maximum load capacity, could carry more materials per distribution, resulting in the highest average loading rate (94.22%). In contrast, although the heavy vehicles had a larger load capacity, their loading rate was lower (73.76%) when carrying the same quantity of materials. The average loading rate for the lightweight vehicles (86.53%) fell between that of the mediumweight and heavyweight vehicles.
Impact of different vehicle configurations on the number of vehicles required: As indicated by the red line in
Figure 7a, to meet the same material transportation needs, both medium- and heavyweight vehicle configurations required five vehicles each, whereas lightweight vehicles necessitated seven vehicles. This discrepancy is likely due to the load limitations of lightweight vehicles, necessitating more vehicles to complete the same distribution tasks.
Impact of different vehicle configurations on total distribution cost: As shown by the green line in
Figure 7a, lightweight vehicles, requiring more vehicles and trips for distribution, incurred the highest total cost (143.1). Mediumweight vehicles, with their efficient loading rates and fewer vehicle requirements, had the lowest total cost (122.6). The cost for heavyweight vehicles was between the two.
In summary, the results in
Figure 7a underscore the critical role of selecting suitable vehicle types to optimize the material distribution scheduling system. Under the conditions of this study, medium-weight vehicles demonstrated optimal performance due to their higher loading rates and lower total costs. Although lightweight vehicles had certain limitations in load capacity, they can still be a viable option under specific conditions. As for heavyweight vehicles, despite their lower load rates, they might be suitable in certain scenarios.
From this sensitivity analysis, valuable management insights can be derived:
Managers need to balance distribution costs and efficiency in logistics operations. The size of a vehicle’s payload impacts the overall material distribution scheduling system’s performance when the quantity of materials remains constant. Overly large payloads can lead to lower load rates, reduced vehicle utilization, and increased total costs. Conversely, excessively small payloads, despite improving average load rates, necessitate more vehicles, increasing maintenance costs. Therefore, the choice of mediumweight vehicles may help firms to strike an optimal balance between cost and efficiency while at the same time reducing their consumption of logistics resources, thus enhancing the economic and environmental sustainability of manufacturing companies.
Managers should consider the alignment of production modes with vehicle configurations. In high-volume production modes, where material demand is significant, using vehicles with larger payloads can better meet the high-volume material distribution requirements and reduce transportation costs. On the other hand, in multi-variety, low-volume production modes where materials vary but are relatively small in quantity, selecting vehicles with smaller payloads can better meet flexibility requirements and improve load rates.
Managers need to find a balance between flexibility and efficiency. High-volume production modes often prioritize efficiency, and therefore, using larger-payload vehicles can reduce costs. However, multi-variety, low-volume production modes prioritize flexibility, and thus, smaller-payload vehicles can better accommodate diverse material needs. In practice, managers must consider production demands, customer requirements, and the availability of logistics resources in their decision-making.
5.3.2. Scenario 2—Sensitivity Analysis of Different Vehicle Quantity Configurations
In the context of sustainable logistics management, an analysis was conducted based on distribution demand data for a specific production batch, considering different quantities of mediumweight distribution vehicles, ranging from 5 to 11 vehicles. This analysis aimed to find the optimal vehicle configuration to reduce carbon emissions and resource consumption while maintaining efficient logistics operations.
The results presented in
Figure 7b reveal a dynamic relationship between the total distribution cost and the number of mediumweight distribution vehicles, a relationship that shows three distinct phases:
High-cost phase with fewer vehicles: The stage where the number of vehicles was limited to five corresponded to the highest distribution cost, which peaked at 747.6. This was mainly attributed to the insufficiency of vehicles, burdening each vehicle with excessive transportation tasks and thereby necessitating frequent trips and escalating wear and tear as well as maintenance costs. Furthermore, a lack of sufficient vehicles may lead to an inability to meet material demands during peak periods, adversely impacting the overall efficiency of deliveries.
Cost reduction phase with moderate increase in vehicles: An increment in the number of vehicles to eight led to a significant drop in total costs, reaching the lowest point at 679.3. This suggests that a moderate increase in the vehicle count can effectively distribute the workload across each vehicle, diminishing the wear and tear and maintenance expenses while simultaneously enhancing distribution efficiency and avoiding extra costs associated with delayed material deliveries.
Cost increase phase with excessive vehicles: Further augmentation of the vehicle count to 11 paradoxically resulted in an uptick in total costs, elevating them to 724.5. This could be due to the escalated additional management costs, parking space constraints, and costs associated with vehicle idling, caused by an overabundance of vehicles.
The comprehensive analysis of
Figure 7b revealed a trend where total distribution costs initially decreased and then increased with the varying number of vehicles, underscoring the critical importance of optimal vehicle configuration in diminishing the total costs of the material distribution scheduling system. Under the parameters of this study, an optimal configuration of eight mediumweight distribution vehicles emerged as the most effective strategy. Both the scenarios of under-configuration and over-configuration of vehicles could lead to an unnecessary escalation in costs. An optimum number of vehicles is not only instrumental to efficiently managing resources and fuel expenses but also to ensuring the timely distribution of materials and the efficacy of logistics operations.
Crucial management insights can be drawn from this sensitivity analysis:
Managers need to strike a balance between penalty costs and idle costs. The number of distribution vehicles, under consistent vehicle types, affects the efficiency of the entire material distribution scheduling system. Having too few vehicles may lead to high penalty costs, whereas having too many vehicles can result in excess idle costs. Therefore, a balance needs to be struck between avoiding penalty costs and maximizing resource utilization. Managers should actively introduce advanced information technology and scheduling algorithms for real-time monitoring and intelligent decision-making to ensure that distribution vehicles meet demand without being underutilized while reducing environmental impacts.
Managers should dynamically and adaptively allocate logistics resources. When an enterprise faces consistent production demand, optimizing the number of vehicles can improve economic efficiency. However, in actual logistics operations, disruptions such as dynamic insertions or equipment failures may require an open, flexible scheduling system that can dynamically lease external logistics resources (such as vehicles) based on real-time demand, forming a flexible logistics resource pool that optimally allocates vehicle resources to adapt to various uncertainties. This flexibility not only improves logistics efficiency but also helps to reduce resource waste and environmental burdens.
5.3.3. Scenario 3—Sensitivity Analysis of Different Dynamic Distribution Demand Volumes
Different dynamic distribution demand quantities can challenge the logistics resources and scheduling strategy of the material distribution system while at the same time placing new demands on environmental sustainability. When adopting scheduling strategies, managers need to consider their environmental impacts in addition to cost and efficiency. Typical disruptions of a dynamic nature, such as increased demand and vehicle breakdowns, not only affect costs and efficiency but can also lead to increased energy consumption and carbon emissions. A representative dynamic scenario—the increase in demand—was analyzed in this section. The additional distribution demand began at time 60 and gradually increased in increments of 10, reaching light dynamic (LD, 10), moderate dynamic (MD, 20), and heavy dynamic (HD, 30). The distribution time for all additional demands was set at 240.
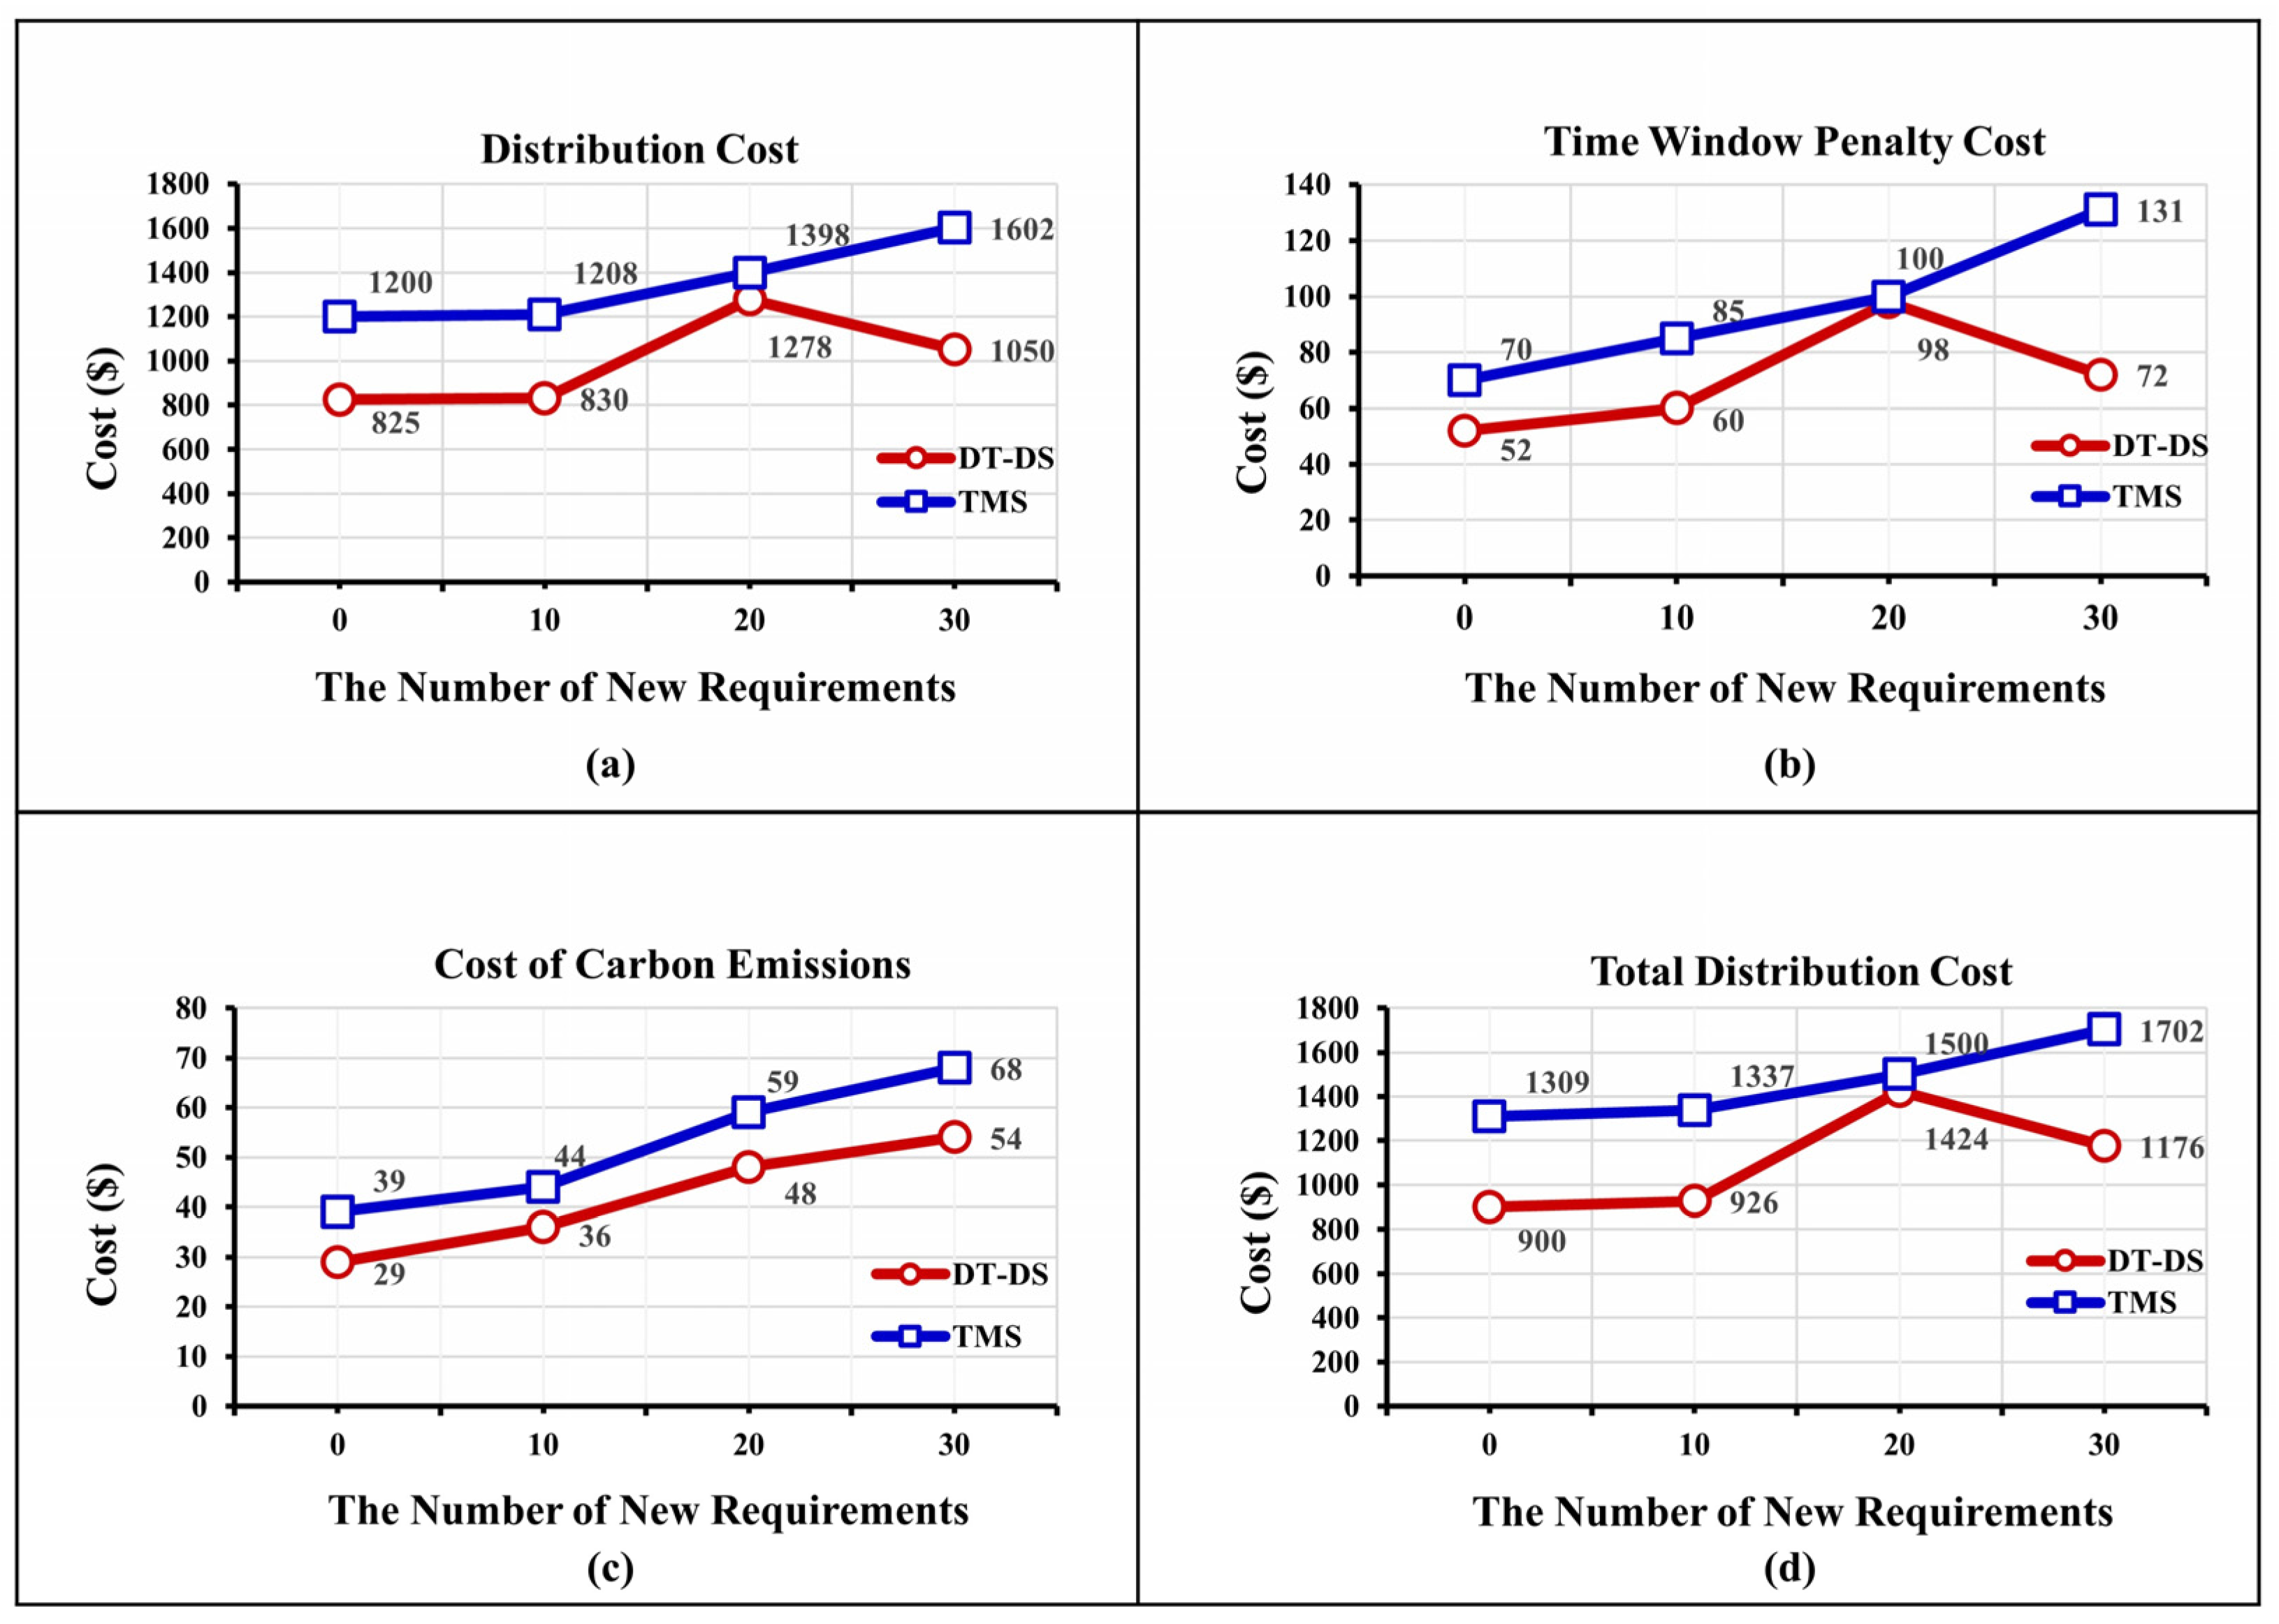
Figure 8 shows the results of a sensitivity analysis under varying dynamic material distribution demands, comparing the cost-control performance of the DT-DS strategy with the TMS strategy. The findings reveal key insights:
Under the TMS strategy, as material transportation demands increased, distribution costs escalated from 1200 to 1602, reflecting an increase in transportation frequency due to heightened demand and subsequently increasing the distribution costs. The cost of failing to meet distribution time windows climbed from 70 to 131, indicating the vehicles’ inability to effectively meet time constraints, leading to higher penalty costs. Carbon emission costs increased from 39 to 68, signifying an increase in vehicle emissions due to more frequent material transportation. Consequently, the total distribution cost under the TMS strategy also rose from 1309 to 1702.
In contrast, under the DT-DS strategy, distribution costs gradually increased from 825 to 1050, showcasing a significant trend of cost reduction and demonstrating the DT-DS strategy’s efficacy in controlling distribution costs. Costs related to time window penalties initially rose from 52 to 98 and then dropped to 72, showing improved adaptability to time window constraints. Although carbon emissions costs rose from 29 to 54, they remained significantly lower compared to with the TMS strategy, highlighting the DT-DS strategy’s advantage in reducing carbon emissions. The total distribution cost increased from 900 to 1424 before dropping to 1176, which was overall lower than with the TMS strategy, thereby underscoring the superior performance of the DT-DS strategy in managing demand fluctuations and overall cost control.
The analysis from
Figure 8 clearly demonstrates the significant advantages of the DT-DS strategy over the TMS strategy in terms of distribution costs, penalties for time window violations, carbon emissions, and overall distribution costs. Particularly when responding to demand variability, the DT-DS strategy exhibited higher adaptability and efficiency. These findings provide valuable insights for manufacturing enterprises in selecting material distribution scheduling strategies and offer effective solutions for achieving the dual objectives of cost-effectiveness and environmental sustainability.
From this sensitivity analysis, the following meaningful management insights can be derived:
Managers need to enhance control of planning execution and demand forecasting and management. The increase in demand volume is positively correlated with the total distribution costs. Therefore, businesses should improve the stability of production plan execution and accurately predict dynamic demand through advanced logistics operation management strategies and precise demand forecasting models while considering environmental impacts to mitigate the negative impacts of unstable demand on the system and the environment.
Managers should proactively adopt intelligent scheduling systems based on advanced technology. When faced with dynamic demand, employing dynamic scheduling strategies based on real-time information can effectively address various dynamic disruptions and, as a result, reduce various operational costs and environmental impacts. Furthermore, when internal resources are insufficient to meet dynamic demand, the timely introduction of flexible, high-quality, economical, and environmentally friendly external logistics resources ensures that the system can respond rapidly while reasonably controlling the usage costs of external resources to support sustainable business development.
6. Discussion
In the field of production logistics management, this study developed an innovative dynamic material distribution scheduling optimization model and strategy based on DT [
9]. Compared to traditional material distribution models in the existing literature [
13,
14,
15,
32], our model not only considers the economic and environmental sustainability indicators of the material distribution system but also implements an integrated system of real-time operational data and data-driven dynamic decision-making and execution control through a DT-based dynamic material distribution scheduling optimization framework. This provides crucial support for manufacturing enterprises at the initial stage of informatization to implement sustainable intelligent decision-making. Additionally, this research is the first to apply an IACO algorithm to the field of material distribution scheduling optimization, significantly enhancing the efficiency of path selection and pheromone updating [
26,
28]. Numerical experiments with cooperating enterprises showed that the proposed DT-DS strategy significantly outperformed the TMS strategy in reducing distribution costs, delay penalties, carbon emissions costs, and overall distribution costs. This strategy enhances material distribution efficiency and reduces environmental impact, offering new solutions for the field of sustainable material distribution scheduling.
Despite the achievements in theoretical models and practical applications, this research has certain limitations. Firstly, the material distribution scheduling optimization model lacks in-depth analysis of decision-making details in the production phase, which may limit its effectiveness in complex production processes. Secondly, the model’s description of utilizing multi-source real-time data is not detailed enough, limiting its potential in data-driven decision-making. Moreover, the model’s universal applicability may be limited, as it primarily relies on data from specific enterprises.
Future research can further focus on the following aspects: (1) Integration of material distribution and final assembly production: Delve deeper into how to more closely integrate final assembly production with material distribution scheduling, achieving real-time collaborative decision-making and control for “material distribution–final assembly production”, thereby enhancing the efficiency and effectiveness of the overall production logistics system. (2) Mining and analysis of manufacturing big data: Explore how to effectively utilize real-time data from various sources, particularly in a big data environment, to enhance the accuracy and timeliness of intelligent decision-making solutions in intelligent manufacturing workshops. (3) Generalization and validation of the optimization model: Expand the research scope to include manufacturing enterprises with different production modes and validate the universality and adaptability of the optimization model.
The model and strategies proposed in this study have significant practical implications for the logistics management practices of manufacturing enterprises. With the model proposed in this study, manufacturing enterprises can more effectively respond to dynamic changes in logistics operations, optimize logistics resource allocation, and consider environmental impacts. This facilitates enhancing production efficiency while advancing manufacturing systems towards sustainable development. Especially in the context of current global environmental challenges and resource pressures, the solutions provided by this research are of great significance in promoting green production and sustainable development in enterprise manufacturing systems.
7. Conclusions
In the context of the continuous global pursuit of sustainable manufacturing, this study successfully explores and demonstrates the great potential of digital twin technology for application in modern industrial environments, especially in the optimization of material distribution scheduling in the smart shop floor of manufacturing companies. The study encompasses, firstly, the establishment of a material distribution optimization model that comprehensively considers distribution costs, penalty costs, and carbon emission costs, and secondly, the proposal of a DT-based material distribution scheduling optimization decision framework, along with a detailed description of its system components and operational mechanisms. Additionally, this research introduces a DT-based dynamic material distribution scheduling optimization strategy to address disturbances in logistics execution and designs an improved ant colony algorithm to enhance the precision and speed of intelligent algorithms. Numerical experiment results indicate that our proposed DT-DS strategy showed significant advantages in a dynamic operational environment, reducing distribution costs, delay penalties, and carbon emissions while increasing material distribution efficiency and loading rates, which can be simultaneously economically and environmentally sustainable.
This research not only enhances the real-time visibility and transparency of the material distribution process but also provides new insights into dynamic material distribution decision-making within sustainable manufacturing. The main contributions include (1) extending the standard digital twin control architecture and proposing a novel DT-based dynamic material distribution scheduling optimization decision framework oriented towards mixed-flow assembly workshops. This framework employs a “cloud–edge” computing architecture, augmenting the system’s ability to process and respond to dynamic, complex real-time data and thereby enhancing the overall performance of the material distribution scheduling system. (2) Developing a DT-based dynamic material distribution scheduling optimization strategy and supporting dynamic adjustments of the material distribution scheduling system in various disruptive environments. (3) Constructing a comprehensive material distribution scheduling optimization model considering distribution costs, workstation satisfaction, and carbon emissions that balances economic and environmental sustainability indicators. (4) Improving the ant colony algorithm, enhancing the efficiency of path node selection probabilities and pheromone update rules, and validating the algorithm’s solution accuracy, speed, and stability through comparative experiments. (5) Testing the application effectiveness of the proposed decision framework, dynamic scheduling strategy, optimization model, and algorithm through case studies with cooperating enterprises, providing useful references for similar manufacturing enterprises in material distribution scheduling optimization.
Future research, building on the outcomes of this study, plans to explore the following directions: (1) conducting in-depth analysis and organization of material distribution scheduling needs of different types of manufacturing enterprises, summarizing dynamic material distribution scheduling strategies and optimization models to form more general research results, and refining the decision framework presented in this paper. (2) Expanding research scope to the final assembly production phase, which is closely related to material distribution, and exploring synchronous decision-making of “material distribution–final assembly production” in real-time information environments, which would further enrich and perfect the theoretical system and practical applications in this field to continually drive the development of sustainable manufacturing.
Author Contributions
Conceptualization, Z.Z. and T.Q.; supervision, T.Q., K.Z. (Kuo Zhao) and G.Q.H.; validation, Z.Z.; writing—original draft, Z.Z.; writing—review and editing, T.Q., K.Z. (Kuo Zhao), K.Z. (Kai Zhang), L.L., J.W. and Y.Z. All authors have read and agreed to the published version of the manuscript.
Funding
This research was funded by the National Natural Science Foundation of China (52375498), the National Key Research and Development Program of China (2021YFB3301701), the 2019 Guangdong Special Support Talent Program—Innovation and Entrepreneurship Leading Team (China) (2019BT02S593), the 2018 Guangzhou Leading Innovation Team Program (China) (201909010006), the Science and Technology Development Fund (Macau SAR) (0078/2021/A), the Guangdong Basic and Applied Basic Research Foundation (No. 2023A1515011712), and the Outstanding Innovative Talents Cultivation Funded Programs for Doctoral Students of Jinan University (No. 2022CXB030).
Institutional Review Board Statement
Not applicable.
Informed Consent Statement
Not applicable.
Data Availability Statement
The experimental data in this paper were obtained from a well-known air-conditioner manufacturer in China. The actual data were modified to some extent to protect their trade secrets. Some relevant data used in the case study of this paper are detailed in
Appendix A.
Acknowledgments
We also appreciate the sponsorships from the industry, including but not limited to Carpoly Chemical Group Co., Ltd.; Guangzhou Ink Stone Technology, Inc.; Sendwant Logistic Ltd.; Zhuhai Top Cloud Tech Co., Ltd.; and the Guangdong International Cooperation Base of Science and Technology for GBA Smart Logistics by the Department of science and technology of Guangdong Province, thanks to which the international collaboration was effectively conducted.
Conflicts of Interest
Author Jun Wang was employed by the company Guangdong Sanpu Garage Shares Co., Ltd. The remaining authors declare that the research was conducted in the absence of any commercial or financial relationships that could be construed as a potential conflict of interest.
Appendix A
The tables specifically show the relevant symbols and data for this article.
Table A1.
Symbols used in the proposed model.
Table A1.
Symbols used in the proposed model.
| Symbol | Description |
|---|
| I | The set of points representing workstation buffer areas, including n workstations and a material distribution center (i = 0), I |
| The number of distribution AGVs, K |
| Q | Maximum load capacity of each AGV |
| F | A very large positive number |
| Distance from station to station |
| Quantity of materials required at workstation , with |
| The earliest time materials are required at workstation |
| The latest time materials are required at workstation |
| Penalty cost per unit time for early arrival of materials at workstation |
| Transport cost per unit distance for distribution AGVs |
| Fixed start-up cost for each distribution AGV |
| Cost per unit of carbon emissions |
| Penalty cost per unit of time for material delivered earlier than the time window |
| Penalty cost per unit of time for material delivered later than the time window |
| Travel time for a distribution AGV to move from workstation to |
| Unloading time of the kth distribution AGV at workstation |
| Moment of the arrival of the kth distribution AGV at workstation i |
| Power consumption per unit distance |
| Distribution AGV transportation distance from station i to station j |
| Battery charging efficiency |
| Carbon emissions factor in the production of electrical energy |
| Binary variable, 1, workstation i is serviced by the kth AGV; 0, otherwise |
| Binary variable, 1, the kth distribution AGV traveling from workstation to workstation ; 0, otherwise |
Table A2.
Vehicle-related data and basic parameters of the ant colony algorithm.
Table A2.
Vehicle-related data and basic parameters of the ant colony algorithm.
| Symbol | Parameter Name | Value | Unit |
|---|
| Number of workstation buffer zones | 40 | / |
| Q | Maximum load capacity of the AGV | 180 | Kg |
| Penalty cost per unit time window for material delivery AGV to station i | 0.5 | USD/s |
| Distribution cost per unit distance of the AGV | 0.1 | USD/m |
| Fixed start-up cost of a single AGV | 5 | USD/vehicle/times |
| Cost per unit of carbon emissions borne | 0.15 | USD/kg |
| Power consumption per unit distance for AGVs | 0.2 | kWh/km |
| Battery charging efficiency | 0.05 | kWh/min |
| Carbon emissions factor in the production of electrical energy | 0.624 | kg(CO2)/kg |
| Number of ants | 20 | Individuals |
| α | Pheromone factor | 1 | / |
| β | Heuristic function factor | 3 | / |
| ρ | Pheromone volatilization factor | 0.25 | / |
| Maximum number of iterations | 100 | / |
Table A3.
Material distribution center and coordinates of each workstation.
Table A3.
Material distribution center and coordinates of each workstation.
| No. | X | Y | No. | X | Y |
|---|
| 0 | 5 | 20 | 17 | 25 | 20 |
| 1 | 15 | 4 | 18 | 25 | 29 |
| 2 | 15 | 8 | 19 | 25 | 34 |
| 3 | 15 | 17 | 20 | 29 | 34 |
| 4 | 15 | 24 | 21 | 29 | 31 |
| 5 | 15 | 30 | 22 | 29 | 23 |
| 6 | 15 | 34 | 23 | 29 | 16 |
| 7 | 19 | 36 | 24 | 29 | 9 |
| 8 | 19 | 32 | 25 | 29 | 5 |
| 9 | 19 | 26 | 26 | 27 | 2 |
| 10 | 19 | 20 | 27 | 35 | 7 |
| 11 | 19 | 16 | 28 | 35 | 11 |
| 12 | 19 | 10 | 29 | 35 | 20 |
| 13 | 18 | 2 | 30 | 35 | 25 |
| 14 | 25 | 4 | 31 | 35 | 31 |
| 15 | 25 | 8 | 32 | 35 | 33 |
| 16 | 25 | 13 | | | |
Table A4.
The time window for material requirements and their unloading times.
Table A4.
The time window for material requirements and their unloading times.
| Workstation No. | Expected Earliest Time (s) | Expected Latest Time (s) | Distribution Quantity (kg) | Unloading Time (s) |
|---|
| 1 | 70 | 180 | 25 | 15 |
| 2 | 250 | 355 | 33 | 20 |
| 3 | 125 | 225 | 30 | 20 |
| 4 | 195 | 310 | 25 | 15 |
| 5 | 200 | 295 | 36 | 15 |
| 6 | 58 | 170 | 20 | 20 |
| 7 | 152 | 250 | 18 | 15 |
| 8 | 90 | 188 | 30 | 20 |
| 9 | 138 | 250 | 15 | 25 |
| 10 | 180 | 280 | 35 | 15 |
| 11 | 108 | 200 | 20 | 15 |
| 12 | 45 | 160 | 20 | 15 |
| 13 | 215 | 330 | 25 | 20 |
| 14 | 145 | 250 | 30 | 25 |
| 15 | 89 | 200 | 35 | 20 |
| 16 | 140 | 238 | 30 | 30 |
| 17 | 95 | 210 | 28 | 25 |
| 18 | 238 | 360 | 23 | 20 |
| 19 | 20 | 138 | 19 | 20 |
| 20 | 178 | 280 | 31 | 15 |
| 21 | 195 | 298 | 38 | 20 |
| 22 | 265 | 370 | 28 | 25 |
| 23 | 144 | 256 | 22 | 15 |
| 24 | 239 | 350 | 30 | 15 |
| 25 | 95 | 195 | 18 | 20 |
| 26 | 102 | 205 | 26 | 20 |
| 27 | 225 | 330 | 29 | 25 |
| 28 | 75 | 185 | 19 | 20 |
| 29 | 100 | 205 | 25 | 15 |
| 30 | 250 | 350 | 35 | 20 |
| 31 | 150 | 265 | 32 | 25 |
| 32 | 130 | 240 | 18 | 20 |
References
- Pozzi, R.; Rossi, T.; Secchi, R. Industry 4.0 technologies: Critical success factors for implementation and improvements in manufacturing companies. Prod. Plan. Control 2023, 34, 139–158. [Google Scholar] [CrossRef]
- Stroumpoulis, A.; Kopanaki, E. Theoretical perspectives on sustainable supply chain management and digital transformation: A literature review and a conceptual framework. Sustainability 2022, 14, 4862. [Google Scholar] [CrossRef]
- Ching, N.T.; Ghobakhloo, M.; Iranmanesh, M.; Maroufkhani, P.; Asadi, S. Industry 4.0 applications for sustainable manufacturing: A systematic literature review and a roadmap to sustainable development. J. Clean Prod. 2022, 334, 130133. [Google Scholar] [CrossRef]
- Qu, T.; Lei, S.P.; Wang, Z.Z.; Nie, D.X.; Chen, X.; Huang, G.Q. IoT-based real-time production logistics synchronization system under smart cloud manufacturing. Int. J. Adv. Manuf. Technol. 2016, 84, 147–164. [Google Scholar] [CrossRef]
- Tao, F.; Zhang, H.; Liu, A.; Nee, A.Y. Digital twin in industry, state-of-the-art. IEEE Trans. Ind. Inform. 2018, 15, 2405–2415. [Google Scholar] [CrossRef]
- Zhong, R.Y.; Xu, X.; Klotz, E.; Newman, S.T. Intelligent manufacturing in the context of industry 4.0: A review. Engineering 2017, 3, 616–630. [Google Scholar] [CrossRef]
- Shao, S.; Xu, G.; Li, M. The design of an IoT-based route optimization system: A smart product-service system (SPSS) approach. Adv. Eng. Inform. 2019, 42, 101006. [Google Scholar] [CrossRef]
- Zhang, Y.; Ren, S.; Liu, Y.; Si, S. A big data analytics architecture for cleaner manufacturing and maintenance processes of complex products. J. Clean Prod. 2017, 142, 626–641. [Google Scholar] [CrossRef]
- Liu, L.; Guo, K.; Gao, Z.; Li, J.; Sun, J. Digital twin-driven adaptive scheduling for flexible job shops. Sustainability 2022, 14, 5340. [Google Scholar] [CrossRef]
- Lei, N. Intelligent logistics scheduling model and algorithm based on Internet of Things technology. Alex. Eng. J. 2022, 61, 893–903. [Google Scholar] [CrossRef]
- Yao, F.; Alkan, B.; Ahmad, B.; Harrison, R. Improving just-in-time delivery performance of IoT-enabled flexible manufacturing systems with AGV based material transportation. Sensors 2020, 20, 6333. [Google Scholar] [CrossRef] [PubMed]
- Kaoud, E.; Heshmat, M.; El-Sharief, M.A.; El-Sebaie, M.G. Scheduling of automated guided vehicles and machines in flexible manufacturing systems: A simulation study. Int. J. Ind. Syst. Eng. 2020, 35, 372–387. [Google Scholar] [CrossRef]
- Farooq, B.; Bao, J.; Raza, H.; Sun, Y.; Ma, Q. Flow-shop path planning for multi-automated guided vehicles in intelligent textile spinning cyber-physical production systems dynamic environment. J. Manuf. Syst. 2021, 59, 98–116. [Google Scholar] [CrossRef]
- Vlachos, I.; Pascazzi, R.M.; Ntotis, M.; Spanaki, K.; Despoudi, S.; Repoussis, P. Smart and flexible manufacturing systems using autonomous guided vehicles (AGVs) and the Internet of Things (IoT). Int. J. Prod. Res. 2022, 1–22. [Google Scholar] [CrossRef]
- Monek, G.D.; Fischer, S. IIoT-Supported Manufacturing-Material-Flow Tracking in a DES-Based Digital-Twin Environment. Infrastructures 2023, 8, 75. [Google Scholar] [CrossRef]
- Haghnegahdar, L.; Joshi, S.S.; Dahotre, N.B. From IoT-based cloud manufacturing approach to intelligent additive manufacturing: Industrial Internet of Things—An overview. Int. J. Adv. Manuf. Technol. 2022, 119, 1461–1478. [Google Scholar] [CrossRef]
- Li, F.; Li, T. Intelligent logistics Enterprise management based on the Internet of things. Math. Probl. Eng. 2022, 2022, 1621082. [Google Scholar] [CrossRef]
- Qing, C. Vehicle scheduling model of emergency logistics distribution based on internet of things. Int. J. Appl. Decis. Sci. 2018, 11, 36–54. [Google Scholar] [CrossRef]
- Ren, P.; Nie, M.; Ming, H. Optimization of sports good recycling management system based on Internet of Things. Wirel. Commun. Mob. Com. 2021, 2021, 6415136. [Google Scholar] [CrossRef]
- Zhang, K.; Qu, T.; Zhou, D.; Jiang, H.; Lin, Y.; Li, P.; Huang, G.Q. Digital twin-based opti-state control method for a synchronized production operation system. Robot. Comput.-Integr. Manuf. 2020, 63, 101892. [Google Scholar] [CrossRef]
- Wang, Y.; Wu, Z. Model construction of planning and scheduling system based on digital twin. Int. J. Adv. Manuf. Technol. 2020, 109, 2189–2203. [Google Scholar] [CrossRef]
- Feng, B.; Ye, Q. Operations management of smart logistics, A literature review and future research. Front. Eng. Manag. 2021, 8, 344–355. [Google Scholar] [CrossRef]
- Fang, Y.; Peng, C.; Lou, P.; Zhou, Z.; Hu, J.; Yan, J. Digital-twin-based job shop scheduling toward smart manufacturing. IEEE Trans. Ind. Inform. 2019, 15, 6425–6435. [Google Scholar] [CrossRef]
- Pasha, J.; Nwodu, A.L.; Fathollahi-Fard, A.M.; Tian, G.; Li, Z.; Wang, H.; Dulebenets, M.A. Exact and metaheuristic algorithms for the vehicle routing problem with a factory-in-a-box in multi-objective settings. Adv. Eng. Inform. 2022, 52, 101623. [Google Scholar] [CrossRef]
- Hu, Y.; Yang, H.; Huang, Y. Conflict-free scheduling of large-scale multi-load AGVs in material transportation network. Transp. Res. Pt. E-Logist. Transp. Rev. 2022, 158, 102623. [Google Scholar] [CrossRef]
- Klenk, E.; Galka, S.; Günthner, W.A. Operating strategies for in-plant milk-run systems. IFAC-PapersOnLine 2015, 48, 1882–1887. [Google Scholar] [CrossRef]
- Tao, Q.; Sang, H.; Guo, H.; Wang, P. Improved particle swarm optimization algorithm for AGV path planning. IEEE Access 2021, 9, 33522–33531. [Google Scholar]
- Wang, Y.; Wang, X.; Guan, X.; Li, Q.; Fan, J.; Wang, H. A combined intelligent and game theoretical methodology for collaborative multicenter pickup and delivery problems with time window assignment. Appl. Soft. Comput. 2021, 113, 107875. [Google Scholar] [CrossRef]
- Chaudhry, I.; Rafique, A.; Elbadawi, I.; Aichouni, M.; Usman, M.; Boujelbene, M.; Boudjemline, A. Integrated scheduling of machines and automated guided vehicles (AGVs) in flexible job shop environment using genetic algorithms. Int. J. Ind. Eng. Comput. 2022, 13, 343–362. [Google Scholar] [CrossRef]
- Chen, T.; Chen, S.; Zhang, K.; Qiu, G.; Li, Q.; Chen, X. A jump point search improved ant colony hybrid optimization algorithm for path planning of mobile robot. Int. J. Adv. Robot. Syst. 2022, 19, 17298806221127953. [Google Scholar] [CrossRef]
- Emde, S.; Gendreau, M. Scheduling in-house transport vehicles to feed parts to automotive assembly lines. Eur. J. Oper. Res. 2016, 260, 255–267. [Google Scholar] [CrossRef]
- Lyu, X.; Song, Y.; He, C.; Lei, Q.; Guo, W. Approach to integrated scheduling problems considering optimal number of automated guided vehicles and conflict-free routing in flexible manufacturing systems. IEEE Access 2019, 7, 74909–74924. [Google Scholar] [CrossRef]
- Liu, L.; Qu, T.; Thürer, M.; Ma, L.; Zhang, Z.; Yuan, M. A new knowledge-guided multi-objective optimisation for the multi-AGV dispatching problem in dynamic production environments. Int. J. Prod. Res. 2023, 61, 6030–6051. [Google Scholar] [CrossRef]
- Kang, X.; Nie, H.; Gao, M.; Wu, F. Carbon emissions from electric vehicle life cycle. Energy Storage Sci. Technol. 2023, 12, 976–984. [Google Scholar]
- Han, Y.; Wang, X.S.; Zhang, Z.; Zhang, H.N. Multi-objective optimization of geometric parameters for the helically coiled tube using Markowitz optimization theory. Energy 2020, 192, 116567. [Google Scholar] [CrossRef]
- Boothroyd, G. Design for Excellence. J. Manuf. Syst. 1996, 15, 443. [Google Scholar] [CrossRef]
- Li, H.; Wang, X.; Liu, Y.; Liu, G.; Zhai, Z.; Yan, X.; Zhang, Y. A novel robotic-vision-based defect inspection system for bracket weldments in a cloud–edge coordination environment. Sustainability 2023, 15, 10783. [Google Scholar] [CrossRef]
- Tao, F.; Liu, W.; Zhang, M.; Hu, T.L.; Qi, Q.; Zhang, H.; Huang, Z. Five-dimension digital twin model and its ten applications. Comput. Integr. Manuf. Syst. 2019, 25, 1–18. [Google Scholar]
- Zhou, Z.; Xu, L.; Ling, X.; Zhang, B. Digital-twin-based job shop multi-objective scheduling model and strategy. Int. J. Comput. Integr. Manuf. 2023, 1–21. [Google Scholar] [CrossRef]
| Disclaimer/Publisher’s Note: The statements, opinions and data contained in all publications are solely those of the individual author(s) and contributor(s) and not of MDPI and/or the editor(s). MDPI and/or the editor(s) disclaim responsibility for any injury to people or property resulting from any ideas, methods, instructions or products referred to in the content. |
© 2023 by the authors. Licensee MDPI, Basel, Switzerland. This article is an open access article distributed under the terms and conditions of the Creative Commons Attribution (CC BY) license (https://creativecommons.org/licenses/by/4.0/).


 ,
, 