Article

Automatic Plastic Greenhouse Extraction from Gaofen-2 Satellite Images with Fully Convolution Networks and Image Enhanced Index

1
Key Laboratory of Urban Land Resources Monitoring and Simulation, Ministry of Natural Resources, Shenzhen 518034, China
2
Guangdong Provincial Key Laboratory of Intelligent Urban Security Monitoring and Smart City Planning, Guangzhou 510290, China
3
School of Geography and Remote Sensing, Guangzhou University, Guangzhou 510006, China
4
School of Environmental Science and Engineering, Southern University of Science and Technology, Shenzhen 518055, China
*
Authors to whom correspondence should be addressed.
Sustainability 2023, 15(23), 16537; https://doi.org/10.3390/su152316537
Submission received: 22 August 2023 / Revised: 24 November 2023 / Accepted: 28 November 2023 / Published: 4 December 2023
(This article belongs to the Section Sustainability in Geographic Science)

Abstract

:
Plastic greenhouses (PGs) play a vital role in modern agricultural development by providing a controlled environment for the cultivation of food crops. Their widespread adoption has the potential to revolutionize agriculture and impact the local environment. Accurate mapping and estimation of PG coverage are critical for strategic planning in agriculture. However, the challenge lies in the extraction of small and densely distributed PGs; this is often compounded by issues like irrelevant and redundant features and spectral confusion in high-resolution remote-sensing imagery, such as Gaofen-2 data. This paper proposes an innovative approach that combines the power of a full convolutional network (FC-DenseNet103) with an image enhancement index. The image enhancement index effectively accentuates the boundary features of PGs in Gaofen-2 satellite images, enhancing the unique spectral characteristics of PGs. FC-DenseNet103, known for its robust feature propagation and extensive feature reuse, complements this by addressing challenges related to feature fusion and misclassification at the boundaries of PGs and adjacent features. The results demonstrate the effectiveness of this approach. By incorporating the image enhancement index into the DenseNet103 model, the proposed method successfully eliminates issues related to the fusion and misclassification of PG boundaries and adjacent features. The proposed method, known as DenseNet103 (Index), excels in extracting the integrity of PGs, especially in cases involving small and densely packed plastic sheds. Moreover, it holds the potential for large-scale digital mapping of PG coverage. In conclusion, the proposed method providing a practical and versatile tool for a wide range of applications related to the monitoring and evaluation of PGs, which can help to improve the precision of agricultural management and quantitative environmental assessment.

1. Introduction

Ever since the advent of the first plastic-sheet-covered greenhouses in the 1950s [1,2,3], this innovation has drastically transformed global agriculture, significantly enhancing the quality and volume of crops. According to estimates, there were over 30,000 square kilometers of PGs in existence in 2016 [4]. A PG is a type of structure made of transparent plastic material that allows for the artificial control of temperature, humidity, lighting, and other factors within the greenhouse [5,6,7,8]; this can create an ideal growing environment for plants, allowing for the cultivation of seasonal fruits and vegetables at different times of the year [9]. Therefore, PGs are often used as the base for intensive vegetable production and are widely distributed in urban areas [2]. They serve as the primary source of fresh vegetables for urban residents. The mapping and monitoring of the coverage of PGs are of great significance for estimating vegetable production, strategic planning of agricultural development, macroeconomic vegetable price regulation, and environmental impact research [10].
Remote-sensing (RS) imagery is widely used for PGs’ mapping and monitoring, as it can provide spatial and temporal information on the distribution of PGs, such as extracting it from medium- [2,11,12,13] or high-resolution remote-sensing imagery [14,15,16]. Compared with medium-resolution remote-sensing imagery, high-resolution remote-sensing imagery can provide more detailed information on the shape, area, texture structure, and number of PG objects and is thus more suitable for the accurate identification and extraction of PGs [3]. Numerous methods have been employed to map plastic greenhouses (PGs) using high-resolution remote-sensing imagery, including object-based classification and semi-supervised machine learning approaches such as support vector machine (SVM) [17], random forest (RF) [17], and decision tree (DT) classifiers [18]. However, these traditional methods often face challenges when it comes to accurately delineating the fine boundaries of PGs [19,20].
In recent years, deep learning techniques [21], particularly deep convolutional neural networks (CNNs) [22,23], have been widely utilized in various fields, including semantic segmentation [24] and object detection [25] of remote-sensing images. CNNs can automatically and efficiently extract hierarchical features from initial inputs, surpassing traditional methods in many vision tasks [26,27]. Semantic segmentation, which is a pixel-level classification task that aims to assign each pixel to a component class, has rapidly advanced since the introduction of fully convolutional networks (FCNs) [28,29]. Several state-of-the-art (SOTA) semantic segmentation frameworks, including Unet [30,31], SegNet [32], PSPNet [33], and the DeepLab family [34], have been proposed based on FCN to enhance the segmentation performance. Many researchers use FCN-based methods to perform semantic segmentation and land-use classification in remote-sensing images. For example, Song Tingqiang et al. proposed an improved multi-temporal semantic segmentation model (MSSN) for PGs’ extraction using Gaofen-2 (GF-2) data, targeting seasonal effects on vegetable plastic greenhouses and the problem of spatial information loss [35]. Shi Wenxi et al. proposed an automatic identification method for plastic greenhouses based on ResNet and transfer learning [36], which applied weights obtained from the ImageNet image dataset to ResNet, improving the accuracy compared to methods such as SVM. Although previous related studies have achieved certain effectiveness in the extraction of PGs, the issue of fusion and misclassification between the boundaries of PGs and adjacent features remains, especially in areas where sheds are small and dense.
In this paper, the objective is to explore a method for effectively extracting PGs, which ensures the integrity of the extracted boundaries, especially for small and densely packed PGs. To achieve this goal, we took the following steps: (1) Presenting an image enhancement index for GF-2 satellite images, aimed at effectively enhancing the boundary features of PG objects; (2) Integrating the full convolutional network (FC-DenseNet103) with the image enhancement index to extract PGs from satellite images. The FC-DenseNet103 offers strong feature propagation capabilities and reuses a large number of critical features. Mapping and monitoring PG coverage are of paramount significance for estimating vegetable production, strategic agricultural development, macroeconomic regulation of vegetable prices, and environmental impact research. This work contributes to the field of PG mapping, addressing the challenges associated with small, densely distributed PGs, thus aiding in these important aspects of agricultural and environmental management.

2. Materials and Methods

2.1. Study Areas

This paper selected two regions located within the Guangdong-Hong Kong-Macao Greater Bay Area (GBA) as the study area (as shown in Figure 1). Among them, the area used for model training is located in Doumen District, Zhuhai City, as shown in Figure 1 (c); the area used for model accuracy validation is located in Xinhui District, Jiangmen City, as shown in Figure 1 (b). These two regions are under a subtropical monsoon climate with weather characterized by abundant sunshine, ample heat, plenty of rainfall, and high humidity, all of which are favorable for agricultural production. The growth of crops requires specific seasons, suitable temperature, humidity, light, carbon dioxide concentration, etc. PGs can alleviate the limitations of the natural environment to some extent, thereby improving crop productivity. As a result, in the last few decades, PGs have become increasingly popular, covering approximately 20% of the total cultivated area. Based on the field survey, it was found that transparent plastics are the most commonly used materials for the roofing of PGs in Zhuhai City and Jiangmen City. They are important bases for intensive vegetable production in the Greater Bay Area and are closely related to the vegetable supply for urban residents in the Greater Bay Area.

2.2. Gaofen-2 Satellite Images

In this study, Gaofen-2 (GF-2) satellite images were used to construct a dataset for extraction of the PGs. The GF-2 satellite was launched on 19 August 2014, and the attributes of GF-2 are listed in Table 1. The GF-2 satellite has the advantages of high positioning accuracy, fast attitude maneuvering capability, large observation width, high radiation quality, high dynamic low-noise imaging, etc. Therefore, GF-2 satellite images are widely used in various fields at a large scale in China, including agricultural resource surveys, land-use changes, and environmental monitoring. The data product used in this study is a mosaic of cloud-free Gaofen-2 images acquired in multiple periods in 2017.

2.3. Methods

In the realm of deep learning models explored in this study, the initial emphasis is on the FC-DenseNet103 algorithm. FC-DenseNet103 stands out as a potent image segmentation tool, boasting a distinctive feature propagation capability and efficient reuse of numerous crucial features, thereby demonstrating its remarkable proficiency in target object extraction. Furthermore, the analysis extends to a comparative evaluation against other established algorithms, including Encoder Decoder, FRRN-B, SVM, and RF. In the following sections, this paper delves into the intricate workings of each algorithm, providing a detailed account of their respective parameter settings.

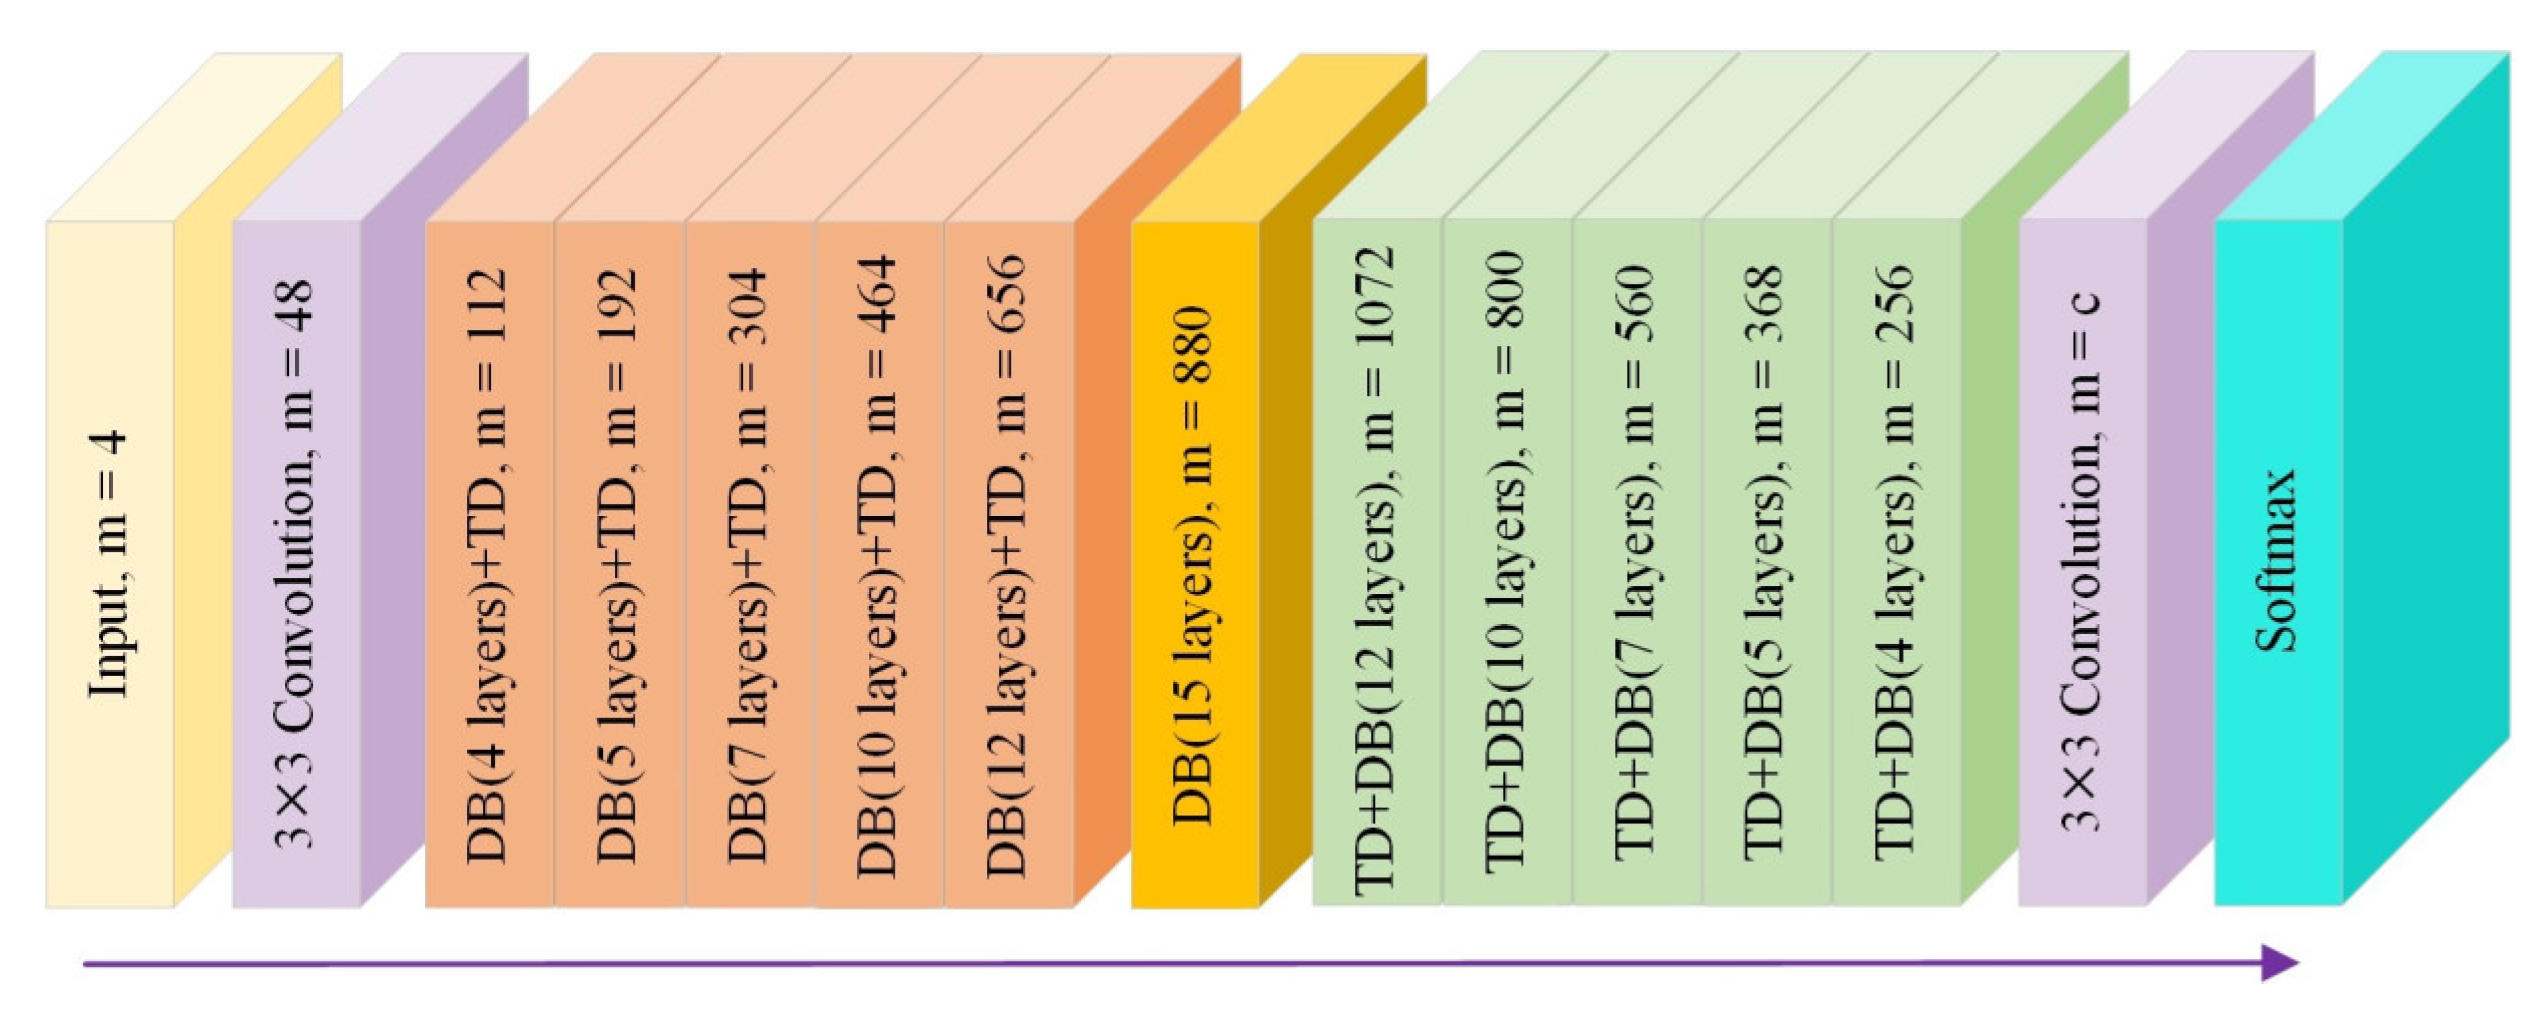
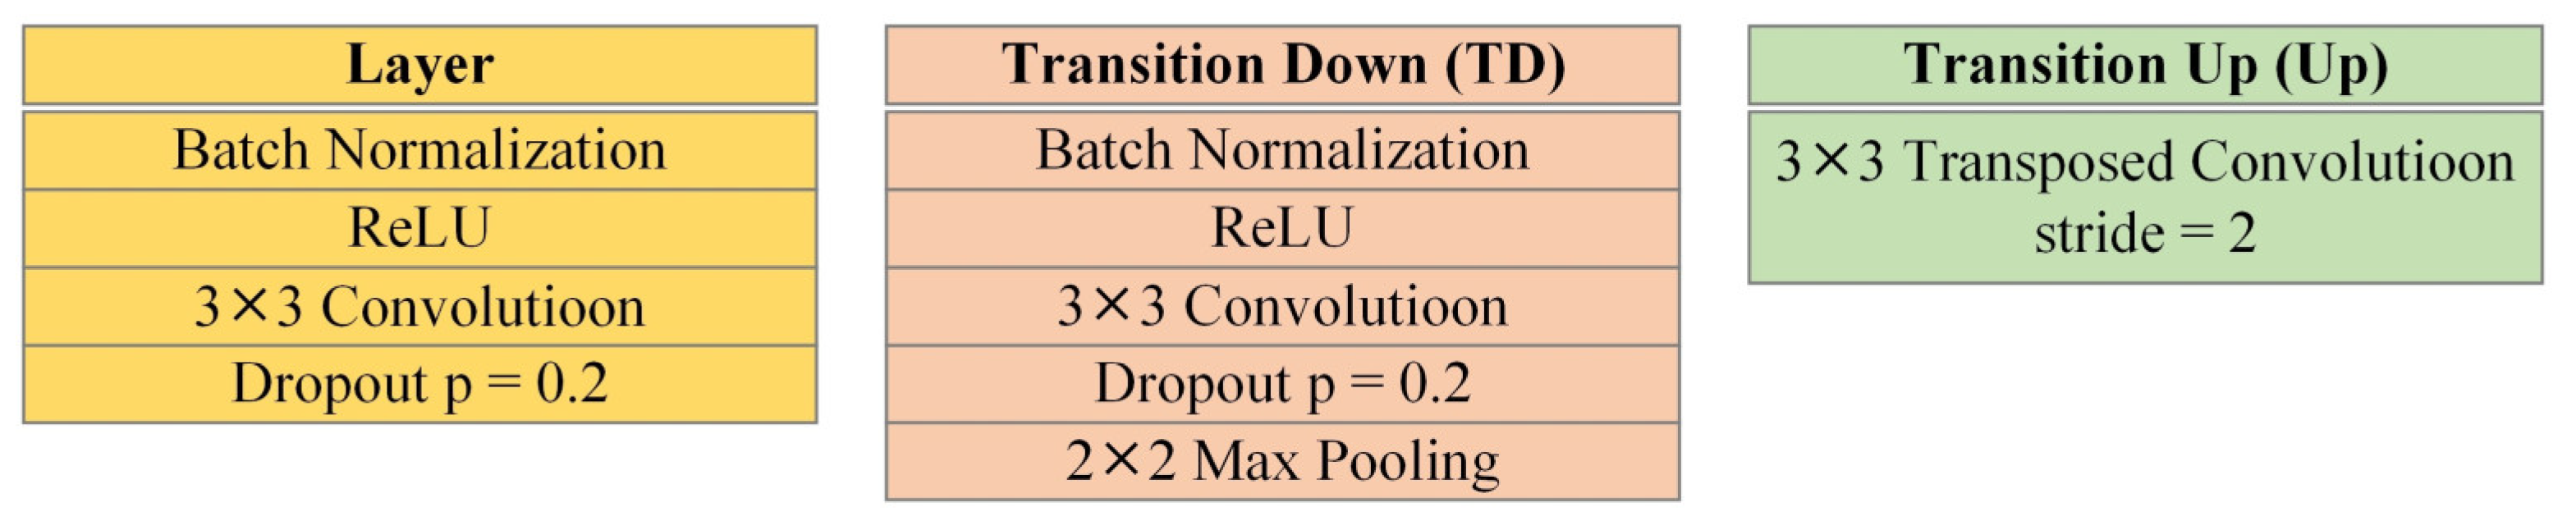
2.3.1. FC-DenseNet103

In this study, a method was proposed which combines a fully convolutional network (FC-DenseNet103) with an image enhancement index. The image enhancement index effectively accentuates the boundary features of plastic greenhouses (PGs) in high-resolution Gaofen-2 satellite images, enhancing the distinct band response characteristics of PGs. FC-DenseNet103, known for its robust feature propagation and the ability to reuse critical features extensively, forms the backbone of the proposed method. The results of this research indicate that incorporating the image enhancement index into the DenseNet103 model effectively mitigates issues related to the blending and misclassification of plastic greenhouse (PG) boundaries and adjacent features, ultimately enhancing the integrity of PG extraction. The proposed method leverages the synergy of image enhancement and deep learning techniques to tackle the challenges associated with plastic greenhouse (PG) extraction, leading to more accurate and refined results.
DenseNet is used not only for data classification but also for image super resolution and image segmentation. The advantages of DenseNet are the elimination of the gradient vanishing problem and enhanced feature propagation. A large number of features are multiplexed, which can effectively reduce the parameters of the model. The DenseNet network is designed with densely connected blocks, resulting in a narrower architecture with fewer parameters. This design optimizes the efficiency and effectiveness of feature transfer, allowing for more effective and complete utilization of features while reducing the issue of gradient disappearance. As a result, the network exhibits exceptional capability in feature extraction. Fully Convolutional DenseNet103 (FC-DenseNet103) [39] is an extension of a densely connected convolutional network (DenseNet) [40], which contains 103 convolutional layers. FC-DenseNet103 is primarily utilized for label-based feature extraction and semantic segmentation. The key process involves incorporating down-sampling and up-sampling functions behind the dense block. As shown in Figure 2, the structure of the FC-DenseNet103 model network consists primarily of Full Convolution DensNet (including Dense Blocks and Transition Down Blocks), Bottleneck Blocks, Dense Blocks add Transition Up Blocks, and Pixel-Wise Classification layer. The dense module/Dense Blocks (as shown in Figure 3) performs convolutional operations, while concatenation combines the outputs of each layer in the dense module.
As shown in Figure 4, the specific structural details of the building blocks in the Full Convolutional Densenet (the layers used in the model, Transition Down (TD), and Transition Up (TU)) are as follows: the dense block part is composed of Batch Normalization, ReLU activation, Convolution2D, and Dropout; the downward transition module is composed of Batch Normalization, ReLU activation, Convolution2D, Dropout, and MaxPooling2D layers; and Transition Up is derived from Deconvolution2D convolution transposition. Model parameters: learning rate of 0.001 and RMSprop of 0.95.

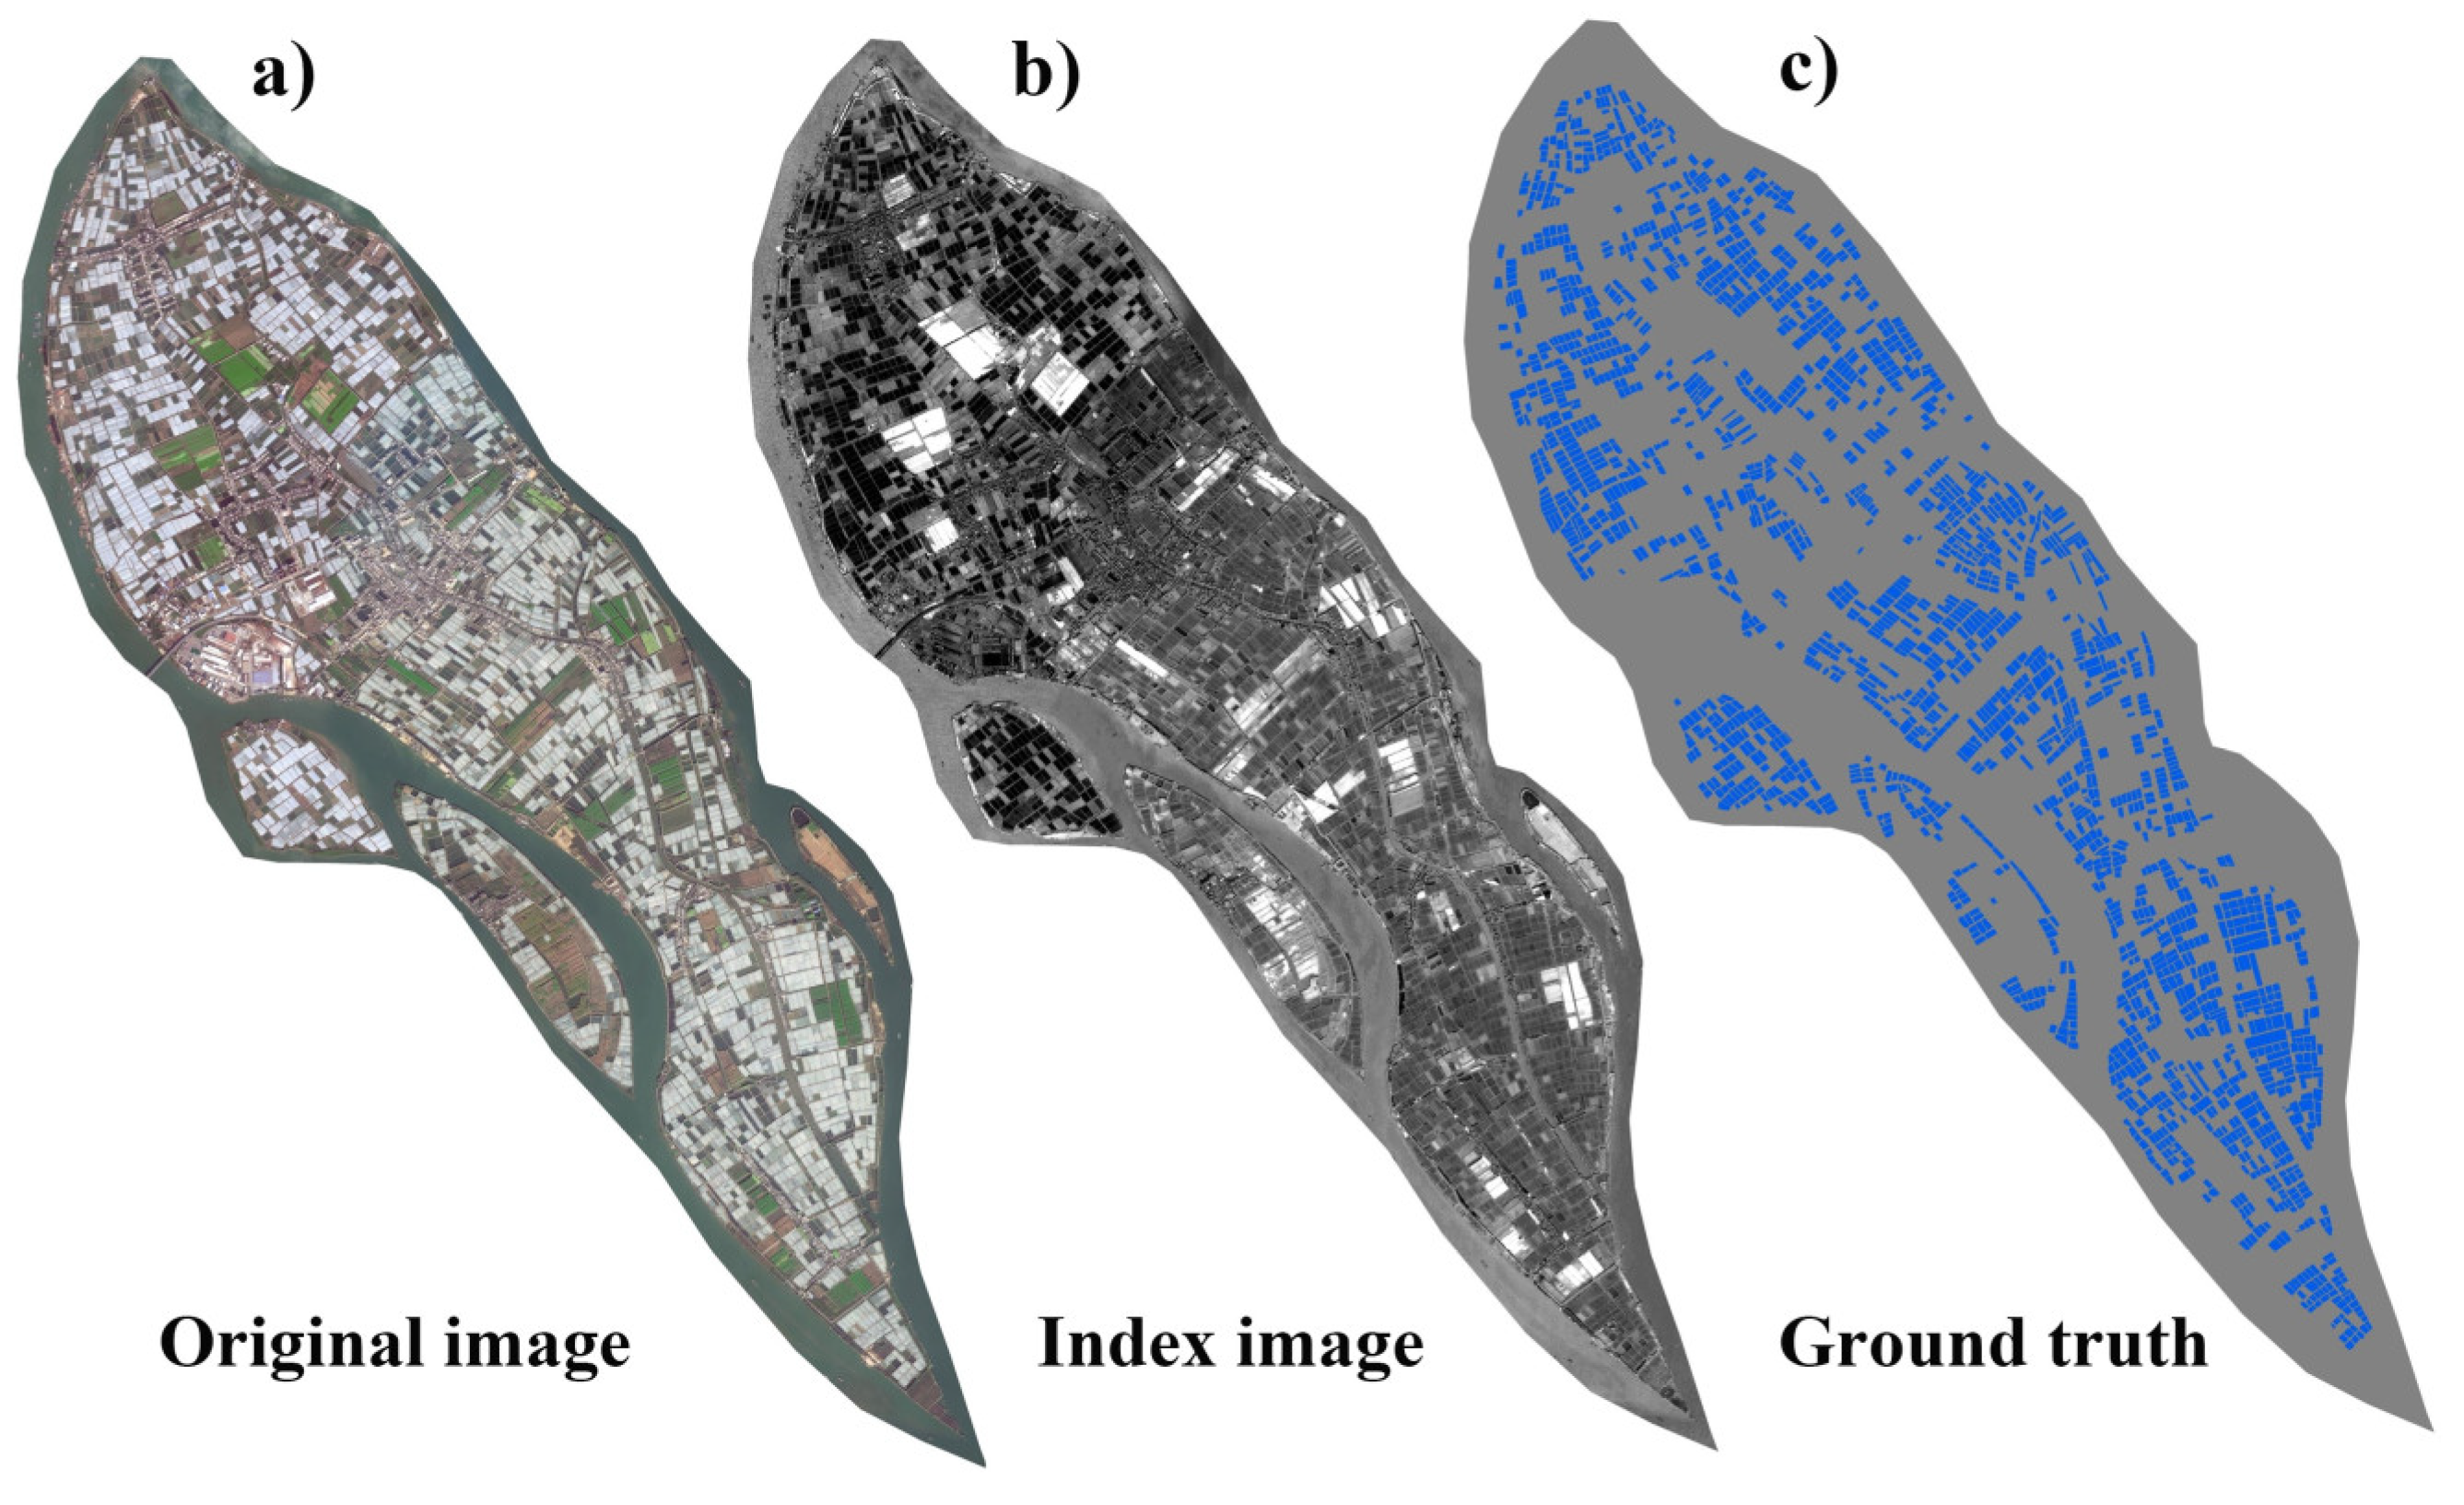
2.3.2. Image Enhanced Index

The GF-2 satellite images can undergo data fusion processing by combining the 1 m resolution panchromatic band with the 4 m resolution multispectral band, resulting in a 1 m resolution multispectral imagery. In this study, an image enhancement index is introduced to enhance the neural network model’s ability to extract key information features of PGs and improve the accuracy of PG extraction. This index is calculated from the green band and blue band of GF-2 satellite imagery, as shown in Figure 5. In previous studies, the normalized green–red difference index (NGRDI) has often been utilized for enhancing high-resolution remote-sensing images, achieving an improvement in the accuracy of deep learning methods in extracting regular land features from remote-sensing imagery [41,42]. PGs display a discernible difference in reflectance in these two bands. The image enhancement index (NGRDI) is calculated as follows [41,42]:
I n d e x = 255     G b a n d B b a n d / G b a n d + B b a n d
where Index is the normalized green–red difference index (NGRDI), and 255 is fixed parameter of image in int 8 format; G b a n d denotes green band of GF-2 satellite imagery and B b a n d denotes blue band of GF-2 satellite imagery.
In this study, taking into careful consideration the available computational resources, DenseNet103 was selected for its capacity to effectively extract PGs while maintaining a manageable computational load. Furthermore, the integration of the DenseNet103 with image enhancement indicators significantly enhances model accuracy and mitigates the risk of excessive reliance on extensive training datasets. Through this synergy with the image enhancement index, the proposed method maximizes the utility of existing data, showcasing its ability to extract PGs even in densely structured regions, all while keeping demands on computational resources and data requirements in check. This strategic amalgamation effectively addresses critical aspects concerning computational costs and data needs.

2.4. Previous Models

2.4.1. Encoder Decoder

Encoder-Decoder [34] is a common model framework in deep learning models. Numerous typical deep learning models are developed with an encoding-decoding framework [43]. Such as, there is the unsupervised algorithm auto-encoding which employs an encoding-decoding structure. The purpose of the encoder is to convert the input sequence into a fixed-length vector, while the decoder is responsible for transforming the previously generated fixed vector back into an output sequence. The Encoder-Decoder model has a distinctive feature in that it is an end-to-end learning algorithm. However, the model is prone to the problem of gradient disappearance, and for complex target objects, it can be challenging to transform the input sequence into a fixed-length vector that preserves all relevant information.

2.4.2. FRRN-B

Full-resolution residual networks (FRRNs) [44] are networks with superior training properties that consist of two processing streams. The first stream, called the residual stream, continuously adds residuals to the computation. The second stream, called the pooling stream, applies a series of convolution and pooling operations directly to the input to obtain the result. The FRNN network is composed of a series of full-resolution residual units (FRRUs), each of which has two inputs and two outputs. Suppose z n 1 is the residual input of the previous n-1 FRRUs and y n 1 is their pooling input, thus the output can be calculated as follows:
z n = z n 1 + H y n 1 ,   z n 1 ;   W n
y n = G y n 1 ,   z n 1 ;   W n
where W n is the parameter of the function G , H . A reasonable configuration of the functions G , H are required to combine the two streams: if G = 0, it corresponds to the removal of the pooled inputs, i.e., FRRUs for RU structures; if H = 0, it is the removal of the residual structures, i.e., FRRUs for traditional feedforward networks structures. Full-resolution residual network with 1/2 Pooling (FRRN-B) is that it is a network architecture based on the full-resolution residual network (FRNN), which includes a 1/2-resolution pooling layer between the encoder and decoder. Compared to the original FRNN, FRRN-B has a reduced input resolution, but it is restored to the desired resolution using bilinear interpolation at the output. This network has been applied in various fields, such as image semantic segmentation, and has shown excellent performance.

2.4.3. Support Vector Machine

The support vector machine (SVM) [45] is a supervised machine learning algorithm that serves as a generalized linear classifier. It is particularly useful for binary classification tasks, where it identifies a decision boundary that maximizes the margin between the two classes in the feature space. The basic model of the SVM was proposed by Cortes and Vapnik in 1964. The SVM employs a hinge loss function to calculate the empirical risk and integrates a regularization term into the solution system to optimize the structural risk. As a sparse and robust classifier, it is designed to minimize the empirical risk while avoiding overfitting by striking a balance between the empirical risk and the regularization term. The SVM is particularly effective in pattern recognition and classification, as it can increase the separation between classes and reduce the expected prediction error. Furthermore, the computational complexity of the SVM is determined by the number of support vectors rather than the dimensionality of the sample space, which helps avoid the curse of dimensionality and allows it to perform well in high-dimensional problems with small sample sizes. However, the SVM has some limitations. It can be challenging to train with large sample sizes, and it is sensitive to missing data, parameter tuning, and the choice of kernel function.

2.4.4. Random Forest

The random forest (RF) [46,47] classifier is an ensemble classifier that generates multiple decision trees using randomly selected training samples and subsets of variables. During classification, the random forest aggregates the results of these decision trees through voting or averaging to obtain the final classification result.
The RF algorithm can be used for the classification of discrete values, unsupervised learning clustering, and outlier detection, among other applications. It has also been extensively utilized in various scenarios, such as reducing the dimensionality of hyperspectral data, identifying the most relevant multi-source remote-sensing and geographic data, and classifying specific target classes. However, it has been found to be susceptible to overfitting in some noisy classification or regression problems. Furthermore, in datasets with different feature attributes, the attribute with more feature subdivisions tends to exert a greater impact on the output value of the random forest, which can result in biased outcomes.
In the experiment, eCognition 9.0 software was used for implementing the SVM and random forest (RF) methods. For the SVM model, the default parameters of the eCognition software were employed. Specifically, the SVM model used the radial basis function (RBF) kernel and was finetuned with the default settings, including the regularization parameter (C) and the kernel parameter (γ). For the random forest model, 50 trees were utilized, and the maximum depth of the tree was determined by expanding nodes until all leaves were pure or until all leaves contained fewer than two samples.

2.5. Method Evaluation
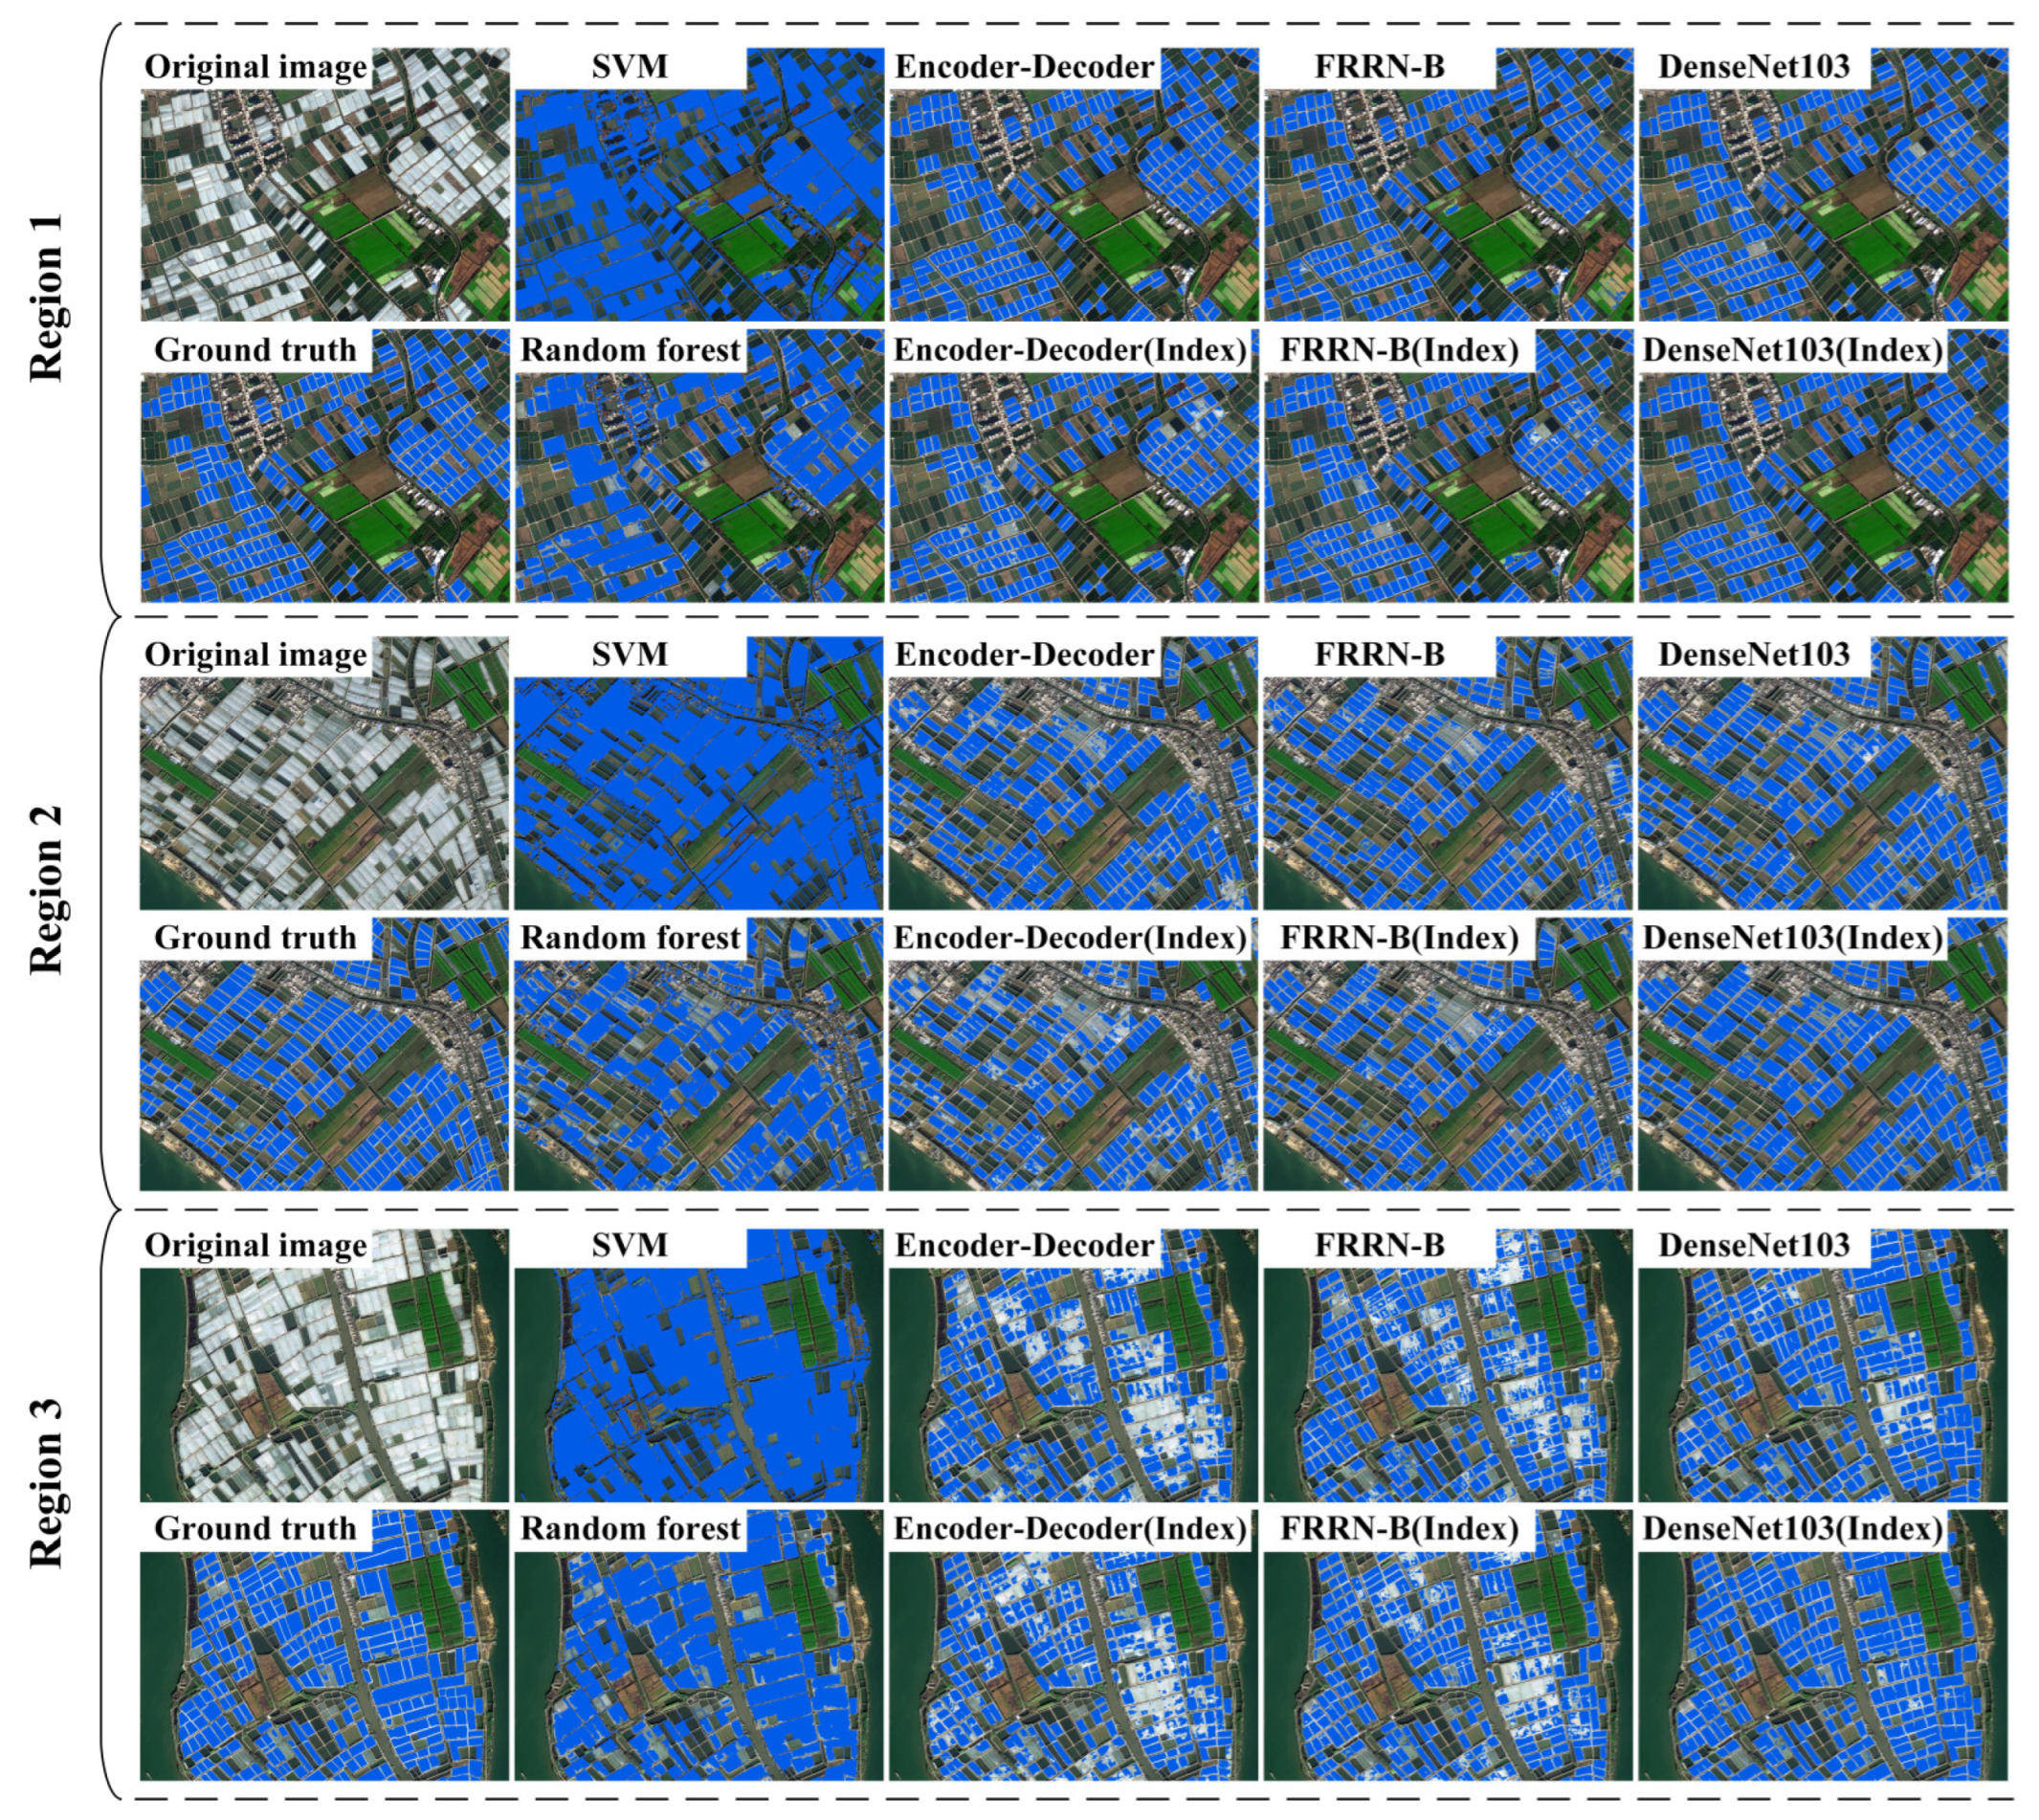
When evaluating the model performance, this paper used the metrics of accuracy, F1-score, and intersecting over union (IoU), which are widely used for assessing the accuracy of image semantic segmentation. The accuracy, precision, and recall can be expressed as follows [48,49]:
A c c u r a c y = ( T P + T N ) / ( T P + F N + F P + T N )
P r e c i s i o n = T P T P + F P
R e c a l l = T P T P + F N
where TP denotes a true positive where both the prediction and the reference are positive; TN denotes a true negative where both the prediction and the reference are negative; FP denotes a false positive where the prediction is positive and the reference is negative; and FN denotes a false negative where the prediction is negative and the reference is positive.
F1-score and IoU are derived as follows [48,49]:
F 1 s c o r e   = 2 P r e c i s i o n R e c a l l P r e c i s i o n + R e c a l l
I o U = T P T P + F P + F N

3. Results

In this study, two traditional machine learning models (SVM and random forest), three deep learning models (Encoder Decoder, FRRN-B, and DenseNet103), and the proposed method (DenseNet103 add image enhancement index) were employed for extracting the PGs. The three metrics of accuracy, F1 score, and IoU were used to evaluate the extraction accuracy of extraction PGs under different methods. To evaluate the model’s performance in extracting PGs, the visualization results of three regions in Jiangmen city were selected (as shown in Figure 6).
Figure 7 shows that the boundaries of PGs extracted by SVM and random forest methods are fuzzy and unclear and multiple greenhouses are even merged. Additionally, other ground objects have also been identified as PGs, resulting in misclassification. The extraction results of the Encoder-Decoder, FRRN-B, and DenseNet103 models show a gradual improvement in detail level. Particularly, the DenseNet103 model can achieve the extraction of most of PGs, even those distributed in areas with extremely high reflectivity. However, there are still small parts that are incompletely extracted. The image enhancement index can effectively highlight the boundary features of regular objects in GF-2 satellite images, strengthen the distinct band response characteristics of PG, and further improve the completeness and accuracy of PGs extraction and boundary definition. The results from three different regions using the Encoder-Decoder (Index), FRRN-B (Index), and DenseNet103 (Index) models after fusing the image enhancement index show a gradual improvement in the completeness of PGs extraction and clearer boundary definition. Among them, the DenseNet103 (Index) model performs the best, achieving the extraction of PGs in the small area with a clear boundary definition.
Table 2 presents the classification accuracies of PGs using various methods. In terms of accuracy, the SVM, random forest, Encoder-Decoder, FRRN-B, DenseNet103, and DenseNet103 (Index) models achieved accuracy values of 0.911, 0.964, 0.983, 0.986, 0.987, and 0.989, respectively. Similarly, in terms of F1 score and IoU performance, the SVM, random forest, Encoder-Decoder, FRRN-B, DenseNet103, and DenseNet103 (Index) models achieved F1 score values of 0.647, 0.795, 0.895, 0.909, 0.921, and 0.934, and IoU values of 0.691, 0.811, 0.896, 0.909, 0.920, and 0.932, respectively.

4. Discussion

The network structure used in this research not only has a small number of parameters, which is effective in extracting the deep features of PGs, but moreover, on the basis of full convolution, it can also break through the door barriers between different layers by skipping connections to realize the reuse of features. However, there still exist some pretzel phenomena in extracting object boundaries and patch edges. The current limitations in plastic greenhouse (PG) detection and extraction methods involve challenges in accurately delineating fine boundaries, dealing with variability in PG characteristics, coping with dense vegetation cover, and addressing biased datasets [3,50]. The proposed research overcomes these limits by introducing a novel approach that combines a deep learning model (DenseNet103) with an image enhancement index. This innovative strategy effectively highlights boundary features, enhances semantic segmentation, and improves the robustness of PG detection. While some evaluation metrics may not outperform accuracy, the approach significantly improves fine feature extraction and offers a promising solution to enhance the accuracy and applicability of PG mapping and monitoring methods.
Post-processing image enhancement helps to improve the classification results based on fully convolutional networks, but the assignment of weights still depends on the actual application. In the experimental results, the semantic segmentation accuracy of models such as Encoder Decoder or FRRN-B is also relatively high [51]. The vegetation coverage in the test data is believed to also impact the results. Moreover, there are various shapes and sizes of agricultural greenhouses in real life, and some of the spectral features are not obvious enough, thus increasing the difficulty of semantic segmentation. The detection of small plastic greenhouses poses a unique challenge due to their relatively diminutive size [52]. To address this challenge, a range of strategies have been implemented, including parameter optimization, careful selection of training data, and the application of post-processing techniques. These efforts are geared towards ensuring the accuracy of detection methods for small greenhouses. Furthermore, it is recognized that distinct greenhouse roof shapes can influence the visual characteristics of satellite images. Consequently, this paper has probed into strategies to adapt the proposed method to these varied conditions, thereby upholding performance stability.
Interestingly, the improved DenseNet103 (Index) model provides a high-precision semantic segmentation architecture that enhances the recognition and extraction of boundaries compared to other models. By using the DenseNet103 (Index) model, deep features can be learned, and useful feature information can be extracted. By fusing it with the image enhancement index, the completeness of the agricultural shed extraction can be further improved. Comparatively, the two evaluation factors, F1 score and IoU, do not perform as well as accuracy on the DenseNet103 (Index) model in terms of results. The analysis suggests that this may be due to the influence of obvious features such as dense vegetation cover and some other objects occluding the tops of the agricultural canopies. In the dataset, the bias in the training and validation datasets may also have caused a bias in the extracted classification results. However, it does not affect the overall effect of the DenseNet103 (Index) model, which can be used in the future in the field of semantic segmentation to realize the recognition and extraction of multi-scale and multi-level fine features.
In the context of this research, it becomes evident that the contemplation of future prospects and broadening the horizons of this work hold great significance. It envisions several compelling avenues for further exploration and enhancement. A particularly exciting opportunity lies in extending the reach of the proposed method to encompass a broader geographical scope, most notably within the Greater Bay Area. This expansion would furnish a comprehensive understanding of the extensive distribution and dynamics of plastic greenhouses across the region. Additionally, there is eager anticipation for the evolution of more sophisticated image enhancement techniques, poised to refine the methodology and enhance its versatility across a spectrum of scenarios. Furthermore, the integration of multi-source remote-sensing data, coupled with the adoption of cutting-edge deep learning architectures, opens promising avenues for methodological refinement [19,53]. For example, the proposed method should extract the digitization footprint of PGs from multi-temporal remote-sensing images.
In addition, PGs can alter the reflectance of solar radiation in localized areas, thereby modifying the temperature and microclimate of those specific regions and influencing the ecosystem. The proposed method can accurately extract the digitization footprint of PGs from multi-temporal remote-sensing images. Using the proposed method, it is possible to monitor changes in PGs during different periods, providing precise surface input parameters for regional ecological modeling. Additionally, it provides valuable data support for monitoring and predicting micro-ecological environments, thereby serving the sustainable development of the ecological environment.

5. Conclusions

This paper meticulously analyzed the performance of various machine learning and deep learning models, consisting of two machine learning models, three deep learning models, and the innovative DenseNet103 method enhanced with an image enhancement index. The primary objective of this research was to achieve precise extraction of plastic greenhouses (PGs), with a particular emphasis on concentrated the PG areas located within the cities of Zhuhai and Jiangmen. The experimental results unequivocally demonstrate the exceptional capabilities of the proposed DenseNet103 (Index) model. By integrating the image enhancement index, this model adeptly captures crucial feature information, resulting in a significant enhancement in classification accuracy and in the integrity of object extraction. In summary, the proposed method excels in the extraction of PGs, especially in scenarios characterized by small and densely distributed PGs. The proposed method’s robustness and accuracy position it as a promising solution for large-scale digital mapping of plastic greenhouse coverage. The implications of this study extend to various applications, including accurate estimation of the area and quantity of PG. It holds immense value in the field of agricultural management, as relying on more accurate estimations of greenhouse area and quantity data can enhance the precision of agricultural resource allocation, optimize crop production, and contribute to achieving the overall objective of ensuring food security. In conclusion, the proposed method provides a practical and versatile tool for a wide range of applications related to the monitoring and evaluation of PGs; it can thus help with improving the precision of agricultural management and quantitative environmental assessment.

Author Contributions

Conceptualization, Y.R.; methodology, Y.R.; software, X.Z.; validation, Y.R.; formal analysis, Y.R. and X.L.; investigation, Y.R.; resources, Y.R. and C.W.; data curation, Y.R.; writing—original draft preparation, X.L., Y.R. and B.R.; writing—review and editing, Y.R., X.J. and X.Z.; visualization, X.L. and Y.R.; supervision, X.J.; project administration, B.R.; and funding acquisition, Y.R., X.Z. and C.W. All authors have read and agreed to the published version of the manuscript.

Funding

The Project Supported by the Humanities and Social Sciences Youth Foundation of Ministry of Education of China (No. 23YJC630145); The Project Supported by the Guangzhou Science and Technology project (No. 2023A04J1541); The Project Supported by the Open Fund of Key Laboratory of Urban Land Resources Monitoring and Simulation, Ministry of Natural Resources (No. KF-2022-07-025). The Project Supported by Guangdong Provincial Key Laboratory of Intelligent Urban Security Monitoring and Smart City Planning (No. GPKLIUSMSCP-2023-KF-05). The Project Supported by the National Natural Science Foundation of China (Nos. 42371406, 42071441).

Institutional Review Board Statement

Not applicable.

Informed Consent Statement

Not applicable.

Data Availability Statement

The data presented in this study are available on request from the corresponding author.

Acknowledgments

The authors sincerely appreciate the MDPI reviewers’ time and insightful comments.

Conflicts of Interest

The authors declare no conflict of interest.

References

  1. Mormile, P.; Stahl, N.; Malinconico, M. The World of Plasticulture. In Soil Degradable Bioplastics for a Sustainable Modern Agriculture; Malinconico, M., Ed.; Springer: Berlin/Heidelberg, Germany, 2017; pp. 1–21. [Google Scholar] [CrossRef]
  2. Yang, D.; Chen, J.; Zhou, Y.; Chen, X.; Chen, X.; Cao, X. Mapping plastic greenhouse with medium spatial resolution satellite data: Development of a new spectral index. ISPRS J. Photogramm. Remote Sens. 2017, 128, 47–60. [Google Scholar] [CrossRef]
  3. Zhang, P.; Guo, S.; Zhang, W.; Lin, C.; Xia, Z.; Zhang, X.; Fang, H.; Du, P. Pixel–Scene–Pixel–Object Sample Transferring: A Labor-Free Approach for High-Resolution Plastic Greenhouse Mapping. IEEE Trans. Geosci. Remote Sens. 2023, 61, 4401717. [Google Scholar] [CrossRef]
  4. Briassoulis, D.; Dougka, G.; Dimakogianni, D.; Vayas, I. Analysis of the collapse of a greenhouse with vaulted roof. Biosyst. Eng. 2016, 151, 495–509. [Google Scholar] [CrossRef]
  5. Campra, P.; Millstein, D. Mesoscale Climatic Simulation of Surface Air Temperature Cooling by Highly Reflective Greenhouses in SE Spain. Environ. Sci. Technol. 2013, 47, 12284–12290. [Google Scholar] [CrossRef] [PubMed]
  6. Ramos-Miras, J.J.; Roca-Perez, L.; Guzmán-Palomino, M.; Boluda, R.; Gil, C. Background levels and baseline values of available heavy metals in Mediterranean greenhouse soils (Spain). J. Geochem. Explor. 2011, 110, 186–192. [Google Scholar] [CrossRef]
  7. Mota, J.F.; Peñas, J.; Castro, H.; Cabello, J.; Guirado, J.S. Agricultural development vs biodiversity conservation: The Mediterranean semiarid vegetation in El Ejido (Almería, southeastern Spain). Biodivers. Conserv. 1996, 5, 1597–1617. [Google Scholar] [CrossRef]
  8. Chang, J.; Wu, X.; Wang, Y.; Meyerson, L.A.; Gu, B.; Min, Y.; Xue, H.; Peng, C.; Ge, Y. Does growing vegetables in plastic greenhouses enhance regional ecosystem services beyond the food supply? Front. Ecol. Environ. 2013, 11, 43–49. [Google Scholar] [CrossRef] [PubMed]
  9. Canakci, M.; Yasemin Emekli, N.; Bilgin, S.; Caglayan, N. Heating requirement and its costs in greenhouse structures: A case study for Mediterranean region of Turkey. Renew. Sustain. Energy Rev. 2013, 24, 483–490. [Google Scholar] [CrossRef]
  10. Jiménez-Lao, R.; Aguilar, F.J.; Nemmaoui, A.; Aguilar, M.A. Remote Sensing of Agricultural Greenhouses and Plastic-Mulched Farmland: An Analysis of Worldwide Research. Remote Sens. 2020, 12, 2649. [Google Scholar] [CrossRef]
  11. Lin, J.; Jin, X.; Ren, J.; Liu, J.; Liang, X.; Zhou, Y. Rapid Mapping of Large-Scale Greenhouse Based on Integrated Learning Algorithm and Google Earth Engine. Remote Sens. 2021, 13, 1245. [Google Scholar] [CrossRef]
  12. Ma, A.; Chen, D.; Zhong, Y.; Zheng, Z.; Zhang, L. National-scale greenhouse mapping for high spatial resolution remote sensing imagery using a dense object dual-task deep learning framework: A case study of China. ISPRS J. Photogramm. Remote Sens. 2021, 181, 279–294. [Google Scholar] [CrossRef]
  13. Novelli, A.; Aguilar, M.A.; Nemmaoui, A.; Aguilar, F.J.; Tarantino, E. Performance evaluation of object based greenhouse detection from Sentinel-2 MSI and Landsat 8 OLI data: A case study from Almería (Spain). Int. J. Appl. Earth Obs. Geoinf. 2016, 52, 403–411. [Google Scholar] [CrossRef]
  14. Agüera, F.; Aguilar, F.J.; Aguilar, M.A. Using texture analysis to improve per-pixel classification of very high resolution images for mapping plastic greenhouses. ISPRS J. Photogramm. Remote Sens. 2008, 63, 635–646. [Google Scholar] [CrossRef]
  15. Agüera, F.; Aguilar, M.A.; Aguilar, F.J. Detecting greenhouse changes from QuickBird imagery on the Mediterranean coast. Int. J. Remote Sens. 2006, 27, 4751–4767. [Google Scholar] [CrossRef]
  16. Balcik, F.B.; Senel, G.; Goksel, C. Object-Based Classification of Greenhouses Using Sentinel-2 MSI and SPOT-7 Images: A Case Study from Anamur (Mersin), Turkey. IEEE J. Sel. Top. Appl. Earth Obs. Remote Sens. 2020, 13, 2769–2777. [Google Scholar] [CrossRef]
  17. Koc-San, D. Evaluation of different classification techniques for the detection of glass and plastic greenhouses from WorldView-2 satellite imagery. J. Appl. Remote Sens. 2013, 7, 073553. [Google Scholar] [CrossRef]
  18. Aguilar, M.A.; Nemmaoui, A.; Novelli, A.; Aguilar, F.J.; García Lorca, A. Object-Based Greenhouse Mapping Using Very High Resolution Satellite Data and Landsat 8 Time Series. Remote Sens. 2016, 8, 513. [Google Scholar] [CrossRef]
  19. Jiang, X.; Zhang, X.; Xin, Q.; Xi, X.; Zhang, P. Arbitrary-Shaped Building Boundary-Aware Detection With Pixel Aggregation Network. IEEE J. Sel. Top. Appl. Earth Obs. Remote Sens. 2021, 14, 2699–2710. [Google Scholar] [CrossRef]
  20. Jung, H.; Choi, H.S.; Kang, M. Boundary Enhancement Semantic Segmentation for Building Extraction From Remote Sensed Image. IEEE Trans. Geosci. Remote Sens. 2022, 60, 5215512. [Google Scholar] [CrossRef]
  21. LeCun, Y.; Bengio, Y.; Hinton, G. Deep learning. Nature 2015, 521, 436–444. [Google Scholar] [CrossRef]
  22. Girshick, R.; Donahue, J.; Darrell, T.; Malik, J. Rich Feature Hierarchies for Accurate Object Detection and Semantic Segmentation. In Proceedings of the 2014 IEEE Conference on Computer Vision and Pattern Recognition (CVPR), Los Alamitos, CA, USA, 23–28 June 2014; pp. 580–587. [Google Scholar]
  23. Shih, K.H.; Chiu, C.T.; Lin, J.A.; Bu, Y.Y. Real-Time Object Detection With Reduced Region Proposal Network via Multi-Feature Concatenation. IEEE Trans. Neural Netw. Learn. Syst. 2020, 31, 2164–2173. [Google Scholar] [CrossRef]
  24. Huang, J.; Zhang, X.; Xin, Q.; Sun, Y.; Zhang, P. Automatic building extraction from high-resolution aerial images and LiDAR data using gated residual refinement network. ISPRS J. Photogramm. Remote Sens. 2019, 151, 91–105. [Google Scholar] [CrossRef]
  25. Jiang, M.; Zhang, X.; Sun, Y.; Feng, W.; Gan, Q.; Ruan, Y. AFSNet: Attention-guided full-scale feature aggregation network for high-resolution remote sensing image change detection. GIScience Remote Sens. 2022, 59, 1882–1900. [Google Scholar] [CrossRef]
  26. Baduge, S.K.; Thilakarathna, S.; Perera, J.S.; Arashpour, M.; Sharafi, P.; Teodosio, B.; Shringi, A.; Mendis, P. Artificial intelligence and smart vision for building and construction 4.0: Machine and deep learning methods and applications. Autom. Constr. 2022, 141, 104440. [Google Scholar] [CrossRef]
  27. Brunetti, A.; Buongiorno, D.; Trotta, G.F.; Bevilacqua, V. Computer vision and deep learning techniques for pedestrian detection and tracking: A survey. Neurocomputing 2018, 300, 17–33. [Google Scholar] [CrossRef]
  28. Long, J.; Shelhamer, E.; Darrell, T. Fully convolutional networks for semantic segmentation. In Proceedings of the IEEE Conference on Computer Vision and Pattern Recognition, Boston, MA, USA, 7–12 June 2015; pp. 3431–3440. [Google Scholar]
  29. Eigen, D.; Fergus, R. Predicting depth, surface normals and semantic labels with a common multi-scale convolutional architecture. In Proceedings of the IEEE International Conference on Computer Vision, Santiago, Chile, 7–13 December 2015; pp. 2650–2658. [Google Scholar]
  30. Ronneberger, O.; Fischer, P.; Brox, T. U-Net: Convolutional Networks for biomedical Image Segmentation. In Proceedings of the Medical Image Computing and Computer-Assisted Intervention–MICCAI 2015: 18th International Conference, Munich, Germany, 5–9 October 2015; pp. 234–241. [Google Scholar]
  31. Huang, H.; Lin, L.; Tong, R.; Hu, H.; Zhang, Q.; Iwamoto, Y.; Han, X.; Chen, Y.; Wu, J.; Processing, S. UNet 3+: A Full-Scale Connected UNet for Medical Image Segmentation. In Proceedings of the 2020 IEEE International Conference on Acoustics, Speech and Signal Processing (ICASSP), Barcelona, Spain, 4–8 May 2020; pp. 1055–1059. [Google Scholar]
  32. Badrinarayanan, V.; Kendall, A.; Cipolla, R. SegNet: A Deep Convolutional Encoder-Decoder Architecture for Image Segmentation. IEEE Trans. Pattern Anal. Mach. Intell. 2017, 39, 2481–2495. [Google Scholar] [CrossRef] [PubMed]
  33. Zhao, H.; Shi, J.; Qi, X.; Wang, X.; Jia, J. Pyramid scene parsing network. In Proceedings of the IEEE Conference on Computer Vision and Pattern Recognition, Honolulu, HI, USA, 21–26 July 2017; pp. 2881–2890. [Google Scholar]
  34. Chen, L.-C.; Zhu, Y.; Papandreou, G.; Schroff, F.; Adam, H. Encoder-decoder with atrous separable convolution for semantic image segmentation. In Proceedings of the European Conference on Computer Vision (ECCV), Munich, Germany, 8–14 September 2018; pp. 801–818. [Google Scholar]
  35. Russakovsky, O.; Deng, J.; Su, H.; Krause, J.; Satheesh, S.; Ma, S.; Huang, Z.; Karpathy, A.; Khosla, A.; Bernstein, M.; et al. ImageNet Large Scale Visual Recognition Challenge. Int. J. Comput. Vis. 2015, 115, 211–252. [Google Scholar] [CrossRef]
  36. Hu, J.; Shen, L.; Sun, G. Squeeze-and-excitation networks. In Proceedings of the IEEE Conference on Computer Vision and Pattern Recognition, Salt Lake City, UT, USA, 18–23 June 2018; pp. 7132–7141. [Google Scholar]
  37. Xia, W.; Zhang, Y.-Z.; Liu, J.; Luo, L.; Yang, K. Road Extraction from High Resolution Image with Deep Convolution Network—A Case Study of GF-2 Image. Proceedings 2018, 2, 325. [Google Scholar]
  38. Zhou, K.; Zhang, Z.; Liu, L.; Miao, R.; Yang, Y.; Ren, T.; Yue, M. Research on SUnet Winter Wheat Identification Method Based on GF-2. Remote Sens. 2023, 15, 3094. [Google Scholar] [CrossRef]
  39. Duan, X.; Nao, L.; Mengxiao, G.; Yue, D.; Xie, Z.; Ma, Y.; Qin, C. High-Capacity Image Steganography Based on Improved FC-DenseNet. IEEE Access 2020, 8, 170174–170182. [Google Scholar] [CrossRef]
  40. Huang, G.; Liu, Z.; Van Der Maaten, L.; Weinberger, K.Q. Densely connected convolutional networks. In Proceedings of the IEEE Conference on Computer Vision and Pattern Recognition, Honolulu, HI, USA, 21–26 July 2017; pp. 4700–4708. [Google Scholar]
  41. Xu, F.; Gao, Z.; Jiang, X.; Shang, W.; Ning, J.; Song, D.; Ai, J. A UAV and S2A data-based estimation of the initial biomass of green algae in the South Yellow Sea. Mar. Pollut. Bull. 2018, 128, 408–414. [Google Scholar] [CrossRef] [PubMed]
  42. Sato, T.; Sekiyama, A.; Saito, S.; Shimada, S. Applicability of farmlands detection in Djibouti from satellite imagery using deep learning. J. Arid Land Stud. 2022, 32, 181–185. [Google Scholar] [CrossRef]
  43. Padmapriya, J.; Sasilatha, T. Deep learning based multi-labelled soil classification and empirical estimation toward sustainable agriculture. Eng. Appl. Artif. Intell. 2023, 119, 105690. [Google Scholar] [CrossRef]
  44. Pohlen, T.; Hermans, A.; Mathias, M.; Leibe, B. Full-resolution residual networks for semantic segmentation in street scenes. In Proceedings of the IEEE Conference on Computer Vision and Pattern Recognition, Honolulu, HI, USA, 21–26 July 2017; pp. 4151–4160. [Google Scholar]
  45. Noble, W.S. What is a support vector machine? Nat. Biotechnol. 2006, 24, 1565–1567. [Google Scholar] [CrossRef] [PubMed]
  46. Belgiu, M.; Drăguţ, L. Random forest in remote sensing: A review of applications and future directions. ISPRS J. Photogramm. Remote Sens. 2016, 114, 24–31. [Google Scholar] [CrossRef]
  47. Breiman, L. Random Forests. Mach. Learn. 2001, 45, 5–32. [Google Scholar] [CrossRef]
  48. Yan, C.; Li, Z.; Zhang, Z.; Sun, Y.; Wang, Y.; Xin, Q. High-resolution mapping of paddy rice fields from unmanned airborne vehicle images using enhanced-TransUnet. Comput. Electron. Agric. 2023, 210, 107867. [Google Scholar] [CrossRef]
  49. Riehle, D.; Reiser, D.; Griepentrog, H.W. Robust index-based semantic plant/background segmentation for RGB- images. Comput. Electron. Agric. 2020, 169, 105201. [Google Scholar] [CrossRef]
  50. Sun, H.; Wang, L.; Lin, R.; Zhang, Z.; Zhang, B. Mapping Plastic Greenhouses with Two-Temporal Sentinel-2 Images and 1D-CNN Deep Learning. Remote Sens. 2021, 13, 2820. [Google Scholar] [CrossRef]
  51. Xin, J.; Zhang, X.; Zhang, Z.; Fang, W. Road Extraction of High-Resolution Remote Sensing Images Derived from DenseUNet. Remote Sens. 2019, 11, 2499. [Google Scholar] [CrossRef]
  52. Feng, Q.; Niu, B.; Chen, B.; Ren, Y.; Zhu, D.; Yang, J.; Liu, J.; Ou, C.; Li, B. Mapping of plastic greenhouses and mulching films from very high resolution remote sensing imagery based on a dilated and non-local convolutional neural network. Int. J. Appl. Earth Obs. Geoinf. 2021, 102, 102441. [Google Scholar] [CrossRef]
  53. Xiong, Y.; Zhang, Q.; Chen, X.; Bao, A.; Zhang, J.; Wang, Y. Large Scale Agricultural Plastic Mulch Detecting and Monitoring with Multi-Source Remote Sensing Data: A Case Study in Xinjiang, China. Remote Sens. 2019, 11, 2088. [Google Scholar] [CrossRef]
Figure 1. The study area: (a) the Guangdong-Hong Kong-Macao Greater Bay Area (GBA); (b) the model accuracy validation region; and (c) the model training region.
Sustainability 15 16537 g001
Figure 2. The structure of FC-DenseNet103.
Sustainability 15 16537 g002
Figure 3. Dense Module/Dense Blocks (DB) module.
Sustainability 15 16537 g003
Figure 4. FC-DenseNet103 building block diagram.
Sustainability 15 16537 g004
Figure 5. Example for the GF-2 satellite image: (a) original image, (b) index image, and (c) ground truth.
Sustainability 15 16537 g005
Figure 6. Locations of the three regions for displaying the performance of different methods in extracting plastic greenhouses.
Sustainability 15 16537 g006
Figure 7. Plastic greenhouses extraction results with different machine learning or deep learning methods on GF-2 satellite images.
Sustainability 15 16537 g007
Table 1. Attributes of the GF-2 satellite images [37,38].
ParametersPanchromatic ImagesMultispectral Images
Spatial resolution1 m4 m
Spectral range0.45–0.90 μm0.45–0.52 μm
0.52–0.59 μm
0.63–0.69 μm
0.77–0.89 μm
Revisit period5 days5 days
Image width631 km631 km
Average orbit altitude>45 km>45 km
Table 2. The classification accuracies of plastic greenhouses using different methods.
MethodsSVMRandom
Forest
Encoder
Decoder
FRRN-BDenseNet103DenseNet103 (Index)
Accuracy0.9110.9640.9830.9860.9870.989↑
F1 score0.6470.7950.8950.9090.9210.934↑
IoU0.6910.8110.8960.9090.9200.932↑
Disclaimer/Publisher’s Note: The statements, opinions and data contained in all publications are solely those of the individual author(s) and contributor(s) and not of MDPI and/or the editor(s). MDPI and/or the editor(s) disclaim responsibility for any injury to people or property resulting from any ideas, methods, instructions or products referred to in the content.

