Article

A Bottom-Up Methodology for Identifying Key Performance Indicators for Sustainability Monitoring of Unit Manufacturing Processes

by
Marija Glišić
1,2,
Badrinath Veluri
2 and
Devarajan Ramanujan
1,*
1
Department of Mechanical & Production Engineering, Aarhus University, 8200 Aarhus, Denmark
2
Motor Department, Advanced Manufacturing Engineering, Grundfos, 8850 Bjerringbro, Denmark
*
Author to whom correspondence should be addressed.
Sustainability 2024, 16(2), 806; https://doi.org/10.3390/su16020806
Submission received: 18 September 2023 / Revised: 22 December 2023 / Accepted: 26 December 2023 / Published: 17 January 2024
(This article belongs to the Special Issue Digital Technology in Sustainable Manufacturing Systems)

Abstract

:
With growing environmental concerns and regulatory requirements, manufacturers are increasingly required to monitor and reduce the environmental impacts of their production processes. Despite increasing digitalization and data-collection capabilities, manufacturers are challenged in collecting the right data and framing process improvement targets. To address this challenge, this paper presents a bottom-up methodology based on the life cycle assessment for identifying performance indicators with the goal of monitoring and reducing the overall environmental impacts of a manufacturing process. More specifically, process performance indicators are defined as a set of controllable process parameters, and their suitability for sustainability monitoring is evaluated based on their sensitivity, measurability, actionability, reliability, timeliness, and human-centricity with respect to a chosen environmental impact category. The bottom-up formulation of process performance indicators is demonstrated through a real-world case study on an infeed centerless grinding process in a large manufacturing company. Results from the case study show that the process performance indicators with regards to climate change impacts included (i) reduction in grinding time, (ii) reduction in total grinding power, (iii) reduction in sparkout time, and (iv) increase in batch size.

1. Introduction

Industrial activities continue to remain a significant contributor to environmental impacts, accounting for 9.2 gigatonnes of global carbon dioxide emissions in 2022 [1]. In order to address climate change challenges and ensure sustainable development, industries, including the manufacturing sector, are increasingly quantifying the environmental impacts of their production processes and searching for new solutions to mitigate such impacts. In this regard, Life Cycle Assessment (LCA) is a widely used tool for assessing the environmental sustainability performance of manufacturing processes, products, and services. The overarching goal of LCA is to provide a systematic procedure that helps in the quantification of the environmental impact of products and manufacturing processes [2]. However, conducting detailed LCAs is time- and cost-intensive, can be uncertain [3,4], and is challenging to interpret for design and manufacturing decision-making [5].

1.1. Performance Indicators for Sustainable Manufacturing

In light of the above challenges, key performance indicators (KPIs) have been proposed as a means for guiding sustainable manufacturing. Herein, a KPI, or more generally, an indicator, has been defined as a parameter that provides more information on significant phenomena relevant to specified performance objectives [6]. Typical indicators used for sustainable manufacturing include measures for energy, carbon dioxide emissions, other process emissions, and waste. Providing a thorough review of the different types of KPIs for environmental sustainability performance measurement is out of the scope of this work. Interested readers are directed to prior works that have compiled KPI databases [7,8,9,10,11]. It is important to note that KPIs for sustainable manufacturing have been defined across hierarchies (i.e., organization, factory, production line, unit process) and can be qualitative, quantitative, or mixed [12]. Moreover, KPIs for environmental sustainability performance measurement are typically defined based on process inventory flows (e.g., energy use, water use, process emissions), as they serve as a proxy for the resulting environmental impacts of the process; they can be easily estimated for a given manufacturing system and are generally easier to understand than corresponding measures for environmental impacts [13,14,15,16,17]. Previous research has demonstrated the use of various approaches for identifying potential process improvements with regard to sustainability. Barbosa et al. [18] used two alternative systems to reduce the flow rate of water/coolant while maintaining the quality of workpieces. The authors conducted a series of experiments employing minimum quantity lubrication and directional device system approaches. Additionally, Shahbazi et al. [16] focused on identifying material efficiency indicators to evaluate operational performance and provide decision-makers with information on areas for sustainable process improvements. From a number of material efficiency indicators used in seven global manufacturing companies in Sweden, the authors narrowed their selection down to three environmental indicators. Similarly, Fan et al. [13] collected a list of environmental, economic, and social indicators to evaluate sustainable manufacturing. The authors empirically shortlisted the indicators and assessed them based on relevance, analytical soundness, and measurability.
Two broad approaches have been identified for defining KPIs relevant to sustainable manufacturing [19]. The bottom-up approach involves defining metrics that are currently in use or necessary to be measured and using them as a basis for developing a KPI. A common characteristic of bottom-up KPIs is they can be directly quantified based on the operational data from manufacturing systems (e.g., energy efficiency, percentage of recycled material used) and are therefore useful for modeling and improving system- and process-level performance [20]. On the other hand, in the top-down approach, the definition of KPIs is driven by the overall organizational goals and may include a collection of processes/systems relevant to that goal [19]. Approaches for introducing KPIs relevant to sustainable manufacturing have also been discussed in prior work [19,21,22] with a generalized approach involving the definition of the overall production goals and objectives, identification and definition of KPIs, selection of relevant KPIs, implementation and monitoring of KPIs, and continuous process improvement. Significant questions to be addressed in this process include (i) defining which environmental sustainability indicators should be in focus, (ii) defining the boundaries of the measurement, (iii) identifying the needs for data collection and reporting, and (iv) evaluating the challenges and benefits of implementing and monitoring a selected KPI.

1.2. Challenges in Defining Bottom-Up Indicators in Sustainable Manufacturing

While bottom-up indicators for sustainable manufacturing can support process improvement, prior research has highlighted it can be challenging to apply them in practice. Significant areas of concern while developing bottom-up KPIs include inconsistencies in defining KPIs and lack of systematic methods for selecting and evaluating KPIs [19]. Reconciling bottom-up KPIs with organizational strategies and top-down indicators is also a concern and can result in siloed treatment of sustainability performance [20]. Bottom-up indicators also tend to be compliance-driven and are typically lagging indicators; relatively few leading indicators exist for proactive improvement of sustainability performance [23]. In this regard, it is important to note that bottom-up indicators are typically inventory-based KPIs and evaluate the operational performance of manufacturing systems (e.g., efficiency, productivity, and quality). Such measures offer little detail on how sustainability performance could be improved or why an improvement occurred in the first place. Furthermore, continuous monitoring of inventory-based KPIs offers greater advantages for the sustainability improvement of manufacturing systems over non-simultaneous, manual data collection and interpretation [24]. However, there is limited prior research on understanding the challenges associated with the real-time collection of such data from manufacturing systems [25,26]. Finally, manufacturing companies are often more concerned with monitoring the time- and cost-productivity of their operations and have established different measurement and data collection systems for tracking such metrics. The integration of the above productivity metrics and sustainability-related KPIs is a challenge given the complexities in relating this data [27].

1.3. Motivations for Defining Process Parameter-Based Performance Indicators

Inventory-based KPIs can provide an understanding of process sustainability performance and enable the identification of hotspots [28,29]. However, they do not necessarily provide insights into (i) why a specific resource/emission has increased or decreased and (ii) how a process can be improved/controlled to reduce a specific resource consumption/emission. To address the above questions, there is a need to define indicators based on process parameters in addition to inventory-based KPIs. This argument stems from the fact that process parameters (e.g., material removal rate, processing time) can be selected by manufacturers in the process planning stage and serve as a means to control inventory flows (e.g., energy consumption, water use) and, consequently, the resulting environmental impacts of a process. Analytical and experimental approaches for constructing manufacturing process models that link inventory flows to process parameters have been presented in prior research [30,31]. They can help establish unit process-level sustainability indicators enabling process sustainability monitoring as well as linking integrated process sustainability and quality performance [32]. Filleti et al. [33] conducted a productive performance assessment and LCIA study, incorporating eleven different impact categories, to evaluate the effects of varying specific material removal rates and wheel types. The study results indicate the environmental hotspots and potential areas for improvement. However, most prior work develops indicators based on physical inventory data. There is limited prior work that discusses how process parameter-based indicators can be systematically defined and selected for unit manufacturing processes [34]. This research gap can be significant, as bottom-up approaches for defining and evaluating process parameter-based indicators are not necessarily equivalent to inventory-based KPIs. To illustrate, the relevance of inventory-based KPIs (e.g., energy waste/efficiency, material waste) to an overall environmental sustainability objective (e.g., CO2 emissions, circular economy indicators) is readily established using methods such as life cycle impact assessment [35]. Furthermore, it is sufficient to perform real-time measurement of inventory-based KPIs at an aggregated level at source/sink points (potentially spanning multiple unit manufacturing processes) for monitoring the sustainability performance of manufacturing systems. The above aspects are not necessarily true in the case of process parameter-based indicators, as they need to be collected and interpreted at a unit process level, and their collection can directly impact the operational feasibility of a unit manufacturing process [26].

1.4. Indicator Selection Criteria

Methodologies for assessing the overall quality of KPIs have been an active area of research, and there is no widespread consensus on adopting a specific approach. Researchers have suggested the use of SMART principles, where well-designed KPIs are defined to be specific, measurable, achievable, relevant, and time-bound with regard to an overall goal/target [36]. The sustainable measures initiative [9] expands on this definition and includes the need for sustainability-related KPIs to be understandable by the community and lay people, to be reliable/usable by presenting trusted and accurate information from the organization or manufacturing process under evaluation, to be accessible by being based on data and information that can be easily accessed and acquired within the organization or process/product system, and to be long-term-oriented, i.e., ensure its future use, development, and adoption as an organizational or process/product sustainability standard. Kibira et al. [19] suggest that KPIs should be cost-effective, quantifiable, calculable, comparable, understandable, and offer management support. Other methods include the above aspects and also stress that indicators must be rooted in a strong scientific basis, have appropriate temporal as well as spatial scale, be compatible with other developed indicators, provide benefits that outweigh the costs of their usage, and be manageable [37,38]. A broader review of requirements of common environmental indicator selection criteria is provided in Niemeijer and de Groot [39]. The authors classify indicator selection criteria based on five dimensions: scientific, systemic, intrinsic, financial and practical, and policy and management. At a policy level, the European Environment Agency suggests that sustainability-related KPIs are relevant to European Union (EU) policy, show progress towards policy targets, are understandable, and are a part of EU priority policy issues [40]. As evident from the above discussions, there is a general consensus on the properties of well-designed KPIs. However, the selection of specific indicator selection criteria depends on the adopted KPI definition methodology (i.e., bottom-up or top-down methodology) and the intended application of the KPIs (e.g., inform policy, affect industry, or process changes).
This paper develops a systematic, bottom-up methodology for identifying and selecting process parameter-based indicators in the context of sustainable manufacturing. The methodology focuses on identifying process parameters that can act as leading indicators for sustainable manufacturing. In other words, monitoring such parameters enables a causal understanding of the sustainability performance of unit manufacturing processes and proactive improvement through avenues such as optimizing process performance and modifying manufacturing equipment. The proposed approach also extends prior selection criteria for inventory-based KPIs and interprets them in the context of process parameter-based KPIs. More specifically, the suitability of process parameters as indicators for sustainability performance is evaluated based on their sensitivity, measurability, actionability, reliability, timeliness, and human-centricity with respect to a chosen environmental impact category. The bottom-up formulation of process parameter-based performance indicators is demonstrated through a real-world case study on an infeed centerless grinding process in a large manufacturing company.

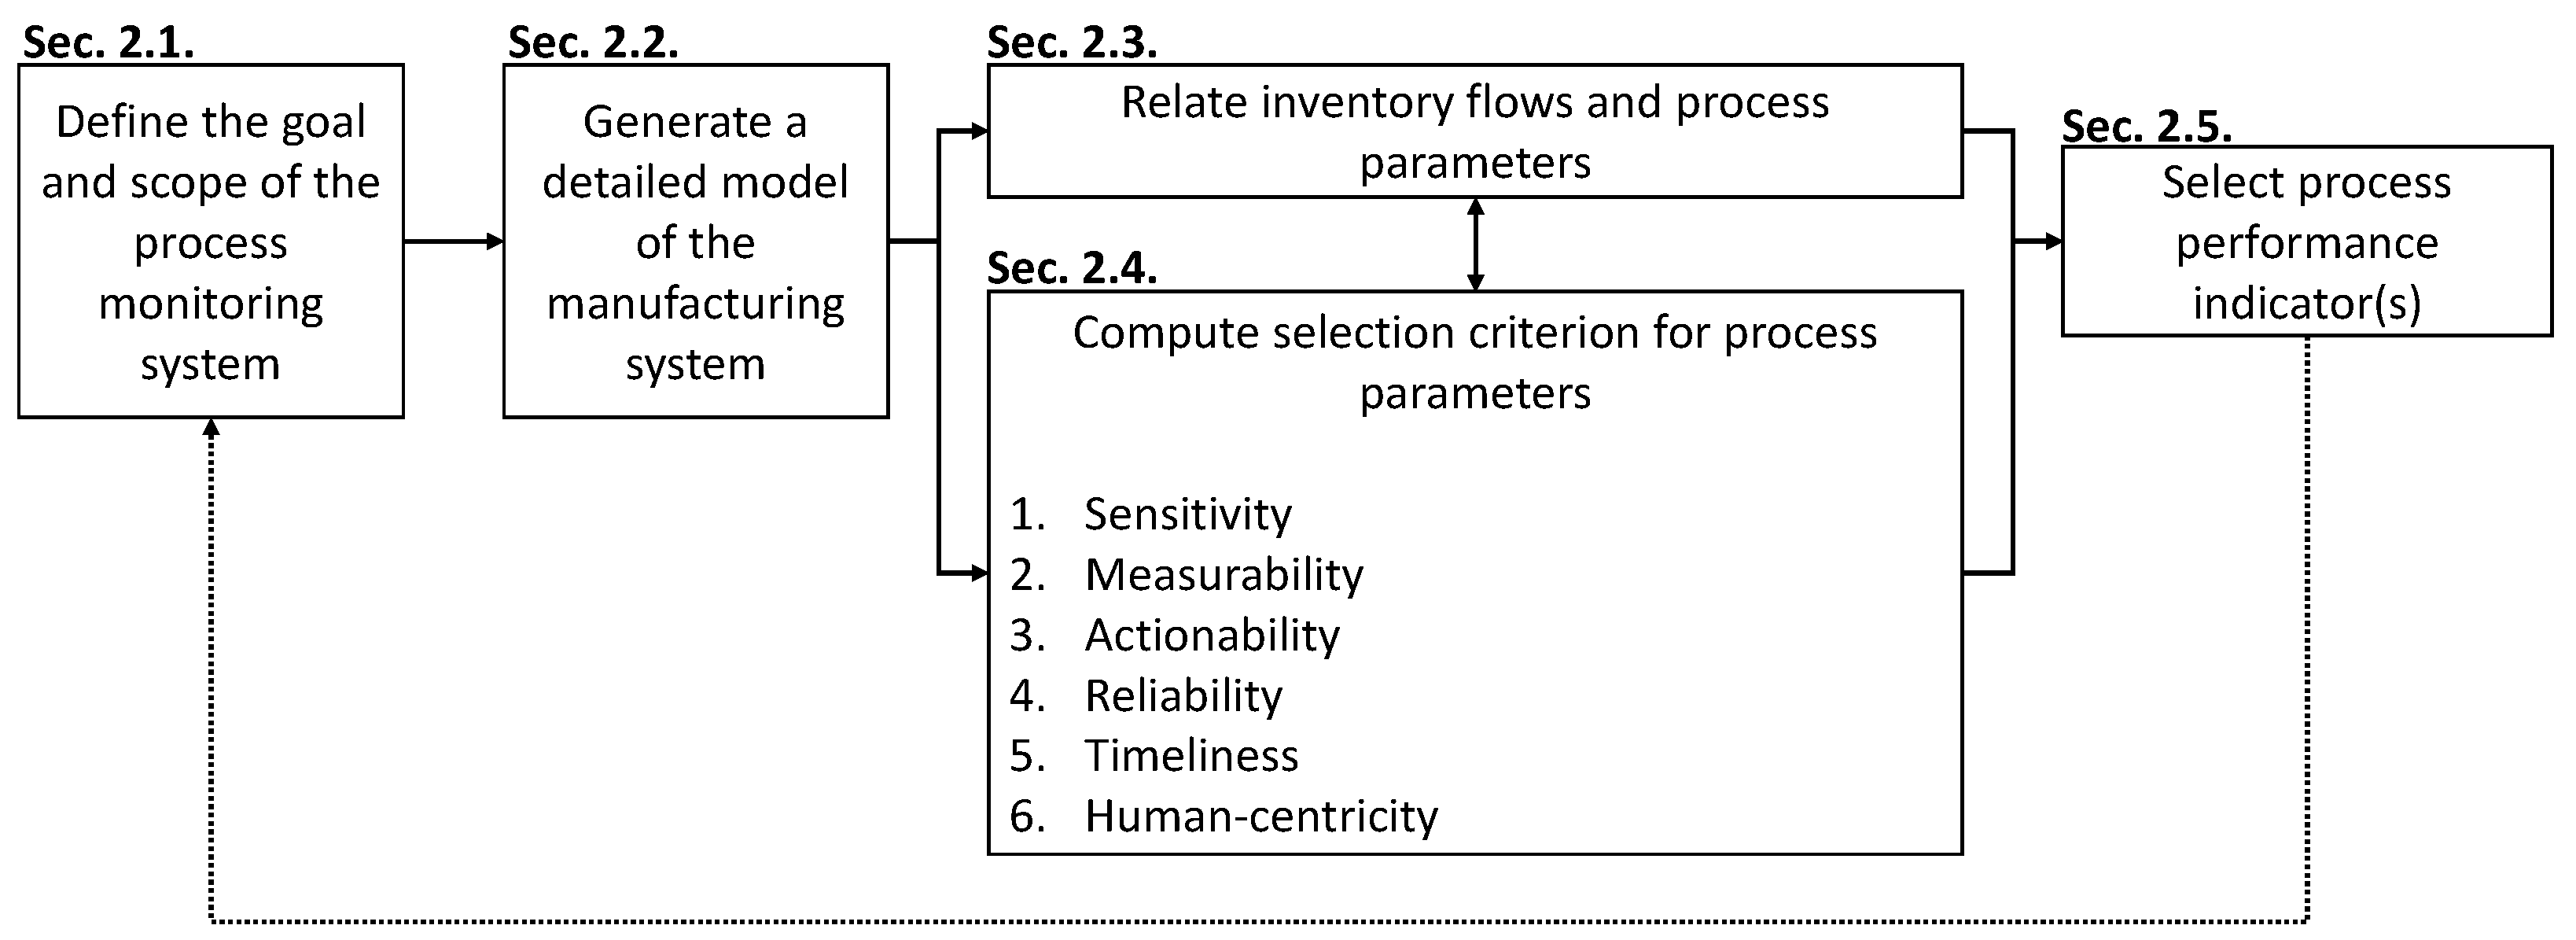
2. Materials and Methods

In this work, our focus is on developing a bottom-up approach for defining process parameter-based indicators. To this end, our methodology for the formulation of indicator evaluation criteria was based on compiling evaluation criteria from prior research discussed above and categorizing them into common themes. Table 1 describes the indicator evaluation criteria proposed in this work, the suggested interpretation, and relevant measures suggested in prior work. For each theme, a suitable criterion name and interpretation text was formulated.
  • The first theme that emerged from the analysis relates to the relevance of a process parameter-based indicator to a chosen environmental impact category/indicator. In other words, any change in the environmental impact indicator should be captured through a change in the chosen process parameter-based indicator. The relationship between the process parameter-based indicator and the environmental impact indicator should also be rooted in a proper scientific basis. These aspects are interpreted as the sensitivity of the process parameter-based indicator to the environmental impact indicator. The formulation of the sensitivity criterion is given in Table 1.
  • The second theme relates to the measurability/quantification of the process parameter-based indicator for a unit manufacturing process. Herein, it is important to note that the measurability relates to the practical aspects of continually monitoring the process parameter for a given production setup. This includes aspects such as the feasibility, cost, and management of measurement processes, as well as the impact the measurements can have on the production process or the measurement of other indicators.
  • The third theme relates to the usefulness/usability of the developed indicators to key stakeholders (i.e., technicians and engineers) from the perspective of product/process improvement. It implies that the chosen process parameters can be controlled at the product/process planning stage in order to affect the sustainability performance of the unit manufacturing process. This concept is interpreted as actionability.
  • The fourth theme corresponds to the reliability of the process parameter-based indicator and its usefulness as an indicator over time. This includes any uncertainties in the measurement process, deviations in the indicator over time, and the effect of uncontrollable process parameters (e.g., ambient temperature) on the indicator.
  • The fifth theme is related to the timeliness of the process parameter-based indicator and reflects the usefulness of the process parameter-based indicator as a leading indicator in the context of sustainable manufacturing. In other words, the indicator should be easily accessible by stakeholders during key decision-making activities (e.g., process planning), apart from being actionable.
  • The sixth theme corresponds to the level of understanding of the process parameter-based indicator by the relevant stakeholders. Ideally, the indicator is already defined and measured in ongoing production activities, with a good understanding of its impact on other aspects of production. Finally, it is important to note the need for existing human skills in the organization to measure, monitor, and control the indicator. These aspects are collectively defined as human-centricity. The formulation of the human-centricity criterion is given in Table 1.
Table 1. Formulation of selection criteria for process parameter-based indicators.
Criterion NameInterpretationAssociated Prior Criteria
SensitiveDescribes the sensitivity (magnitude of change) of the process parameters with respect to the chosen environmental impact indicator (for a specific impact category). A process parameter with a significant and predictable sensitivity to the selected environmental impact indicator is preferred.Specific [9,36], relevant [9,36], strong scientific basis [37,38,39]
MeasurableDescribes the ease of measurement of a process parameter on a specific manufacturing process. It is important to note that measurability is defined on a practical basis, specific to a production setup. For example, it is important to consider aspects such as the cost of measurement and the ability to measure the process parameter without significantly impacting established production processes and requirements.Measurable [9,36], accessible [9,39], benefits outweigh costs [37], resource demand and operational simplicity [39]
ActionableDescribes the ability of the process parameter to be controlled through changes to the product and/or process. Thus, affecting the process parameter enables improving the environmental sustainability performance of a manufacturing processUseful [9], achievable [36], manageable [38,39],
ReliableDescribes the reliability of measuring the process parameter over time. For example, if a process parameter is uncontrolled or if there is significant uncertainty in its measurement, monitoring this process parameter over time does not give a reliable indicator of process improvement.Reliable/useful
[9,39], long-term oriented [9], robustness and uncertainty [39]
TimelyData and information collection, calculation, and evaluation for an indicator must be completed in a timely manner for informative decision-makingTime-bound [36], timely [9], anticipatory [39]
Human-centricShould be defined based on aspects that process engineers and operators already consider in production planning. This should give them a good understanding of the process, how to control and monitor it, and the skills to change it if needed.Understandable/comprehensible
[9,39], user-driven [39], necessary skills [39]
The review of prior work also highlighted important themes to be considered in the design of the overall indicator selection methodology. Specifically, the goal and scope of the process monitoring systems should be clearly defined, including assumptions made in the process [37]. The definition of the indicator, as well as the measurement process for the indicator, should lend itself toward standardization; ideally, such standards are a part of the ongoing production process [9].
The overarching aim of the proposed framework is to help manufacturers define performance indicators that can be monitored for a specific manufacturing process on an operational production line. The goal is to support the correction of sub-optimal behavior and identify potential improvements to the manufacturing process from the perspective of environmental sustainability. Figure 1 presents the overall methodology for the proposed work. The different steps in the methodology are detailed in the sections below.

2.1. Goal and Scope Definition

The method for selecting the appropriate performance indicators for a process begins with defining the goal and scope of the monitoring system. This involves (i) defining the production and manufacturing systems that will be monitored, (ii) selecting environmental impact categories/indicators for the system, and (iii) identifying the appropriate personnel in the organization who can participate in the indicator evaluation process. The selection of a production system for monitoring can be motivated based on several criteria, e.g., increased resource consumption of the production system, need for further energy savings, and need for reducing process losses. After identifying a production system, manufacturing process(es) of interest within the production system are selected for further analysis. The selection of specific environmental indicator(s) should be reflected in the analysis. To illustrate, if the focus is on reducing climate change-related impacts, then subsequent mapping of inventory flows, selection of process parameters, and performance indicators should include inventory flows (e.g., energy consumption) that significantly influence this indicator. The proposed methodology does not distinguish between the use of process- and product-focused environmental indicator(s), and they should be selected to reflect the study goals. For example, if the goal of the monitoring system is to minimize process impacts (regardless of the type of part being manufactured), the selected environmental indicator(s) can be quantified over a chosen time period. On the other hand, environmental indicator(s) can be quantified per produced part if the aim is to minimize the process impacts of producing a specific part. Conducting detailed inventory analyses to quantify the selected environmental indicators can be time- and cost-intensive, depending on the selected manufacturing system. If so, a streamlined approach can be adopted where the focus is restricted to a limited set of process inventory (e.g., electricity consumption), or environmental impact indicators can be quantified for sub-systems or sub-processes. In such cases, an iterative refinement of the inventory analysis may be required depending on the utility of the obtained results towards the study goals. The proposed methodology requires inputs from domain experts such as process engineers and/or technical operators. The selected experts should have a detailed understanding of the production system and enough experience to identify the various process parameters and inventory flows for the analyzed manufacturing process, as well as the challenges and opportunities in monitoring these data.

2.2. Generate a Detailed Model of the Manufacturing System

Inventory models constructed for conducting environmental sustainability assessments typically include aggregated quantities of resource flows and, therefore, do not provide sufficient details about the manufacturing process. To provide a more detailed characterization of the manufacturing process, a detailed system model is constructed. A detailed system model for a manufacturing system consists of (i) a decomposed model for the analyzed machinery, detailing significant sub-systems, shown in Figure 2a, and (ii) a list of process parameters and inventory data for the corresponding sub-systems. Herein, sub-systems are defined as distinct mechanical, hydraulic, electrical, and electronic systems that have significantly influenced process inventory flows (i.e., resource consumption and/or emissions) and process performance. It should be noted that while data-intensive, the knowledge for creating sub-system models is typically readily available in the form of mechanical and electrical drawings provided by machine tool manufacturers.

2.3. Relate Inventory Flows and Process Parameters

To establish relationships between inventory flows and process parameters, it is necessary to identify which of the process parameters defined in the previous section have an actual influence on inventory flows. A generic method for modeling unit manufacturing processes (see Figure 2b) towards the above goal is outlined in the ASTM E3012-16 standard for the characterization of environmental aspects in manufacturing processes [41]. In order to model the influence of specific process parameter(s) on the chosen environmental impact indicator(s), a corresponding mapping is constructed between these data. Typically, such mappings can be constructed using methods such as (i) analytical process modeling, e.g., unit process life cycle inventory model, (ii) process simulation, and (iii) experimental studies that can establish correlations between process variations and process flows. Several reusable unit process life cycle inventory models have been developed over the past decades that enable mapping process parameters to inventory flows. According to Overcash et al. [42], 31 such models have been developed for various manufacturing processes. Regardless of the chosen approach, the end result of any chosen method is a mathematical quantification of dependencies between the process parameters and environment. In cases where the manufacturing process is characterized by a large number of process parameters, or if there are significant time or resource constraints, the mapping can be restricted based on a defined threshold for the selection criterion (described in the following section).

2.4. Compute Selection Criterion for Process Parameters

The goal of defining the indicator selection criteria is to assist decision-makers in selecting process parameters that can act as performance indicators for a chosen environmental impact. Therefore, an evaluation methodology for each criterion is developed in this work, which is subsequently discussed in the overall methodology description. Table 2 summarizes the proposed approach for evaluating the six selection criteria detailed in Table 1. The design of the evaluation methodology was developed in consultation with a total of six process engineers and technicians from a large manufacturing company. Feedback was collected on the design of the evaluation methodology, scoring, and aggregation system and consolidated in the form of an Excel-based questionnaire that is provided as Supplementary Material (S1). It is important to emphasize that the variables for calculating the indicator selection criteria and the criteria themselves are non-dimensional and do not have measurement units. Please refer to the Supplementary Material S1 for further details.
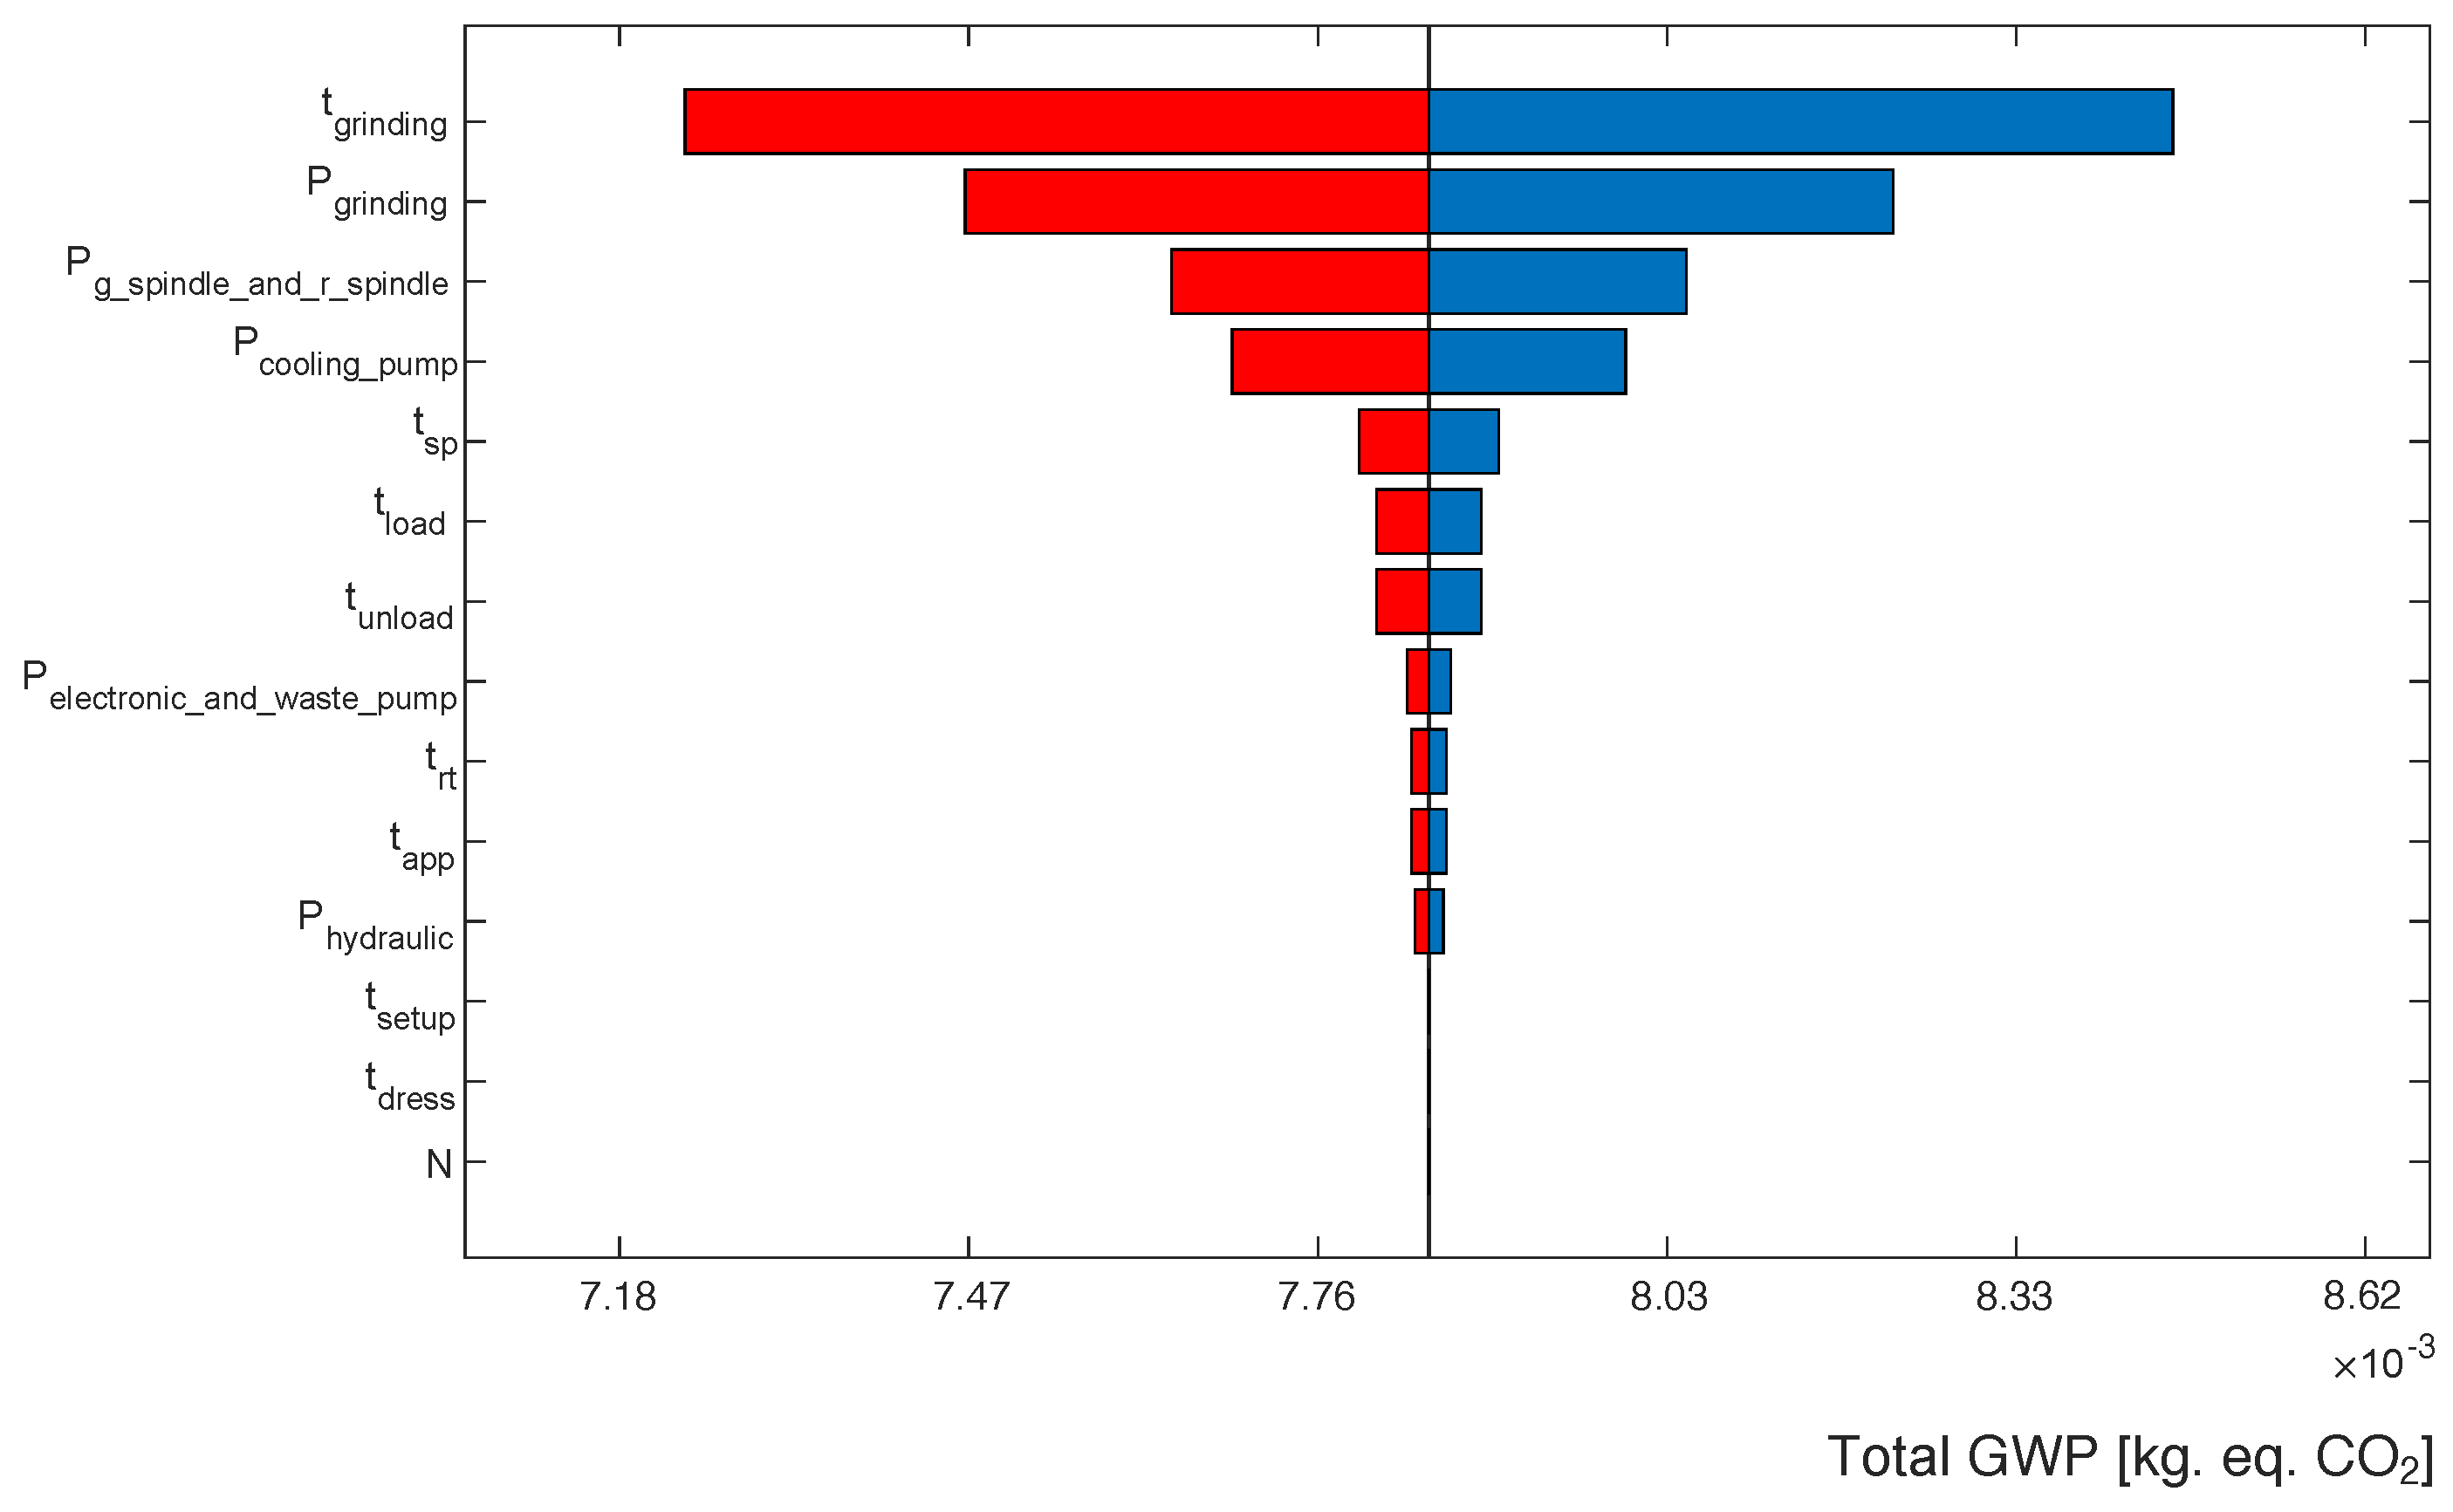
  • Sensitivity assessment is based on the quantitative estimation of the sensitivity for the ith process parameter P i to a chosen environmental indicator E I . In other words, the partial rate of change in P i with respect to E I is measured in the neighborhood of the nominal value of P i ( P i / E I ). The sensitivity is estimated at the nominal value for the process parameter, which is determined from empirical data for the process setup. Finally, a normalized sensitivity score ( S i ) for the i th process/inventory parameter from the set of all ( N P ) process parameters is calculated as shown in Equation (1).
    S i = s i m a x i N P ( | s i | )
  • Measurability assessment is performed through a questionnaire (see Supplementary Material S1) that evaluates five criteria describing the difficulty of measurement, adapted from the DVS framework described in the author’s previous work [43]. Supplementary Material S1 explains how to score the process parameters according to all five measurability criteria and provides a definition for each criterion. A normalized measurability score ( M i ) for the ith process/inventory parameter from the set of all ( N P ) process/inventory parameters is computed using the formula in Equation (2).
    M i = 1 C 1 D i × C 2 D i × C 3 D i × C 4 D i × C 5 D i m a x i N P ( C 1 D i × C 2 D i × C 3 D i × C 4 D i × C 5 D i )
    Here, C 1 D i , C 2 D i ,… C 5 D i represent the difficulty-related criteria scores for the ith process parameter, established from the questionnaire.
  • Actionability assessment defines whether a given process parameter is relevant for improving the environmental sustainability performance through the environmental indicator. Two aspects are evaluated on a 3-point Likert scale (High = +1, Medium = 0, Low = −1) (i) controllability of the process parameter during the production process ( C 1 A ), (ii) degree to which the process parameter can be controlled (affected) in the product/process planning stage ( C 2 A ), and (iii) feasibility of implementing the action the relevant controls ( C 3 A ). An overall score (A) is computed by averaging the ratings for the above questions, as shown in Equation (3).
    A i = C 1 A i + C 2 A i + C 3 A i 3
    Here, C 1 A i , C 2 A i , C 3 A i represent the actionability-related criteria scores for the ith process parameter, established from the questionnaire.
  • Reliability assessment is performed through a questionnaire (see Supplementary Material S1) that evaluates four criteria encoding factors that can affect the accuracy as well as the precision of process data measurements and is adapted from the DVS framework described in the author’s previous work [43]. Supplementary Material S1 explains how to score the process parameters according to all four reliability criteria and provides a definition for each criterion. The overall reliability score ( R i ) for the ith process/inventory parameter from the set of all ( N P ) process/inventory parameters is computed using the formula in Equation (4).
    R i = 1 C 1 V i × C 2 V i × C 3 V i × C 4 V i m a x i N P ( C 1 V i × C 2 V i × C 3 V i × C 4 V i )
    Here, C 1 V i , C 2 V i ,… C 4 V i represent the variability-related criteria scores for the ith process parameter, established from the questionnaire.
  • Timeliness assessment evaluates the ability of data collected on the process parameter to be available to decision-makers during product and process planning tasks, which could influence the environmental sustainability performance of the process. Timeliness is assessed on a 3-point Likert scale (High = +1, Medium = 0, Low = −1) and is based on the following aspects, (i) data collection and analysis for the process parameter can be conducted at a rate that is meaningful for product/process planning ( C 1 T ), (ii) data can be archived in systems that are accessible during product/process planning ( C 2 T ). An overall timeliness rating (T) is computed by averaging these two ratings, as shown in Equation (5).
    T i = C 1 T i + C 2 T i 2
    Here, C 1 T i and C 2 T i represent the timeliness-related criteria scores for the ith process parameter.
  • Human-centricity is also assessed on a 3-point Likert scale (High = +1, Medium = 0, Low = −1) by the process engineers and operators participating in the analysis. The aspects addressed under human-centricity, include (i) do all relevant stakeholders have a common understanding of the process parameter ( C 1 H ), (ii) do relevant stakeholders understand how the change in the process parameter influences the process performance ( C 2 H ) (iii) do relevant stakeholders have an understanding of how changes to the process parameters affect the sustainability aspects of the process performance ( C 3 H ), and (iv) do relevant stakeholders have the necessary skills to control the process parameter ( C 4 H )? An overall score (H) is computed, as shown in Equation (6).
    H i = C 1 H i + C 2 H i + C 3 H i + C 4 H i 4
    Here, C 1 H i , C 2 H i C 4 H i represent the human-centricity related criteria scores for the ith process parameter.
It should be noted that, as stated in the goal and scope definition, the involvement of domain experts is required for conducting the above evaluations. The information is produced by generating a detailed model of the system, and the mapping of inventory flows to process parameters is used as a basis for making the above evaluations. The objective of these evaluations is to identify the relative benefits of selecting a process performance indicator for a given manufacturing system. As the evaluation process is highly dependent on the system being analyzed (e.g., level of automation, standard operating procedure), results from the evaluation may not be transferable to other production setups for the same manufacturing process. An Excel-based questionnaire that can be used to evaluate the six criteria is provided in Supplementary Material (S1). The design and validity of the questionnaire were checked using discussions with process engineers and technicians and an expert assessment of the applicability of the framework to three conventional and automated manufacturing processes (plunge grinding, infeed grinding, and superfinishing) at two different production sites.

2.5. Selection of Performance Indicator(s)

Results from evaluating the six indicator selection criteria are used as the basis for selecting relevant process performance indicators. In general, a higher rating on all six criteria implies the parameter is more suitable for selection as a process performance indicator. It may be necessary to trade off performance on the six process performance selection criteria in practice. This could be achieved by establishing a threshold for filtering low-performing parameters and through additional discussions with the involved domain experts. As indicated in Figure 1, the overall process for selecting performance indicators is considered to be iterative, and each stage in the method could be refined based on an initial set of results.

3. Case Study

This section describes the case study used to demonstrate the application of the indicator selection methodology proposed in this work. The selection was based on the fact that the system represented a critical production operation in the company and was a significant source of manufacturing impacts for the produced product. Furthermore, the company was interested in upgrading the centerless grinding process, and its operation was flexible and could be optimized towards reducing the overall environmental impact of manufacturing. Prior research has also indicated the challenges in using inventory-based KPIs (e.g., volume of material removed) for monitoring the sustainability performance of finishing processes [32]; this makes infeed centerless grinding a suitable candidate for demonstrating the use of process parameter-based KPIs. The above factors motivated the authors to select an infeed centerless grinding process in a high-volume production system for shaft and rotor production within a large pump manufacturing company for the case study. We begin the description of the case study by presenting a short background on centerless grinding and subsequently describe the specific system utilized for the case study.

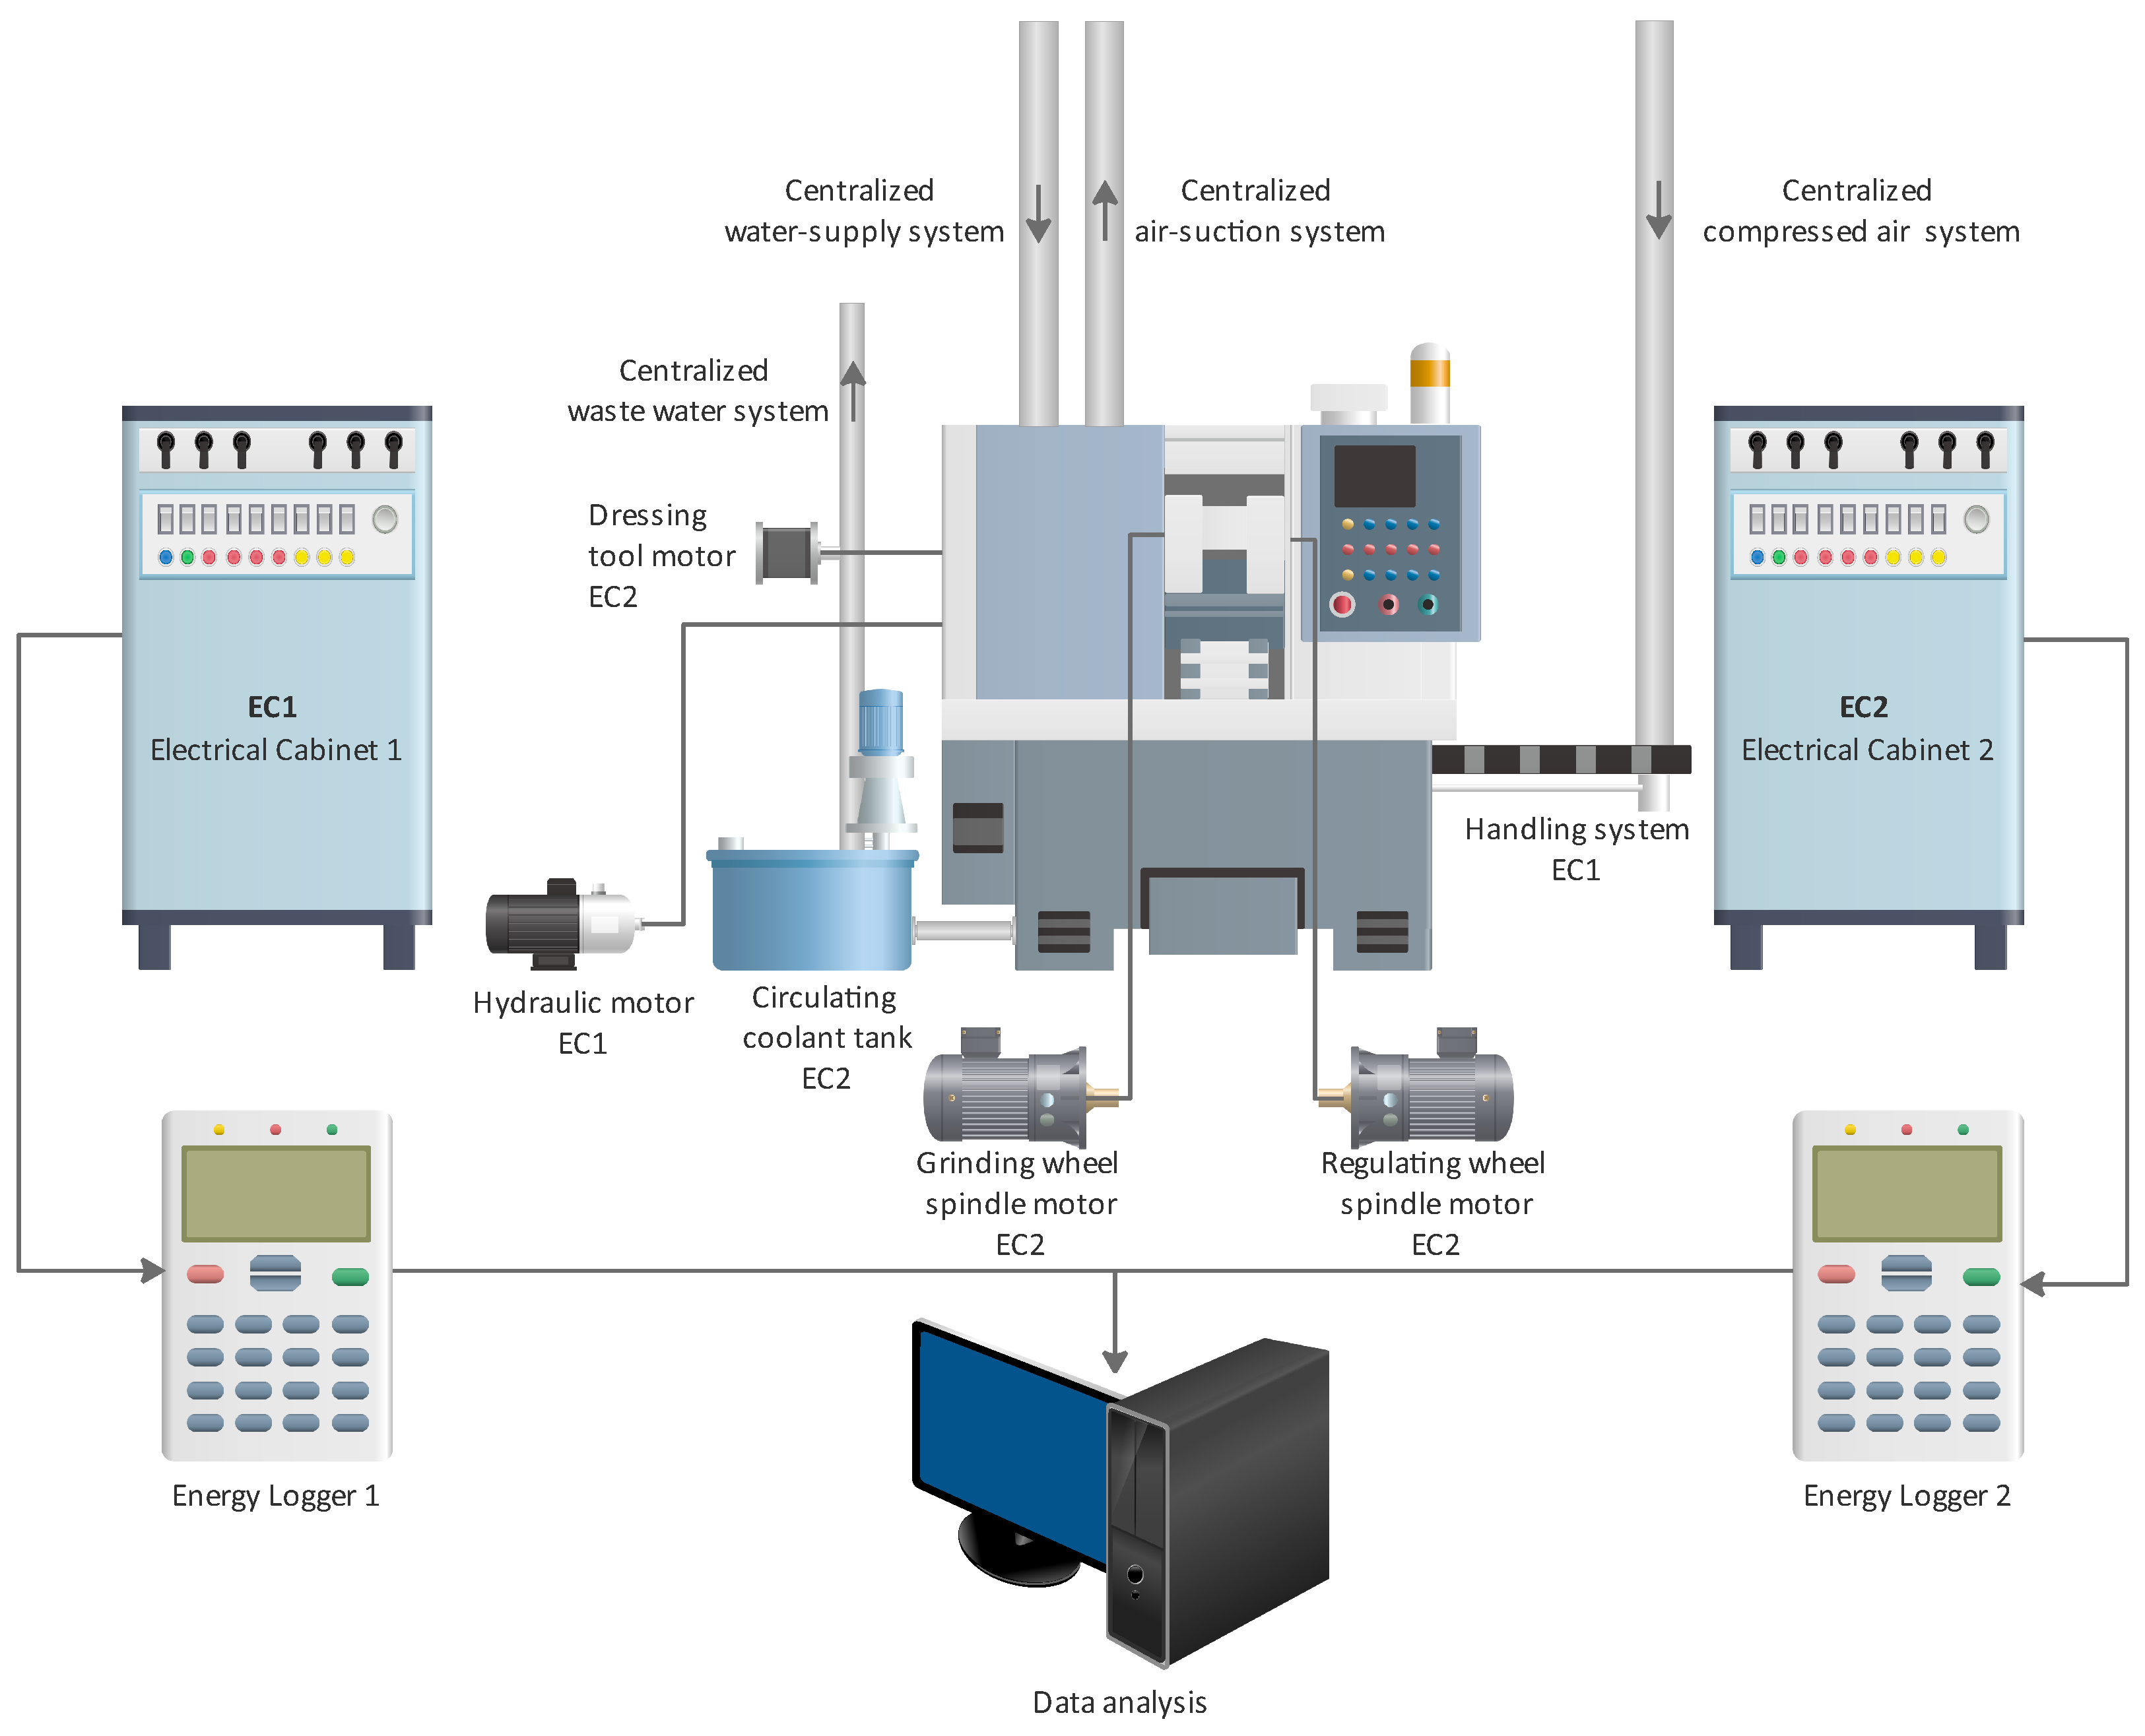
3.1. System Description

The infeed grinding process belongs to the family of centerless grinding processes that are used to machine cylindrical workpieces to fine tolerances and high surface finish. The process setup for centerless grinding typically consists of three main grinding elements: (i) a grinding wheel, (ii) a regulating wheel, and (iii) a work rest blade. The regulating wheel axis is parallel to the grinding wheel axis and forces the workpiece against the work rest blade while the grinding wheel removes the workpiece material. Radial feed is provided through the inwards and outwards motion of the regulating wheel, and thus, the feed rate is specified by the axial (linear) speed of the regulating wheel. The stability of the centerless grinding process is ensured by maintaining a greater friction force between the workpiece and the regulating wheel than the friction force between the workpiece and the grinding wheel [26]. This is achieved by selecting a regulating wheel material such that there is a high friction coefficient between the wheel material and the workpiece material, as well as an angle provided at the top of the work support blade in order to create a normal force that presses the workpiece against the regulating wheel (Cincinnati Machines (Cincinnati, OH, USA), Technical Documentation for Cincinnati Milacron 3-300 Twin Grip). Due to the high friction coefficient between the regulating wheel and the workpiece, the surface speed of the workpiece is governed by the surface speed of the regulating wheel. The grinding process can be supplied with workpieces either manually or automatically.
The case study was conducted on a fully automated infeed centerless grinding process using a Danobat Estarta 318 MV-DC machine. This case study includes two types of peripheral systems, (i) peripherals that are directly connected to the grinding process, and (ii) peripherals that are a part of the centralized production system and supply/evacuate resources to multiple processes. For the studied process, coolant, water, and compressed air were supplied by a centralized system.

3.2. Application of Indicator Selection Methodology

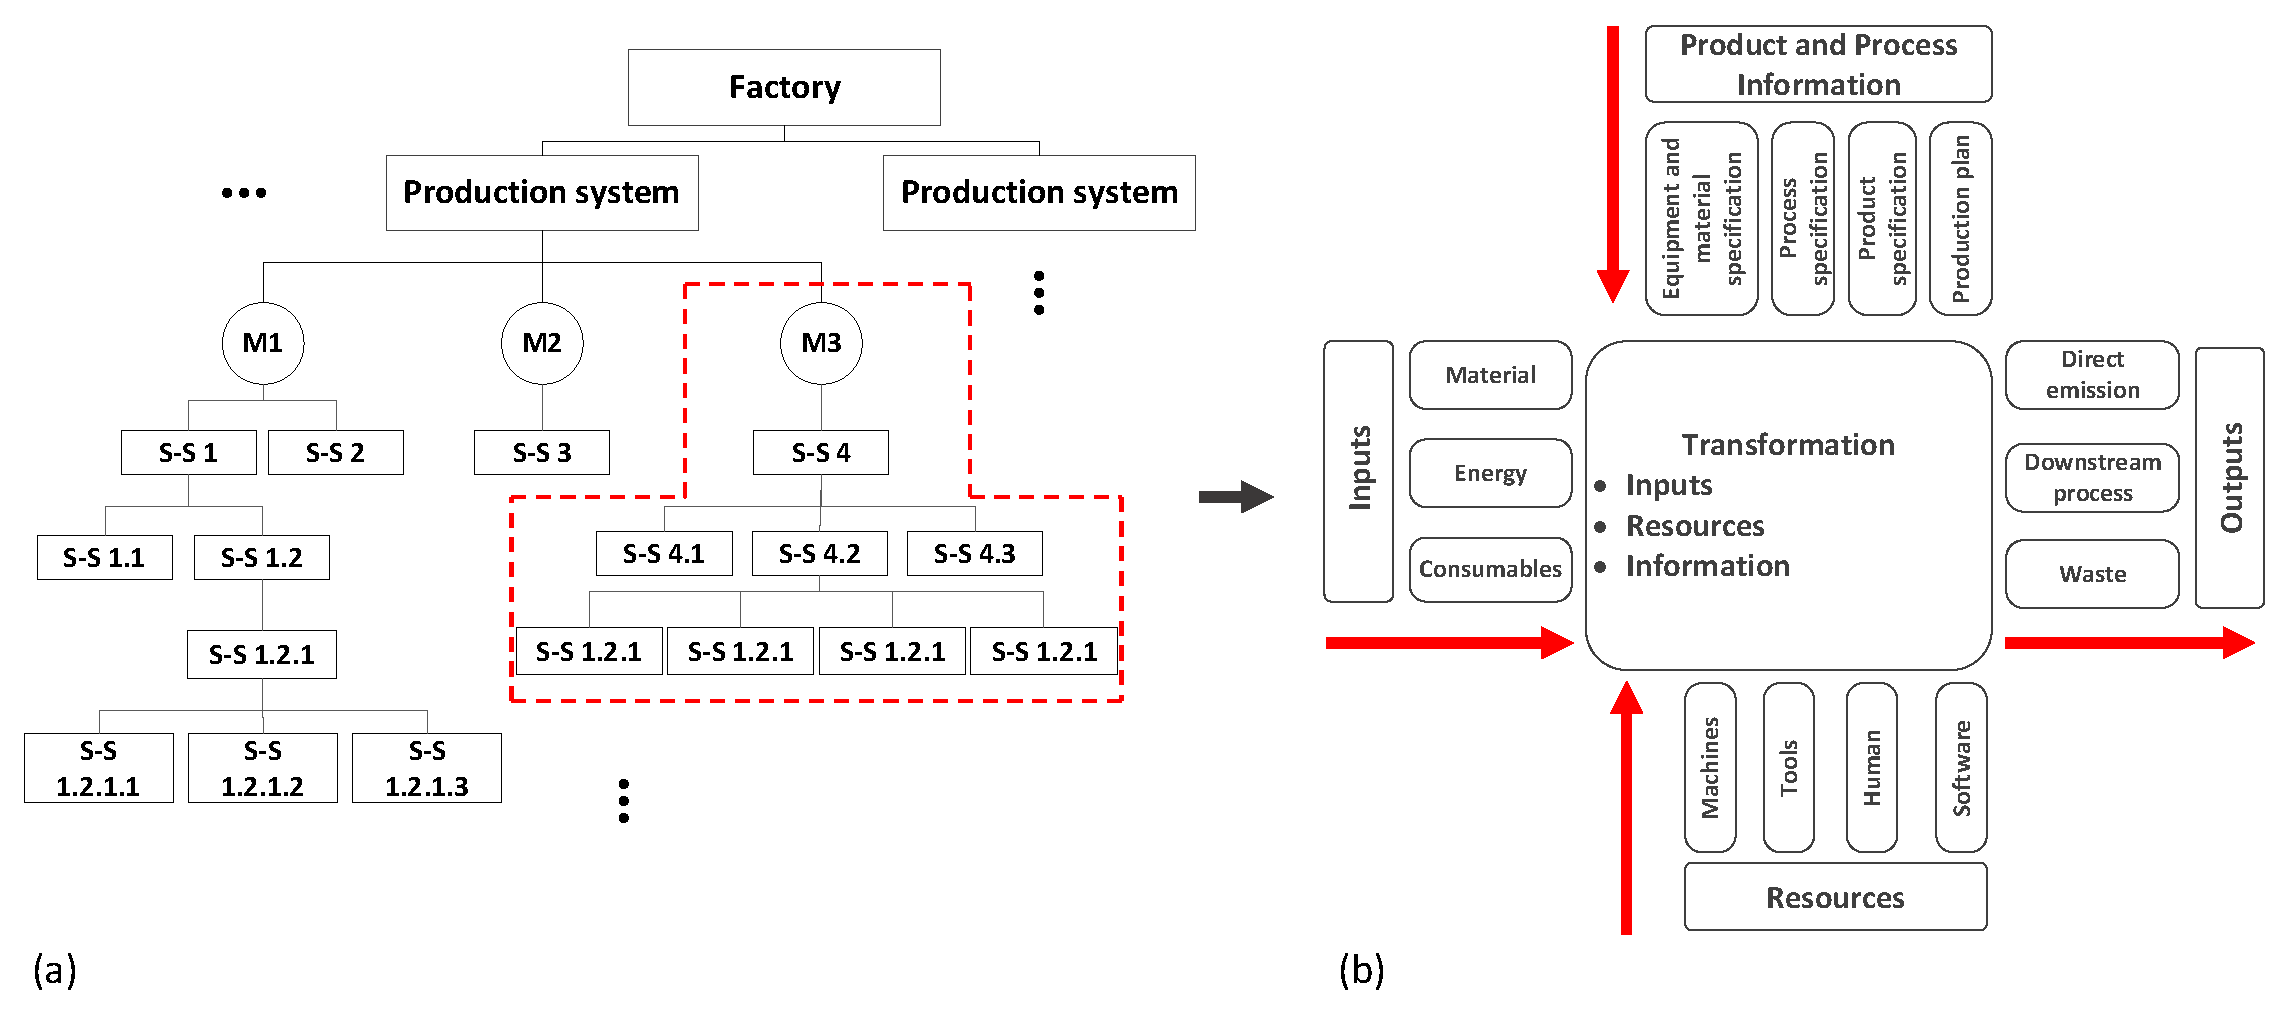
3.2.1. Manufacturing System Selection and Modeling

Goal and scope definition: The goal and scope definition for developing the monitoring system was performed in collaboration with two domain experts: one process engineer and one technician with experience in the studied infeed process. Based on the sustainability strategy of the company, the focus was restricted to monitoring and reducing the climate change-related impacts, i.e., the global warming potential (GWP) of the system. Process GWP was assessed based on the resources consumed to machine a specific rotor design, as the focus was to minimize process impacts during the aforementioned operation. A preliminary assessment of the system showed that electrical energy consumption was the most significant contributor to the above indicator, as the material consumption (i.e., cooling fluid, lubricating fluid, and wheel debris) per produced part, and consequently, their contribution to GWP was insignificant. Therefore, the study focuses on the selection of indicators for GWP reduction through reducing energy use. While the focus on GWP simplified the inventory collection process, alternate environmental impacts, e.g., emissions to water or air due to cooling fluid use, were not considered and, therefore, not reflected in the eventual choice of process performance indicators.
Generate a detailed model of the manufacturing system: A decomposed system model for the centerless grinding process was generated by the authors in collaboration with the domain experts (see Figure 3). A detailed model of the manufacturing system, including relevant sub-systems and inventory flows is also shown in Figure 3. The analyzed infeed centerless grinding process setup is typically used to machine two types of rotors that have the same diameters but different material structures. For example, the removal of softer material (e.g., copper) requires a smaller depth of cut, compared to the depth of cut needed to remove material from workpieces made from tougher materials (e.g., steel). Therefore, the environmental sustainability performance of this process is also influenced by the type of material and process parameters such as the depth of cut. Relevant inventory flows for the studied process are shown in Figure 3 and include,
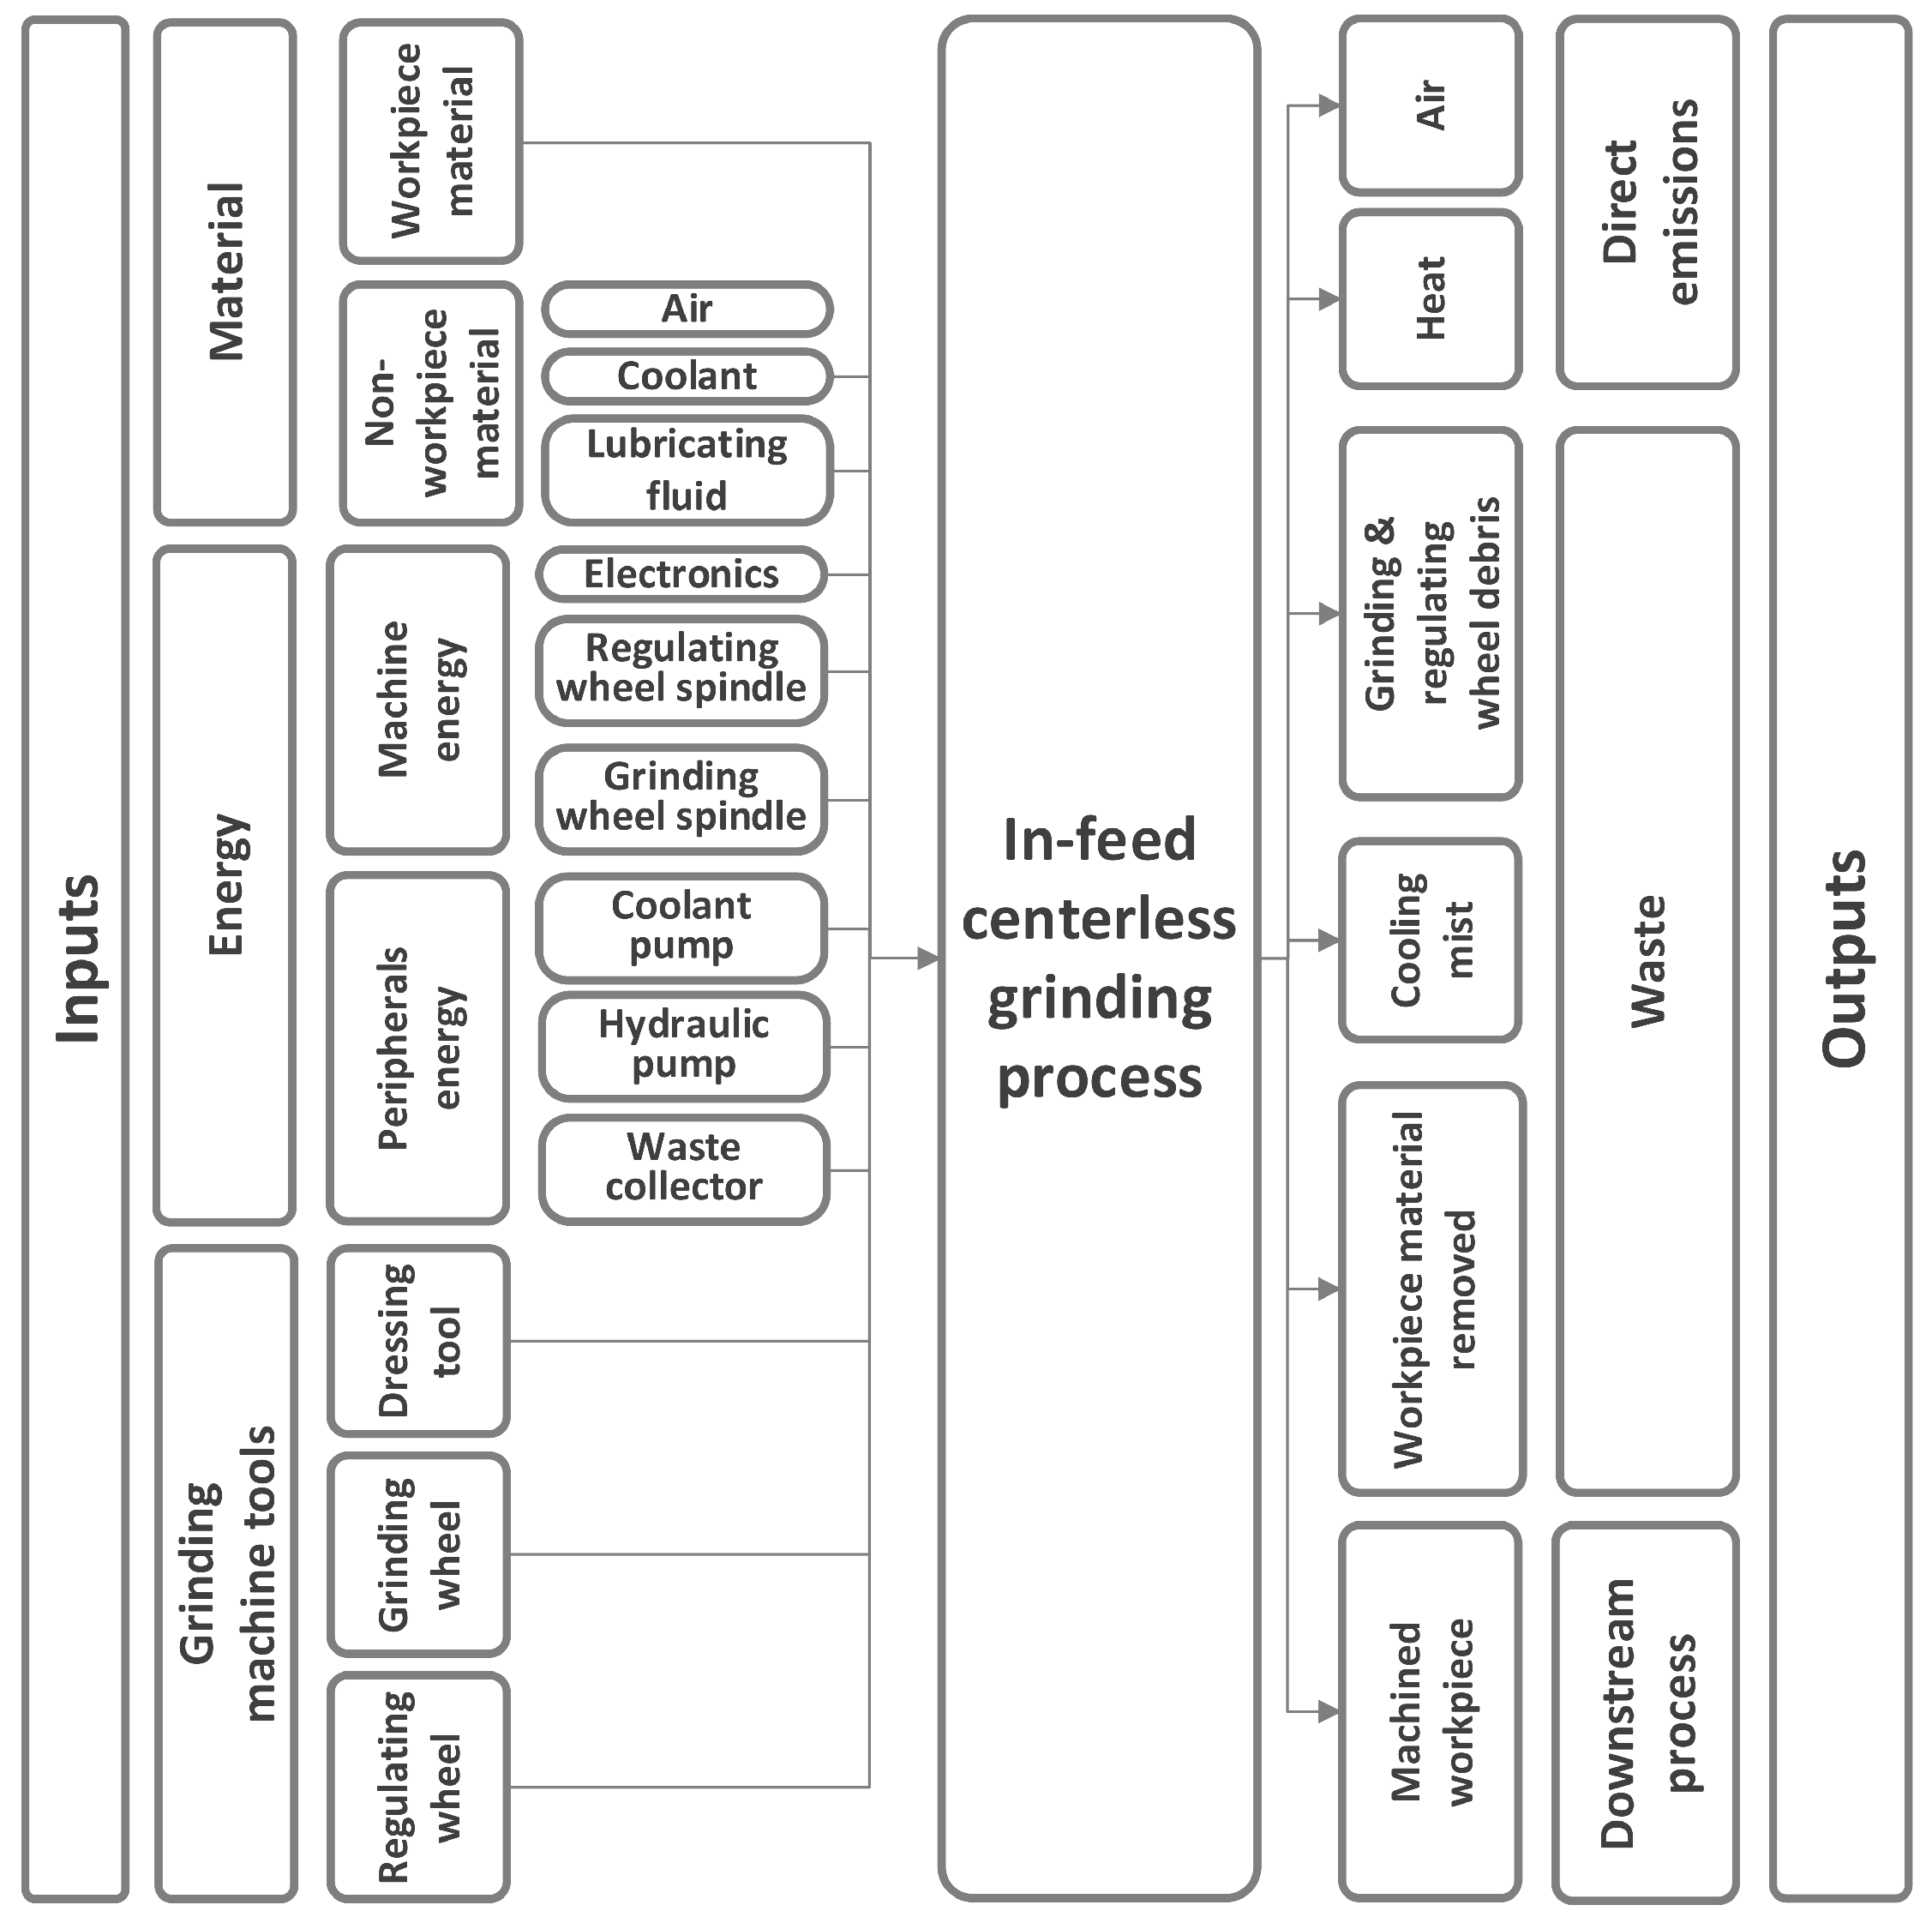
  • Input materials: A workpiece (WP) that is to be ground to the required specifications while fulfilling predefined dimensional and quality requirements as well as material characteristics. Other material inputs, e.g., grinding, regulating, and dressing wheels, that have to be replaced periodically, e.g., lubricating fluid, cooling fluid, and compressed air.
  • Input energy: The centerless grinding machine, peripherals, and auxiliary systems are driven by electrical energy. Significant sub-systems with regards to energy consumption are broken down in terms of the (i) main machine: electronics, regulations wheel, and grinding wheel spindles, and (ii) peripheral systems: coolant pump, hydraulic pump, and waste collector.
  • Outputs emissions and wastes: These include (i) direct emissions: air, heat (ii) produced wastes: cooling mist, grinding wheel and the regulating wheel debris, and removed workpiece material.
  • Output products: The ground workpiece is transferred to other downstream manufacturing processes.
Figure 3. Decomposed system model and process flows of the in-feed centerless grinding process.
Sustainability 16 00806 g003
The detailed list of identified process parameters and inventory flows, as well as the process sequence for the centerless grinding process is provided in the Supplementary Information (Sections S2.2 and S2.3).

3.2.2. Relate Inventory Flows and Process Parameters

Analytical inventory modeling: Using the identified process parameters from the decomposed system model and the process sequence, a power-time graph was constructed for the process. This enables the construction of analytical models for process GWP based on the total energy consumption of the centerless grinding process. The equations for estimating GWP and total energy consumption for the in-feed centerless grinding process are provided in S2.3 in the Supplementary Information.
Experimental setup for inventory modeling: The experiment was conducted in a real-world production setting, and the schematic illustration of the process setup and hardware configuration is presented in Figure 4. It aimed to collect nominal values for power and time-related process parameters and corresponding inventory data (i.e., energy consumption) necessary for performing sensitivity analysis. To run the in-feed centerless grinding process setup, process parameters for the specific type of rotor were set and remained constant throughout the entire experiment. The energy loggers were configured for data sampling every 1 s, at a nominal frequency of 50 Hz, and using a 3-phase 4-wire Y electrical connection. Based on the analytical model and the power-time graph provided in Section S2.3 in Supplementary Material, it was determined which parameters need to be measured for different power modes. However, to measure the parameters, it was necessary to isolate the power draw for individual peripheral systems, as depicted in Figure 4. The experiment was conducted in three iterations; iteration 1 focused on experimentally measuring power-related parameters for the centerless grinding setup, while iterations 2 and 3 mirrored the nominal production process in order to measure time-related parameters and process energy consumption.
In the first iteration, dedicated to measuring power parameters, it was necessary to manually control the peripheral equipment. To initiate the experiment, the machine was shut down, and the energy logger showed no signals of power draw. Subsequently, the peripheral systems were switched on one at a time, enabling the power data sampling for the specific system. Equipment, including the coolant pump and the handling system, could not be controlled manually because their initiation was triggered by the working mode of other equipment. Nonetheless, the operation of these systems remained unchanged over the experiments, as the geometry of the rotor being produced as well as process parameters, including the peripheral speed of the grinding wheel, feed rate, depth of cut, spark-out time, number of cycles for lubricating the regulating wheel and dressing the grinding wheel, were held constant. The sequence of activating the peripheral systems, as well as the type of activation, is presented in Table 3. To generate the nominal value, 5–10 min of data samples were collected (per parameter) at a 1 Hz sampling rate after equipment stabilization and averaged over time.
The second and third iterations followed the standard operating procedure (with the same operator) and sequence of operations for the production of a rotor (refer to the power-time graph in Section S2.3 of the Supplementary Material). During this phase of the experiment, energy loggers remained connected to the electrical cabinets while time parameters were measured for individual operations. The decision to replicate the same setup in the third iteration was intentional so as to average the manually collected time-related parameters over two independent experiments. Nominal values for both power and time parameters are presented in Section S2.4 of the Supplementary Material.
Figure 4. Schematic illustration of the in-feed centerless grinding process and hardware configuration of the experimental setup.
Sustainability 16 00806 g004

3.2.3. Performance Indicator(s) Definition

Compute selection criterion for process parameters: Sensitivity analysis was performed by varying the reported nominal values of the process parameters (described in S2.4) by a range of ± 10 % , and estimating the corresponding effects on GWP scores using the analytical model described in S2.3. An experimental assessment of sensitivity could not be performed due to the high utilization rate of the centerless grinding process in the company’s day-to-day production. The measurability, actionability, reliability, timeliness, and human-centricity scores for the identified set of process parameters were assessed by the two domain experts as per the described methodology. The Excel-based questionnaire used for this assessment is provided as a part of the Supplementary Information (S1). Selection of performance indicator(s): The definition of process performance indicators with regard to the GWP-related performance of the centerless grinding process was based on the evaluation of the 6 selection criteria. In this regard, the top three process parameters suitable for monitoring were determined based on their overall score across the 6 selection criteria. In this case study, no specific targets were established for the identified performance indicators.

4. Results and Discussion

Results from the sensitivity analysis are shown in Figure 5. As shown, the grinding time ( t g r i n d i n g ) was the most sensitive parameter to the total GWP of the centerless grinding process ( G W P t o t a l ). A ± 10 % variation in t g r i n d i n g around its nominal value resulted in a variation of ± 7.80 % for G W P t o t a l . The sensitivity of G W P t o t a l to variation in grinding power consumption ( P g r i n d i n g ), spindle power of the grinding wheel ( P g s p i n d l e ) and the spindle power of the regulating wheel ( P r s p i n d l e ) was also notable at ± 4.86 % , ± 2.70 % , and ± 2.70 % , respectively. The results from the sensitivity analysis are the same for P g s p i n d l e and P r s p i n d l e as, due to the complexity of the process setup, it was only possible to measure the combined energy consumption of grinding and regulating wheel spindles. Variation in sparkout time ( t s p ) had a moderate effect on G W P t o t a l ( ± 0.73 % ), even though the machine setup allows continuous monitoring of this parameter.
Results detailing the measurability assessment and reliability assessment are shown in Table 4. Please note that all provided results are averaged across individual ratings provided by the domain experts. Results are listed in ascending order, where a higher score indicates a parameter is considered to be more measurable and more reliable relative to the rest of the parameters. Even though the infeed centerless grinding process is fully automated, the process setup does not enable monitoring and acquisition of the process parameters listed in Table 4. This resulted in most parameters mentioned being scored at 3 for C 1 D by the domain experts. Results also show that it is possible to measure the specified process parameters at a high level of granularity and that the operators have in-depth knowledge of the production setup and knowledge of how to measure all listed parameters in Table 4, as evidenced by a low score (1) for both C 2 D and C 5 D . Results from the complexity evaluation for infeed centerless grinding setup ( C 3 D ) indicate that while direct measurement was possible for all listed parameters, most such measurements would require minor modifications of the process setup ( C 3 D = 2). Finally, measurement of the listed parameters causes minor or no disruptions to production, as indicated by the low scores ( C 4 D = 1 or C 4 D = 2) for all process parameters. In general, the measurability rating M for all process parameters was observed to be relatively close. This stems from the fact that the infeed centerless grinding setup is a fully automated process that already has some monitoring of process parameters. The setup can also be easily modified to enable monitoring of other time- and power-related parameters. Results from the reliability assessment show a similar tendency to the measurability score. In general, the reliability rating R for all process parameters is high and observed to be relatively close. The measurement of almost all listed parameters is affected by the lack of a standard operating procedure, as indicated by the high scores ( C 1 V 3). For example, the last standard procedure to set process parameters and load the work pieces causes significant variabilities in setup, loading, and unloading times ( t s e t u p , t l o a d i n g , t u n l o a d i n g ). Similarly, the lack of clear guidance on setting a specified spindle power for the grinding and regulating wheel affects power measurements for these components ( P g s p i n d l e and P g r i n d i n g ). Results show that P g s p i n d l e and P g r i n d i n g can also vary due to process variations and the fact that the machining of the different parts can impact the measurement of the parameters ( C 2 V 1). Variabilities in environmental conditions and the reliability of the measurement process itself (i.e., accuracy and precision) do not significantly affect the overall reliability score ( C 3 V = 1 & C 4 V = 1) for all process parameters.
Results from the actionability, timeliness, and human-centricity assessment are shown in Table 5. Please note the provided results are averaged across individual ratings provided by the six domain experts. Results are listed in ascending order, where a higher score indicates a better performance along the specified indicator selection criterion. The actionability measurement results showed that the time parameters in the case of criterion C 1 A were assessed with +1, mostly due to the fact that the infeed grinding setup is automated. Considering that the time parameters are inputs to the process and can be modified in isolation, they can be controlled/changed through the program. However, t s e t u p has significantly lower scores compared to the other time-related parameters. As shown in Table 5, it was scored with 0 for ( C 1 A ) and ( C 2 A ) . This is due to the fact that the setup operation for the infeed grinding machine is entirely manual. It is difficult to plan/predict and control the parameter as it depends on the operators’ level of experience and machine state. Furthermore, power-related parameters were generally not easily controlled, as they depend on a significant number of parameters. For example, P g r i n d i n g cannot be controlled in isolation in the current setup. Similarly, P s p i n d l e g and P s p i n d l e r are set in accordance with other process parameters and cannot be controlled individually as the production setup does not power the spindles separately. On the contrary, a majority of parameters were scored with +1 for C 3 A criterion; as the existing setup is automated, it is easy to implement modifications to the setup that can make these parameters controllable. The overall timeliness score shows the readiness of the infeed production setup to enable access to the process parameters to the relevant stakeholders. The existing setup of the infeed grinding process does not enable data collection of the process parameters at the specified rate relevant for the process planning stage. Consequently, the majority of the parameters were scored as −1 for C 1 T . However, N was scored with +1 as the setup has access to this parameter, and it can be archived in existing systems. Human-centricity scores showed that there is a common understanding of process parameters and their influence on process performance. However, there is a lack of understanding of the influence of individual power and time parameters on sustainability performance. Thus, all time- and power-related parameters were assessed as −1 for C 3 H .
The most significant process parameters for monitoring process GWP performance are listed in Table 6. The selection of the four process performance indicators, i.e., t g r i n d i n g , P g r i n d i n g , P c o o l i n g _ p u m p , and t s p , with regard to the GWP-related performance of the infeed centerless grinding process was based on their overall score across the six indicator selection criteria. The sensitivity analysis showed that the t g r i n d i n g and P g r i n d i n g have the highest influence on the total GWP of the process. Thus, variations in the process parameters can significantly influence process GWP performance. However, human-centricity assessment showed that stakeholders were not aware of the individual influence of process parameters on the sustainability performance of the process. Thus, continuous monitoring of these parameters, in a manner that can be made visible to stakeholders, can be viewed as highly important. In particular, P g r i n d i n g is not an independent parameter, and small changes in the process setup can lead to unexpected changes in the grinding power consumption. Process GWP performance was moderately sensitive to P c o o l i n g _ p u m p . However, the actionability score for P c o o l i n g _ p u m p is greater than P g r i n d i n g as it represents the power consumption of a peripheral system that is independent of process mechanics. Thus, there is a good understanding of how P c o o l i n g _ p u m p influences the overall grinding process. Nevertheless, the measurability assessment showed all parameters are accessible on the high-granularity level, and relatively small upgrades in the production setup could enable continuous monitoring of the parameters. t s p is the only parameter that is directly accessible and controlled through the existing setup, and decreasing this parameter can result in a corresponding decrease in process GWP.
Figure 5. Sensitivity of time- and power-related process parameters with regards to the total process energy consumption for the infeed centerless grinding process. The red color indicates the change in G W P t o t a l for a 10 % change for each process parameter, compared to their nominal values, and vice versa ( + 10 % ) for the blue color.
Sustainability 16 00806 g005
In terms of the utility of bottom-up KPIs and their relation to the overall organizational goals regarding sustainability, the case study focused on a company with an overall ambition of transitioning to net-zero climate impact operations, including impacts resulting from manufacturing. Currently, these goals are translated into top-down KPIs in terms of monitoring energy, water, air, and other resource consumption in production. Such KPIs are used to justify production interventions and upgrades when there is a significant increase in their values over past baselines. However, the experts involved in the case study indicated that such KPIs can identify a change in resource consumption but do not point to the underlying reason for the change. Consequently, there is little room for systematic process improvement and proactive optimization based on such KPIs. On the other hand, the bottom-up, process parameter-based KPIs directly correspond to the processes being analyzed and allow for the above activities to occur. Even so, the direct contribution of these KPIs to the overall goals is challenging to establish, requiring that resource consumption data need to be actively monitored across the production system.
Table 4. Measurability and reliability assessment of process parameters for the infeed centerless grinding setup. Results are averaged across all respondents, and the scores are listed in ascending order. A larger score indicates higher measurability/reliability. Please see the questionnaire in S1 for further details.
Criteria
 Parameter C 1 D C 2 D C 3 D C 4 D C 5 D M
Measurability P g r i n d i n g 312210.99616
t g r i n d i n g 312210.99616
P h y d r a u l i c 3121.5010.99712
P r s p i n d l e 3121.5010.99712
P g s p i n d l e 3121.5010.99712
P e l _ w p 311.501.5010.99784
t l o a d i n g 312110.99808
t u n l o a d i n g 312110.99808
t s e t u p 312110.99808
P c o o l i n g _ p u m p 312110.99808
t d r e s s i n g 312110.99808
t a p p 2.5012110.9984
t r t 2.5012110.9984
t s p 111110.99968
N111110.99984
 Parameter C 1 V C 2 V C 3 V C 4 V R
Reliability P g r i n d i n g 3.50211 0.9888
P g s p i n d l e 41.5011 0.9904
P r s p i n d l e 3111 0.9904
t l o a d i n g 4111 0.9936
t a p p 4111 0.9936
t g r i n d i n g 4111 0.9936
t s p 4111 0.9936
t r t 4111 0.9936
t u n l o a d i n g 4111 0.9936
t s e t u p 4111 0.9936
P e l _ w p 4111 0.9936
P c o o l i n g _ p u m p 4111 0.9936
P h y d r a u l i c 4111 0.9936
t d r e s s i n g 4111 0.9936
N1111 0.9984
Table 5. Actionability, timeliness, and human-centricity assessment for the process parameters of the in-feed centerless grinding process. Results are averaged across all respondents.
Criteria
 Parameter C 1 A C 2 A C 3 A  A
Actionability P g r i n d i n g −101 0
P h y d r a u l i c 000 0
P r s p i n d l e 000 0
P g s p i n d l e 000 0
t s e t u p 001 0.3333
P c o o l i n g _ p u m p 001 0.3333
P e l _ w p 011 0.6666
t g r i n d i n g 011 0.6666
t l o a d i n g 111 1
t u n l o a d i n g 111 1
N111 1
t d r e s s i n g 111 1
t s p 111 1
t a p p 111 1
t r t 111 1
 Parameter C 1 T C 2 T  T
Timeliness P h y d r a u l i c −10 −0.5
P g r i n d i n g −10 −0.5
P g s p i n d l e −10 −0.5
P r s p i n d l e −10 −0.5
t s e t u p −10 −0.5
P e l _ w p −10 −0.5
P c o o l i n g _ p u m p −10 −0.5
t l o a d i n g −10 −0.5
t a p p −10 −0.5
t g r i n d i n g −10 −0.5
t r t −10 −0.5
t u n l o a d i n g −10 −0.5
t d r e s s i n g −10 −0.5
t s p 00 0
N11 1
 Parameter C 1 H C 2 H C 3 H C 4 H H
Human-centricity t s e t u p 10−110.25
P e l _ w p 10−110.25
P c o o l i n g _ p u m p 10−110.25
P g r i n d i n g 11−100.25
P g s p i n d l e 11−100.25
P r s p i n d l e 11−100.25
P h y d r a u l i c 11−110.5
t d r e s s i n g 11−110.5
t l o a d i n g 11−110.5
t a p p 11−110.5
t g r i n d i n g 11−110.5
t s p 11−110.5
t r t 11−110.5
t u n l o a d i n g 11−110.5
N11010.75
Table 6. Selected performance indicators for the infeed centerless grinding process.
ParameterPerformance IndicatorSMARTH
t g r i n d i n g % reduction in grinding time over the baseline value of 8.0 s7.8%0.996160.66660.9936−0.50.5
P g r i n d i n g % reduction in grinding power consumption over the baseline value of 8.3 kW4.9%0.996160.00.9888−0.50.25
P c o o l i n g _ p u m p % reduction in cooling pump power consumption over the baseline value of 2.01 kW2.7%0.998080.33330.9936−0.50.25
t s p % reduction in sparkout time over the baseline value of 2.0 s0.73%0.999681.00.99360.00.5

5. Conclusions

This paper discusses a methodology for the bottom-up definition of process indicators to monitor the environmental sustainability-related performance of manufacturing processes in real-world production settings. Indicator selection and definition are carried out by assessing the sensitivity, measurability, actionability, reliability, timeliness, and human-centricity of process parameters with respect to a given environmental impact category. The application of this method is demonstrated for an infeed centerless grinding process in a large pump manufacturing company to improve climate change-related performance. Results showed that the percentage reduction in grinding time, the percentage reduction in grinding power, the percentage reduction in sparkout time, and the percentage increase in batch size (over their baseline values) serve as useful performance indicators for reducing the global warming potential associated with process energy consumption.
One of the significant limitations in applying the methodology in practice is the need for domain experts in the evaluation process. Although the domain experts agreed on the usefulness of the proposed methodology, they noted that significant amounts of data need to be collected, analyzed, and interpreted to arrive at the indicator definitions. Such data (and access to expertise) might not be readily available for other processes, which could present additional challenges in applying the proposed method. Furthermore, it should be noted the assessment performed by the domain experts is specific to a given process and production setup. Therefore, transferring the results to other similar processes requires careful consideration and may not always be possible. Finally, it should be noted that the methodology relies on the knowledge of domain experts. Its validity is, therefore, strongly linked to their experience and understanding of the manufacturing process. Involving multiple independent experts in the assessment process could mitigate underlying biases or misinformation of a single decision-maker. Nonetheless, the utility of the selected indicators can only be validated through long-term monitoring of these indicators and observing if they help enable sustainability-related process improvements. A long-term validation was not conducted as a part of this work due to time constraints. Further studies that benchmark the proposed indicator selection methodology with other relevant methods for defining process parameter-based KPIs are required to strengthen the validity of the presented work.
Our future work will aim to address the aforementioned shortcomings by exploring more streamlined approaches for evaluating the six indicator selection criteria for relevant process parameters. We will also investigate approaches for integrating uncertainties resulting from subjective evaluation of the indicator selection criteria into the decision-making process for selecting the indicators to be monitored. We also aim to conduct long-term studies in the company evaluating the benefit of implementing the prescribed monitoring strategies and evaluating any resulting environmental sustainability-related benefits from doing so.

Supplementary Materials

The following supporting information can be downloaded at https://www.mdpi.com/article/10.3390/su16020806/s1: Supplementary Material (S1), Excel-based questionnaire for SMARTH assessment. Supplementary Material (S2), Detailed information about infeed centerless grinding process.

Author Contributions

Conceptualization, M.G. and D.R.; methodology, M.G. and D.R.; validation, M.G.; resources, M.G. and B.V.; original draft preparation, M.G.; writing—review and editing, M.G., B.V. and D.R.; visualization, M.G.; supervision, D.R. and B.V.; project administration, B.V.; funding acquisition, D.R. All authors have read and agreed to the published version of the manuscript.

Funding

This work is supported by funding from the Grundfos Advanced Manufacturing Engineering division. This paper represents the original findings and opinions of the authors. No official recommendation or endorsement of the presented work is implied by Grundfos A/S.

Institutional Review Board Statement

Not applicable.

Informed Consent Statement

Not applicable.

Data Availability Statement

Data will be provided on reasonable request.

Conflicts of Interest

Devarajan Ramanujan reports that financial support for conducting this research work was provided by Grundfos A/S, wherein the case study was also conducted. The contents and results reported in this manuscript reflect the authors’ independent findings and were not influenced or edited in any manner by the funding agency.

Nomenclature

M # Corresponding machine tool for identified production system
S # Corresponding sub-systems for identified production system
S i Normalized sensitivity score of the ith process parameter
s i Sensitivity score of the ith process parameter
N p Total number of process/inventory parameters
M i Normalized measurability score of the ith process parameter
C 1 D i Measurability criterion evaluating digitalization of the ith process parameter
C 2 D i Measurability criterion evaluating data granularity of the ith process parameter
C 3 D i Measurability criterion evaluating complexity of the process architecture of the ith process parameter
C 4 D i Measurability criterion evaluating the impact of data collection on the process of the ith process parameter
C 5 D i Measurability criterion evaluating operator/technician knowledge of the ith process parameter
A i Overall actionability score of the ith process parameter
C 1 A i Actionability criterion evaluating controllability of the ith process parameter during the production process
C 2 A i Actionability criterion evaluating the degree to which ith process parameter can be controlled (affected) in the product/process planning stage
C 3 A i Actionability criterion evaluating the possibility of implementing the action to the relevant controls of the ith process parameter
R i Overall reliability score of the ith process parameter
C 1 V i Reliability criterion evaluating the standard operating procedure of the ith process parameter
C 2 V i Reliability criterion evaluating the variability of process setup for ith process parameter
C 3 V i Reliability criterion evaluating the variability of the environmental conditions of the ith process parameter
C 4 V i Reliability criterion evaluating the accuracy of the ith process parameter measurement
T i Overall timeliness score of the ith process parameter
C 1 T i Timeliness criterion evaluating if data collection and analysis for the ith process parameter can be conducted at a rate that is meaningful for product/process planning
C 2 T i Timeliness criterion evaluating if data can be archived in systems that are accessible during product/process planning for ith process parameter
H i Overall human-centricity score of the ith process parameter
C 1 H i Human-centricity criterion evaluating if all relevant stakeholders have a common understanding of the ith process parameter
C 2 H i Human-centricity criterion evaluating if all relevant stakeholders understand how the change in ith process parameter influences the process performance
C 3 H i Human-centricity criterion evaluating if all relevant stakeholders have an understanding of how changes to ith process parameters affect the sustainability aspects of the process performance
C 4 H i Human-centricity criterion evaluating if all relevant stakeholders have the necessary skills to control ith process parameter?
P g r i n d i n g Grinding power consumption
P h y d r a u l i c Power consumption of the hydraulic system
P c o o l i n g _ p u m p Power consumption of the cooling pump
P g s p i n d l e Power consumption of the grinding wheel spindle motor
P r s p i n d l e Power consumption of the regulating wheel spindle motor
P e l _ w p Power consumption of the electronic system and waste pump
t l o a d i n g Loading time
t u n l o a d i n g Unloading time
t a p p Approaching time of the regulating wheel
t r t Retracting time of the regulating wheel
t s p Spark-out time
t g r i n d i n g Grinding time
t s e t u p Setup time
t d r e s s i n g Dressing time
NSize of the batch

References

  1. International Energy Agency. CO2 Emissions in 2022; International Energy Agency: Paris, France, 2023. Available online: https://www.iea.org/reports/co2-emissions-in-2022 (accessed on 17 September 2023).
  2. ISO 14040:2006; Environmental Management—Life Cycle Assessment—Principles and Framework. International Organization for Standardization: Geneva, Switzerland, 2006. Available online: https://www.iso.org/standard/37456.html (accessed on 17 September 2023).
  3. Kim, D.B.; Shin, S.J.; Shao, G.; Brodsky, A. A decision-guidance framework for sustainability performance analysis of manufacturing processes. Int. J. Adv. Manuf. Technol. 2015, 78, 1455–1471. [Google Scholar] [CrossRef]
  4. Igos, E.; Benetto, E.; Meyer, R.; Baustert, P.; Othoniel, B. How to treat uncertainties in life cycle assessment studies? Int. J. Life Cycle Assess. 2019, 24, 794–807. [Google Scholar] [CrossRef]
  5. Reap, J.; Roman, F.; Duncan, S.; Bras, B. A survey of unresolved problems in life cycle assessment: Part 2: Impact assessment and interpretation. Int. J. Life Cycle Assess. 2008, 13, 374–388. [Google Scholar] [CrossRef]
  6. Feng, S.C.; Joung, C.B.; Li, G. Development overview of sustainable manufacturing metrics. In Proceedings of the 17th CIRP International Conference on Life Cycle Engineering, Hefei, China, 19–21 May 2010; Citeseer: University Park, PA, USA, 2010; Volume 6, p. l2. [Google Scholar]
  7. Sarkar, P.; Joung, C.B.; Carrell, J.; Feng, S.C. Sustainable manufacturing indicator repository. In Proceedings of the International Design Engineering Technical Conferences and Computers and Information in Engineering Conference, Washington, DC, USA, 28–31 August 2011; Volume 54792, pp. 943–950. [Google Scholar]
  8. Amrina, E.; Yusof, S.M. Key performance indicators for sustainable manufacturing evaluation in automotive companies. In Proceedings of the 2011 IEEE International Conference on Industrial Engineering and Engineering Management, Singapore, 6–9 December 2011; pp. 1093–1097. [Google Scholar]
  9. Joung, C.B.; Carrell, J.; Sarkar, P.; Feng, S.C. Categorization of indicators for sustainable manufacturing. Ecol. Indic. 2013, 24, 148–157. [Google Scholar] [CrossRef]
  10. Calero, C.; Bertoa, M.F.; Moraga, M.Á. A systematic literature review for software sustainability measures. In Proceedings of the 2013 2nd International Workshop on Green and Sustainable Software (GREENS), San Francisco, CA, USA, 20 May 2013; pp. 46–53. [Google Scholar]
  11. Issa, I.I.; Pigosso, D.C.; McAloone, T.C.; Rozenfeld, H. Leading product-related environmental performance indicators: A selection guide and database. J. Clean. Prod. 2015, 108, 321–330. [Google Scholar] [CrossRef]
  12. Kibira, D.; Morris, K.C.; Kumaraguru, S. Methods and tools for performance assurance of smart manufacturing systems. J. Res. Natl. Inst. Stand. Technol. 2016, 121, 282. [Google Scholar] [CrossRef] [PubMed]
  13. Fan, C.; Carrell, J.D.; Zhang, H.C. An investigation of indicators for measuring sustainable manufacturing. In Proceedings of the 2010 IEEE International Symposium on Sustainable Systems and Technology, Arlington, VA, USA, 17–19 May 2010; pp. 1–5. [Google Scholar]
  14. Bogdanski, G.; Spiering, T.; Li, W.; Herrmann, C.; Kara, S. Energy monitoring in manufacturing companies–generating energy awareness through feedback. In Proceedings of the Leveraging Technology for a Sustainable World: Proceedings of the 19th CIRP Conference on Life Cycle Engineering, University of California at Berkeley, Berkeley, CA, USA, 23–25 May 2012; Springer: Berlin/Heidelberg, Germany, 2012; pp. 539–544. [Google Scholar]
  15. Dorn, C.; Behrend, R.; Giannopoulos, D.; Napolano, L.; James, V.; Herrmann, A.; Uhlig, V.; Krause, H.; Founti, M.; Trimis, D. A systematic LCA-enhanced KPI evaluation towards sustainable manufacturing in industrial decision-making processes. A case study in glass and ceramic frits production. Procedia CIRP 2016, 48, 158–163. [Google Scholar] [CrossRef]
  16. Shahbazi, S.; Salloum, M.; Kurdve, M.; Wiktorsson, M. Material efficiency measurement: Empirical investigation of manufacturing industry. Procedia Manuf. 2017, 8, 112–120. [Google Scholar] [CrossRef]
  17. Mani, M.; Madan, J.; Lee, J.H.; Lyons, K.W.; Gupta, S.K. Review on Sustainability Characterization for Manufacturing Processes; Report No. NISTIR; National Institute of Standards and Technology: Gaithersburg, MD, USA, 2013; Volume 7913. [Google Scholar]
  18. Barbosa, E.L.; Santos Delfino, A.C.d.; Brandão, L.C. The use of alternative coolant techniques to reduce the environmental impact in the use of water in through-feed centreless grinding. Int. J. Adv. Manuf. Technol. 2017, 91, 3417–3425. [Google Scholar] [CrossRef]
  19. Kibira, D.; Brundage, M.P.; Feng, S.; Morris, K. Procedure for selecting key performance indicators for sustainable manufacturing. J. Manuf. Sci. Eng. 2018, 140, 011005. [Google Scholar] [CrossRef]
  20. Smullin, M.M.; Haapala, K.R.; Mani, M.; Morris, K.C. Using industry focus groups and literature review to identify challenges in sustainable assessment theory and practice. In Proceedings of the International Design Engineering Technical Conferences and Computers and Information in Engineering Conference, Charlotte, NC, USA, 21–24 August 2016; American Society of Mechanical Engineers: New York, NY, USA, 2016; Volume 50145, p. V004T05A048. [Google Scholar]
  21. Garetti, M.; Taisch, M. Sustainable manufacturing: Trends and research challenges. Prod. Plan. Control 2012, 23, 83–104. [Google Scholar]
  22. Rakar, A.; Zorzut, S.; Jovan, V. Assessment of Production Performance by Means of KPI; In Proceedings of the Control 2004, Bath, UK, 6–9 September 2004.
  23. Despeisse, M.; Mbaye, F.; Ball, P.D.; Levers, A. The emergence of sustainable manufacturing practices. Prod. Plan. Control 2012, 23, 354–376. [Google Scholar] [CrossRef]
  24. Raman, A.S.; Haapala, K.R.; Raoufi, K.; Linke, B.S.; Bernstein, W.Z.; Morris, K. Defining near-term to long-term research opportunities to advance metrics, models, and methods for smart and sustainable manufacturing. Smart Sustain. Manuf. Syst. 2020, 4, 1–37. [Google Scholar] [CrossRef]
  25. Ramanujan, D.; Bernstein, W.; Diaz-Elsayed, N.; Haapala, K.R. The Role of Industry 4.0 Technologies in Manufacturing Sustainability Assessment. J. Manuf. Sci. Eng. 2022, 145, 010801. [Google Scholar] [CrossRef]
  26. Glišić, M.; Veluri, B.; Ramanujan, D. A reusable unit process life cycle inventory model for infeed centerless grinding. In Proceedings of the International Design Engineering Technical Conferences and Computers and Information in Engineering Conference, Virtual Conference, 17–19 August 2021; American Society of Mechanical Engineers: New York, NY, USA, 2021; Volume 85413, p. V005T05A025. [Google Scholar]
  27. Shin, S.J.; Suh, S.H.; Stroud, I.; Yoon, S. Process-oriented life cycle assessment framework for environmentally conscious manufacturing. J. Intell. Manuf. 2017, 28, 1481–1499. [Google Scholar] [CrossRef]
  28. Tan, H.X.; Yeo, Z.; Ng, R.; Tjandra, T.B.; Song, B. A sustainability indicator framework for Singapore small and medium-sized manufacturing enterprises. Procedia CIRP 2015, 29, 132–137. [Google Scholar] [CrossRef]
  29. Contini, G.; Peruzzini, M.; Bulgarelli, S.; Bosi, G. Developing key performance indicators for monitoring sustainability in the ceramic industry: The role of digitalization and industry 4.0 technologies. J. Clean. Prod. 2023, 414, 137664. [Google Scholar] [CrossRef]
  30. Kellens, K.; Dewulf, W.; Overcash, M.; Hauschild, M.Z.; Duflou, J.R. Methodology for systematic analysis and improvement of manufacturing unit process life-cycle inventory (UPLCI)—CO 2 PE! initiative (cooperative effort on process emissions in manufacturing). Part 1: Methodology description. Int. J. Life Cycle Assess. 2012, 17, 69–78. [Google Scholar] [CrossRef]
  31. Ramanujan, D.; Bernstein, W.Z.; Totorikaguena, M.A.; Ilvig, C.F.; Ørskov, K.B. Generating contextual design for environment principles in sustainable manufacturing using visual analytics. J. Manuf. Sci. Eng. 2019, 141, 021016. [Google Scholar] [CrossRef]
  32. Linke, B.; Das, J.; Lam, M.; Ly, C. Sustainability indicators for finishing operations based on process performance and part quality. Procedia CIRP 2014, 14, 564–569. [Google Scholar] [CrossRef]
  33. Filleti, R.A.P.; Silva, D.A.L.; da Silva, E.J.; Ometto, A.R. Productive and environmental performance indicators analysis by a combined LCA hybrid model and real-time manufacturing process monitoring: A grinding unit process application. J. Clean. Prod. 2017, 161, 510–523. [Google Scholar] [CrossRef]
  34. Bunse, K.; Vodicka, M.; Schönsleben, P.; Brülhart, M.; Ernst, F.O. Integrating energy efficiency performance in production management–gap analysis between industrial needs and scientific literature. J. Clean. Prod. 2011, 19, 667–679. [Google Scholar] [CrossRef]
  35. Hauschild, M.Z.; Huijbregts, M.A.J. Introducing Life Cycle Impact Assessment. In Life Cycle Impact Assessment; Hauschild, M.Z., Huijbregts, M.A., Eds.; Springer: Dordrecht, The Netherlands, 2015; pp. 1–16. [Google Scholar]
  36. Schomaker, M. Development of Environmental Indicators in UNEP; FAO Land and Water Bulletin (FAO): Rome, Italy, 1997. [Google Scholar]
  37. National Research Council. Ecological Indicators for the Nation; National Academies Press: Washington, DC, USA, 2000. [Google Scholar]
  38. Hák, T.; Janoušková, S.; Moldan, B. Sustainable Development Goals: A need for relevant indicators. Ecol. Indic. 2016, 60, 565–573. [Google Scholar] [CrossRef]
  39. Niemeijer, D.; De Groot, R.S. A conceptual framework for selecting environmental indicator sets. Ecol. Indic. 2008, 8, 14–25. [Google Scholar] [CrossRef]
  40. Kristensen, P. EEA Core Set of Indicators; Technical report; European Environment Agency: Copenhagen, Denmark, 2003. [Google Scholar]
  41. ASTM E3012-16; Standard Guide for Characterizing Environmental Aspects of Manufacturing Processes. ASTM International: West Conshohocken, PA, USA, 2020. Available online: https://www.astm.org/DATABASE.CART/HISTORICAL/E3012-16.htm (accessed on 17 September 2023).
  42. Overcash, M.; Griffing, E.; Vozzola, E.; Twomey, J.; Flanagan, W.; Isaacs, J. Advancements in Unit Process Life Cycle Inventories (UPLCI) Tools. Procedia CIRP 2018, 69, 447–450. [Google Scholar] [CrossRef]
  43. Glišić, M.; Sarfraz, S.; Veluri, B.; Ramanujan, D. A Systematic Framework for Quantifying Production System-Specific Challenges in Life Cycle Inventory Data Collection. Procedia CIRP 2022, 105, 210–218. [Google Scholar] [CrossRef]
Figure 1. Overview of the methodology for defining process performance indicators for monitoring a given manufacturing system.
Sustainability 16 00806 g001
Figure 2. (a) The selection of a production system for monitoring, e.g., within a factory, is based on the goal and scope of the study. Once a production system is identified, corresponding machine tools (M#) and sub-systems (S#) are identified to define relevant process parameters and inventory flows. (b) Inventory flows are related to product and process information by constructing a detailed unit manufacturing process model. These relationships can be represented through analytical, experimental, and simulation-based models for input–output transformations.
Sustainability 16 00806 g002
Table 2. Evaluation methodology for indicator selection criteria.
CriterionEvaluation Methodology
SensitivityQuantitative estimate for sensitivity estimated through experimental studies or through analytical process modeling.
MeasurabilityA normalized measurability score M is calculated, which encodes difficulties in the measuring process and relevant inventory parameters.
ActionabilityHigh/medium/low evaluation encoding the controllability of process parameters.
ReliabilityA normalized reliability score R is calculated, which encodes the accuracy and precision of process measurements.
TimelinessHigh/medium/low evaluation encoding the the ease-of-availability of process parameters for product and process planning.
Human-centricityHigh/medium/low evaluation based on the understandability of process parameters and their effects by the people responsible for the manufacturing process.
Table 3. Sequence of activating the peripherals systems throughout the first iteration of the experiment.
Sequence of OperationActivationEquipment
Seq 1ManuallyElectronics
Air supply
Motor for workpiece waste (wear of material)
Seq 2ManuallyHydraulic pump - grinding wheel
Seq 3ManuallyGrinding wheel and Regulating wheel
Seq 4Manually—After GW and RW are startedCoolant
Seq 5Automatically—When the tank is fullPump for coolant
Seq 6Automatically—When the safety doors are closedHandling system
Seq 7Manually—After everything is preparedMaster—Notify
Seq 8AutomaticallyA1 axis (gripper for workpiece movement within process)
Seq 9AutomaticallyGrinding
Seq 10250 cyclesLubrication of regulating wheel
Seq 115 cyclesDressing of grinding wheel
Seq 12Approaching and retracting during grinding processZ1 motor of workrest blade
Seq 13Approaching and retracting during grinding processZ2 axis regulating wheel motor
Seq 14Grinding wheel moving along X axisX axis grinding wheel spindle movement motor
Disclaimer/Publisher’s Note: The statements, opinions and data contained in all publications are solely those of the individual author(s) and contributor(s) and not of MDPI and/or the editor(s). MDPI and/or the editor(s) disclaim responsibility for any injury to people or property resulting from any ideas, methods, instructions or products referred to in the content.

