


Passive Energy Conservation Strategies for Mitigating Energy Consumption and Reducing CO2 Emissions in Traditional Dwellings of Peking Area, China

Abstract
:1. Introduction
1.1. Previous Studies
1.2. Motivation
- · What strategies can enhance the thermal efficiency of these traditional brick houses while preserving their architectural integrity?
- · Given the abundance of solar radiation in the Peking region, how can we effectively harness this resource to reduce indoor energy consumption?
- · How much energy efficiency can these strategies offer, and how economically feasible and implementable are they?
2. Materials and Methods
2.1. Geographical Location and Climatic Characteristics
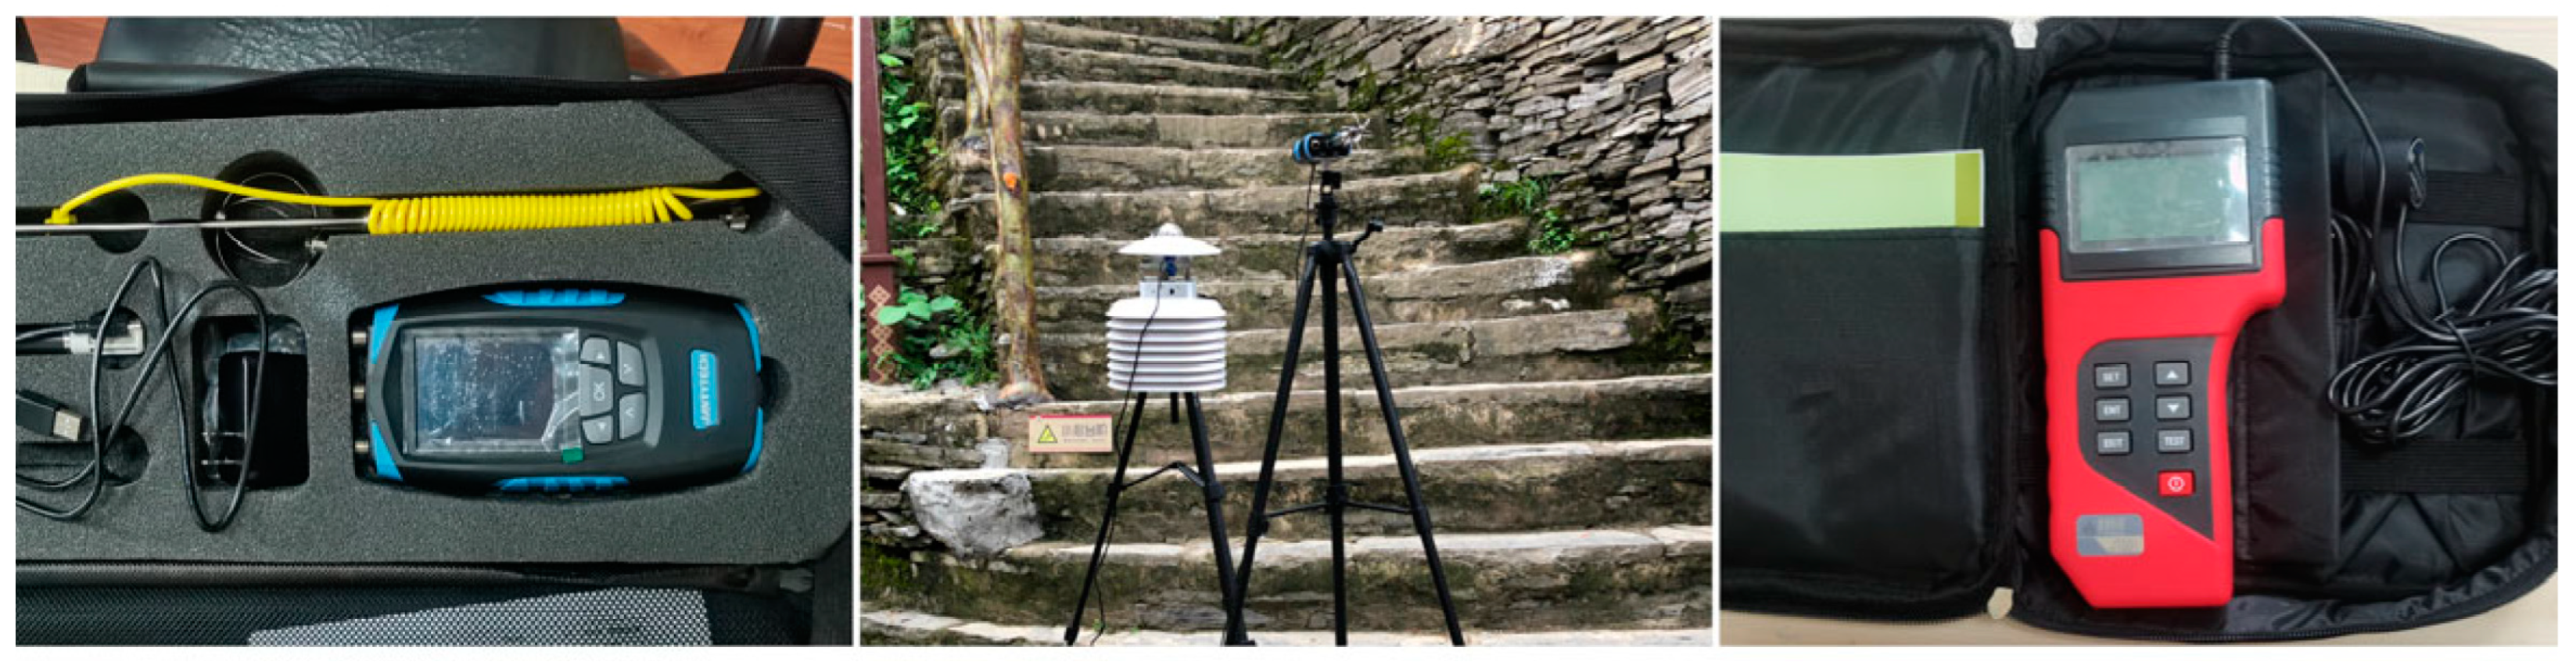
2.2. In-Field Experimental Campaign
2.3. The Characteristics of Brick Dwellings
2.4. Numerical Analysis
2.4.1. Simulation Model Setting and Validation
2.4.2. The Parameter Settings of the Improvement Strategy
- Enhancement of Openings
- 2.
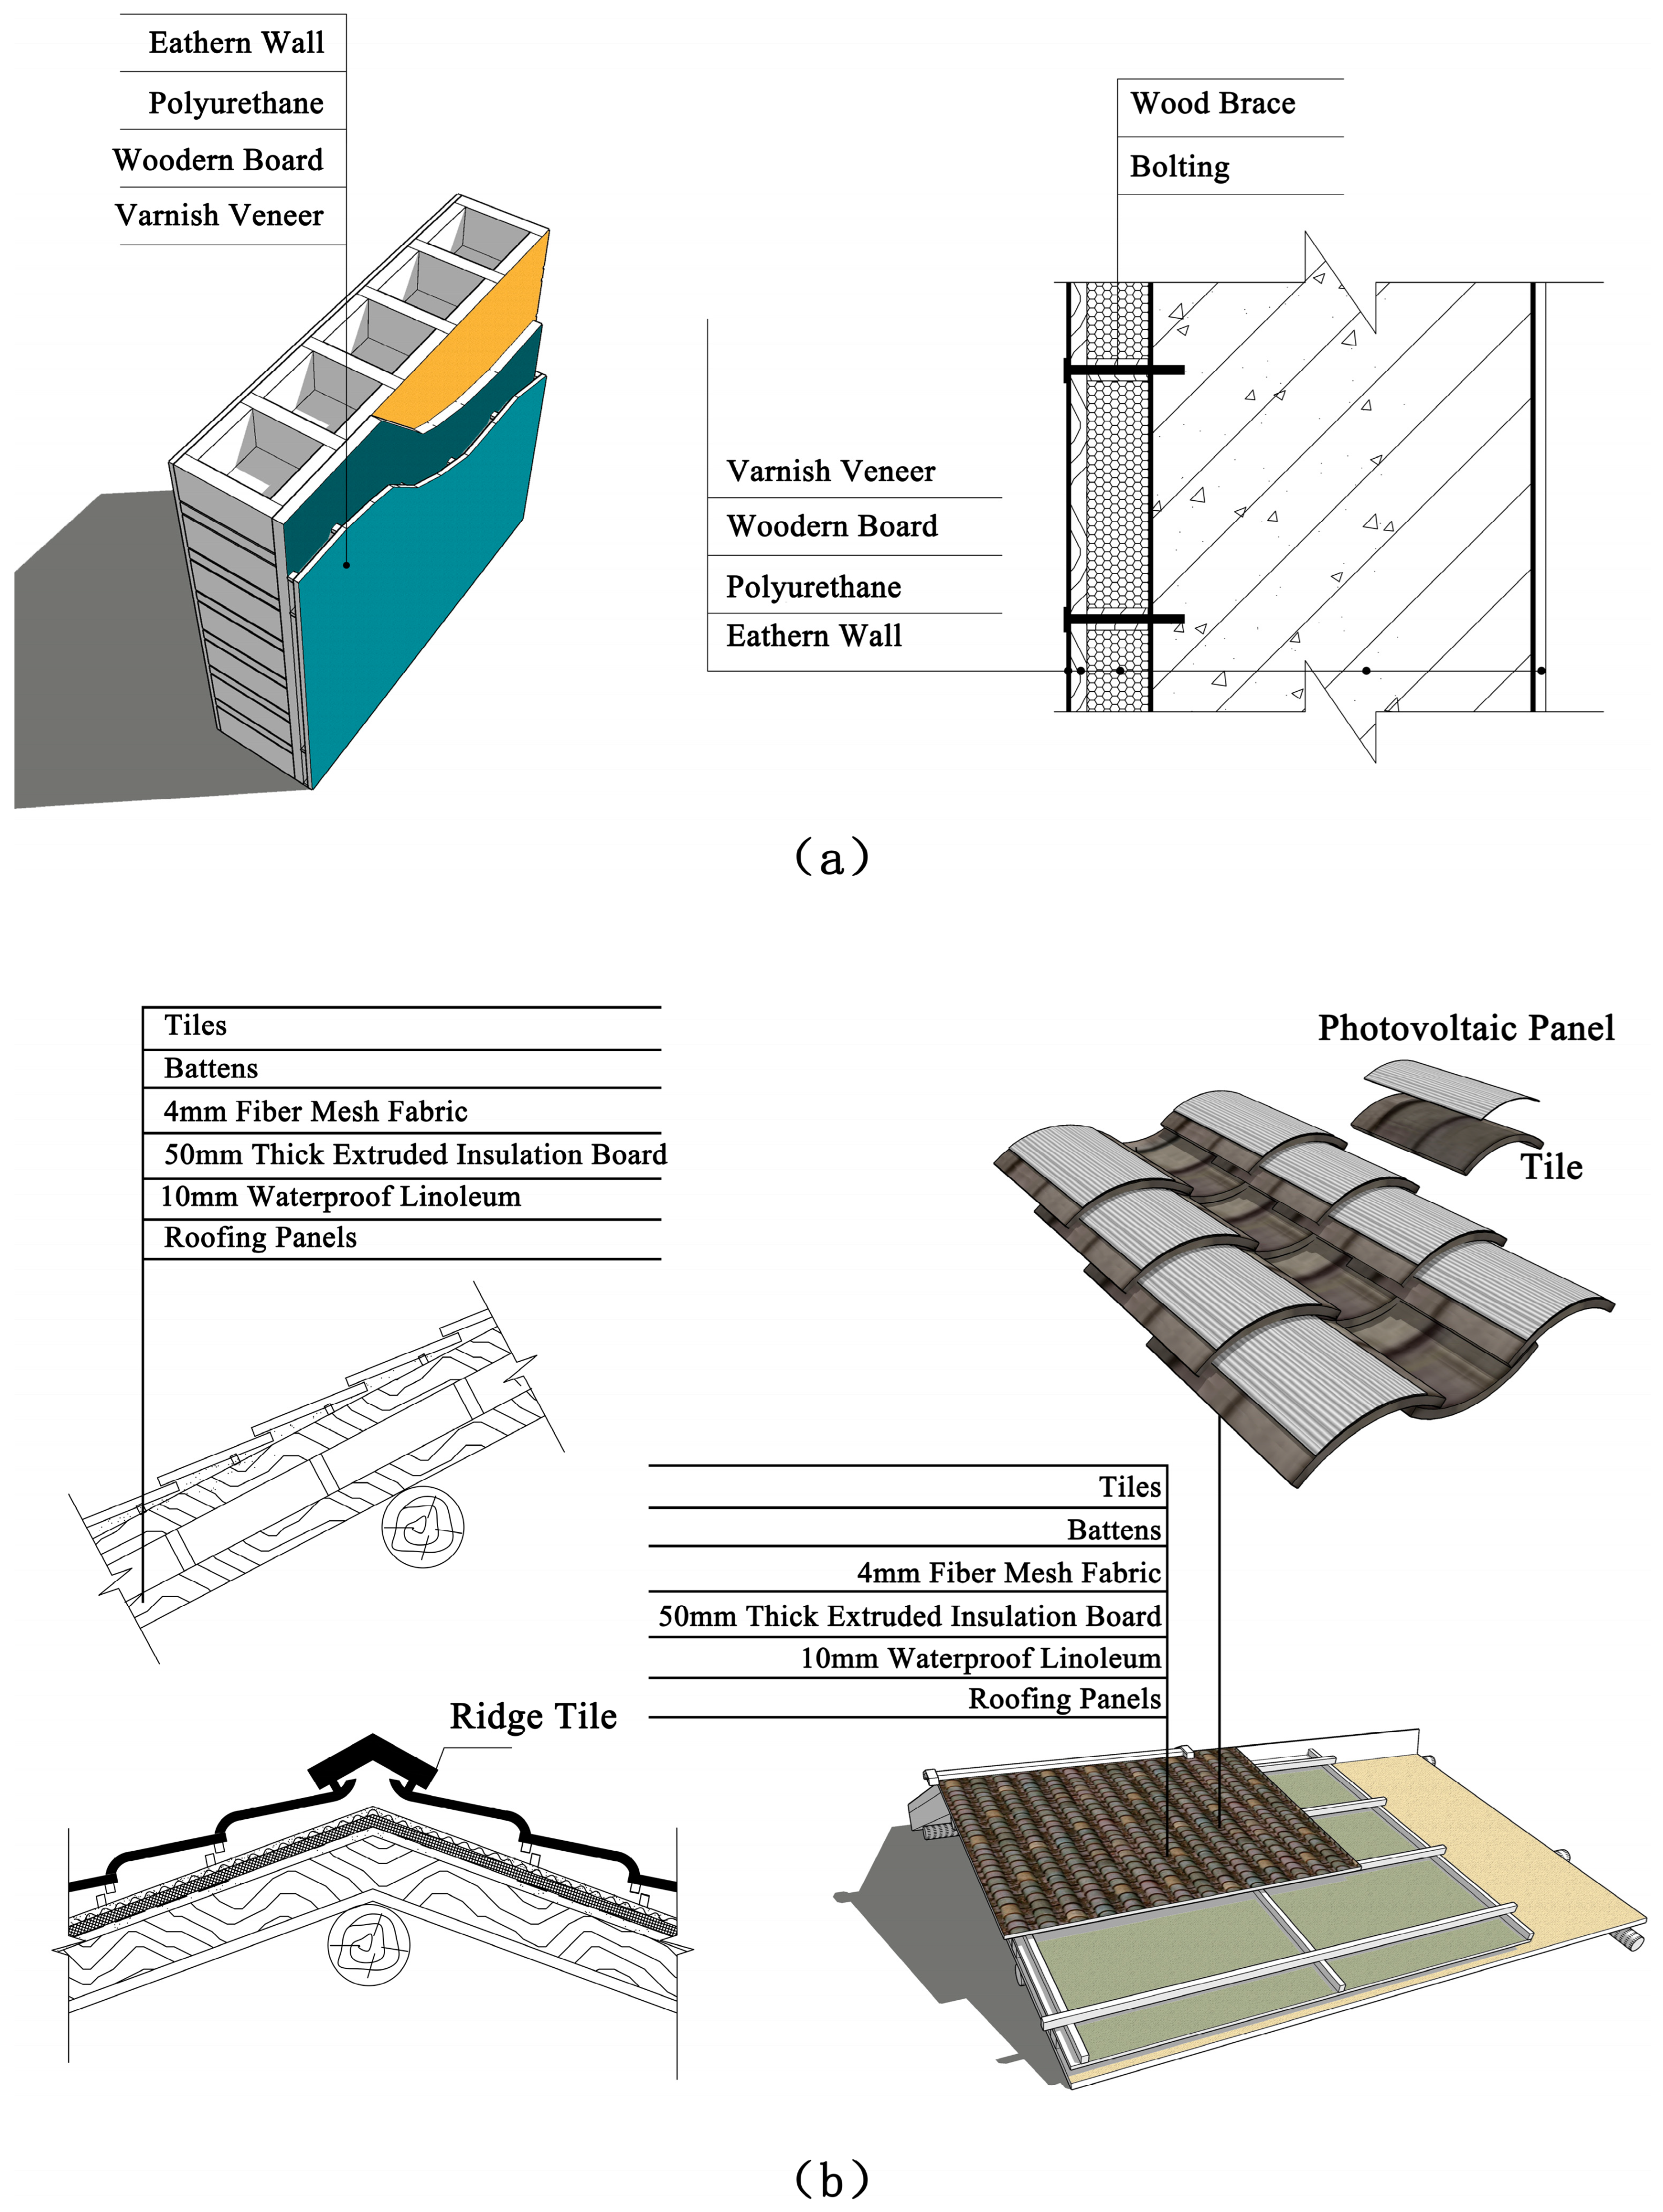
- Optimization of the Enclosure Structure
- Winter Heating Scenario
- Summer Mixed Cooling Scenario
- Heating and Cooling Systems
- 3.
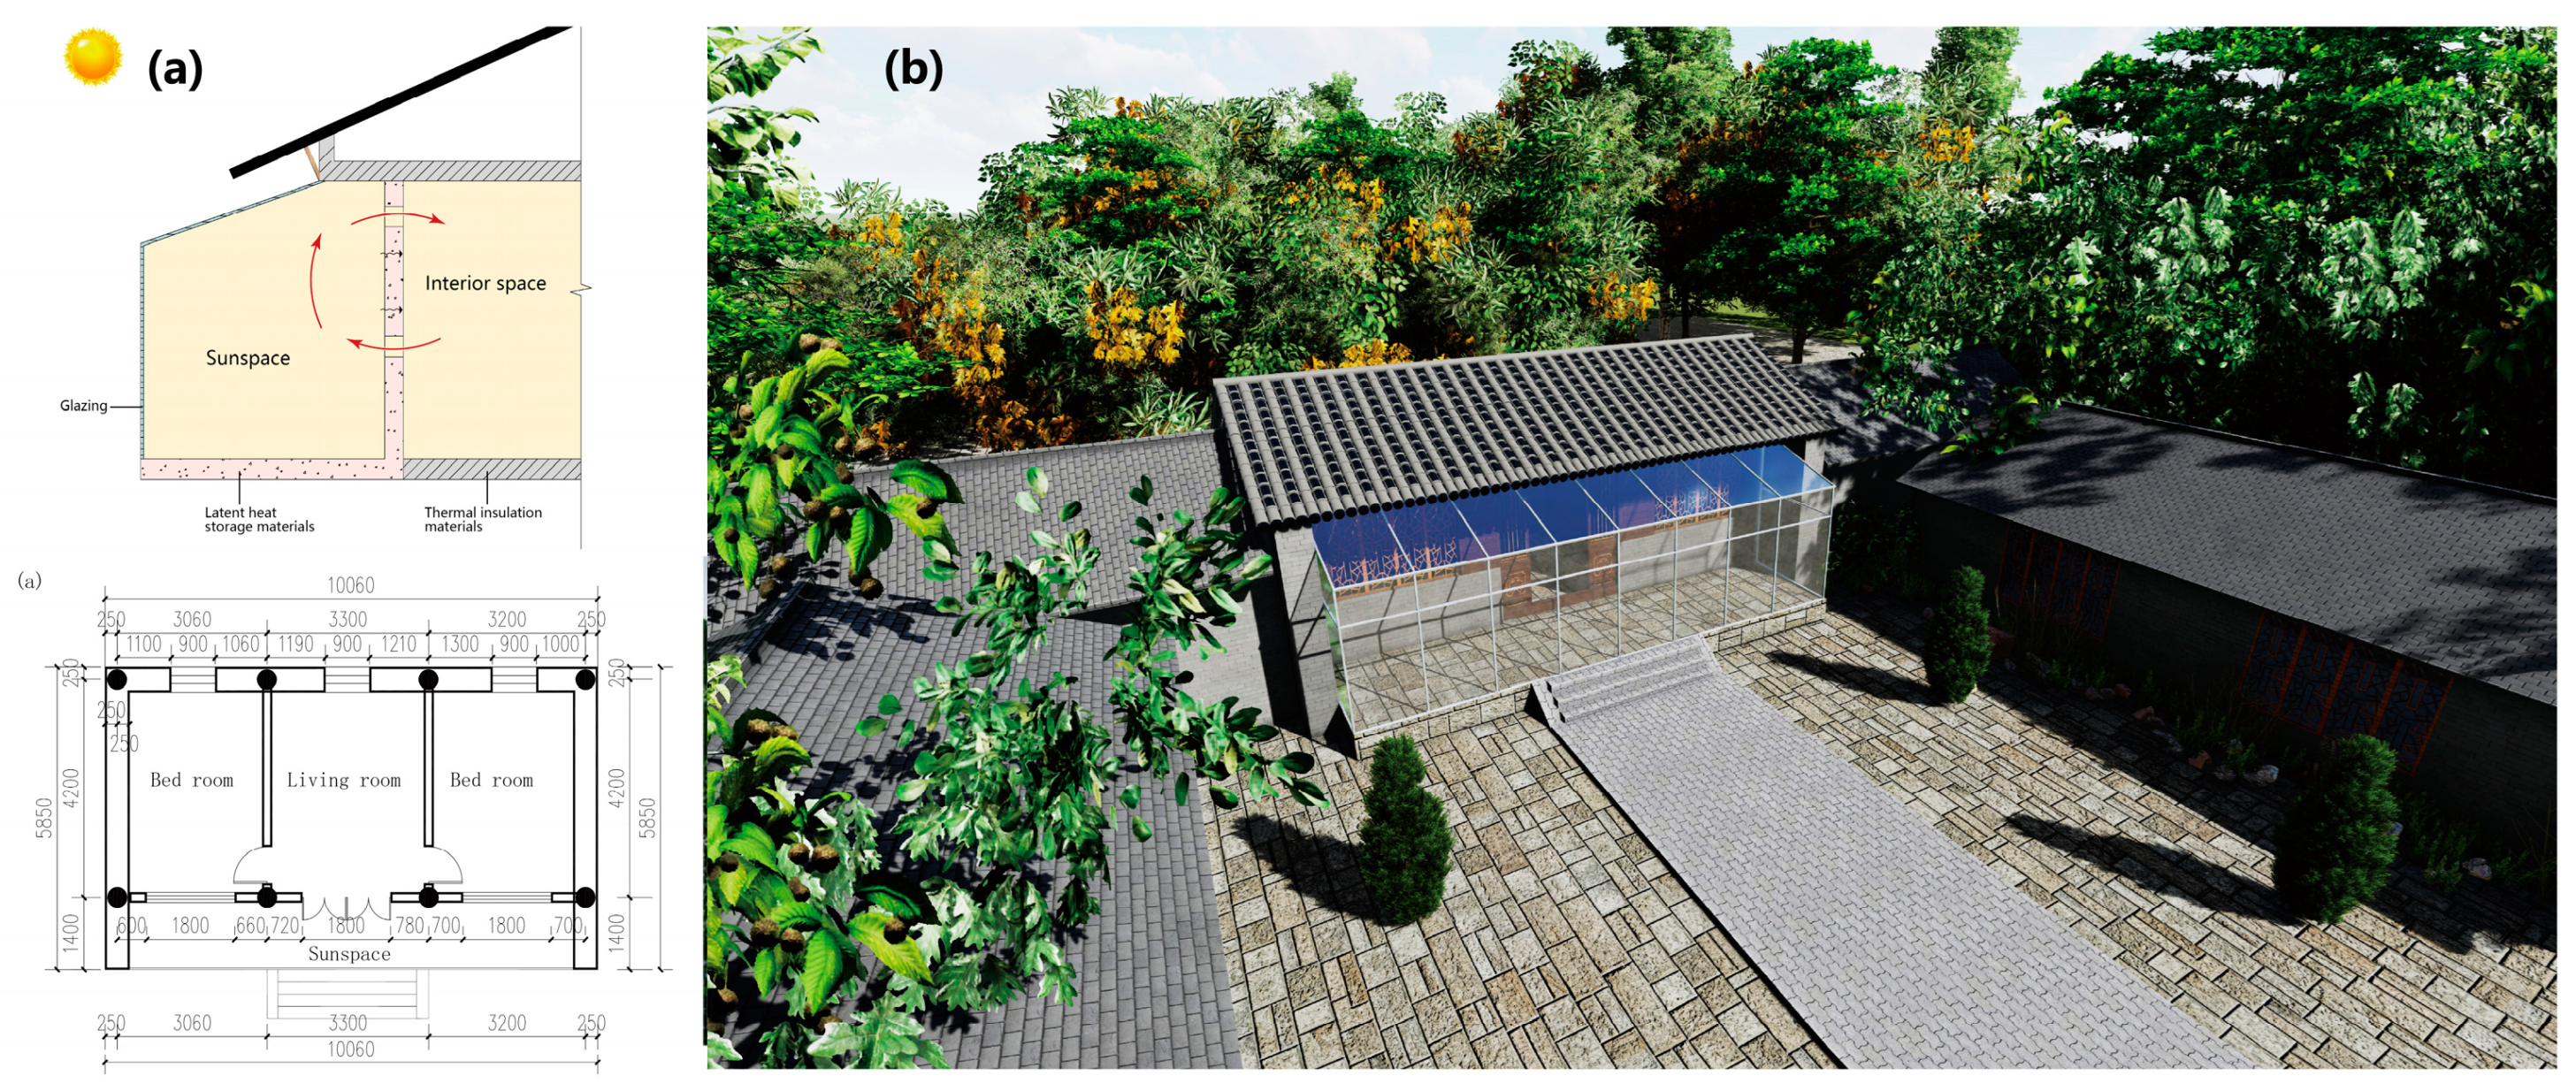
- Integrated Sunspace
- (1)
- By facilitating the transfer of warm air into the internal spaces via natural convection through shared windows and doors.
- (2)
- By augmenting the heat transfer resistance between indoor spaces and the external environment.
- 4.
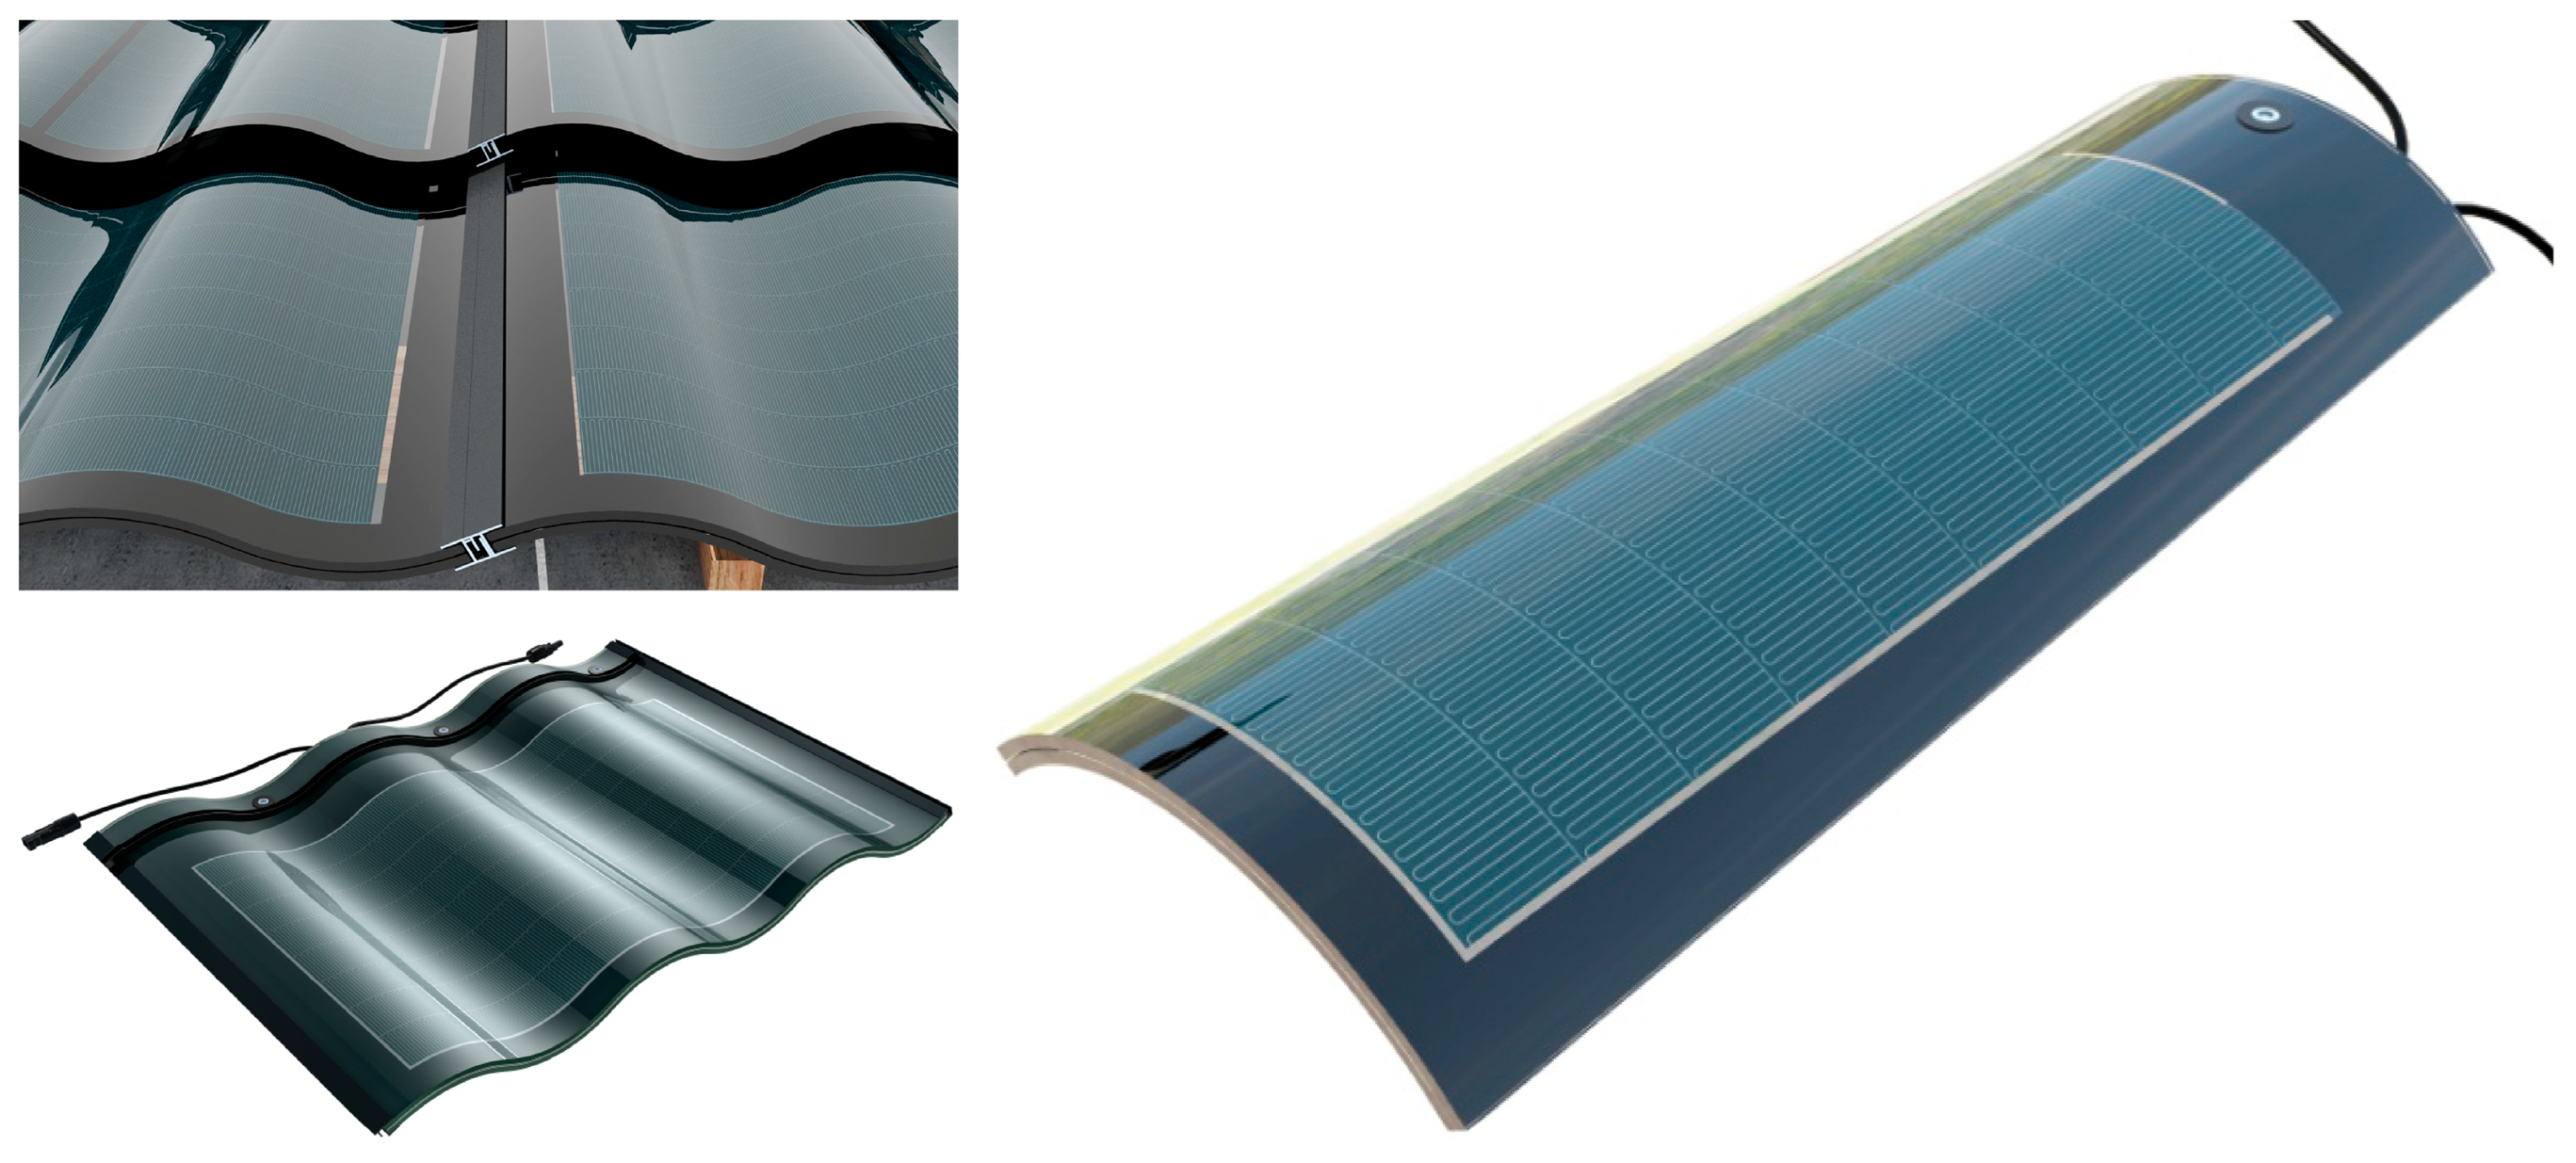
- Roof solar energy utilization
2.5. The Net Present Value (NPV)
2.6. Sensitivity Analysis
2.6.1. Approach and Method
2.6.2. Sampling and Statistics
2.6.3. Independent Variables and Predictor Parameters (Energy Saving)
3. Results and discussion
3.1. Field Experiment Result
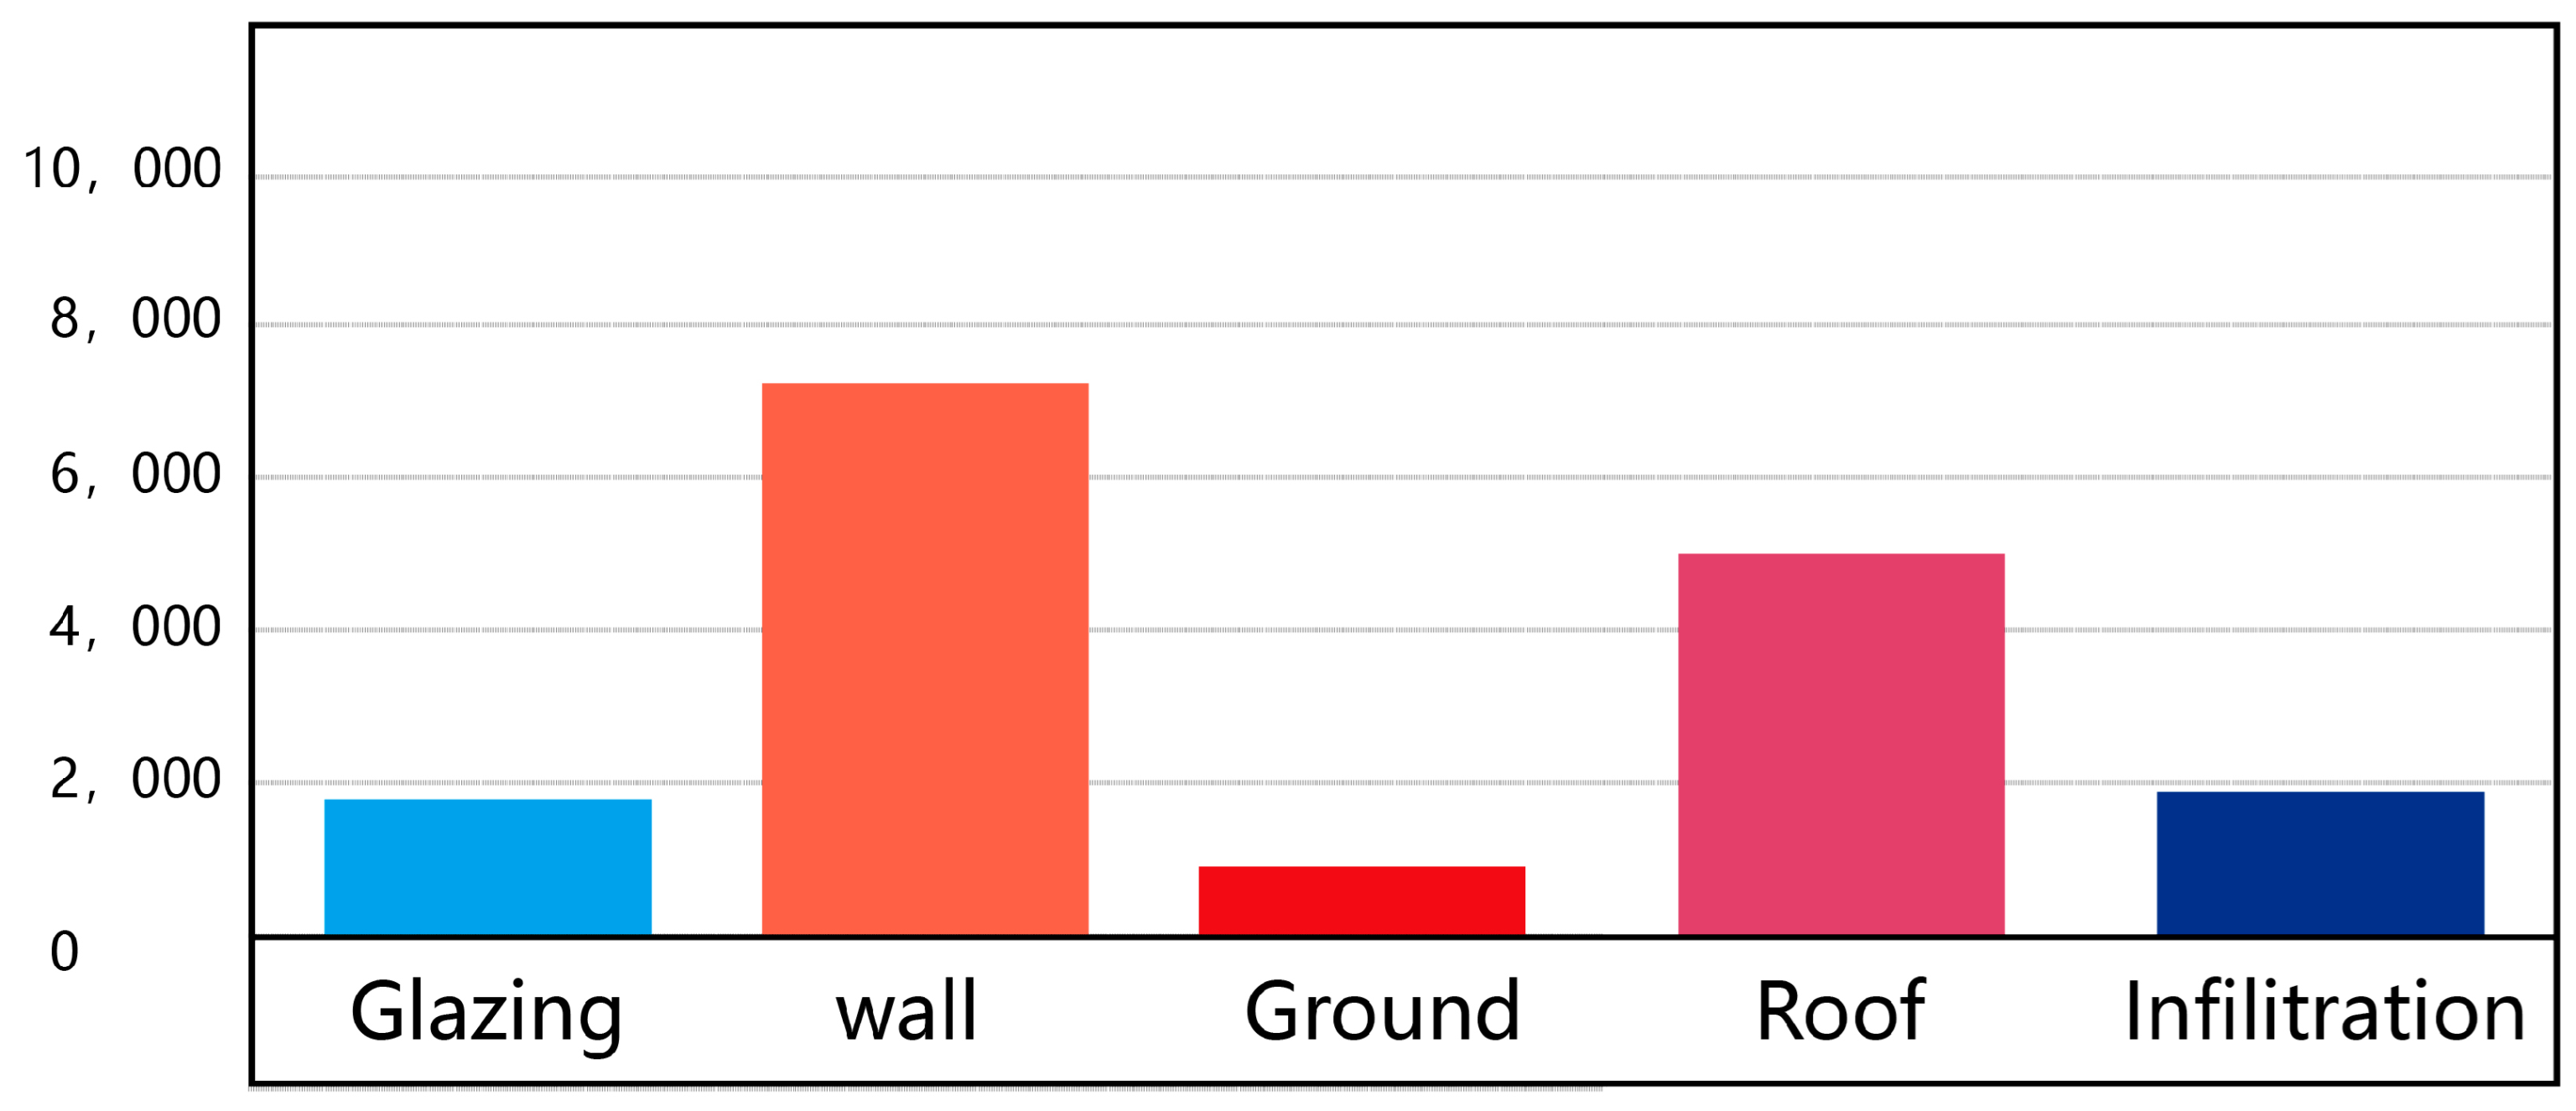
3.2. Simulation Result
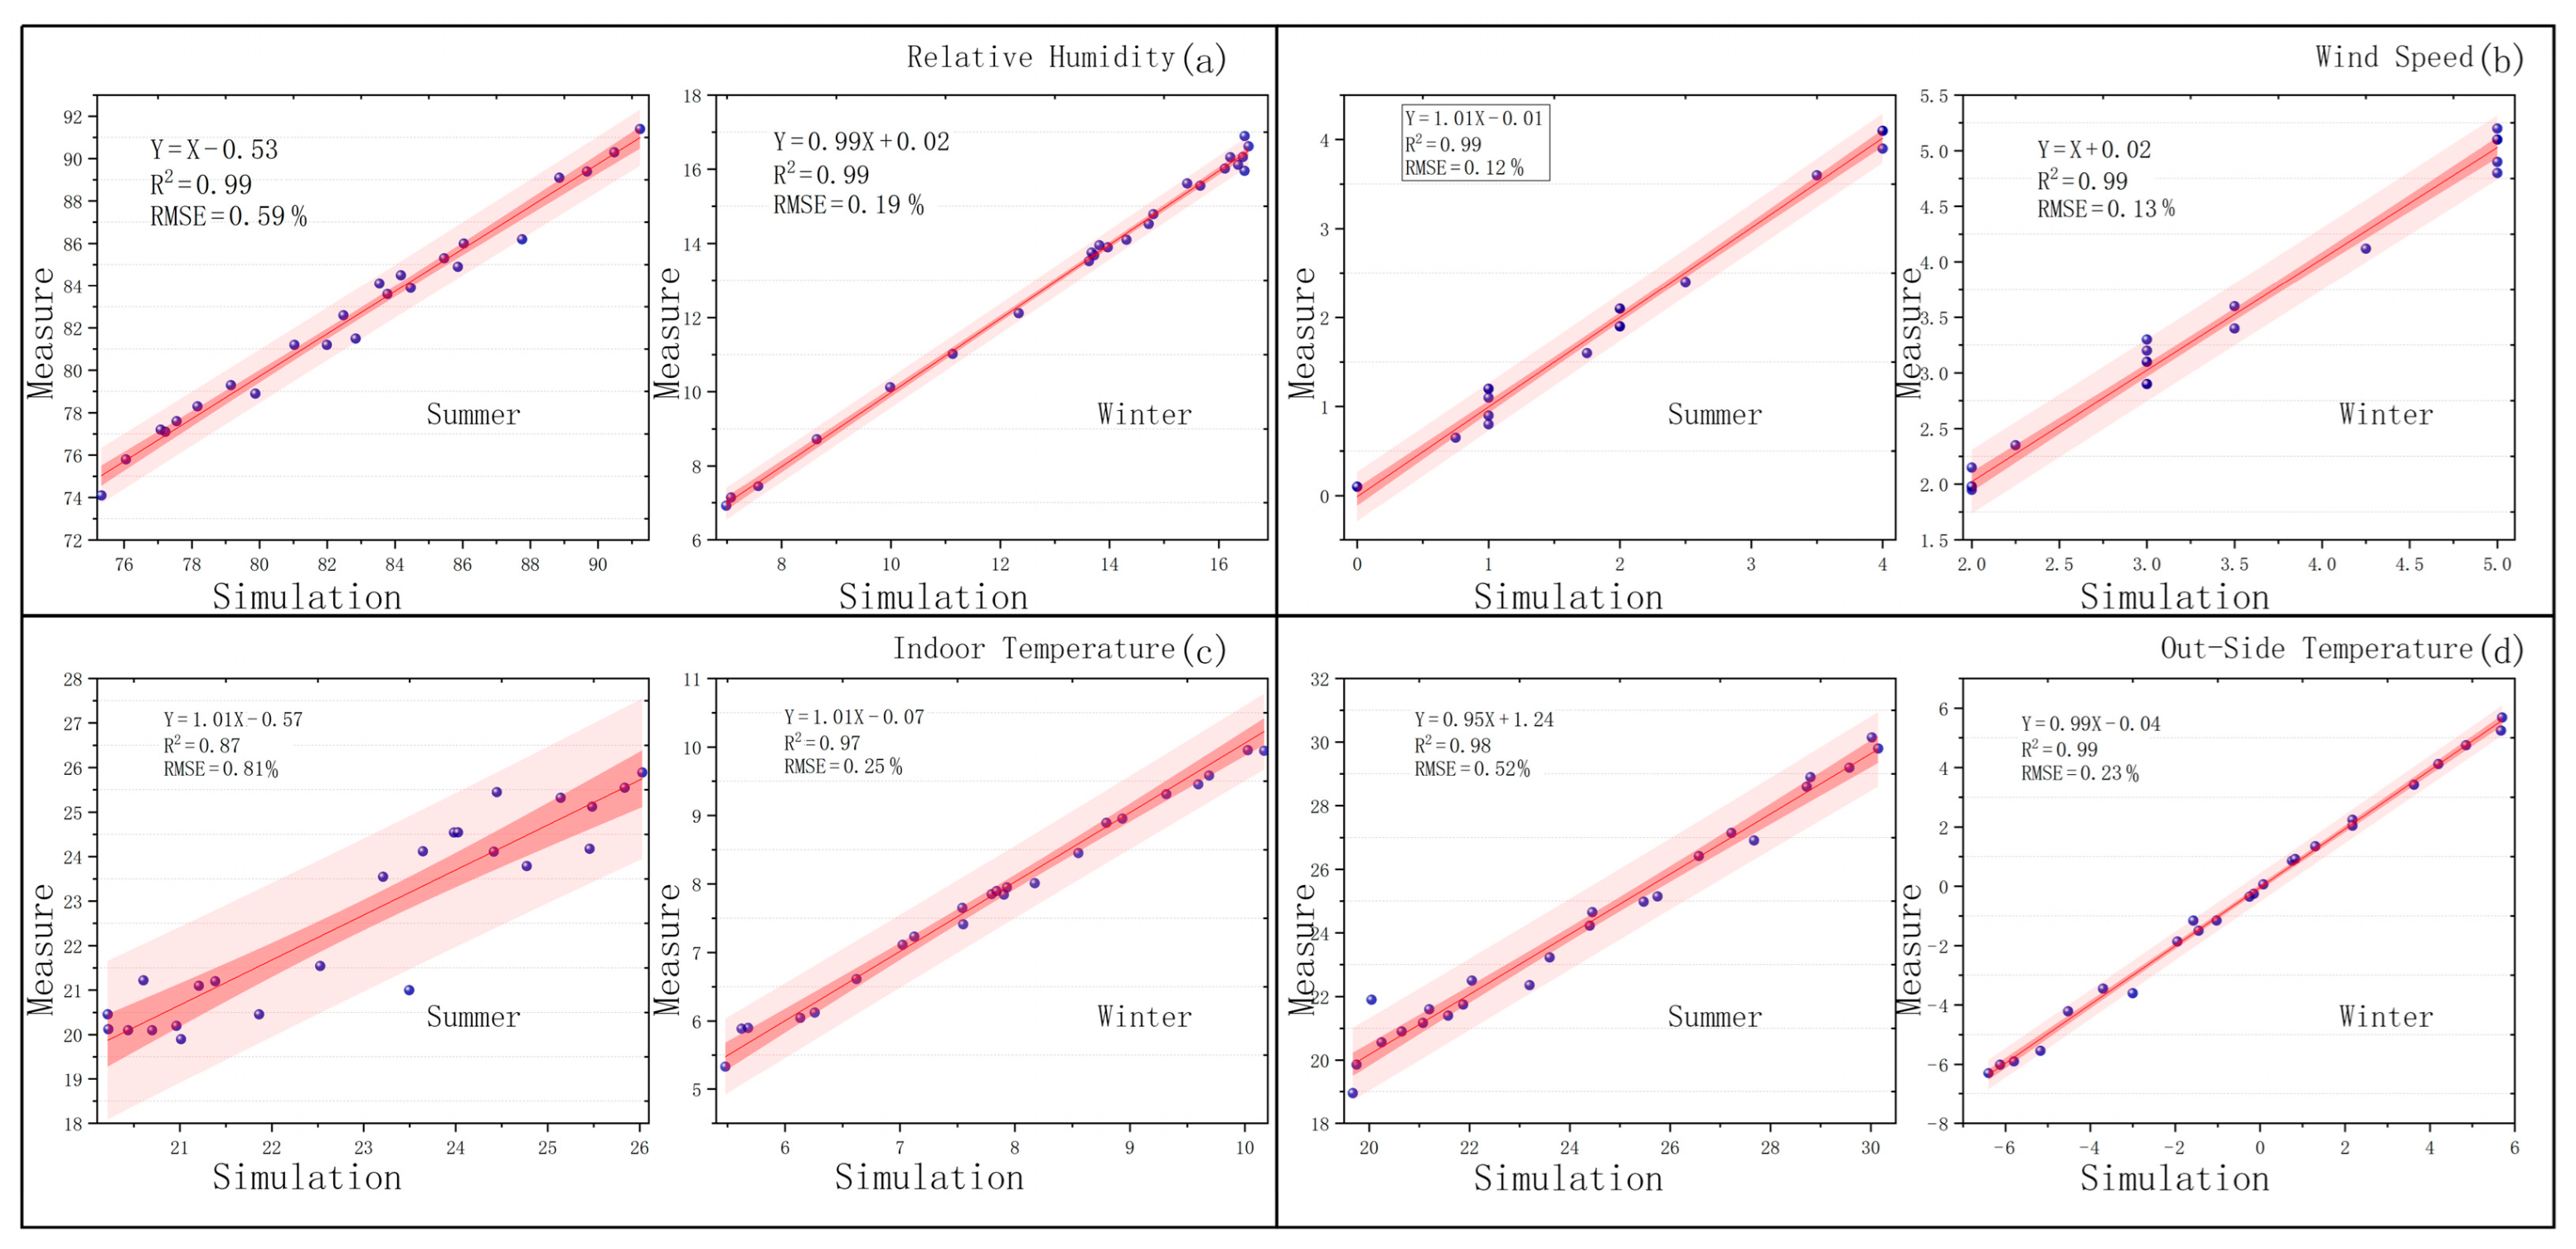
3.3. Model Validation
3.4. Sensitivity Analysis Result
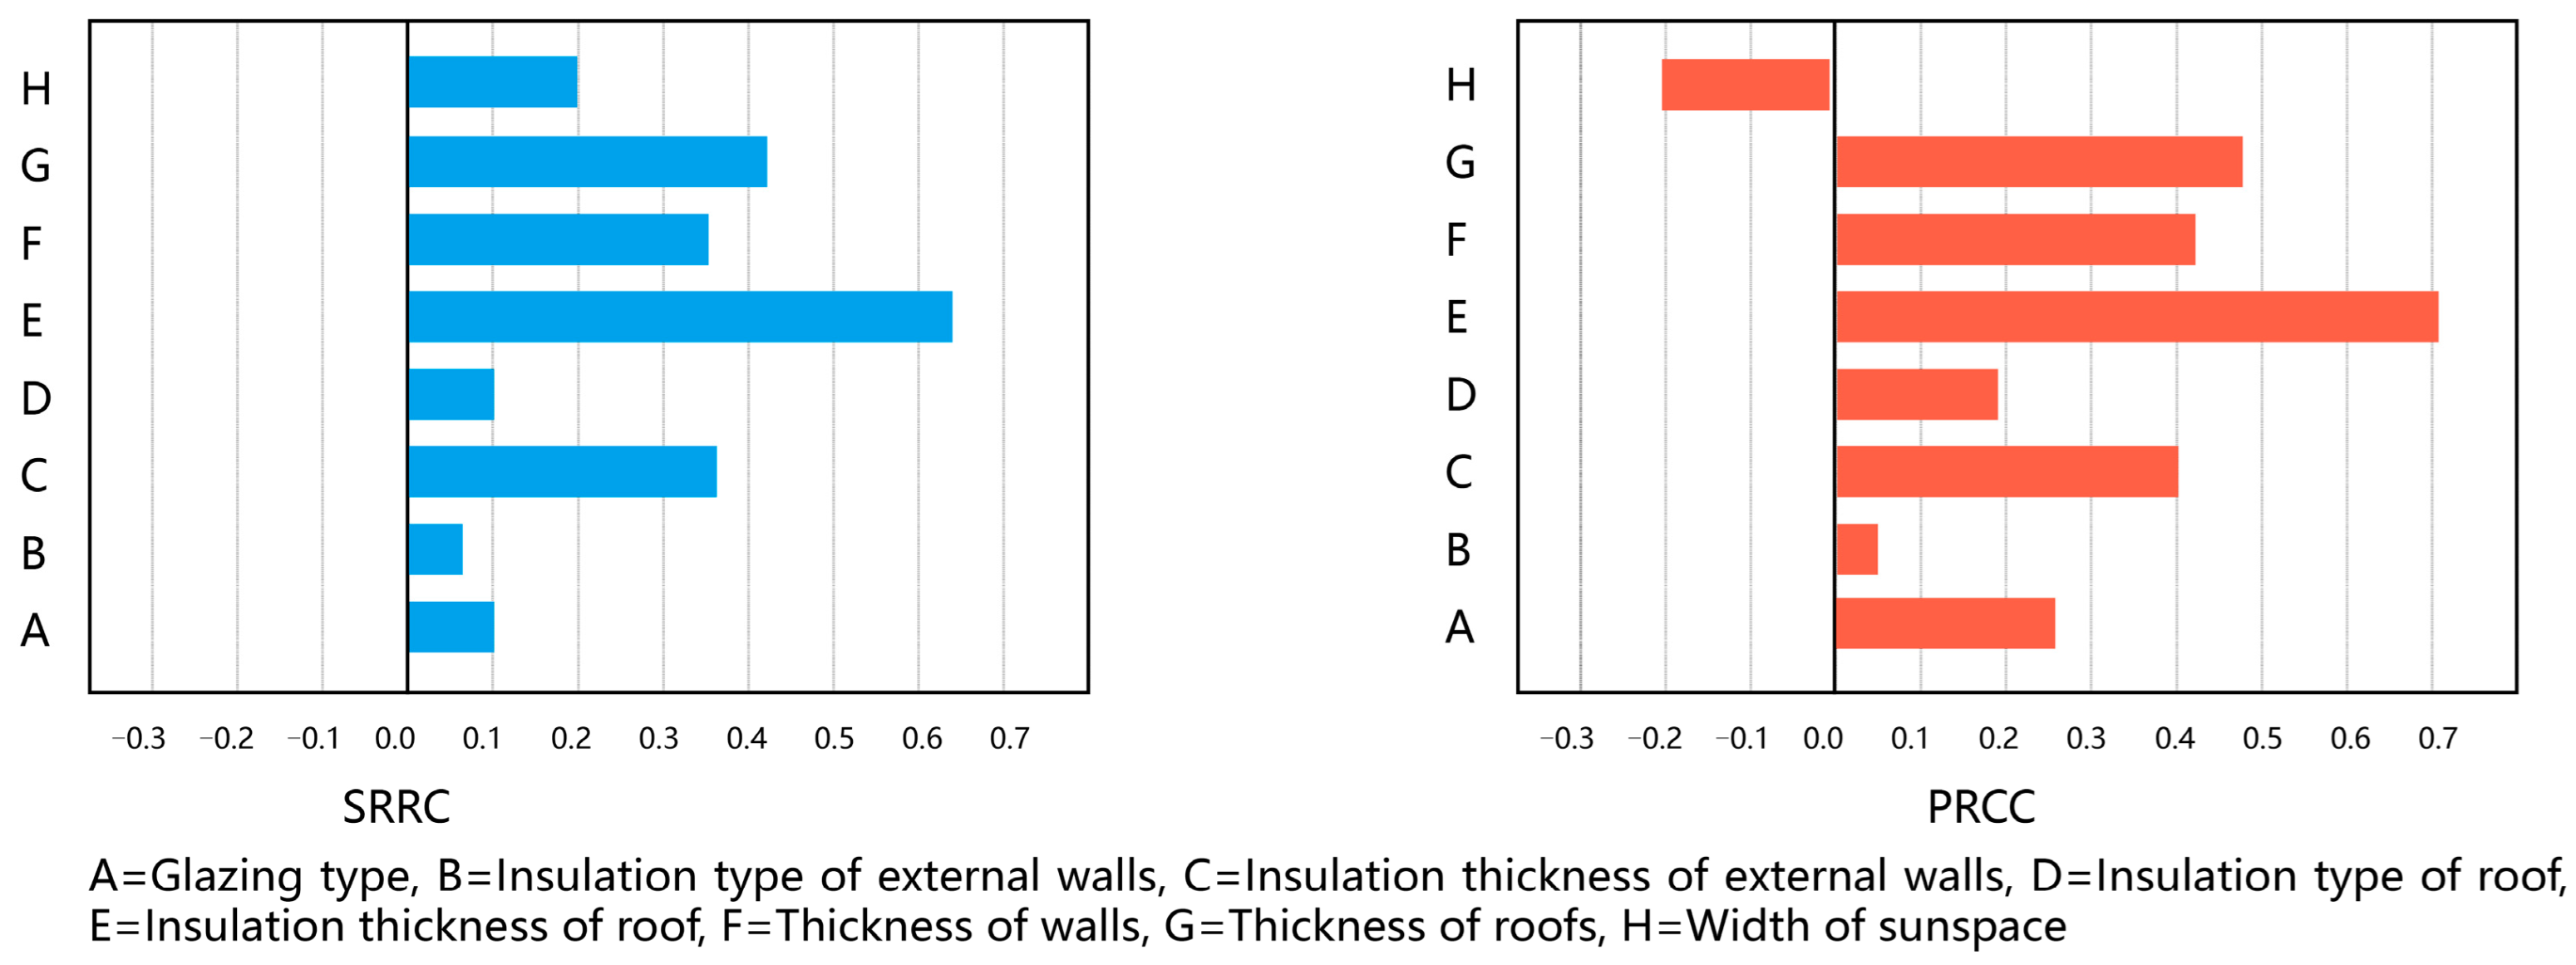
3.4.1. Global Sensitivity Analysis Result
3.4.2. Single-Factor Sensitivity Analysis
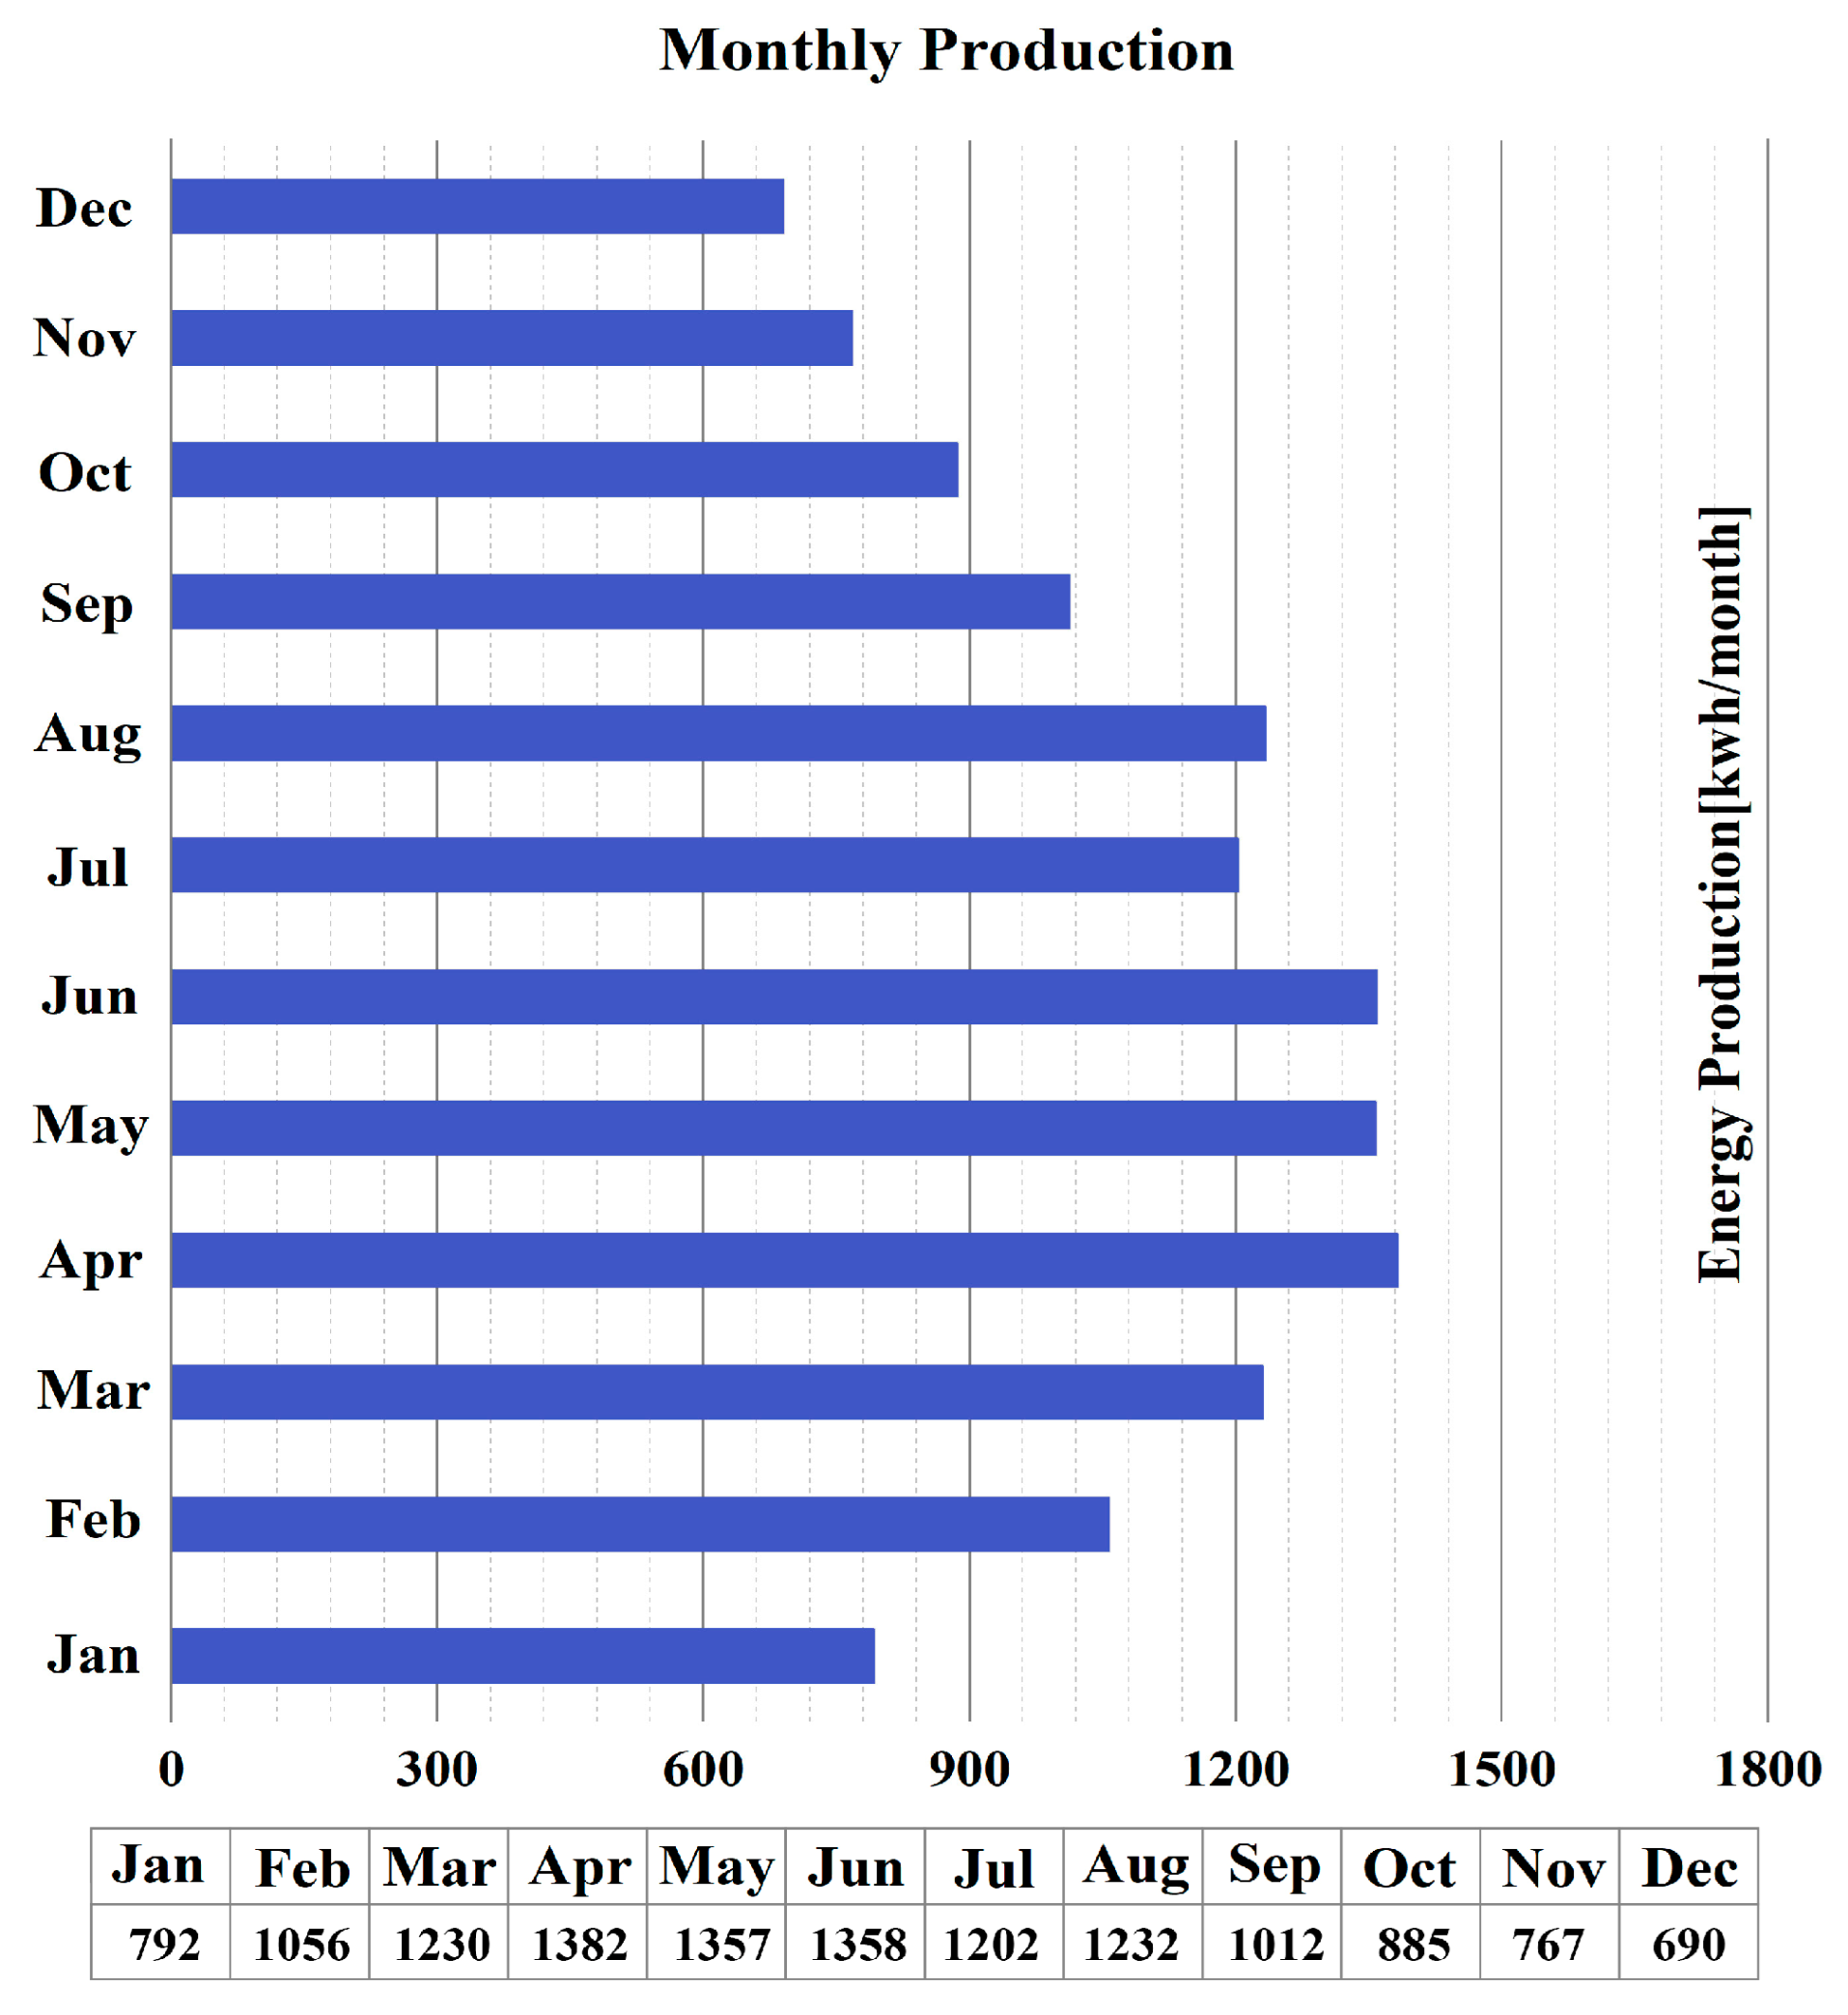
3.4.3. Annual Solar Tile Roof Power Generation
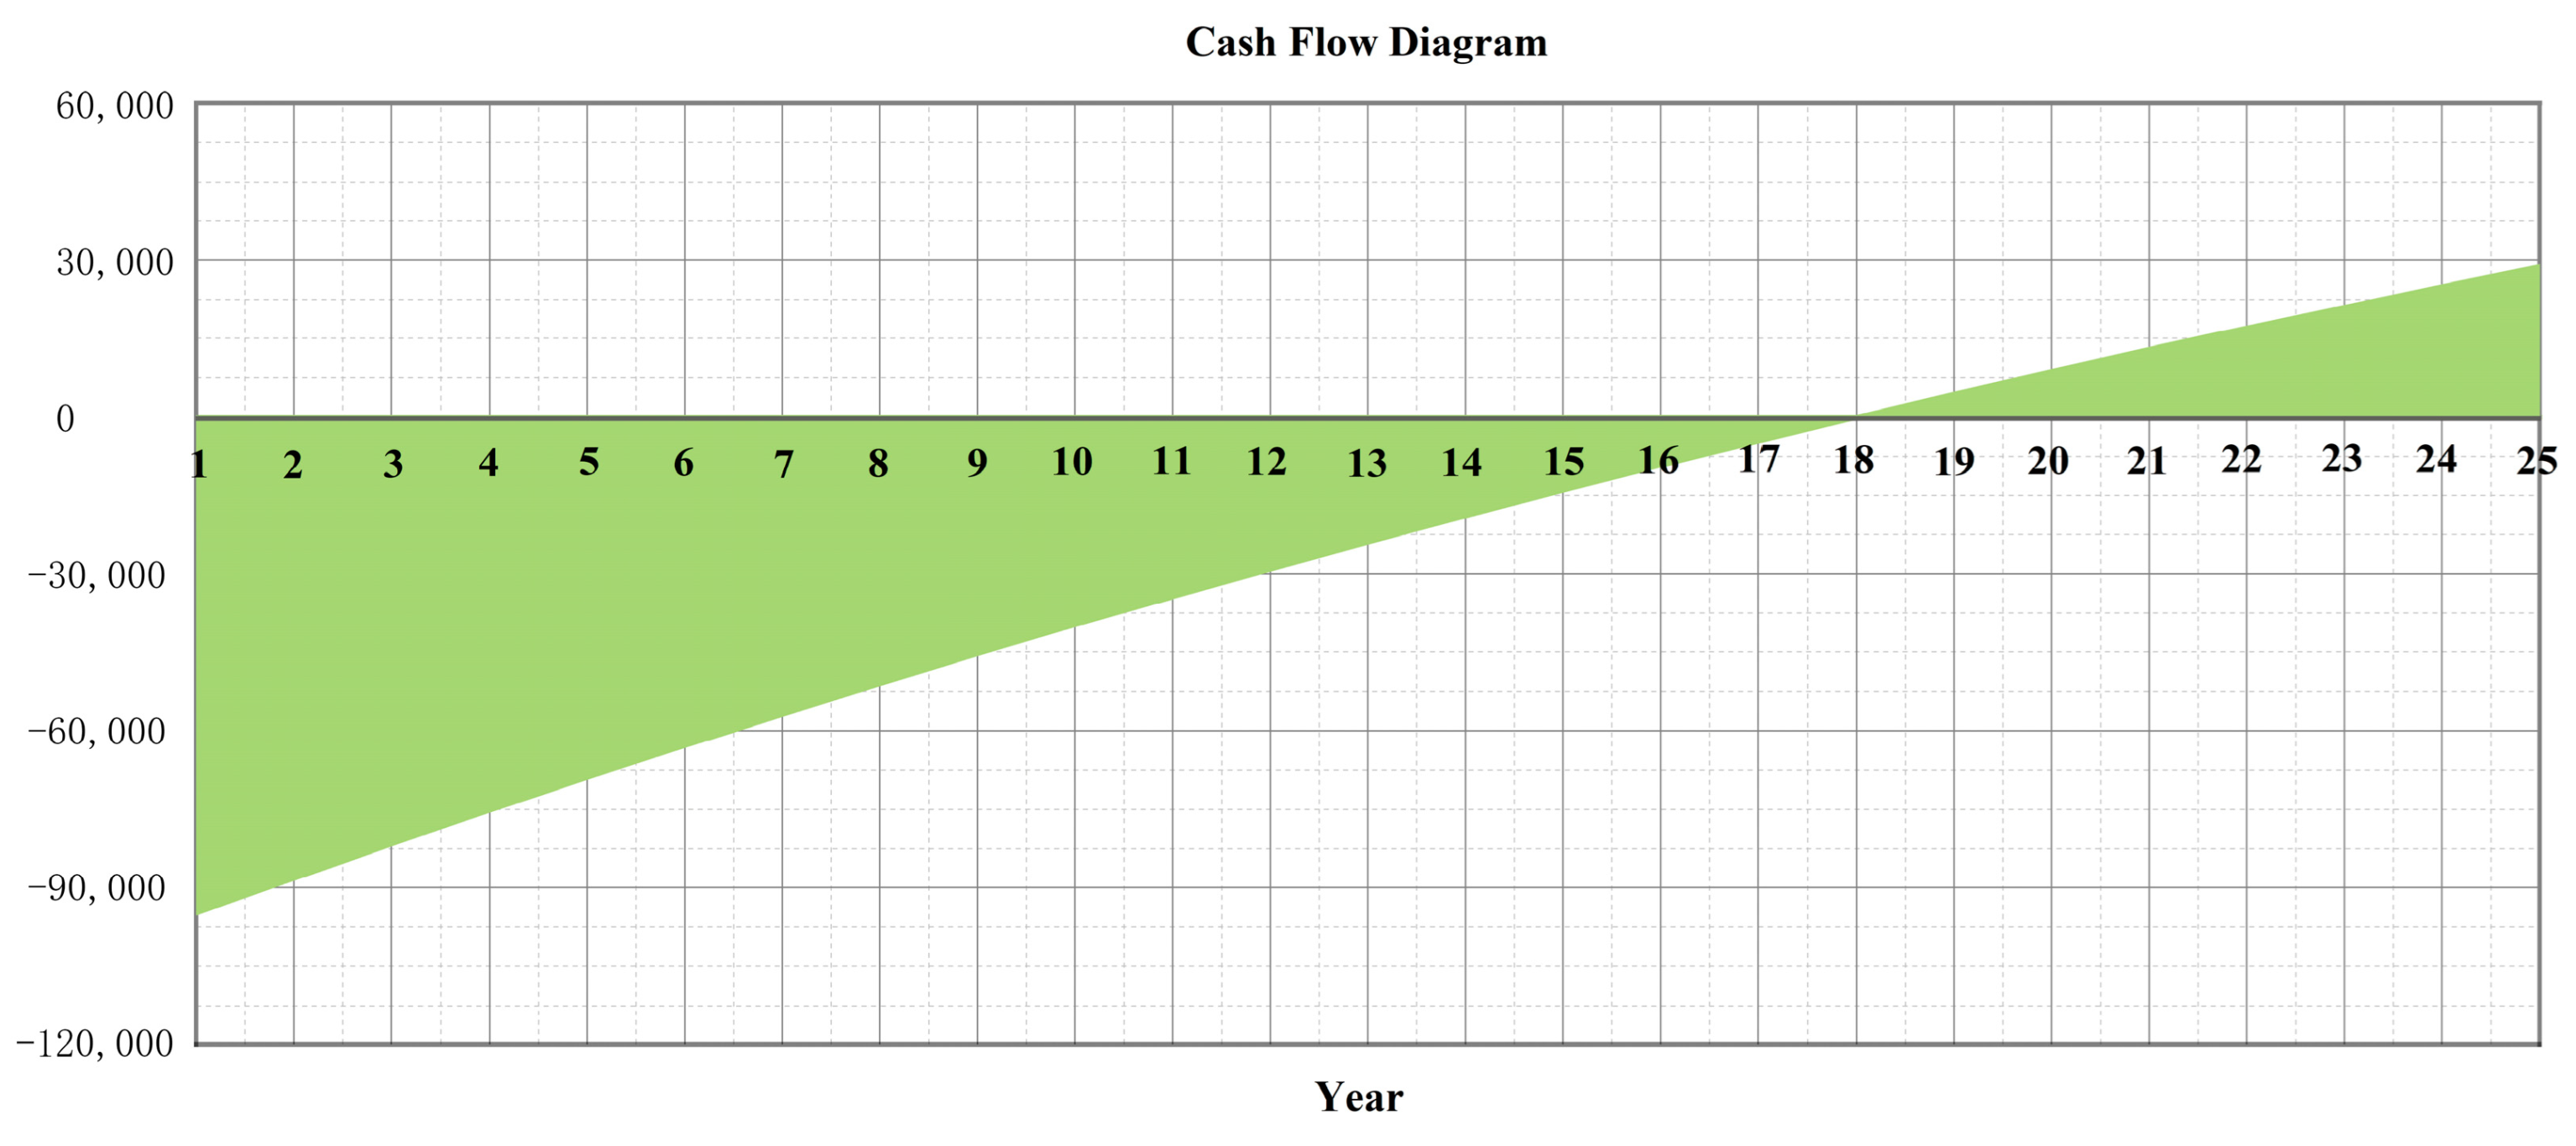
3.4.4. PV System Economic Impact Financial
4. Conclusions
- (1)
- Field experiments have revealed that the average annual solar radiation in the area amounts to 140 W/m2. The outdoor temperature experiences significant fluctuations during both the winter and summer seasons. Despite some inherent thermal insulation properties of local brick dwellings, they have not been able to provide a consistently comfortable indoor living environment. Consequently, measures such as cooling and heating are necessary to enhance indoor thermal comfort.
- (2)
- The simulation results have shown that the annual reduction in energy consumption for rooms with attached sunspaces maximum value is 884.6 kWh. Notably, there exists a nonlinear correlation between the depth of the sunspace and energy consumption, indicating that total energy consumption increases as the depth of the sunspace exceeds 1.6 m.
- (3)
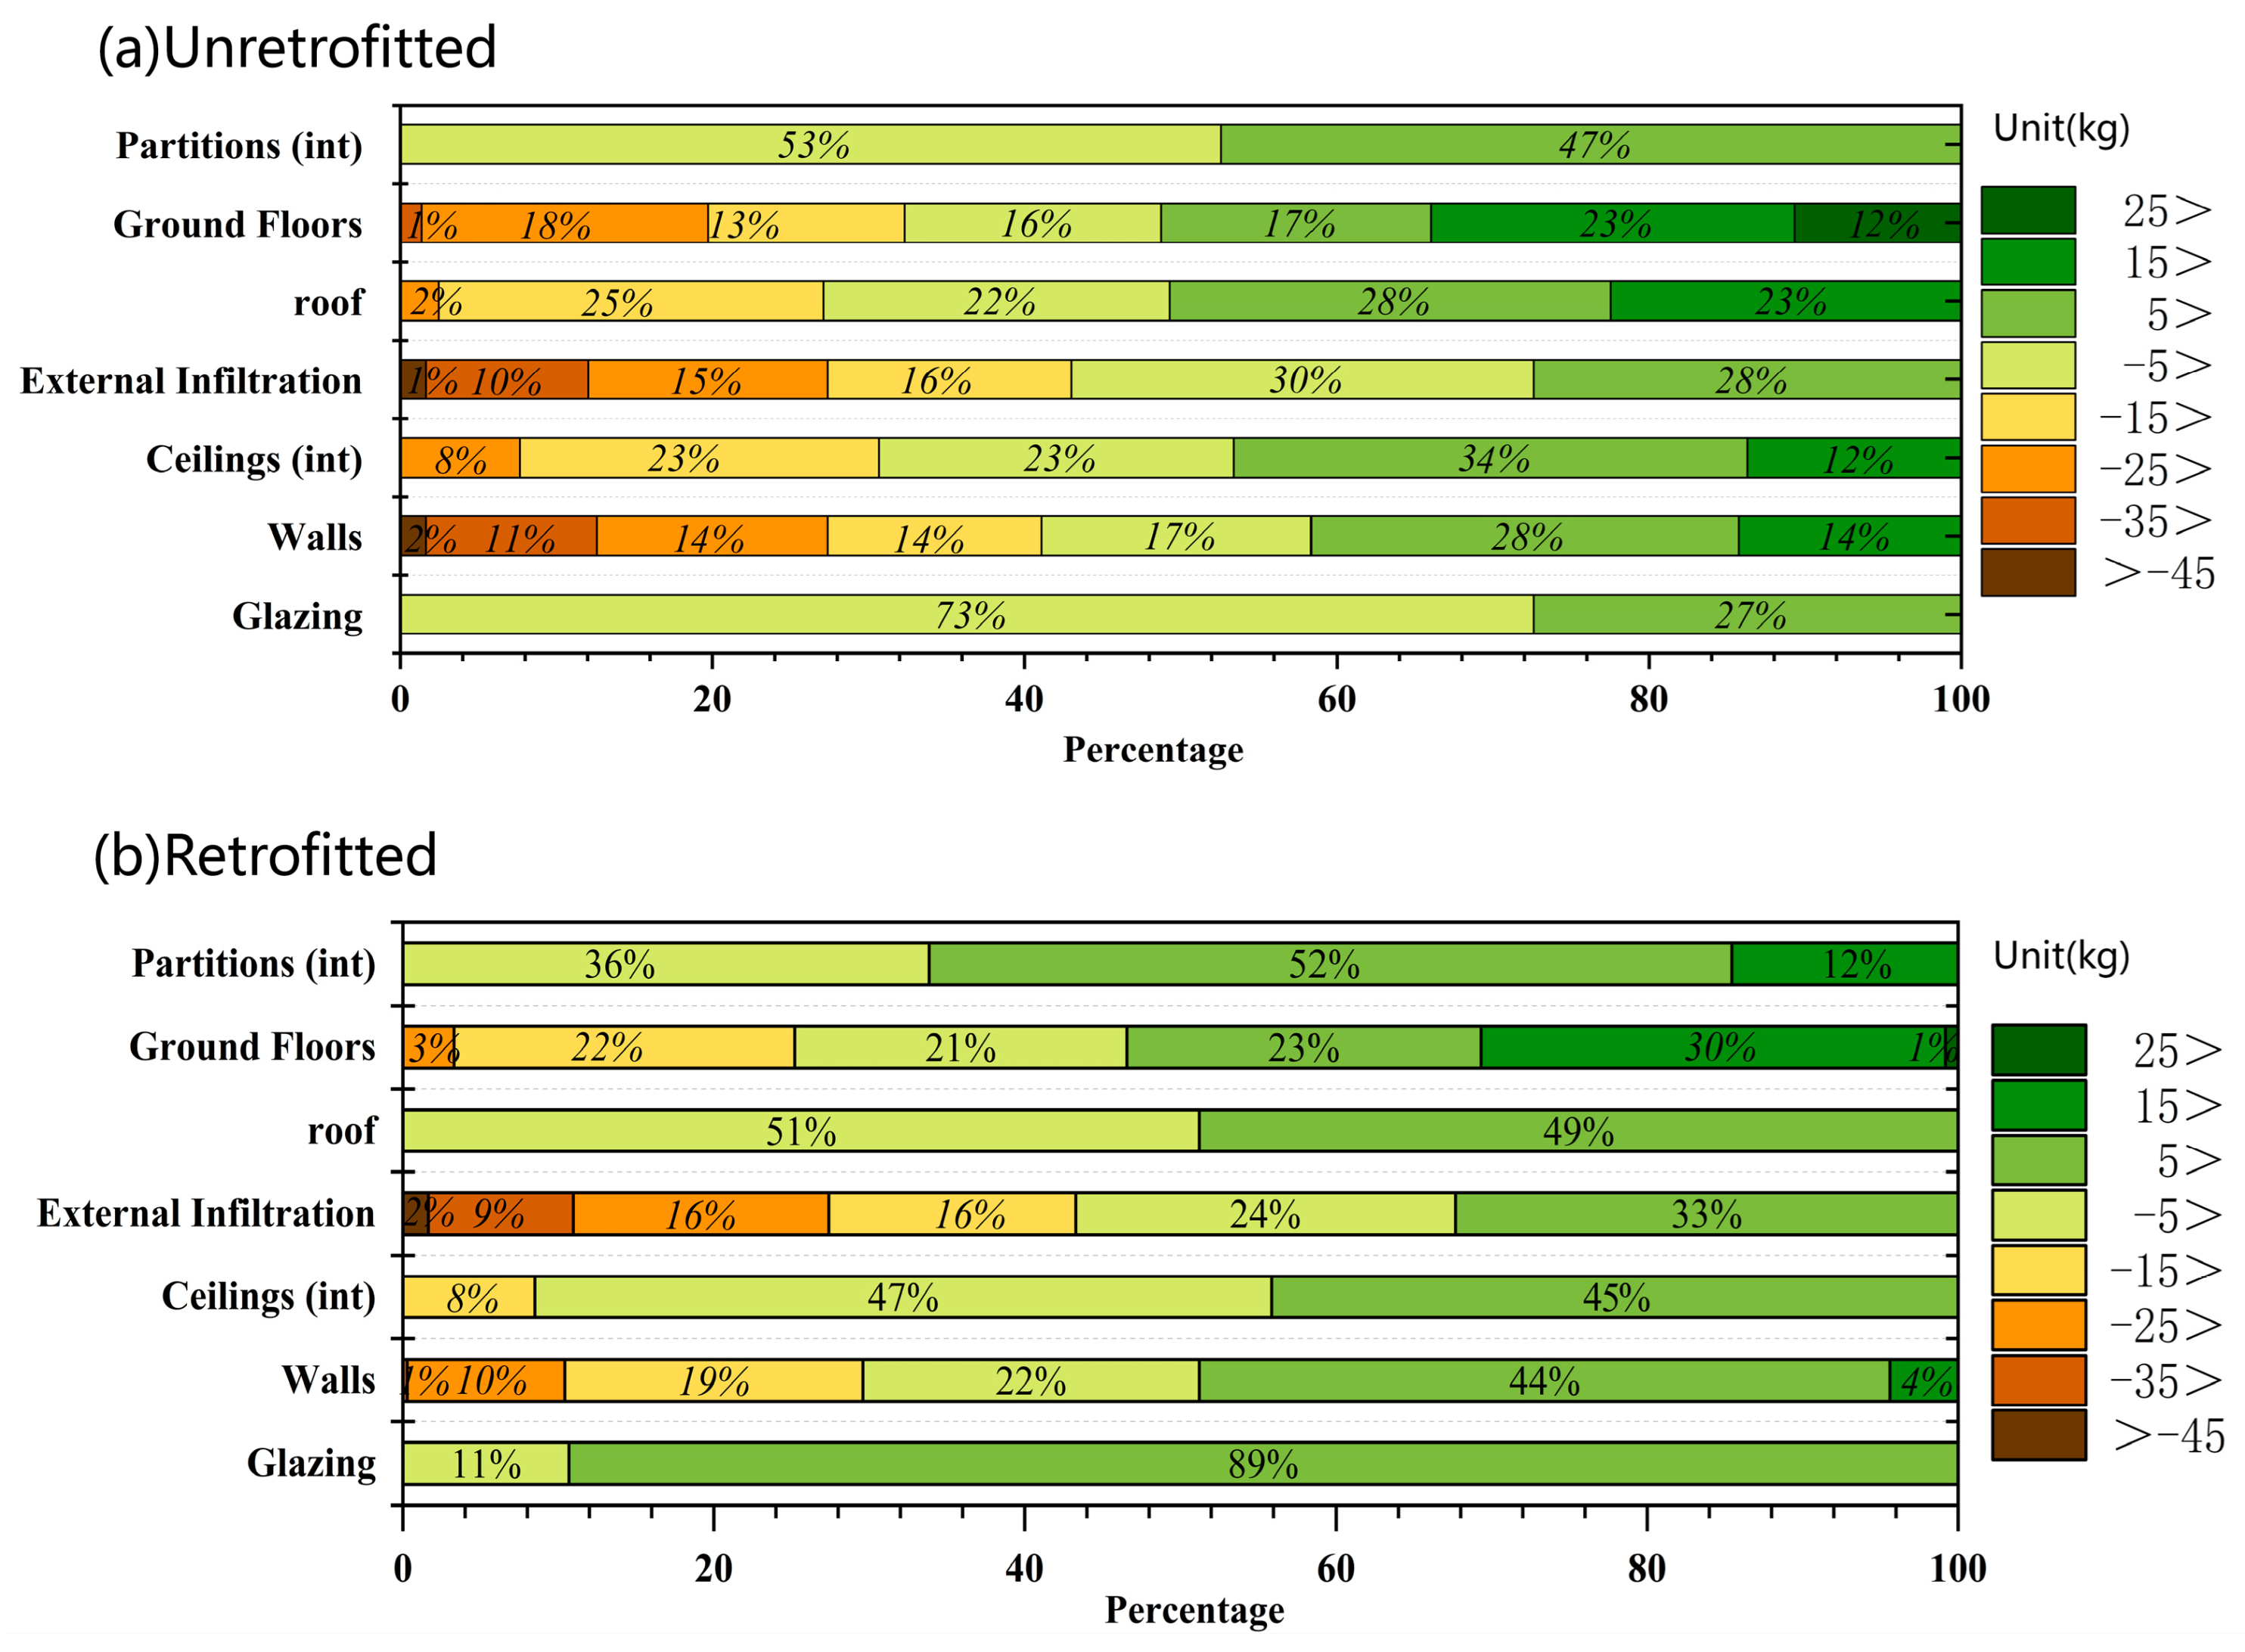
- At a wall thickness of 800 mm, there is a reduction of 744.68 kWh in indoor energy consumption. Similarly, with the preferred thickness of roof insulation material set at 15 mm, indoor energy consumption decreases by 2514.58 kWh. Additionally, a recommended outer wall insulation material thickness of 50 mm results in a decrease of 1997 kWh in indoor energy consumption. The implementation of a well-suited brick dwelling renewal design has led to a reduction in the annual CO2 emissions of a single residence by approximately 3799.79 kg.
- (4)
- When employing Photovoltaic tiles of type BPsolar 380, the annual electricity production is estimated to reach 12,057 kWh, and the approximate annual reduction in CO2 emissions after installation of a roof PV system is approximately 6631.35 kg.
Author Contributions
Funding
Institutional Review Board Statement
Informed Consent Statement
Data Availability Statement
Acknowledgments
Conflicts of Interest
References
- Kim, J.; Tzempelikos, A.; Braun, J.E. Energy Savings Potential of Passive Chilled Beams vs. Air Systems in Various US Climatic Zones with Different System Configurations. Energy Build. 2019, 186, 244–260. [Google Scholar] [CrossRef]
- Alhaj Hasan, O.; Defer, D.; Shahrour, I. A Simplified Building Thermal Model for the Optimization of Energy Consumption: Use of a Random Number Generator. Energy Build. 2014, 82, 322–329. [Google Scholar] [CrossRef]
- Cao, W.; Yang, L.; Zhang, Q.; Chen, L.; Wu, W. Evaluation of Rural Dwellings’ Energy-Saving Retrofit with Adaptive Thermal Comfort Theory. Sustainability 2021, 13, 5350. [Google Scholar] [CrossRef]
- Juan, X.; Ziliang, L.; Weijun, G.; Mengsheng, Y.; Menglong, S. The Comparative Study on the Climate Adaptability Based on Indoor Physical Environment of Traditional Dwelling in Qinba Mountainous Areas, China. Energy Build. 2019, 197, 140–155. [Google Scholar] [CrossRef]
- Sun, H.; Leng, M. Analysis on Building Energy Performance of Tibetan Traditional Dwelling in Cold Rural Area of Gannan. Energy Build. 2015, 96, 251–260. [Google Scholar] [CrossRef]
- Li, B.; Du, C.; Yao, R.; Yu, W.; Costanzo, V. Indoor Thermal Environments in Chinese Residential Buildings Responding to the Diversity of Climates. Appl. Therm. Eng. 2018, 129, 693–708. [Google Scholar] [CrossRef]
- Zhu, X.; Liu, J.; Yang, L.; Hu, R. Energy Performance of a New Yaodong Dwelling, in the Loess Plateau of China. Energy Build. 2014, 70, 159–166. [Google Scholar] [CrossRef]
- Yuk, H.; Choi, J.Y.; Kim, Y.U.; Chang, S.J.; Kim, S. Historic Building Energy Conservation with Wooden Attic Using Vacuum Insulation Panel Retrofit Technology. Build. Environ. 2023, 230, 110004. [Google Scholar] [CrossRef]
- Fantucci, S.; Serra, V. Investigating the Performance of Reflective Insulation and Low Emissivity Paints for the Energy Retrofit of Roof Attics. Energy Build. 2019, 182, 300–310. [Google Scholar] [CrossRef]
- Li, H. Green Transformation of Thermalenvironment of Block Dwellingsin Jizhong Area Based on Dynamic Simulation; Hebei University of Architecture: Zhangjiakou, China, 2011. [Google Scholar] [CrossRef]
- Zhang, L.; Dong, Z.; Liu, F.; Li, H.; Zhang, X.; Wang, K.; Chen, C.; Tian, C. Passive Solar Sunspace in a Tibetan Buddhist House in Gannan Cold Areas: Sensitivity Analysis. J. Build. Eng. 2023, 67, 105960. [Google Scholar] [CrossRef]
- Xu, J.; Yang, W.; Lu, Z.; Wu, Y.; Hou, C.; Liu, D. Quality Analysis on Indoor Thermal Comfort and Energy-Saving Improvement Strategy of Slate Dwellings, China. Buildings 2022, 12, 468. [Google Scholar] [CrossRef]
- León, E.Z.; Barraza, C.C. Adaptability of Photovoltaic Mono-Polycrystalline Solar Panels and Photovoltaic Roof Tiles on Dwelling Roofs of Real Estate Developments. Rev. Constr. 2019, 18, 42–53. [Google Scholar] [CrossRef]
- Odeh, S. Thermal Performance of Dwellings with Rooftop PV Panels and PV/Thermal Collectors. Energies 2018, 11, 1879. [Google Scholar] [CrossRef]
- Földváry Ličina, V.; Cheung, T.; Zhang, H.; de Dear, R.; Parkinson, T.; Arens, E.; Chun, C.; Schiavon, S.; Luo, M.; Brager, G.; et al. Development of the ASHRAE Global Thermal Comfort Database II. Build. Environ. 2018, 142, 502–512. [Google Scholar] [CrossRef]
- Lamsal, P.; Bajracharya, S.B.; Rijal, H.B. A Review on Adaptive Thermal Comfort of Office Building for Energy-Saving Building Design. Energies 2023, 16, 1524. [Google Scholar] [CrossRef]
- Yao, R.; Li, B.; Liu, J. A Theoretical Adaptive Model of Thermal Comfort—Adaptive Predicted Mean Vote (APMV). Build. Environ. 2009, 44, 2089–2096. [Google Scholar] [CrossRef]
- Timur, B.A.; Başaran, T.; İpekoğlu, B. Thermal Retrofitting for Sustainable Use of Traditional Dwellings in Mediterranean Climate of Southwestern Anatolia. Energy Build. 2022, 256, 111712. [Google Scholar] [CrossRef]
- Hou, L.Q.; Yang, L.; Liu, D.L.; Xu, X.Y.; Liu, J.P. Research on optimization of envelope structure of traditional residential buildings in Kangding. Build. Energy Effic. 2016, 3, 43–46+50. [Google Scholar] [CrossRef]
- Gelesz, A.; Catto Lucchino, E.; Goia, F.; Serra, V.; Reith, A. Characteristics That Matter in a Climate Façade: A Sensitivity Analysis with Building Energy Simulation Tools. Energy Build. 2020, 229, 110467. [Google Scholar] [CrossRef]
- Wang, H.F.; Chiou, S.C. Spatial Form Analysis and Sustainable Development Research of Traditional Residential Buildings. Sustainability 2020, 12, 637. [Google Scholar] [CrossRef]
- Saif, J.; Wright, A.; Khattak, S.; Elfadli, K. Keeping Cool in the Desert: Using Wind Catchers for Improved Thermal Comfort and Indoor Air Quality at Half the Energy. Buildings 2021, 11, 100. [Google Scholar] [CrossRef]
- Xu, C.; Li, S.; Zhang, X. Energy Flexibility for Heating and Cooling in Traditional Chinese Dwellings Based on Adaptive Thermal Comfort: A Case Study in Nanjing. Build. Environ. 2020, 179, 106952. [Google Scholar] [CrossRef]
- Wang, F.; Wang, S.; Cheng, B.; Wang, W. To Inhabit, Retain, or Abandon? Adaptive Utilization of Energy-Efficient Sunken Buildings by Rural Households in Shanzhou, China. Energy Build. 2022, 255, 111668. [Google Scholar] [CrossRef]
- Becker, F.G.; Cleary, M.; Team, R.M.; Holtermann, H.; The, D.; Agenda, N.; Science, P.; Sk, S.K.; Hinnebusch, R.; Hinnebusch, A.R.; et al. Design Standard for Energy Efficiency of Residential Buildings in Hot Summer and Cold Winter Zone. Syr. Stud. 2015, 7, 37–72. [Google Scholar]
- Huang, J.; Sun, W.; Zhang, Z.; Ling, Z.; Fang, X. Thermal Protection of Electronic Devices Based on Thermochemical Energy Storage. Appl. Therm. Eng. 2021, 186, 116507. [Google Scholar] [CrossRef]
- Yang, T.; Wei, J.; Guo, Y.; Lv, Z.; Xu, Z.; Cheng, Z. Manipulation of Oxygen Vacancy for High Photovoltaic Output in Bismuth Ferrite Films. ACS Appl. Mater. Interfaces 2019, 11, 23372–23381. [Google Scholar] [CrossRef] [PubMed]
- Hou, C.F.; Li, S.Q.; Li, B.; Sun, X.D. Incoherently Coupled Bright-Dark Screening-Photovoltaic Soliton Pairs in Biased Photovoltaic Photorefractive Crystals. Acta Phys. Sin. 2001, 50, 1711–1712. [Google Scholar] [CrossRef]
- Lu, K.-Q.; Zhang, Y.-P.; Tang, T.-T.; Lu, Z.-X.; Liu, L. Steady-State Screening-Photovoltaic Spatial Solitons in the Biased Photorefractive-Photovoltaic Crystals. Chin. Phys. Lett. 2001, 18, 233–235. [Google Scholar] [CrossRef]
- Mahar, W.A.; Verbeeck, G.; Reiter, S.; Attia, S. Sensitivity Analysis of Passive Design Strategies for Residential Buildings in Cold Semi-Arid Climates. Sustainability 2020, 12, 1091. [Google Scholar] [CrossRef]
- Mahar, W.A.; Verbeeck, G.; Singh, M.K.; Attia, S. An Investigation of Thermal Comfort of Houses in Dry and Semi-Arid Climates of Quetta, Pakistan. Sustainability 2019, 11, 5203. [Google Scholar] [CrossRef]
- Bayarri, M.J.; Berger, J.O.; Cafeo, J.; Garcia-Donato, G.; Liu, F.; Palomo, J.; Parthasarathy, R.J.; Paulo, R.; Sacks, J.; Walsh, D. Computer Model Validation with Functional Output. Ann. Stat. 2007, 35, 1874–1906. [Google Scholar] [CrossRef]
- Gao, J.; Wang, Y.; Wargocki, P. Comparative Analysis of Modified PMV Models and SET Models to Predict Human Thermal Sensation in Naturally Ventilated Buildings. Build. Environ. 2015, 92, 200–208. [Google Scholar] [CrossRef]
- Cheung, T.; Schiavon, S.; Parkinson, T.; Li, P.; Brager, G. Analysis of the Accuracy on PMV—PPD Model Using the ASHRAE Global Thermal Comfort Database II. Build. Environ. 2019, 153, 205–217. [Google Scholar] [CrossRef]
- Enescu, D. A Review of Thermal Comfort Models and Indicators for Indoor Environments. Renew. Sustain. Energy Rev. 2017, 79, 1353–1379. [Google Scholar] [CrossRef]
- Kim, J.; Zhou, Y.; Schiavon, S.; Raftery, P.; Brager, G. Personal Comfort Models: Predicting Individuals’ Thermal Preference Using Occupant Heating and Cooling Behavior and Machine Learning. Build. Environ. 2018, 129, 96–106. [Google Scholar] [CrossRef]
- Karunakaran, R.; Iniyan, S.; Goic, R. Energy Efficient Fuzzy Based Combined Variable Refrigerant Volume and Variable Air Volume Air Conditioning System for Buildings. Appl. Energy 2010, 87, 1158–1175. [Google Scholar] [CrossRef]
- Wang, Y.; Zhao, F.Y.; Kuckelkorn, J.; Liu, D.; Liu, L.Q.; Pan, X.C. Cooling Energy Efficiency and Classroom Air Environment of a School Building Operated by the Heat Recovery Air Conditioning Unit. Energy 2014, 64, 991–1001. [Google Scholar] [CrossRef]
- Zou, H.; Liu, Z.; Long, E. An Experimental Study on External Ventilation to the Heating Performance of Household Air Source Heat Pump. Front. Energy Res. 2021, 9, 785461. [Google Scholar] [CrossRef]
- Shahsavar, A.; Salmanzadeh, M.; Ameri, M.; Talebizadeh, P. Energy Saving in Buildings by Using the Exhaust and Ventilation Air for Cooling of Photovoltaic Panels. Energy Build. 2011, 43, 2219–2226. [Google Scholar] [CrossRef]
- Helton, J.C.; Johnson, J.D.; Sallaberry, C.J.; Storlie, C.B. Survey of Sampling-Based Methods for Uncertainty and Sensitivity Analysis. Reliab. Eng. Syst. Saf. 2006, 91, 1175–1209. [Google Scholar] [CrossRef]
- GB/T 51366-2019; Standard for Building Carbon Emission Calculation. The Standardization Administration of the People’s Republic of China: Beijing, China, 2019.


| Walls | Doors and Windows | Roof |
|---|---|---|
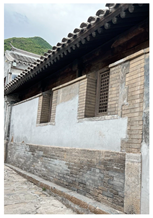 | 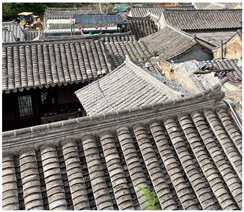 | 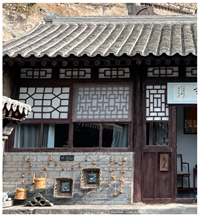 |
| Considering the construction materials employed, the walls are primarily composed of brick, with a thickness of 370 mm. These walls serve a dual purpose: they offer insulation while also promoting ventilation. A plaster coat completes the exterior finish of the wall. | One side of the courtyard is designated as the front. Besides a brief segment of the windowsill wall, the majority of this facade features wooden doors and windows. All rooms within the compound have their doors and windows oriented towards the inner courtyard. The exterior and lateral walls are constructed robustly, often devoid of windows or furnished with only diminutive ones. This architectural approach compromises the building’s air-tightness, considerably impacting the indoor climate during winter. | Each roof features a double-sloped design reminiscent of a sharp mountain peak, ensuring optimal drainage efficiency. A buffer layer between the roof and ceiling effectively mitigates the notable temperature fluctuations between winter and summer, thereby elevating indoor comfort. The roof is constructed with petite green tiles, known for their durability and reduced long-term maintenance costs. Furthermore, these tiles exhibit exceptional insulation and waterproofing properties. |
| Item | construction | U-value (w/m2) |
| Roof | 20 mm tile | 1.02 |
| Ground | 100 mm plain concrete | 2.92 |
| Windows | Wooden frame single glazing (3 mm) | 6.257 |
| Brick dwelling | 200 mm brick | 0.72 |
| Interior wall | 30 mm Wooden Board | 5.621 |
| Glazing NO. | Window Glazing Type | Total Solar Transmission | U-Value (W/M2K) | Light Transmission |
|---|---|---|---|---|
| G1 | Single clear (6 mm) (SC) | 0.81 | 6.1 | 0.744 |
| G2 | Sgl LoE (e2 = 0.2) Clr 6 mm | 0.72 | 3.779 | 0.811 |
| G3 | Dbl LoE (e2 = 0.1) Tint 6 mm/13 mm Air | 0.38 | 1.761 | 0.44 |
| G4 | Trp LoE (e2 = e5 = 0.1) Clr 3 mm/13 mm Air | 0.474 | 0.982 | 0.661 |
| G5 | Single reflective (6 mm) (SR) | 0.28 | 5.1 | 0.72 |
| G6 | Double reflective-D (6 m/13 mm Air) (DR) | 0.7 | 2.7 | 0.69 |
| NO. | Insulation Type | Heat Conductivity W (m·k) | Specific Heat Capacity KJ/(kg·K) | Density (kg/m³) |
|---|---|---|---|---|
| I1 | Woods—fir, pine | 0.12 | 1380 | 510 |
| I2 | Extruded polystyrene (XPS) | 0.03 | 1400 | 35 |
| I3 | Aluminum Foil | 0.22 | 2700 | 130 |
| I4 | Insulation Paint | 0.03 | 896 | 1240 |
| Photovoltaic NO. | Solar Photovoltaic Panel Type | Module Current at Max Power (A) | Module Voltage at Max Power (V) | Short Circuit Current (A) | Open Circuit Voltage (A) |
|---|---|---|---|---|---|
| P1 | ASE 300-DFG/50 | 5.6 | 50.5 | 6.2 | 60 |
| P2 | BP Solar 380 | 4.55 | 17.6 | 4.8 | 22.1 |
| P3 | Shell S115 | 4.2 | 26.8 | 4.7 | 32.8 |
| P4 | Uni Solar PVL-128 | 3.88 | 33 | 4.8 | 47.6 |
| Category | Building Parameters | Unit | Variable Names | Probability Density Functions | Sampling Range | Variation Step |
|---|---|---|---|---|---|---|
| Thermal insulation | Insulation type of wall Insulation type of roof | - | X1 X2 | Discrete Discrete | I1, I2 I3, I4 | Table 1 Table 1 |
| Thermal mass | Insulation thickness of the roof Insulation thickness of the wall | mm mm | X3 X4 | Continuous uniform Continuous uniform | [0,45] [0,200] | 5 20 |
| Thermal mass | Thickness of roof Thickness of wall | mm mm | X5 X6 | Continuous uniform Continuous uniform | [200] [200,2000] | - 200 |
| parameters | Glazing type | - | X7 | Discrete | [G1, G4] | Table 3 |
| Type of PV system | Long axis azimuth | - | X8 | Discrete | [P1, P4] | Table 4 |
| Sunspace structural | Width | m | X9 | Continuous uniform | [1.2, 1.8] | 0.1 |
| ASE 300-DFG/50 | BP Solar 380 | Shell s115 | Uni-Solar PVL-128 | |||||
|---|---|---|---|---|---|---|---|---|
| Total Investment = CNY 69,010 | Total Investment = CNY 111,220 | Total Investment = CNY 85,425 | Total Investment = CNY 101,840 | |||||
| Unit cost = 1030 CNY/m2 | Unit cost = 1560 CNY/m2 | Unit cost = 1275 CNY/m2 | Unit cost = 1420 CNY/m2 | |||||
| annual profit = CNY 4504 | annual profit = CNY 7486 | annual profit = CNY 5924 | annual profit = CNY 7090 | |||||
| Inflation rate, d = 2.5% | Inflation rate, d = 2.5% | Inflation rate, d = 2.5% | Inflation rate, d = 2.5% | |||||
| Years | Cash flow (CNY) | NPV (CNY) | Cash flow (CNY) | NPV (CNY) | Cash flow (CNY) | NPV (CNY) | Cash flow (CNY) | NPV (CNY) |
| 1 | 4394.1 | −64,615.9 | 7303 | −103,917 | 5779.5 | −79,645.5 | 6917.1 | −94,922.9 |
| 2 | 4285.5 | −60,330.4 | 7123.2 | −96,793.8 | 5636.5 | −74,009 | 6745.9 | −88,177 |
| 3 | 4185.9 | −56,144.5 | 6957.2 | −89,836.6 | 5505.6 | −68,503.4 | 6589.2 | −81,587.8 |
| 4 | 4079.7 | −52,064.8 | 6780.8 | −83,055.8 | 5366 | −63,137.4 | 6422.2 | −75,165.6 |
| 5 | 3982.3 | −48,082.5 | 6618.9 | −76,436.9 | 5237.8 | −57,899.6 | 6268.7 | −68,896.9 |
| 6 | 3882.7 | −44,199.8 | 6453.5 | −69,983.4 | 5106.9 | −52,792.7 | 6112.1 | −62,784.8 |
| 7 | 3788.1 | −40,411.7 | 6296 | −63,687.4 | 4982.3 | −47,810.4 | 5963 | −56,821.8 |
| 8 | 3697.9 | −36,713.8 | 6146.2 | −57,541.2 | 4863.8 | −42,946.6 | 5821 | −51,000.8 |
| 9 | 3608.9 | −33,104.9 | 5998.4 | −51,542.8 | 4746.8 | −38,199.8 | 5681.1 | −45,319.7 |
| 10 | 3518.8 | −29,586.1 | 5848.4 | −45,694.4 | 4628.1 | −33,571.7 | 5539.1 | −39,780.6 |
| 11 | 3432.9 | −26,153.2 | 5705.8 | −39,988.6 | 4515.2 | −29,056.5 | 5403.9 | −34,376.7 |
| 12 | 3351.2 | −22,802 | 5569.9 | −34,418.7 | 4407.8 | −24,648.7 | 5275.3 | −29,101.4 |
| 13 | 3266.1 | −19,535.9 | 5428.6 | −28,990.1 | 4295.8 | −20,352.9 | 5141.4 | −23,960 |
| 14 | 3189.8 | −16,346.1 | 5301.7 | −23,688.4 | 4195.5 | −16,157.4 | 5021.3 | −18,938.7 |
| 15 | 3110.5 | −13,235.6 | 5169.9 | −18,518.5 | 4091.2 | −12,066.2 | 4896.4 | −14,042.3 |
| 16 | 3034.7 | −10,200.9 | 5043.8 | −13,474.7 | 3991.3 | −8074.87 | 4776.98 | −9265.32 |
| 17 | 2960.5 | −7240.31 | 4920.76 | −8553.94 | 3894.02 | −4180.85 | 4660.47 | −4604.85 |
| 18 | 2888.41 | −4351.9 | 4800.75 | −3753.19 | 3799.05 | −381.799 | 4546.8 | −58.04 |
| 19 | 2817.96 | −1533.94 | 4683.66 | 930.47 | 3706.39 | 3324.591 | 4435.9 | 4377.859 |
| 20 | 2749.2 | 1215.282 | 4569.43 | 5499.9 | 3615.99 | 6940.58 | 4327.71 | 8705.571 |
| 21 | 2682.2 | 3897.454 | 4457.98 | 9957.887 | 3527.79 | 10,468.37 | 4222.16 | 12,927.73 |
| 22 | 2616.8 | 6514.208 | 4349.25 | 14,307.14 | 3441.76 | 13,910.13 | 4119.18 | 17,046.91 |
| 23 | 2552.9 | 9067.138 | 4243.16 | 18,550.3 | 3357.8 | 17,267.93 | 4018.71 | 21,065.62 |
| 24 | 2490.7 | 11,557.8 | 4139.68 | 22,689.98 | 3275.91 | 20,543.84 | 3920.69 | 24,986.31 |
| 25 | 2429.9 | 13,987.72 | 4038.71 | 26,728.69 | 3196.01 | 23,739.85 | 3825.07 | 28,811.38 |
Disclaimer/Publisher’s Note: The statements, opinions and data contained in all publications are solely those of the individual author(s) and contributor(s) and not of MDPI and/or the editor(s). MDPI and/or the editor(s) disclaim responsibility for any injury to people or property resulting from any ideas, methods, instructions or products referred to in the content. |
© 2023 by the authors. Licensee MDPI, Basel, Switzerland. This article is an open access article distributed under the terms and conditions of the Creative Commons Attribution (CC BY) license (https://creativecommons.org/licenses/by/4.0/).
Share and Cite
Xie, L.; Fan, L.; Zhang, D.; Liu, J. Passive Energy Conservation Strategies for Mitigating Energy Consumption and Reducing CO2 Emissions in Traditional Dwellings of Peking Area, China. Sustainability 2023, 15, 16459. https://doi.org/10.3390/su152316459
Xie L, Fan L, Zhang D, Liu J. Passive Energy Conservation Strategies for Mitigating Energy Consumption and Reducing CO2 Emissions in Traditional Dwellings of Peking Area, China. Sustainability. 2023; 15(23):16459. https://doi.org/10.3390/su152316459
Chicago/Turabian StyleXie, Liang, Lai Fan, Dayu Zhang, and Jixin Liu. 2023. "Passive Energy Conservation Strategies for Mitigating Energy Consumption and Reducing CO2 Emissions in Traditional Dwellings of Peking Area, China" Sustainability 15, no. 23: 16459. https://doi.org/10.3390/su152316459
APA StyleXie, L., Fan, L., Zhang, D., & Liu, J. (2023). Passive Energy Conservation Strategies for Mitigating Energy Consumption and Reducing CO2 Emissions in Traditional Dwellings of Peking Area, China. Sustainability, 15(23), 16459. https://doi.org/10.3390/su152316459