Abstract
Recently, the main aim of the road freight transportation sector has been the establishment of a cost-effective and sustainable operation because it is one of the most environmentally damaging and most expensive elements of the supply chains’ activities. The efficiency improvement and optimization of these transport activities can result in significant cost savings, which lead to increased competitiveness of the transport companies. Two new methods were elaborated for the optimization of road freight transport activities; therefore, this research is very innovative and up to date. The elaborated methods are as follows: (1) A new calculation method for the precise prime cost pre-calculation of transport tasks in order to determine an accurate transport fee, thus ensuring the company’s profit; furthermore, the losses can be eliminated in order to provide competitiveness to the transport company. (2) A new optimization method for the refueling procedure of international transport trips in order to minimize the total fuel cost of the transport trips taking into consideration the different unit fuel prices at the different stations. Therefore, the elaborated optimization method on the one hand helps in selecting the optimal petrol station and, on the other hand, defines the optimal amount of fuel to be refueled. Based on the newly developed methods, two decision-supporting software applications were developed to establish more profitable and sustainable transportation. The added value of the developed calculation methods and software applications is that, recently, both the prime cost calculation and the fuel supply optimization have not been supported by software. This is the reason the two developed methods and two software applications are innovative and unique. The newly developed software applications were successfully implemented at transport companies. The correctness of both elaborated mathematical methods was validated using the developed software in real case studies.
1. Introduction
Road freight transport is one of the most environmentally damaging and most expensive logistical activities. The transport cost sometimes reaches up to 30% of the total cost of the supply chain [1,2]. This is the reason both manufacturing and service companies have to reduce these costs significantly. Therefore, the optimization of transport activity can result in significant cost savings for manufacturing companies and service providers.
Road freight transport represents 78% of the total freight transport in Europe. The reasons for this are as follows:
- Road transport has the densest road network compared to the other transport modes (rail, water, air); furthermore, a wide range of goods can be transported through this transport mode without any limitations.
- The transport of goods between loading-in and loading-out stations can be achieved without transshipment.
- Short transit times for goods can be realized due to the relatively high speed of transportation.
- Relatively flexible transport mode in terms of both route and delivery time.
- A high degree of flexibility and adaptability to customer requirements can be achieved.
- The dynamic loading effects on the transported goods during transportation are low and the resulting damage to the goods is also low [3,4].
One of the main aims of the rollers of the transport sector is the optimization of the transport activity and reduction in the transport cost.
The main aim of this research was to optimize international road freight transportation primarily from an economic sustainability perspective. Two innovative calculation methods were elaborated in order to support the profitable and cost-effective realization of freight transportation.
In Section 2, a newly developed calculation method and software application for the precise prime cost pre-calculation of transport tasks are introduced. The accurate pre-calculation—before the achievement of the transport task—of the prime cost of a given transport task is essential for the transport companies in order to determine an adequate transport fee. The transport fee for a given transport task can be determined considering the pre-calculated prime cost and the company’s profit to provide competitiveness to the transport company. The transport task means a given transport activity ordered by a customer, which is defined by the loading-in and loading-out stations and the weight of the cargo to be transported.
In Section 3, a new optimization method and software application for the refueling procedure of vehicles working in international transport trips are introduced. The purpose was to minimize the total fuel cost of the transport trips taking into consideration the different unit fuel prices at the different stations. Therefore, the elaborated optimization method on the one hand helps to select the optimal petrol station and, on the other hand, defines the optimal amount of fuel to be refueled.
The added value of the introduced calculation methods and software applications is that both the prime cost calculation and the fuel supply procedure are not based on mathematical calculation methods; furthermore, they are not supported by software. This is the reason the two developed methods and two software applications are innovative and unique. The newly developed software applications were successfully implemented at forwarding companies.
2. Literature Review
The main objective in the transport sector is to reduce transport costs, carry out transport tasks as efficiently and economically as possible, and establish sustainable transport [5,6,7,8].
Sustainability is based on the following three main aspects according to most of the relevant literature: environmental, social, and economic [9,10,11,12,13]. The realization of all aspects is essential in the organization and operation of the road transportation sector.
One of the key objectives of the European Union’s (EU) common transport policy is to increase the cooperation and coordination between the different transport modes (road, rail, water, air) in order to achieve these objectives. Another key objective of the EU is to reduce the share (78%) of road freight transport in the global transport sector and increase the utilization of the free capacity of rail- and waterways. This will lead to the more efficient use of energy and raw materials globally [14,15].
Reducing the share of road freight transport would also reduce the significant emissions and noise pollution caused by the road transport sector [16].
Recently, the intensity of road transportation has been continuously growing. However, despite these efforts, experts predict that the current high share of road freight transport will increase further in the future. Customers’ expectations relating to the quality of transport services are also increasing (e.g., the delivery time acceptable to consumers is decreasing), there is demand for cost reduction, and the traceability of products is expected [17,18].
Based on the literature review and the author’s professional experience, the possible ways to optimize the performance of road freight transport and to reduce transport costs are as follows:
- Planning and determining the optimal transport routes; eliminating empty runs (running without useful load); and integrating several transport tasks into one round trip, etc. [19].
- Maximizing vehicle capacity utilization and providing more efficient transport management.
- More effective use of logistics IT tools to improve the efficient execution of transport tasks and ensure the traceability and controllability of the transported goods.
- The use of multimodal transportation; combining road, rail, air, and water transport modes in the transport chain; and taking advantage of each other’s advantages and eliminating each other’s disadvantages.
- Modernization of the vehicle fleet: the use of more modern, lower-consumption, more environmentally friendly engines, and the wider application of vehicles using alternative fuels (gas, electric), etc.
- Application of innovative results of scientific research (digitalization, software development, development of route optimization algorithms, etc.) in practice [20,21,22,23].
A lot of publications are available on the topics of the efficiency improvement of road freight transport and the reduction in freight transport costs [24,25,26,27]. Any method that helps to optimize the performance of road freight transport activities will also indirectly lead to a reduction in freight transport costs [28,29,30]. The relevant publications dealing with the cost components of transport activity have been reviewed [31,32,33].
After a deep analysis of the literature, it can be concluded that the available publications do not deal with all of the cost components of transport costs in sufficient detail, and the factors influencing the transport costs are discussed only in theoretical aspects instead of practical aspects. In the articles, the fuel cost is only considered as static data. In my opinion, the fuel consumption of the vehicle is not a constant value, but dynamically changing, depending on the weight of the transported load and also on the topography. This aspect has not been previously investigated in the literature.
Optimal planning of road freight transport trips is a very complex task. Several publications deal with the optimal performance of road freight transport through an efficient organization of transport tasks resulting in the reduction in transport costs [34,35,36]. The relevant publications discuss the optimal design of round trips using different methods, for example, the selection of optimal transport routes, the elimination of empty runs, the integration of several transport tasks into one round trip, as well as the use of multimodal transport modes to maximize the use of vehicle capacity [37,38,39,40]. The relevant publications dealing with the overall costs of transport activity have also been reviewed [41,42,43]. Obviously, any method that helps to achieve optimal performance of road freight transport will indirectly result in the reduction in transport costs.
After reviewing the literature, it can be concluded that although several publications deal with the optimization of freight transport activities and networks [44,45], the publications available on this topic mainly focus on route optimization and the optimal planning of transport round trips [46,47,48,49]. The elaboration of route optimization algorithms is also presented in several publications [50,51,52], whose aim is to reduce transport distances and costs. Furthermore, there are a few publications in which the cost of freight transport is already considered in the optimization process [53,54].
One of the main objectives of the organization of freight transport activity is economic sustainability, i.e., the reduction in transport costs per unit volume of goods and, hence, in fuel costs [55,56,57]. The fuel optimization of road freight transportation activity is a gap in the literature.
Based on the synthesis of the literature, it can be concluded that there is no available publication based on the innovative idea of developing an optimization method that helps to select—among fuel stations at different locations and different unit fuel prices—the optimal petrol station and the optimal amount of fuel to be refilled in order to minimize the fuel cost of a given transport trip.
3. Materials and Methods—Calculation Method and Software for Prime Cost Calculation of Road Freight Transport Trips
3.1. Reasons and Purpose of this Research
Nowadays, in the practice of the transport sector, the determination of the transport tasks’ transport fees is individually and roughly estimated by the transport managers. This means that the transport manager—who is responsible for the organization of the transport trips—has to make a bid for the transport fee after receiving a customer order for a given transport task.
Actually, the estimation of the price offer is based on specific transportation costs obtained from the analysis of the historical transport data. This cost analysis results in an average transport cost per kilometer with a high deviation; therefore, in this approach, the calculation of the cost for a new transport task can result in a false and inaccurate fee calculation in most cases. Consequently, the estimated and offered transport fee relating to a given transport task can be higher or lower than the real accurate prime cost.
The basic problems of the actually used calculation practice are as follows:
- If the cost offer relating to the transport task is low compared to the prime cost of the transport trip, the transport enterprise will not turn a profit.
- If the cost offer for the transport task is much higher than the transport trip’s prime cost, the offered fee for the ordered transport task will be much higher compared to the market price. In this case, the forwarding enterprise will not be competitive. The customer will not entrust the forwarding enterprise with the task, and the enterprise will thus not realize any income.
To avoid the abovementioned cases, a precise prime cost pre-calculation of every new demand has to be achieved.
The primary aim of this research is the elaboration of an accurate and fast calculation method that can ensure profitable round trips. A detailed calculation method relating to the total prime cost’s components has to be developed.
3.2. The Novelty of the Newly Developed Cost Calculation Method
The novelty and added value of the newly developed, accurate cost calculation method is that the author defined and took into consideration the following two new relevant factors influencing the fuel cost components in the calculation, which have not been discussed in the literature until now. The two new correction factors are the following: (1) the weight of the cargo ( in Equations (3)) and (2) the topography ( in Equation (3)). These two correction factors have a strong influence on the fuel consumption of the vehicle and thus on the fuel cost. For each transport task, the values of these two factors have to be defined for each available transport vehicle of the company. The author utilized real data sets for the most frequently used type of transport vehicles in one of their previous industrial R&D projects. For example, a Volvo or a Scania semi-trailer truck (24 tons of capacity) has a basic fuel consumption of ~20 L/100 km without a payload. However, loaded with 24 tons, the additional consumption is ~+4 dL/ton. That is +9.6 L/100 km of extra fuel consumption, which increases consumption by almost 50%.
The additional fuel consumption of a vehicle due to different topographical characteristics of the transport route was also analyzed and calculated by the author. When driving on a normal flat route, the vehicle only has a base consumption (+0% additional fuel consumption). On a medium-hard route (hilly), the additional fuel consumption is +30%; on a hard route (mountainous), it is up to +60%.
Taking into consideration the two abovementioned correction factors, the own cost calculated by the elaborated method and software shows a better agreement with the real cost of the completed transport tasks than the prime costs calculated by other general cost functions described in the literature. This better agreement, and thus the accuracy of the own cost calculated using my new software and calculation method, is successfully demonstrated through comparative analyses (see Section 3.5).
3.3. Elaboration of an Accurate Method for Calculation of Total Prime Cost for International Road Transport Trips
At first, the prime cost’s components have to be taken into account and precisely defined. The prime cost of a transport trip () is the sum of the following cost components:
where CPi is the prime cost of a transport trip (euro); is the cost of burned fuel; is the cost of waiting time; is the further extra costs; is the drivers’ labor cost; is the operational and maintenance costs of the transport vehicle; i is the identifier of the road transport trip; and j is the identifier of the road transport section.
Figure 1 shows a round trip, which is the most generally used organization form of international road freight transportation. In this case, the transport vehicle goes from the site of the transport company to a loading-in station where the useful goods to be transported are loaded onto the truck. From this first loading-in station, the vehicle goes to the first loading-out station where the goods are unloaded. Then, it proceeds to more loading-in and loading-out stations, and the vehicle finally arrives at the initial station, which is the site of the transport company.
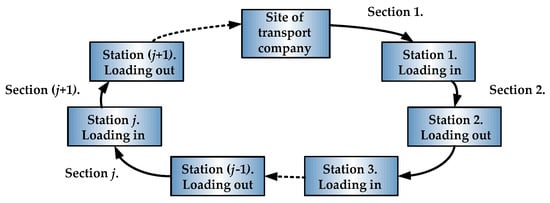
Figure 1.
Introduction of a road transport trip (source: own).
It is worth dividing the transport trips (i)—in order to make the calculations easier—into transport sections (j). A transport section is a transport route between a loading-in station and a loading-out station independent of whether the vehicle is running with or without useful weight. A new transport section begins when the transport weight is changing. The number of sections in a transport trip can be arbitrary N.
The cost components of the total prime cost are detailed in the following sub-sections.
3.3.1. Cost of Burned Fuel
The cost of the burned fuel on a given transport task can be calculated:
where CFij is in units of euro; is the specific fuel cost (euro/km); and Lij is the transport distance of a transport section (km).
The specific fuel cost can be calculated using the following equation:
where cFij is in units of euro/km; is the actual unit fuel price (euro/liter); is the specific fuel consumption in case of an empty vehicle (liter/km); is the correction factor relating to topographical characteristics of the transport route (0 in case of flat; 0.3 in case of hilly; 0.6 in case of mountainous transport routes); is the correction factor relating to the loading conditions of the vehicle (the transported weight influences the fuel consumption, every additional ton of goods results in additional fuel consumption) ; and is the weight of useful transported goods (ton).
Based on a previous deep data analysis of the most frequently used types of transport vehicles (semi-trailer trucks with 24 tons of capacity), the correction factor relating to topographical characteristics of the transport route could be defined. It can be concluded based on the analysis that by driving on a normal flat route, the vehicle only has a base consumption (+0% additional fuel consumption); on a medium-hard route (hilly), the additional fuel consumption is +30%; on a hard route (mountainous), it is up to +60%. The value of the correction factor relating to the loading conditions of the same analyzed vehicles could also be defined. The average value of is ~+4 dL/100 km of extra fuel consumption with every additional ton of cargo.
The limitation of the elaborated prime cost calculation method is that the and the correction factor relating to the loading conditions were elaborated for the most frequently used types of transport vehicles (semi-trailer trucks with 24 tons of capacity). In order to apply the calculation method for lower-capacity vehicles (e.g., 12 or 7.5 tons), the aforementioned correction factors have to be defined in the future.
3.3.2. Cost of Waiting Time
Different waiting times occurring during the transport trip also have costs:
where CWTij is in units of euro; is the specific waiting cost of the transport vehicle (euro/hour); is the time taken for the loading in/out of goods (hour); is the waiting time taken for loading in/out (hour); is the time taken for daily breaks according to the European AETR agreement (hour); and is the time taken by truck traffic stops (hour).
3.3.3. Further Extra Costs
Further charges can be incurred during the transport task:
where is the motorway fee (euro); is the parking fee (euro); and is the costs of permissions, licenses, and documentation (euro).
3.3.4. Driver’s Labor Cost
The driver’s labor cost for the transport trip can be calculated:
where CWij is in units of euro; is the specific labor cost of the truck driver (euro/hour); and is the total transit time of the transport route (hour).
3.3.5. Operational and Maintenance Costs of the Transport Vehicle
Operational and maintenance costs (taxes, insurance of the vehicle and cargo, maintenance, etc.) of a transport task can be calculated for every individual vehicle:
where COij is in units of euro; is the specific operational cost of the vehicle (euro/hour); is the individual correction factor for the different vehicles; and is the total transit time of the transport route (hour).
3.4. Introduction of Newly Developed Software for Prime Cost Calculation of Road Freight Transport Activities
A software application was also developed to pre-calculate the prime cost of a given transport task based on the newly elaborated detailed cost calculation method. In the software development, student Szabolcs Schmidt contributed.
Through the application of the developed software, the transport manager of a transport company can accurately and quickly determine the competitive fees for freight transport tasks, based on the exact pre-calculation of the prime cost and the expected profit. With the application of the software, cost offers that are too low or too high can be eliminated; thus, the company’s risk and loss can be minimized and its profit can be guaranteed.
The software has the following menus:
- (1)
- In the menu “Database”, the most important basic data can be defined relating to the following:
- Vehicles available for transportation (e.g., fuel consumption, operational and maintenance costs of the individual vehicles);
- Actual fuel prices at different available fuel stations;
- Motorway fees in different European countries, etc.
- (2)
- In the menu “Calculation”, the most important information relating to the ordered transport task to be calculated has to be defined.
At first, the adequate/available vehicle has to be selected for the transport task. The basic parameters of the selected vehicle (engine characteristics, specific fuel consumption, loading capacity, etc., which are saved in the database) will be considered during the prime cost calculation.
The next step is the definition of the main input parameters of the transport trip in Figure 2, which are needed for the prime cost calculation. The transport trip includes road sections that also have to be identified, and the identifier for transport trips (i) and transport sections (j) has to be defined according to the logic of Figure 1. The individual parameters relating to every road section and round trip, the distances (Lij in Equation (2)) and the topographical conditions ( in Equation (3)) of the different road sections, and the weight of the cargo to be transported ( in Equation (3)) have to be defined according to Equations (2) and (3).
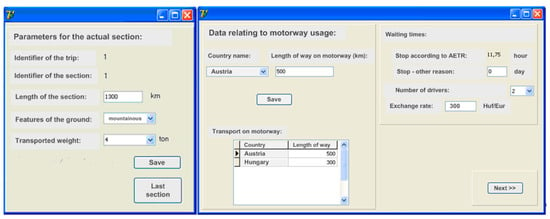
Figure 2.
Screens including the parameter settings of a transport task (source: own).
In the case of international transportation, the countries and the length of the used motorways have to be given for all transport road sections (Figure 2). These data are needed for the calculation of the motorway fees ( in Equation (5)) of the transport task.
The waiting times for loading in and loading out ( in Equation (4)), the times taken for truck traffic stops ( in Equation (4)), etc., also have to be defined; furthermore, the daily break according to the AETR agreement ( in Equation (4)) is automatically determined by the software from the calculated total lead time of the transport task ( in Equation (7)). These waiting times are needed for the calculation of the waiting times’ cost component of the prime cost (Equation (4)). In the case of international transportation, two drivers are sometimes needed, which can also be given as an input parameter for the labor cost (CWij in Equation (6)) calculation. The prime cost and its cost components can be calculated in Euro and HUF (Hungarian Forint) currencies; therefore, the exchange rate of the HUF/EUR can also be defined.
After the setting of the basic input data required for the prime cost calculations, the software provides the results for the total prime cost (calculated by Equation (1)), as well as the different cost components (calculated by Equations (2)–(7)) for a given transport order (Figure 3).
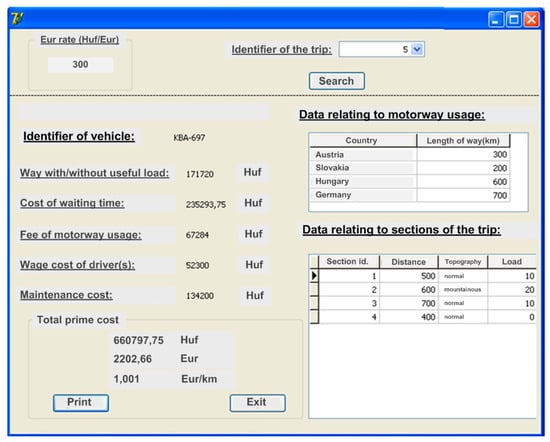
Figure 3.
Results of the prime cost calculation (source: own).
After the software completed the pre-calculation for the prime cost relating to a received transport task, the transport manager can give a precise transport fee offer to the potential customer’s demand. Due to the detailed pre-calculation, the offered transport fee would not be lower than the exactly pre-calculated prime cost or would not be much higher than the other competing transport companies’ bid. In conclusion, the potential risks and losses of our transport company can be eliminated.
- (3)
- In the menu “Archive data” of the software, the user can check or search for any historic pre-calculations. This possibility is very useful because the transport manager can compare the earlier prepared transport plans/pre-calculations and the real transport fees resulting after the realization of the transport tasks.
3.5. Comparative Analysis for Validation of the Efficiency and Precision of the Elaborated Prime Cost Calculation Method and Software
The newly developed software that was introduced was successfully implemented at a transport company; therefore, the author has experience relating to the advantages and precision of the elaborated cost calculation method and software. Based on the practical experience, a comparative analysis was completed to validate the correctness and reliability of the developed prime cost calculation method and software. The transport company provided its historical data for this examination.
Twenty transport tasks were randomly selected from the archived transport orders (Task 1, … Task 15) for the analysis.
In the case of these 15 transport trips, the following costs were compared (Table 1):

Table 1.
Comparative analysis of real, calculated, and estimated prime costs (source: own).
- (1)
- Total real costs summarized after the completion of the selected transport trips;
- (2)
- Prime costs of the selected transport trips pre-calculated using the new method and software;
- (3)
- Prime costs pre-estimated by the transport manager based on the formerly applied cost calculation method (based on rough results of statistical analysis of historic transport trips).
The aforementioned comparative analysis shows that the difference between real costs and pre-calculated prime costs is approximately ±3.5%. This difference is not significant, especially in the case of long-distance international road freight transport.
The comparison also shows that the difference between estimated costs and real transport costs is approximately ±11%. In cases of cost, these significant differences can result in significant financial losses for the transport companies (Figure 4).
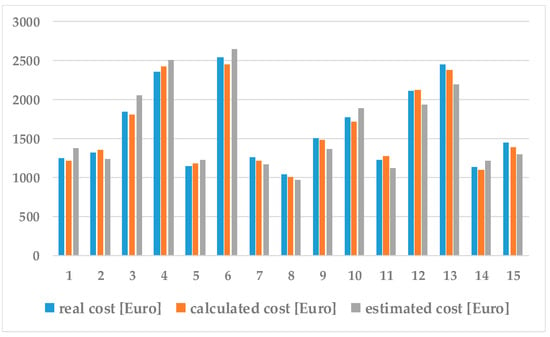
Figure 4.
Comparative analysis of real, calculated, and estimated prime costs (source: own).
Concluding the tendencies, it can be confirmed that the prime costs of the randomly selected transport trips—calculated using the newly developed cost function and software—are more precise than the pre-estimated prime costs based on the formerly applied cost calculation method.
This comparative analysis validates that the newly developed, more detailed prime cost calculation method and software are more precise and reliable compared to the estimated calculation method used in recent practice.
The developed prime cost calculation software was successfully implemented at a forwarding company.
4. Materials and Methods—Development of Method and Software for Fuel Cost Optimization of Road Freight Transport Trips
4.1. Reasons and Purpose of this Research
Current practice in transport companies is that the selection of refueling stations and the determination of the quantities of fuel to be refueled during round trips are not centrally managed by the company and controlled by software or a precise calculation method, only depending on the ad hoc decision of the truck driver. It can result in losses if drivers refuel at an expensive refueling station or buy an inadequate amount of fuel.
- Refueling a lower amount of fuel than is needed for the whole transport trip results in further unnecessary refueling action. However, refueling a higher amount of fuel than is necessary, especially at the end of a round trip, also leads to additional costs, because most transport companies have fuel tanks at the company’s own site, which provide the cheapest alternative.
- Due to the aforementioned wrong drivers’ decisions, the total fuel costs of the transport trips are not optimal but include significant additional costs. For example, in Europe, the difference in unit fuel prices at different fuel stations can be 0.1–0.4 Euro/L.
- It can be a dilemma—due to the different unit fuel prices at different stations—whether the cheaper unit price is at the well farther away from the original location of the vehicle to be refueled or at the more expensive one, but that closer to the vehicle is more cost-effective.
The aforementioned facts inspired me to develop a new optimization method and software for the refueling procedure.
The purpose of this research was to minimize the total fuel cost of the transport trips taking into consideration the different unit fuel prices at the different stations. Therefore, an optimization method was elaborated that on the one hand helps to select the optimal petrol station and, on the other hand, defines the optimal amount of fuel to be refueled. Based on the elaborated optimization method, a new decision-supporting software was developed to confirm the possibility of significant fuel cost savings.
4.2. The Novelty of the Newly Elaborated Fuel Cost Optimization Method
- (1)
- The new scientific result of this research is that there is no available method in the literature—similar to the optimization method developed by the author—that minimizes fuel costs by selecting the optimal petrol station and determines the optimal amount of fuel to be refilled. Consequently, there is no available software to achieve this research aim.
- (2)
- The basic idea of my research, that the fuel cost required to complete freight transport tasks depends on the weight of the transported load and also on the topography of the transport route, has not been previously investigated in the literature. Thus, in my opinion, the fuel consumption of the vehicle is not a constant value, but dynamically changing, depending on the two abovementioned factors. Therefore, the basic cost function (Equation (8)) used for the fuel optimization method introduced in this section is the same as defined in detail in Section 3.3.
- (3)
- The fuel cost savings achieved by using the optimization method and the developed software have been successfully validated through a comparative analysis. The fuel costs optimized using the newly elaborated method are compared to the fuel costs resulting from the current practice of refueling without the use of software, based on the ad hoc driver’s individual decisions.
4.3. Elaboration of the Optimization Method for Fuel Cost Reduction
The trucks of most transport companies can refuel at their contracted fuel distributor partners’ network at a discounted price. When transport companies choose fuel distributors, they prefer those that have a Europe-wide network of petrol stations (Shell, OMV, etc.). Both the location via GPS coordinates and the actual fuel prices are available for each petrol station. Fuel prices are different at the petrol stations. For example, the difference between the specific fuel prices at the different petrol stations can be up to 0.13 Euro/L in Hungary. This difference can result in, e.g., 65 Euros of extra cost for a 500 L capacity tank of a truck.
The aforementioned fact inspired my research idea, that the total fuel cost of a transport trip can be minimized by the (1) optimal selection of the refueling petrol station and the (2) determination of the optimal amount of the fuel to be refueled.
In the next part of this section, the elaborated optimization method for selecting the optimal refueling station and the calculation method for determining the optimal amount of fuel to be refilled is presented step by step.
To find the cost reduction possibilities, the total prime cost of a transport trip () has to be defined (same as in Equation (1)):
Because the main purpose is to minimize the fuel cost, the fuel cost component (CFij) of the transport trip has to be examined and reduced (see Equations (2) and (3)).
4.3.1. Selection of the Optimal Fuel Station—First Phase of the Optimization
At first, the optimal (most cost-effective) petrol station (Tiopt in Figure 5) has to be selected among those stations that are preferred by the transport company (Til) for a given transport task on the transport route from the loading-in station Sij to loading-out station Sij+1. During the cost optimization, the systematic search method is used. After that, the amount of refilled fuel (QTij) can be determined (Figure 5). The optimal station is that where refueling—from the point of departure to the given destination—provides the lowest total fuel cost.
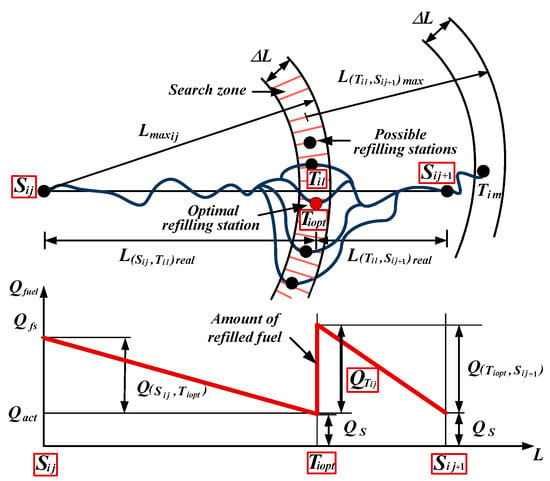
Figure 5.
Description of the important stations of a transport route, and changes in fuel level of the vehicle during the transport route (source: own).
The initial fuel level of the track is known at the loading-in station (Qfs). The fuel consumption of the vehicle can be calculated based on Equation (3) between the loading-in station and loading-out station (Figure 5).
During the calculation, a safe amount of fuel margin capacity (QS) has to be taken into consideration, which is available for the fuel consumption of the truck in the case of stochastic events (missed ways, accidents, etc.) on the transport route between loading-in station Sij and fuel station Til. This safe amount of fuel also has to be considered between the fuel station Til and loading-out station Sij+1 to arrive safely at the next fuel station Tim (Figure 5).
The maximal transport distance () of the vehicle can be calculated using the following formula taking into consideration the initial fuel level of the vehicle, the safe amount of the fuel, and the fuel consumption of the vehicle (Figure 5):
The optimal refueling station has to be selected from possible Til refilling petrol stations located in the search zone, which is defined by the radius ( − ∆L) (Figure 4). ∆L can define that zone in which the optimal petrol station has to be found providing safe arrival to the petrol station.
After that, the optimal petrol station that results in the most cost-effective transport route has to be defined (Figure 6).
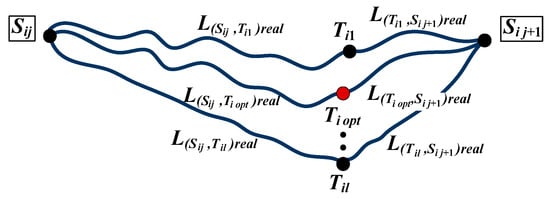
Figure 6.
Alternative transport routes across the possible refilling stations (source: own).
The optimal petrol station (Ti opt) among the possible transport routes that provide the minimal total fuel cost can be defined by Equation (10) according to Figure 6:
where Cmin is the minimal total fuel cost (euro); is the specific fuel cost for the transport route Sij − Til calculated by the fuel price at the refueling station used before Sij loading-in station (euro/km); is the specific fuel cost for the transport route Til − Sij+1 calculated by the fuel price at Til petrol station (euro/km); is the distance between stations Sij and Til (km); and is the distance between stations Til and Sij+1 (km).
4.3.2. Determination of the Optimal Amount of Fuel to Be Refilled—Second Phase of the Optimization
In the second phase of the optimization, the optimal amount of fuel to be refueled (QTij) has to be determined, the amount of which is required for the remaining transport distance to the destination. This amount is determined based on the actual fuel level of the vehicle at the optimal refueling point (Qact) and the safe fuel requirements (QS) for the remaining transport distance to be covered. The optimal amount of fuel to be refueled is the amount that can be safely provided to arrive at the destination, taking into account the possible additional fuel consumption due to unforeseen obstacles.
The optimal amount of fuel to be refilled (QTij) can be calculated according to Figure 5:
where QTij is the optimal amount of fuel to be refilled (liter); QS is the safe volume of fuel; and Qact is the fuel level of the vehicle in the optimal petrol station Tiopt.
4.4. Introduction of Newly Developed Software for Optimal Fuel Supply of Road Freight Transport Activities
Based on the aforementioned theoretical optimization method, a new decision-supporting software was developed for minimizing the fuel cost by the contribution of student Norbert Cziczer. The software provides the information necessary for the most economic performance of each individual road freight transport task. This generated information can be forwarded to the drivers via telecommunication devices on an on-board terminal.
The new software has two menu points, which are detailed in the following sub-sections.
4.4.1. Menu “Definition of New Data”
This menu point provides the possibility of the creation of (1) new fuel stations (Figure 7), (2) new loading-in/out stations (Figure 8); and (3) new transport trucks (Figure 9) for the user.
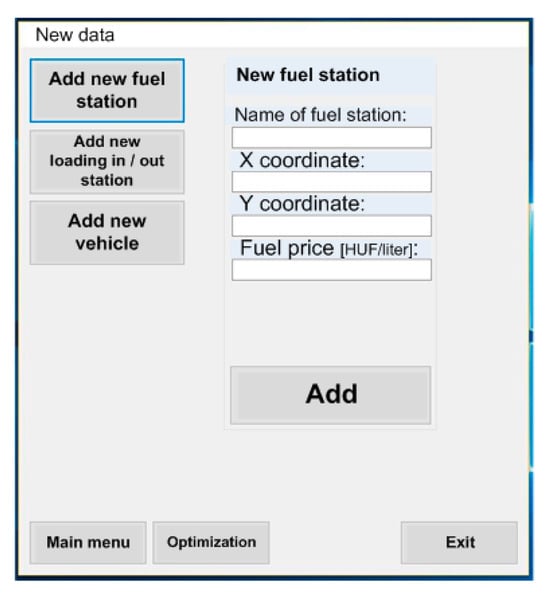
Figure 7.
Creation of new fuel stations.
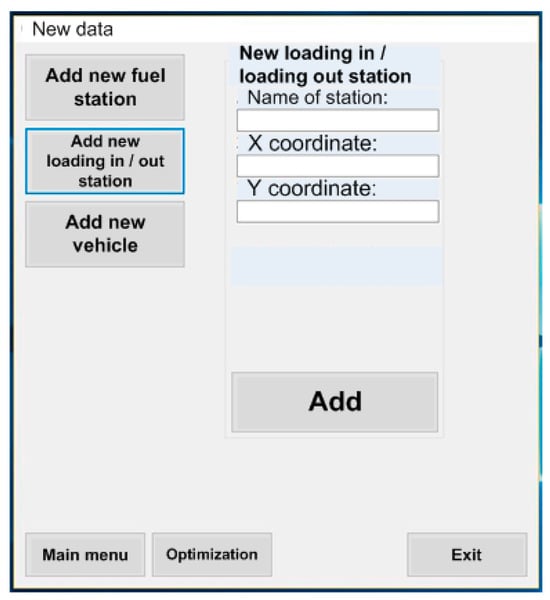
Figure 8.
Creation of new loading-in/out stations.
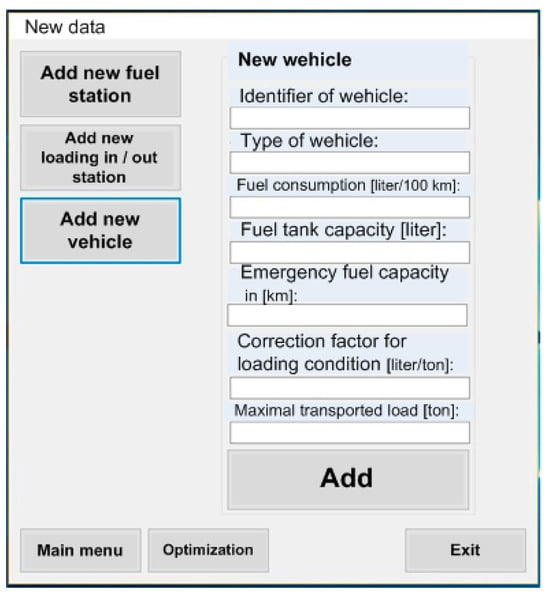
Figure 9.
Creation of new transport trucks (source: own).
4.4.2. Menu “Optimization”—Introduction in a Case Study
In this menu, the user has to select the vehicle for a given transport task; furthermore, the main data of the given transport task have to be defined. These data are as follows: loading-in and loading-out stations of the transport loop, weights transported on the different transport sections, the initial level and price of the fuel in the selected vehicle, etc.
The optimization of the fuel supply is achieved based on the elaborated optimization theory introduced in Section 4.3.
Introduction of the fields of the main screen and input data for the case study:
In field 10.a of Figure 10, the user can select the vehicle for a given transport task from the database.
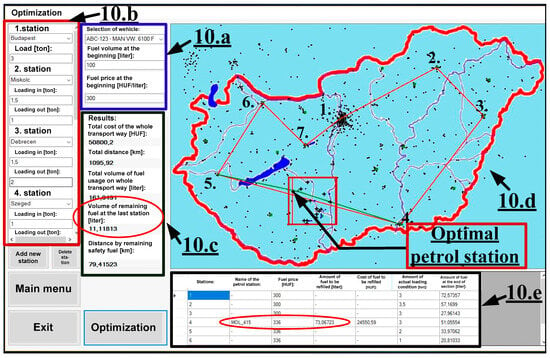
Figure 10.
Screen of menu “Optimization”—introduction of a case study with the optimal solution (source: own).
The initial fuel level of the truck and the fuel price of this initial fuel have to be defined. In the case study, a light truck with a maximal load capacity of 3.5 tons was selected for the given transport task defined in Figure 11. The fuel consumption of the selected vehicle is 14 L/100 km; the maximal capacity of the fuel tank of the vehicle is 150 L. The initial fuel level is 100 L at the beginning of the transport trip. The specific fuel price of this initial fuel volume is 300 HUF/L.
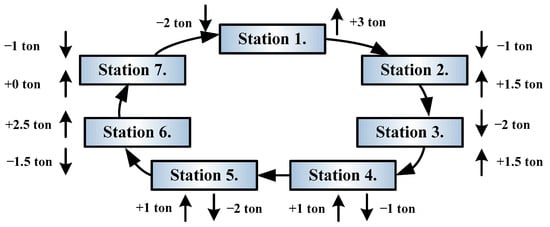
Figure 11.
Case study—loading-in/out stations with the transported weights (source: own).
In field 10.b of Figure 10, the parameters of the transport trip have to be defined, i.e., loading-in/out stations, as well as the weights of the cargo transported on each road section.
The transport trip can be seen in Figure 11. The stations of the transport trip and the transported cargo weights at the different sections are as follows (see Figure 11). Station 1: +3 ton; Station 2: +1.5 ton −1 ton; Station 3: +1.5 ton −2 ton; Station 4: +1 ton −1 ton; Station 5: +1 ton −2 ton; Station 6: +2.5 ton −1.5 ton; Station 7: +0 ton −1 ton; and Station 8: −2 ton.
In field 10.c of Figure 10, the optimization results can be seen, i.e., the total fuel consumption and fuel cost of the trip, as well as the amount of remaining fuel at the end of the transport trip.
Based on the elaborated optimization method introduced in Section 4.3., the optimization is completed. In the case study—in the case of refueling at the optimal fuel station—the total fuel cost of the transport trip is 50,800 HUF, while the total amount of burned fuel is 161.9 L; furthermore, the remaining fuel volume at the end of the transport trip (site of the company) is 11 L (enough for 79.4 km).
Field 10.d of Figure 10 visualizes the transport trip on a map of Hungary; furthermore, it shows the searching zone (colored by a red tetragon) and the location of the optimal refueling petrol station.
On the map, the stations of the transport trip can be seen, as well as the search zone in which the optimal petrol station has to be searched. The optimal petrol station is also depicted on the map.
In the field 10.e of Figure 10, the details of the optimal petrol station (name, location) and the amount and cost of the petrol to be refilled are listed.
After the calculation by the software, the optimal petrol station was identified (“MOL_415” station with 336 HUF/liter minimal fuel price), and the optimal amount of fuel to be refilled was 73 L.
Based on the results of the developed software, the drivers can be supported by useful fueling information to make the best decisions in order to minimize the total fuel costs of the total transport trips.
The limitation of the elaborated fuel supply optimization software is that it can be used for the fuel cost optimization of only national transport trips, because the map of Hungary is built into the software. The optimization method can also be applied for international transport trips through the implementation of the map of Europe.
4.5. Comparative Analysis for Validation of the Efficiency of the Elaborated Optimal Fuel Supply Method and Developed Software
The purpose of the comparative analysis is to demonstrate the fuel cost savings that can be achieved through the application of the developed optimization method and software. The optimal solution was compared to the recently applied practice, which is based on the driver’s individual ad hoc refueling decision. During the transport trip, for purely practical reasons, the drivers frequently chose the petrol station with expensive fuel or refueled a higher or smaller amount of fuel than necessary. These wrong drivers’ decisions result in extra fuel costs for transport companies.
Figure 12 illustrates a non-optimal refueling of a driver (simulating a wrong ad hoc driver decision), in the same case study introduced in Figure 10. In this scenario, the driver selected the most expensive (376 HUF/L) refueling station (“OMV_36” station) in the searching zone (Figure 12d); furthermore, they also refilled the vehicle with 139.8 L to the maximal capacity level of the fuel tank. In this case, the remaining amount of fuel at the last station (site of the company) was 76.9 L (Figure 12c,d).
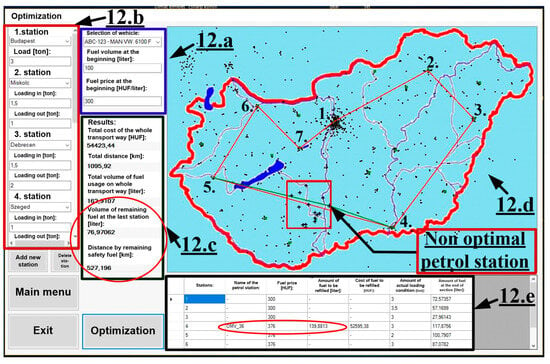
Figure 12.
Non-optimal refueling—wrong ad hoc driver’s decision (source: own).
The results of the optimal refueling scenario (Figure 10) received through the application of the optimization method and the non-optimal (driver’s individual decision in Figure 12) refueling scenario are compared in Table 2.

Table 2.
Comparison of optimal and non-optimal refueling scenarios (source: own).
Based on the data of Figure 10 and Figure 12, it can be concluded that the developed method and software can achieve a fuel cost saving of 15.8% on the 1096 km long round trip by using the optimal fuel station and the optimal amount of fuel required to complete the transport trip. The comparative analysis introduced above has also demonstrated that the new decision-supporting software developed based on the elaborated optimization method is suitable for optimizing the total fuel costs of road freight transport tasks by accurately defining both the optimal refueling stations and the optimal volume of fuel to be refueled. The software can generate the information needed for the economic performance of road freight tasks and can be used to significantly reduce transport costs.
The developed optimization software was successfully installed and tested at a forwarding company.
5. Conclusions
Nowadays, the most important aim is the establishment of a cost-effective and sustainable road freight transportation sector because it is the most environmentally damaging and most expensive element of the supply chains’ activities. The efficiency improvement and optimization of the transport activities can result in significant cost savings, which lead to increased competitiveness of the forwarding companies.
This research is very innovative and up to date because two new methods were developed for the optimization of road freight transportation activities. Based on the newly developed methods, two decision-supporting software were developed to establish more profitable and sustainable transportation. The developed methods are as follows:
- (1)
- A new calculation method and software were developed for the precise prime cost pre-calculation of transport tasks. The accurate pre-calculation—before the achievement of the transport task—of the prime cost of a given transport task is essential for the transport companies in order to determine an adequate transport fee. The transport fee for a given transport task can be determined considering the pre-calculated prime cost; thus, the company’s profit can be ensured and the losses can be eliminated in order to provide competitiveness to the forwarding company.
- (2)
- A new optimization method and software application were also developed for the refueling procedure of international transport trips. The purpose was to minimize the total fuel cost of the transport trips taking into consideration the different unit fuel prices at the different stations. Therefore, the elaborated optimization method on the one hand helps to select the optimal fuel station and, on the other hand, defines the optimal volume of fuel to be refueled.
The added value of the introduced calculation methods and software applications is that both the prime cost calculation and the fuel supply procedure are not supported by the software. This is why the two developed methods and two software applications are innovative and unique. The newly developed software applications were successfully implemented at forwarding companies. The correctness of both elaborated mathematical methods was validated by the developed software in real case studies.
The limitation of the elaborated prime cost calculation method is that the correction factor relating to topographical characteristics of the transport route and the correction factor relating to the loading conditions were elaborated for the most frequently used types of transport vehicles (semi-trailer trucks with 24 tons of capacity). In order to apply the calculation method for lower-capacity vehicles (e.g., 12 or 7.5 tons), the aforementioned correction factors have to be defined in the future.
The limitation of the elaborated fuel supply optimization software is that it can be used for the fuel cost optimization of only national transport trips, because the map of Hungary is built into the software. The optimization method can also be applied for international transport trips through the implementation of the map of Europe.
A future research direction in the case of the elaborated prime cost calculation method can be the determination of the and correction factors for other types of transport vehicles (12 and 7.5 tons) based on a deep analysis of historical data relating to these types of vehicles.
In the case of the elaborated fuel supply optimization software, one of the future research directions can be the implementation of the map of Europe in order to use the optimization method in the case of international transport trips.
Funding
This research received no external funding.
Institutional Review Board Statement
Not applicable.
Informed Consent Statement
Not applicable.
Data Availability Statement
No new data were created or analyzed in this study. Data sharing is not applicable to this article.
Conflicts of Interest
The author declares no conflict of interest.
References
- Kovács, G.; Kot, S. New logistics and production trends as the effect of global economy changes. Pol. J. Manag. Stud. 2016, 14, 115–126. [Google Scholar] [CrossRef]
- Gnap, J.; Poliak, M.; Semanova, S. The issue of a transport mode choice from the perspective of enterprise logistics. Open Eng. 2019, 9, 374–383. [Google Scholar] [CrossRef]
- Pfohl, H.C. Logistics Systems—Business Fundamentals; Springer: Berlin/Heidelberg, Germany, 2022. [Google Scholar]
- Bouchery, Y.; Ghaffari, A.; Jemai, Z.; Fransoo, J.C. Sustainable transportation and order quantity: Insights from multiobjective optimization. Flex. Serv. Manuf. 2016, 28, 367–396. [Google Scholar] [CrossRef]
- Miomir, M.J. Belgrade’s urban transport CO2 emissions from an international perspective. Pol. J. Environ. Stud. 2016, 25, 635–646. [Google Scholar]
- Jie-Fang, D.; Jie-Yz, H.; Rong-Wei, W.; Chung, D. Delinking indicators on transport output and carbon emissions in Xinjiang, China. Pol. J. Environ. Stud. 2017, 26, 1045–1056. [Google Scholar]
- Ševčenko-Kozlovska, G.; Čižiūnienė, K. The impact of economic sustainability in the transport sector on GDP of neighbouring countries: Following the example of the Baltic States. Sustainability 2022, 14, 3326. [Google Scholar] [CrossRef]
- Černý, J.; Černá, A.; Bohdan, L. Support of decision-making on economic and social sustainability of public transport. Transport 2014, 29, 59–68. [Google Scholar] [CrossRef][Green Version]
- Walker, H.; Seuring, S.; Sarkis, J.; Klassen, R. Sustainable operations management: Recent trends and future directions. Int. J. Oper. Prod. Manag. 2014, 34, 1–12. [Google Scholar] [CrossRef]
- Koberg, E.; Longoni, A. A systematic review of sustainable supply chain management in global supply chains. J. Clean. Prod. 2019, 207, 1084–1098. [Google Scholar] [CrossRef]
- Kacmáry, P.; Straka, M. Statistical development of transport which reflects the need for catalysts. Acta Technol. 2020, 6, 123–127. [Google Scholar] [CrossRef]
- Elkington, J. 25 years ago I coined here’s why it’s time to rethink it. Harvard Business Review, 25 June 2018; pp. 1–4. [Google Scholar]
- Taticchi, P.; Carbone, P.; Albino, V. (Eds.) Corporate Sustainability; Springer: Berlin/Heidelberg, Germany, 2013. [Google Scholar]
- Szaruga, E.; Załoga, E. Environmental management from the point of view of the energy intensity of road freight transport and shocks. Int. J. Environ. Res. Public Health 2022, 19, 14417. [Google Scholar] [CrossRef] [PubMed]
- Lambrechts, W.; Son-Turan, S.; Reis, L.; Semeijn, J. Lean, green and clean? Sustainability reporting in the logistics sector. Logistics 2019, 3, 3. [Google Scholar] [CrossRef]
- Machado, P.G.; Teixeira, A.C.R.; Collaço, F.M.A.; Mouette, D. Review of life cycle greenhouse gases, air pollutant emissions and costs of road medium and heavy-duty trucks. Wiley Interdiscip. Rev. Energy Environ. 2021, 10, e395. [Google Scholar] [CrossRef]
- Kovács, G. Trends and Efficiency Improvement of Production and Transport Processes; University Miskolc-University Press: Miskolc, Hungary, 2020. [Google Scholar]
- Potkány, M.; Krajcírová, L. Cost reporting of the transport company and its use in decision making. Proc. Eng. 2017, 192, 731–736. [Google Scholar] [CrossRef]
- Konstantakopoulos, G.D.; Gayialis, S.P.; Kechagias, E.P. Vehicle routing problem and related algorithms for logistics distribution: A literature review and classification. Oper. Res. 2022, 22, 2033–2062. [Google Scholar] [CrossRef]
- Ross, D.F. Distribution Planning and Control, Managing in the Era of Supply Chain Management; Springer: New York, NY, USA, 2015. [Google Scholar]
- Sinha, K.C.; Labi, S. Transportation Decision Making; John Wiley & Sons Inc.: Hoboken, NJ, USA, 2007. [Google Scholar]
- Woxenius, J. Directness as a key performance indicator for freight transport chains. Res. Transp. Econ. 2012, 36, 63–72. [Google Scholar] [CrossRef]
- Rushton, A.; Croucher, P.; Baker, P. The Handbook of Logistics & Distribution Management; Kogan Page Limited: London, UK, 2010. [Google Scholar]
- Chatzikontidou, A.; Longinidis, P.; Tsiakis, P.; Georgiadis, M.C. Flexible supply chain network design under uncertainty. Chem. Eng. Res. Des. 2017, 128, 290–305. [Google Scholar] [CrossRef]
- Gudheus, T.; Kotzab, H. Comprehensive Logistics; Springer: Hamburg, Germany, 2009. [Google Scholar]
- Franceschini, F.; Galetto, M.; Maisano, D. Designing Performance Measurement Systems, Theory and Practice of Key Performance Indicators; Springer: Cham, Switzerland, 2019. [Google Scholar]
- Elgazzar, S.; Tipi, N.; Jones, G. Key characteristics for designing a supply chain performance measurement system. Int. J. Prod. Perform. Manag. 2018, 68, 296–318. [Google Scholar] [CrossRef]
- Sierpiński, G.; Macioszek, E. (Eds.) Decision Support Methods in Modern Transportation Systems and Networks; Springer: Cham, Switzerland, 2021. [Google Scholar]
- Blanquart, C.; Burmeister, A. Evaluating the performance of freight transport: A service approach. Eur. Transp. Res. Rev. 2009, 1, 135–145. [Google Scholar] [CrossRef]
- Farchi, F.; Farchi, C.; Touzi, B.; Mabrouki, C. A comparative study on AI-based algorithms for cost prediction in pharmaceutical transport logistics. Acadlore Trans. Mach. Learn. 2023, 2, 129–141. [Google Scholar] [CrossRef]
- Abid, M.; Saqlain, M. Decision-making for the bakery product transportation using linear programming. Spectr. Eng. Manag. Sci. 2023, 1, 1–12. [Google Scholar] [CrossRef]
- Carlan, V.; Sys, C.; Vanelslander, T. Innovation in road freight transport: Quantifying the environmental performance of operational cost-reducing practices. Sustainability 2019, 11, 2212. [Google Scholar] [CrossRef]
- Jurčević, M.; Bubalo, T.; Mandžuka, B. Influence of costs on the optimization of transport routes (case study)—Passenger transportation company from Zagreb. Ekon. Vjesn. 2018, 31, 65–73. [Google Scholar]
- Wheat, P.; Stead, A.D.; Huang, Y.; Smith, A. Lowering transport costs and prices by competition: Regulatory and institutional reforms in low income countries. Sustainability 2019, 11, 5940. [Google Scholar] [CrossRef]
- Prajová, V.; Kostal, P. Optimisation of the measurement and evaluation process through an information system. IOP Conf. Ser. Mater. Sci. Eng. 2022, 1256, 012035. [Google Scholar]
- Milewski, D.; Milewska, B. Efficiency of the consumption of energy in the road transport of goods in the context of the energy crisis. Energies 2023, 16, 1257. [Google Scholar] [CrossRef]
- Liedtke, G.T. Estimation of the benefits for shippers from a multimodal transport network. Log. Res. 2012, 4, 113–125. [Google Scholar] [CrossRef]
- Limbourg, S. External costs as competitiveness factors for freight transport—A state of the art. Transp. Rev. 2016, 36, 692–712. [Google Scholar]
- Fan, X.; Yao, G.; Yang, Y. Multi-compartment vehicle routing problem considering traffic congestion under the mixed carbon policy. Appl. Sci. 2023, 13, 10304. [Google Scholar] [CrossRef]
- Paricio-Garcia, A.; Lopez-Carmona, M.A. Application of traffic weighted multi-maps based on disjoint routing areas for static traffic assignment. Appl. Sci. 2023, 13, 10071. [Google Scholar] [CrossRef]
- Minken, H.; Johansen, B.G. A logistics cost function with explicit transport cost. Econ. Transp. 2019, 19, 100116. [Google Scholar] [CrossRef]
- Tsekeris, T. Freight transport cost and urban sprawl across EU regions. Sustainability 2022, 14, 5217. [Google Scholar] [CrossRef]
- Simchi-Levi, D.; Xin, C.; Bramel, J. The Logic of Logistics: Theory, Algorithms, and Applications for Logistics Management; Springer: New York, NY, USA, 2014. [Google Scholar]
- Anbuudayasankar, S.P.; Ganesh, K.; Mohapatra, S. Models for Practical Routing Problems in Logistics. Design and Practices; Springer: New York, NY, USA, 2014. [Google Scholar]
- Ehmke, J.F. Integration of Information and Optimization Models for Routing in City Logistics; Springer: New York, NY, USA, 2012. [Google Scholar]
- Koca, C.; Laporte, G. Vehicle routing with backhauls: Review and research perspectives. Comp. Oper. Res. 2018, 91, 79–91. [Google Scholar] [CrossRef]
- Gubán, M.; Gubán, Á.; Udvaros, J.; Sándor, Á. Mathematical model and a solution method of the establishment of logistics centres. Int. J. Adv. Nat. Sci. Eng. Res. 2023, 7, 241–245. [Google Scholar]
- Ibarra-Rojas, O.J.; Hernandez, L.; Ozuna, L. The accessibility vehicle routing problem. J. Clean. Prod. 2018, 172, 514–1528. [Google Scholar] [CrossRef]
- Dinu, S.; Bodea, G. A new genetic approach for transport network design and optimization. Bull. Pol. Acad. Sci. Tech. Sci. 2011, 59, 263–272. [Google Scholar] [CrossRef]
- Tsao, Y.C.; Zhang, Q.; Chen, T.H. Multi-item distribution network design problems under volume discount on transportation cost. Int. J. Prod. Res. 2015, 54, 426–443. [Google Scholar] [CrossRef]
- Rostamzadeh, R.; Sabaghi, M.; Sofian, S.; Ismail, Z. Hybrid GA for material routing optimization in supply chain. Appl. Soft Comp. 2015, 26, 107–122. [Google Scholar] [CrossRef]
- Caramia, M.; Dell’Olmo, P. Multi-Objective Management in Freight Logistics, Increasing Capacity, Service Level and Safety with Optimization Algorithms; Springer: London, UK, 2008. [Google Scholar]
- Danchuk, V.; Bakulich, O.; Svatko, V. An improvement in ant algorithm method for optimizing a transport route with regard to traffic flow. Proc. Eng. 2017, 187, 425–434. [Google Scholar] [CrossRef]
- Ahi, P.; Searcy, C. A comparative literature analysis of definitions for green and sustainable supply chain management. J. Clean. Prod. 2013, 52, 329–341. [Google Scholar] [CrossRef]
- Ghadimi, P.; Wang, C.; Lim, M.K. Sustainable supply chain modeling and analysis: Past debate, present problems and future challenges. Res. Conserv. Recycl. 2019, 140, 72–84. [Google Scholar] [CrossRef]
- Grant-Muller, S.; Usher, M. Intelligent transport systems: The propensity for environmental and economic benefits. Technol. Forecast. Soc. Chan. 2014, 82, 149–166. [Google Scholar] [CrossRef]
- Kadłubek, M.; Thalassinos, E.; Noja, G.G.; Cristea, M. Logistics customer service and sustainability-focused freight transport practices of enterprises: Joint influence of organizational competencies and competitiveness. J. Green Econ. Low-Carbon Dev. 2022, 1, 2–15. [Google Scholar] [CrossRef]
Disclaimer/Publisher’s Note: The statements, opinions and data contained in all publications are solely those of the individual author(s) and contributor(s) and not of MDPI and/or the editor(s). MDPI and/or the editor(s) disclaim responsibility for any injury to people or property resulting from any ideas, methods, instructions or products referred to in the content. |
© 2023 by the author. Licensee MDPI, Basel, Switzerland. This article is an open access article distributed under the terms and conditions of the Creative Commons Attribution (CC BY) license (https://creativecommons.org/licenses/by/4.0/).