Abstract
The road surfacing material is continuously exposed to both traffic and climate stresses, including extreme temperatures and heavy rainfalls. Subsequently, most road defects start from the surface and potentially develop into road structural damage. Appropriate road maintenance schemes are necessary to ensure the surface remains functionable. On the other hand, these maintenance schemes would be uneconomical without the use of durable and climate-resilient materials for road surfacing. This is vital in low-income countries (LICs), where the burdens of road maintenance are economically unbearable. In this regard, long-life epoxy-modified asphalt offers an opportunity to achieve durable and climate-resilient pavement surfacing. However, epoxy is an expensive material that may be subject to fraud, leading to poor quality of the surfacing mixture and the resulting road infrastructure. In order to prevent fraud and ensure the quality of epoxy bitumen mixtures for road surfacing, Fourier transform infrared spectroscopy (FTIR) was used to characterise mixes of epoxy-modified bitumen and trace the content of epoxy. The findings showed that the epoxy content used in the preparation of mixes agreed with the epoxy content traced using FTIR. The mean difference between the two quantities was approximately ±1.0% with a correlation coefficient R2 > 0.9. Therefore, FTIR can efficiently provide an antifraud method for modified epoxy asphalt mixes at the plant level to help achieve sustainable pavements.
1. Introduction
Sustainable infrastructure is potentially one of the major indicators of development. Roads are thought to be the most important infrastructure to a country, and it is undebatable that sustainable and long-life roads could be a beacon for strong economies and development. However, one of the reasons for not achieving sustainable roads could be the poor quality of the materials used for the construction of these roads. Poor quality of road surfacing materials could be associated with the nature of the materials or with fraud involving the materials, leading to the use of inadequate mixing ratios that are not in accordance with what is specified by road designers. In this paper, the authors introduce a novel method for combating fraud involving materials in the construction of long-life epoxy-modified road surfacing. This will help achieve quality and climate-resilient sustainable roads, particularly in low-income countries (LICs), where recurrent maintenance costs are economically unaffordable to governments.
Roads are thought to be not only the most important but also the most expensive infrastructure in LICs. At the same time, they significantly impact the development of these countries. The high cost of road projects in many countries is linked to importing road surfacing materials, in particular bitumen—the main component of asphaltic road surfacing. Olutaiwo and Adanikin [1] argued that even if roads in LICs were to be designed appropriately, substandard construction of these roads could result from poor-quality assurance and control measures existing in these countries. Bitumen is an important and potentially the most expensive material in traditional road construction, and it is repeatedly exposed to traffic loadings and environmental stresses. Several types of additives are increasingly used to improve the performance of bitumen in extreme environmental conditions, which may severely affect the bonding nature of the asphalt components [2]. However, mixing of different components complicates the characterisation of the bituminous binder, which is necessary to ensure correct proportions are used and the resulting mixture is fit for purpose, leading to sustainable road surfacing.
Characterisation of bitumen is an important step for quality control during road construction activities, and failure to do it properly will only lead to increased capital and lifecycle costs of road projects while reducing their lifespan [3]. Achampong et al. [4] found that the premature failure of pavements was due to inadequate quality control and assurance programs, improper and low levels in ground investigations, and both poor drainage and construction methods. Potentially, many of the causes of premature pavement failures are more common in LICs than they are in developed countries. Amongst the several efforts made to reduce premature failure of pavements is the use of additives that could improve the quality of the surfacing material to make it more durable and resilient. One of the additives currently being investigated to identify its capabilities in improving the resilience of bituminous surfacing is epoxy [5,6,7,8].
The utilisation of epoxy bituminous material for road surfacing can help to achieve climate-resilient and sustainable roads that require less maintenance in regions known for heat waves, severe snow events, extreme precipitation, and high sea level rises. The failure to account for the impacts of climate on road designs, maintenance schemes, and operational planning can lead to faster and premature road deterioration with the associated heavy costs on road agencies and users, making it a pitfall for sustainable development [3]. Recent laboratory studies to appropriately characterise epoxy-modified bituminous binders [7] have shown that epoxy is a thermoset material that enhances fatigue performance and improves mechanical characteristics of modified bituminous materials. However, there is a need to experimentally evaluate the chemistry changes that occur during the production of the epoxy-modified binder and identify the effects of these chemical reactions on the performance of epoxy-modified surfacing [7]. Amongst various techniques that could be used to evaluate the influence of chemical reactions in a modified epoxy bitumen, Fourier transform infrared spectroscopy (FTIR) could be the most appropriate method due to the availability of the equipment globally and the simplicity and efficacy of the method. In addition to the technical advantages, the FTIR method is also cost effective.
However, although FTIR is globally considered applicable, Marsac et al. [9] reported that results of FTIR spectra can significantly differ across laboratories. The main cause for this could be the method adopted for the calculation of the FTIR oxidation index. In order to solve this and yield both comparable and repeatable FTIR results across different laboratories, there is a need for harmonised procedures of data acquisition. Such procedures will improve the accuracy of results and strengthen the role of the FTIR method to achieve long-life epoxy pavements that are able to resist climate change. Nevertheless, the production of epoxy-modified bitumen binders is associated with changes in the material properties. The mixing and production temperatures can break chemical bonds and change the rheology of the material, and care must be taken to avoid overcuring of the mixture during production [10]. Table 1 shows some characterisation parameters with the methods and evidence reported in the literature for epoxy bituminous materials.

Table 1.
Parameters for characterisation of modified epoxy bituminous binder (MEB).
This study was undertaken in the context of advancing the quality of road surfacing technologies in developing countries under the Climate-Resilient Sustainable Road Pavement Surfacing (CRISPS) project led by the University of Birmingham [18]. These technologies are modified epoxy chip seal (MECS) and modified epoxy asphalt surfacing (MEAS). FTIR was selected as it can help to quantify epoxy into modified epoxy bitumen mixes and stop the fraud that can happen when expensive epoxy is unjustifiably reduced in the mixes. Reduction of the epoxy content reduces the strength and durability of the resultant epoxy-modified bitumen pavements. Therefore, precision and accuracy in the measurement of components during manufacturing of modified epoxy bitumen binders is vital as deviation from this can significantly reduce the performance of MECS and MEAS pavements. To this end, this paper advances the use of FTIR spectroscopy technology to reliably identify and quantify epoxy content in modified epoxy bituminous binders.
2. Materials and Methods
Modified epoxy bitumen samples were prepared and tested using FTIR to characterise and quantify the content of epoxy in the mixtures. Epoxy is a two-part product. Part A is the epoxy resin (modifier), which is clear, viscous, and made up of bisphenol-A epoxy resin. According to the supplier’s information, Part A had a viscosity of 600–1000 millipascal seconds (mPa-s) at 23 °C and a relative density of 1.15 at 20 °C. It improves physical–chemical degradation and strengthens the fatigue and adhesive properties of the binder [19,20,21], leading to an overall improvement of the durability and strength of the pavement. Part B is a hardener or curing agent and is a black material formed of amines or anhydride. It improves the thermosetting properties of the modified epoxy bitumen binder. It attains the flashing point at approximately 122 °C, has a relative density of 0.96, a vapour pressure of approximately 0.1 Pa, and a viscosity of approximately 6000 centistokes. FTIR spectroscopy sends an infrared signal through modified epoxy bitumen samples to generate the material’s spectra fingerprints due to the levels of absorption of the infrared waves [5,7]. The height and area of the band peaks of the spectra at the functional groups (carbonyl and sulfoxide) characteristic of the changes due to reactions between epoxy and bitumen can be used to calculate the mass percentages of epoxy components [6,7,22].
For sample preparation, approximately 100 or 200 g of epoxy-modified bitumen were prepared by mixing bitumen grades 60/70 and 80/100 with various epoxy percentages by weight. The bitumen grade 60/70, also called moderate or paving bitumen grade, is widely used and adaptable to various applications of pavements. It performs well in temperatures ranging from −22 to +76 °C, making it a perfect choice globally, including in developing countries mostly located in Africa and Asia [23]. Similarly, the bitumen grade 80/100 can also be acceptable for low-volume pavements globally and high-volume pavements in less problematic environments. The portions of epoxy Part A (14.6%) and Part B (85.4%) were weighed into a 250 mL container at room temperature. The required amount of bitumen, heated to 125 °C, was added and the container placed in an oven at 125 °C for 10 min. The samples were then stirred by hand for 30 s and left to cool. In this way, a total of 30 samples and repetitions with epoxy content of 0.0%, 15.0%, 20.0%, 25.0%, 27.5%, 30.0%, and 35.0% were prepared as shown in Table 2.
Table 2.
Summary of sample preparation for epoxy-modified bitumen.
The prepared samples were tested using FTIR spectroscopy with attenuated total reflection (ATR). The equipment uses ultraviolet visible (UV–vis) infrared rays, and the built-in OMNIC™ software is used to collect and analyse the generated spectra. It is capable of measuring wavenumbers in the range of 500 to 4500 cm−1 at a resolution of 4 cm−1. A balance with a capacity of 1200 g and readability of 0.001 g and an oven and a hotplate both able to maintain a temperature of 125 ± 5 °C were used. The method consists of scanning through the specimens with infrared light, which then generates a spectrum of waves indicating how much infrared light has been absorbed or transmitted by different molecules of the tested material. However, the properties of the peak of the spectra could be affected by the film thickness of the specimens. This was controlled by ensuring that the specimens’ sizes were approximately 1–2 g. Because different molecules of the tested material absorb or transmit different amounts of infrared light and at different wavenumbers of light, the resulting spectrum plots at a wide range of wavenumbers. This allows changes in the spectrum patterns to be identified as reactions take place between bitumen and epoxy contents and therefore between bitumen and various ratios of epoxy. The spectroscopy (FTIR/ATR) was calibrated and the testing conditions set by considering (a) the number of scans (24), (b) the resolution (4 cm−1), (c) the final format for spectra (absorbance), and (d) background duration (120 min). The samples were prepared as listed in Table 2. Some typical samples are shown in Figure 1. The samples were tested using the experimental setup shown in Figure 2.
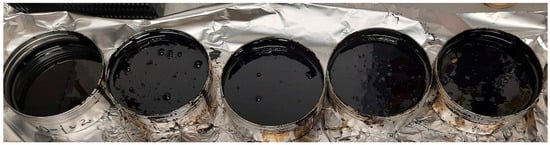
Figure 1.
Typical samples of epoxy-modified bitumen.
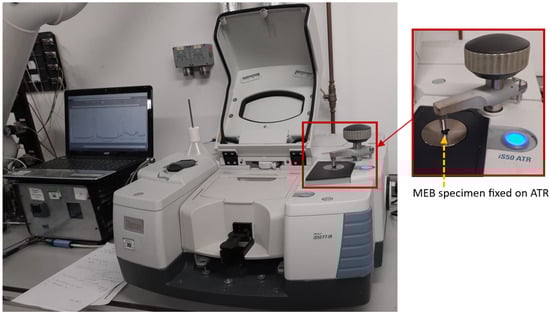
Figure 2.
Experimental setup (FTIR-ATR) and a zoom-in of the specimen fixed on the ATR.
During FTIR testing, atmospheric humidity can affect the process. The FTIR’s ability to absorb bands from atmospheric CO2 and H2O can affect the analysis. It is therefore important to be aware of the location of absorption bands for H2O and CO2 molecules, also referred to as mid-infrared (mid-IR)-absorbing molecules in the laboratory atmosphere, as these constitute a serious drawback of IR spectroscopy by being able to contribute to the spectra and hindering the accurate identification and quantification of targeted molecules. For epoxy bitumen mixes, the interference from mid-IR-absorbing molecules must be removed as the effect of H2O (between 1900 and 1600 cm−1 wavenumbers) can hinder accurate analysis of the carbonyl functional group. To do this, FTIR has an automated option to suppress the atmospheric contribution, which was enabled during the tests.
3. Results Analysis and Discussion
A semiquantitative approach was used for the analysis of the spectra. The technique serves as a reference for comparison between binders with different modification levels or different stages of chemical processes for the same material. It mainly exploits the peak ratio and area ratio evaluation of the spectrum bands, as presented in Figure 3 for a typical specimen containing 25% epoxy. The area ratio eliminates the interference between vibrations of a similar type. A band of a functional group is more reliable than a single peak because it includes the total contribution of the neighbouring groups [5,7]. Furthermore, guidance was taken from the New Zealand Transport Agency [6] based on the institution’s vast experience of working with epoxy-modified bitumen mix designs.
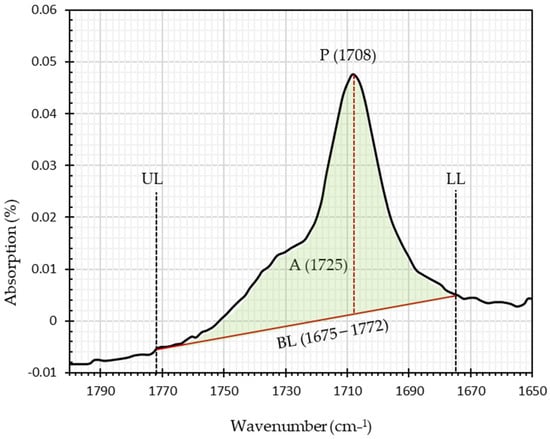
Figure 3.
Peak (P) and area (A) of the IR spectrum band of 1675–1772 wavenumbers. BL is the baseline, and UL and LL are the upper and lower limits of wavenumbers, respectively.
For the analysis, tests were conducted on three identical specimens, and an average of the three results was determined for what is called a triplicate spectrum. From the triplicate spectrum from each sample, the mean values were determined to at least three decimal places each for A1249, A1725, H1708, and H1738, which are defined as follows:
- A1249 = area of the absorbance peak at 1249 cm−1 using a BL from 1203 to 1275 cm−1. The wavelength of 1249 cm−1 relates to the peak of the sulfoxide functional group.
- A1725 = area of the doublet absorbance peak centred at 1725 cm−1 using a BL from 1675 to 1772 cm−1. The wavelength of 1708 cm−1 relates to the highest peak of the carbonyl functional group.
- H1708 = height of the absorbance peak at 1708 cm−1 using a BL drawn from 1810 cm−1.
- H1738 = height of the absorbance peak at 1738 cm−1 using a BL drawn from 1810 cm−1.
In order to determine the peak areas and heights of the spectra, the baselines (BL) were drawn using the built-in OMNIC software. The BL remained the same for the varying concentrations of epoxy in the mixes, meaning that changes in areas were essentially a result of the changes in heights due to reactions between materials.
Because curing affects the area of the measured absorbance peaks, a curing correction value α was calculated as follows:
The FTIR is embedded with functions that allow the determination of areas and heights of the peaks that have successfully been used in previous studies [5,7,24]. Therefore, areas and heights of peaks were determined for the two groups of interest: carbonyls (peak at 1708 cm−1) and sulfoxides (peak at 1249 cm−1). The carbonyl (C=O) absorption (1690–1760 cm−1) is a strong band indicating the presence of conjugated aldehyde, aliphatic ketone, and carboxylic or conjugated acids, whereas the sulfoxide (S=O) peak at 1249 cm−1 belongs to the amine group.
Concentration Calibration and Curing Correction Curves
The heights and areas of the spectra for the two functional groups—carbonyl and sulfoxide—that affect rheological changes of modified epoxy bitumen mixes during the short- and long-term ageing processes were analysed and the mass of epoxy components calculated. However, before analysing the mixes, the spectra for the control materials were undertaken using FTIR. These are shown in Figure 4 for bitumen 60/70 and 80/100 grades and in Figure 5 for epoxy’s Part A and Part B components. To highlight the effect of chemical reactions between epoxy and bitumen, especially at the functional group level, Figure 6 shows how these functional groups can be affected by the variation of the epoxy content with a comparison of spectra from mixtures containing 0% and 25% for mixes with bitumen grade 60/70. Also, Figure 7 shows the spectra for bitumen grade 80/100 and its modification by adding 25% epoxy.
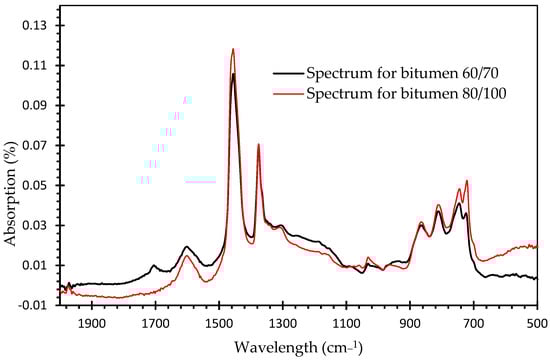
Figure 4.
FTIR spectra for control bitumen grades 60/70 and 80/100.
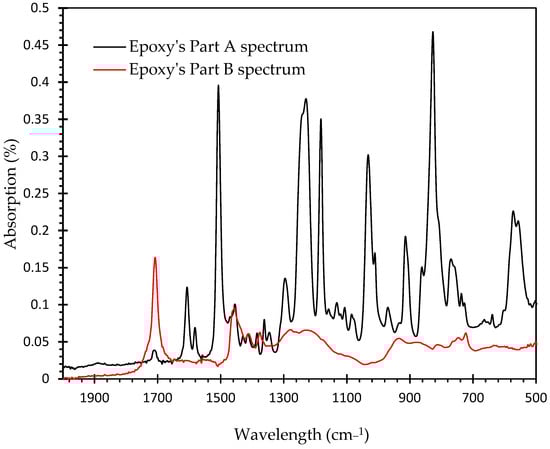
Figure 5.
FTIR spectra for epoxy’s Part A and Part B components.
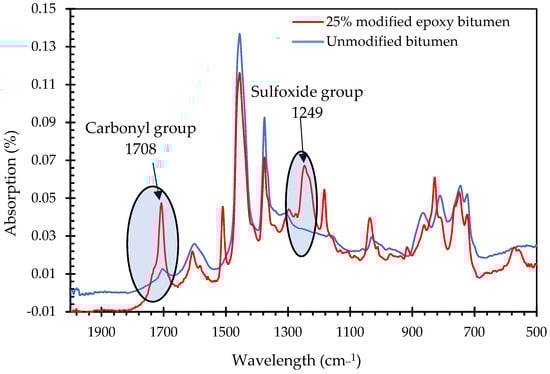
Figure 6.
FTIR spectra for bitumen grade 60/70 and its modification by 25% epoxy content.
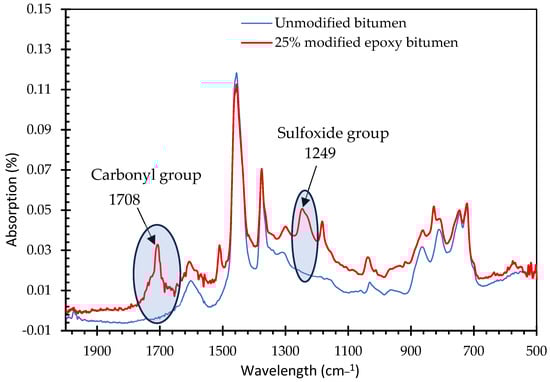
Figure 7.
FTIR spectra for bitumen grade 80/100 and its modification by 25% epoxy content.
By obtaining the areas A1249 and A1725 for different epoxy ratios within the modified epoxy bitumen mixtures, the percentages of Part A were plotted against A1249 and the percentages of Part B were plotted against A1725. The four calibration lines showed increases in the areas of the peaks as the epoxy content increased, as shown in Figure 8. Error bars of 5% were used because the variations of the results contributing to the triplicates were within this range.
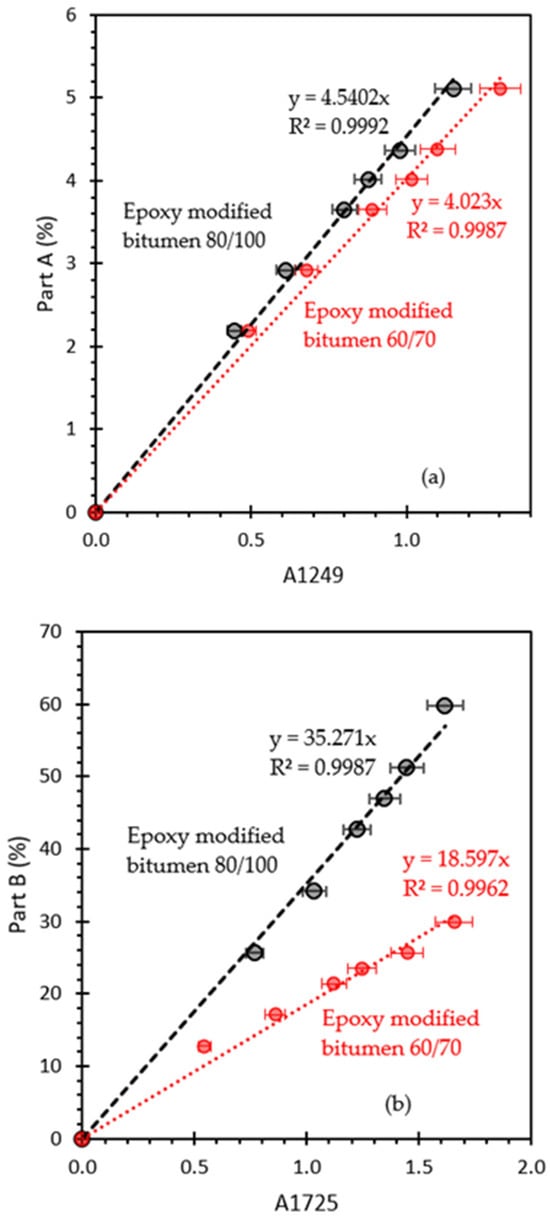
Figure 8.
Correlation between epoxy components and areas of the functional groups: (a) epoxy’s Part A content versus the area of the absorbance peak at 1249 cm−1 and (b) epoxy’s Part B versus the area of the doublet absorbance peak centred at 1725 cm−1.
Temperature changes during the curing time of epoxy-modified bitumen were found to have significant effects on the heights of the peaks of the epoxy-modified bitumen spectra, particularly for the carbonyl and sulfoxide functional groups [5]. The peak formed at a wavenumber of approximately 1708 cm−1 due to some elements of epoxy’s Part B not having fully reacted with the rest of the mixture, while another peak appeared at approximately 1738 cm−1 when both Part A and Part B of the epoxy had reacted completely. This suggests that the curing effect must be considered when determining the epoxy content based on the heights and areas of the peaks of the spectra.
To achieve curing corrections, a 200 g standard mixture of diluted epoxy-modified bitumen at 25% was prepared. Each component of the mixture was weighed to an accuracy of 0.01 g. The mixture was oven-heated at 125 °C for 10 min, after which it was well stirred with a spatula for one minute. The zero-time sample of approximately 2 g was then taken, and additional samples were taken at 5 min intervals, with the remaining mixture being kept at a temperature of approximately 125 °C on a vibrating hot plate and continually stirred without splashing or causing air entrainment. All these samples were left to cool to room temperature, which was usually achieved overnight, and a triplicate spectrum for each was recorded using FTIR. From each sample’s triplicate spectra, the mean values were determined to at least three decimal places each for A1249CURE, A1725CURE, H1708CURE, and H1738CURE where, which are defined as follows:
- A1249CURE = area of absorbance peak at 1249 cm−1 using a BL drawn from 1203 to 1275 cm−1.
- A1725CURE = area of the doublet absorbance peak centred at 1725 cm−1 using a BL from 1675 to 1772 cm−1.
- H1708CURE = height of absorbance peak at 1708 cm−1 using a horizontal BL drawn from 1810 cm−1 and stretched straight to the other lowest point of the peak at a smaller wavenumber.
- H1738CURE = height of the absorbance peak at 1738 cm−1 using a BL drawn from 1810 cm−1 and stretched straight to the other lowest point of the peak at a smaller wavenumber.
The A1249ZERO and A1725ZERO values are the values of A1249CURE and A1725CURE determined for the zero-time sample. For each sample, the curing correction value αCURE was calculated to three decimal places as follows:
In addition, for each sample, the curing correction factor A1249CURECF was calculated as follows:
Finally, the curing correction factor A1725CURECF was calculated as follows:
After these calculations, αCURE (x-axis) was plotted against A1249CURECF (y-axis) and a piece-wise linear regression performed to calculate the best fit lines to the data. The same was conducted for αCURE (x-axis) against A1725CURECF values. For each sample, the value α was then used to calculate the appropriate value of A1249CURECF and A1725CURECF from the respective regression equations. Finally, the corrected values A1249CORR and A1725CORR were calculated to two decimal places:
The final calculations included the following:
- The corrected percentage Part A—percentage Part ACORR—was calculated using the concentration calibration curve for Part A and the value of A1249CORR. Similarly, the corrected percentage Part B—percentage Part BCORR—was calculated using the concentration calibration for Part B and the value of A1725CORR.
- The percentage epoxy bitumen content was calculated as follows:
- The component ratio β was calculated as follows:
- The standard component ratio βSTD was calculated using the component proportions specified by the epoxy bitumen supplier (i.e., Part A (STD) = 14.6 weight % and percentage Part B (STD) = 85.4 weight %) for a 25% diluted epoxy bitumen blend. Therefore,
- The component ratio difference was as follows:
- Therefore, the epoxy content in the epoxy-modified bitumen mixes were obtained as presented in Table 3 and Table 4.
Table 3. FTIR results on samples prepared with bitumen grade 60/70.
Table 4. FTIR results on samples prepared with bitumen grade 80/100.
The curing correction curves for epoxy-modified bitumen 60/70 with 25% epoxy content are shown in Figure 9. The same curves for epoxy-modified bitumen 80/100 with 25% epoxy content can be seen in Figure 10.
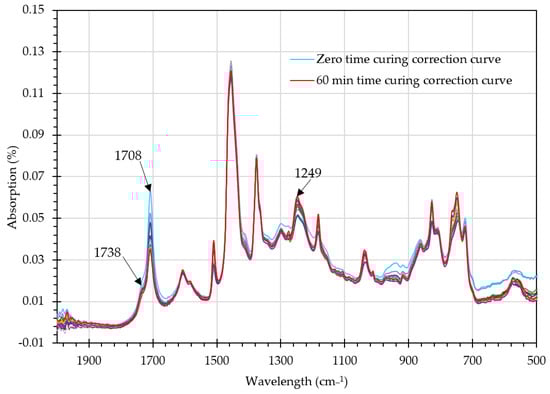
Figure 9.
Curing correction curves for 25% epoxy-modified bitumen grade 60/70.
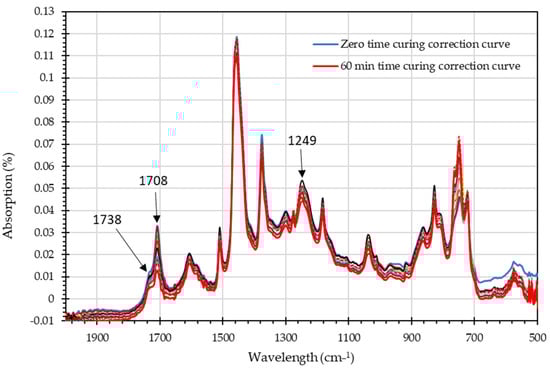
Figure 10.
Curing correction curves for 25% epoxy-modified bitumen grade 80/100.
After performing the corrections to take curing into account, it was observed that the areas of the spectra and the heights of the peaks changed with increasing curing period. According to Figure 11, the area of the spectra reduced gradually for the carbonyl functional group as the curing period increased, whereas it increased with curing time for the sulfoxide functional group. However, the height of the peaks was found to decrease for both functional groups as the time of curing increased from 0 to 60 min. Other results of the tests are summarised in Table 3 and Table 4 for the mixes containing 60/70 and 80/100 bitumen grades, respectively.
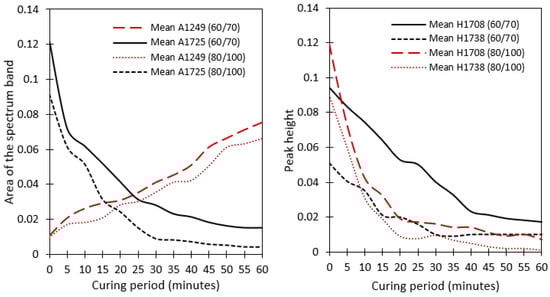
Figure 11.
Changes of the areas of spectra (left) and changes of the heights of peaks (right) during the curing period.
A comparison of the epoxy content in the sample mixes and that determined by FTIR analysis is shown in Figure 12 and Figure 13, with high linear regression significance highlighted by R2 > 0.99 for the mixes of epoxy content with both 60/70 and 80/100 bitumen penetration grades. These figures were drawn with error bars of 5%, which was based on the differences between results from individual specimens. It can be seen in Figure 12 and Figure 13 that lower concentrations of epoxy were not studied. This is because the study focused on developing a quality control methodology for new road surfacing. Based on previous studies in New Zealand, new surfacing needs to have an epoxy content of no less than 20%; otherwise, any benefits on the durability and sustainability of the road surfacing would be diminished. Thus, the FTIR analysis focused on the likely range to be experienced in practice.
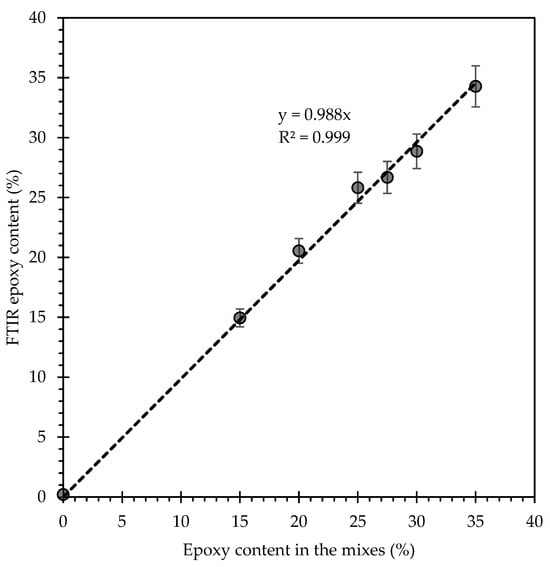
Figure 12.
Comparison of epoxy content in the sample mixes and by FTIR analysis for 80/100 grade bitumen.
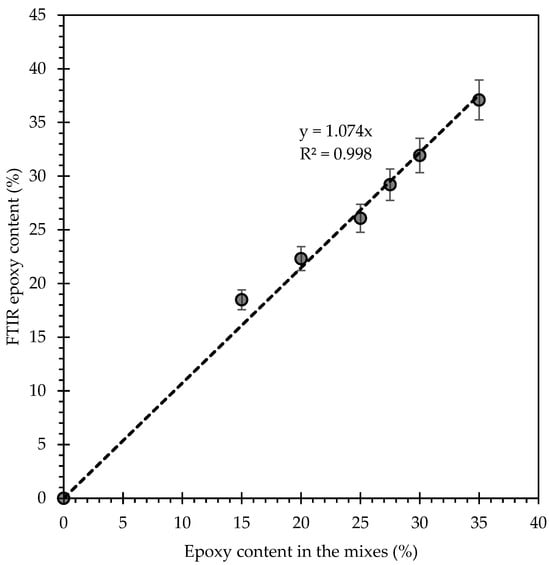
Figure 13.
Comparison of epoxy content in the sample mixes and by FTIR analysis for bitumen grade 60/70.
FTIR can be used to cross-check the content of epoxy in the bituminous binder, for example, during the construction and maintenance of modified epoxy asphalt concrete and modified epoxy chip seal pavements. It can help prevent fraud during the mixing of materials at the mixing plant level, a subject of concern in developing countries, where quality assessment and quality control systems present many loopholes that can accommodate fraud. These loopholes include lack of qualified personnel for quality control in the construction industry and suitable equipment and financial conditions that promote collaboration between plant engineers and road surfacing contractors to produce substandard mixtures and save materials in exchange for corruption. Such unprofessional activities can only lead to poor surfacing materials and subsequently poor road infrastructure that will incur premature failure and thus excessive life cycle costs.
The process of tracing epoxy content within modified epoxy bituminous mixtures can involve two main stages. The first is the determination of the concentration calibration curves from the analysis of spectral changes in both height and areas of peaks, as shown in Figure 6 and Figure 7. The components of epoxy (Part A and Part B) ratios in the mixtures positively correlated with the areas of the peaks at the functional groups (sulfoxide and carbonyl, respectively) with R2 > 0.99 for both groups, as shown in Figure 8. However, it was found that for the same content of epoxy’s Part A and Part B, the areas of the spectra peaks of the concerned functional groups were greater for the mixes containing bitumen grade 80/100 than for the mixes containing bitumen grade 60/70. The second stage is the determination of the curing correction curves, which were obtained from a mixture of the sample targeted for on-field construction of the pavement surfacing. The target mixture was 25% epoxy, and the extremes of the samples range were ±10% of the target mixture, i.e., from 15% to 35% epoxy content, as recommended by the New Zealand Transport Agency 377 (NZTA) [22]. From the curing corrections curves, the areas under the spectra reduced gradually for the carbonyl functional group (i.e., around the 1700 cm−1 wavelength) as the curing period increased but increased with the curing time for the sulfoxide functional group (i.e., around the 1250 cm−1 wavelength), as can be seen in Figure 9 and Figure 10. Also, there was a decrease in the height of the peaks for both functional groups as the time of curing increased from 0 to 60 min, as shown in Figure 11. These changes to the height and area allowed us to track the influence of the amount of epoxy content used in the mixtures and therefore confirm if the correct mixing ratios as specified in the designs were used.
In Table 3, FTIR test results for the mixes with bitumen grade 60/70 show a close relationship with the quantities of epoxy used during the preparation of the standard mixes. The mean deviation (FTIR—mixed quantities) was approximately −2.1%. The biggest deviation was −3.9% for the mixture containing 15% of epoxy, while the smallest deviation was approximately −1.08% for the mixture containing the target mixture (25% epoxy) for the on-field construction of modified epoxy pavement surfacing. Similarly, Table 4 shows the results of FTIR tests for the mixes with bitumen grade 80/100, which compare well with the quantities of epoxy used during the preparation of the standard mixes. Clearly, although FTIR results were slightly greater or smaller than the quantities used during the preparation of the mixes, there was strong agreement between the two results. The mean deviation (FTIR—mixed quantities) was approximately −0.23%. The biggest deviation was −1.14% for the mixture containing 30% of epoxy, while the smallest deviation was approximately −0.05% for the mixture containing 15% epoxy. The deviation from the target mixture (25% epoxy) was found to be +0.82%. The common observation from both mixes was that deviations of FTIR results from standard mixed samples gradually increased from the smallest sample towards the target sample, after which there was a significant reduction in the deviations. From this observation, it can be argued that the deviation of the target sample should form the peak of the curve of deviations of the FTIR results from standard mixes. While this trend could not be backed by any method of testing, it may be an indication that the tests were carried out in a systematic and consistent manner, thereby increasing confidence in the findings.
Additionally, the FTIR results agreed with the work by van den Kerkhof et al. [8], which included the characterisation of epoxy-modified binder from two different mixing plants. Considering the target mixture containing 25% epoxy content, the FTIR results showed the epoxy content for the mixes with bitumen grade 60/70 was approximately 26.08%. This was a deviation of approximately −1.62% and +4.88% from the mean results obtained by van den Kerkhof et al. [8] for samples from Plant A and Plant B, respectively. Similarly, the FTIR results from this study for the target mixture using bitumen grade 80/100 standard mixes was 21.35%, which is a deviation of −6.35% and +0.15% from the mean results obtained by van den Kerkhof et al. [8] for samples from Plant A and Plant B, respectively. Overall, the mean of all 10 samples reported by van de Kerkhof et al. [8] for the target mixture of 25% epoxy content from two mixing plants was 24.2%, while the mean result for this study was 25.95%, showing a difference of just 1.75%. Although the effect of sampling from different mixing plants and the small size of the samples tested in this study could affect comparisons, the results align well between the two studies.
Generally, it was found that the epoxy content determined with FTIR agreed with the epoxy quantities used during the preparation of the standard mixes. The graphical representation of the FTIR results and standard mixes for the epoxy contents showed a linear regression coefficient of determination of R2 = 0.999 and R2 = 0.998 for the mixes containing 80/100 and 60/70 bitumen grades, respectively. This is shown in Figure 12 and Figure 13. The close relationships between the quantities of epoxy determined using FTIR and the actual true quantities suggest that FTIR is an appropriate technology to combat fraud at the mixing plant level in developing countries. However, on-field practical realities could suggest that ensuring appropriate qualities during the production of epoxy-modified bitumen binder may be difficult and hence require extra attention. This can be specific to the type of technology of road surfacing to be constructed. For example, difficulties could be associated with necessary modifications to be made to conventional plants usually used for spraying the binder during the construction of bituminous pavements. The modifications necessary to the conventional asphalt batching plant to accommodate modified epoxy asphalt concrete could certainly be different to the modifications needed for the spray nozzles while building modified epoxy cheap seals [25,26]. When nozzles are utilised to spray the binder, considerations such as the spray rate must be accounted for to ensure that the sprayed binder is the same as the binder characterised using FTIR spectroscopy.
4. Conclusions
FTIR is a simple, efficient, and cost-effective equipment to quantify epoxy within modified epoxy asphalt binders and can hence help reduce the fraud that could take place and hamper the achievement of durable modified epoxy bitumen pavement surfaces. The cost-effectiveness, availability, and simplicity in operating FTIR spectroscopy means that the method could be advantageous for developing countries. These countries are desperately in need of strong quality control measures to prevent fraud during the construction of bituminous road surfaces, without which these roads will be poorly constructed with recurrent excessively unbearable maintenance costs. The following conclusions can therefore be drawn:
- Epoxy content is crucial within the mixes of modified epoxy bituminous surfaces, such as modified epoxy asphalt surface (MEAS) and modified epoxy chip seal (MECS). Failure to use appropriate ratios of epoxy due to fraudulent actions will lead to premature failures of roads and therefore excessive lifecycle costs. Fraud could be a result of temptations to make excessive profits by reducing the quantity of epoxy, which is probably the most expensive of the bituminous binder components.
- FTIR can accurately determine the epoxy content within bituminous binders and therefore prevent possible fraud at the mixing plant level. When an on-field construction target mixture of a bituminous binder with 25% epoxy is used, the equations in Figure 12 and Figure 13 can be used for bitumen grades 80/100 and 60/70, respectively. The 25% modified epoxy binder is recommended by the New Zealand Transport Agency (NZTA) to optimise strength, durability, and economic benefits of modified epoxy surfacing.
- This study has shown that if the sample preparation, sampling, and testing processes are appropriately performed, FTIR results are expected to fall within ±1% of the actual quantities of epoxy used during the mixing of modified epoxy bituminous binder materials.
Author Contributions
Conceptualization: E.N. and M.E.T.; methodology: E.N., M.E.T. and N.M.; software: E.N.; validation: E.N., N.M. and M.E.T.; formal analysis: E.N.; investigation: E.N.; resources: M.E.T., M.B. and G.S.G.; data curation: E.N.; writing—original draft preparation: E.N.; writing—review and editing: E.N., N.M., Y.D. and M.E.T.; visualization: E.N. and N.M.; supervision: N.M. and M.B.; project administration: N.M., M.B., G.S.G. and Y.D.; funding acquisition: M.B. All authors have read and agreed to the published version of the manuscript.
Funding
This research was funded by High Volume Transport, grant number HVT037. The APC was funded by The University of Birmingham.
Institutional Review Board Statement
Not applicable.
Informed Consent Statement
Not applicable.
Data Availability Statement
The data presented in this study may be available on request from the corresponding author.
Acknowledgments
The authors would like to thank the Foreign, Commonwealth, and Development Office (FCDO) through High-Volume Transport for funding the research as part of the Climate Resilient Sustainable Road Pavement Surfacings (CRISPS) project under Project Number HVT037. Also, the authors would like to thank the anonymous reviewers for both their time and constructive critiques.
Conflicts of Interest
The authors declare no conflict of interest.
References
- Olutaiwo, A.; Adanikin, A. Evaluating the Quality Assurance and Control of Hot-Mix Asphalt from Selected Plants in South West, Nigeria. Niger. J. Technol. Dev. 2020, 17, 217–222. [Google Scholar] [CrossRef]
- Weigel, S.; Stephan, D. The prediction of bitumen properties based on FTIR and multivariate analysis methods. Fuel 2017, 208, 655–661. [Google Scholar] [CrossRef]
- Velasquez, E.D.R. A Quality Control Performance-Based Methodology for Pavement Management Systems. In Masters in Civil Engineering; The University of Texas at El Paso: El Paso, TX, USA, 2018. [Google Scholar]
- Achampong, F.; Boadu, F.; Agbeko, P.K.; Anum, R.A. Post construction failure analysis of road pavements in Ghana. Civ. Environ. Res. 2013, 3, 74–78. [Google Scholar]
- van de Bergh, W. The Effect of Ageing on the Fatigue and Healing Properties of Bituminous Mortars. Ph.D. Thesis, Delft University of Technology, Delft, the Netherlands, 2011. [Google Scholar]
- New Zealand Transport Agency. NZTA-T21—Test Methods for Epoxy Modified Open Graded Porous Asphalt; NZTA: Wellington, New Zealand, 2017. [Google Scholar]
- Pipintakos, G. Experimental Characterization of Chemical and Physical Performance of Epoxy Modified Bitumen. Master’s Thesis, Technical University of Delft, Delft, the Netherlands, 2018. [Google Scholar]
- van den Kerkhof, L.C.; Alabaster, D.; Herrington, P.R. Determination of epoxy resin concentration in epoxy modified bitumens. Proc. RILEM Int. Symp. Bitum. Mater. 2020, 7, 537–543. [Google Scholar]
- Marsac, P.; Pierard, N.; Porot, L.; Van den bergh, W.; Grenfell, J.; Mouillet, V.; Pouget, S.; Besamusca, J.; Farcas, F.; Gabet, T.; et al. Potential and limits of FTIR methods for reclaimed asphalt characterisation. Mater. Struct. 2014, 47, 1273–1286. [Google Scholar] [CrossRef]
- Apostolidis, P.; Liu, X.; Erkens, S.; Scapas, A. Characterization of epoxy-asphalt binders by differential scanning calorimetry. Constr. Build. Mater. 2020, 249, 118800. [Google Scholar] [CrossRef]
- Li, R.; Leng, Z.; Partl, M.N.; Raab, C. Characterization and modelling of creep and recovery behaviour of waterborne epoxy resin modified bitumen emulsion. Mater. Struct. 2021, 54, 8. [Google Scholar] [CrossRef]
- Li, R.; Leng, Z.; Zhang, Y.; Ma, X. Preparation and characterization of waterborne epoxy modified bitumen emulsion as a potential high-performance cold binder. J. Clean. Prod. 2019, 235, 1265–1275. [Google Scholar] [CrossRef]
- Apostolidis, P.; Liu, X.; Kasbergen, C.; van de Ven, M.F.C.; Pipintakos, G.; Scarpas, A. Chemo-Rheological Study of Hardening of Epoxy Modified Bituminous Binders with the Finite Element Method. Transp. Res. Rec. 2018, 2672, 190–199. [Google Scholar] [CrossRef]
- Xiao, Y.; van de Ven MF, C.; Molenaar, A.A.A.; Su, Z.; Zandvoort, F. Characteristics of two-component epoxy modified bitumen. Mater. Struct. 2011, 44, 611–622. [Google Scholar] [CrossRef]
- Cuadri, A.A.; Delgado-Sánchez, C.; Navarro, F.J.; Partal, P. Short- and Long-Term Epoxy Modification of Bitumen: Modification Kinetics, Rheological Properties, and Microstructure. Polymers 2020, 12, 508. [Google Scholar] [CrossRef] [PubMed]
- Omairey, E.L.; Zhang, Y.; Gu, F.; Ma, T.; Hu, P.; Luo, R. Rheological and Fatigue Characterisation of Bitumen Modified by Anti-ageing Compounds. Constr. Build. Mater. 2020, 265, 120307. [Google Scholar] [CrossRef]
- Luo, Z.; Liu, T.; Wu, Y.; Yuan, H.; Qian, G.; Meng, X.; Cai, J. Study on Epoxy Resin-Modified Asphalt Binders with Improved Low-Temperature Performance. Adv. Civ. Eng. 2021, 2021, 5513338. [Google Scholar] [CrossRef]
- University of Birmingham. Climate Resilient Sustainable Road Pavement Surfacings (CRISPS). Available online: https://more.bham.ac.uk/hvt-crisps/about-the-project/ (accessed on 5 August 2023).
- Holleran, G.; Holleran, I.; Bearsley, S.; Dubois, C.J.; Wilson, D. Epoxy Asphalt for Durability of Open Graded Mixes: Part 1 Performance Approaches. In Proceedings of the 17th AAPA International Flexible Pavements Conference: Roads of the Future, Embracing Disruption, Melbourne, Australia, 13–16 August 2017. [Google Scholar]
- Herrington, P. Epoxy modified porous asphalt. In NZTA Research Report 410; NZTA: Wellington, New Zealand, 2010. [Google Scholar]
- Herrington, P.; Alabaster, D. Epoxy modified open-graded porous asphalt. Road Mater. Pavement Des. 2008, 9, 481–498. [Google Scholar] [CrossRef]
- NZTA-P/11E. Specification for Epoxy Modified Open Graded Porous Asphalt—Draft; NZTA: Wellington, New Zealand, 2016. [Google Scholar]
- Highways Today. Penetration Grade Bitumen: An Ideal Bitumen for Road Construction. Available online: https://highways.today/2021/01/26/penetration-grade-bitumen/ (accessed on 15 May 2023).
- Nikolic, G.; Zlatkovic, S.; Cakic, M.; Cakic, S.; Lacnjevac, C.; Rajic, Z. Fast Fourier Transform IR Characterization of Epoxy GY Systems Crosslinked with Aliphatic and Cycloaliphatic Polyamine Adducts. Sensors 2010, 10, 684–696. [Google Scholar] [CrossRef] [PubMed]
- Burrow, M.; Ghataora, G.; Ngezahayo, E.; Muniandy, R.; Metje, N.; Desalegn, Y.; Tsegaye, H. Climate Sustainable Road Pavement Surfacings—Trials Constructability Report; High Volume Transport (HVT): London, UK, 2023. [Google Scholar]
- Burrow, M.; Ngezahayo, E.; Ghataora, G.; Metje, N.; Eskandari-Torbaghan, M.; Muniandy, R.; Henning, T.; Weldon, C.; Avis, W.; Zamataro, S.; et al. Climate Sustainable Road Pavement Surfacings—Final Report; High Volume Transport (HVT): London, UK, 2023. [Google Scholar]
Disclaimer/Publisher’s Note: The statements, opinions and data contained in all publications are solely those of the individual author(s) and contributor(s) and not of MDPI and/or the editor(s). MDPI and/or the editor(s) disclaim responsibility for any injury to people or property resulting from any ideas, methods, instructions or products referred to in the content. |
© 2023 by the authors. Licensee MDPI, Basel, Switzerland. This article is an open access article distributed under the terms and conditions of the Creative Commons Attribution (CC BY) license (https://creativecommons.org/licenses/by/4.0/).