
Economic Viability Assessment of Neighbourhood versus Residential Batteries: Insights from an Australian Case Study


Abstract
:1. Introduction
1.1. Motivation
1.2. Literature Review: Knowledge Gaps
1.3. Overall Aim and Objectives
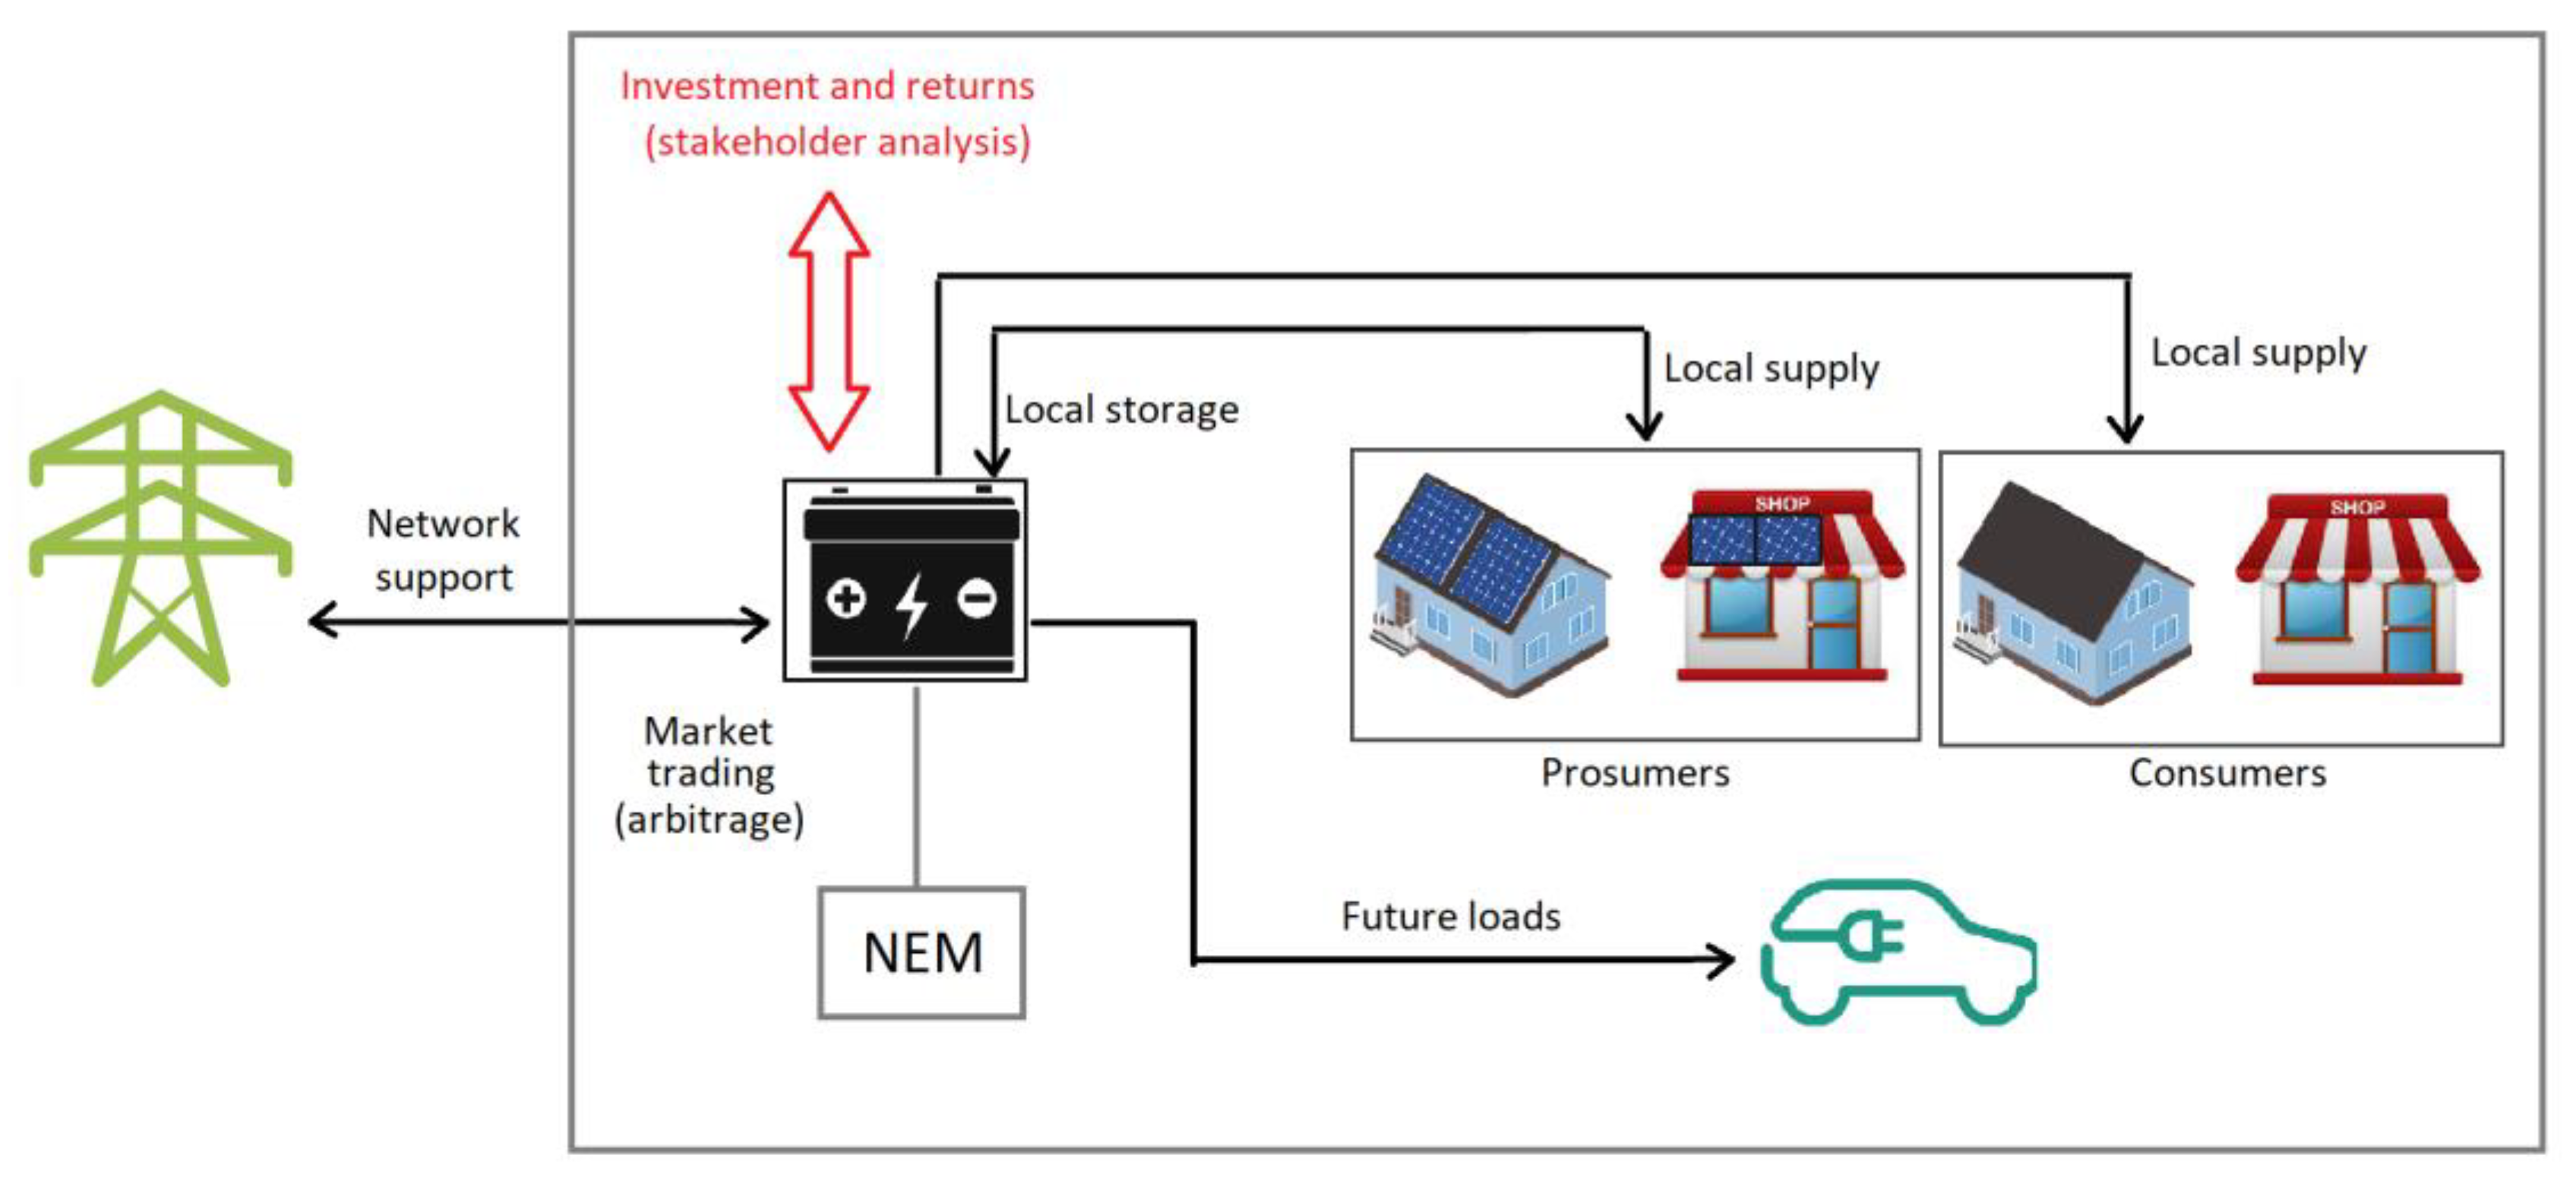
- Analysing potential value streams from a neighbourhood battery, with a comparison of the associated value streams in FTM and BTM configurations.
- Evaluating the economic impact of various network tariffs on a community battery, including the contribution of trial network tariffs to the economic viability of batteries.
- Comparing the ROI of a community battery to an equivalent capacity of BTM batteries considering different capital grant levels.
- Providing stakeholder-specific guidance in community battery integration, offering tailored insights and recommendations to different stakeholders.
1.4. Paper Organisation
2. Materials and Methods
2.1. The Scenarios
- Installation of an FTM battery on the residential feeder: A singular FTM battery energy storage system is positioned at an optimal location along the residential feeder. It is designed to provide energy storage and distribution services to those households served by the feeder.
- Deployment of a fleet of BTM batteries across solar PV-equipped residences: Multiple individual household BTM battery energy storage systems equivalent to the total energy capacity of the FTM battery. All the households are also equipped with solar PV systems.
2.2. Data Inputs and Processing
2.3. Trial Tariffs for FTM Battery Assessment
2.4. Values Sources for the FTM and BTM Batteries
2.4.1. Enhancing Self-Consumption
2.4.2. Utility Grid Arbitrage
2.4.3. Frequency Control Ancillary Services
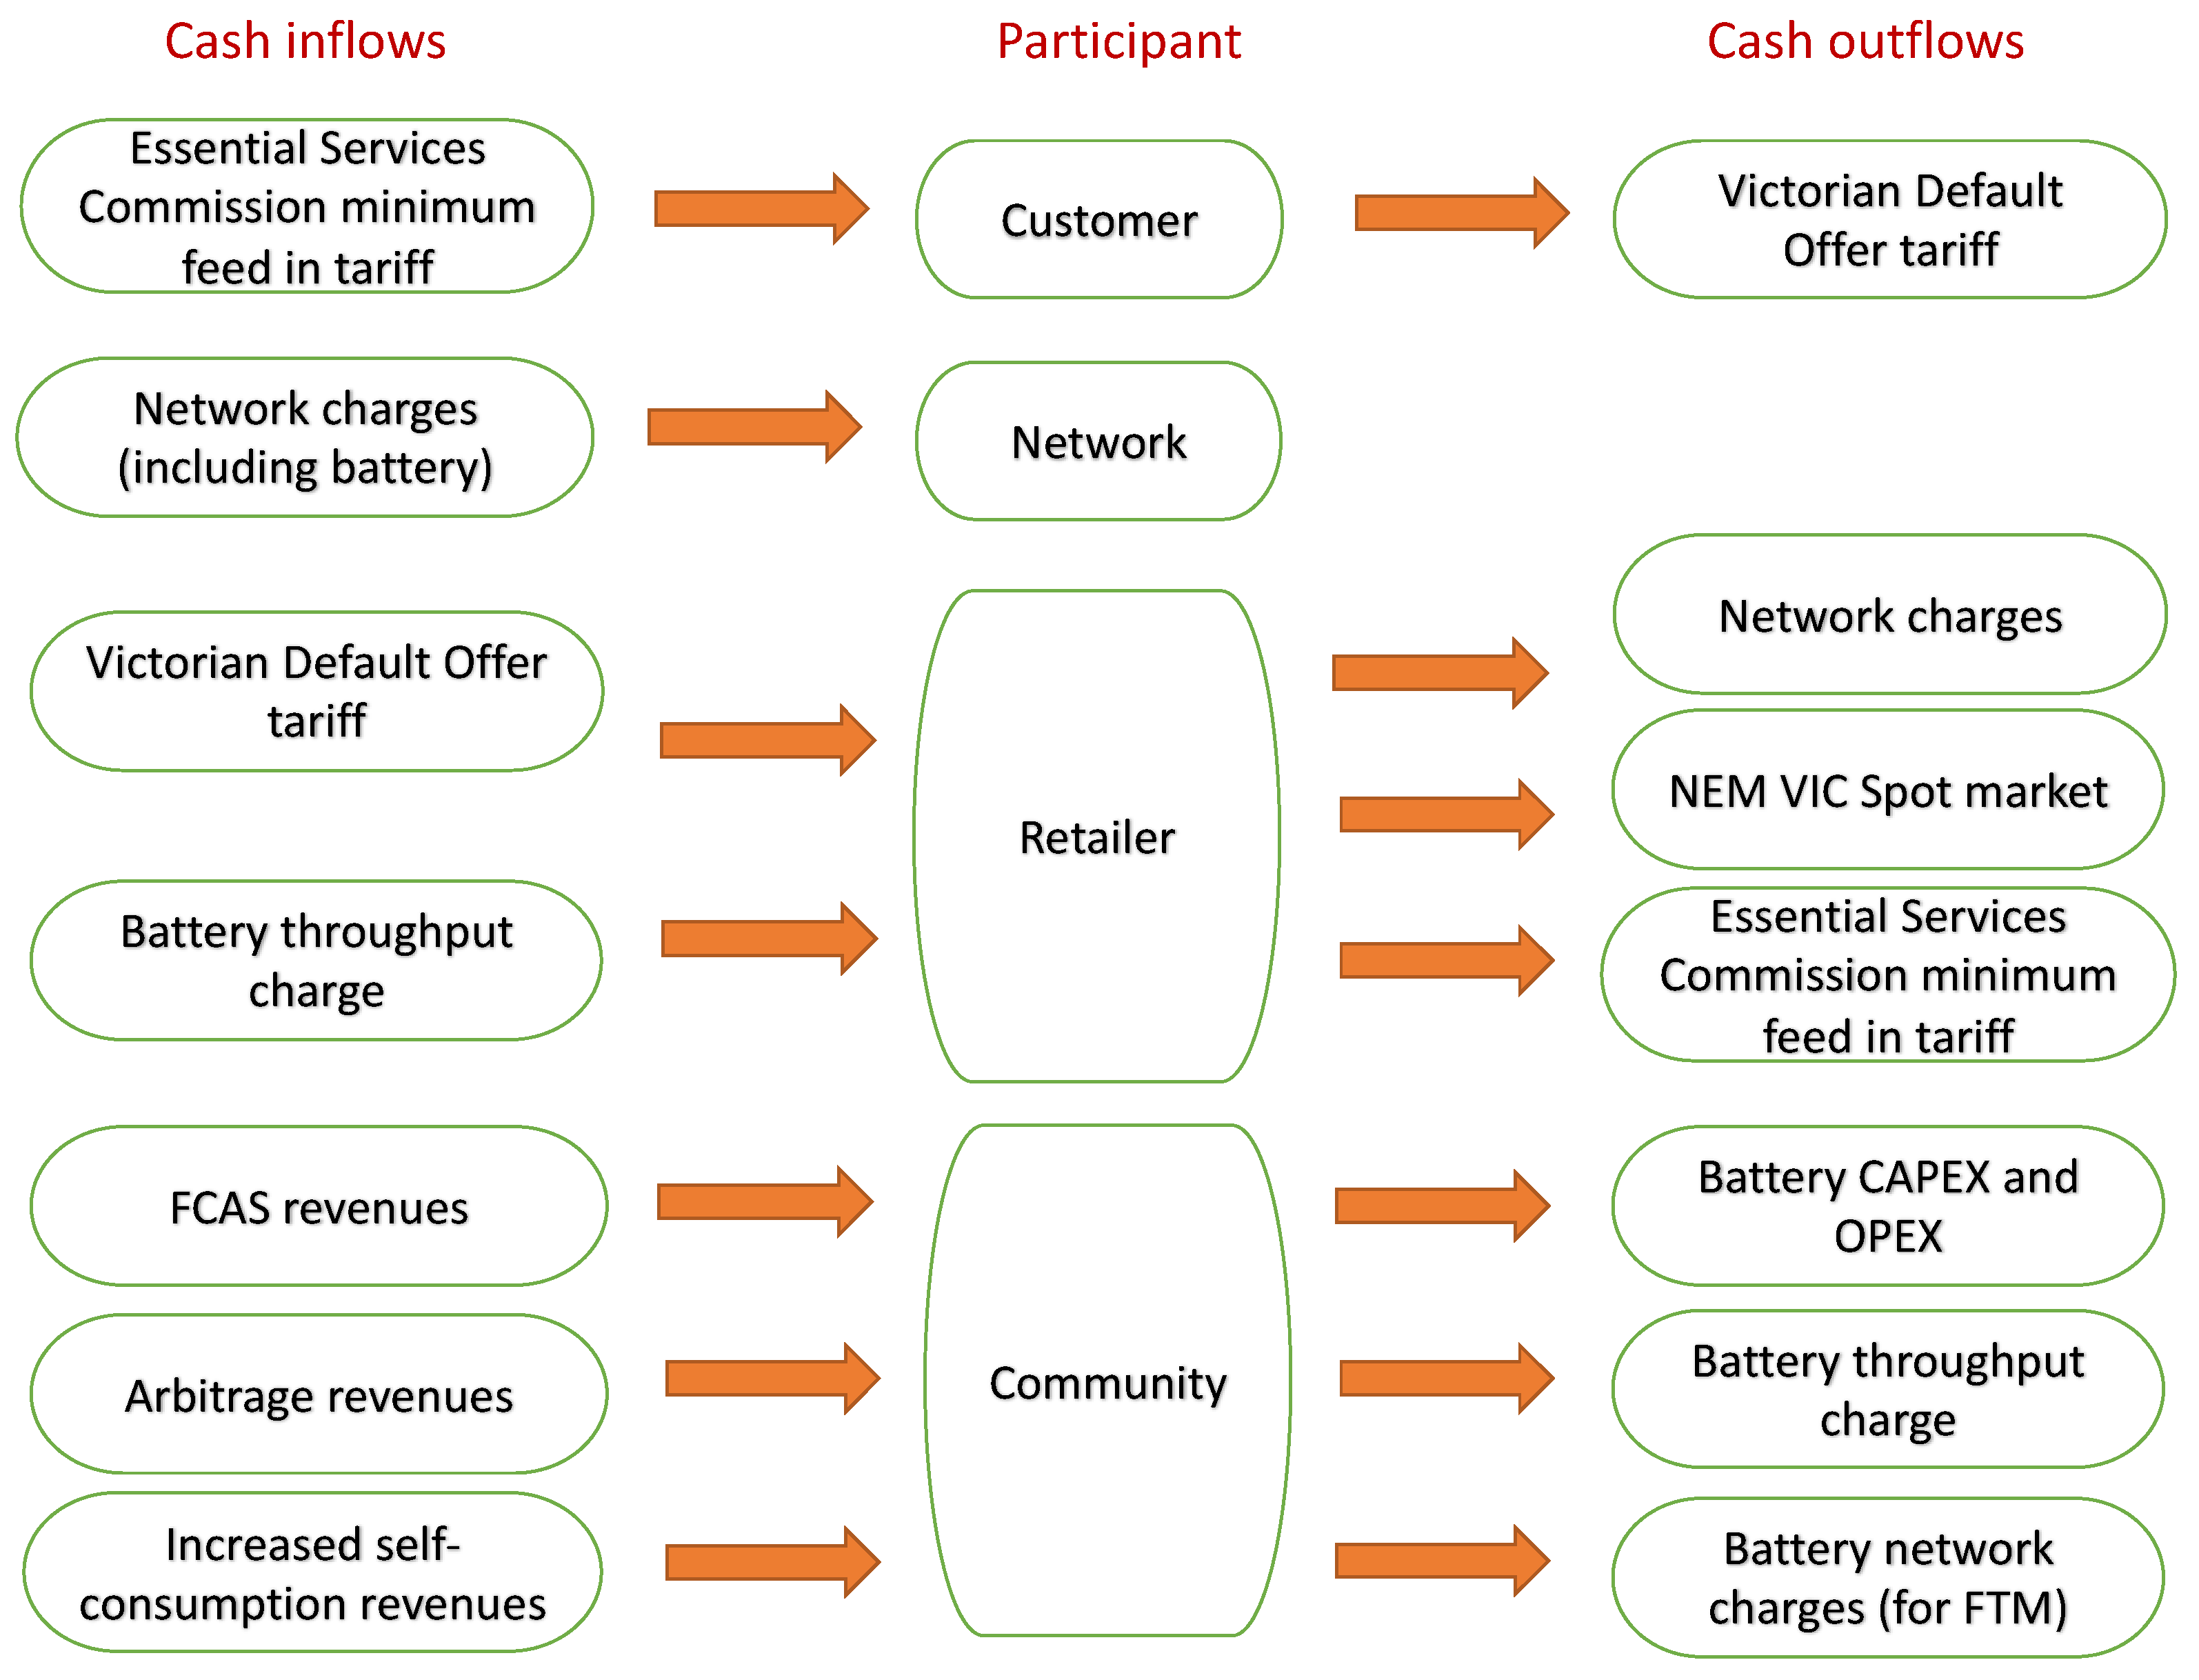
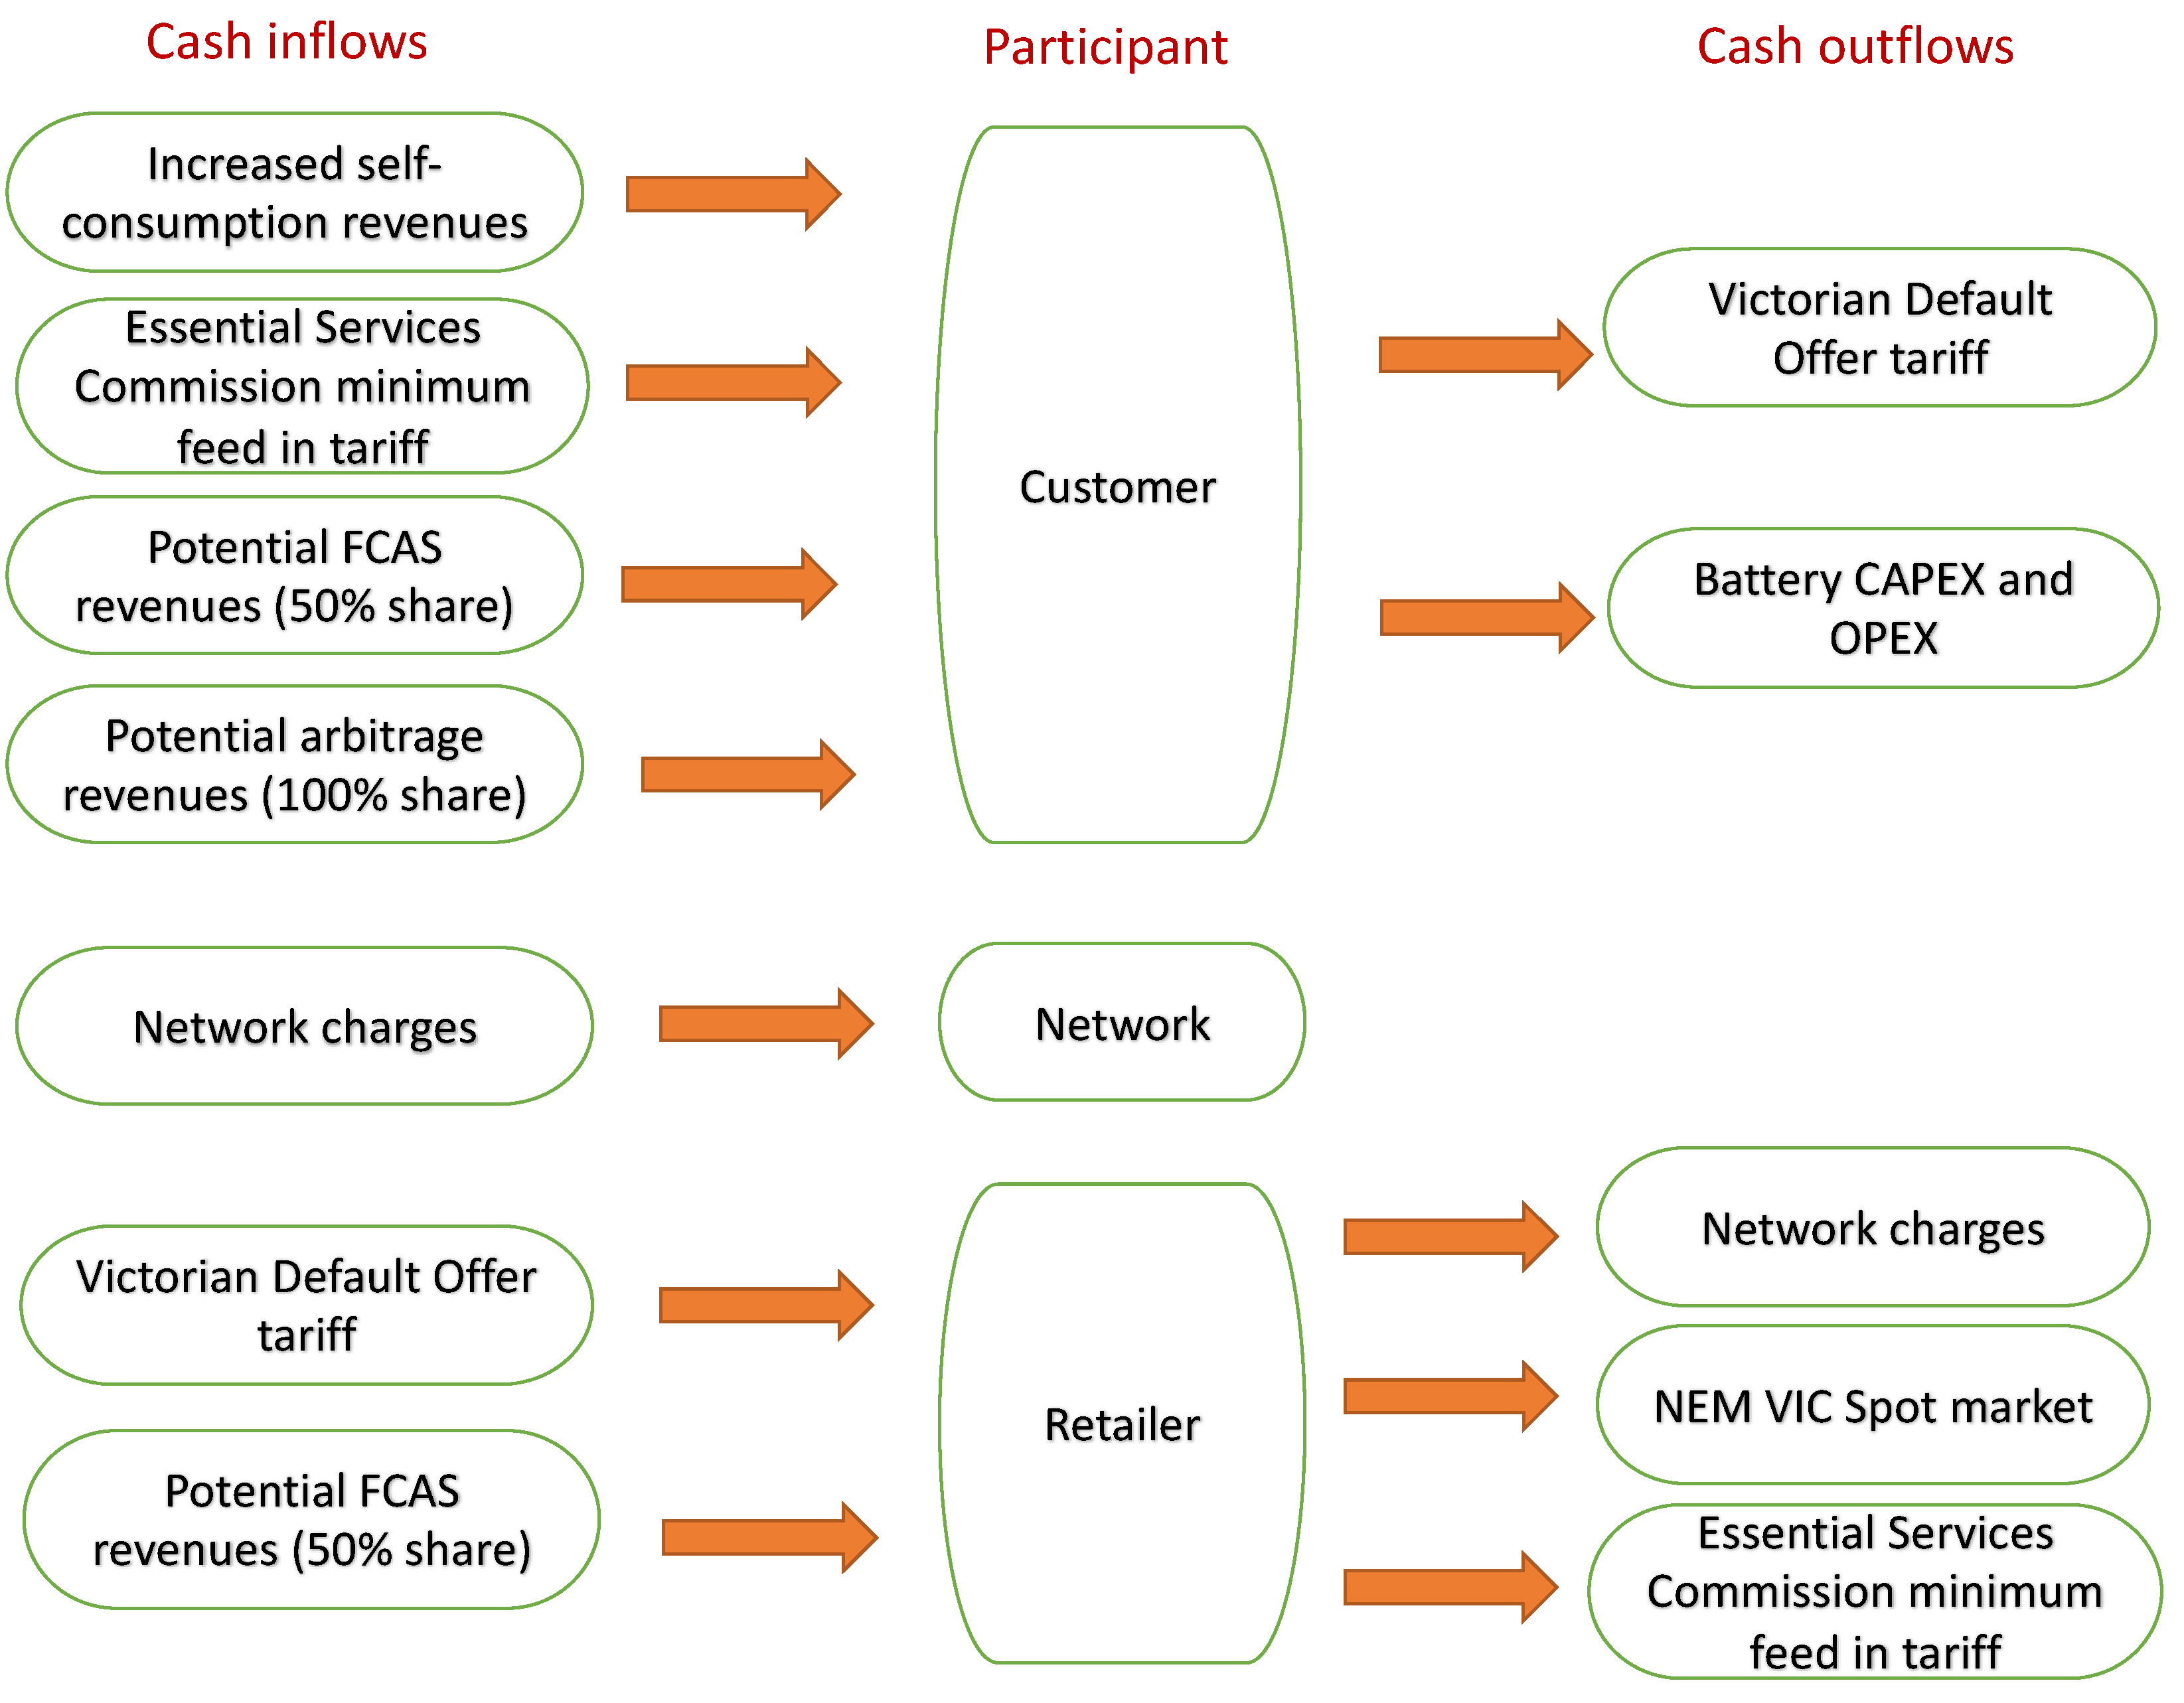
2.4.4. Participant-Level Value Flow Configurations
3. Results and Discussion
3.1. FTM Battery
3.1.1. Key Inputs and Assumptions
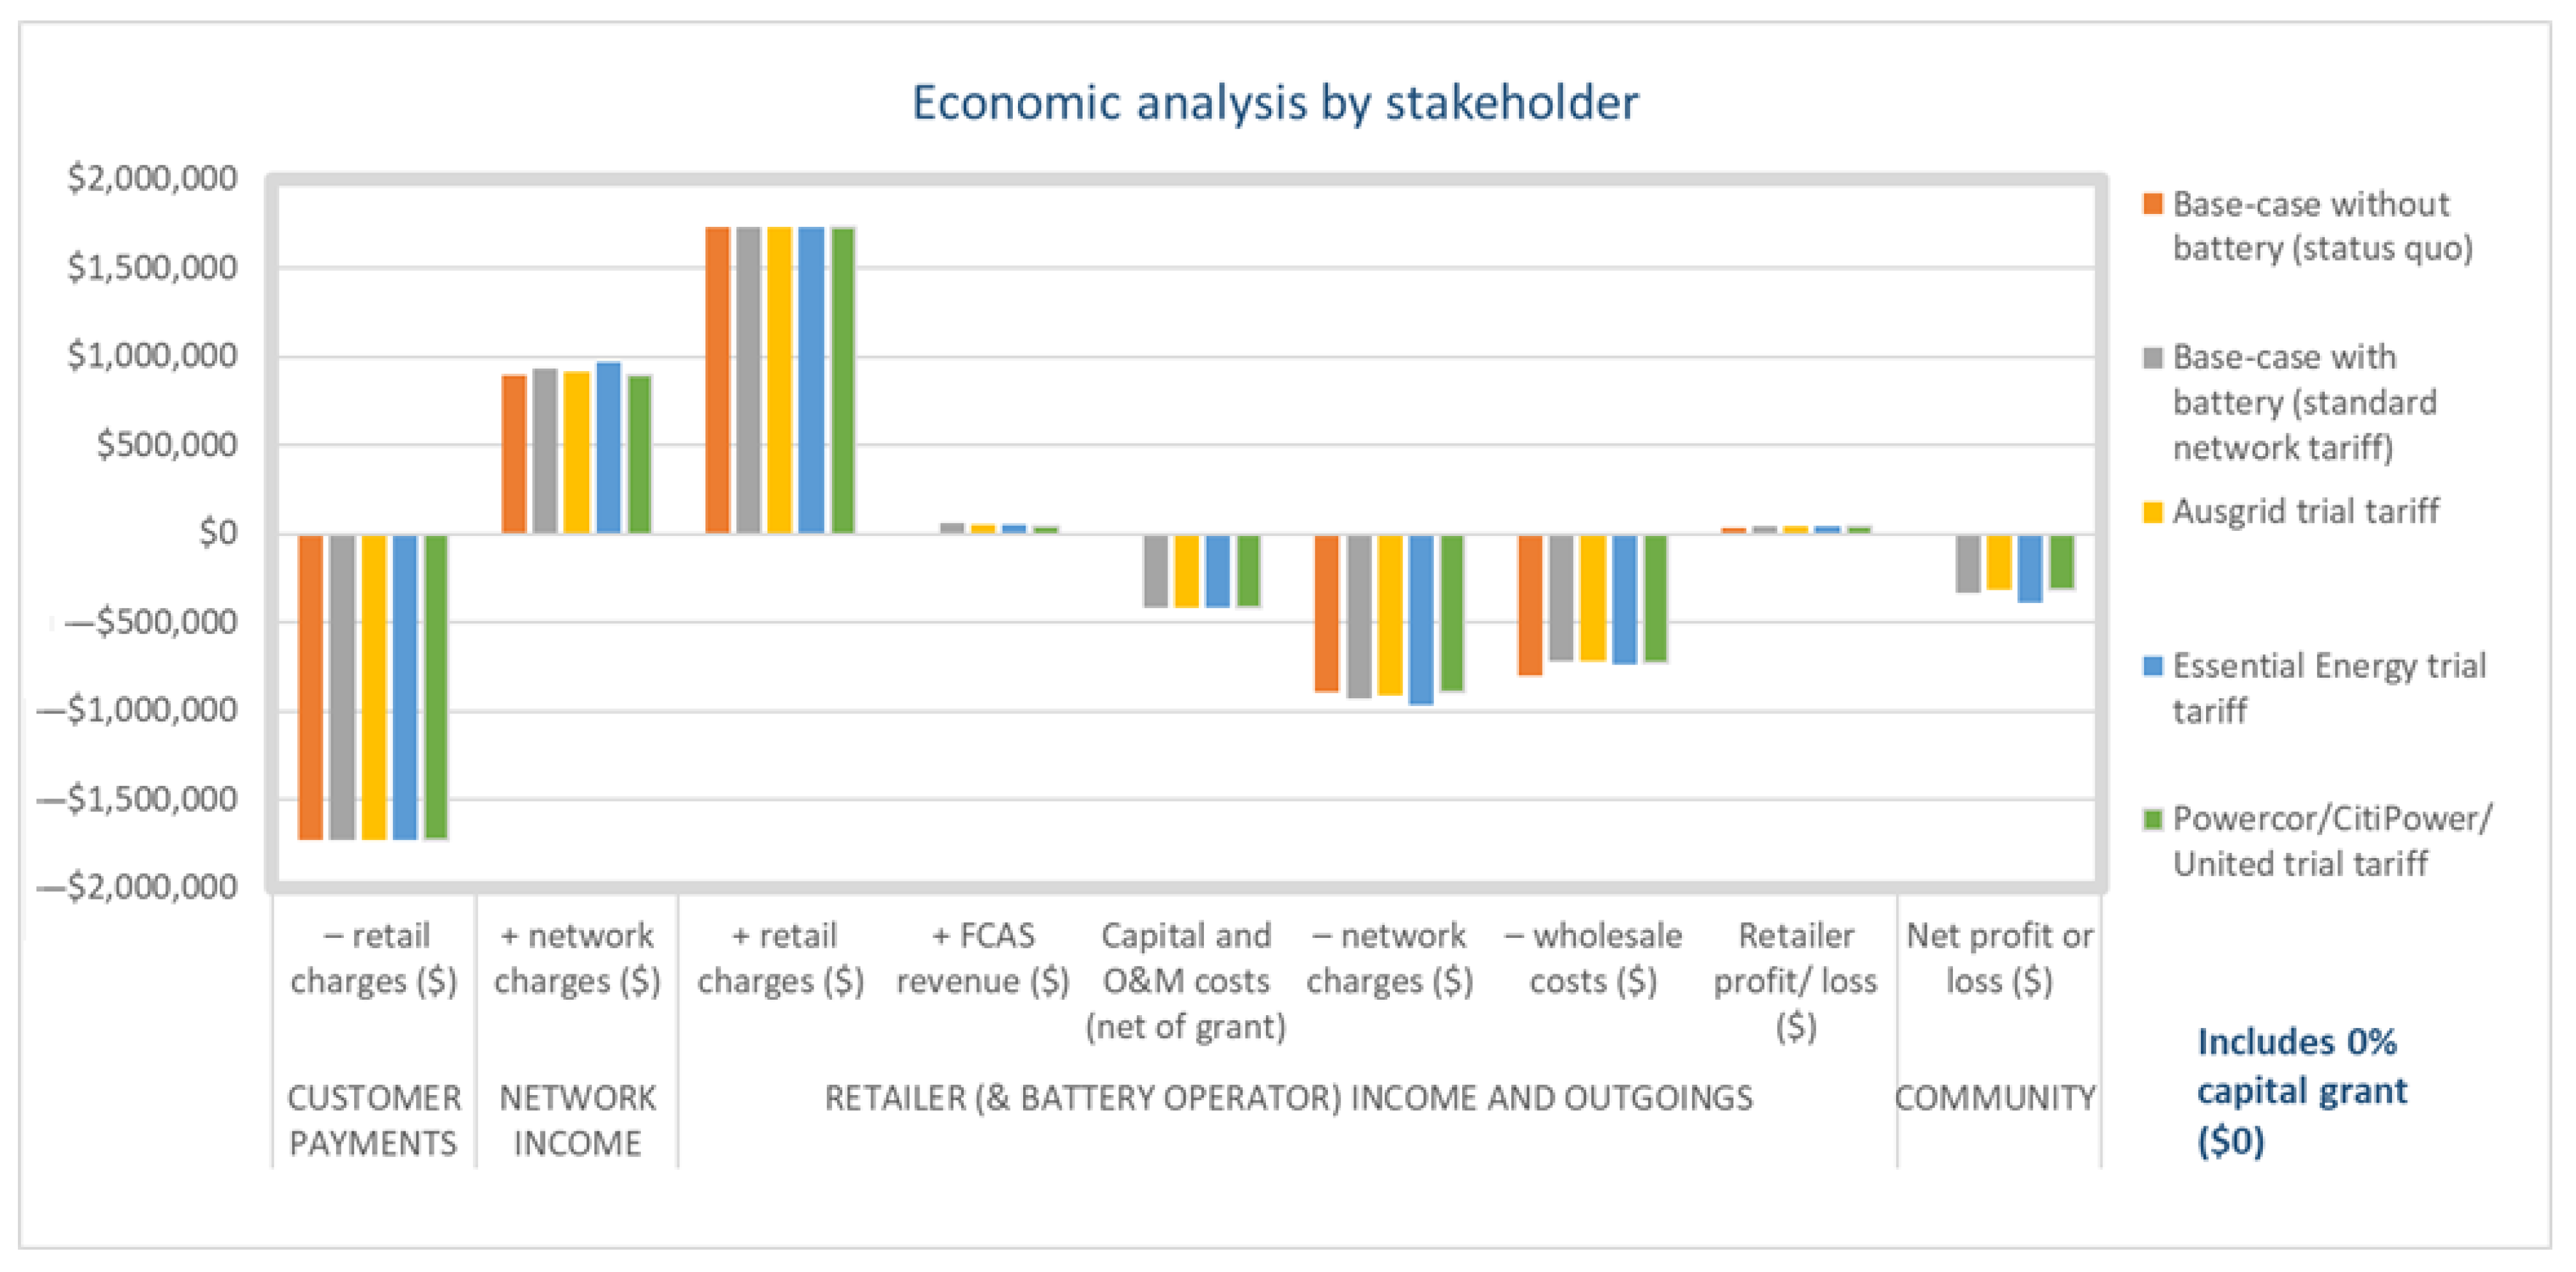
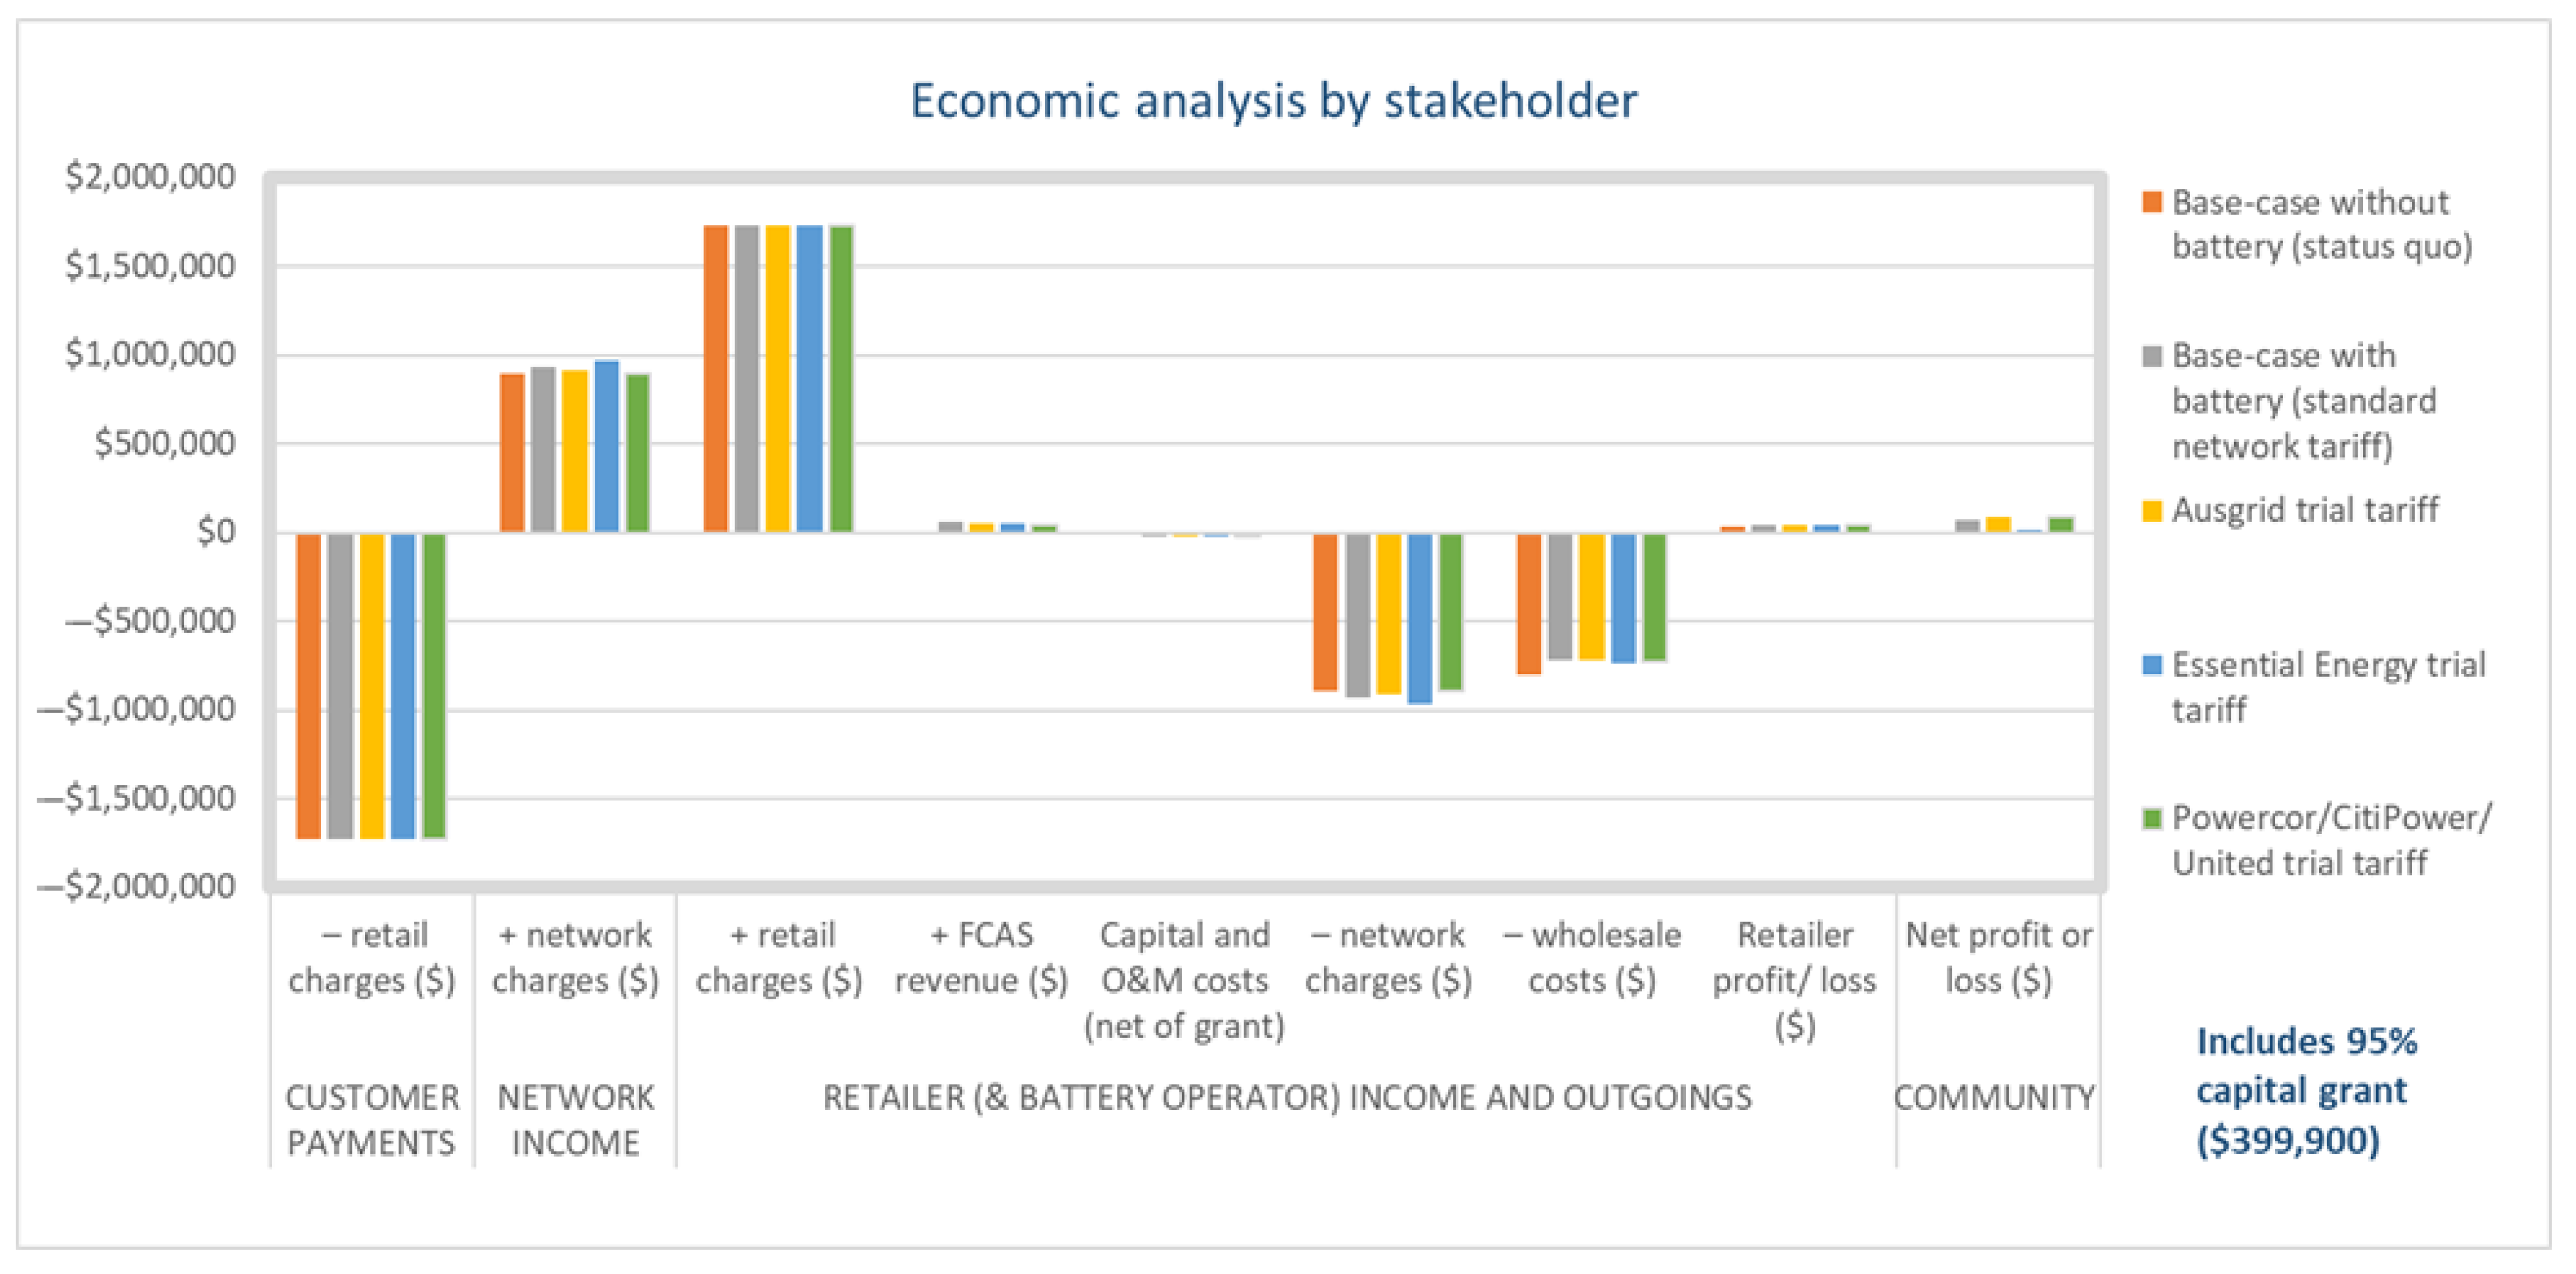
3.1.2. Economic Results by Stakeholder
3.1.3. Load Shape Analysis: System Dynamics
3.2. BTM Batteries
3.2.1. Key Inputs and Assumptions
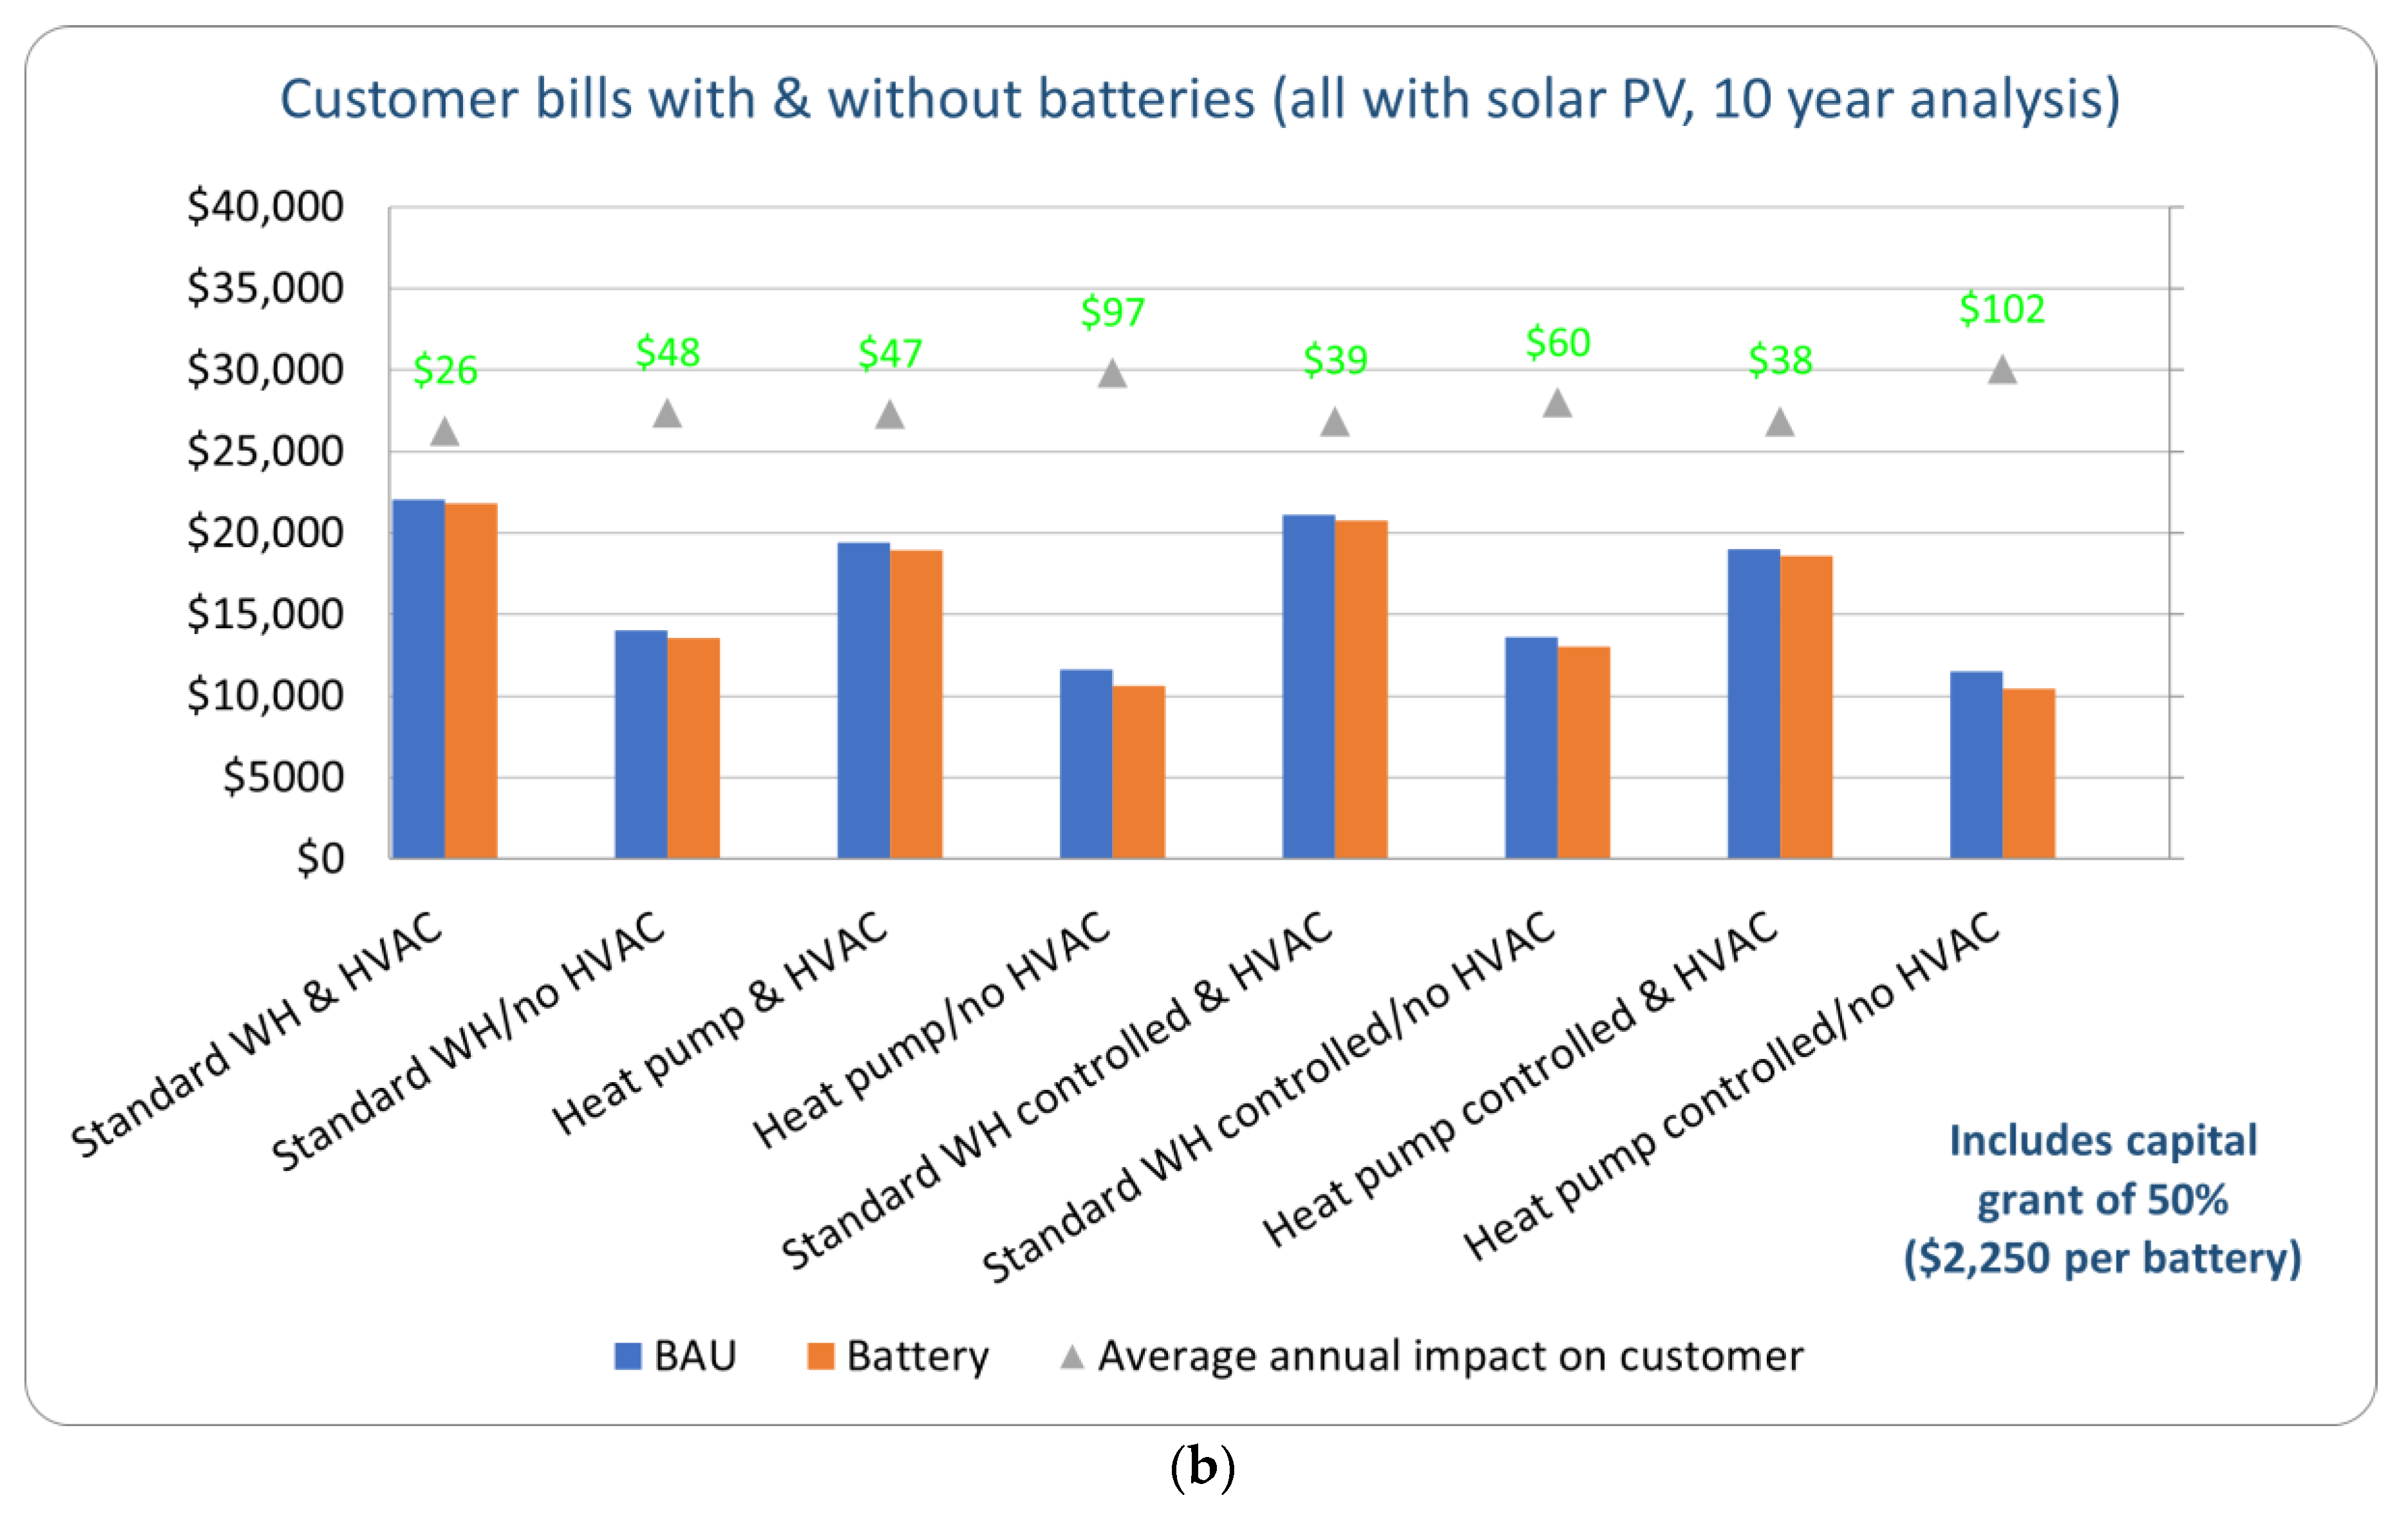
3.2.2. Economic Results for Households
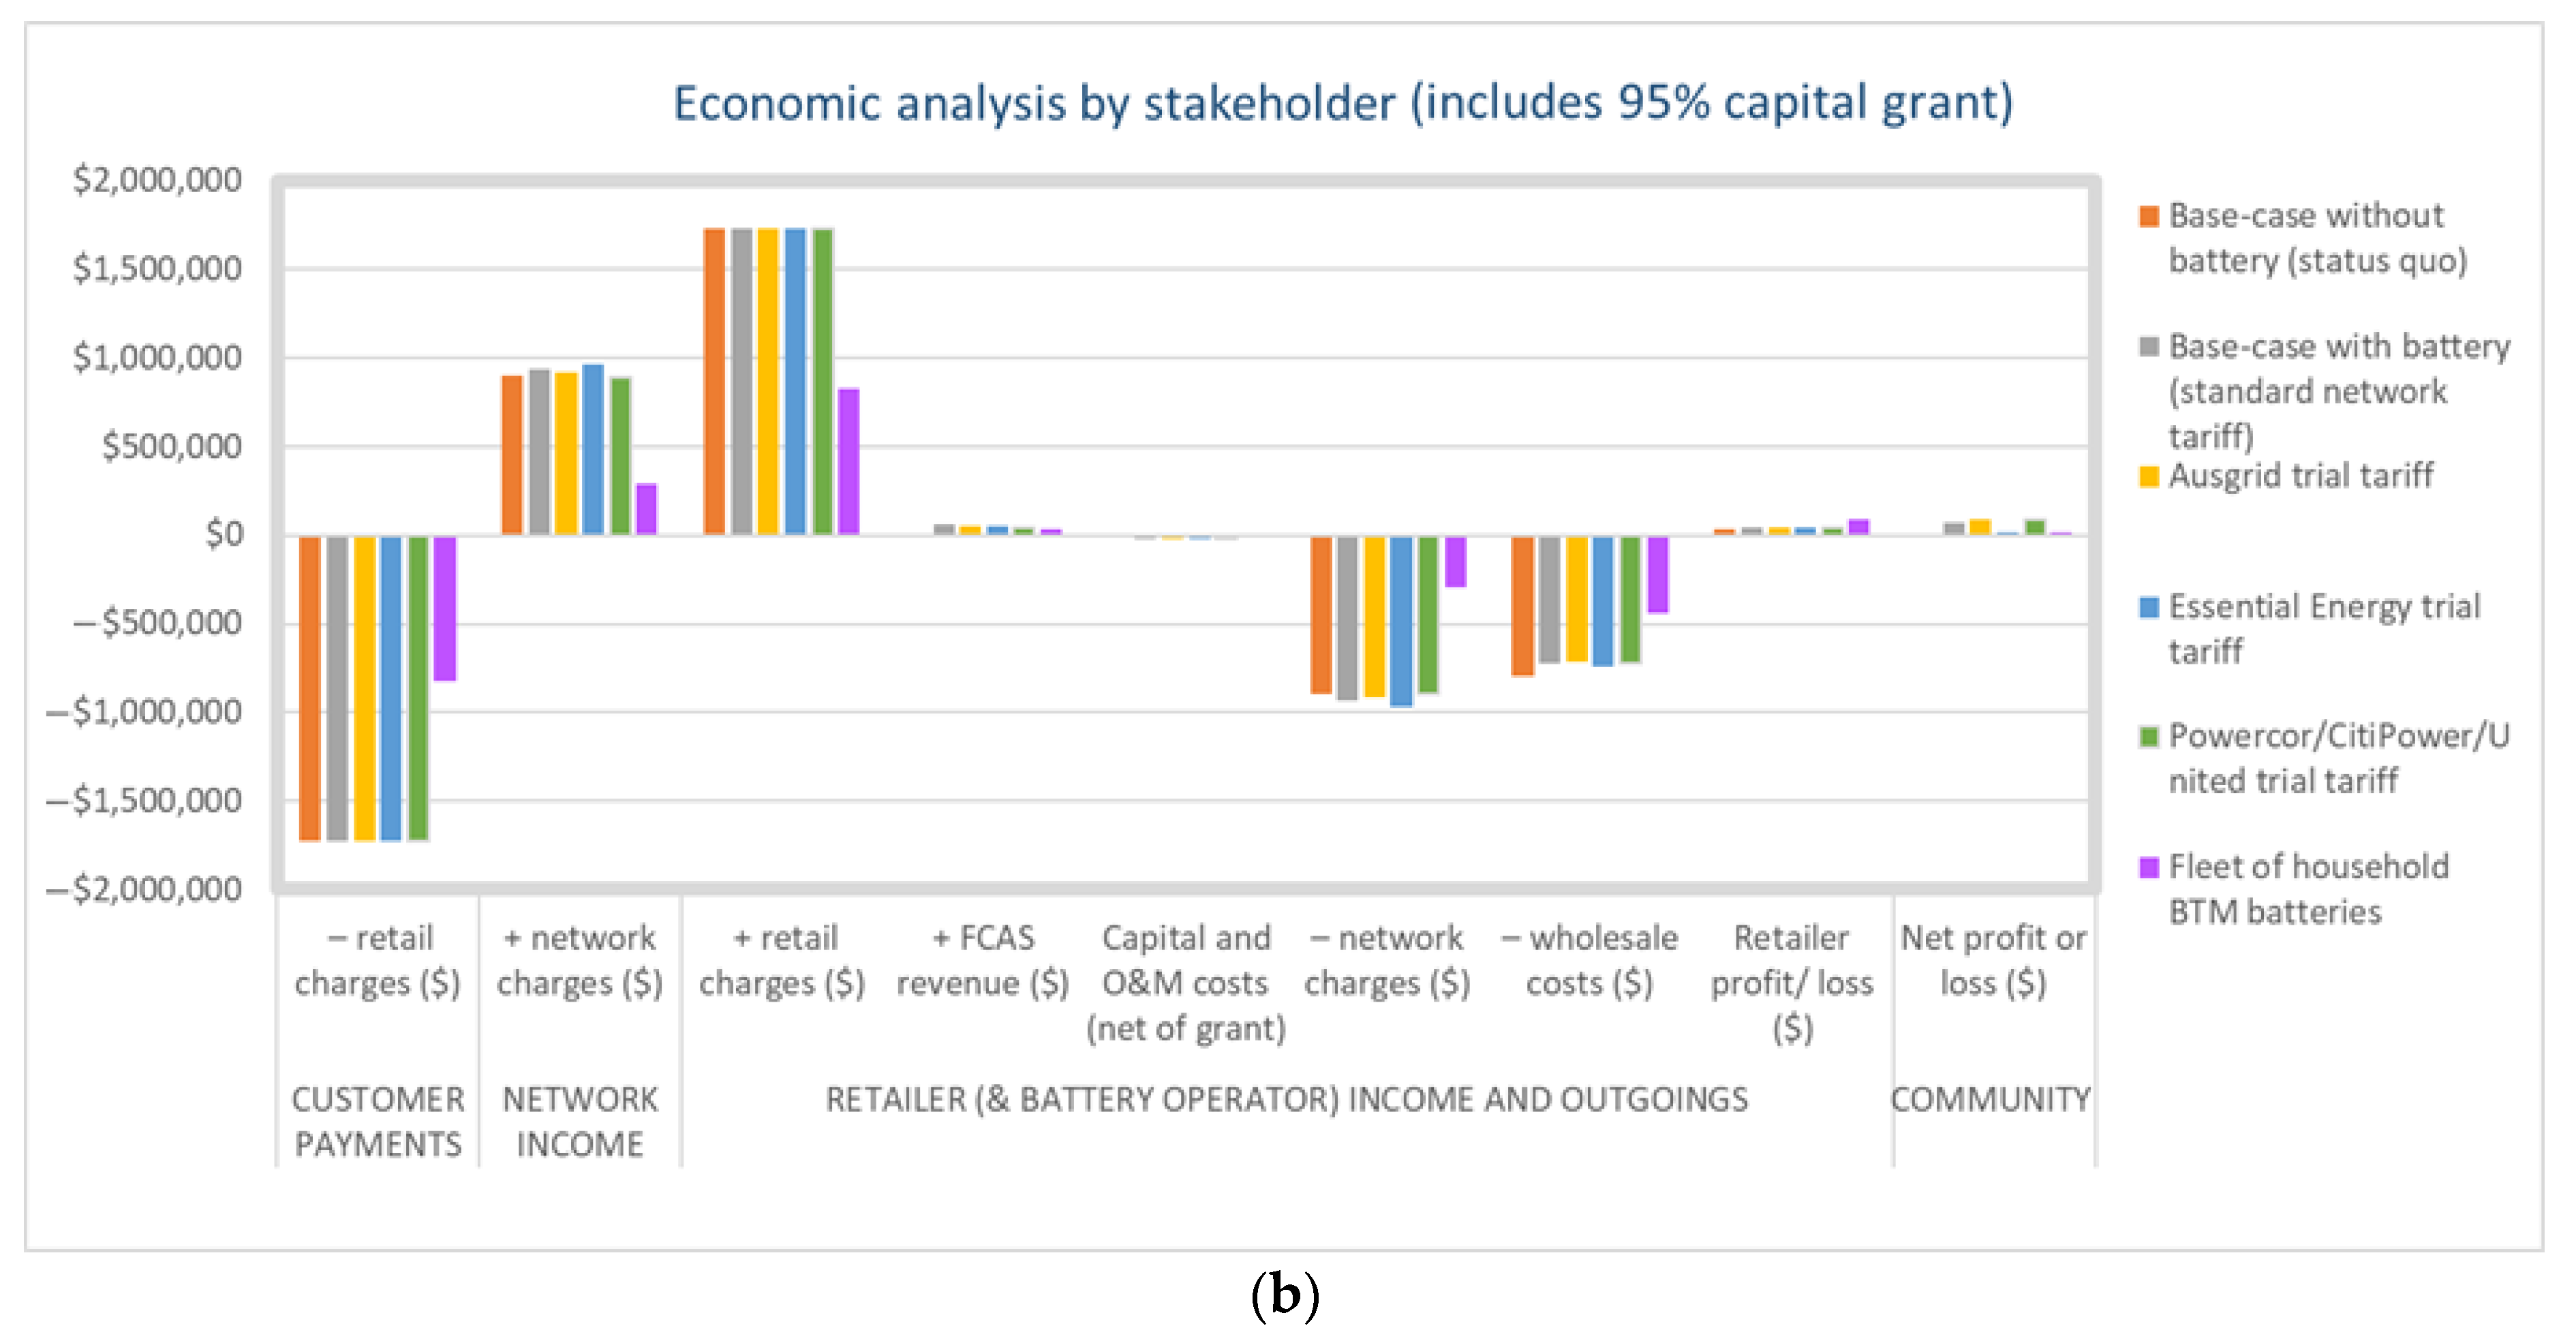
3.3. Comparison of the FTM and BTM Scenarios
4. Conclusions and Future Work
Author Contributions
Funding
Institutional Review Board Statement
Informed Consent Statement
Data Availability Statement
Acknowledgments
Conflicts of Interest
Nomenclature
| Acronym | |
| BTM battery | Behind-the-meter battery |
| DNSPs | Distribution network service providers |
| EV | Electric vehicle |
| FCAS | Frequency control ancillary services |
| FIT | Feed-in tariff |
| FTM battery | Front-of-the-meter battery |
| HP | Heat pump |
| HVAC | Heating, ventilating, and air conditioning |
| kW | Kilowatt |
| kWh | Kilowatt hour |
| LUOS | Local Use of Service |
| LV | Low voltage |
| MW | Megawatt |
| MWh | Megawatt hour |
| NEM | National Electricity Market |
| NMI | National Metering Identifier |
| O&M | Operation and maintenance |
| ROI | Return on interest |
| SoC | State of charge |
| Solar-PV | Solar photovoltaic |
| TOU | Time of use |
References
- Nastasi, B.; Markovska, N.; Puksec, T.; Duić, N.; Foley, A. Renewable and Sustainable Energy Challenges to Face for the Achievement of Sustainable Development Goals. Renew. Sustain. Energy Rev. 2022, 157, 112071. [Google Scholar] [CrossRef]
- Mishra, D.K.; Ghadi, M.J.; Azizivahed, A.; Li, L.; Zhang, J. A Review on Resilience Studies in Active Distribution Systems. Renew. Sustain. Energy Rev. 2021, 135, 110201. [Google Scholar] [CrossRef]
- Bashir, M.F.; Pan, Y.; Shahbaz, M.; Ghosh, S. How Energy Transition and Environmental Innovation Ensure Environmental Sustainability? Contextual Evidence from Top-10 Manufacturing Countries. Renew. Energy 2023, 204, 697–709. [Google Scholar] [CrossRef]
- Olabi, A.G.; Abdelkareem, M.A. Renewable Energy and Climate Change. Renew. Sustain. Energy Rev. 2022, 158, 112111. [Google Scholar] [CrossRef]
- Englberger, S.; Jossen, A.; Hesse, H. Unlocking the Potential of Battery Storage with the Dynamic Stacking of Multiple Applications. Cell Rep. Phys. Sci. 2020, 1, 100238. [Google Scholar] [CrossRef]
- Yang, J.; Weil, M.; Gu, F. Environmental-Economic Analysis of the Secondary Use of Electric Vehicle Batteries in the Load Shifting of Communication Base Stations: A Case Study in China. J. Energy Storage 2022, 55, 105823. [Google Scholar] [CrossRef]
- Zame, K.K.; Brehm, C.A.; Nitica, A.T.; Richard, C.L.; Schweitzer, G.D. Smart Grid and Energy Storage: Policy Recommendations. Renew. Sustain. Energy Rev. 2018, 82, 1646–1654. [Google Scholar] [CrossRef]
- Battke, B.; Schmidt, T.S. Cost-Efficient Demand-Pull Policies for Multi-Purpose Technologies—The Case of Stationary Electricity Storage. Appl. Energy 2015, 155, 334–348. [Google Scholar] [CrossRef]
- Clean Energy Council. Clean Energy Australia—Report 2023. 2023. Available online: https://assets.cleanenergycouncil.org.au/documents/Clean-Energy-Australia-Report-2023.pdf (accessed on 19 September 2023).
- Energy Matters. Energising Homes: Residential Solar Batteries Surging in Australia. May 2023. Available online: https://www.energymatters.com.au/renewable-news/energising-homes-residential-solar-batteries-surging-in-australia/ (accessed on 19 September 2023).
- Ransan-Cooper, H.; Shaw, M.; Sturmberg, B.C.P.; Blackhall, L. Neighbourhood Batteries in Australia: Anticipating Questions of Value Conflict and (in)Justice. Energy Res. Soc. Sci. 2022, 90, 102572. [Google Scholar] [CrossRef]
- Pimm, A.J.; Palczewski, J.; Morris, R.; Cockerill, T.T.; Taylor, P.G. Community Energy Storage: A Case Study in the UK Using a Linear Programming Method. Energy Convers. Manag. 2020, 205, 112388. [Google Scholar] [CrossRef]
- Dratsas, P.A.; Psarros, G.N.; Papathanassiou, S.A. Feasibility of Behind-the-Meter Battery Storage in Wind Farms Operating on Small Islands. Batteries 2022, 8, 275. [Google Scholar] [CrossRef]
- Wen, K.; Li, W.; Yu, S.S.; Li, P.; Shi, P. Optimal Intra-Day Operations of behind-the-Meter Battery Storage for Primary Frequency Regulation Provision: A Hybrid Lookahead Method. Energy 2022, 247, 123482. [Google Scholar] [CrossRef]
- Energy Matters. Solar Battery System Rebates, Subsidies, & Incentives. 2023. Available online: https://www.energymatters.com.au/residential-solar/battery-system-rebates (accessed on 19 September 2023).
- Tostado-Véliz, M.; Rezaee Jordehi, A.; Amir Mansouri, S.; Jurado, F. Day-Ahead Scheduling of 100% Isolated Communities under Uncertainties through a Novel Stochastic-Robust Model. Appl. Energy 2022, 328, 120257. [Google Scholar] [CrossRef]
- Thompson, B.; Murfitt, P. Getting in Front of the Meter: Finding Value in Sharing. ReNew Technol. Sustain. Future 2016, 137, 30–33. [Google Scholar]
- Lehmbruck, L.; Kretz, J.; Aengenvoort, J.; Sioshansi, F. Aggregation of Front-and behind-the-Meter: The Evolving VPP Business Model. In Behind and Beyond the Meter; Elsevier: Amsterdam, The Netherlands, 2020; pp. 211–232. [Google Scholar]
- Sun, S.I.; Smith, B.D.; Wills, R.G.A.; Crossland, A.F. Effects of Time Resolution on Finances and Self-Consumption When Modeling Domestic PV-Battery Systems. Energy Rep. 2020, 6, 157–165. [Google Scholar] [CrossRef]
- Wang, F.; Ge, X.; Yang, P.; Li, K.; Mi, Z.; Siano, P.; Duić, N. Day-Ahead Optimal Bidding and Scheduling Strategies for DER Aggregator Considering Responsive Uncertainty under Real-Time Pricing. Energy 2020, 213, 118765. [Google Scholar] [CrossRef]
- Seward, W.; Qadrdan, M.; Jenkins, N. Revenue Stacking for behind the Meter Battery Storage in Energy and Ancillary Services Markets. Electr. Power Syst. Res. 2022, 211, 108292. [Google Scholar] [CrossRef]
- Shen, J.; Jiang, C.; Li, B. Controllable Load Management Approaches in Smart Grids. Energies 2015, 8, 11187–11202. [Google Scholar] [CrossRef]
- Lopez-Lorente, J.; Liu, X.A.; Best, R.J.; Makrides, G.; Morrow, D.J. Techno-Economic Assessment of Grid-Level Battery Energy Storage Supporting Distributed Photovoltaic Power. IEEE Access 2021, 9, 146256–146280. [Google Scholar] [CrossRef]
- Elgqvist, E. Battery Storage for Resilience; National Renewable Energy Lab (NREL): Golden, CO, USA, 2021.
- Smart Energy International. What’s on the Energy Storage Market Besides Lithium-Ion Batteries. October 2020. Available online: https://www.smart-energy.com/news/whats-on-the-energy-storage-market-besides-lithium-ion-batteries/ (accessed on 19 September 2023).
- Wu, Y.; Liu, Z.; Li, B.; Liu, J.; Zhang, L. Energy Management Strategy and Optimal Battery Capacity for Flexible PV-Battery System under Time-of-Use Tariff. Renew. Energy 2022, 200, 558–570. [Google Scholar] [CrossRef]
- Parra, D.; Patel, M.K. Effect of Tariffs on the Performance and Economic Benefits of PV-Coupled Battery Systems. Appl. Energy 2016, 164, 175–187. [Google Scholar] [CrossRef]
- Gautier, A.; Jacqmin, J. PV adoption in Wallonia: The role of distribution tariffs under net metering. In Proceedings of the 5th FAERE Annual Conference, Aix-en-Provence, France, 9–10 September 2018; pp. 1–27. [Google Scholar]
- Wang, Y.; Qi, C.; Dong, H.; Wang, S.; Wang, X.; Zeng, M.; Zhu, J. Optimal Design of Integrated Energy System Considering Different Battery Operation Strategy. Energy 2020, 212, 118537. [Google Scholar] [CrossRef]
- Campana, P.E.; Cioccolanti, L.; François, B.; Jurasz, J.; Zhang, Y.; Varini, M.; Stridh, B.; Yan, J. Li-Ion Batteries for Peak Shaving, Price Arbitrage, and Photovoltaic Self-Consumption in Commercial Buildings: A Monte Carlo Analysis. Energy Convers. Manag. 2021, 234, 113889. [Google Scholar] [CrossRef]
- Zhang, S.; Tang, Y. Optimal Schedule of Grid-Connected Residential PV Generation Systems with Battery Storages under Time-of-Use and Step Tariffs. J. Energy Storage 2019, 23, 175–182. [Google Scholar] [CrossRef]
- Ouédraogo, S.; Faggianelli, G.A.; Notton, G.; Duchaud, J.L.; Voyant, C. Impact of Electricity Tariffs and Energy Management Strategies on PV/Battery Microgrid Performances. Renew. Energy 2022, 199, 816–825. [Google Scholar] [CrossRef]
- Kong, W.; Luo, F.; Jia, Y.; Dong, Z.; Liu, J. Benefits of Home Energy Storage Utilization: An Australian Case Study of Demand Charge Practices in Residential Sector. IEEE Trans. Smart Grid 2021, 12, 3086–3096. [Google Scholar] [CrossRef]
- Darghouth, N.R.; Barbose, G.; Zuboy, J.; Gagnon, P.J.; Mills, A.D.; Bird, L. Demand Charge Savings from Solar PV and Energy Storage. Energy Policy 2020, 146, 111766. [Google Scholar] [CrossRef]
- Bloch, L.; Holweger, J.; Ballif, C.; Wyrsch, N. Impact of Advanced Electricity Tariff Structures on the Optimal Design, Operation and Profitability of a Grid-Connected PV System with Energy Storage. Energy Inform. 2019, 2, 1–19. [Google Scholar] [CrossRef]
- Zeraatpisheh, M.; Arababadi, R.; Saffari Pour, M. Economic Analysis for Residential Solar PV Systems Based on Different Demand Charge Tariffs. Energies 2018, 11, 3271. [Google Scholar] [CrossRef]
- Luo, F.; Kong, W.; Ranzi, G.; Dong, Z.Y. Optimal Home Energy Management System with Demand Charge Tariff and Appliance Operational Dependencies. IEEE Trans. Smart Grid 2020, 11, 4–14. [Google Scholar] [CrossRef]
- Batista Abikarram, J.; McConky, K.; Proano, R. Energy Cost Minimization for Unrelated Parallel Machine Scheduling under Real Time and Demand Charge Pricing. J. Clean. Prod. 2019, 208, 232–242. [Google Scholar] [CrossRef]
- Sharma, V.; Aziz, S.M.; Haque, M.H.; Kauschke, T. Energy Economy of Households With Photovoltaic System and Battery Storage Under Time of Use Tariff With Demand Charge. IEEE Access 2022, 10, 33069–33082. [Google Scholar] [CrossRef]
- Freitas Gomes, I.S.; Perez, Y.; Suomalainen, E. Coupling Small Batteries and PV Generation: A Review. Renew. Sustain. Energy Rev. 2020, 126, 109835. [Google Scholar] [CrossRef]
- Dong, S.; Kremers, E.; Brucoli, M.; Rothman, R.; Brown, S. Techno-Enviro-Economic Assessment of Household and Community Energy Storage in the UK. Energy Convers. Manag. 2020, 205, 112330. [Google Scholar] [CrossRef]
- Muenzel, V.; Mareels, I.; de Hoog, J.; Vishwanath, A.; Kalyanaraman, S.; Gort, A. PV Generation and Demand Mismatch: Evaluating the Potential of Residential Storage. In Proceedings of the 2015 IEEE Power & Energy Society Innovative Smart Grid Technologies Conference (ISGT), Washington, DC, USA, 18–20 February 2015; pp. 1–5. [Google Scholar]
- Comello, S.; Reichelstein, S. The Emergence of Cost Effective Battery Storage. Nat. Commun. 2019, 10, 2038. [Google Scholar] [CrossRef]
- Parra, D.; Norman, S.A.; Walker, G.S.; Gillott, M. Optimum Community Energy Storage System for Demand Load Shifting. Appl. Energy 2016, 174, 130–143. [Google Scholar] [CrossRef]
- Alonso, A.M.; Costa, D.; Messagie, M.; Coosemans, T. Techno-Economic Assessment on Hybrid Energy Storage Systems Comprising Hydrogen and Batteries: A Case Study in Belgium. Int. J. Hydrogen Energy 2023, in press. [CrossRef]
- Cardoso, G.; Brouhard, T.; DeForest, N.; Wang, D.; Heleno, M.; Kotzur, L. Battery Aging in Multi-Energy Microgrid Design Using Mixed Integer Linear Programming. Appl. Energy 2018, 231, 1059–1069. [Google Scholar] [CrossRef]
- Barbour, E.; Parra, D.; Awwad, Z.; González, M.C. Community Energy Storage: A Smart Choice for the Smart Grid? Appl. Energy 2018, 212, 489–497. [Google Scholar] [CrossRef]
- van der Stelt, S.; AlSkaif, T.; van Sark, W. Techno-Economic Analysis of Household and Community Energy Storage for Residential Prosumers with Smart Appliances. Appl. Energy 2018, 209, 266–276. [Google Scholar] [CrossRef]
- Parra, D.; Swierczynski, M.; Stroe, D.I.; Norman, S.A.; Abdon, A.; Worlitschek, J.; O’Doherty, T.; Rodrigues, L.; Gillott, M.; Zhang, X.; et al. An Interdisciplinary Review of Energy Storage for Communities: Challenges and Perspectives. Renew. Sustain. Energy Rev. 2017, 79, 730–749. [Google Scholar] [CrossRef]
- AlSkaif, T.; Luna, A.C.; Zapata, M.G.; Guerrero, J.M.; Bellalta, B. Reputation-Based Joint Scheduling of Households Appliances and Storage in a Microgrid with a Shared Battery. Energy Build. 2017, 138, 228–239. [Google Scholar] [CrossRef]
- Kalkbrenner, B.J. Residential vs. Community Battery Storage Systems—Consumer Preferences in Germany. Energy Policy 2019, 129, 1355–1363. [Google Scholar] [CrossRef]
- Dong, S.; Kremers, E.; Brucoli, M.; Rothman, R.; Brown, S. Improving the Feasibility of Household and Community Energy Storage: A Techno-Enviro-Economic Study for the UK. Renew. Sustain. Energy Rev. 2020, 131, 110009. [Google Scholar] [CrossRef]
- Sharma, V.; Haque, M.H.; Aziz, S.M. Energy Cost Minimization for Net Zero Energy Homes through Optimal Sizing of Battery Storage System. Renew. Energy 2019, 141, 278–286. [Google Scholar] [CrossRef]
- Li, J. Optimal Sizing of Grid-Connected Photovoltaic Battery Systems for Residential Houses in Australia. Renew. Energy 2019, 136, 1245–1254. [Google Scholar] [CrossRef]
- Sepúlveda-Mora, S.B.; Hegedus, S. Making the Case for Time-of-Use Electric Rates to Boost the Value of Battery Storage in Commercial Buildings with Grid Connected PV Systems. Energy 2021, 218, 119447. [Google Scholar] [CrossRef]
- Tang, Y.; Zhang, Q.; Li, H.; Li, Y.; Liu, B. Economic Analysis on Repurposed EV Batteries in a Distributed PV System under Sharing Business Models. Energy Procedia 2019, 158, 4304–4310. [Google Scholar] [CrossRef]
- Abdulla, K.; de Hoog, J.; Muenzel, V.; Suits, F.; Steer, K.; Wirth, A.; Halgamuge, S. Optimal Operation of Energy Storage Systems Considering Forecasts and Battery Degradation. IEEE Trans. Smart Grid 2018, 9, 2086–2096. [Google Scholar] [CrossRef]
- Temene Hermann, D.; Donatien, N.; Konchou Franck Armel, T.; René, T. Techno-Economic and Environmental Feasibility Study with Demand-Side Management of Photovoltaic/Wind/Hydroelectricity/Battery/Diesel: A Case Study in Sub-Saharan Africa. Energy Convers. Manag. 2022, 258, 115494. [Google Scholar] [CrossRef]
- Reis, I.; Gonçalves, I.; Lopes, M.A.R.; Henggeler Antunes, C. Business Models for Energy Communities: A Review of Key Issues and Trends. Renew. Sustain. Energy Rev. 2021, 144, 111013. [Google Scholar] [CrossRef]
- Henni, S.; Staudt, P.; Weinhardt, C. A Sharing Economy for Residential Communities with PV-Coupled Battery Storage: Benefits, Pricing and Participant Matching. Appl. Energy 2021, 301, 117351. [Google Scholar] [CrossRef]
- Celik, B.; Roche, R.; Bouquain, D.; Miraoui, A. Decentralized Neighborhood Energy Management With Coordinated Smart Home Energy Sharing. IEEE Trans. Smart Grid 2018, 9, 6387–6397. [Google Scholar] [CrossRef]
- Gjorgievski, V.Z.; Cundeva, S.; Georghiou, G.E. Social Arrangements, Technical Designs and Impacts of Energy Communities: A Review. Renew. Energy 2021, 169, 1138–1156. [Google Scholar] [CrossRef]
- Burlinson, A.; Giulietti, M. Non-Traditional Business Models for City-Scale Energy Storage: Evidence from UK Case Studies. Econ. Polit. Ind. 2018, 45, 215–242. [Google Scholar] [CrossRef]
- Iazzolino, G.; Sorrentino, N.; Menniti, D.; Pinnarelli, A.; De Carolis, M.; Mendicino, L. Energy Communities and Key Features Emerged from Business Models Review. Energy Policy 2022, 165, 112929. [Google Scholar] [CrossRef]
- Tietze, I.; Szichta, P.; Lazar, L. Lukas Lazar Potentials of the Sharing Economy for the Electricity Sector Regarding Private Capital Involvement and Decarbonisation. In Proceedings of the 16th IAEE European Conference, Ljubljana, Slovenia, 25–28 August 2019; pp. 25–28. [Google Scholar]
- Tushar, W.; Yuen, C.; Saha, T.K.; Morstyn, T.; Chapman, A.C.; Alam, M.J.E.; Hanif, S.; Poor, H.V. Peer-to-Peer Energy Systems for Connected Communities: A Review of Recent Advances and Emerging Challenges. Appl. Energy 2021, 282, 116131. [Google Scholar] [CrossRef]
- Tushar, W.; Saha, T.K.; Yuen, C.; Azim, M.I.; Morstyn, T.; Poor, H.V.; Niyato, D.; Bean, R. A Coalition Formation Game Framework for Peer-to-Peer Energy Trading. Appl. Energy 2020, 261, 114436. [Google Scholar] [CrossRef]
- Tushar, W.; Saha, T.K.; Yuen, C.; Morstyn, T.; McCulloch, M.D.; Poor, H.V.; Wood, K.L. A Motivational Game-Theoretic Approach for Peer-to-Peer Energy Trading in the Smart Grid. Appl. Energy 2019, 243, 10–20. [Google Scholar] [CrossRef]
- Müller, S.C.; Welpe, I.M. Sharing Electricity Storage at the Community Level: An Empirical Analysis of Potential Business Models and Barriers. Energy Policy 2018, 118, 492–503. [Google Scholar] [CrossRef]
- Gridcog Software. Available online: https://www.gridcog.com/ (accessed on 19 September 2023).
- Mohseni, S.; Rutovitz, J.; Smith, H.; McCoy, T.; Dwyer, S. Heyfield Residential Load Profiles: Derived Dataset, 2021–2022. Mendeley Data, V1. 2023. Available online: https://data.mendeley.com/datasets/wtd3c8dpkz/1 (accessed on 19 September 2023).
- AusNet Services. Electricity Distribution—Annual Pricing Proposal 2022–23. July 2022. Available online: https://www.ausnetservices.com.au/-/media/project/ausnet/corporate-website/files/electricity/tariffs-and-charges/2022/ausnet---annual-pricing-proposal-2022-23.pdf (accessed on 19 September 2023).
- Essential Energy. Tariff Trial Notification—2022-23. February 2022. Available online: https://www.aer.gov.au/system/files/Essential%20Energy%20-%20Tariff%20trial%20notification%20-%202022-23%20-%20PUBLIC%20%28correction%2027%20July%202022%29.pdf (accessed on 19 September 2023).
- CitiPower; Powercor; United Energy. Community Battery Trial Tariff Factsheet. February 2022. Available online: https://media.powercor.com.au/wp-content/uploads/2022/02/28084618/Community-Battery-Trial-Tariff-factsheet.pdf (accessed on 19 September 2023).
- Ausgrid. Ausgrid Battery Tariffs. February 2022. Available online: https://www.aer.gov.au/system/files/Ausgrid%20-%20Tariff%20trial%20notification%20-%202022-23_0.pdf (accessed on 19 September 2023).
- Rezaeimozafar, M.; Monaghan, R.F.D.; Barrett, E.; Duffy, M. A review of behind-the-meter energy storage systems in smart grids. Renew. Sustain. Energy Rev. 2022, 164, 112573. [Google Scholar] [CrossRef]
- Exchange Rates UK. Australian Dollar to US Dollar Spot Exchange Rates for 2022. Available online: https://www.exchangerates.org.uk/AUD-USD-spot-exchange-rates-history-2022.html (accessed on 19 September 2023).
- Essential Services Commission. Victorian Default Offer, 2023–2024. Available online: https://www.esc.vic.gov.au/electricity-and-gas/prices-tariffs-and-benchmarks/victorian-default-offer (accessed on 19 September 2023).
- Essential Services Commission. Minimum Feed-In Tariff, 2023–2024. Available online: https://www.esc.vic.gov.au/electricity-and-gas/electricity-and-gas-tariffs-and-benchmarks/minimum-feed-tariff (accessed on 19 September 2023).
- Blomgren, G.E. The development and future of lithium ion batteries. J. Electrochem. Soc. 2016, 164, A5019. [Google Scholar] [CrossRef]
- Graham, P.; Hayward, J.; Foster, J.; Havas, L. CSIRO’s GenCost 2021–22. 2022. Available online: https://www.csiro.au/-/media/News-releases/2022/GenCost-2022/GenCost2021-22Final_20220708.pdf (accessed on 19 September 2023).
- Shaw, M. Community Batteries: A Cost/Benefit Analysis. 2020. Available online: https://arena.gov.au/assets/2020/08/community-batteries-cost-benefit-analysis.pdf (accessed on 19 September 2023).
- Parliament of Australia. Discount Rates for Commonwealth Infrastructure Projects. October 2018. Available online: https://www.aph.gov.au/About_Parliament/Parliamentary_Departments/Parliamentary_Library/FlagPost/2018/October/Discount-rates (accessed on 19 September 2023).
- Victoria State Government. Solar Premium Feed-In Tariff. May 2023. Available online: https://www.energy.vic.gov.au/for-households/solar-premium-feed-in-tariff (accessed on 19 September 2023).
- Wattwatchers Digital Energy. Available online: https://wattwatchers.com.au/ (accessed on 19 September 2023).
- LG RESU 3.3 Datasheet. Available online: https://myenergygroup.com.au/wp-content/uploads/2021/07/Datasheet-RESU3.3.pdf (accessed on 19 September 2023).
- Solar Choice. Solar Battery Costs: Solar Battery Price Index. March 2023. Available online: https://www.solarchoice.net.au/solar-batteries/price/ (accessed on 19 September 2023).


| Theme | Reference(s) | Description/Remark | Associated Research Gap(s) |
|---|---|---|---|
| Techno-economic analysis using tariff structures | [20] | Studying the impact of tariff structures on neighbourhood batteries | Lack of a comprehensive cost assessment framework for BTM and FTM neighbourhood batteries. Paucity of studies focused on evaluating the role of trial battery tariffs in improving the economics of community batteries. |
| [26] | Studying the impact of tariff structures on neighbourhood batteries | ||
| [27] | Comparing different tariff structures for BTM batteries | ||
| [28] | Investigating the impact of network tariffs on the adoption of solar PV | ||
| [29] | Developing battery storage operating strategies based on time-of-use tariffs | ||
| [30] | Devising hybrid operational strategies for BTM batteries | ||
| [31] | Investigating the impacts of time-of-use and step tariffs on the performance of community batteries | ||
| [32] | Exploring the efficiency of various rule-based energy management strategies | ||
| [33] | Analysing the impact of time-of-use tariffs for reducing home energy costs | ||
| [34] | Optimising solar PV and battery coordination for minimum demand charges | ||
| [35] | Optimal sizing of the battery, minimising the costs for customers attached to time-of-use tariffs | ||
| [36,37,38,39] | Investigation of demand charges and various tariffs | ||
| [40] | Designing novel tariffs and evaluating their impacts on batteries coupled with PV | ||
| [41] | Studying the impact of time-of-use tariffs on the efficiency of community-scale batteries | ||
| [46] | Proposing an enhanced framework for reducing battery operation costs | ||
| Comparison of community-scale and household-level batteries | [47] | Comparing the economic viability of FTM and BTM batteries | Lack of tariff-level comparative economic viability studies of FTM and equivalent fleet of BTM batteries, particularly within an Australian context. Underrepresented studies on the contribution of various value streams to the economic viability of BTM and FTM batteries. |
| [48,49,50] | Economic viability assessment of community-scale batteries | ||
| [51] | Comparing economic aspects of residential and community batteries in Germany | ||
| [52] | Comparison of the economic viability of the FTM and BTM batteries in the UK | ||
| [53,54,55] | Cost reduction by optimal battery sizing for time-of-use tariffs | ||
| [56] | Developing methodologies for the operational cost reduction of battery storage systems | ||
| Business models, ownership structures, and revenue streams | [51] | Energy sharing using neighbourhood battery storage systems | Lack of stakeholder-specific guidance in community battery integration, resulting in a deficiency of tailored insights and recommendations for different stakeholders. |
| [56] | Investigating cost reduction strategies and potential revenue streams for community batteries | ||
| [59,60,61] | Developing novel energy sharing strategies for neighbourhood batteries | ||
| [62] | Review of business models and ownership structures for community batteries | ||
| [63] | Comprehensive review of business models and ownership structures for community batteries | ||
| [64,65,66,67,68] | Peer-to-peer energy trading using household-level BTM batteries | ||
| [69] | Comprehensive review of energy sharing mechanisms at the community scale |
| Network Tariff | Fixed Charge | Off Peak/Solar Soaker (Essential Energy Only) | Peak | Shoulder | Critical Times | Ref. | |||
|---|---|---|---|---|---|---|---|---|---|
| AusNet Services Standard tariff (NAST12) | 34.2658 cents per day | 10 p.m.–8 a.m. weekdays The entire weekends | 9 a.m.–9 p.m. weekdays | Not applicable | Not applicable | [72] | |||
| 4.7115 c/kWh import | 0 c/kWh export | 19.3182 c/kWh import | 0 c/kWh export | ||||||
| Essential Energy Community Battery Tariff | AUD 15.8085 per day | 9 a.m.–3 p.m. 9 p.m.–7 a.m. | 10 a.m.–2 p.m. | 5 p.m.–7 p.m. | 7 a.m.–9 a.m. 3 p.m.–4 p.m. 8 p.m.–9 p.m. | Not applicable | [73] | ||
| 2.7850 c/kWh import AUD 2.3064/kVA/month demand charge 0 c/kWh export | 0 c/kWh import or export AUD 0.65/kW/month 0 kW to 3 kW export capacity, AUD 1.45/kW/month above 3 kW | 5.0624 c/kWh import AUD 10.2257/kVA/month demand charge 10.8012 c/kWh export | 4.1956 c/kWh import AUD 9.2519/kVA/month demand charge 0 c/kWh export | ||||||
| Powercor/CitiPower/United Energy Community Battery Tariff | 45 cents per day | 10 a.m.–3 p.m. | 4 p.m.–9 p.m. | All other times | Not applicable | [74] | |||
| −1.5 c/kWh import | 0 c/kWh export | 25 c/kWh import | −1 c/kWh export | 0 c/kWh import | 0 c/kWh export | ||||
| Ausgrid Community Battery Tariff (EA962/EA963) | AUD 1.72/kW/month (Balancing charge paid to the network to make battery revenue neutral if supporting network) | Anytime (other than critical peaks) when adding load to the transformer * | Up to 10 4-h events per year | [75] | |||||
| 1.6 c/kWh import 0 c/kWh export | Peak demand 141 c/kWh import −141 c/kWh export Peak solar export −75 c/kWh import 75 c/kWh export | ||||||||
| Sources of Value | FTM Batteries | BTM Batteries | ||
|---|---|---|---|---|
| Energy Flow Direction(s) | Importance | Energy Flow Direction(s) | Importance | |
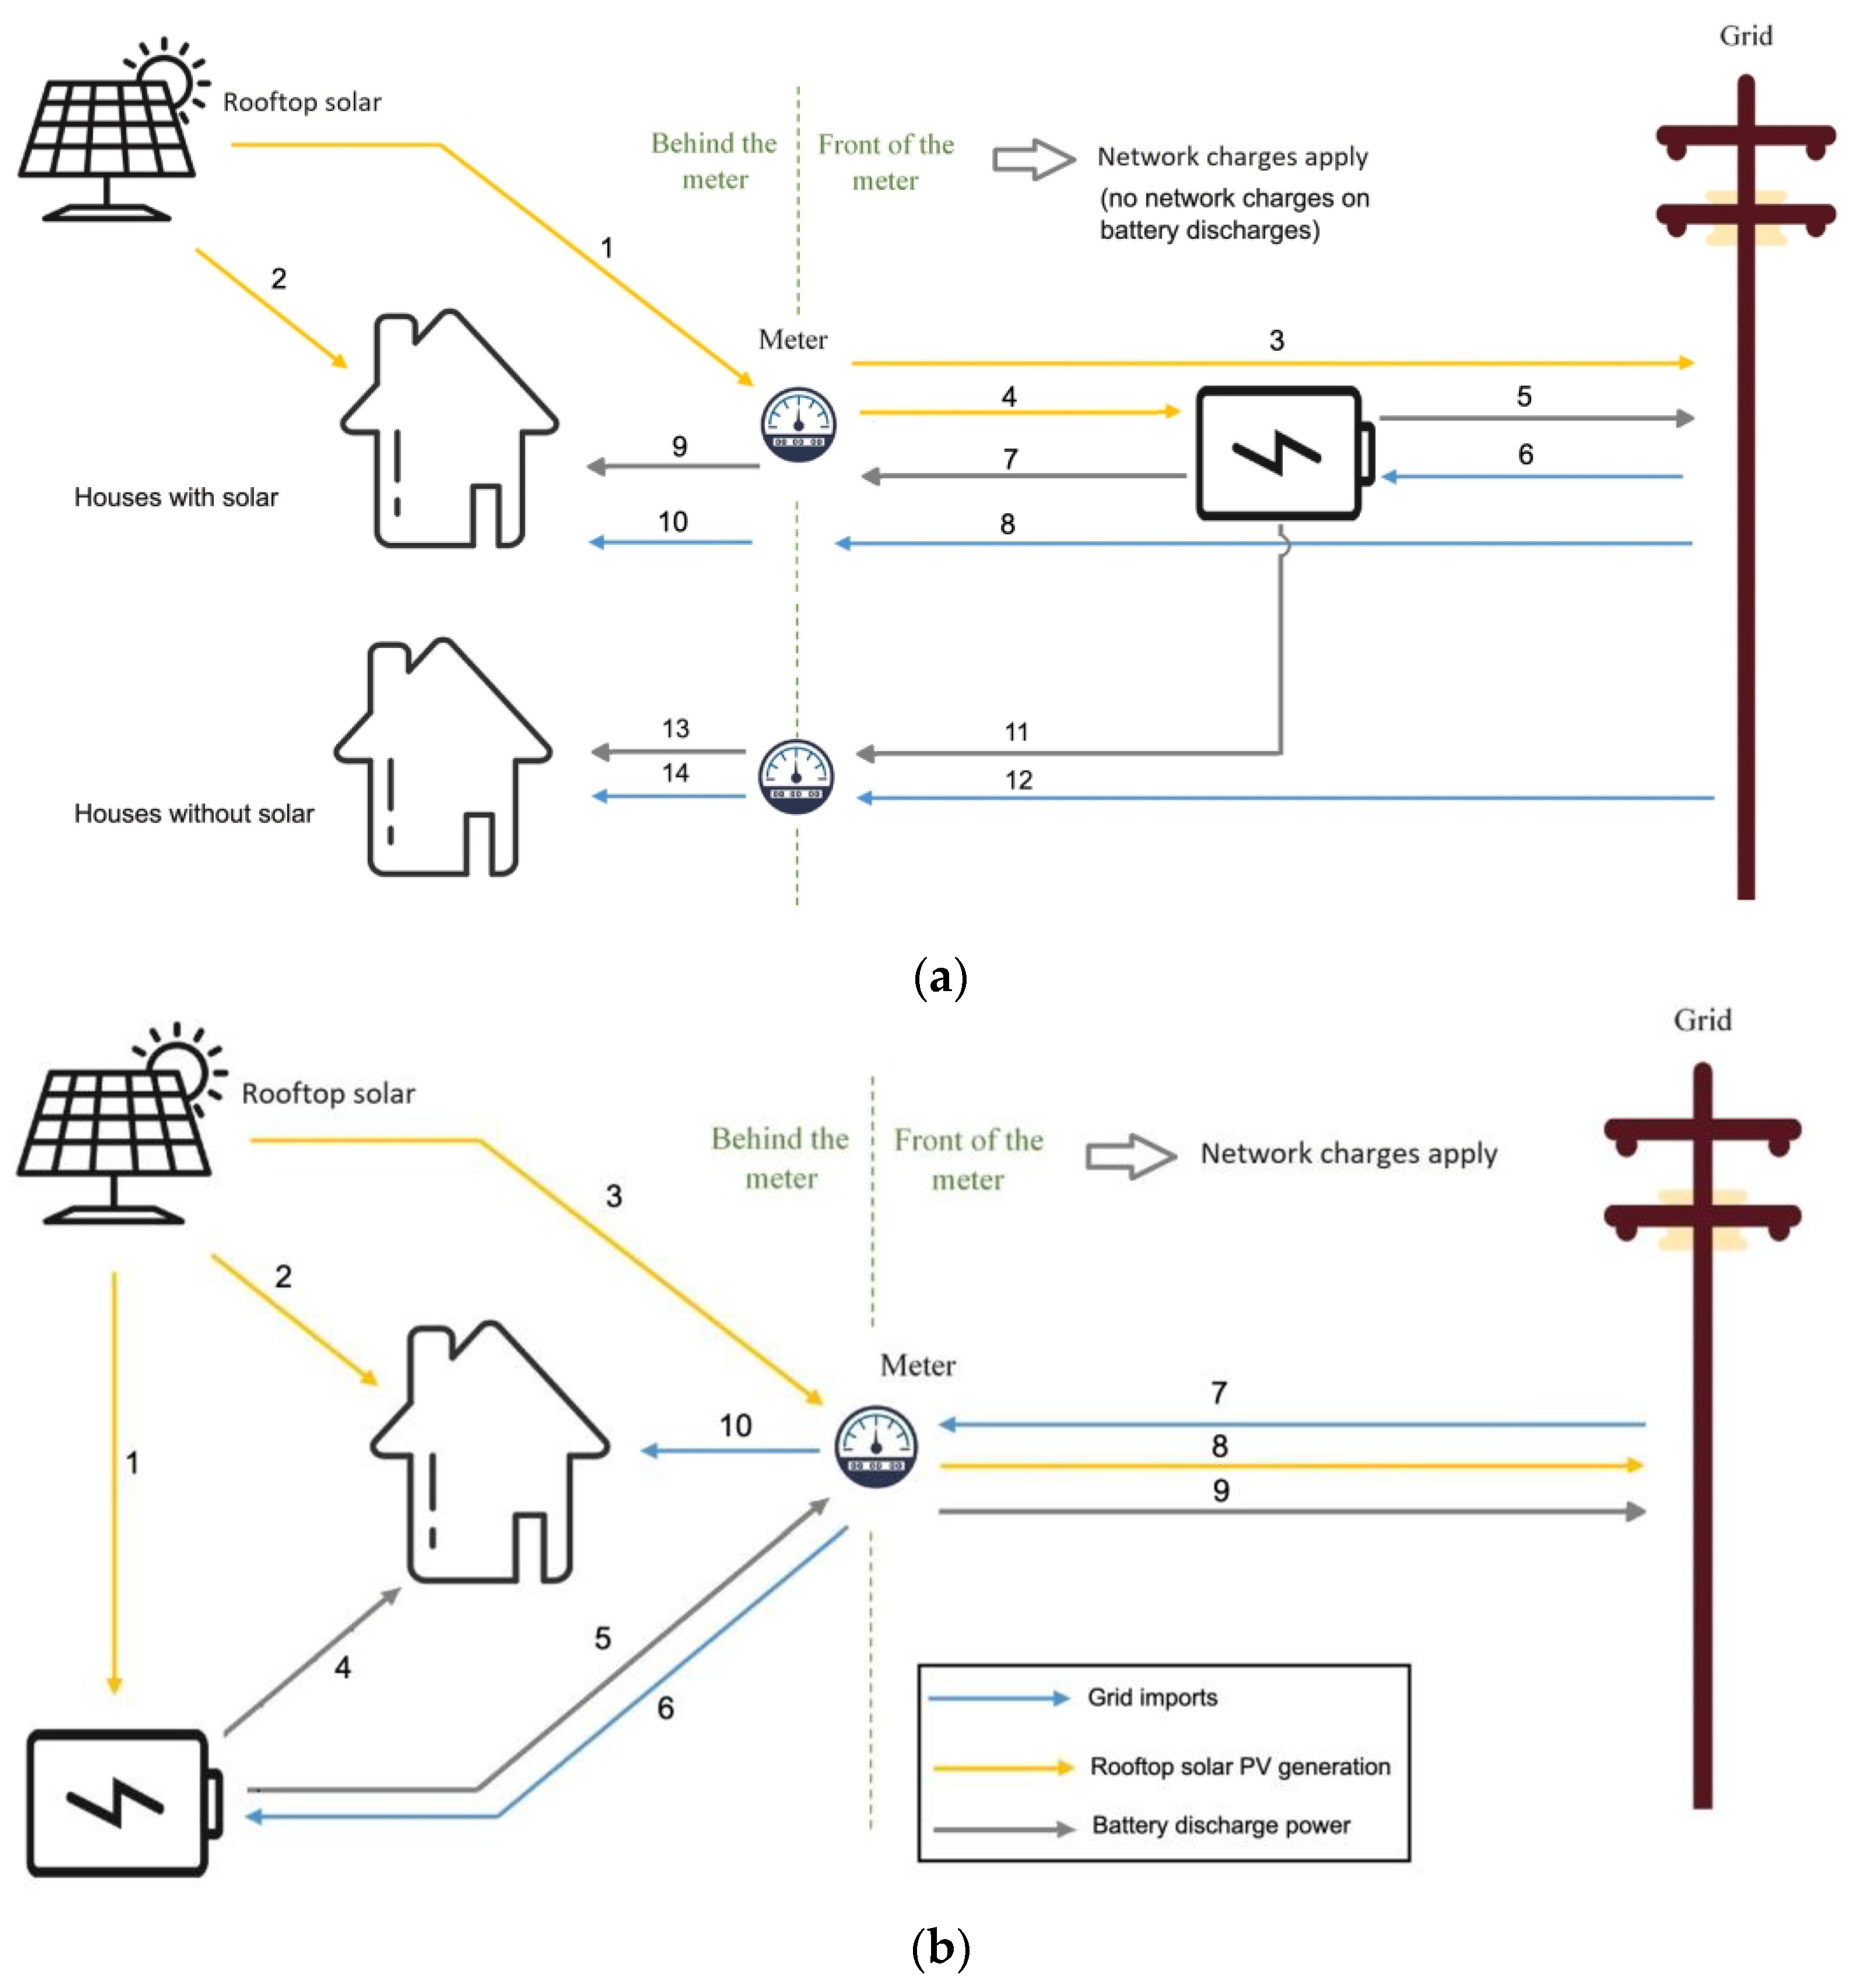
| Increased self-consumption | 1 → 4 → 7 → 9 1 → 4 → 11 → 13 | Medium (at the neighbourhood level) | 1 → 4 | High (at the customer level) |
| Arbitrage | 6 → 5 6 → 7 → 9 6 → 11 → 13 1 → 4 → 5 | High | 7 → 6 → 5 → 9 7 → 6 → 4 1 → 5 → 9 | Low |
| FCAS | 5 | High | 5 → 9 | Low |
| Parameter | Value(s) Used in Modelling | Remark | Ref. |
|---|---|---|---|
| Residential electricity tariff | Peak: 0.4081 AUD/kWh Off-peak: 0.1965 AUD/kWh Service charge: AUD 1.2994/day | Local state rates (Victorian Default Offer Rates) for the relevant electricity network provider (AusNet Services) area. | [78] |
| Network tariff (non-battery energy flow) | 3 p.m.–9 p.m. weekdays: 0.2291 AUD/kWh All other times: 0.0477 AUD/kWh Service charge: AUD 125.07/year | Enables stakeholder outcomes’ calculation for the network business and retailer. | [72] |
| Standard network tariff (battery charging energy flows) | 9 a.m.–9 p.m. weekdays: 0.1932 AUD/kWh All other times: 0.0471 AUD/kWh Service charge: AUD 125.07/year | Based on the small business time-of-use tariff (NAST12) in the local electricity network provider area. | [72] |
| Feed in tariff * | AUD 0.05/kWh | The minimum feed-in tariff set by the State Government’s economic regulator (the Essential Services Commission). | [79] |
| Battery type | Lithium ion | Currently the most available and cost-effective option. | [80] |
| Battery capacity | Power: 100 kW Energy: 200 kWh | Discharge duration = 2 h. | [81] |
| Expected lifetime (excluding battery cells) | 10 years | Includes non-battery cell components, like a power conversion system, cables, cooling systems, and other equipment. | [81] |
| Battery capital cost (initial) | AUD 305,680 | Excludes battery cell replacement; detailed components and underlying assumptions were considered. | [81] |
| Capital cost of replacing battery cells | AUD 88,768 | The discounted cost of replacement at the end of year 5, based on CSIRO’s GenCost report. | [81] |
| Battery O&M cost | AUD 16/kWh/year | Covers labour, materials, and equipment required to operate the system. | [82] |
| Battery round-trip efficiency | 90% | Represents the ratio of energy output to input during a full charge–discharge cycle. | [81] |
| Depth of discharge (DoD) | 95% | Refers to the percentage of a battery’s capacity that has been discharged relative to its maximum capacity. | |
| Battery throughput cost | 1 c/kWh | Assumes the retailer applies a surcharge of 1 c/kWh on battery throughput. | |
| FCAS market exposure | 100% | The battery can offer all available electricity capacity for providing FCAS services in the market. | |
| Time period of original data | One year from July 2021 to June 2022 with hourly resolution | National Metering Identifier (NMI) data obtained from the local electricity network provider. | |
| Project lifetime/planning horizon | 10 years | January 2024 to December 2033. | |
| Discount rate | 4% | The recommended discount rate for Australian Government infrastructure projects. | [83] |
| Parameter | Value(s) Used in Modelling | Remark | Ref. |
|---|---|---|---|
| Residential electricity tariff (including battery) | Peak: 0.4081 AUD/kWh Off-peak: 0.1965 AUD/kWh Controlled: 0.1962 AUD/kWh Service charge: AUD 1.2994/day | Local state rates (Victorian Default Offer Rates) for the relevant electricity network provider (AusNet Services) area. | [78] |
| Network tariff (including battery) | 3 p.m.–9 p.m. weekdays: 0.2291 AUD/kWh All other times: 0.0477 AUD/kWh Service charge: AUD125.07/year | Enables calculation of stakeholder outcomes to include network business and retailer. | [72] |
| Feed in tariff * | 0.05 AUD/kWh | The minimum feed-in tariff set by the State Government’s economic regulator (the Essential Services Commission). | [79] |
| Battery type | Lithium ion | Selected for availability and cost-effectiveness. | [80] |
| Battery capacity | Power: 3 kW Energy: 3.3 kWh (2.9 kWh usable) | Discharge duration = 1 h. | [86] |
| Expected lifetime | 10 years | Proven safety and 10 years warranty. | [86] |
| Battery capital cost | AUD 1500/kWh | Includes an additional inverter for managing the battery bank in a DC-coupled configuration. | [87] |
| Capital cost of replacing battery cells | N/A | The battery’s throughput over 10 years does not necessitate replacement costs. | [86] |
| Battery O&M cost | N/A | No O&M costs are considered for household-level BTM batteries. | |
| Battery round-trip efficiency | 90% | The ratio of energy output to energy input during a full charge–discharge cycle. | [86] |
| Depth of discharge (DoD) | 95% | Refers to the percentage of a battery’s capacity that has been discharged relative to its maximum capacity. | |
| FCAS market exposure | 100% | The battery can offer all available electricity capacity for FCAS services in the market, not just energy sales. | |
| FCAS revenue allocation | Customer’s share of FCAS revenues = 50% Retailer’s share of FCAS revenues = 50% | The total FCAS revenues are equally shared between the retailer and customers. The retailer acts as an aggregator and facilitates access to the FCAS market, retaining 50% of the revenues and passing the rest to end-consumers. | |
| Time period of the original data used | One year from July 2021 to June 2022 with hourly resolution | Typical load and solar PV generation profiles derived from energy usage patterns of local households. | [71] |
| Project lifetime/planning horizon | 10 years | January 2024 to December 2033. | |
| Discount rate | 4% | The recommended discount rate for Australian Government infrastructure projects. | [83] |
Disclaimer/Publisher’s Note: The statements, opinions and data contained in all publications are solely those of the individual author(s) and contributor(s) and not of MDPI and/or the editor(s). MDPI and/or the editor(s) disclaim responsibility for any injury to people or property resulting from any ideas, methods, instructions or products referred to in the content. |
© 2023 by the authors. Licensee MDPI, Basel, Switzerland. This article is an open access article distributed under the terms and conditions of the Creative Commons Attribution (CC BY) license (https://creativecommons.org/licenses/by/4.0/).
Share and Cite
Mohseni, S.; Rutovitz, J.; Smith, H.; Dwyer, S.; Tahir, F. Economic Viability Assessment of Neighbourhood versus Residential Batteries: Insights from an Australian Case Study. Sustainability 2023, 15, 16331. https://doi.org/10.3390/su152316331
Mohseni S, Rutovitz J, Smith H, Dwyer S, Tahir F. Economic Viability Assessment of Neighbourhood versus Residential Batteries: Insights from an Australian Case Study. Sustainability. 2023; 15(23):16331. https://doi.org/10.3390/su152316331
Chicago/Turabian StyleMohseni, Soheil, Jay Rutovitz, Heather Smith, Scott Dwyer, and Farzan Tahir. 2023. "Economic Viability Assessment of Neighbourhood versus Residential Batteries: Insights from an Australian Case Study" Sustainability 15, no. 23: 16331. https://doi.org/10.3390/su152316331
APA StyleMohseni, S., Rutovitz, J., Smith, H., Dwyer, S., & Tahir, F. (2023). Economic Viability Assessment of Neighbourhood versus Residential Batteries: Insights from an Australian Case Study. Sustainability, 15(23), 16331. https://doi.org/10.3390/su152316331