1. Introduction
Industrialization has led to huge greenhouse gas emissions, of which carbon emission is a major problem [
1]. Economic globalization and increasing urbanization have also further contributed to the growth of global carbon emissions [
2,
3,
4,
5]. To protect the ecological environment, governments around the world have introduced a series of policies to curb the rapid growth of carbon emissions, among which the emission trading scheme (ETS) is widely recognized [
6]. The concept of emission trading was first proposed by Dales in 1968 [
7]. The ETS is a government-managed market mechanism that controls commercial behavior through economic means to achieve sustainable development goals [
8]. Under this policy, governments set a cap on pollution emissions for each firm in a certain period. The firms with emissions exceeding the quotas are required to purchase emission rights while allowing them to sell the remaining quotas in the carbon market to earn profits [
9]. The ETS has been regarded as the most promising tool to reduce greenhouse gas emissions worldwide due to its flexibility, effectiveness, and cost-saving nature [
10,
11,
12,
13]. Since the launch of the European Union Emissions Trading Scheme (EU ETS) in 2005, a total of 28 ETS markets or pilots with their characteristics have been established all over the world [
14]. According to the induced innovation theory, some evidence suggests that ETS policy can not only reduce emissions but also promote green technology innovation for firms [
15,
16].
It is worth noting that the high costs of abatement R&D lead to a lack of innovation initiative among firms [
17]. That is, the firms are concerned that the benefits of green innovation cannot compensate for the cost of investment. However, Porter takes a different view and argues that reasonable environmental regulation can stimulate green technology innovation to offset the additional environmental costs to firms. This is known as the Porter hypothesis [
18,
19]. Controlling pollution emissions cannot solve the problem at its core; green technology innovation is the fundamental approach and also an effective measure for firms to achieve long-term emissions-related cost reduction [
20,
21,
22]. There has been a lot of research exploring the impact factors such as green finance, market incentive policies, and international technology spillover rates on green technology innovation [
23,
24,
25,
26,
27]. Some studies also show that cloud computing technology and big data management algorithms can promote green finance and promote green technology innovation in firms [
28,
29,
30]. Among existing research, how environmental policies, especially ETS, affect the green technology innovation efforts of firms is currently a research hot spot [
31,
32,
33].
In fact, the green technology innovation of firms includes two models: cleaner production and end-of-pipe technology innovation [
34,
35]. Cleaner production means adopting advanced equipment and processes, which makes the production process itself less impactful on the environment [
36]. End-of-pipe technology means to implement effective treatment technologies to reduce the emissions generated at the end of the production process [
36]. Existing research has extensively discussed which of the two green technology innovation models the firms will choose [
34,
37,
38]. In fact, the purpose of ETS policy is not to reduce production by increasing costs to firms, but to promote green technology innovation [
39]. However, to our knowledge, none of the previous studies considered what the optimal green technology innovation model is for both firms and governments under ETS policy, as well as the differences in the benefits these choices bring to the environment and society. Whether for firms or governments, this is very important and worth exploring. Moreover, the policies are not always implemented separately in real life, while relevant studies often discuss the effects of a certain policy, neglecting the coupling effects of multiple policies on the choices of green technology innovation models.
To bridge the research gaps, this work tries to answer the following questions:
- (1)
What is the inventive ETS policy for abatement R&D investment of firms under the different green technology innovation models?
- (2)
How do the ETS policy and the most widely used emission tax (ET) policy affect the supply of emission rights of firms under different green technologies?
- (3)
Which model of green technology innovation is optimal from the perspective of firms or governments, and are they consistent?
To answer these questions and fill the theoretical gap, this paper builds a two-stage game model under the ETS policy. Different from the traditional linear method, it is a suitable method for studying complex firms’ decision-making problems and has been used in the research of green technology innovation [
40]. In this paper, the two-stage game model covers both the stages of firms determining the optimal abatement R&D level and the production competition. Based on this method, we investigate the pollutant abatement R&D, the environmental and economic performance of firms adopting cleaner production, and the end-of-pipe technology innovation models. Furthermore, we analyze the impact of ETS on the optimal green technology innovation model for firms and governments by using numerical simulation. In addition, this paper also identifies the difference between ETS and ET in the choice of green technology innovation model of firms.
The rest of the article is organized as follows:
Section 2 presents the related literature.
Section 3 lays out the basic model.
Section 4 presents the model construction and solution.
Section 5 is the analysis of the difference between the environmental and economic performance of firms under different green technology innovation models.
Section 6 sets forth the conclusions and offers directions for future research.
2. Literature Review
This paper brings together two streams of literature: (1) emission trading and green technology innovation investment; and (2) the choice of green technology innovation models. Next, this section briefly reviews the previous research and highlights our contributions to each stream.
2.1. Emission Trading and Green Technology Innovation Investment
The first stream of literature involves the relationship between emission trading and firm green technology innovation investment. Requate and Unold (2001, 2003) show that under the premise that firms are relatively short-sighted, emission trading policy cannot significantly improve the investment level of green emission reduction technology compared with emission tax [
41,
42]. Villegas-Palacio and Coria (2010) explored the impact of emission tax and studied the influencing factors of tradable emission permit price. The results show that the incentive effect of emission trading on innovation investment is better than that of emission tax [
43]. Drake et al. (2016) researched the impact of different emissions regulations (emissions cap-and-trade and emissions tax) on capacity decisions and green technology investment. They found that when firms have a combination of clean and dirty technologies, the production subsidies for high investment and production cost technologies have no impact on the optimal total capacity of firms. However, the investment subsidies for the technologies increase the total capacity of firms and conditionally increase the expected emissions [
44]. Turken et al. (2020) studied the impact of environmental regulations (including emissions taxes, command and control, and emissions permit trading) on strategic supply chain decisions regarding end-of-pipe and green technology. Their findings show that if the variable emissions tax, emissions penalty, or emissions price is nonzero, firms invest in the best available green abatement technology; if one of them is more than the per-unit cost of end-of-pipe technology, firms should invest in the end-of-pipe technology emissions reductions. The study shows that when intertemporal emission trading is allowed or not allowed, compared with the conclusion obtained from the net present value method, the uncertainty of emission trading price will delay the investment of green technology innovation [
35]. Li et al. (2022) constructed a Difference-in-Difference model and found that, in China, the green total factor productivity in ETS pilot cities increased by 11.4% on average compared with non-pilot cities [
45]. Based on energy-related green patent applications in 283 Chinese cities from 2003 to 2018, Sun et al. (2023) found that ETS policy has reduced green technology innovation to a certain extent, due to the higher environmental regulation compliance costs [
46]. Xu et al. (2023) explored the asymmetric effects of heterogeneous environmental standards on green technology innovation. The results indicate that cleaner production standards can greatly facilitate green technology innovation. However, pollution emission standards have a significant dampening effect on innovation [
24].
2.2. The Choice of Green Technology Innovation Models
Another stream involves the choice of green technology innovation models. Frondel et al. (2007) divided green technology innovation models into two categories, cleaner production and end-of-pipe technologies, and analyzed the choices of two models in OECD countries through empirical studies. The results showed that more countries tend to choose the former model [
34]. Through the empirical research of SMEs in 27 OECD countries, Triguero et al. (2013) found that the best model to adopt depends on many factors such as supply, demand, and environmental regulation [
47]. Further research by Triguero et al. (2015) showed that in the decision-making of adopting cleaner production technology, subsidies play a key role in small enterprises, while environmental regulation plays a key role in medium-sized enterprises [
48]. Mantovani et al. (2017) found that the interplay between the market competition, the level of consumers’ income disparity, and their degree of environmental concern plays a key role in the technological model choice of the green producer [
37]. Shen et al. (2020) researched the relationship between environmental policy instruments and green innovation based on the data of 30 provinces in China. They found that environmental policy instruments have a positive effect on green product innovation and end-of-pipe technology innovation [
49]. Garcia-Quevedo et al. (2022) carried out an empirical analysis and found that policy instruments drive the adoption of green innovation more than organizational capabilities. Moreover, tax incentives seem to mostly foster cleaner production technologies, while subsidies are used to finance all types of eco-innovations [
50]. Fang et al. (2023) divided environmental governance into cleaner production performance and end-of-pipe treatment performance and then analyzed how green finance affects firms [
23]. However, they still have not explored how firms choose green technology innovation.
2.3. Research Gaps
In summary, in the first stream, the existing research mostly focuses on the differences between emission trading and other environmental regulations (such as taxes, subsidies, and environmental standards) in promoting firms’ green technology innovation investment. However, these results have not clarified the promotion effect of ETS on different green technology innovation models. Moreover, in real life, multiple policies are often implemented simultaneously, but most of the scholars considered different policies separately, and research on the effects of combined policies is relatively scarce. In the second stream, the existing research mainly investigated the choice of green technology innovation models of firms from two aspects theory and experience. It is worth noting that the different green technology innovation models chosen by firms bring different environmental performances and social welfare, which are also of concern to governments. However, most of the scholars only focused on firms and overlooked which model is optimal for governments as well as whether the choices of the two agents are consistent. The exploration of this issue helps guide the decision making of firms to achieve win–win outcomes for multiple agents. In addition, although most scholars are aware of the important role of ETS in promoting green technology innovation, no further research on the differences and optimal choices of different innovation models for both firms and governments under the ETS policy.
To bridge these research gaps, this paper constructs a two-stage game model under the ETS policy and the ET policy to investigate the pollutant abatement R&D, and environmental and economic performance of firms adopting cleaner production and end-of-pipe technology innovation models. Then, through numerical simulation, the impact of ETS policy on the optimal choices of green technology innovation models for firms and governments is further analyzed, as well as the differences between ETS policy and ET policy on firms’ green technology innovation model choices. Our study develops and deepens the theory related to ETS, ET, and green technology innovation. It also provides theoretical support for governments to guide the decision making of firms to promote sustainable production.
3. The Basic Model
The Cournot duopoly game can reflect the monopolistic control of two firms over the market, where two firms supply homogeneous goods and maximize their respective profits by selecting appropriate production strategies [
51]. This method can eliminate the interference of heterogeneous firms, making the conclusions universal and easy to generalize to scenarios with more oligarchs, and has been widely used in complex agents’ decision-making problems [
52,
53]. Consider a Cournot duopoly industry consisting of two firms that produce homogeneous products. The modeling assumptions are presented below, and the remainder of the paper uses the following notations as defined in
Table 1.
Assumption 1. These two firms have a linear demand function: , where is the market capacity, is the firm’s output, respectively, is the price of the product, and the cost of production is [52]. Assumption 2. The emission intensity of firm is represented by , which means one unit of production of firm discharges units of pollution. In order to improve environmental quality, governments levy an emission tax on the unit production of firms. The emission tax is an exogenous factor.
Assumption 3. The firms can reduce pollution emissions by investing in green technology innovation, thereby reducing the tax burden. Green technology can be divided into cleaner production and end-of-pipe technologies [12,34,37,38]. Cleaner production technology increases product output by reducing the amount of pollutant emissions, whereas end-of-pipe technology reduces pollution control costs while product output and the amount of pollutant emissions remain unchanged [36]. Referring to [54,55], the R&D cost of cleaner production and end-of-pipe technologies for firm are and , respectively, where γ (γ > 0) is the inverse measure of R&D efficiency, and and are the R&D investment level of cleaner production and end-of-pipe technology for firm . Assumption 4. Referring to [56], the relationship between pollutant emissions, production, and R&D under cleaner production technology can be expressed as and the relationship under end-of-pipe technology can be expressed as , where is the pollution emission coefficient, is the technology spillover rate, and and indicate the effective R&D level. Assumption 5. Pollutant emissions can cause damage to the environment. Without losing generality, as in [55], the pollution damage function is given by , where is the pollution damage coefficient. Assumption 6. Suppose there is a perfectly competitive emission trading market: the firms can buy emission rights to reduce pollution costs or sell emission rights to gain revenues. The emission rights for the entire region are , and each firm receives an initial emission right of , where . The initial allocation price is ; when , it means paid distribution, whereas when , it means free distribution. The emission trading price is .
Hence, the profit function of firm
that uses cleaner production technology is:
The profit function of firm
that uses end-of-pipe technology is:
Based on the previous assumptions, as in [
57], the social welfare function includes consumer surplus, firms’ profits, emission tax, revenues from the sale of initial emission rights, and pollution damage, which can be defined as follows:
where
CS denotes the consumer surplus and
.
Based on the above model, the following two-stage game is considered. In the first stage, under a given emission tax and emission trading price, each firm determines the abatement R&D level to maximize profit. In the second stage, the two firms compete for output to maximize their own profits. The equilibrium solutions of the game are solved by the backward induction method.
Section 4 derives equilibrium solutions under the cleaner production technology model and end-of-pipe technology model.
4. Equilibrium Analysis
This section constructs pollution abatement game models of firms under two green technology innovation models and gives the corresponding levels of abatement R&D investment, supply of emission rights, economic profit, and social welfare. The superscripts “” and “” are used to represent the cleaner production technology and end-of-pipe technology, respectively.
4.1. Cleaner Production Technology Model
In the second stage, the firm determines output to maximize its own profit:
Solving the first-order condition, we obtain:
Combining with the symmetric Nash equilibrium
, we obtain the optimal output:
where
denotes the level of output under cleaner production technology. Substituting Equation (6) into Equation (1), the profit of the firm becomes:
In the first stage, the firm determines the R&D level to maximize profit:
Solving the first-order condition, we obtain:
Combining the symmetric Nash equilibrium conditions, we obtain the optimal R&D investment level . Substituting into Equation (6), we obtain the equilibrium output level of the cleaner production technology model. Substituting and into Equations (1) and (3), we obtain the following results.
Proposition 1. The equilibrium outcomes in the cleaner production technology model are: To make Equations (10) and (11) meaningful, assume that when , ; when , . At this point, the greater , the technology spillover rate, the higher the R&D level.
Corollary 1. (i) ; (ii) ; (iii) ; (iv) ; (v) .
Corollary 1 indicates that the equilibrium R&D investment level increases with emission trading price, emission tax, and technology spillover rate and decreases with pollution emission coefficient and the inverse measure of R&D efficiency. The emission trading policy and emission tax policy will make the firm using cleaner production technology invest more in R&D, resulting in higher levels of R&D.
Corollary 2. (i) When and , ; When and , or and , ; (ii) When and , ; When and , or and , ; (iii) ; (iv) ; (v) .
Corollary 2 indicates that when the technology spillover rate is sufficiently high, the equilibrium output level increases with the emission trading price or emission tax, and otherwise decreases with them. The equilibrium output level increases with the technology spillover rate and decreases with pollution emission coefficient and the inverse measure of R&D efficiency.
4.2. End-of-Pipe Technology Model
In the second stage, the firm determines output to maximize its own profit:
By solving the first-order condition, the optimal output
can be obtained. Substituting
into Equation (2), the profit of the firm becomes:
In the first stage, the firm determines the R&D investment level to maximize profit:
Solving the first-order condition, the following results can be obtained.
Proposition 2. The equilibrium outcomes in the end-of-pipe technology model are: Corollary 3. (i) ; (ii) ; (iii) .
Corollary 3 indicates that under this model, the level of abatement R&D investment does not affect the level of output, whereas an increase in the emission trading price, emission tax, or pollution emission coefficient reduces firms’ output. In addition, compared to the cleaner production technology model, only when the technology spillover rate is sufficiently high will the emission trading price have a positive impact on output under the end-of-pipe technology model.
Corollary 4. (i) ; (ii) ; (iii) .
Corollary 4 indicates that under the end-of-pipe technology model, the abatement R&D investment level is positively related to the emission trading price and the emission tax. That is, the higher the emission trading price and the emission tax, the more R&D investment is required. In addition, the abatement R&D level is inversely related to the R&D efficiency. That is, the higher the R&D efficiency, the less the R&D investment is required for one unit of pollution abatement. At this time, the level of R&D investment is not related to the industrial technology spillover rate. In this case, there is inevitably a duplication of R&D investment, which is the motivation for firms to cooperate. The above results are significantly different from those under the cleaner production technology model. Under the clean production technology model, the level of R&D investment is positively correlated with the technology spillover rate. Therefore, under the cleaner production technology model, governments should subsidize the cleaner production technology R&D activities of firms to prevent free riders from leading to market failure.
5. Comparison of Results
Based on the results of the previous section, this section compares the variation in abatement R&D investment levels, emission rights supply, profits, and social welfare levels under emission trading policy and different green technology innovation models. Then, the optimal choices of green technology innovation models for firms and governments, as well as the differences between them, are presented. We further analyze the variations in the impact of emission trading policy and emission tax policy on different green technology innovation models.
5.1. Abatement R&D Investment
From Equations (10) and (19), we obtain:
From Equation (23), when , ; when , . The above conclusion implies that when the emission trading price is low, the level of abatement R&D investment under cleaner production technology is higher than that under end-of-pipe technology. It means that emission trading has a greater incentive effect on the R&D investment under cleaner production technology. On the contrary, when the emission trading price is high, emission trading has a greater incentive effect on the R&D investment under end-of-pipe technology. When , emission trading has the same incentive effect on different green technology innovation models, and the critical emission trading price keeps decreasing with the increase in emission tax. The reason for the above conclusions is that in order to reduce emissions, firms using cleaner production technology need to research and develop new technologies to reform the production process, resulting in higher investment and costs in abatement R&D. Therefore, the higher the emission trading price, the less revenue firms using cleaner production technology can earn from emission trading, and the lower the motivation for R&D investment. The above analysis is summarized as Observation 1.
Observation 1. When the emission trading price is low, the emission trading policy has a greater incentive effect on the R&D investment of firms using cleaner production technology. On the contrary, when the emission trading price is high, the emission trading policy has a greater incentive effect on the R&D investment of firms using end-of-pipe technology.
5.2. The Supply of Emission Rights
When adopting advanced green pollution abatement technologies, firms can supply more emission rights indicators to the market and become a seller in the market. Therefore, this section analyzes the difference in the supply of emission rights when firms become sellers in the market under different green technology innovation models. When the emission firm is the seller, the supply of emission rights under the pollution control of cleaner production technology is
, and the supply of emission rights under the pollution control of end-of-pipe technology is
. It can be observed that regardless of the green technology innovation model, as the initial allocation of emission rights
decreases, the number of emission rights indicators that emission firms can provide decreases. As the level of R&D investment increases, the supply of emission rights indicators increases. Because
involves nonlinearity, this section conducts numerical simulations to analyze the supply of emission rights under different green technology innovation models. Referring to [
54,
55,
56], the benchmark parameters are set as
, and the range of emission trading prices
is
. The result is shown in
Figure 1.
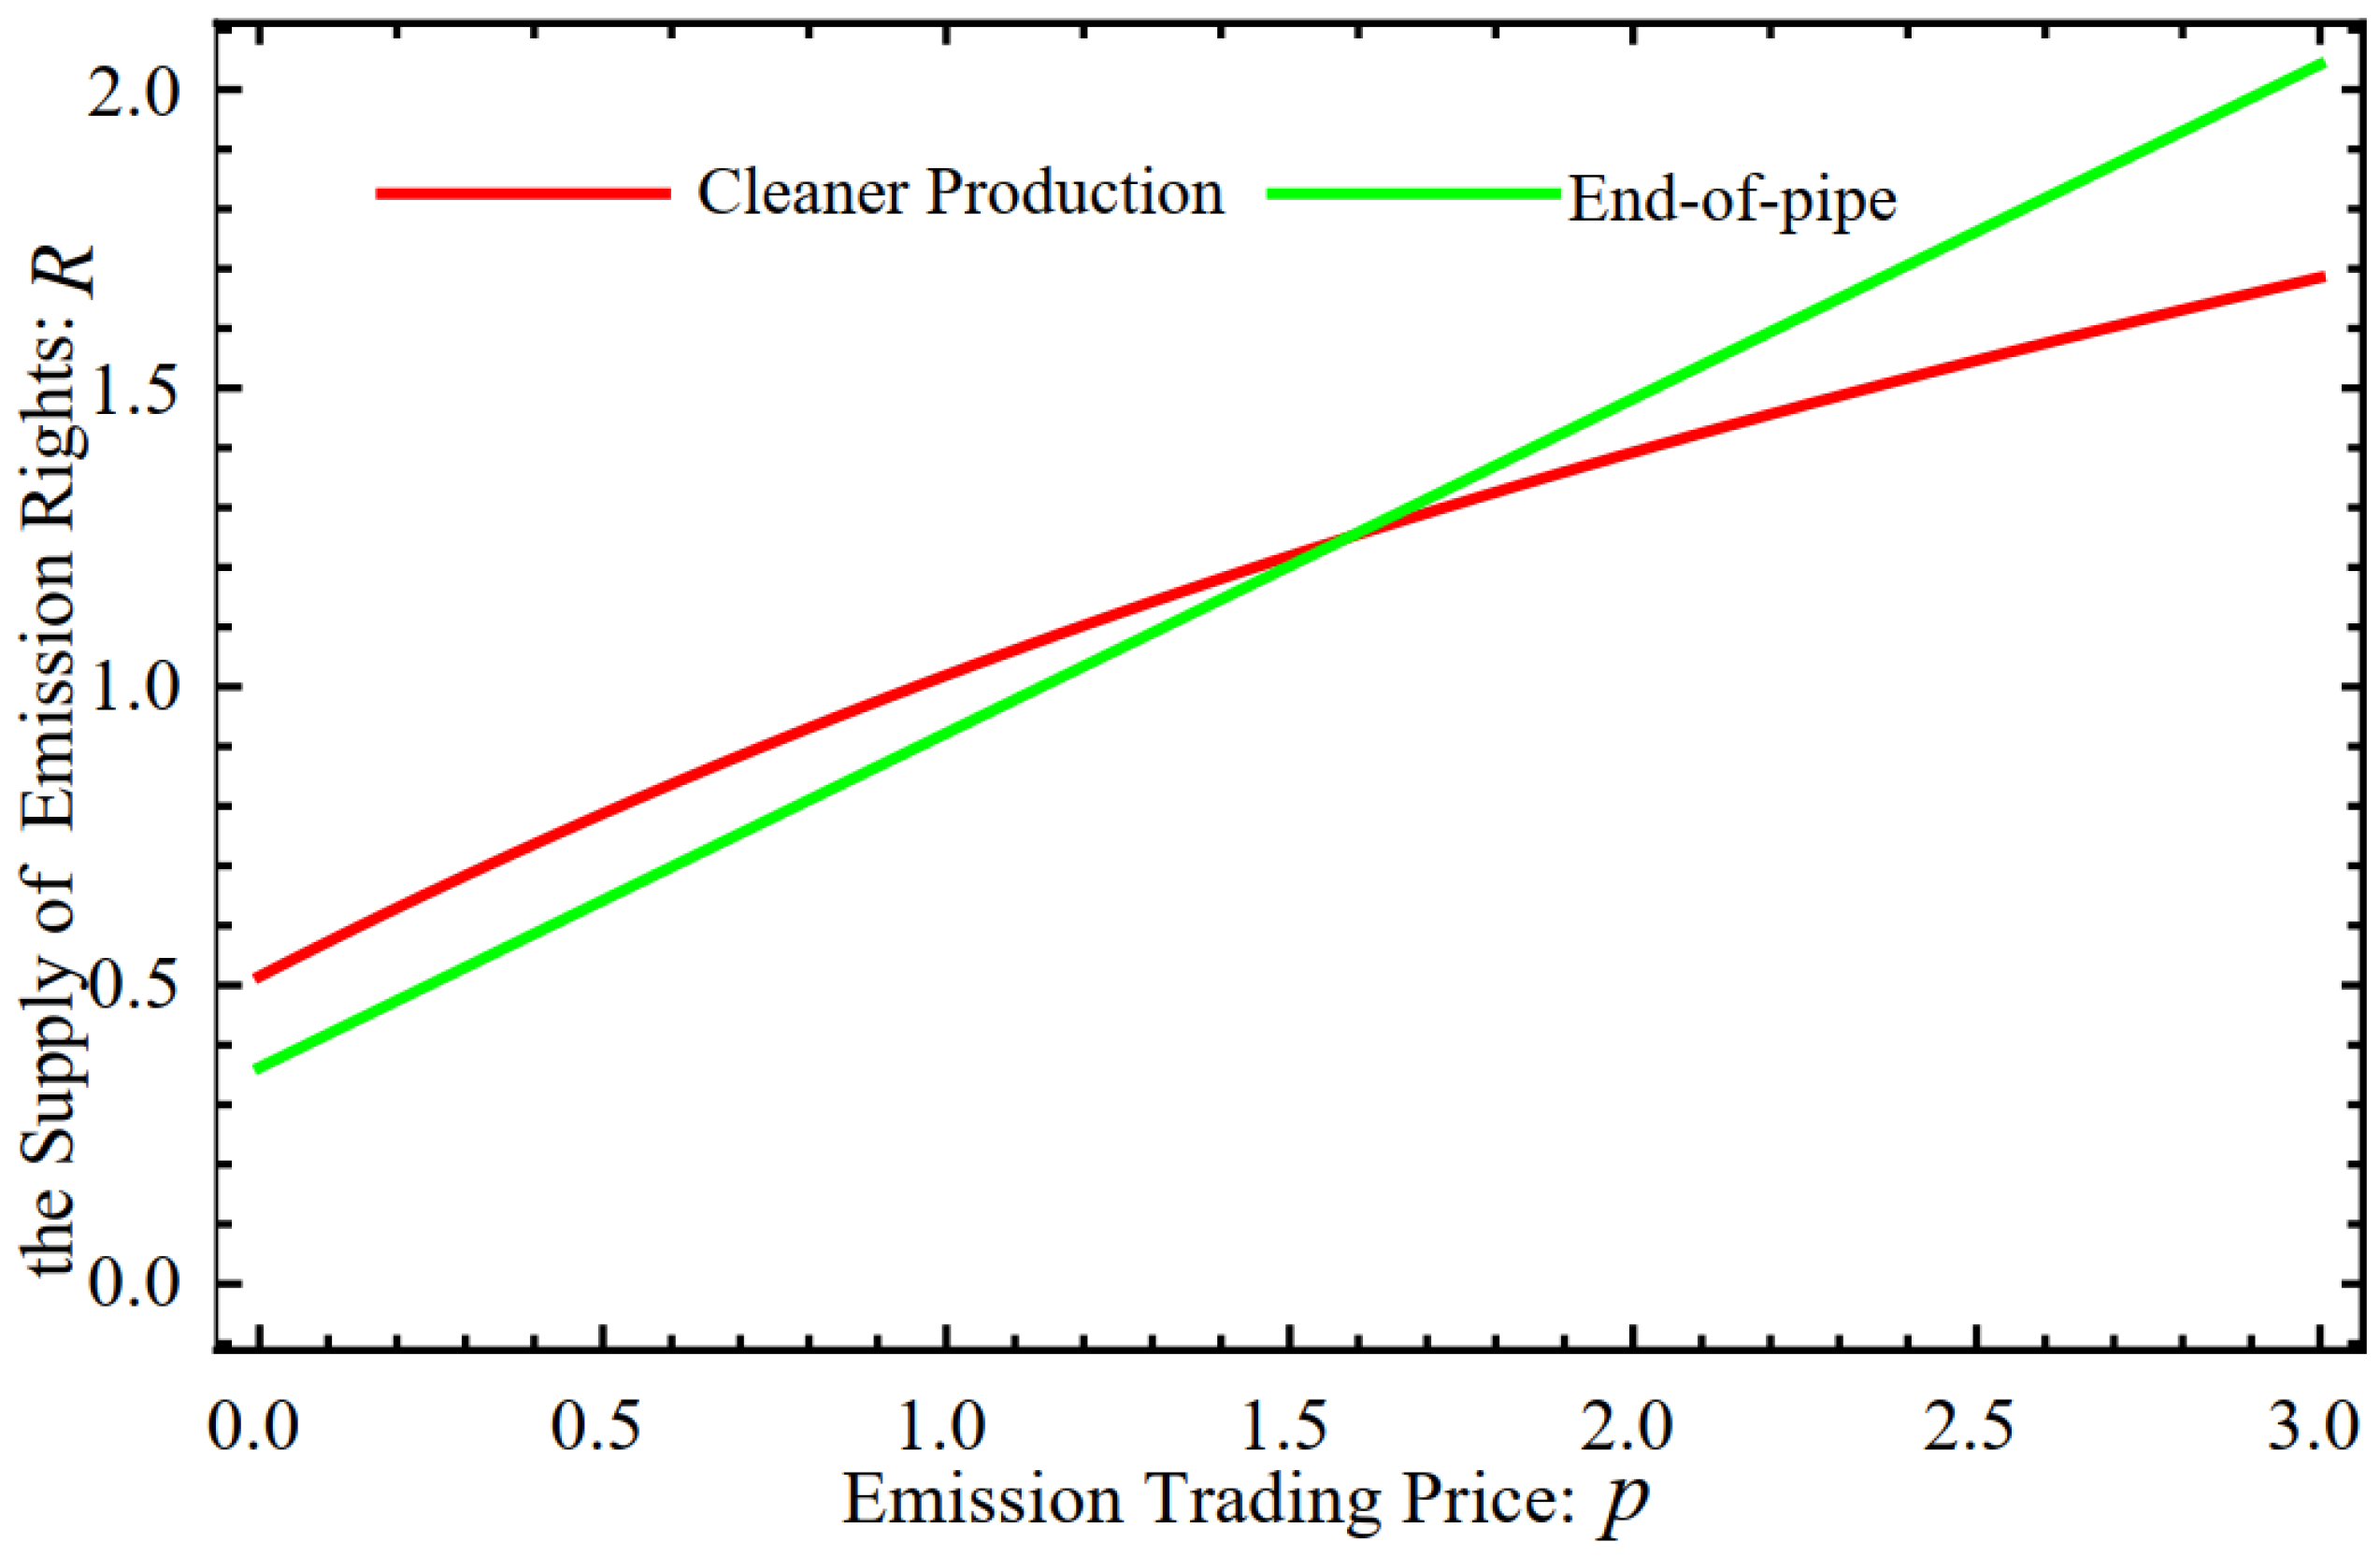
As shown in
Figure 1, as emission trading price increases, the supply of emission rights will also increase. The supply relationship of emission rights under different green technology innovation models is as follows. When
, the supply of emission rights under end-of-pipe technology is less than that under cleaner production technology; when
, the supply of emission rights under end-of-pipe technology is more than that under cleaner production technology. The explanation for the above conclusion is that when the emission trading price is low, firms using cleaner production technology gains more revenue from emission trading and has more motivation for R&D investment. On the contrary, when the emission trading price is high, firms using cleaner production technology gains less revenue from emission trading and has less motivation for R&D investment.
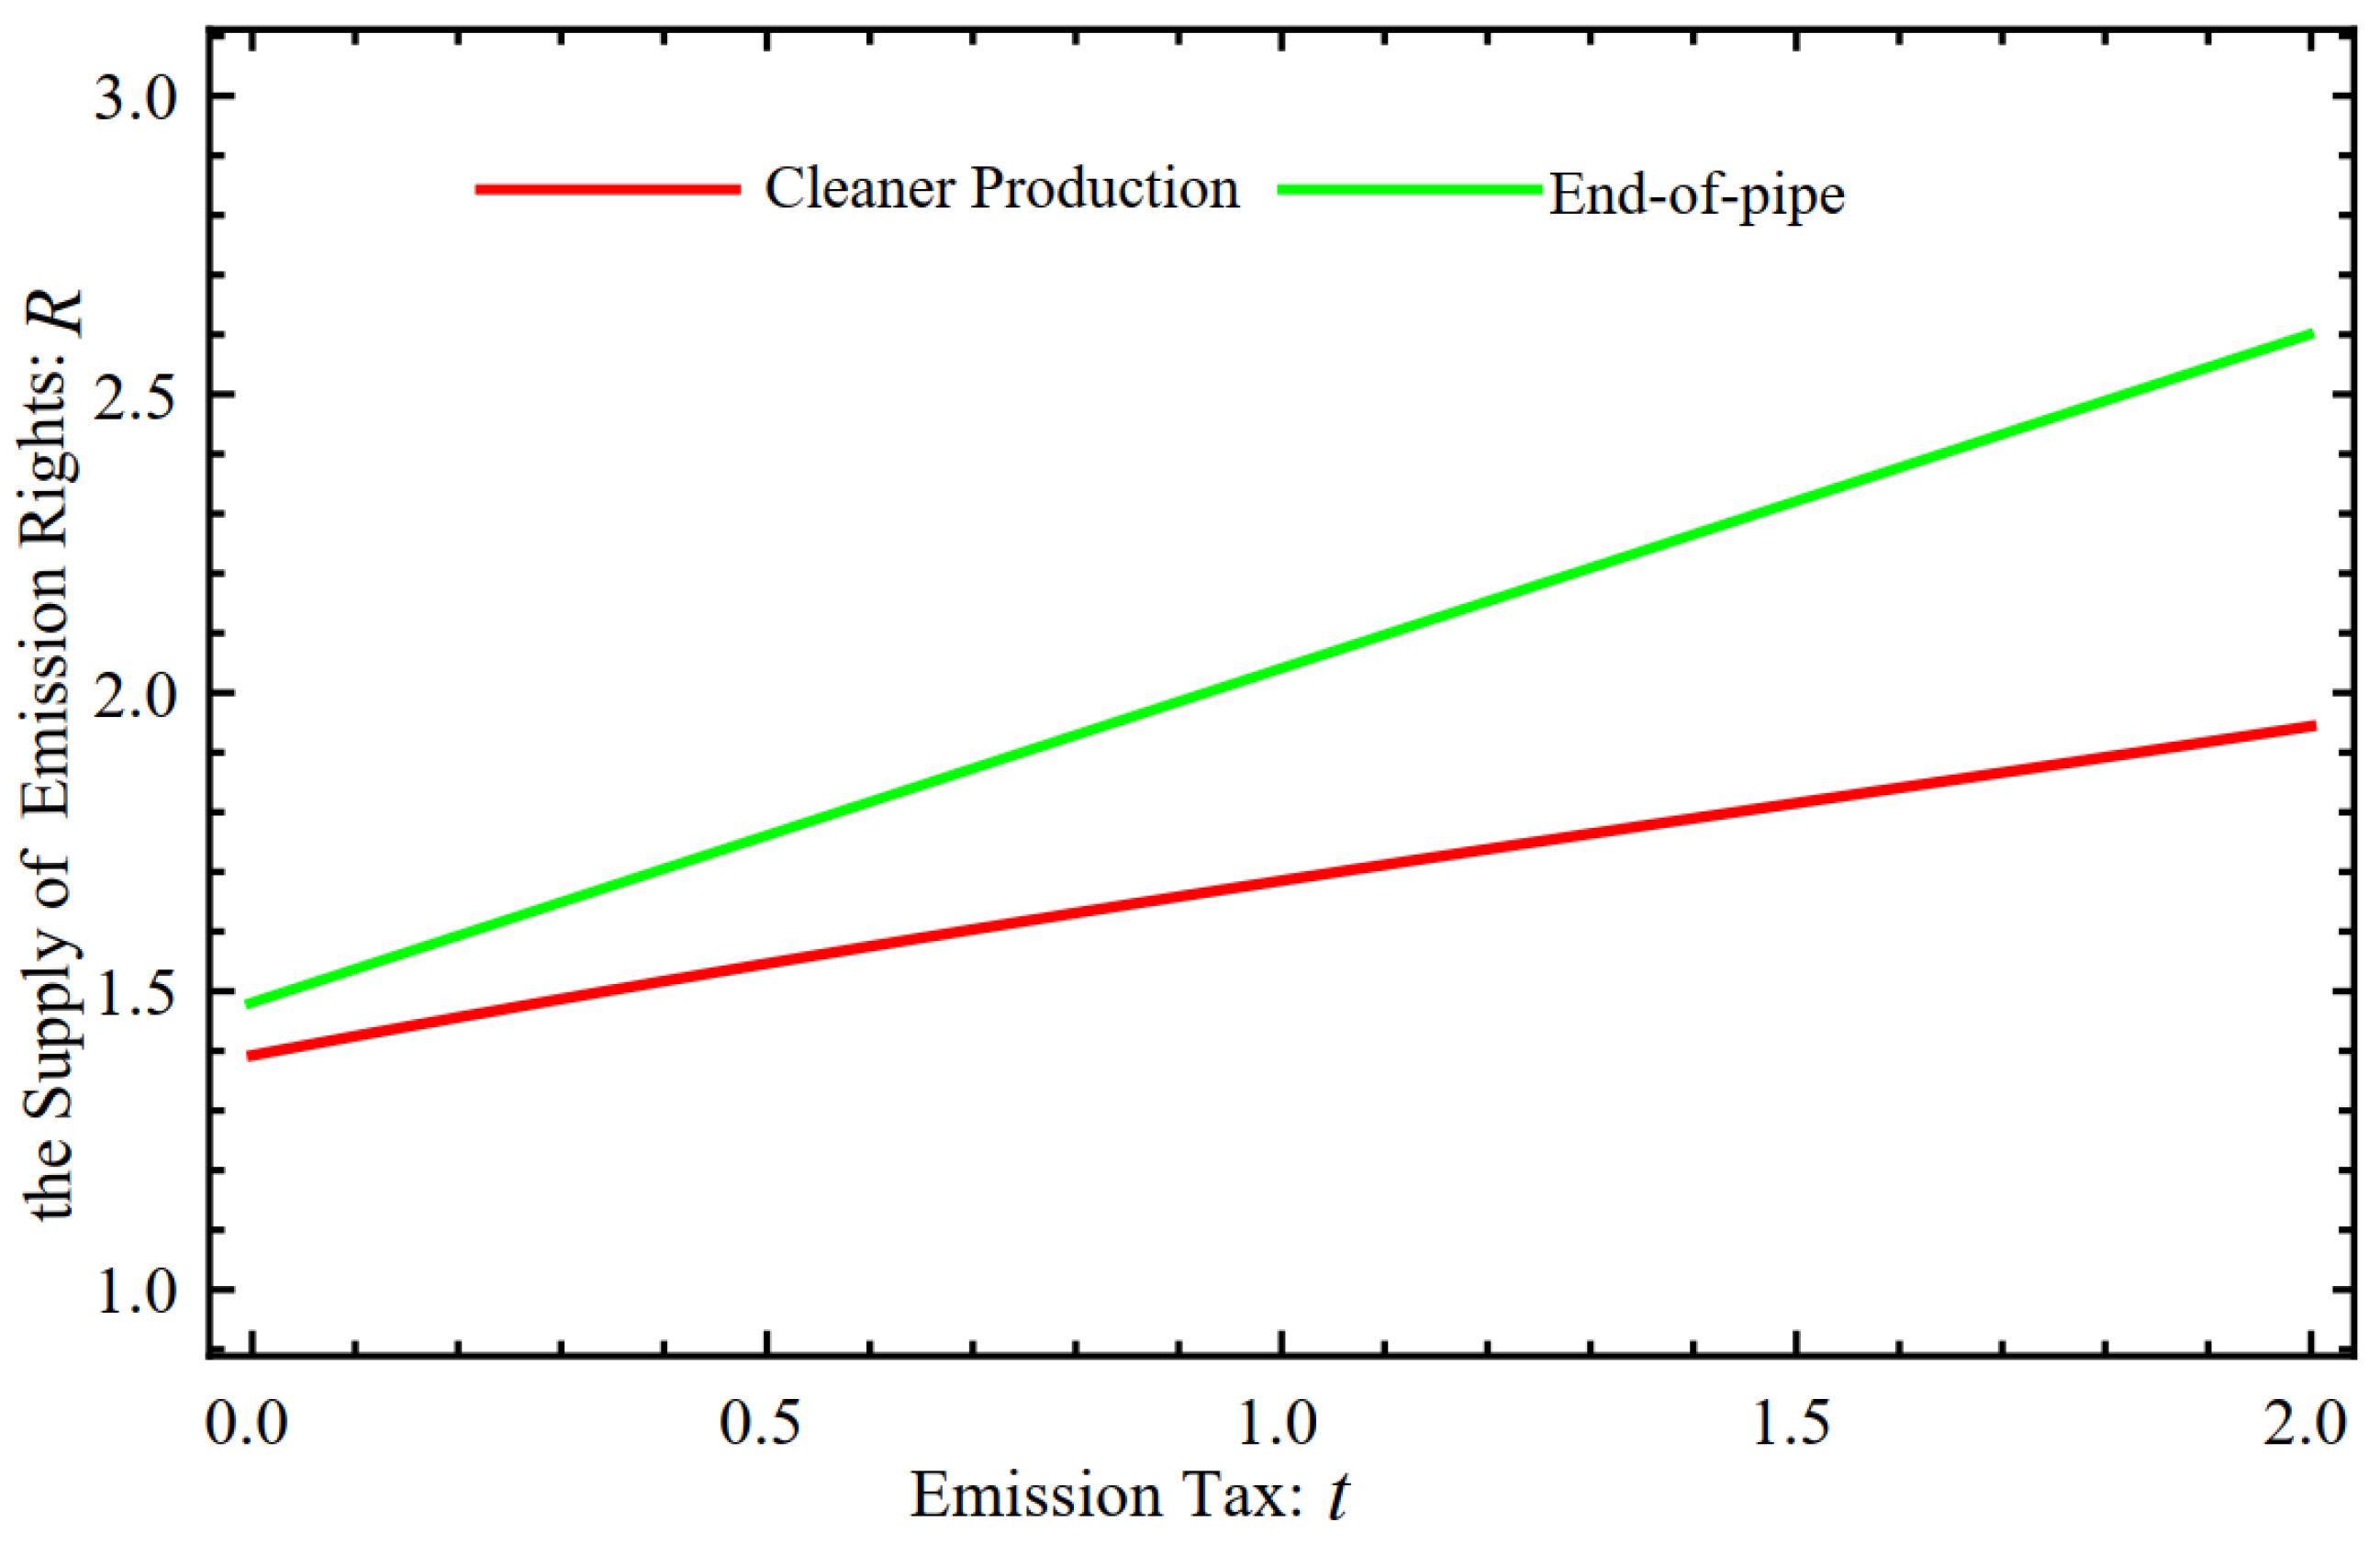
Under emission trading, what is the impact of governments’ emission tax policy on the supply of emission rights? Again, the analysis is carried out by numerical simulations. Referring to [
54,
55,
56], the benchmark parameters are set as
, and the range of the emission tax is
. The results are shown in
Figure 2.
As shown in
Figure 2, the increase in emission tax can increase the supply of emission rights. This is because environmental regulations such as emission tax can improve the motivation for firms to invest in green R&D, thus increasing the tradable emission rights. Therefore, appropriately increasing the emission tax can promote the activity of the entire emission trading market. It can be further found that regardless of the value of the emission tax, the supply of emission rights under end-of-pipe technology is more than that under cleaner production technology. The above analysis is summarized as Observation 2.
Observation 2. The difference in the supply of emission rights of firms under different green technology innovation models is affected by the level of emission trading price. When the emission trading price is low, the supply of emission rights under end-of-pipe technology is less than that under cleaner production technology. When the emission trading price is high, the supply of emission rights under end-of-pipe technology is more than that under cleaner production technology. Regardless of the value of the emission tax, the supply of emission rights under cleaner production technology is always less than that under end-of-pipe technology.
5.3. Profit
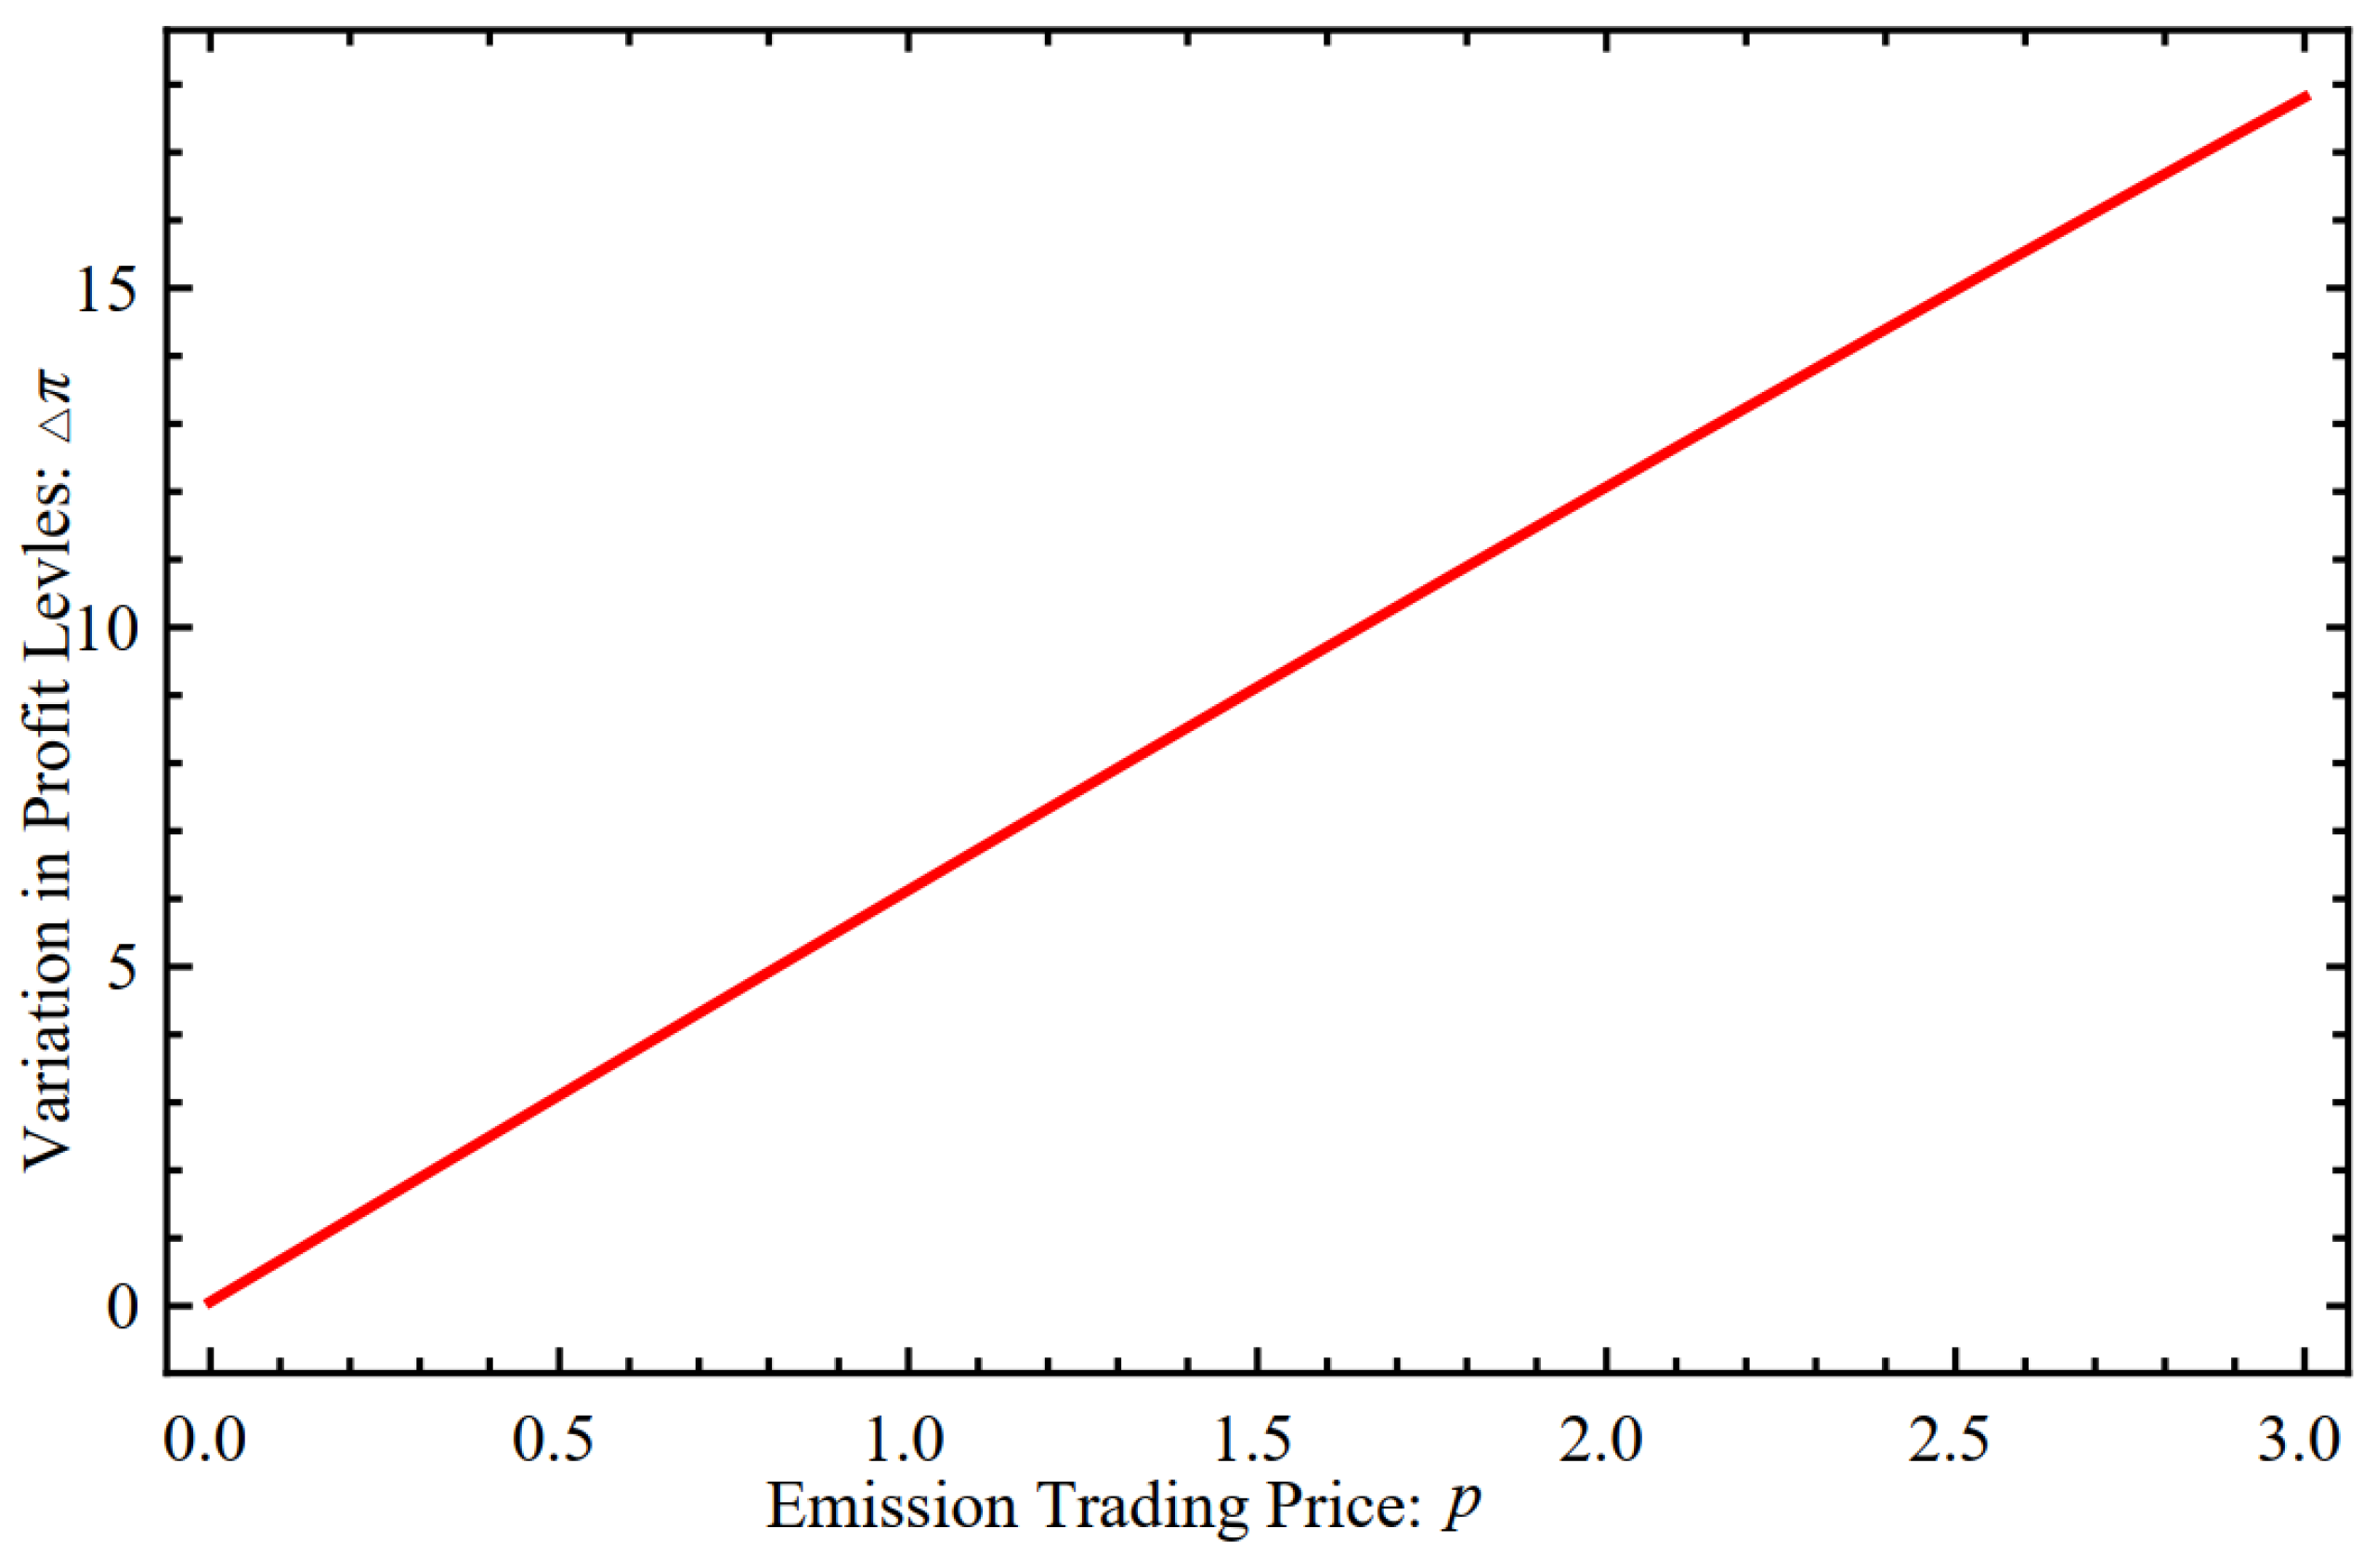
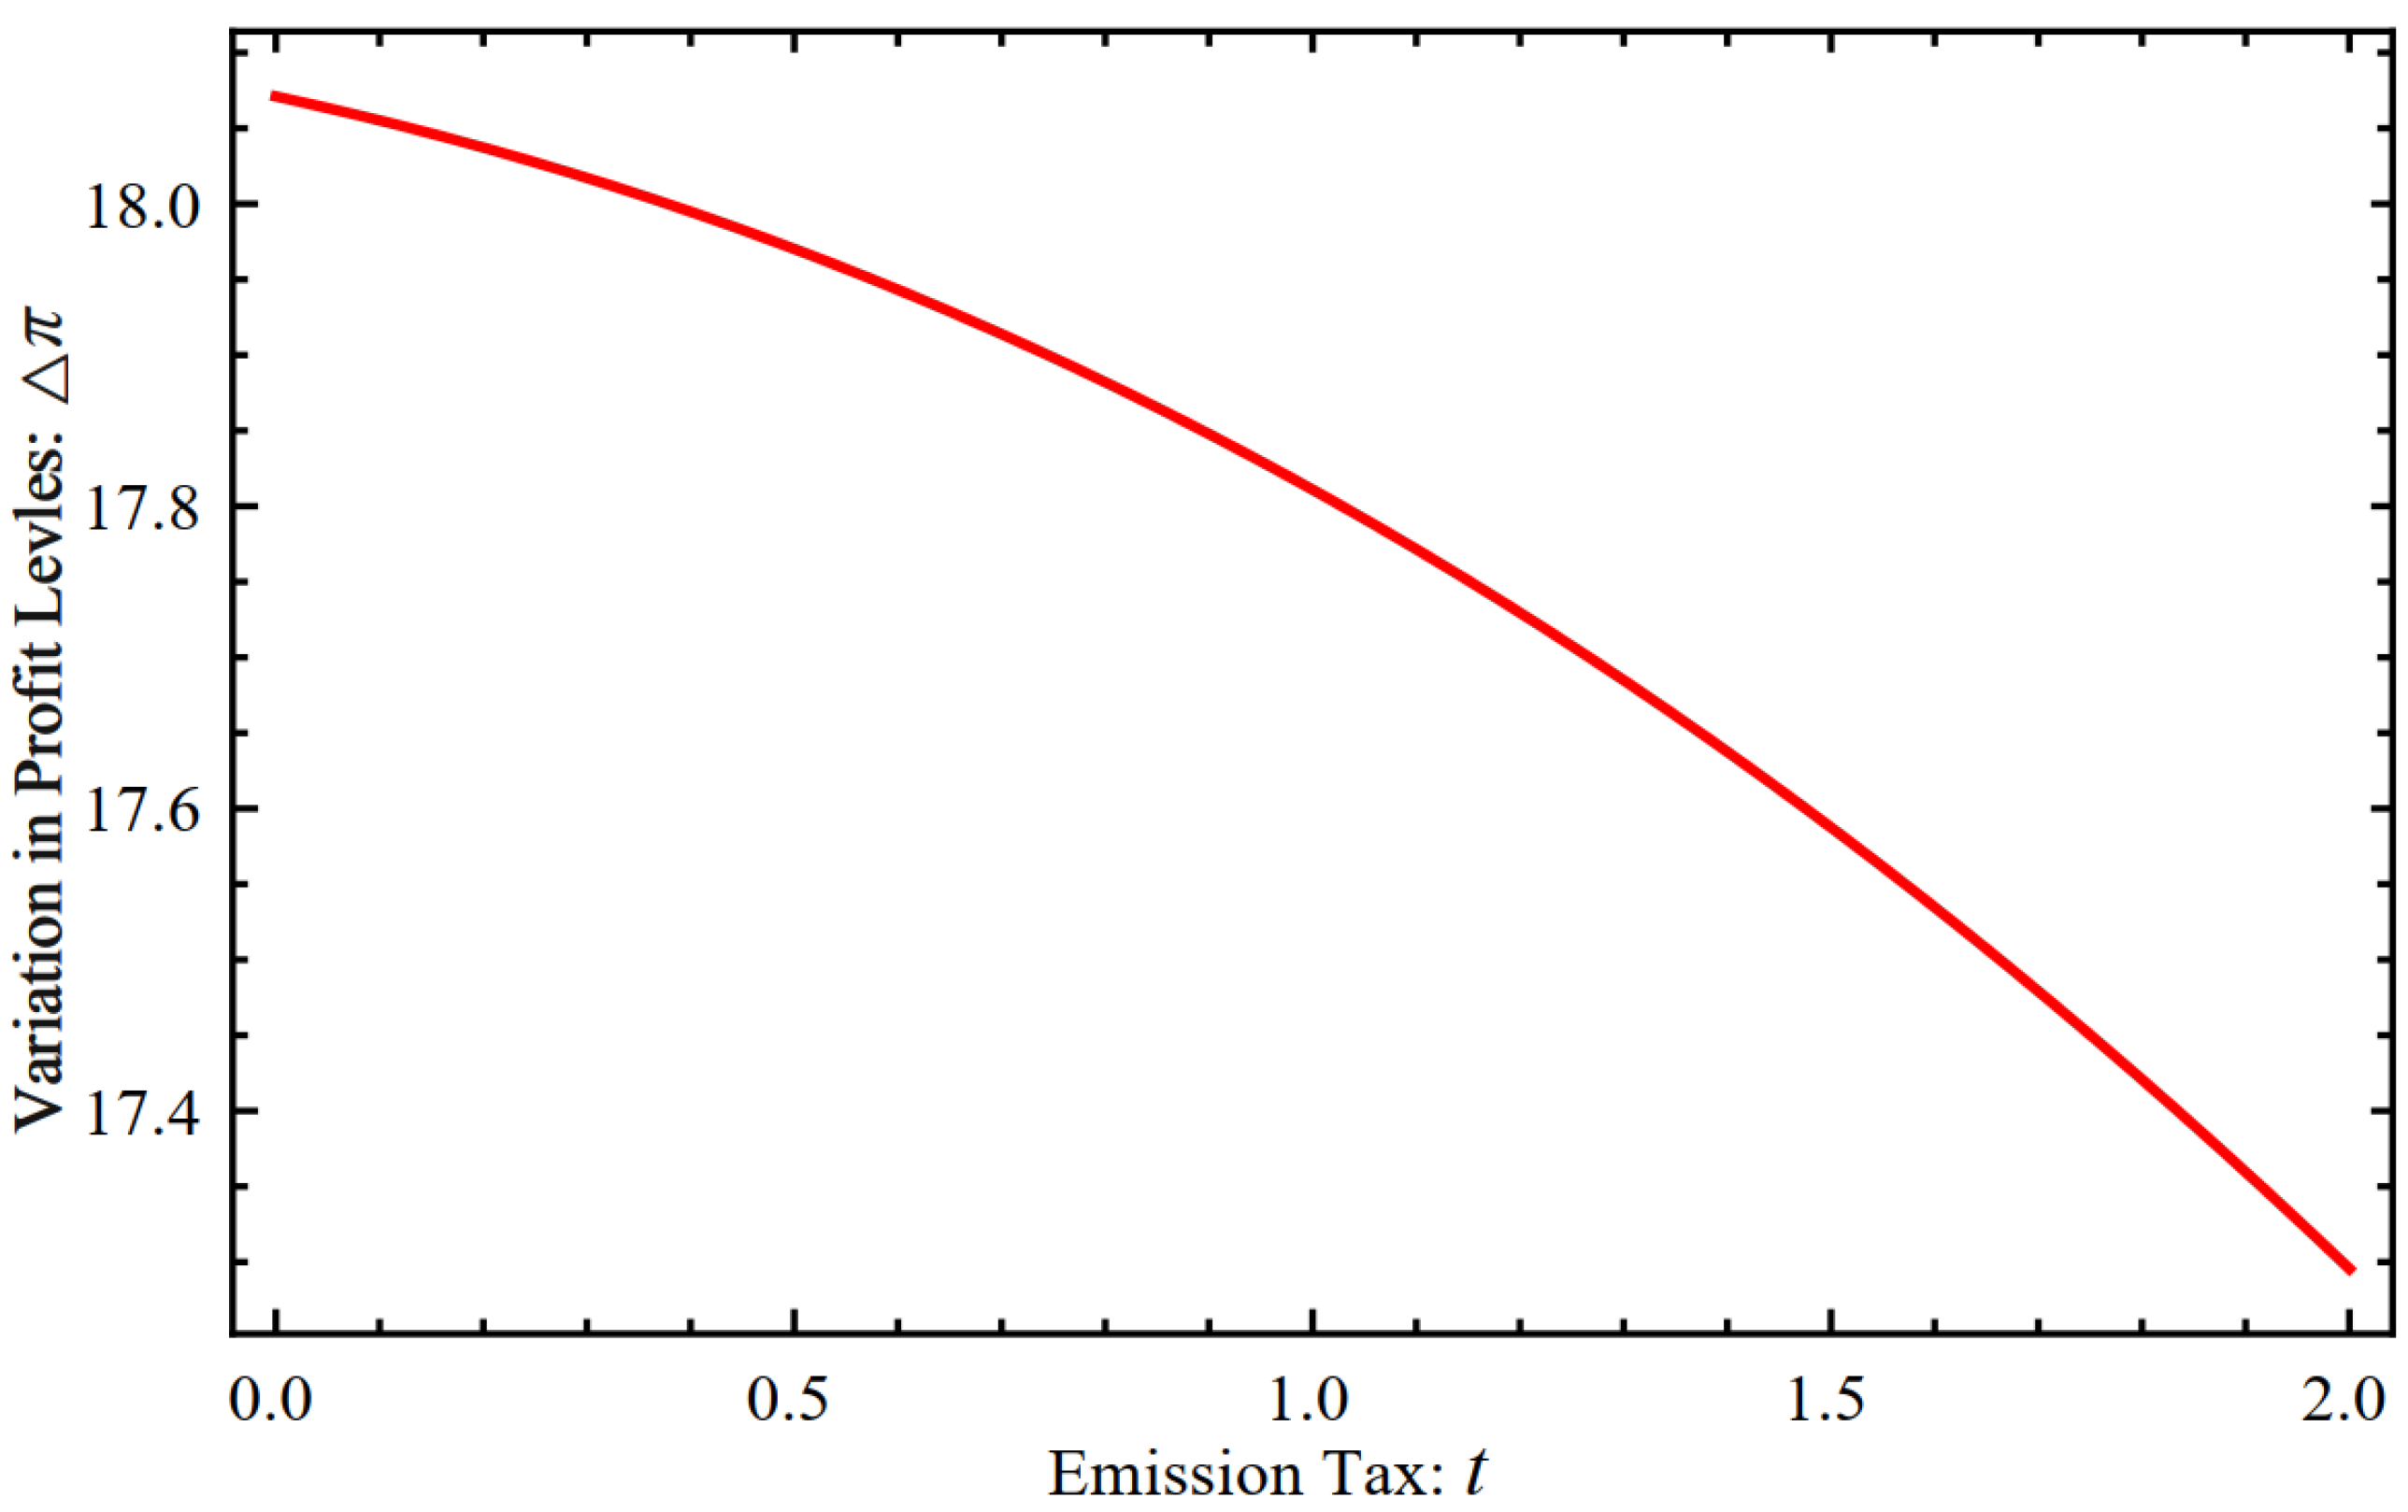
From Equations (13) and (21), it can be found that:
This section compares the profit levels of firms under different green technology innovation models. Considering the nonlinearity of the profit function, numerical simulations are used for analysis. The benchmark parameters are the same as above. The results are represented in
Figure 3 and
Figure 4 below.
As shown in
Figure 3 and
Figure 4, regardless of the value of the emission trading price and the emission tax, the profit under cleaner production technology is always more than the profit under end-of-pipe technology. As the emission trading price increases, the variation in profit levels of firms under different green technology innovation models will increase. Whereas with the increase in emission tax, the variation in profit levels of firms under different green technology innovation models will decrease. It is still positive within the relevant scope. The above analysis leads to the following observation.
Observation 3. The optimal green technology innovation model for firms is cleaner production technology, which is not affected by the emission trading price and the emission tax.
5.4. Social Welfare
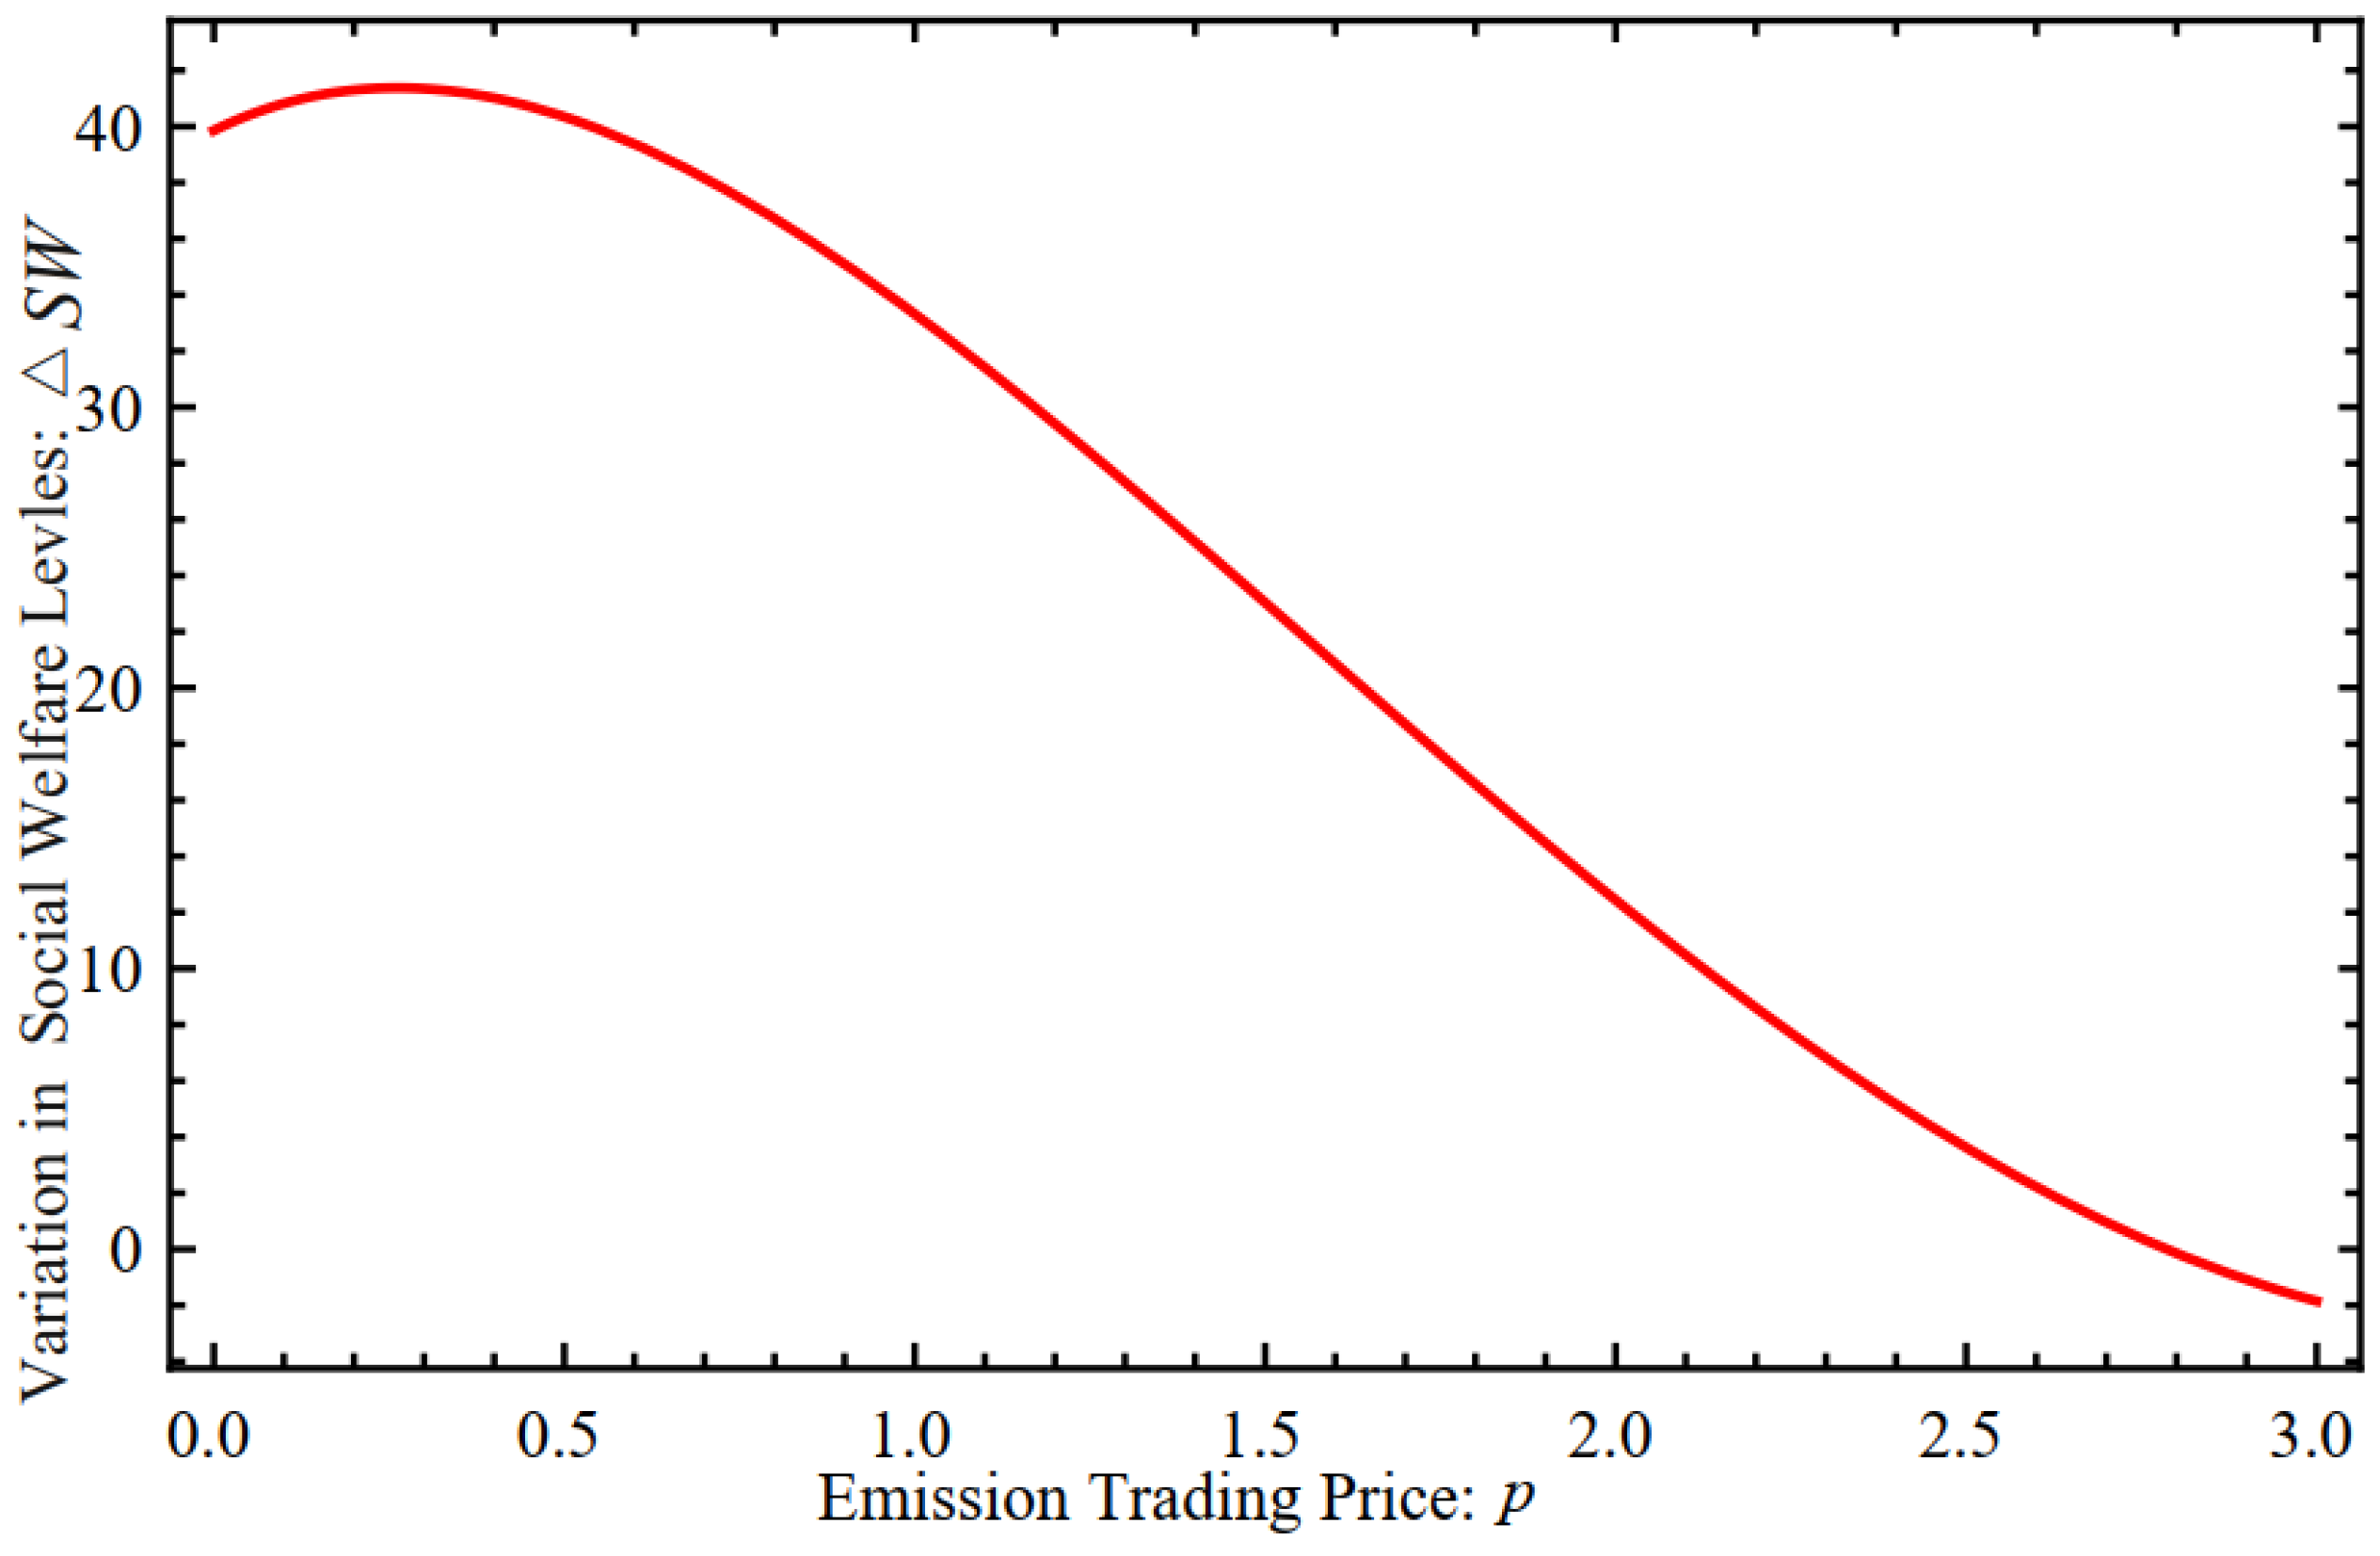
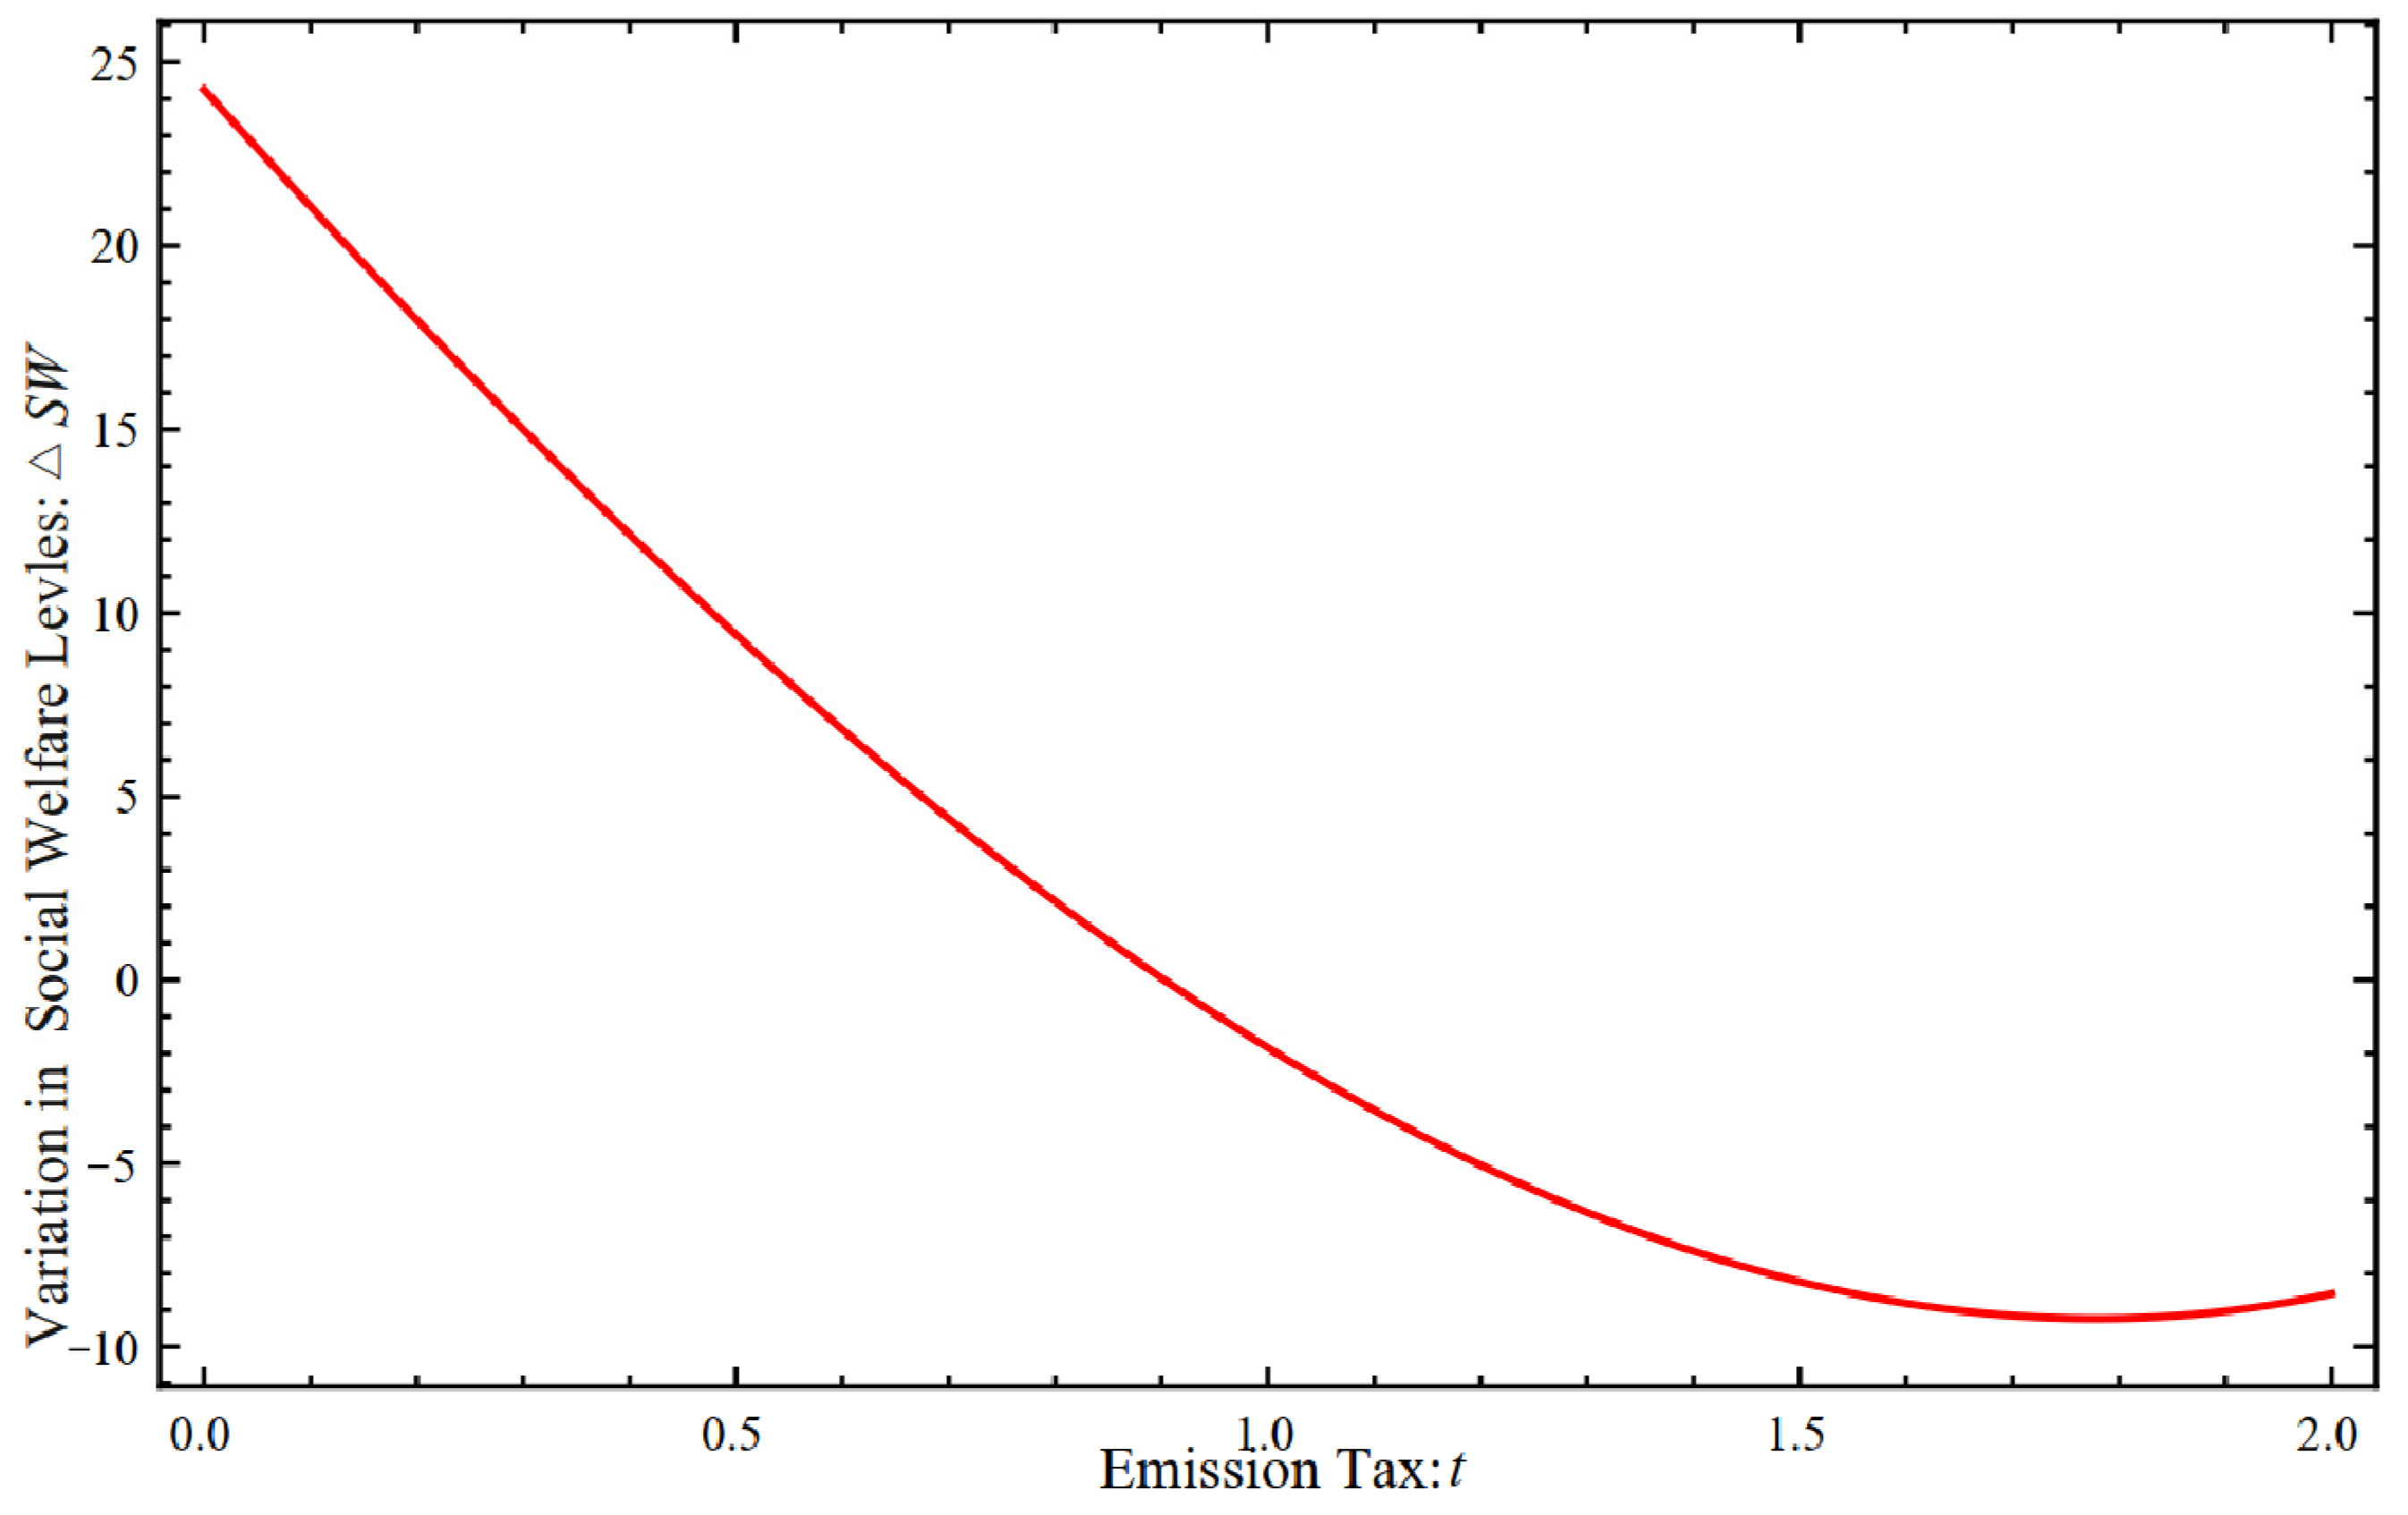
From Equations (14) and (21), it can be found that:
The impact of emission trading price and emission tax on the difference in social welfare levels of firms under different green technology innovation models is shown in
Figure 5 and
Figure 6.
The level of social welfare mainly depends on three aspects: consumer surplus, firms’ profits, and pollution damage. Combining Equations (11) and (16), it is clear that the output under cleaner production technology is more than the output under end-of-pipe technology. Therefore, the consumer surplus under cleaner production technology is larger than that under end-of-pipe technology. From
Figure 1,
Figure 2,
Figure 3 and
Figure 4, it can be seen that only the level of pollution emission depends on the emission trading price. Furthermore, regardless of the value of the emission trading price and emission tax, the profit under cleaner production technology is greater than that under end-of-pipe technology. Combining
Figure 5 and
Figure 6, it can be found that when the emission trading price or emission tax is lower, the level of social welfare under cleaner production technology is more than that under end-of-pipe technology. While the emission trading price or the emission tax is higher, the level of social welfare under cleaner production technology is less than that under end-of-pipe technology. Therefore, when the emission trading price or emission tax is lower, the optimal green technology innovation model for governments is cleaner production technology. When the emission trading price or the emission tax is higher, the optimal green technology innovation model for governments is end-of-pipe technology. It can be seen that although consumer surplus and firms’ profits under cleaner production technology are higher than that under end-of-pipe technology, when the emission trading price or the emission tax is higher, the level of social welfare under cleaner production technology is lower than that under end-of-pipe technology. It means that when the emission trading price or emission tax is higher, firms using cleaner production technology will generate serious pollution emissions.
From the above analysis, we can obtain Observation 4:
Observation 4. When the emission trading price or emission tax is lower, the optimal green technology innovation model for governments is cleaner production technology. When the emission trading price or the emission tax is higher, the optimal green technology innovation model for governments is end-of-pipe technology.
Combined with conclusions 3–4, we can see that there are differences in the optimal technology choices between governments and firms. From the perspective of maximizing profits for firms, the optimal green technology innovation model should be cleaner production technology. However, from the perspective of maximizing social welfare for governments, the optimal model depends on the emission trading price in the secondary market and the emission tax. Therefore, in order to make the choice of firms consistent with governments, governments should take relevant measures to appropriately regulate the emission trading price in the secondary market, reasonably levy emission tax, guide firms to choose the optimal green technology innovation model, and achieve a win–win situation between the economy and the environment.
Compared with existing research, our results have the following similarities and differences. The authors of [
17,
46] argued that emission trading policy is not conducive to green technology innovation, while our results are consistent with [
15,
16,
22,
31,
32,
39], stating that emission trading policy has a positive impact on green technology innovation in firms. At the same time, our findings are consistent with [
30], which found that emission tax has a positive impact on green technology innovation. Moreover, our study indicates that cleaner production technology is the optimal green technology innovation model for firms, which is consistent with [
35]. In addition, [
34] also mentioned that most firms in OECD countries choose cleaner production technology. Our findings enrich the conclusions of existing relevant studies. The authors of [
49] showed that command and control environmental policy tools have little impact on cleaner production technology but contribute to end-of-pipe technology. The authors of [
50] pointed out that taxes mainly stimulate cleaner production. The authors of [
54] indicated that emission taxes have better effects on end-of-pipe technology. We believe that there are differences in the impact of emission tax and emission trading price on the supply of emission rights and profits of firms with different green technology innovation models.
6. Conclusions and Policy Implications
6.1. Conclusions
In this paper, we construct a two-stage game model to investigate the abatement R&D, environmental, and economic performance of firms adopting cleaner production and end-of-pipe technology innovation model under the emission trading policy. We further use the numerical simulation method to analyze the impact of the emission trading policy on the choice of the optimal green technology innovation model of firms and governments as well as its difference with the emission tax policy. Through the above analysis, we draw the following conclusions.
Firstly, the degree of incentive from emission trading price to firms’ pollution abatement R&D investment is affected by the green technology innovation model. When the emission trading price is high, emission trading has a greater incentive for the R&D investment of end-of-pipe technology firms. On the contrary, when the emission trading price is low, emission trading has a greater incentive to the R&D investment of cleaner production technology firms.
Secondly, there are differences in the impacts of emission tax and emission trading price on the supply of emission rights and profits of firms with different green technology innovation models. When the emission trading price is low, the supply of emission rights under end-of-pipe technology is less than that under cleaner production technology. When the emission trading price is high, the supply of emission rights under end-of-pipe technology is more than that under cleaner production technology. Regardless of the value of the emission tax, the supply of emission rights under cleaner production technology is always less than that under end-of-pipe technology.
Finally, there is a certain difference in the choice of the optimal green technology innovation model between governments and firms. The choice of the optimal green technology innovation model of governments is affected by the emission trading price and the emission tax. When the emission trading price or the emission tax is lower, governments’ optimal green technology innovation model is cleaner production technology; when the emission trading price or the emission tax is higher, governments’ optimal green technology innovation model is end-of-pipe technology. However, regardless of the value of emission trading price and emission tax, the level of a firm’s profit under cleaner production technology innovation is always more than that under end-of-pipe technology innovation. The optimal green technology innovation model of firms is cleaner production technology.
6.2. Policy Implications
The above conclusions lead to the following policy implications.
- (1)
The choice of the optimal green technology innovation model between the government and firms is affected by the emission trading price and the emission tax. There are differences between the two choices when the emission trading price or the emission tax is high. At this time, the government should reserve emission rights to properly regulate the emission trading price in the secondary market, so as to guide firms to choose the government’s optimal green technology innovation model and realize the win–win situation of the economy and environment.
- (2)
Under emission trading conditions, an appropriate increase in emission tax can promote the activity of the whole market. Although cleaner production is the optimal green technology innovation model from the firms’ optimal perspective, its market supply is lower than that under the end-of-pipe green technology innovation model. Therefore, the government should actively use the emission tax policy to encourage firms to increase green technology R&D investment, improve the market supply of emission right indicators, and provide sufficient liquidity for the emission trading market. For example, in China, the emission trading policy still has a problem of primary allocation by local governments and cold trading in the secondary market. This is not conducive to fully utilizing the incentive mechanism for green technology innovation of firms. While enhancing the transparency and uniformity of trading platforms, appropriate emission tax can be supplemented.
- (3)
Under cleaner production technology, the level of abatement R&D investment of firms is affected by the industrial technology spillover rate. In order to prevent free riders leading to market failure, the government should provide subsidies for cleaner production technology R&D activities of firms. Currently, most countries attach great importance to promoting cleaner production in firms. However, some regions have not yet developed reasonable subsidy mechanisms based on specific situations, and the relevant evaluation methods are not yet specific, resulting in some malicious fraudulent behavior. Therefore, relevant regions should adapt to local conditions, improve relevant procedures, utilize information network resources to strengthen supervision, and ensure that firms that truly need them receive appropriate subsidies.
6.3. Limitations and Future Recommendations
Several limitations in this research may be considered for future research. First, this paper establishes a Cournot duopoly game model where the two firms have the same status and produce the same products. Although the model has good universality, the impact of relevant policies and green technology innovation investment on firms of different scales varies in real life. In future research, we will expand our research on heterogeneous firms from two aspects: on the one hand, we will construct a Bertrand model to study differentiated product firms, and on the other hand, we will differentiate between large, medium-sized, and small firms. Secondly, our research is based on the ETS policy and the most widely used ET policy. However, in real life, the choice of green technology innovation strategies for firms is not only influenced by these two policies. In future research, considering other policies such as the green finance policy is also a direction that can be expanded.


