Article

Enhancing Sustainable Dairy Industry Growth through Cold-Supply-Chain-Integrated Production Forecasting

1
Department of Mechanical Engineering, National Institute of Technology Patna, Patna 800005, India
2
Indian Council of Agricultural Research-Research Complex for Eastern Region (ICAR-RCER), Farming System Research Centre for Hill and Plateau Region Ranchi, Ranchi 834010, India
3
Department of Management Studies, Graphic Era (Deemed to Be University), Dehradun 248002, India
4
Department of Mechanical Engineering, Malaviya National Institute of Technology Jaipur, Jaipur 302017, India
*
Author to whom correspondence should be addressed.
Sustainability 2023, 15(22), 16102; https://doi.org/10.3390/su152216102
Submission received: 25 September 2023 / Revised: 15 November 2023 / Accepted: 16 November 2023 / Published: 20 November 2023
(This article belongs to the Section Sustainable Management)

Abstract

:
Cold supply chains (CSCs) are critical for preserving the quality and safety of perishable products like milk, which plays a vital role in the daily lives of a vast population, especially in countries like India. This research centers on sustainable milk production in Northern India, with priorities of ensuring efficiency and waste reduction within the cold supply chain. Leveraging data from a prominent North India-based dairy company, Company ‘X’, an ARIMA model is applied for predicting monthly milk production trends. Utilizing the Statistical Package for the Social Sciences (IBM SPSS STATISTICS 20) software, the study forecasts Company ‘X’s monthly milk production and identifies four distinct ARIMA models based on the autocorrelation function (ACF) and the partial autocorrelation function (PACF). By comparing predicted and actual milk production values (April–October 2021), sustainability metrics are integrated into ARIMA forecasts. Implications for the dairy sector’s sustainability and alignment with the Sustainable Development Goals (SDGs) are assessed through error terms such as R squared (R2) and mean absolute percentage error (MAPE). The study promotes sustainable milk production practices in Northern India’s dairy sector, resonating with the SDGs to optimize demand–supply dynamics and foster a more environmentally conscious dairy industry.

1. Introduction

In the context of dairy production, particularly within a significant country like India, CSCs assume a pivotal role of utmost importance. Dairy products hold a fundamental place in daily life, as they contribute to more than 10% of the body’s protein requirement [1]. Throughout history, these products have evolved from being considered luxuries to becoming absolute necessities. Among these dairy products, milk stands out as a natural food source that provides all the essential nutrients required for bodily growth and development [2]. The dairy sector serves as a cornerstone for the social and economic progress of the nation, representing a substantial portion of the rural population [3,4]. Globally, India holds the top position when it comes to both the production and consumption of milk, boasting a dairy cow population of 125.34 million [5,6,7]. In the last ten years, India has witnessed a remarkable increase of 237.58% in milk production, soaring from 55.6 million tonnes in 1991–1992 to a remarkable 187.7 million tonnes in 2018–2019 [8]. This consistent growth has averaged around 4.8% annually in the last ten years [9,10]. Simultaneously, the daily per capita milk availability in India has risen from 130 g in 1950–1951 to 374 g in 2017, surpassing the estimated global average consumption for 2017 [11,12,13]. In fact, in 2017, India accounted for an impressive 21.29 % share of global milk production [14]. Since dairy accounts for one of the largest portions of agriculture’s gross domestic product (GDP), it is essential to predict milk production in order to gauge supply and demand for milk and to develop the best course of action for addressing any ensuing gaps [8,15,16]. Moreover, in the dairy industry, where maintaining the integrity of CSCs is paramount, accurate predictions of milk production take on added significance. These forecasts empower stakeholders to make informed decisions that are crucial for the efficient allocation of resources and the optimization of procurement and distribution processes, especially within cold supply chains. Beyond their logistical importance, milk and dairy products are vital sources of nutrition, being rich in essential elements such as proteins, vitamins, and minerals, all of which are fundamental for human growth and development. Ensuring sustainable milk production practices is not only a matter of meeting the surging demand for dairy products but also safeguarding the environment and our precious natural resources [17]. The dairy industry’s sustainability hinges on optimizing production processes, reducing environmental impact, and promoting responsible consumption and production practices [18,19]. Efficient forecasting of milk production aligns with these sustainability goals by preventing food shortages, minimizing wastage, and reducing the industry’s ecological footprint [20]. The link between milk production forecasting and the SDGs further accentuates its significance. The SDGs encompass a set of global objectives aimed at eradicating poverty, protecting the planet, and ensuring prosperity for all by 2030. Sustainable milk production directly supports several SDGs, primarily within the scopes of SDG 2 (“Zero Hunger”) and SDG 12 (“Responsible Consumption and Production”) [21].
In light of this context, this study makes an effort to examine and predict milk production using the established time-series modelling approach ARIMA. The effectiveness of ARIMA models in forecasting milk production is evaluated based on the MAPE and the coefficient of determination (R2). The MAPE quantifies the average percentage deviation between the predicted and actual values which reflects the precision and accuracy of the forecasting models [22,23]. A lower MAPE indicates higher forecast accuracy, with a smaller average deviation from the actual values. On the other hand, R2 quantifies the proportion of total variation in milk production, explained by the independent variables included in the ARIMA model [24]. A higher R2 value denotes a more robust correlation and a better fit of the model to the data, enhancing their predictive power. Through an investigation of MAPE and R2 values, the paper aims to offer insights into the predictive competences of the ARIMA models and their ability to capture underlying patterns and trends in milk production data to facilitate sustainable decision making, hence assisting us in achieving the SDGs. To achieve this aim, the following research objectives (ROs) were identified:
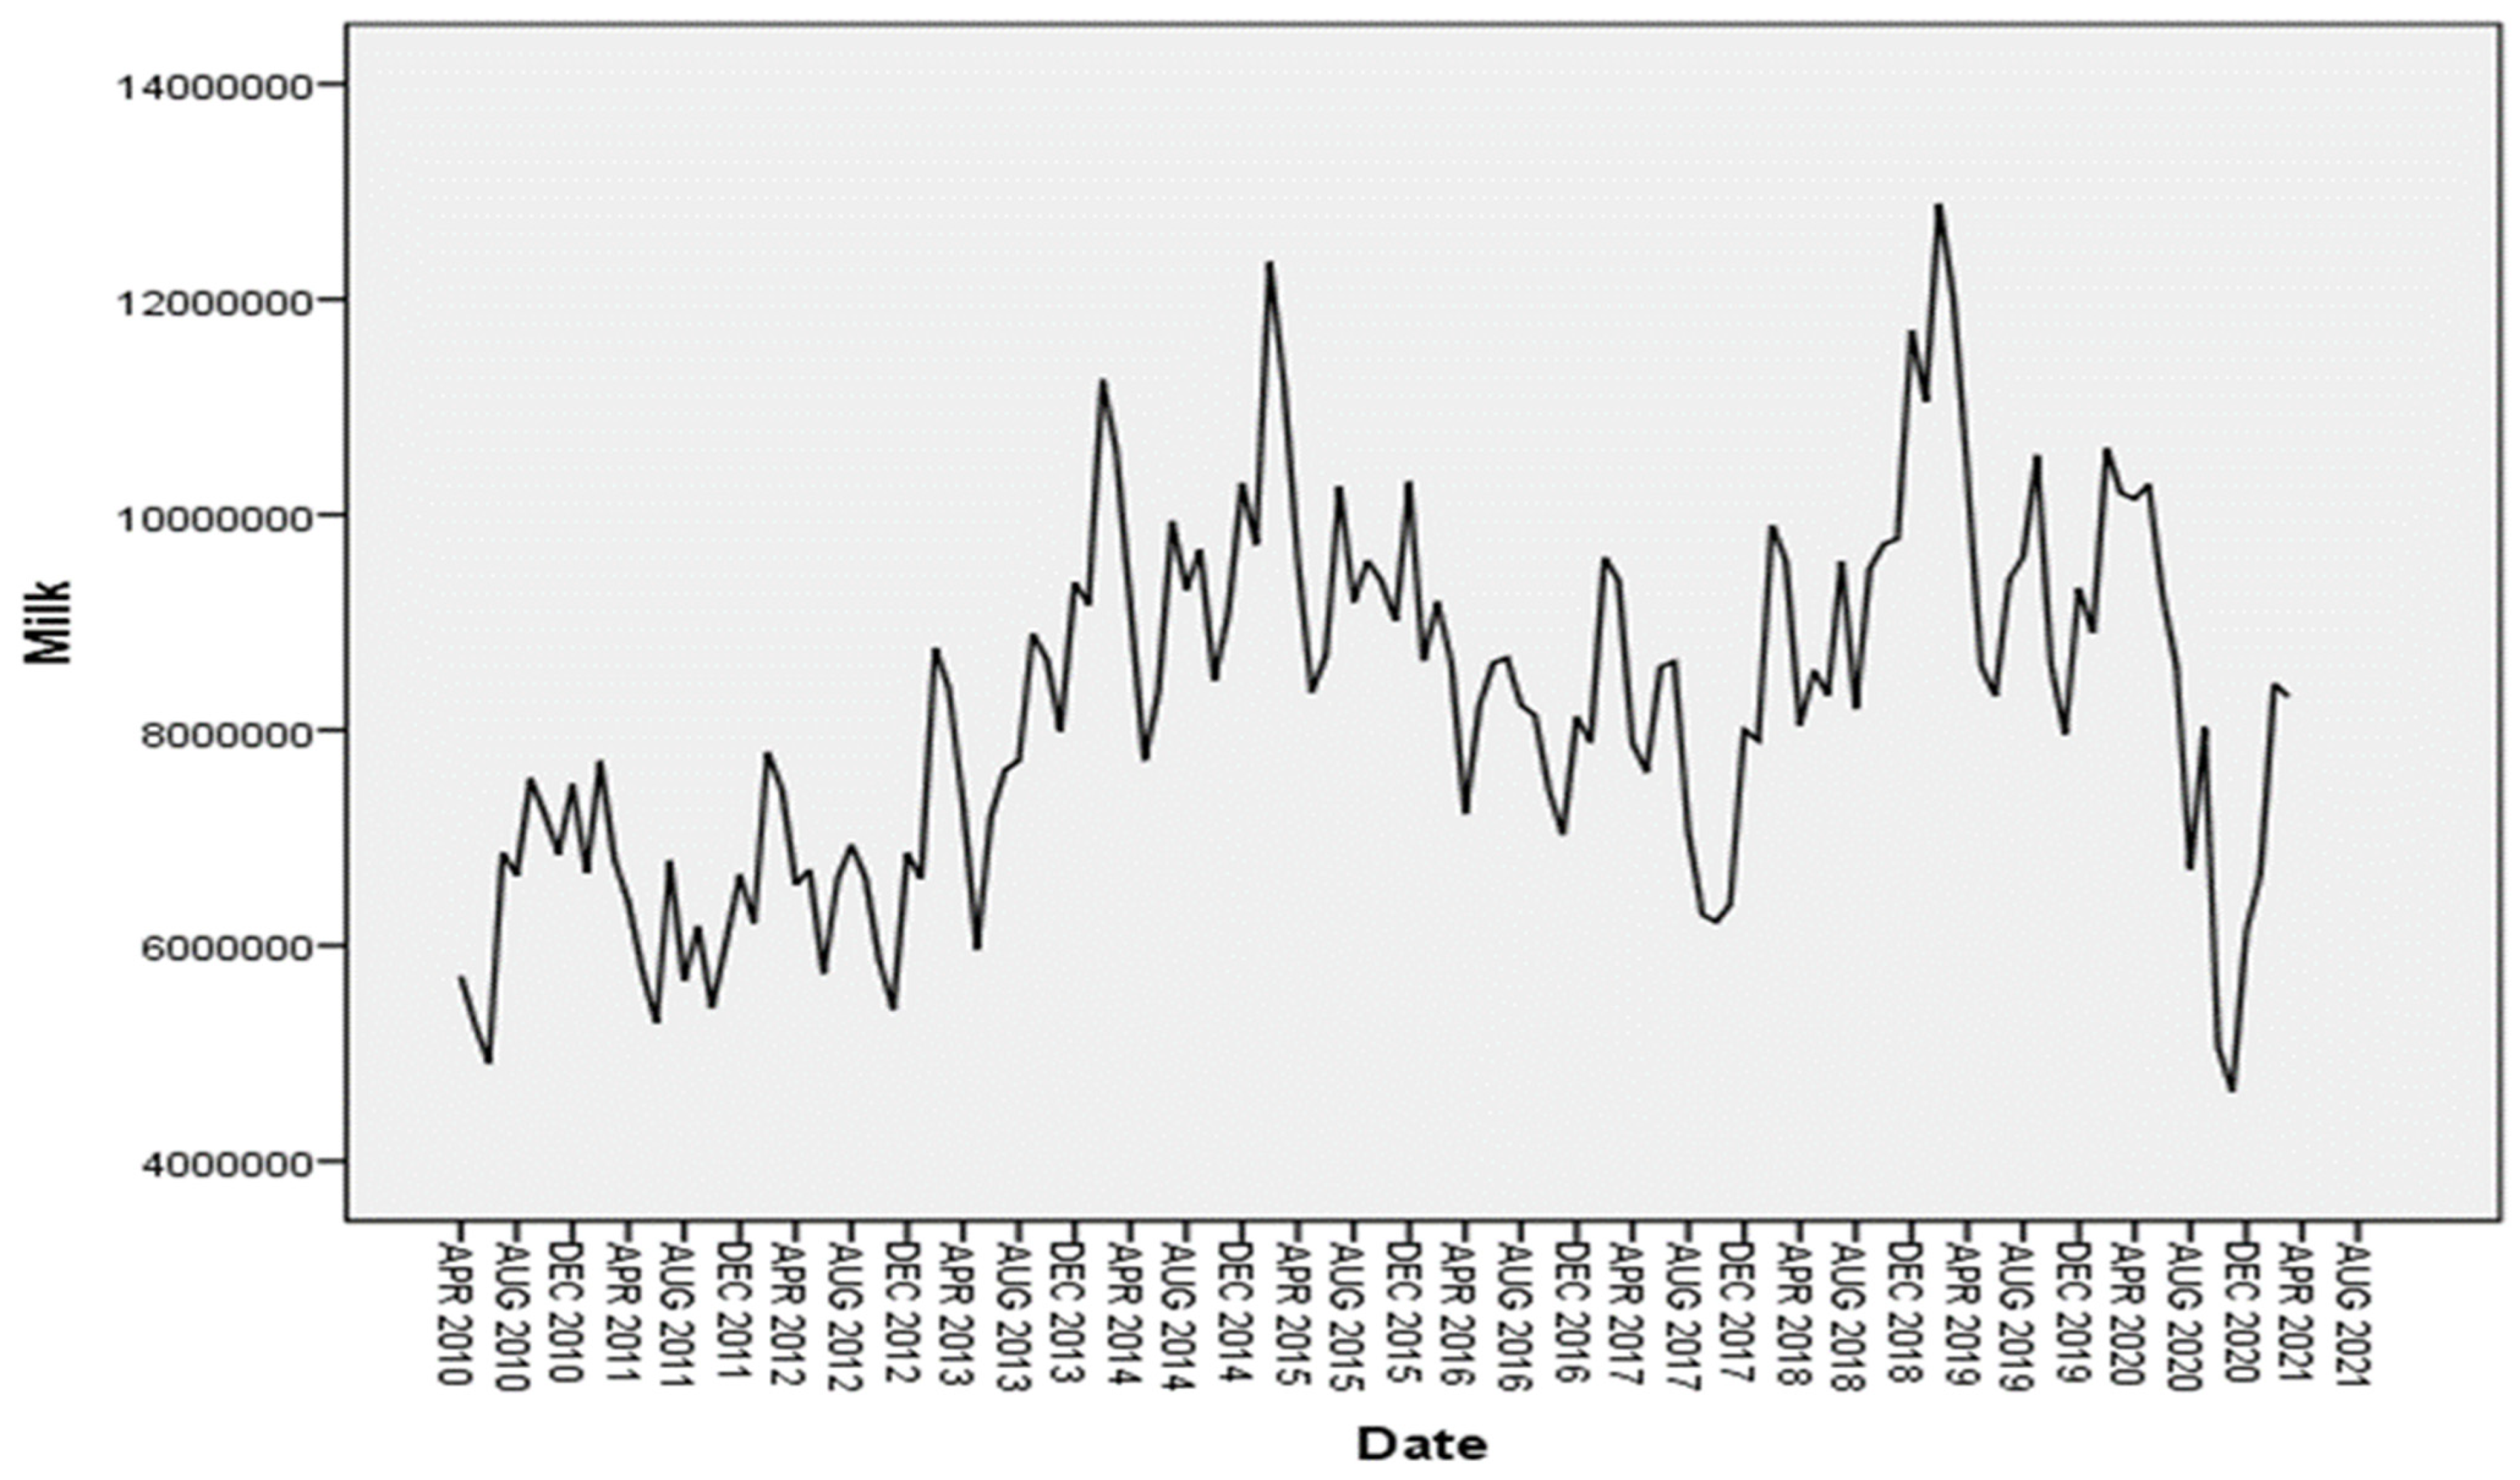
  • RO1: Examine the monthly milk production trends of Company ‘X’ in North India from April 2010 to October 2021, and identify underlying patterns and trends.
  • RO2: Develop ARIMA models for forecasting milk production from April 2021 to October 2021, and evaluate the precision of the forecasted values using MAPE and R2.
  • RO3: Evaluate the implications of precise milk production forecasting for achieving SDGs in the dairy industry.
In this study, we introduce several innovative elements that constitute the core contributions of this research. First and foremost, the study pioneers the integration of CSC dynamics into the realm of milk production forecasting. While prior studies have primarily focused on predicting milk production trends, this research takes a holistic approach by considering the intricate dynamics of the CSC. This innovation allows us not only to generate accurate forecasts but also to evaluate the broader implications of these forecasts in the context of sustainability within the dairy industry. Furthermore, our study extends the conventional time-series forecasting paradigm by aligning our predictions with the SDGs. This unique approach enables us to assess the long-term impact of milk production forecasting on sustainability objectives. The study also emphasizes the crucial role of data-driven decision making in CSC management, empowering stakeholders to make informed choices about resource allocation and distribution processes. Additionally, it sheds light on the significance of strategic preparedness to mitigate the effects of unforeseen disruptions, such as the COVID-19 pandemic, on milk production forecasts.
The following is the structure of the paper: Section 2 contains the method and materials followed by the model formation in Section 3. Subsequently, Section 4 contains the results and discussions, implications, and limitations. Eventually, the paper concludes with future insights in Section 5.

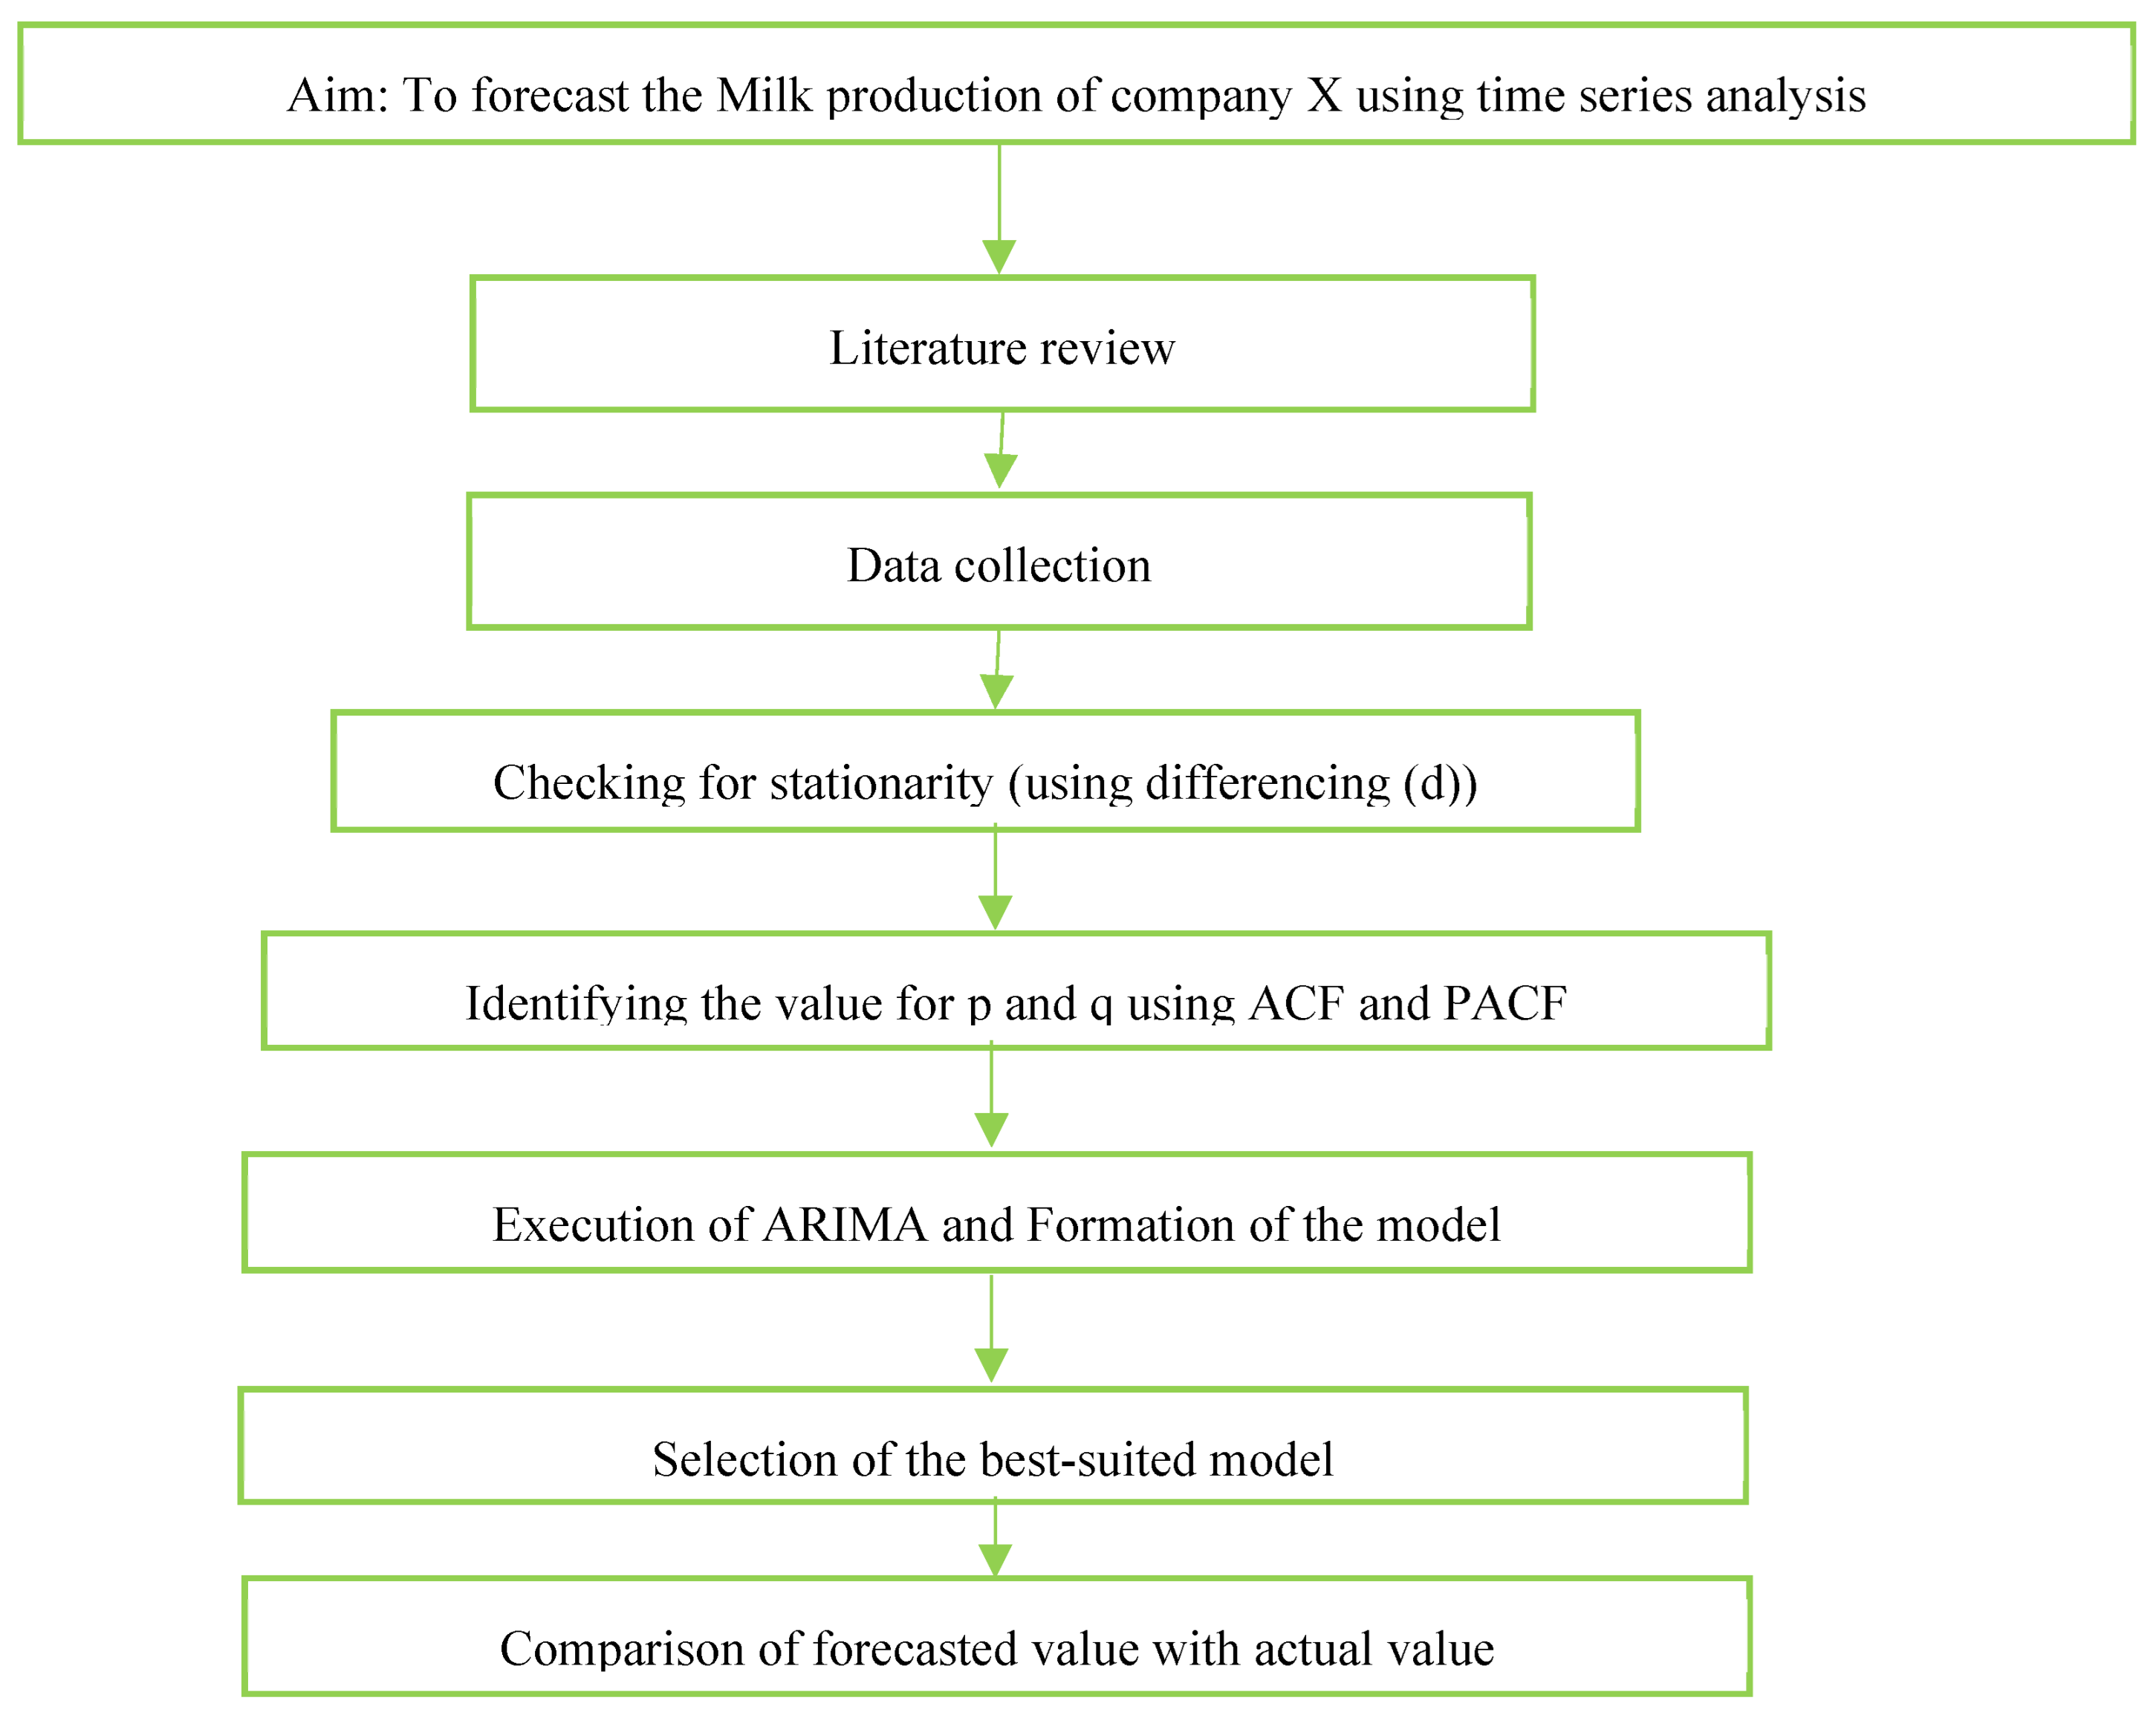
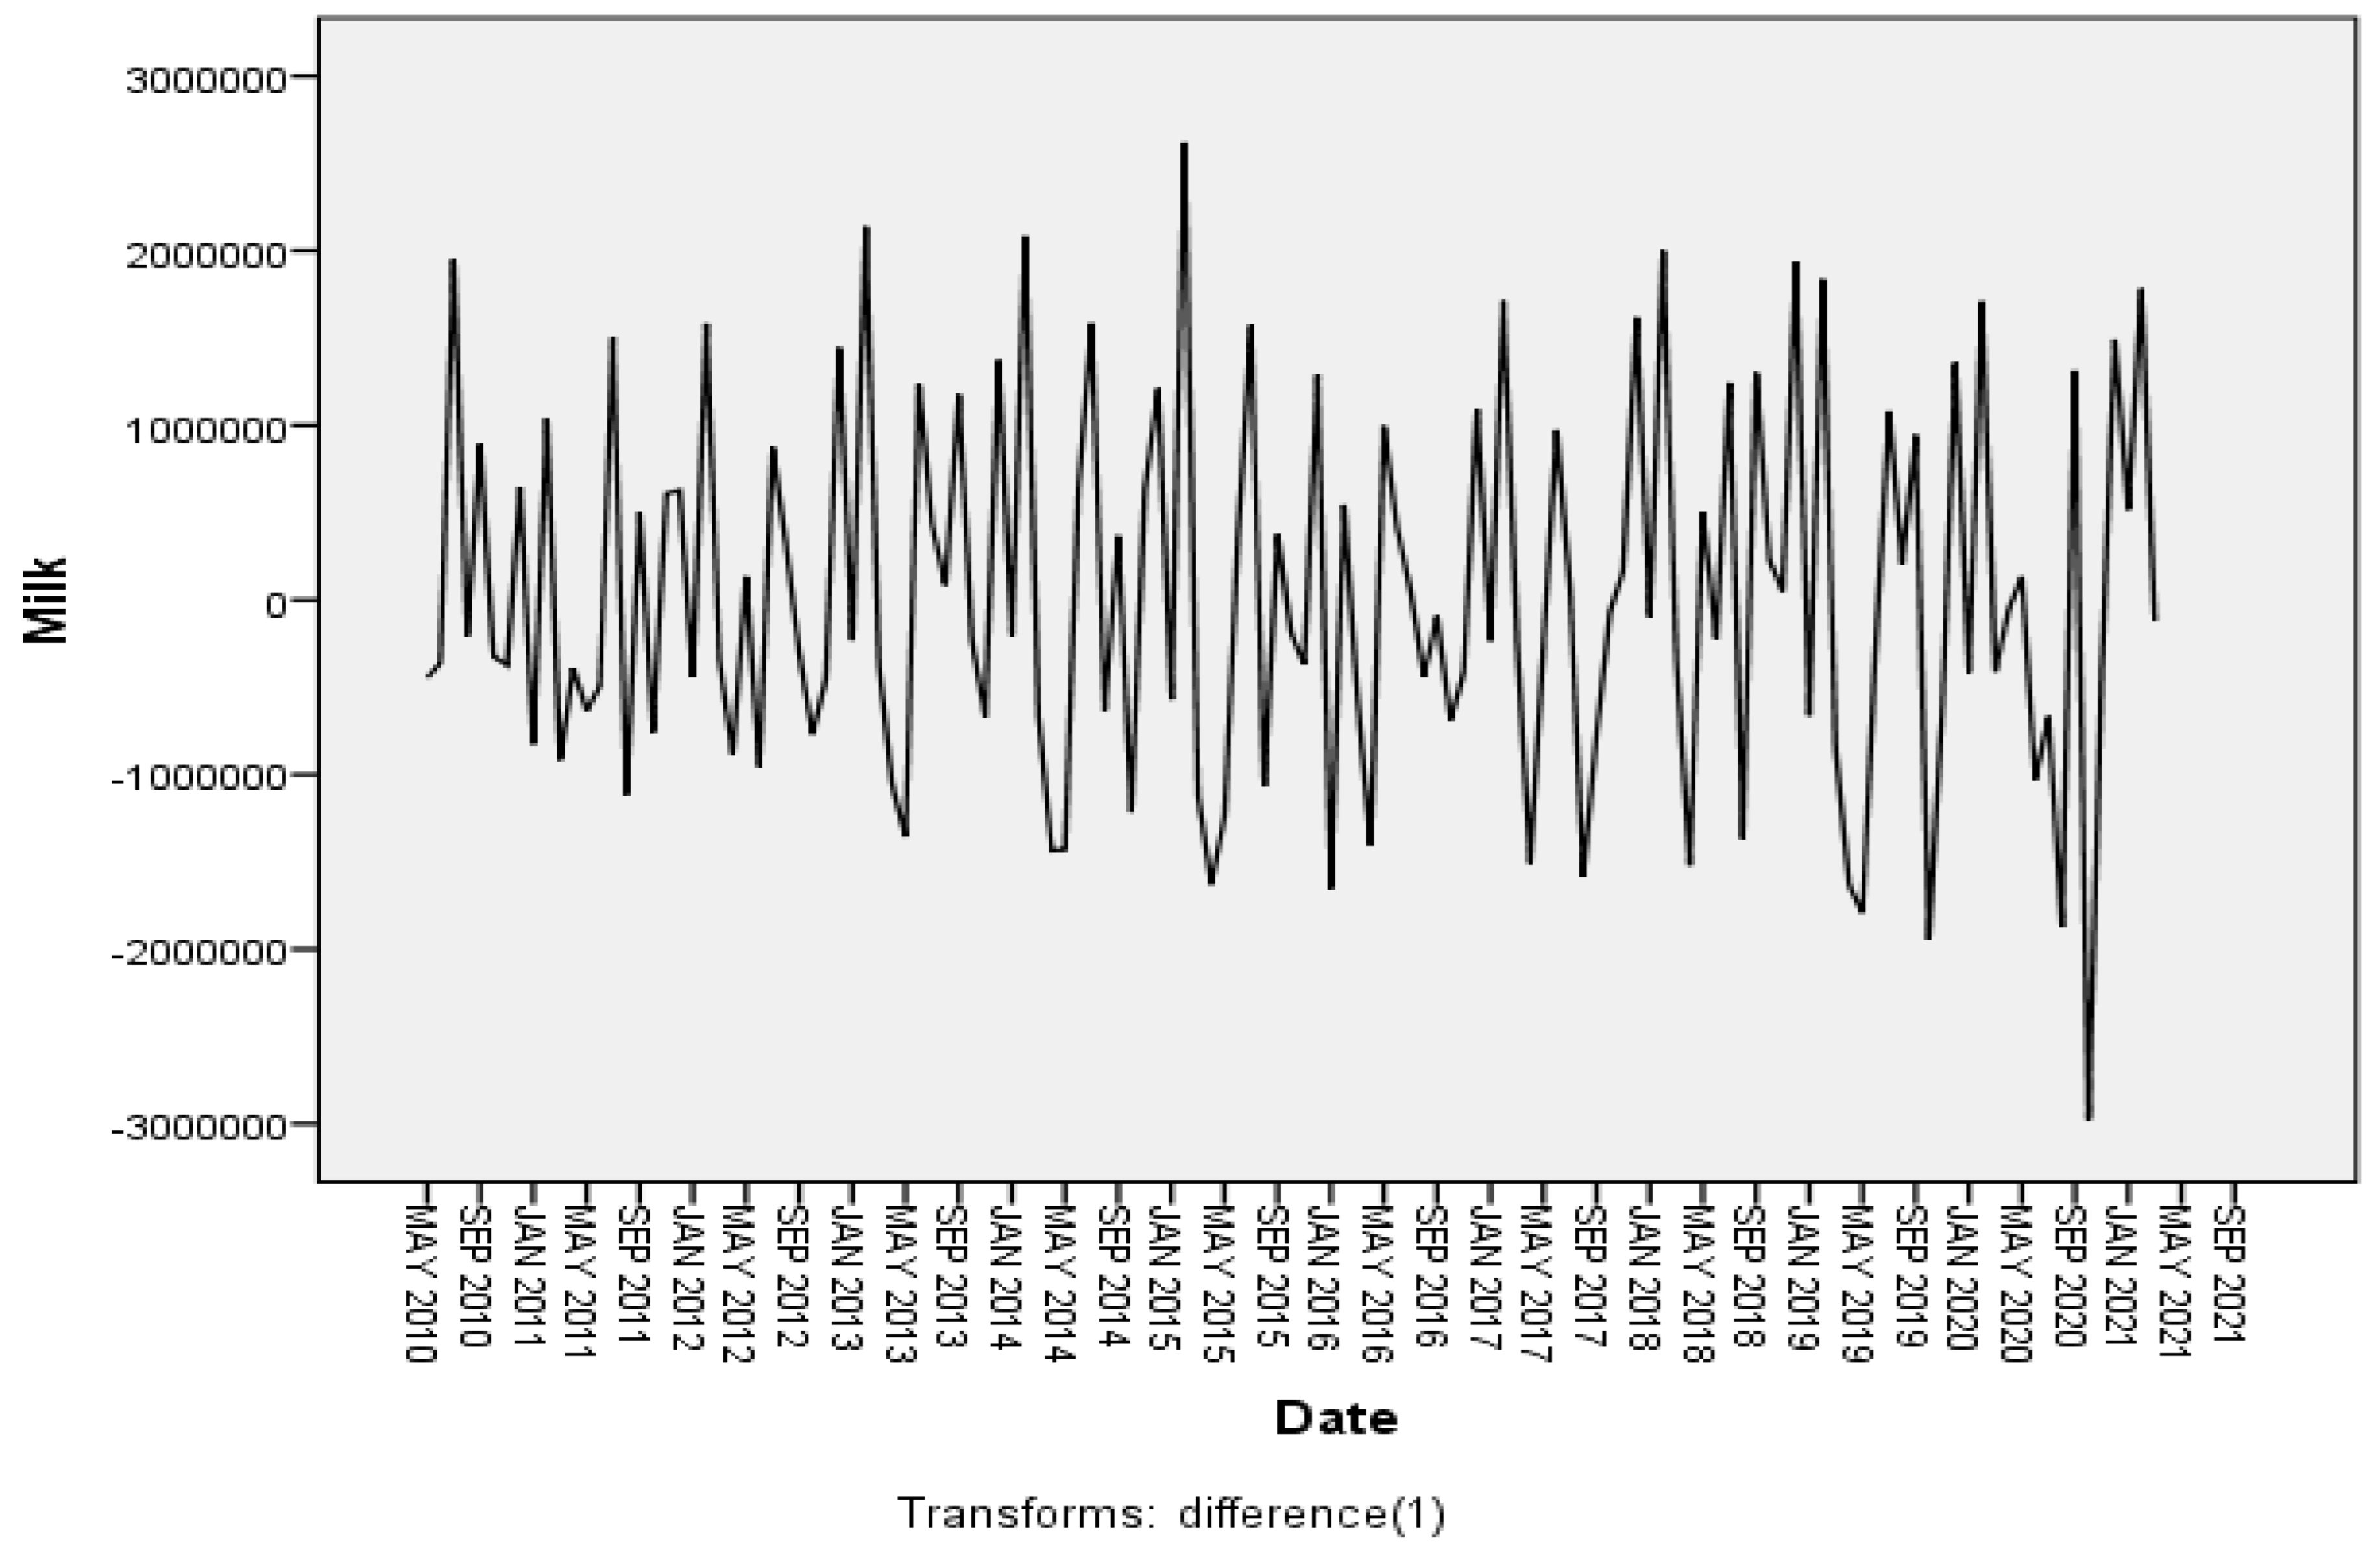
2. Materials and Methods

Forecasting is a method that utilizes historical data as inputs to generate educated estimates that can be used to make accurate predictions about the trajectory of future trends [25,26]. This kind of demand forecasting is essentially a technique that makes use of local sales history and incorporates a search for the foreseeable future [27]. Forecasting, in its most basic form, refers to making predictions which can be carried out with or without the assistance of historical information [28]. This study has incorporated the following methodology, as shown in Figure 1. The paper begins with a comprehensive literature review on forecasting using the ARIMA model, followed by data collection from Company ‘X’. The data considered for the study is from the period of April 2010–October 2021, and an ARIMA model is formulated to predict milk production for the upcoming months. The initial model is developed using data from April 2010 to March 2021 to predict milk production from April 2021 to October 2021. The stationarity of the gathered data is assessed to apply the ARIMA model, which is an extension of the autoregressive (AR) and moving average (MA) models.
As per the ARIMA model, the analyzed time-series data can be described as a linear combination of their previous values and unpredictable disturbances [29,30,31]. This model is characterized by three key components: p (representing the autoregressive order), d (indicating the order of differencing required to achieve stationarity), and q (denoting the moving average order). Table 1 demonstrates the model’s mathematical form [32,33].
As the estimate approach is only applicable to stationary series, ensuring that the series under consideration is stationary is the first and most crucial criterion for ARIMA modelling [34,35]. If neither a series’ mean nor its autocorrelation change over time, it is said to be stationary [36,37]. Using a time plot tests, one must determine whether a time-series is stationary. A non-stationary series may be turned into or recognized as a stationary series through distinguishing. The number of differentiations required to obtain stationarity is indicated by the symbol d, which stands for the order of integration/difference. To predict milk production, the ARIMA model is used once the p, d, and q values are obtained. The statistical program SPSS is utilized in this paper’s ARIMA modelling. Data transformation, regression analysis, variance analysis, multivariate analysis of variance, analysis of covariance, t-tests, non-parametric tests, time-series forecasting, and many more statistical applications may all be performed using SPSS [38,39,40].

3. Model Formation

The ARIMA model involves multiple processes to arrive at a final forecasting value [41]. A variety of tools are used in the forecasting process, including ACF and PACF [42], both of which play an important role. The data obtained from Company ‘X’ is plotted in Figure 2, revealing an increasing trend in the data followed by some decreasing trend. To prepare the data for ARIMA analysis, a process called differencing is employed. Differencing involves subtracting a previous observation from the current one to stabilize the data and make it suitable for ARIMA modeling. In the case at hand, this differencing process is depicted in Figure 3 and Figure 4.
As illustrated in Figure 3, an initial differencing of d = 1 is applied to the data. This transformation is employed to remove any linear trends or periodic fluctuations in the data. However, upon closer examination of the results in Figure 3, it becomes apparent that the data still exhibit deviations from a consistent mean value. This indicates the presence of further non-stationarity, prompting the need for an additional differencing step. In Figure 4, a second differencing operation, denoted by d = 2, is executed. This second differencing process serves to further stabilize the data by eliminating any residual fluctuations and ensuring that the data adhere to a constant mean. The result, as depicted in Figure 4, showcases data that appear more stationary, making them better suited for ARIMA modeling. Consequently, ACF and PACF are used to determine the value of p and q [43]. If the ACF is geometric and the PACF is significant to lag p, then the MA component will be zero, i.e., p = 0, as shown in Table 2. Similarly, if the PACF is geometric and ACF is significant to lag q, then the AR component will be zero, i.e., q = 0. However, if both components are significant, then both p and q are considered. In this study, the SPSS software is used for the formation of ACF and PACF, followed by the final formation of the model. Initially, the data are input into the software, followed by integrating the difference (d = 2) to deploy ARIMA. The p and q values are identified with the help of ACF and PACF provided by SPSS. The ACF and PACF provided by SPSS are shown in Figure 5 and Figure 6, respectively. The formulation of the model is completely dependent on the values of p, d, and q. As shown in Figure 4, d = 2 provides stationarity to the data. Moreover, the value of p and q is determined with the help of Figure 5 and Figure 6.
After examining the ACF and PACF, it was found that both were significant to lag q (1, 2) and lag p (1, 2), indicating that both the AR and MA components needed to be included in the model [44]. The optimal model for forecasting milk production in North India using the ARIMA model was determined through generating and comparing all the potential models that are described in Table 3.

4. Result and Discussion, Implications, and Limitations

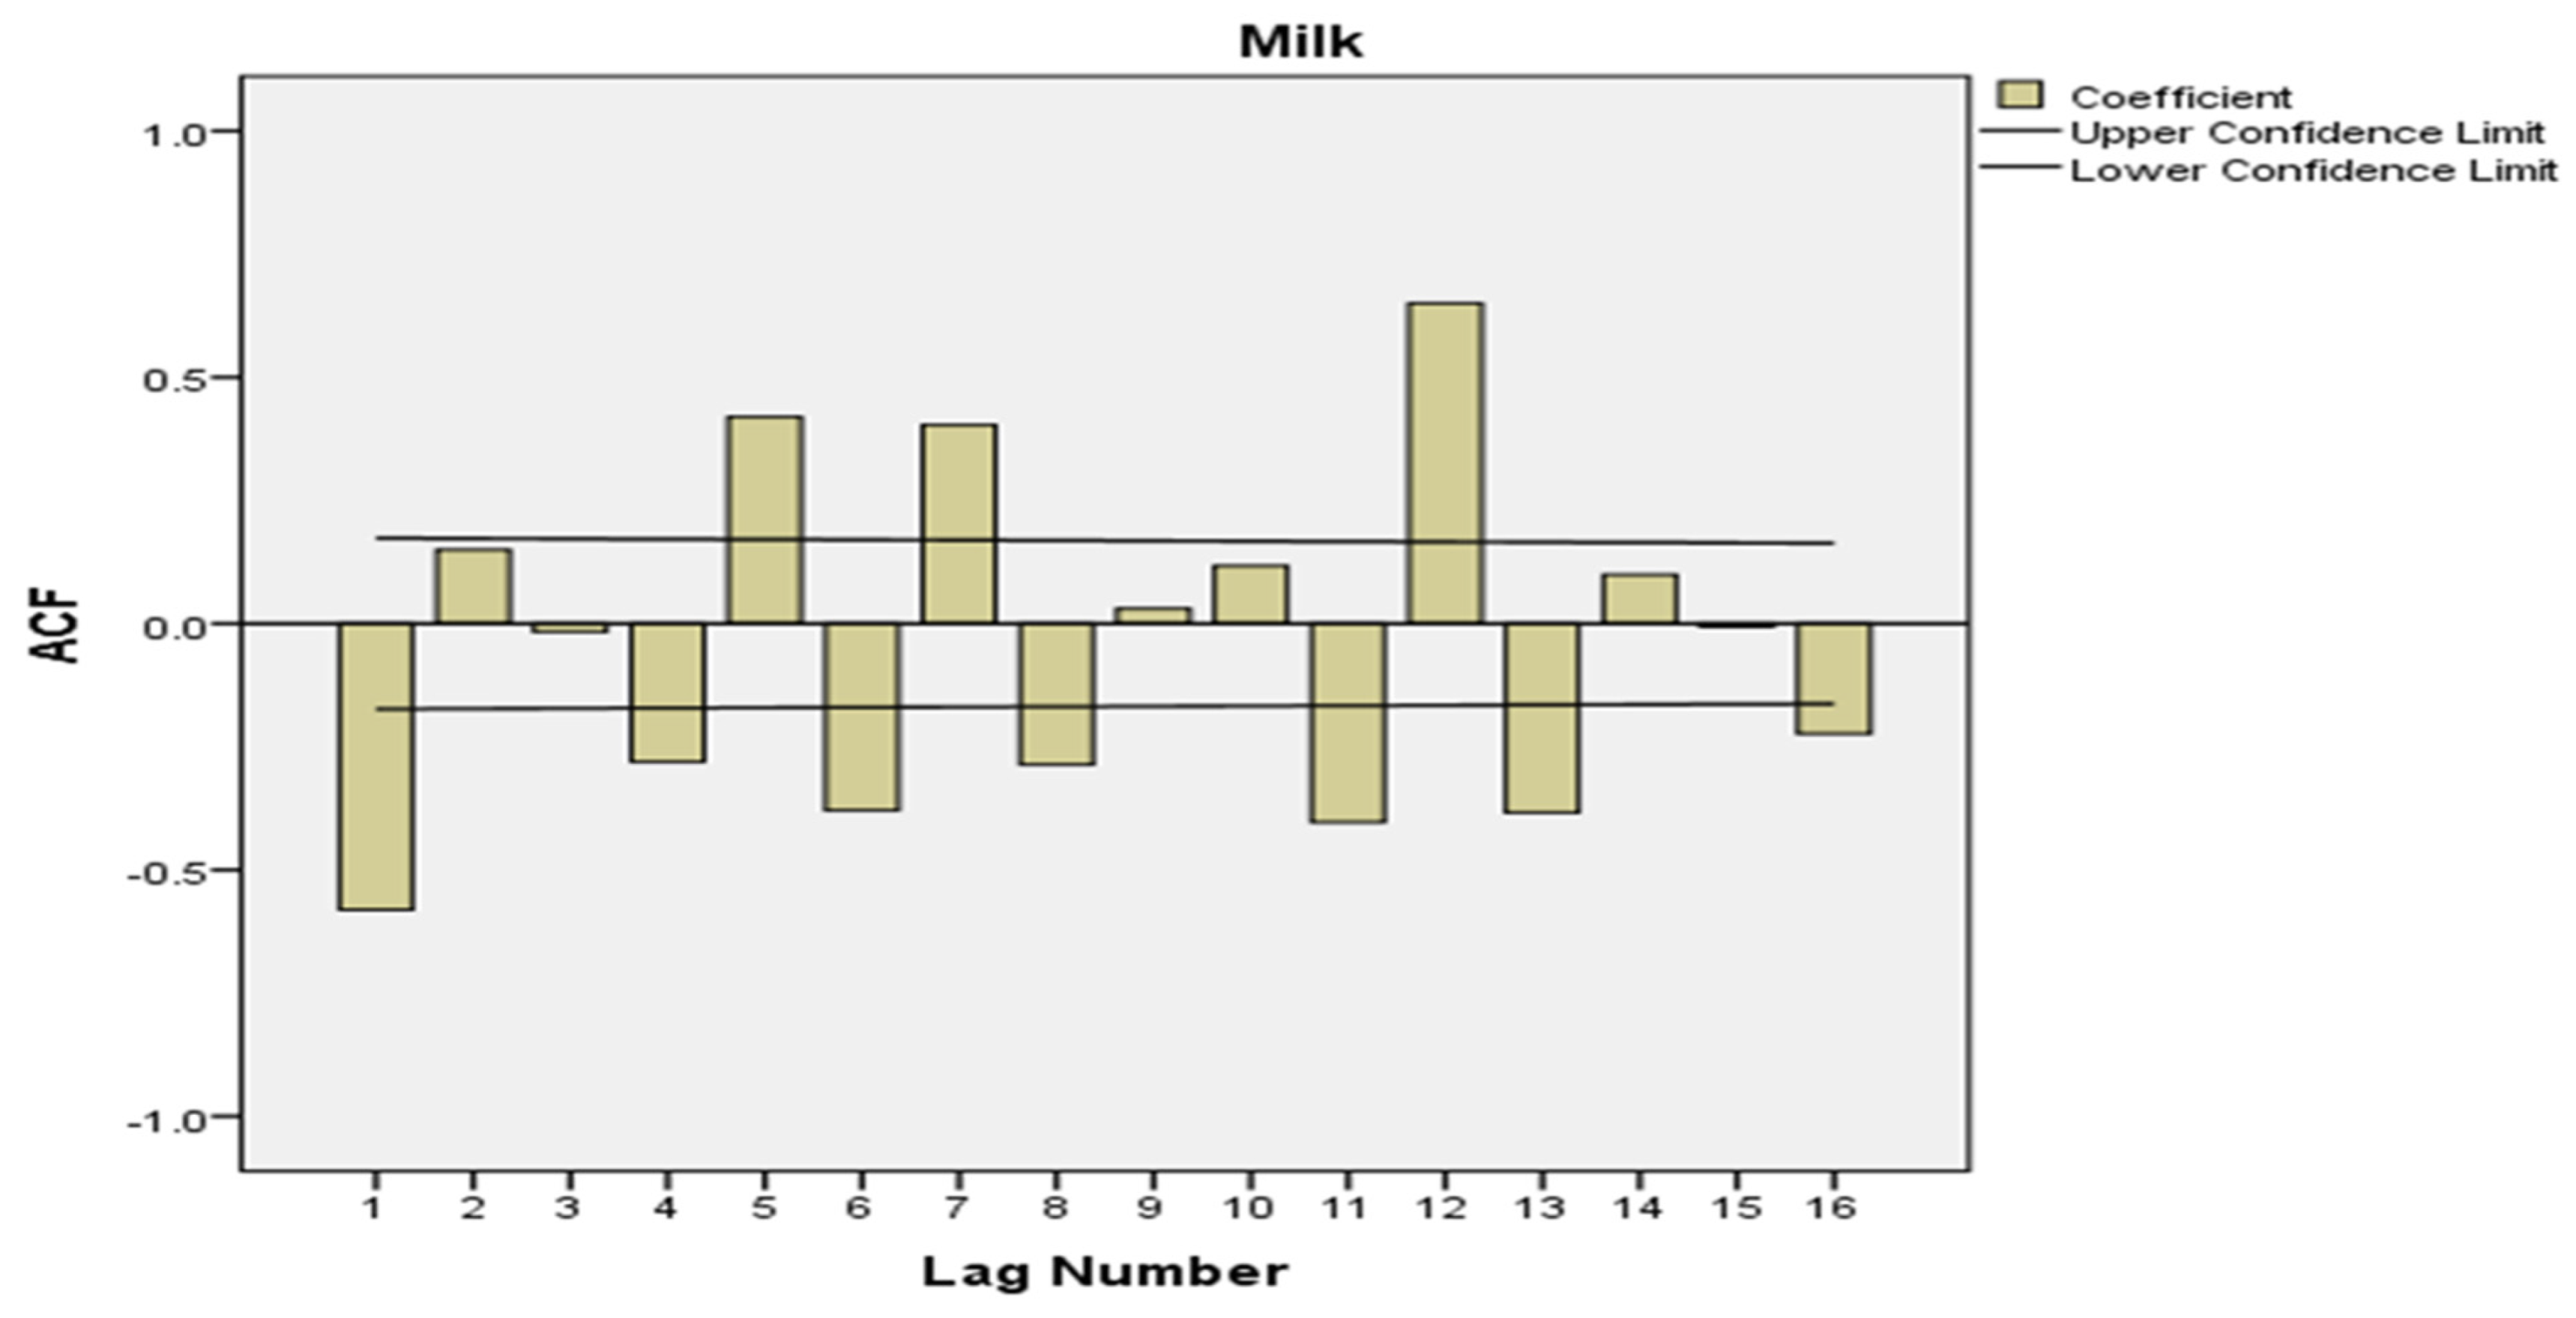
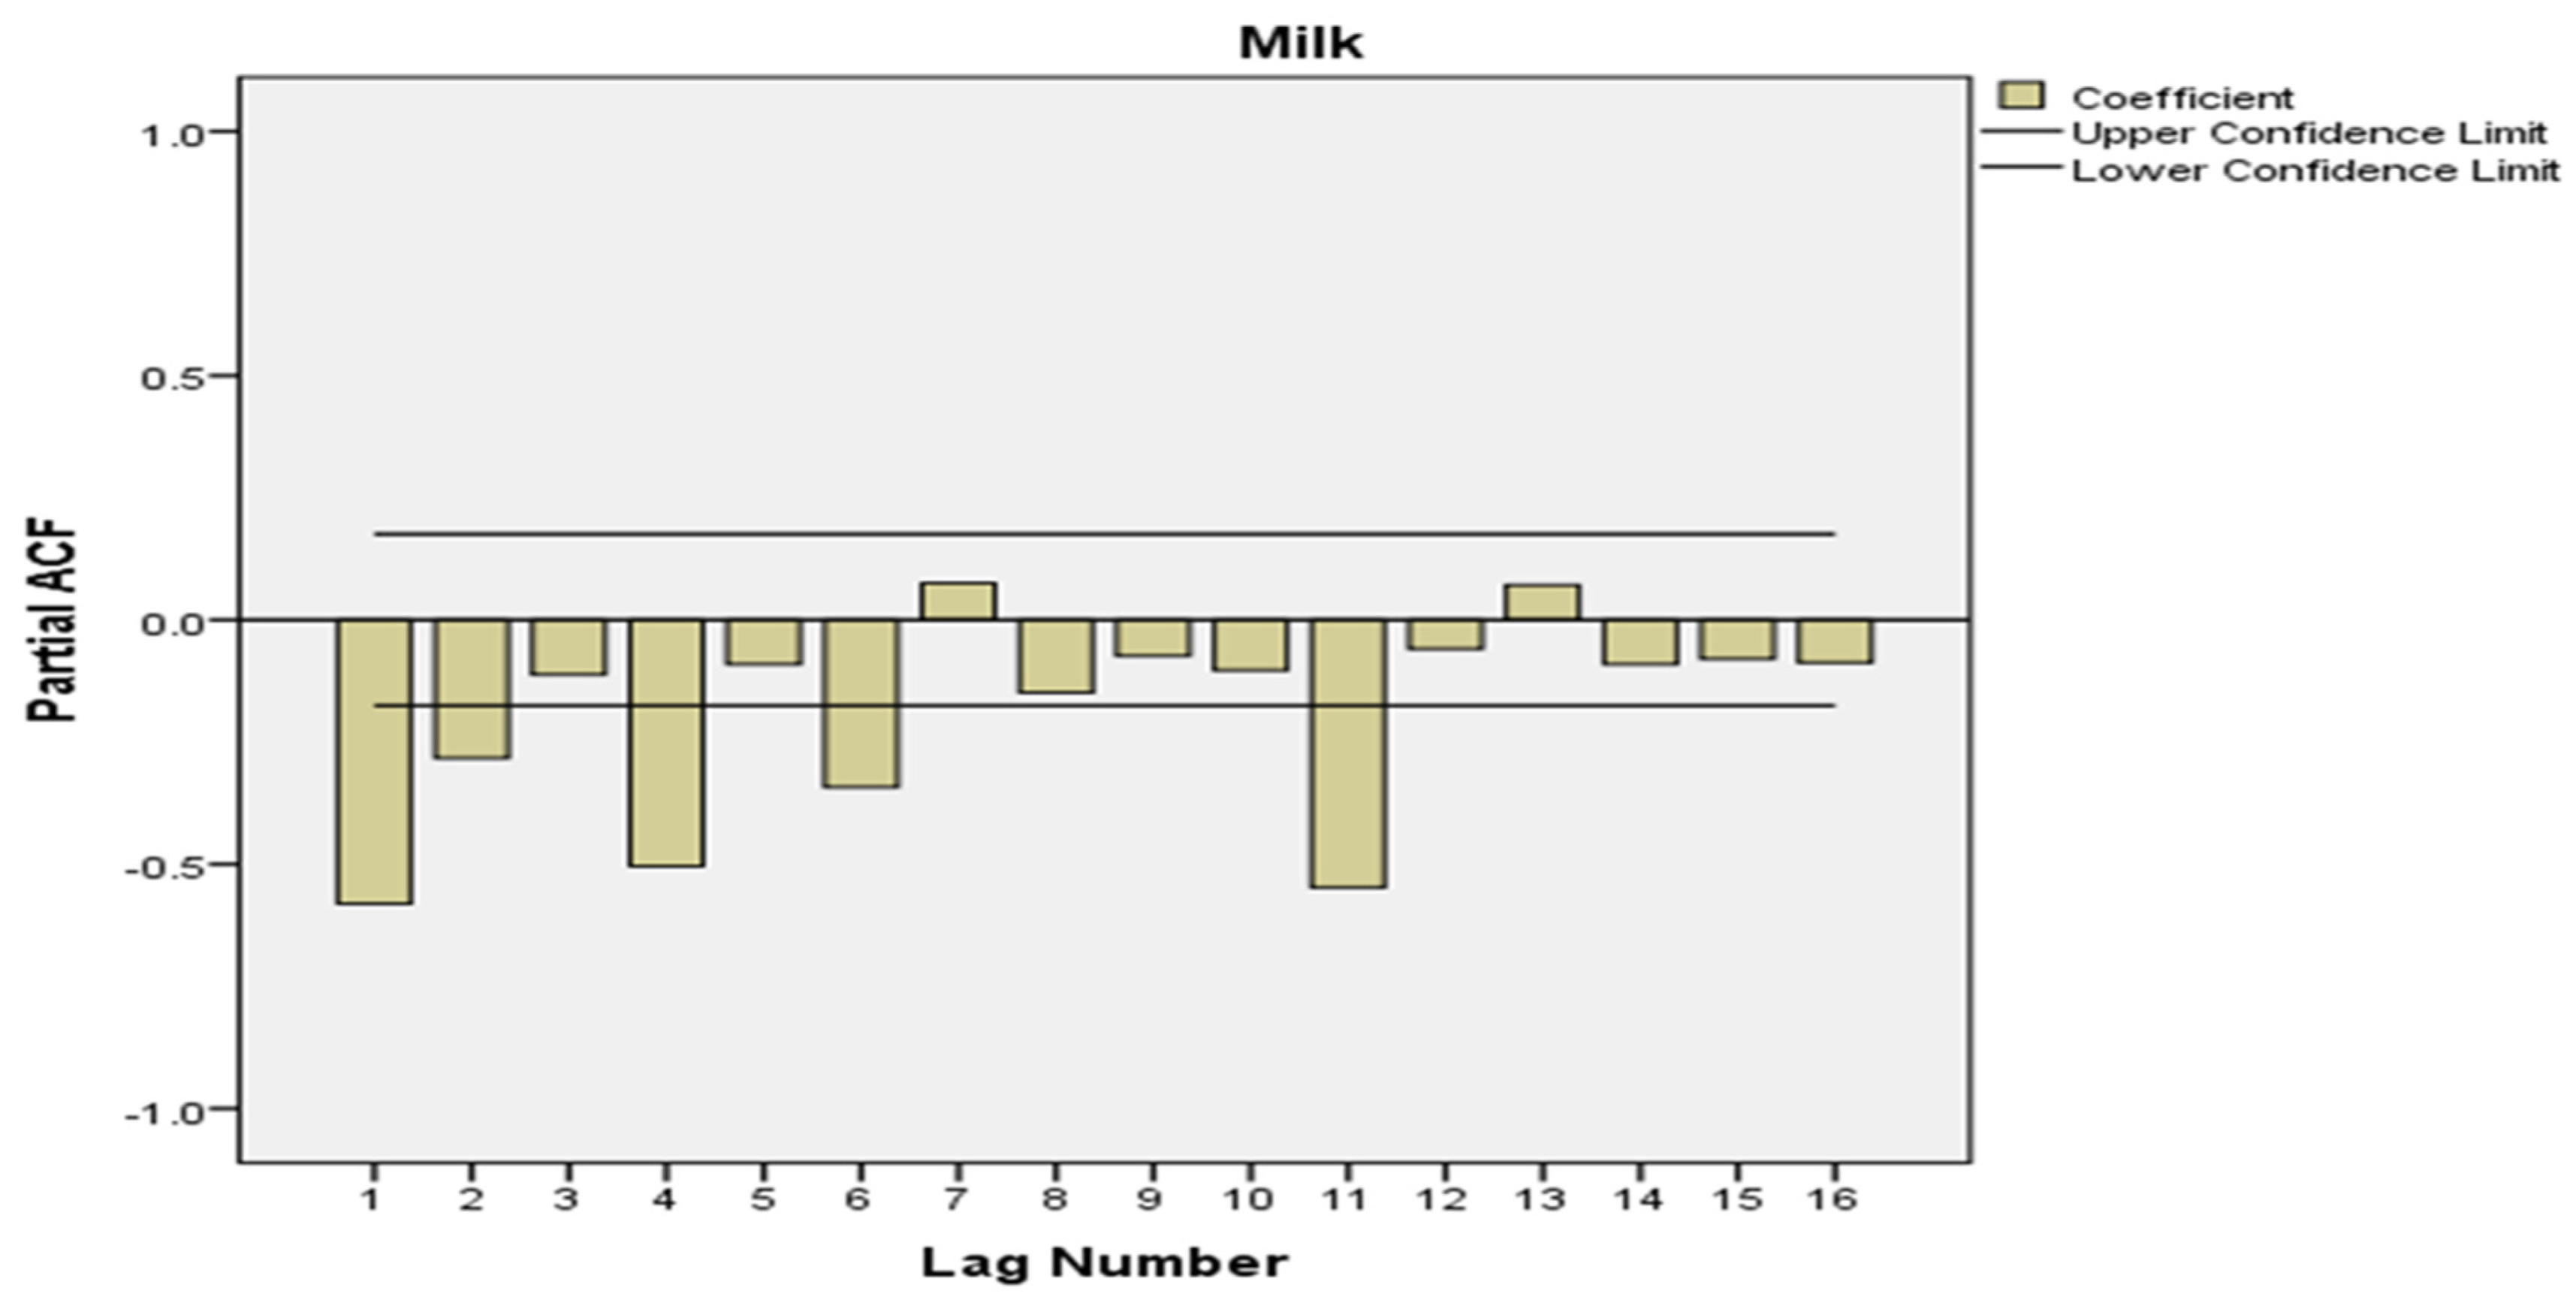
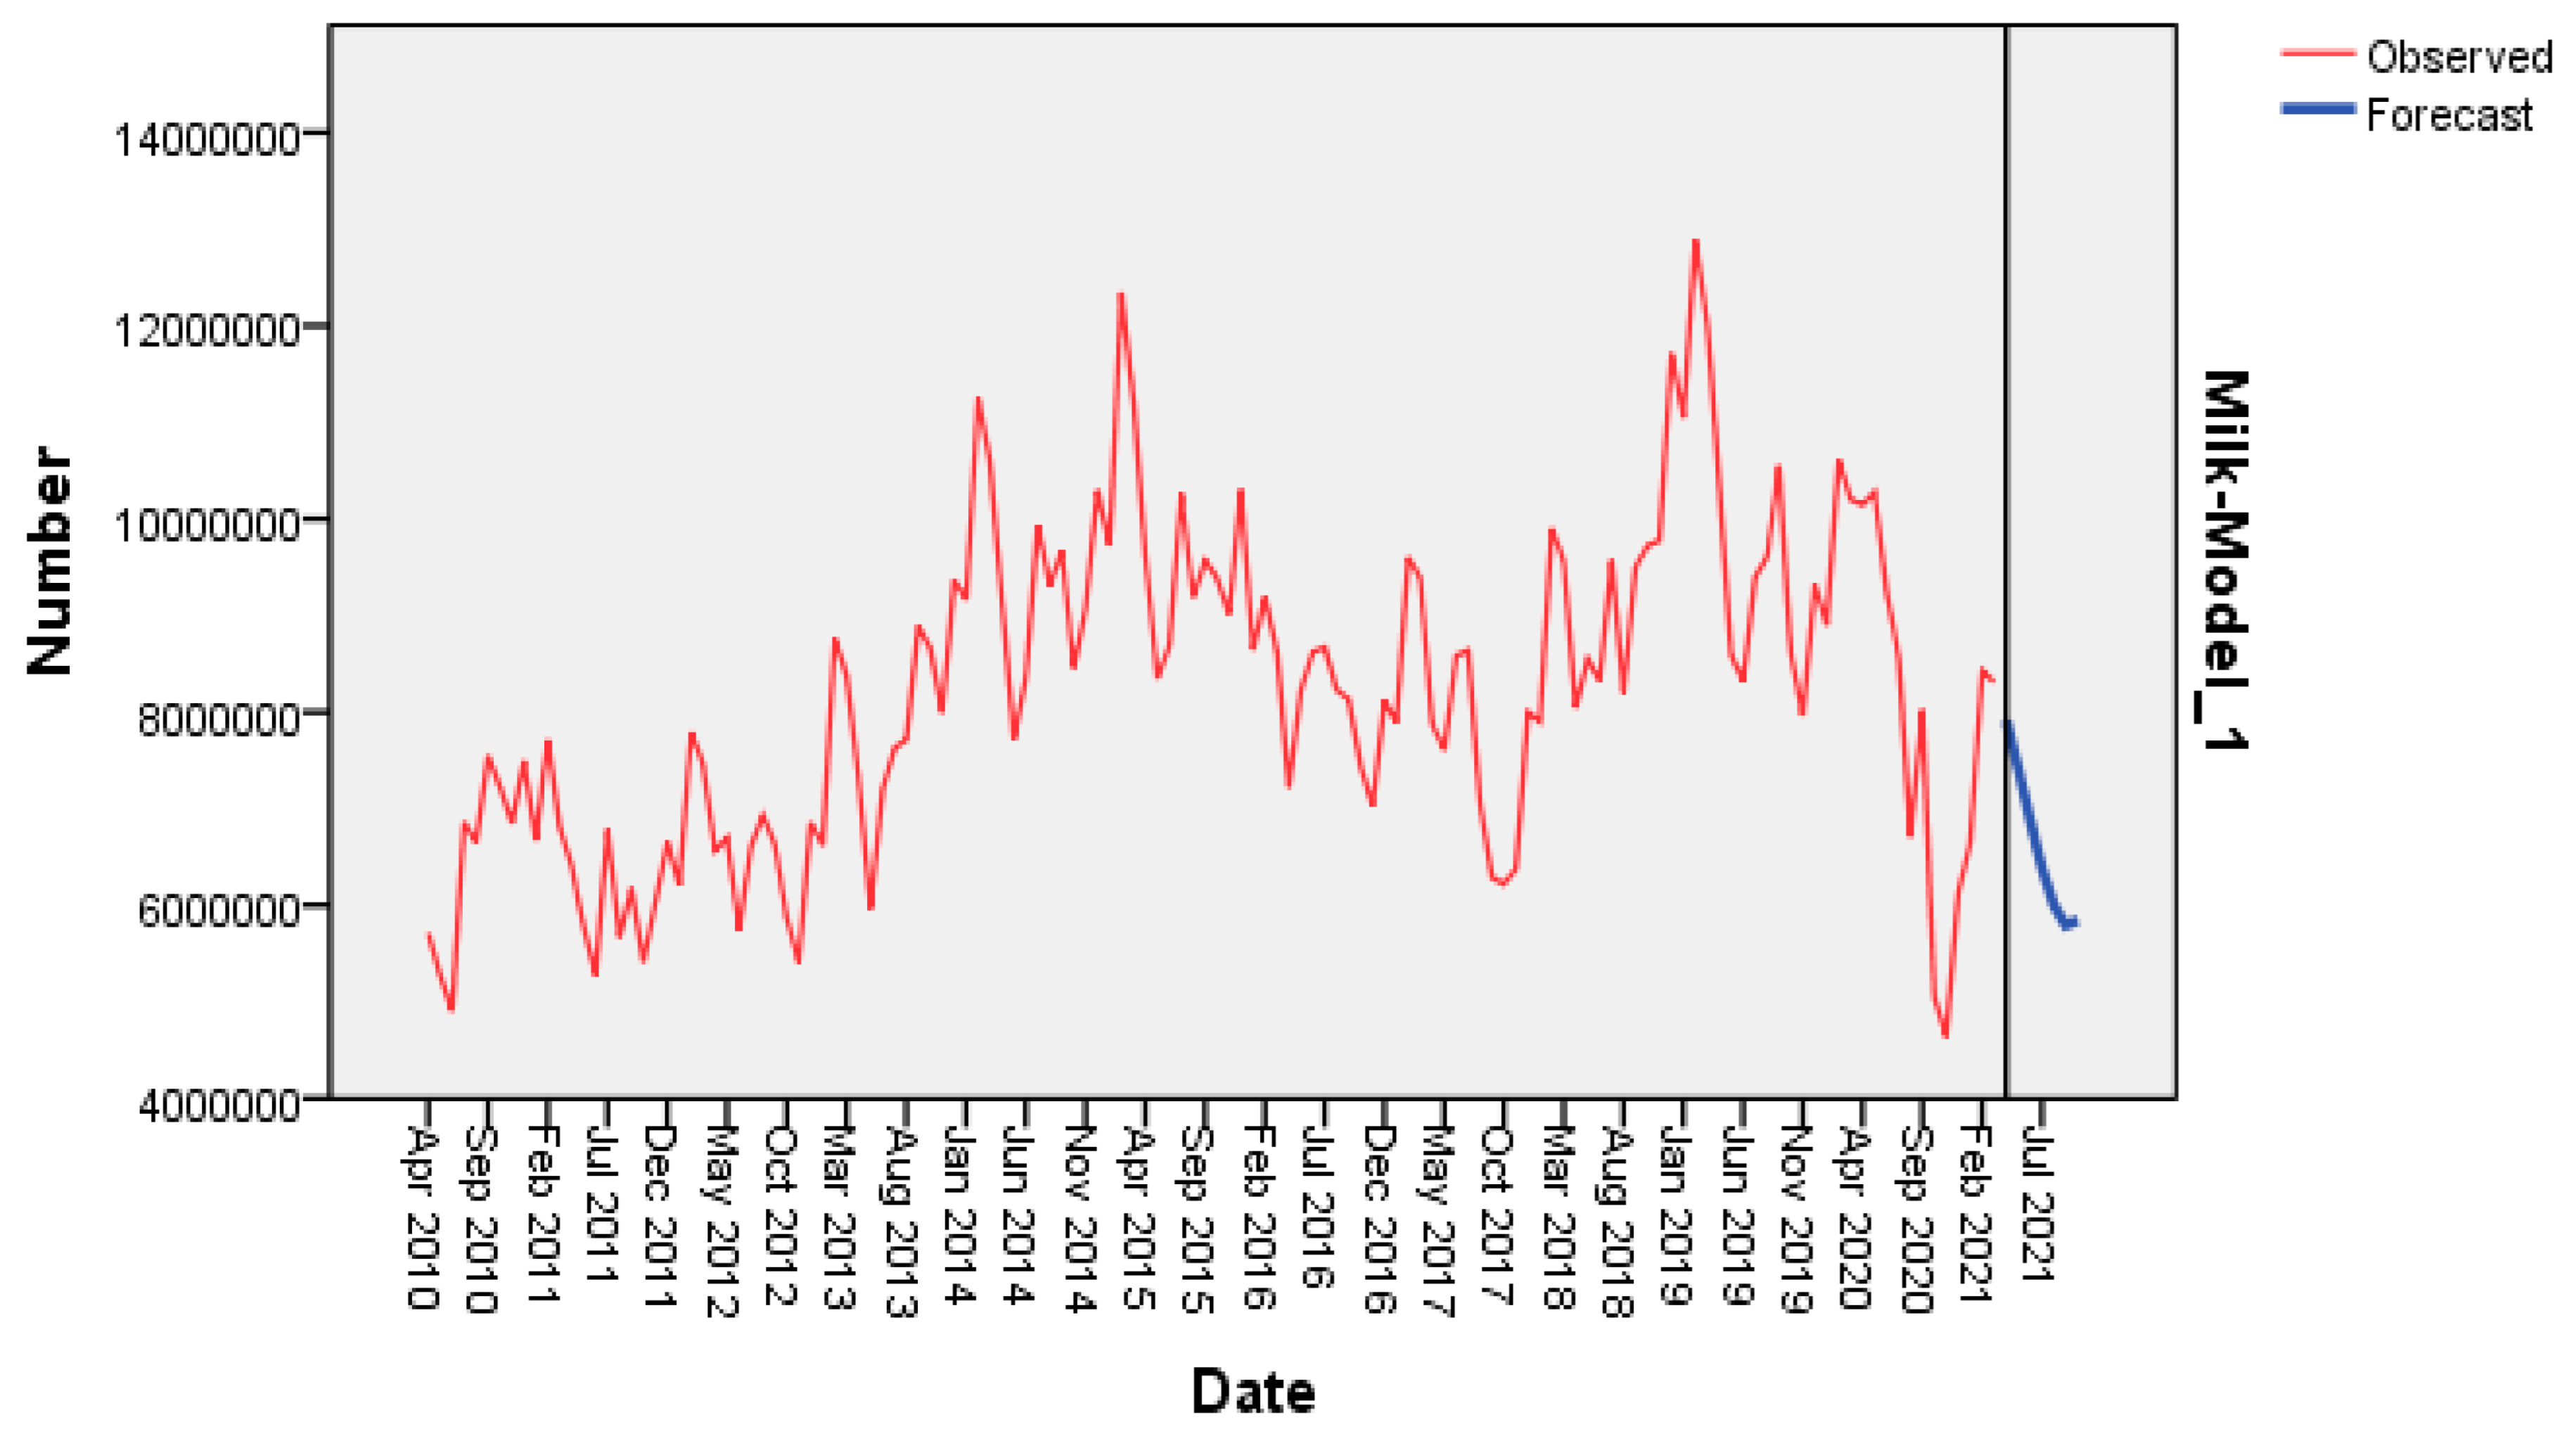
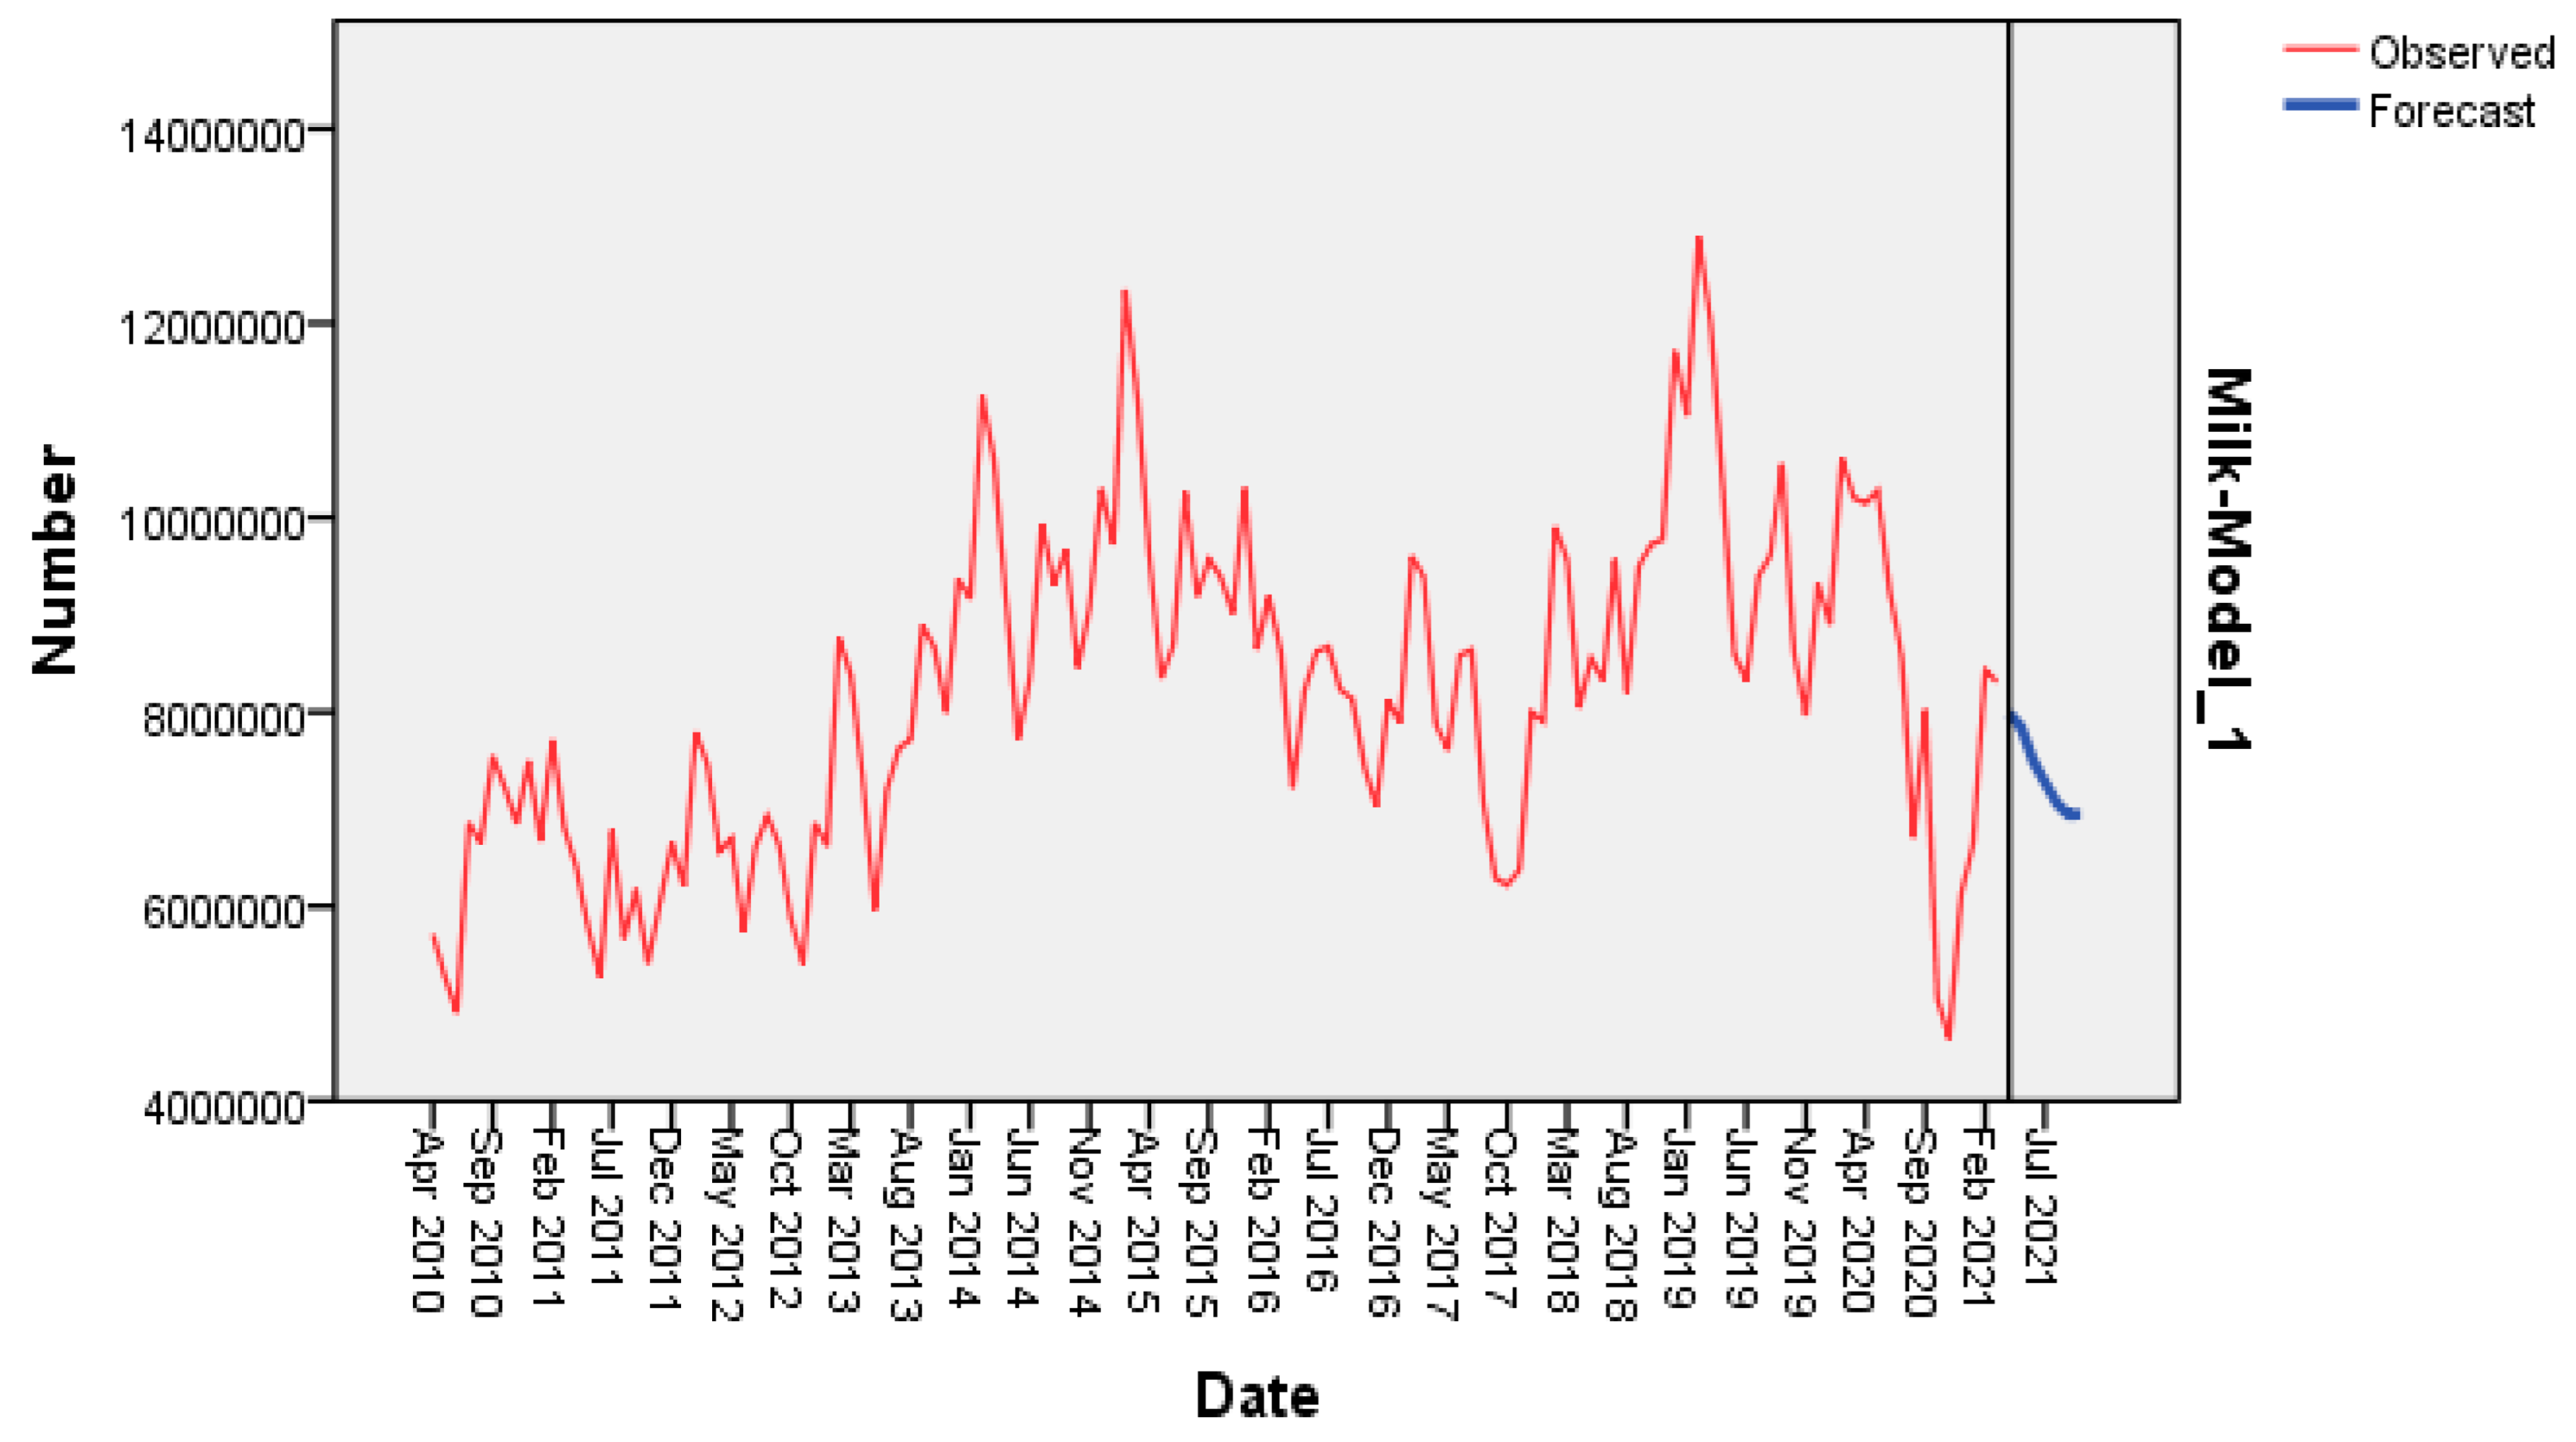
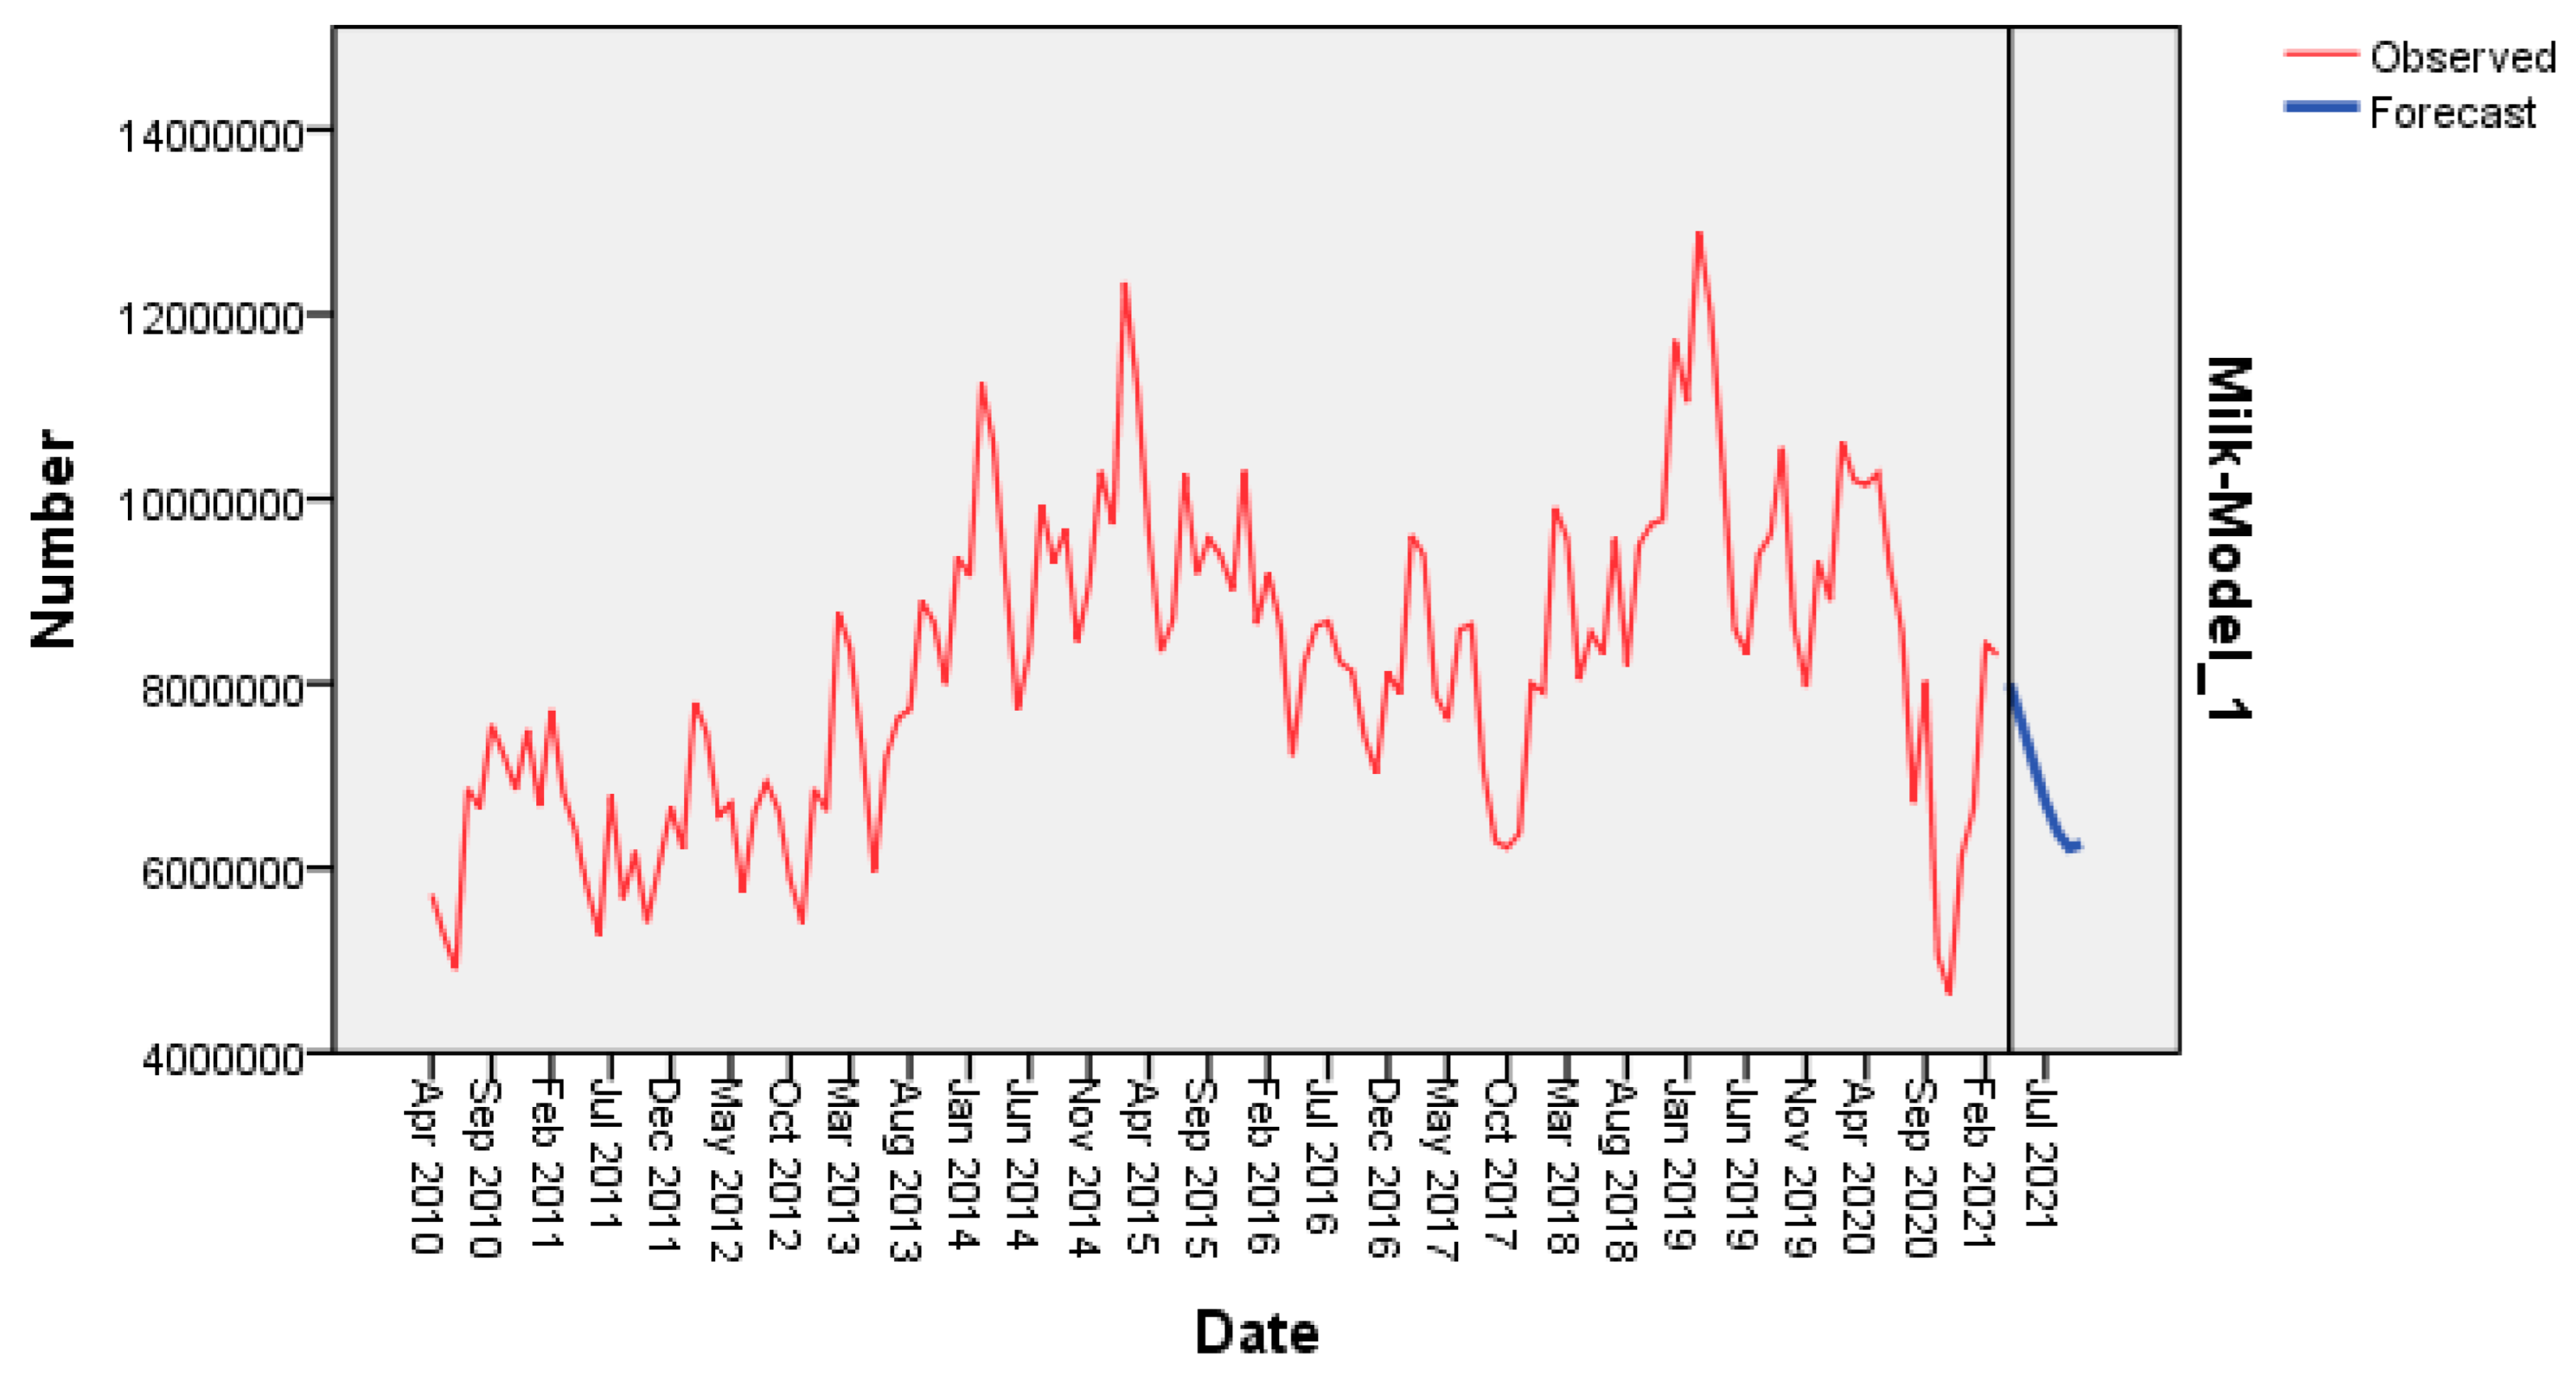
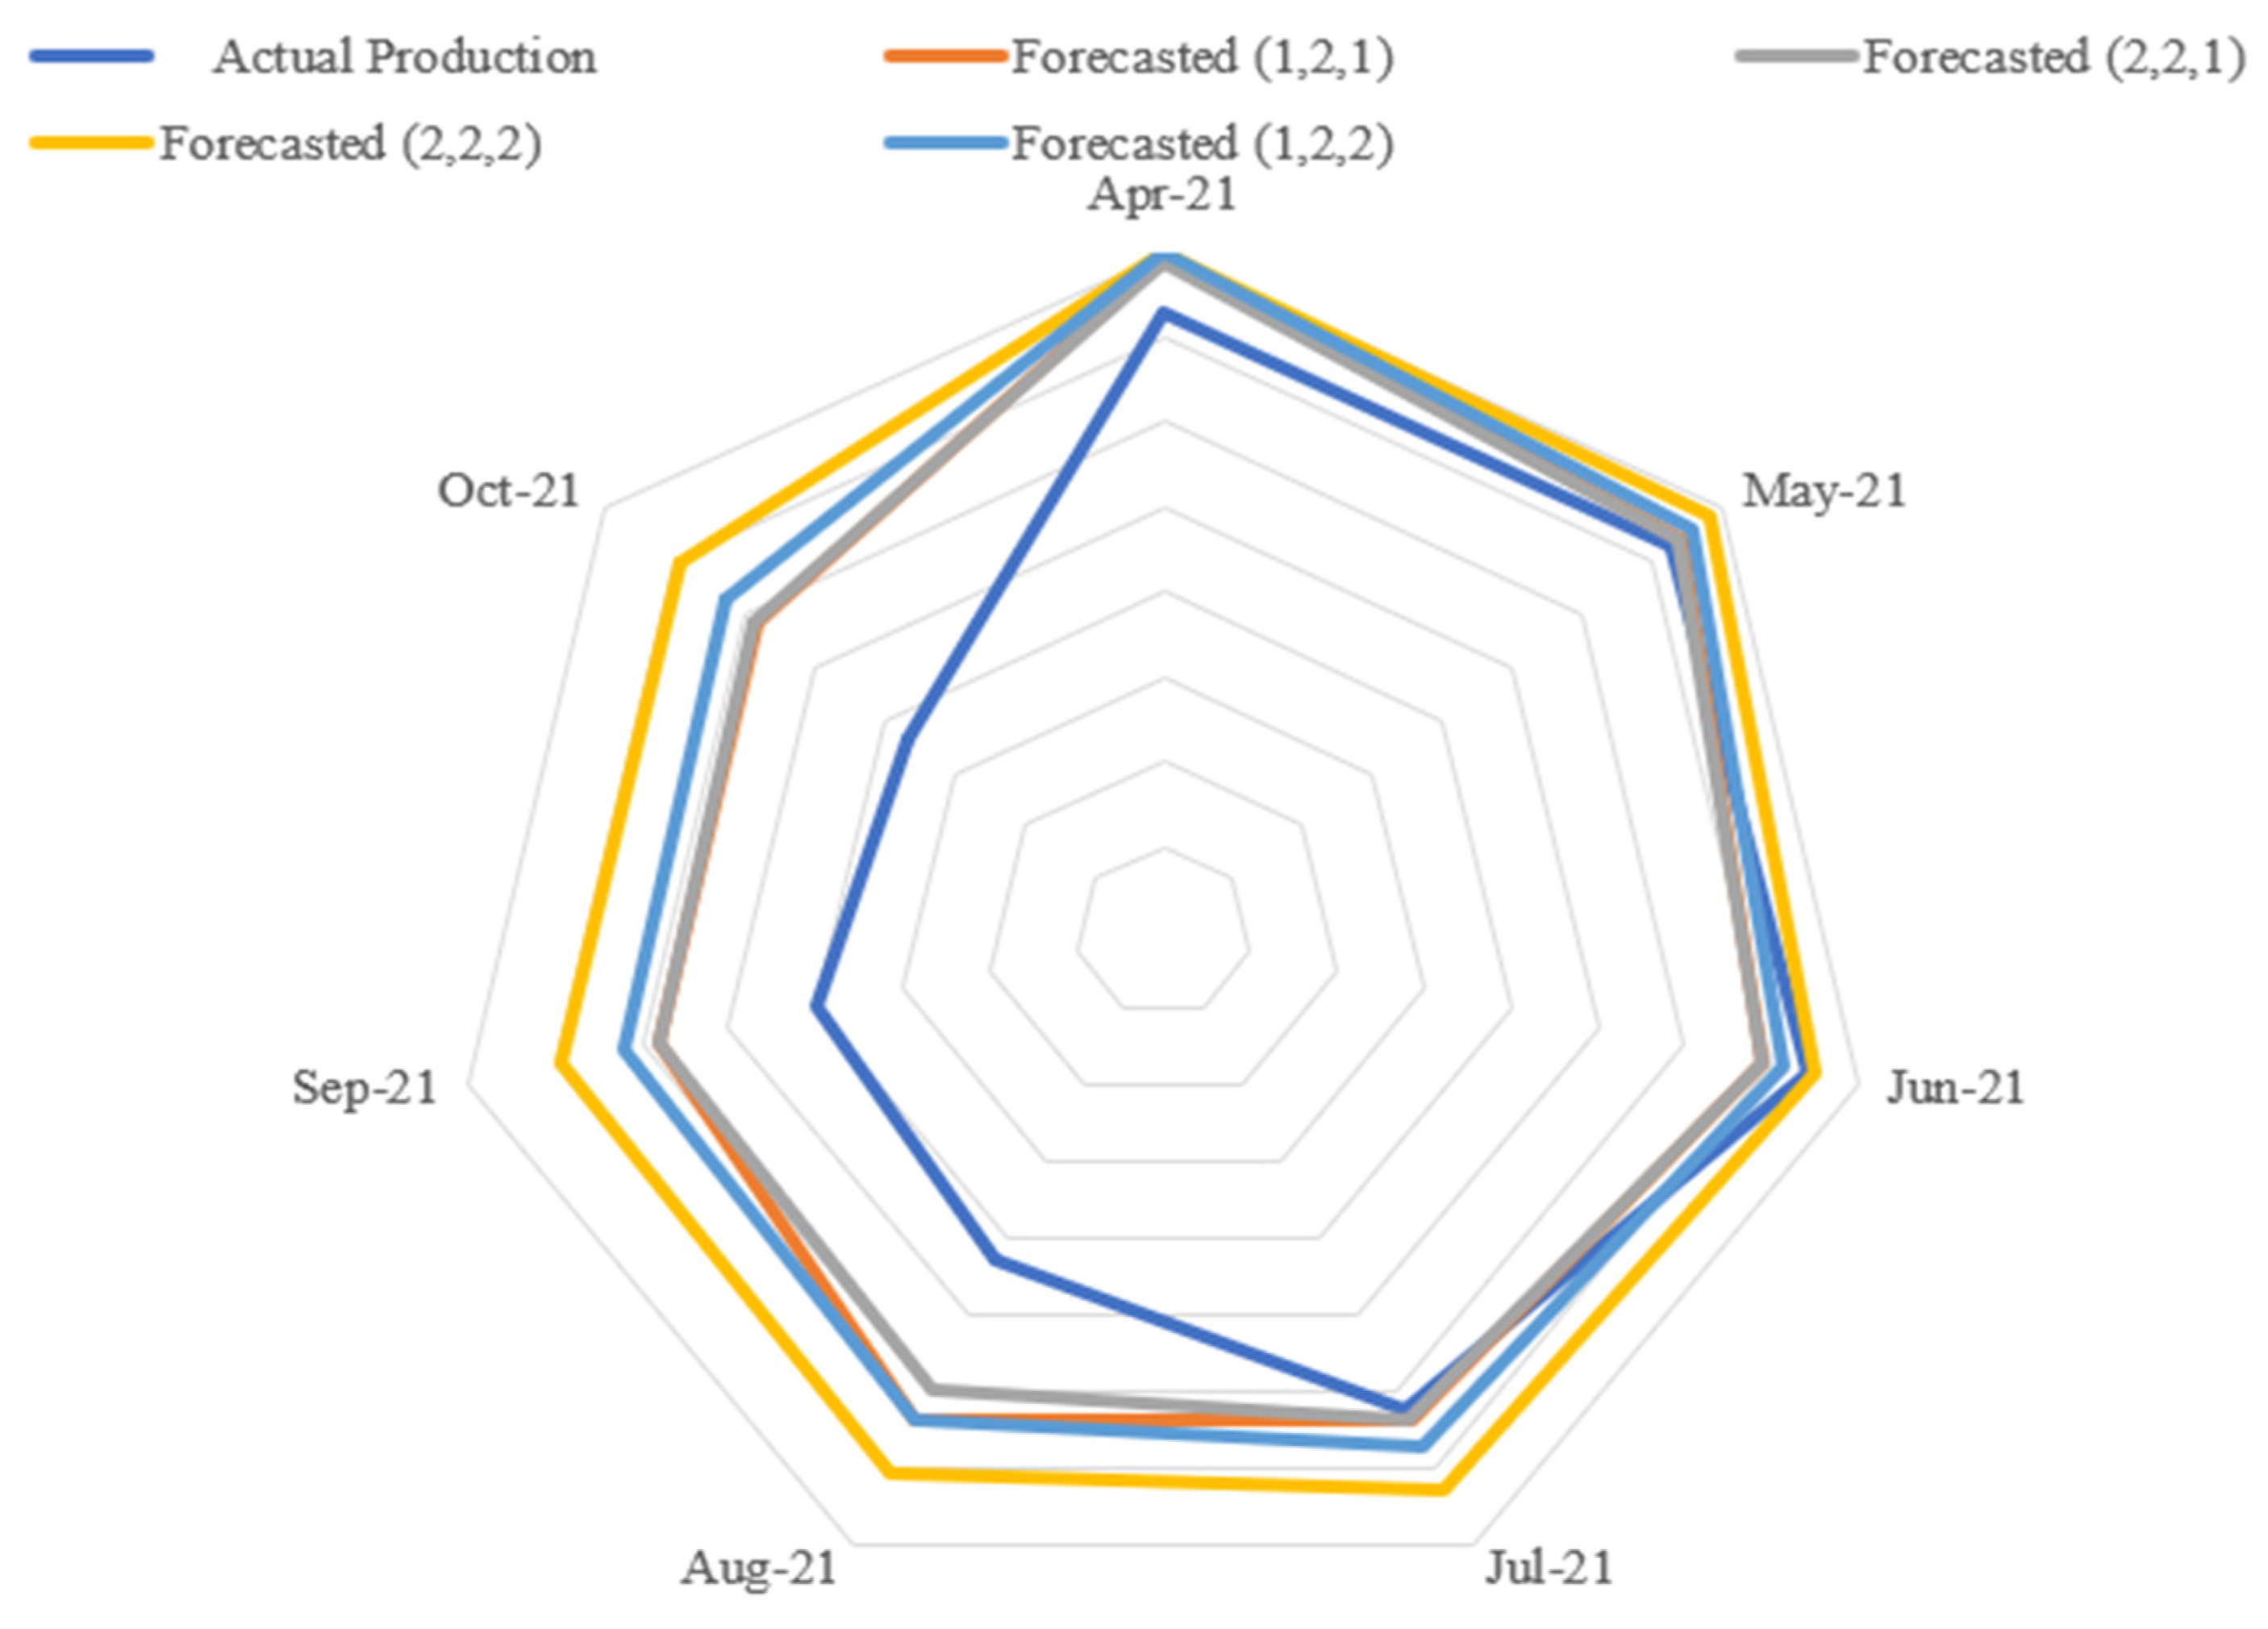
4.1. Results and Discussion
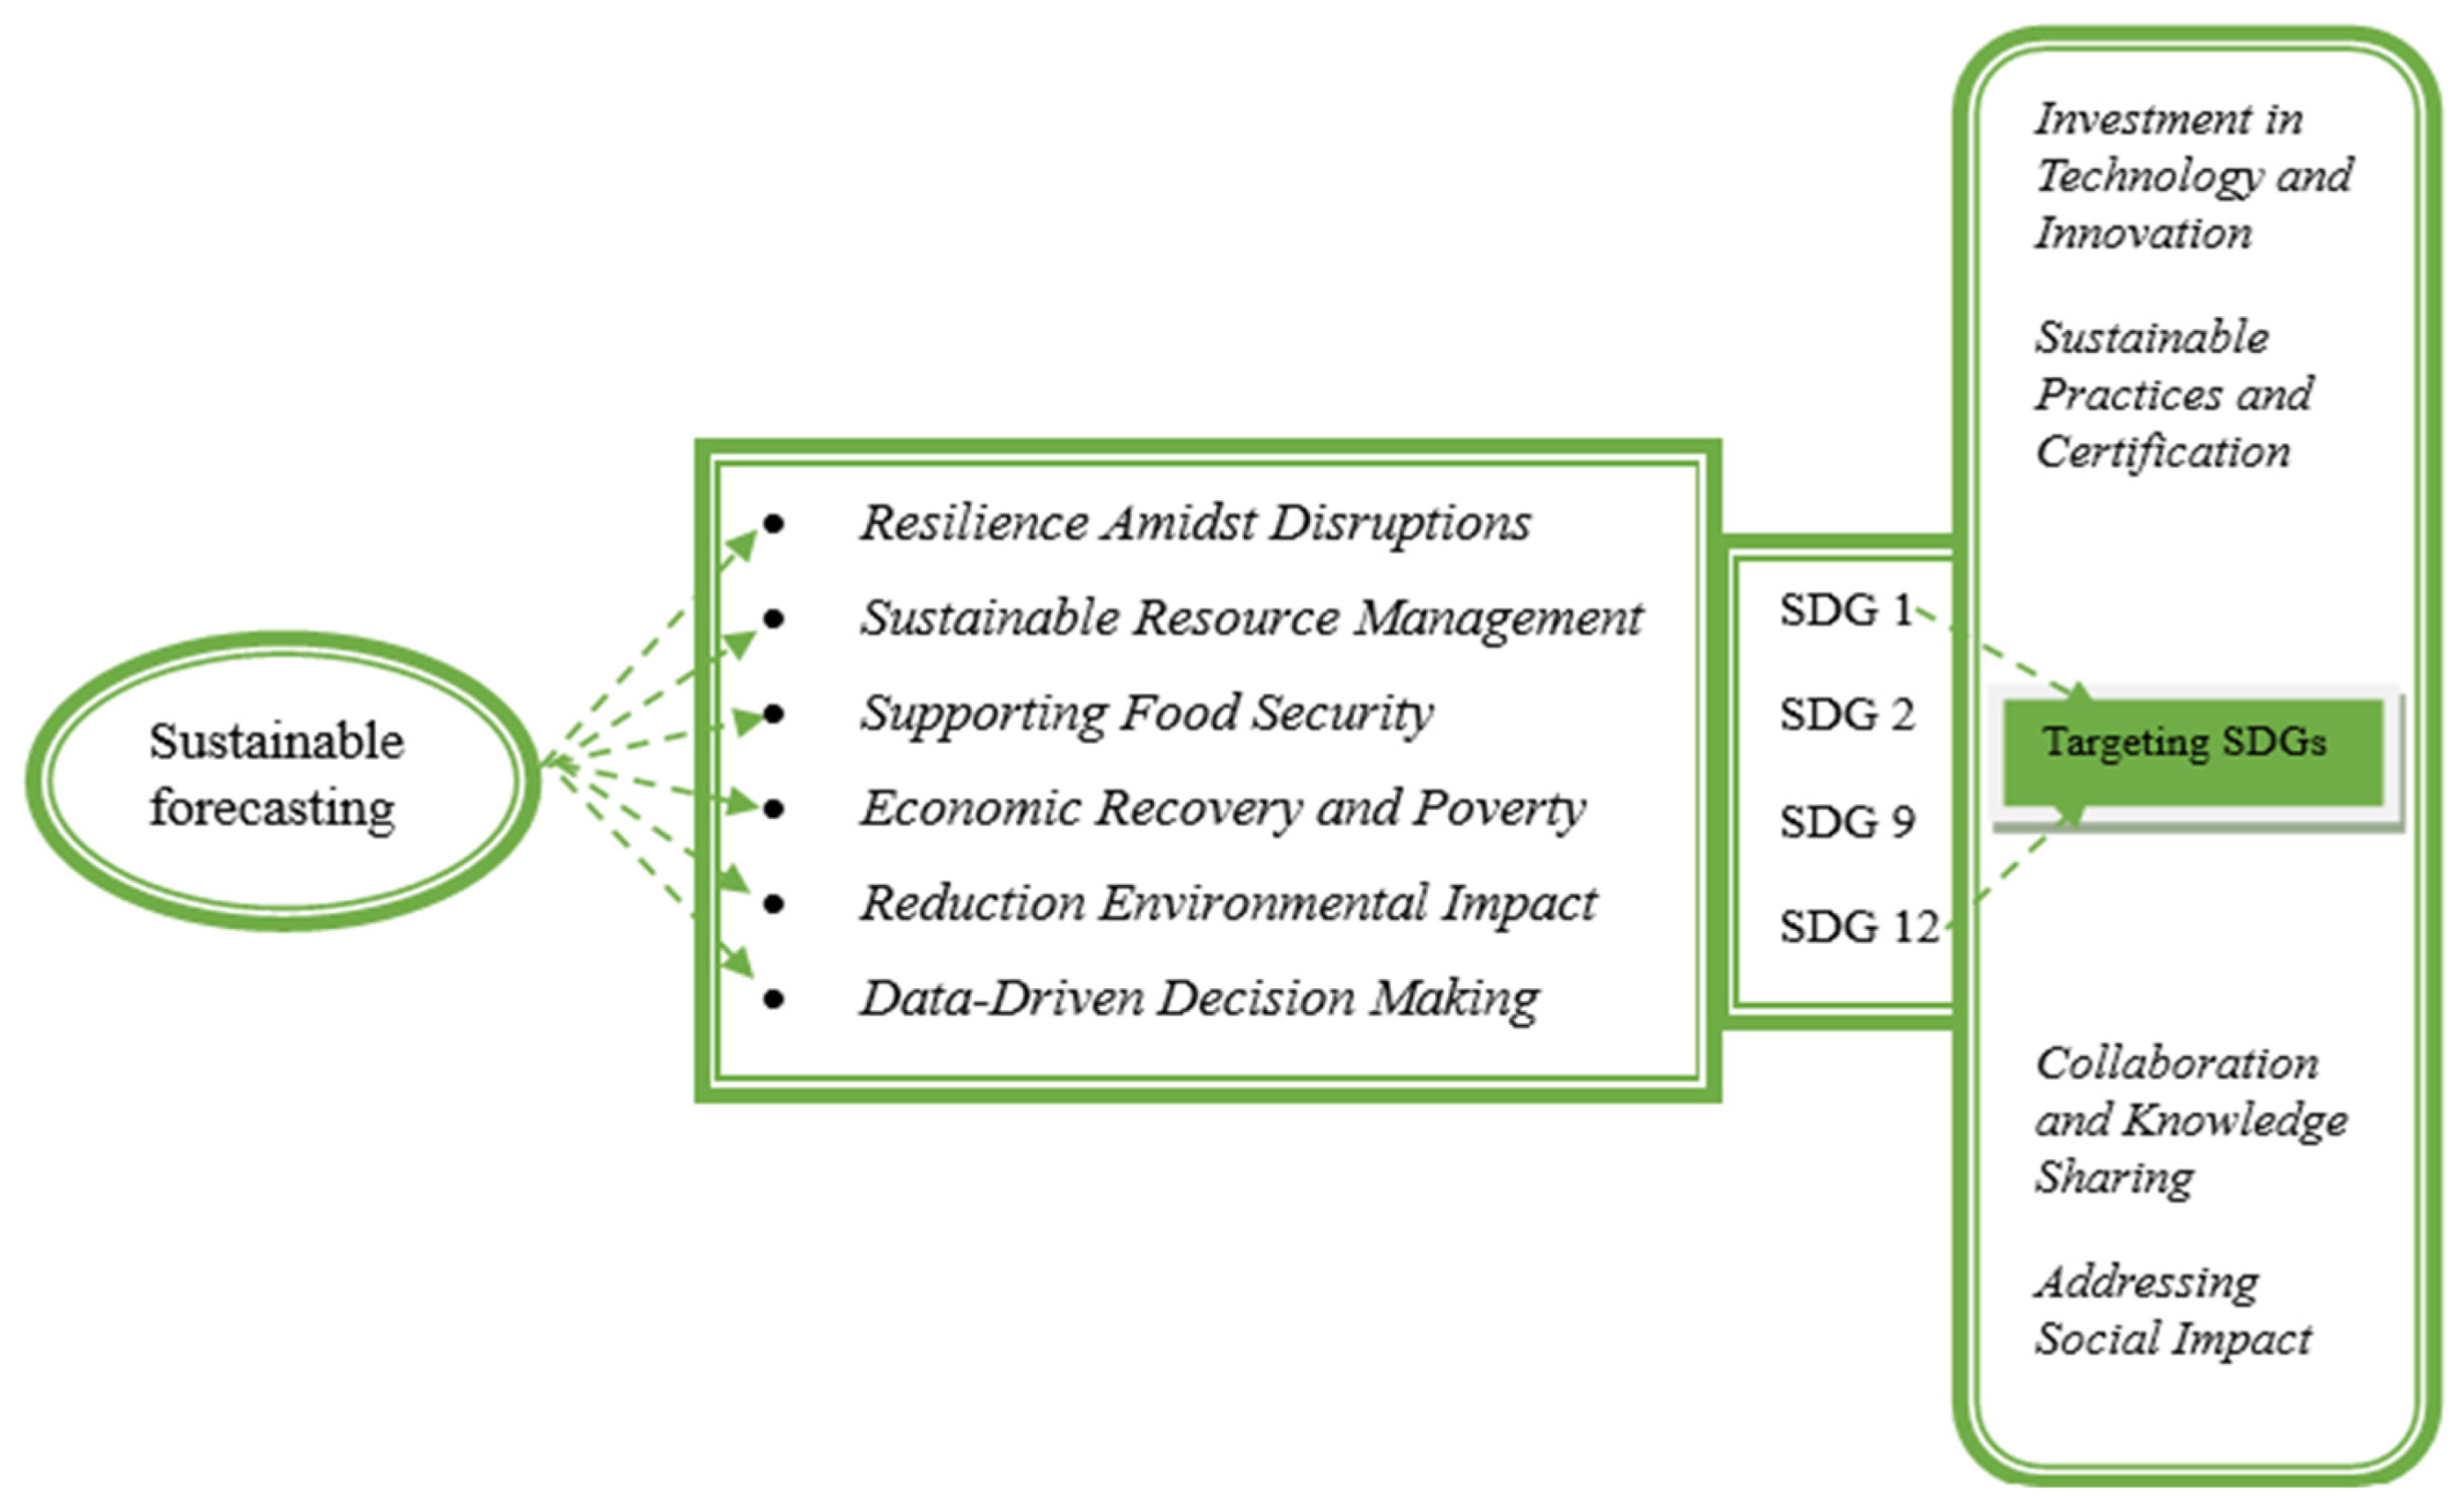
The first stage in time-series analysis involves visually evaluating the behaviors of the data by plotting them. This visual representation provides a valuable insight into the underlying patterns and trends that exist in the data. Figure 2 depicts the monthly production of milk production of Company ‘X’ from April 2010 to October 2021 as a function of time. This graph shows an initial upward trend followed by a sudden downward trend. The second differentiation of the data is used to set the stationarity of the data. However, Figure 4 displays the time plots of the differenced series, revealing that the second-order differenced series is stagnant. Once the data have achieved stationarity, the next step is to use ACF and PACF to identify the value of p and q. In Figure 5 and Figure 6, it can be easily noticed that both ACF and PACF are significant to some lags. ACF is significant to lag 1 and lag 2, which decides the value of q = 1 and 2. PACF is also significant to lag 1 and lag 2, which decides the value of p = 1 and 2. Different values in p and q lead to the formation of different (p, d, q) values causing the formation of various ARIMA models. Once the models were identified, it was incorporated into the SPSS software, which generated forecasts for all conceivable models [40]. The software generated forecasts for ARIMA (1, 2, 1), ARIMA (2, 2, 1), ARIMA (2, 2, 2), and ARIMA (1, 2, 2), as illustrated in Figure 7, Figure 8, Figure 9 and Figure 10, respectively.
The forecasted value from April 2021 to October 2021 for each of the models is listed in Table 4. Moreover, the actual value of the milk production from April 2021 to October 2021 is compared with the forecasted value and represented in Figure 11.
All four models show a consistent downward trend in milk production. However, it is crucial to note that the accuracy of these models varies across different months. For the initial months, spanning from April 2021 to July 2021, all four models performed relatively well, with their predictions closely aligning with the actual production data generated by Company ‘X’ (Figure 11). However, this accuracy begins to decline after July 2021. The abrupt shift in forecast accuracy post-July 2021 can be primarily attributed to the significant disruptions caused by the second wave of the COVID-19 pandemic. The sudden change in procurement processes within the cold supply chain (CSC) had a profound impact on milk production and distribution, making it challenging to accurately predict production levels during this period. Besides the COVID-19-related disruptions, several other factors might contribute to the difficulty in accurate predictions. These may include seasonality, changes in consumer preferences, variations in cattle health, or shifts in feed availability [45].
Furthermore, the models are checked for validation using MAPE and R2. The forecasting model with an optimized value between MAPE and R2 was chosen as the best model to predict milk production in North India using the ARIMA model [46]. Table 5 represents the results of four different ARIMA models, each evaluated using two performance measures: the MAPE and the R2 value. The ARIMA models are differentiated by their order, which specifies the number of autoregressive, integrated, and moving average terms used in the model. For example, ARIMA (1, 2, 1), which has one autoregressive term, two differences, and one moving average term. However, the MAPE indicates the average percentage deviation of the forecasted values from the actual values for each model [47]. For instance, the ARIMA (2, 2, 1) model has a MAPE of 21.3%, indicating that, on average, the predicted values exhibit a difference of around 21.3% compared to the actual milk production values. The R2 shows the proportion of the variance in the actual values that is explained by the forecasted values. As an illustration, the ARIMA (2, 2, 2) model achieved an R2 value of 0.818, indicating that approximately 81.8% of the variation in the actual values can be accounted for by the forecasted values [48]. While the ARIMA (2, 2, 2) model may have a higher R2 value, indicating a better explanatory power, it also has a higher MAPE value, suggesting a higher average percentage deviation between the forecasted and actual values. This higher MAPE value indicates that, on average, the ARIMA (2, 2, 2) model’s forecasts deviate more from the actual values compared to the ARIMA (2, 2, 1) model. In forecasting scenarios, it is crucial to strike a balance between accuracy and practicality. Although the ARIMA (2, 2, 1) model has a marginally lower R2 value, it exhibits a lower MAPE value, signifying superior overall accuracy in predicting milk production values [49]. This model’s forecasts exhibit a smaller average percentage deviation from the actual values compared to the ARIMA (2, 2, 2) model. Therefore, considering both the R2 value and MAPE, the decision to choose the ARIMA (2, 2, 1) model as the best-performing model is based on its ability to provide more accurate and sustainable forecasts, which is ultimately more valuable in practical applications.

4.2. Implications

The implications of accurate milk production forecasts presented in the study, combined with the assessment of the cold supply chain, are of great significance for the dairy industry, with far-reaching effects on sustainability and the achievement of the SDGs [21]. The dairy sector plays a critical role in supporting food security, responsible consumption and production, economic growth, and environmental sustainability [50,51,52]. Moreover, the efficiency and sustainability of the cold supply chain, a vital component of the dairy industry, directly impacts these aspects [53,54]. Forecasting accuracy using ARIMA models can act as a powerful tool in promoting efficiency, resilience, and better decision making within the industry. Considering this comprehensive perspective, the study’s findings have significant implications (Figure 12), which are detailed below.
  • Resilience amidst disruptions: The stark deviations observed between the forecasted and actual production values, particularly evident post-July 2021, attest to the dairy industry’s vulnerability to unforeseen disruptions like the COVID-19 pandemic. This pronounced impact underscores the paramount importance of accurate milk production forecasts [55,56]. Furthermore, the cold supply chain’s role in maintaining product quality and safety during such disruptions cannot be underestimated. By harnessing the insights offered by ARIMA models, stakeholders can proactively navigate challenges, restructure supply chains, and avert supply gaps, bolstering the resilience of the CSC alongside industry-wide resilience [57]. This strategic preparedness is in direct harmony with the essence of SDG 9—“Industry, Innovation, and Infrastructure”—ensuring industry resilience against unexpected upheavals.
  • Sustainable resource management: A closer examination of the disparities revealed in the comparison highlights a significant area of focus for dairy sector resource management. The fluctuations between predicted and actual values underscore the criticality of judiciously managing resources such as water, energy, and feed [58,59]. Effective resource management within the CSC is vital for energy-efficient refrigeration and transportation. By narrowing the variance, dairy producers and the CSC can minimize waste, optimize resource utilization, and actively contribute to the realization of SDG 12—“Responsible Consumption and Production”. This alignment fosters a sustainable approach while balancing milk production demands [60].
  • Supporting food security: The juxtaposition of forecasted and actual values accentuates the dairy industry’s crucial role in upholding food security, particularly in the face of global disruptions. The disparities between predicted and actual production patterns during challenging periods underscore the potential of precise milk production forecasts to mitigate food shortages and prevent wastage [61,62,63]. Considering SDG 2—“Zero Hunger”—this alignment becomes a cornerstone in ensuring consistent cold supply chain [64,65], supporting nutrition needs, and stabilizing communities [66].
  • Economic recovery and poverty reduction: The disparities observed, particularly in times of disruption, delineate the dairy industry’s significance in promoting economic recovery and reducing poverty [67,68,69]. The accuracy of forecasts empowers decision makers to navigate uncertain terrain effectively. This strategic clarity, in alignment with SDG 1—“No Poverty”—becomes pivotal in safeguarding livelihoods, bolstering economic stability, and fostering long-term prosperity within the dairy sector.
  • Environmental impact: The discernible variations between forecasted and actual values underscore the industry’s journey towards environmental stewardship. These deviations reflect the direct influence of forecasted trends on resource utilization, waste generation, and sustainability practices. By achieving a closer accord between predictions and actual outcomes, the dairy sector contributes to the principles of SDG 12, culminating in more sustainable production patterns [70].
  • Data-driven decision making: The disparities unveiled by the comparison between forecasts and actuals substantiate the dairy industry’s progression towards data-driven decision making. These deviations act as a compass, guiding industry stakeholders to better comprehend production dynamics, identify opportunities, and address bottlenecks. This strategic transformation, in consonance with the core tenets of the SDGs, underscores the pivotal role of data-driven policies in steering the sector towards sustainable development [71,72,73].
The convergence of these implications, borne out of the comparison between forecasted and actual production values, underscores the dairy industry’s trajectory towards sustainability and SDG alignment. The responsive strategies, guided by insights from accurate predictions, amplify the industry’s commitment to responsible practices and enduring growth in the face of disruptions. However, to improve sustainability and the achievement of the SDGs in the face of such disruptions, the dairy industry needs to adopt a holistic approach, as follows [66]:
  • Investment in technology and innovation: Embracing technology and innovation can improve production efficiency and reduce the industry’s environmental footprint. For instance, advanced data analytics and IoT technologies can optimize resource utilization and enable real-time decision making.
  • Sustainable practices and certification: Encouraging and incentivizing sustainable farming practices can promote responsible production. Certifications such as “organic” or “sustainable” can help consumers make more sustainable choices and contribute to achieving SDG 12.
  • Collaboration and knowledge sharing: Collaborating with stakeholders, including governments, NGOs, and research institutions, can foster knowledge sharing and best practices. This collective effort can enhance the industry’s sustainability and contributions to the SDGs.
  • Addressing social impact: The COVID-19 pandemic’s socioeconomic effects highlighted the importance of considering the social impact of dairy production. Ensuring fair wages, safe working conditions, and community engagement can align the industry with SDG 8—“Decent Work and Economic Growth”.

4.3. Limitations

One limitation of this analysis presented in the above discussion is its potential inability to accurately predict unexpected or sudden changes in the data. For instance, the second wave of COVID-19 caused a significant disruption in the procurement process, leading to deviations between forecasted and actual values after July 2021. This highlights the challenge of capturing abrupt shifts or anomalies in the data using the ARIMA models, potentially limiting their effectiveness in certain dynamic scenarios. Moreover, it is essential to recognize that the time-series analysis in this study focuses solely on a single variable, which is the milk production data. Though the ARIMA model is valuable in capturing time-related patterns, they may not account for other external factors that could influence milk production sustainability. Factors such as weather conditions, shifts in government policies, and evolving consumer preferences can also impact milk production levels and the dairy industry’s ecological footprint.

5. Conclusions and Future Perspective

This study has demonstrated the power of time-series analysis, particularly the ARIMA models, in forecasting and managing monthly milk production within the complex landscape of the CSC. By meticulously examining historical data from April 2010 to March 2021 and making projections up to October 2021, we have gained valuable insights into the dynamics of milk production for Company ‘X’. The findings reveal the strengths and limitations of various ARIMA models, with ARIMA (2, 2, 1) standing out for its remarkable accuracy in predicting milk production, boasting a low MAPE value of 21.3. On the other hand, ARIMA (2, 2, 2) demonstrated a superior R2 value of 0.818, indicating a robust alignment with observed production trends. However, it also exhibited a higher MAPE of 37.4, highlighting the challenges that are encountered in capturing and predicting unforeseen disruptions. Additionally, the study’s timing coincided with the COVID-19 pandemic’s second wave, which significantly impacted the CSC in the study area. This disruption serves as a stark reminder of the need for robust forecasting that considers external factors, especially within the context of supply chain management. The study underscores the importance of visual analysis, data stationarity, and thoughtful model selection as essential tools in refining predictions for CSCs. These steps are pivotal in ensuring reliability in dairy industry forecasts and facilitating informed decision making, ultimately contributing to the sustainability of the cold supply chain. Furthermore, our research has contributed to the growing body of knowledge in time-series analysis within the dairy sector. It highlights the potential of data-driven approaches, especially pertinent in the context of the CSC, where accurate forecasts are critical not only for supply but also for effective storage and distribution. Beyond its technical contributions, this study emphasizes the broader implications for sustainability and alignment with the SDGs within CSCs. The dairy industry’s commitment to incorporating sustainability principles, making data-driven decisions, and addressing the impacts of disruptions positions it as a crucial player in resilience-building activities and environmental stewardship. In a post-pandemic context, the dairy sector within the studied CSC is well-positioned to lead the way in sustainable development, optimizing the demand–supply dynamics of this essential commodity while contributing positively to society and the global community. As we move forward, further exploration of advanced forecasting models and continued adaptation to changing dynamics will be essential in ensuring the long-term success of the dairy industry within CSCs.
In terms of future perspectives, the present study suggests exploring seasonal ARIMA (SARIMA) models and machine learning algorithms, specifically within the cold supply chain. SARIMA models are adept at handling seasonal variations in milk production; this is crucial for managing dairy products that require temperature control. Machine learning, especially neural networks, can be harnessed to decipher intricate relationships within CSCs. This entails optimizing the storage, transportation, and distribution of dairy products under controlled temperatures. These advanced techniques promise more precise and sustainable predictions, enhancing efficiency and minimizing waste. By integrating these technologies into the cold supply chain, the dairy industry can become aligned with sustainability objectives, enabling it to contribute more effectively to the SDGs.

Author Contributions

A.K., O.J.S. and B.K.J. conceived, conceptualized, and presented the idea. A.K. completed the writing of the manuscript under the supervision of O.J.S., B.R. and G.S., who contributed in terms of the data and software. All authors have read and agreed to the published version of the manuscript.

Funding

This research received no external funding.

Institutional Review Board Statement

Not applicable.

Informed Consent Statement

Not applicable.

Data Availability Statement

The data presented in this study are not available due to privacy.

Conflicts of Interest

The authors declare no conflict of interest.

References

  1. Huth, P.J.; DiRienzo, D.B.; Miller, G.D. Major Scientific Advances with Dairy Foods in Nutrition and Health. J. Dairy Sci. 2006, 89, 1207–1221. [Google Scholar] [CrossRef] [PubMed]
  2. Milk Products: Contribution to Nutrition and Health. Int. J. Dairy Technol. 1992, 45, 61–67. [CrossRef]
  3. Koç, G.; Uzmay, A. Determinants of Dairy Farmers’ Likelihood of Climate Change Adaptation in the Thrace Region of Turkey. Environ. Dev. Sustain. 2022, 24, 9907–9928. [Google Scholar] [CrossRef]
  4. Van der Ploeg, J.D.; Renting, H.; Brunori, G.; Knickei, K.; Mannion, J.; Marsden, T.; De Roest, K.; Sevilla-Guzmán, E.; Ventura, F. Rural Development: From Practices and Policies towards Theory. In the Rural; Routledge: London, UK, 2008; ISBN 978-1-315-23721-3. [Google Scholar]
  5. Juniwal, C.; Khan, A.R.; Ganesh, A.; Carvalho, R.M.; Karunamay, S. Constraints in Milk Production of Dairy Cattle: A Review. Pharma Innov. J. 2022, SP-11, 3991–3994. [Google Scholar]
  6. Pradhan, P.P.; Priyan, P.K. Dairy Farming: The Rural Cash Cow. GH Patel Postgraduate Institute of Business Management 1. J. Manag. 2020, 22, 1–68. [Google Scholar]
  7. Singh, P.; Mukesh, M.; Kumar, S. Artificial Insemination: Scope and Challenges for Indian Dairy Sector. In Advances in Animal Experimentation and Modeling; Elsevier: Amsterdam, The Netherlands, 2022; pp. 359–364. [Google Scholar]
  8. Subbanna, Y.B.; Kumar, S.; Puttaraju, S.K.M. Forecasting Buffalo Milk Production in India: Time Series Approach. Buffalo Bull. 2021, 40, 335–343. [Google Scholar]
  9. Ali, J. Livestock Sector Development and Implications for Rural Poverty Alleviation in India. Livest. Res. Rural Dev. 2007, 19, 1–15. [Google Scholar]
  10. Gulati, A.; Minot, N.; Delgado, C.; Bora, S. Growth in High-Value Agriculture in Asia and the Emergence of Vertical Links with Farmers. In Global Supply Chains, Standards and the Poor: How the Globalization of Food Systems and Standards Affects Rural Development and Poverty; CABI: Wallingford, UK, 2007; pp. 91–108. [Google Scholar]
  11. Kumar, A. Socio-Economic Scope of Agri-Business in State of Bihar: Dairy Industry a Case Study (December 5, 2020). e-Journal-First Pan IIT International Management Conference–2018. 2020. Available online: https://papers.ssrn.com/sol3/papers.cfm?abstract_id=3743430 (accessed on 18 May 2023).
  12. Rajak, S.K.; Panse, R.K.; Kadam, D.M. Milk Production in India and World: An Overview. Front. Crop Improv. 2019, 9, 238–242. [Google Scholar]
  13. Swaminathan, M.S.; Bhavani, R.V. Food Production & Availability—Essential Prerequisites for Sustainable Food Security. Indian J. Med. Res. 2013, 138, 383–391. [Google Scholar]
  14. Kaur, G.; Goswami, T.K. Physical and Sensory Characteristics of Low Sugar Dairy Dessert (Rasgulla) Developed at Different Level Coconut Sap Syrup. J. Food Sci. Technol. 2021, 58, 343–348. [Google Scholar] [CrossRef]
  15. Ravichandran, M.; Naresh, R.; Kandasamy, J. Supply Chain Routing in a Diary Industry Using Heterogeneous Fleet System: Simulation-Based Approach. J. Inst. Eng. (India) Ser. C 2020, 101, 891–911. [Google Scholar] [CrossRef]
  16. van Asselt, E.D.; Capuano, E.; van der Fels-Klerx, H.J. Sustainability of Milk Production in the Netherlands—A Comparison between Raw Organic, Pasteurised Organic and Conventional Milk. Int. Dairy J. 2015, 47, 19–26. [Google Scholar] [CrossRef]
  17. McLaughlin, D.; Kinzelbach, W. Food Security and Sustainable Resource Management. Water Resour. Res. 2015, 51, 4966–4985. [Google Scholar] [CrossRef]
  18. Mishra, P.; Fatih, C.; Niranjan, H.K.; Tiwari, S.; Devi, M.; Dubey, A. Modelling and Forecasting of Milk Production in Chhattisgarh and India. IJAR 2020, 54, 912–917. [Google Scholar] [CrossRef]
  19. Singh, S.P.; Tegegne, F.; Ekanem, E.P.; Singh, S.P.; Tegegne, F.; Ekanem, E.P. The Food Processing Industry in India: Challenges and Opportunities. J. Food Distrib. Res. 2012, 43, 81–89. [Google Scholar] [CrossRef]
  20. Abbate, S.; Centobelli, P.; Cerchione, R. The Digital and Sustainable Transition of the Agri-Food Sector. Technol. Forecast. Soc. Chang. 2023, 187, 122222. [Google Scholar] [CrossRef]
  21. Bandyopadhyay, S.; Joshi, L. Understanding Implications of Dairy Sector Development to Sustainable Development Goals (SDGs); National Council of Applied Economic Research: New Delhi, India, 2022. [Google Scholar]
  22. Kim, S.; Kim, H. A New Metric of Absolute Percentage Error for Intermittent Demand Forecasts. Int. J. Forecast. 2016, 32, 669–679. [Google Scholar] [CrossRef]
  23. Song, X.; Liu, Y.; Xue, L.; Wang, J.; Zhang, J.; Wang, J.; Jiang, L.; Cheng, Z. Time-Series Well Performance Prediction Based on Long Short-Term Memory (LSTM) Neural Network Model. J. Pet. Sci. Eng. 2020, 186, 106682. [Google Scholar] [CrossRef]
  24. Choudhury, A.; Jones, J. Crop Yield Prediction Using Time Series Models. J. Econ. Econ. Educ. Res. 2014, 15, 53–67. [Google Scholar]
  25. Elhag, M.; Gitas, I.; Othman, A.; Bahrawi, J.; Psilovikos, A.; Al-Amri, N. Time Series Analysis of Remotely Sensed Water Quality Parameters in Arid Environments, Saudi Arabia. Env. Dev. Sustain. 2021, 23, 1392–1410. [Google Scholar] [CrossRef]
  26. Makridakis, S.; Wheelwright, S.C.; Hyndman, R.J. Forecasting Methods and Applications; John Wiley & Sons: Hoboken, NJ, USA, 2008. [Google Scholar]
  27. Fradinata, E.; Suthummanon, S.; Sirivongpaisal, N.; Suntiamorntuthq, W. ANN, ARIMA and MA Timeseries Model for Forecasting in Cement Manufacturing Industry: Case Study at Lafarge Cement Indonesia—Aceh. In Proceedings of the 2014 International Conference of Advanced Informatics: Concept, Theory and Application (ICAICTA), Bandung, Indonesia, 20–21 August 2014; IEEE: Piscataway, NJ, USA, 2014; pp. 39–44. [Google Scholar]
  28. Veerendra, G.T.N.; Kumaravel, B.; Rao, P.K.R.; Dey, S.; Manoj, A.V.P. Forecasting Models for Surface Water Quality Using Predictive Analytics. Environ. Dev. Sustain. 2023. [Google Scholar] [CrossRef]
  29. Taye, B.A.; Alene, A.A.; Nega, A.K.; Yirsaw, B.G. Time Series Analysis of Cow Milk Production at Andassa Dairy Farm, West Gojam Zone, Amhara Region, Ethiopia. Model. Earth Syst. Environ. 2021, 7, 181–189. [Google Scholar] [CrossRef]
  30. Yadav, A.K.; Das, K.K.; Das, P.; Raman, R.K.; Kumar, J.; Das, B.K. Growth Trends and Forecasting of Fish Production in Assam, India Using ARIMA Model. J. Appl. Nat. Sci. 2020, 12, 415–421. [Google Scholar] [CrossRef]
  31. Rabbani, M.B.A.; Musarat, M.A.; Alaloul, W.S.; Rabbani, M.S.; Maqsoom, A.; Ayub, S.; Bukhari, H.; Altaf, M. A Comparison Between Seasonal Autoregressive Integrated Moving Average (SARIMA) and Exponential Smoothing (ES) Based on Time Series Model for Forecasting Road Accidents. Arab. J. Sci. Eng. 2021, 46, 11113–11138. [Google Scholar] [CrossRef]
  32. Almasarweh, M.; Alwadi, S. ARIMA Model in Predicting Banking Stock Market Data. Mod. Appl. Sci. 2018, 12, 309. [Google Scholar] [CrossRef]
  33. Minhas, K.S.; Sidhu, J.S.; Mudahar, G.S.; Singh, A.K. Flow Behavior Characteristics of Ice Cream Mix Made with Buffalo Milk and Various Stabilizers. Plant Foods Hum. Nutr. 2002, 57, 25–40. [Google Scholar] [CrossRef]
  34. Siami-Namini, S.; Tavakoli, N.; Namin, A.S. A Comparison of ARIMA and LSTM in Forecasting Time Series. In Proceedings of the 2018 17th IEEE International Conference on Machine Learning and Applications (ICMLA), Orlando, FL, USA, 17–20 December 2018; IEEE: Piscataway, NJ, USA, 2018; pp. 1394–1401. [Google Scholar]
  35. Zhang, X. Forecasting Short-Term Electricity Load with Combinations of Singular Spectrum Analysis. Arab. J. Sci. Eng. 2023, 48, 1609–1624. [Google Scholar] [CrossRef]
  36. Schaffer, A.L.; Dobbins, T.A.; Pearson, S.-A. Interrupted Time Series Analysis Using Autoregressive Integrated Moving Average (ARIMA) Models: A Guide for Evaluating Large-Scale Health Interventions. BMC Med. Res. Methodol. 2021, 21, 1–12. [Google Scholar] [CrossRef]
  37. Sharma, A.K.; Punj, P.; Kumar, N.; Das, A.K.; Kumar, A. Lifetime Prediction of a Hydraulic Pump Using ARIMA Model. Arab. J. Sci. Eng. 2023. [Google Scholar] [CrossRef]
  38. Argyrous, G. Statistics for Research: With a Guide to SPSS; Sage Publications Ltd.: New York, NY, USA, 2011; 608p. [Google Scholar]
  39. Bryman, A.; Cramer, D. Quantitative Data Analysis with IBM SPSS 17, 18 & 19: A Guide for Social Scientists; Routledge: London, UK, 2012. [Google Scholar]
  40. Levesque, R. SPSS Programming and Data Management: A Guide for SPSS and SAS Users; SPSS: Armonk, NY, USA, 2005. [Google Scholar]
  41. Perone, G. An ARIMA Model to Forecast the Spread and the Final Size of COVID-2019 Epidemic in Italy. MedRxiv 2020. [Google Scholar] [CrossRef]
  42. Alizadeh, M.; Rahimi, S.; Ma, J. A Hybrid ARIMA–WNN Approach to Model Vehicle Operating Behavior and Detect Unhealthy States. Expert Syst. Appl. 2022, 194, 116515. [Google Scholar] [CrossRef]
  43. Nath, B.; Dhakre, D.S.; Bhattacharya, D. Forecasting Wheat Production in India: An ARIMA Modelling Approach. J. Pharmacogn. Phytochem. 2019, 8, 2158–2165. [Google Scholar]
  44. Abdel-Aal, R.E.; Al-Garni, A.Z. Forecasting Monthly Electric Energy Consumption in Eastern Saudi Arabia Using Univariate Time-Series Analysis. Energy 1997, 22, 1059–1069. [Google Scholar] [CrossRef]
  45. Zhang, Y.; Tang, Y.; Zhang, Y.; Sun, Y.; Yang, H. Impacts of the COVID-19 Pandemic on Fish Trade and the Coping Strategies: An Initial Assessment from China’s Perspective. Mar. Policy 2021, 133, 104748. [Google Scholar] [CrossRef]
  46. Mor, R.S.; Jaiswal, S.K.; Singh, S.; Bhardwaj, A. Demand Forecasting of the Short-Lifecycle Dairy Products. In Understanding the Role of Business Analytics; Springer: Singapore, 2019; pp. 87–117. [Google Scholar]
  47. Chang, Y.-S.; Chiao, H.-T.; Abimannan, S.; Huang, Y.-P.; Tsai, Y.-T.; Lin, K.-M. An LSTM-Based Aggregated Model for Air Pollution Forecasting. Atmos. Pollut. Res. 2020, 11, 1451–1463. [Google Scholar] [CrossRef]
  48. Khin, A.A.; Thambiah, S.; Teng, K.L.L. Short-Term and Long-Term Price Forecasting Models for the Future Exchange of Malaysian Natural Rubber Market. Int. J. Agric. Resour. Gov. Ecol. 2017, 13, 21–42. [Google Scholar] [CrossRef]
  49. Farajian, L.; Moghaddasi, R.; Hosseini, S. Agricultural Energy Demand Modeling in Iran: Approaching to a More Sustainable Situation. Energy Rep. 2018, 4, 260–265. [Google Scholar] [CrossRef]
  50. Govindan, K. Sustainable Consumption and Production in the Food Supply Chain: A Conceptual Framework. Int. J. Prod. Econ. 2018, 195, 419–431. [Google Scholar] [CrossRef]
  51. Pawlak, K.; Ko\lodziejczak, M. The Role of Agriculture in Ensuring Food Security in Developing Countries: Considerations in the Context of the Problem of Sustainable Food Production. Sustainability 2020, 12, 5488. [Google Scholar] [CrossRef]
  52. Edwards, J. New Zealand Aid and Dairy Development in Sri Lanka. 2020. Available online: https://researcharchive.vuw.ac.nz/handle/10063/8886 (accessed on 18 May 2023).
  53. Chiang, C.-T.; Kou, T.-C.; Koo, T.-L. A Systematic Literature Review of the IT-Based Supply Chain Management System: Towards a Sustainable Supply Chain Management Model. Sustainability 2021, 13, 2547. [Google Scholar] [CrossRef]
  54. Keller, J.; Jung, M.; Lasch, R. Sustainability Governance: Insights from a Cocoa Supply Chain. Sustainability 2022, 14, 10763. [Google Scholar] [CrossRef]
  55. Nchanji, E.B.; Lutomia, C.K. Sustainability of the Agri-Food Supply Chain amidst the Pandemic: Diversification, Local Input Production, and Consumer Behavior. In Advances in Food Security and Sustainability; Elsevier: Amsterdam, The Netherlands, 2021; Volume 6, pp. 211–229. [Google Scholar]
  56. Sharma, M.; Joshi, S.; Luthra, S.; Kumar, A. Managing Disruptions and Risks amidst COVID-19 Outbreaks: Role of Blockchain Technology in Developing Resilient Food Supply Chains. Oper. Manag. Res. 2021, 15, 268–281. [Google Scholar] [CrossRef]
  57. Barbosa-Povoa, A.P.; Pinto, J.M. Process Supply Chains: Perspectives from Academia and Industry. Comput. Chem. Eng. 2020, 132, 106606. [Google Scholar] [CrossRef]
  58. Aarts, H.F.M.; Habekotte, B.; Hilhorst, G.J.; Koskamp, G.J.; Van Der Schans, F.C.; De Vries, C.K. Efficient Resource Management in Dairy Farming on Sandy Soil. Neth. J. Agric. Sci. 1999, 47, 153–167. [Google Scholar] [CrossRef]
  59. Nahed, J.; Castel, J.M.; Mena, Y.; Caravaca, F. Appraisal of the Sustainability of Dairy Goat Systems in Southern Spain According to Their Degree of Intensification. Livest. Sci. 2006, 101, 10–23. [Google Scholar] [CrossRef]
  60. Faye, B.; Konuspayeva, G. The Sustainability Challenge to the Dairy Sector—The Growing Importance of Non-Cattle Milk Production Worldwide. Int. Dairy J. 2012, 24, 50–56. [Google Scholar] [CrossRef]
  61. Benyam, A.A.; Soma, T.; Fraser, E. Digital Agricultural Technologies for Food Loss and Waste Prevention and Reduction: Global Trends, Adoption Opportunities and Barriers. J. Clean. Prod. 2021, 323, 129099. [Google Scholar] [CrossRef]
  62. Duncan, E.; Abdulai, A.-R.; Fraser, E.D. Modernizing Agriculture through Digital Technologies: Prospects and Challenges. In Handbook on the Human Impact of Agriculture; Edward Elgar Publishing: Cheltenham, UK, 2021; pp. 138–161. [Google Scholar]
  63. National Academies of Sciences. Medicine a National Strategy to Reduce Food Waste at the Consumer Level; National Academies Press: Washington, DC, USA, 2020. [Google Scholar]
  64. López-Gálvez, F.; Gómez, P.A.; Artés, F.; Artés-Hernández, F.; Aguayo, E. Interactions between Microbial Food Safety and Environmental Sustainability in the Fresh Produce Supply Chain. Foods 2021, 10, 1655. [Google Scholar] [CrossRef]
  65. Bottani, E.; Casella, G.; Nobili, M.; Tebaldi, L. An Analytic Model for Estimating the Economic and Environmental Impact of Food Cold Supply Chain. Sustainability 2022, 14, 4771. [Google Scholar] [CrossRef]
  66. Augustin, M.A.; Udabage, P.; Juliano, P.; Clarke, P.T. Towards a More Sustainable Dairy Industry: Integration across the Farm–Factory Interface and the Dairy Factory of the Future. Int. Dairy J. 2013, 31, 2–11. [Google Scholar] [CrossRef]
  67. Atieno, R.; Kanyinga, K. The Revitalisation of Kenya Cooperative Creameries: The Politics of Policy Reforms in the Dairy Sector in Kenya. 2008. Available online: http://erepository.uonbi.ac.ke/bitstream/handle/11295/39683/Kanyinga_The%20Revitalisation%20of%20Kenya%20Cooperative%20Creameries.pdf?sequence=1 (accessed on 18 May 2023).
  68. Rob, V.O.S.; Cattaneo, A. Poverty Reduction through the Development of Inclusive Food Value Chains. J. Integr. Agric. 2021, 20, 964–978. [Google Scholar]
  69. Upton, M. The Role of Livestock in Economic Development and Poverty Reduction. 2004. Available online: https://ageconsearch.umn.edu/record/23783/ (accessed on 18 May 2023).
  70. Hurduzeu, G.; Pânzaru, R.L.; Medelete, D.M.; Ciobanu, A.; Enea, C. The Development of Sustainable Agriculture in EU Countries and the Potential Achievement of Sustainable Development Goals Specific Targets (SDG 2). Sustainability 2022, 14, 15798. [Google Scholar] [CrossRef]
  71. Ali, Z.A.; Zain, M.; Pathan, M.S.; Mooney, P. Contributions of Artificial Intelligence for Circular Economy Transition Leading toward Sustainability: An Explorative Study in Agriculture and Food Industries of Pakistan. Environ. Dev. Sustain. 2023. [Google Scholar] [CrossRef]
  72. Cabrera, V.E.; Fadul-Pacheco, L. Future of Dairy Farming from the Dairy Brain Perspective: Data Integration, Analytics, and Applications. Int. Dairy J. 2021, 121, 105069. [Google Scholar] [CrossRef]
  73. Kamble, S.S.; Gunasekaran, A.; Gawankar, S.A. Achieving Sustainable Performance in a Data-Driven Agriculture Supply Chain: A Review for Research and Applications. Int. J. Prod. Econ. 2020, 219, 179–194. [Google Scholar] [CrossRef]
Figure 1. Workflow diagram.
Sustainability 15 16102 g001
Figure 2. Monthly milk production (in Kgs).
Sustainability 15 16102 g002
Figure 3. Monthly production data, with d = 1 (in Kgs).
Sustainability 15 16102 g003
Figure 4. Monthly production data, with d = 2 (in Kgs).
Sustainability 15 16102 g004
Figure 5. ACF.
Figure 5. ACF.
Sustainability 15 16102 g005
Figure 6. PACF.
Figure 6. PACF.
Sustainability 15 16102 g006
Figure 7. ARIMA (1, 2, 1). y-axis—milk production (Kgs); x-axis—month.
Sustainability 15 16102 g007
Figure 8. ARIMA (2, 2, 1). y-axis—milk production (Kgs); x-axis—month.
Sustainability 15 16102 g008
Figure 9. ARIMA (2, 2, 2). y-axis—milk production (Kgs); x-axis—month.
Sustainability 15 16102 g009
Figure 10. ARIMA (1, 2, 2). y-axis—milk production (Kgs); x-axis—month.
Sustainability 15 16102 g010
Figure 11. Comparison between the models.
Sustainability 15 16102 g011
Figure 12. Sustainable forecasting implications and targeted SDGs.
Sustainability 15 16102 g012
Table 1. AR, MA, and ARMA equations.
ModelEquationsExplanationMeaning of Terms
AR (p)Yt = c + ϕ1Yt−1 + ϕ2Yt−2 + … + ϕpYt−p + εIn the AR model, the current value Yt is a linear combination of its past values up to order p.Yt—current value of the time-series; c—constant; ϕ1, ϕ2, …, ϕp—autoregressive coefficients; ε—white noise error terms.
MA (q)Yt = c − θ1εt−1 − θ2εt−2 − … − θqεt−q + εIn the MA model, the current value Yt depends on a linear combination of past white noise error terms up to order q.Yt—current value of the time-series; c—constant; θ1, θ2, …, θq—moving average coefficients; εt−1, εt−2, …, εt−q—white noise error terms.
ARMAYt = c + ϕ1Yt−1 + ϕ2Yt−2 + … + ϕpYt−p + ε − θ1εt−1 − θ2εt−2 − … − θqεt−qThe ARMA model combines both AR and MA components, expressing the current value Yt as a combination of past values and past error terms.Yt—current value of the time-series; c—constant; ϕ1, ϕ2, …, ϕp—autoregressive coefficients; ε—white noise error term; θ1, θ2, …, θq—moving average coefficients; εt−1, εt−2, …, εt−q—white noise error terms.
Table 2. Model selection using ACF and PACF.
ACFPACFModel
AR (p)GeometricSignificant until p lags(p, d, 0)
MA (q)Significant until q lagsGeometric(0, d, q)
AR (p) MA (q)Significant until q lagsSignificant until p lags(p, d, q)
Table 3. Possible models using ACF and PACF.
AR (p)I (d)MA (q)ARIMA (p, d, q)
121ARIMA (1, 2, 1)
221ARIMA (2, 2, 1)
222ARIMA (2, 2, 2)
122ARIMA (1, 2, 2)
Table 4. Forecasting results.
MonthActual Production (Kgs)ARIMA (1, 2, 1)ARIMA (2, 2, 1)ARIMA (2, 2, 2)ARIMA (1, 2, 2)
April 20217,276,5307,915,5607,883,0797,990,7917,995,746
May 20217,284,1507,420,9337,401,7057,844,2047,577,291
June 20217,428,6606,885,3456,874,7687,500,7317,134,018
July 20216,240,5106,385,9846,383,3907,278,2606,714,827
August 20214,304,7306,385,9846,002,1147,057,4916,390,933
September 20214,006,1705,793,4785,804,8996,943,5956,216,954
October 20213,665,0705,849,7205,865,9566,947,2706,259,852
Table 5. Forecasting error.
ModelMAPE R 2
ARIMA (1, 2, 1)22.60.739
ARIMA (2, 2, 1)21.30.790
ARIMA (2, 2, 2)37.40.818
ARIMA (1, 2, 2)28.40.793
Disclaimer/Publisher’s Note: The statements, opinions and data contained in all publications are solely those of the individual author(s) and contributor(s) and not of MDPI and/or the editor(s). MDPI and/or the editor(s) disclaim responsibility for any injury to people or property resulting from any ideas, methods, instructions or products referred to in the content.

