Review

Leveraging the No Net Land Take Policy through Ecological Connectivity Analysis: The Role of Industrial Platforms in Flanders, Belgium

by
Dorothy Julian Nalumu
*,
Daniel Otero Peña
and
Daniela Perrotti
Urban Metabolism Lab, Louvain Research Institute for Landscape, Architecture, Built Environment, 1060 Brussels, Belgium
*
Author to whom correspondence should be addressed.
Sustainability 2023, 15(22), 16103; https://doi.org/10.3390/su152216103
Submission received: 19 July 2023 / Revised: 20 September 2023 / Accepted: 29 September 2023 / Published: 20 November 2023

Abstract

:
Land take for urbanisation has become a significant problem in many parts of the world due to environmental, social and economic impacts associated with the rapid depletion of blue and green spaces. In Europe, literature reveals a massive loss of ecosystems due to land take. The European Union has formulated a “No Net Land Take Policy” to stop new development activities on the available urban lands by 2050 within its member countries. In this paper, we highlight opportunities for mainstreaming green infrastructure planning in the industrial areas located in Flanders, Belgium, to enhance ecological connectivity towards the No Net Land Take Policy. The ecological connectivity was analysed using a blended methodology combining spatial analysis at the scale of the entire region and that of sixteen sub catchments within using the Patch-Corridor-Matrix model. A multifunctionality framework for assessing green infrastructure implementation was designed based on an analysis of the scientific literature discussing the ecological benefits of green infrastructure networks within industrial platforms. Our results show that industrial platforms might provide a broad spectrum of implementation opportunities reflecting the multi-functionality of green infrastructure networks while highlighting to what extent the underdeveloped areas laying within the boundary of industrial platforms are suitable for green infrastructure expansion.

1. Introduction

1.1. Infrastructures and Bouwshift

Urban green infrastructures (GI) are planned natural and semi-natural networks of blue and green areas laying within the boundaries of urban regions, which provide multifunctional use and multiple environmental and social benefits [1,2,3]. The fast depletion of green and blue areas poses an increasing threat to urban ecosystem sustainability [3,4,5]. For this reason, environmental policy and urban planning researchers and practitioners have reported a need to stop land take, a process by which metropolitan areas expand into previously rural land or undeveloped regions, e.g., [5,6,7] consider ecosystem functionality during urbanisation at different levels of policy and stakeholder engagement. The literature on urban sprawl and green area management in Europe, e.g., [7,8,9], reveals a massive loss of ecosystems due to land take. For example [10] anticipate that each extra percent of artificial land development will require a 2.2 percent increase in GI land to sustain benefits from the ecosystem function as they were in 2010. Conservation and maintenance of urban green areas against the high demand for building and infrastructural development is even more critical when considered in the light of the 2018 United Nations World Urbanization Prospects, according to which, the world’s urban population is projected to reach 68 per cent by 2050. Moreover, land take significantly affects land use efficiency, environmental sustainability, and quality of life [6,7]. For instance, the visible negative impacts on the social-ecological system include climate change, air and water pollution, habitat loss, infrastructure strain, cultural and heritage loss, and challenges related to housing affordability [8].
Schiavina et al., 2019 [9], provide comprehensive continental data on urban expansion by comparing the built-up surface area alongside the population increase per continent between 1990 and 2015. In this period, urban land use efficiency for the built-up surface area expanded by almost 50% from 522,000 km2 in 1990 to more than 777,000 km2 in 2015 with the lowest positive land use efficiency in the Global South. For example, the urban population in Africa increased to nearly 90%, resulting in a 54% increase in the built-up surface area. In Europe, population increase was only 2.4% and built-up area increase nearly 32% (i.e., more than 7000 km2), meaning that the expansion of urban built-up areas outpaced population growth. In the Global South as much as in the Global North, land consumption for the built-up urbanisation has played a role in the deterioration of ecosystems at the continental scale.
From a policy perspective, there has been a growing number of approaches to address the impact of urbanisation and land take in Europe. For example, the European Union (EU) has formulated a “No Net Land Take Policy” (NNLT) to stop new development activities on the available urban lands within its member countries by 2050 [11]. To support the implementation of the NNLT policy, Cortinovis et al., 2019 [11] report that the EU has developed six primary spatial-specific strategies, including green cities and urban regeneration. The authors also note the different strategic approaches taken by some member states. In addition, Decoville and Schneider, 2015 [12], give some quantitative political objectives from six countries of the EU (Belgium, Germany, Luxembourg, Austria, France, and Denmark) to limit land take. For example, in Flanders, Belgium, 60% of urban development was planned to be on brownfields. Again, in Belgium, the Wallonia region targeted reducing 1200 ha per year by 2020 and 900 ha per year by 2040.
In Flanders, one of the three regions of Belgium besides Wallonia and Brussels, the government introduced the ‘Betonstop’ policy (concrete stop) policy in 2014, intending to implement the EU’s NNLT policy while adapting it to Belgium-specific urbanisation and sprawl challenges. The European Territorial Observatory Network (ESPON 2020) indicates that the ‘Betonstop’ was aimed at stopping developing open spaces and green fields in 2040. However, the Betonstop policy remained at a proposal level and was not implemented into planning due to lack of finances, moreover, it received a lot of opposition from private landowners. To overcome Betonstop policy limitation, in 2016, the Flemish government, replaced the ‘Betonstop policy’ with ‘Bouwshift’ (literally, “shift in building attitude”), as a new path to mitigate current and halt future urban land take [13]. The Bouwshift policy has gained widespread acceptance because of local concerns regarding deforestration and flooding incidents. Consequently, various political parties, climate change experts and advocates have reinforced its importance on political agendas. However, since its inception in 2016, the Bouwshift policy has not undergone significant strategic, regulatory, or operational planning levels. Instead, it has received formal approval, mainly incorporating the strategic vision for the Spatial Policy Plan Flanders, with only a limited focus on the ‘no net land take’ policy. It is essential to note that Belgium and the Netherlands have the largest share of urban land within the EU, with Belgium having the highest rate of urban use dispersion [14]. In Flanders, land used for “settlement area” (housing, health care, education, nursing infrastructure, roads, recreation, rail networks and commercial purposes) was at 33% in 2014, as per the regional spatial planning department (Ruimte Vlaanderen) [14]. Buitelaar, E. and Leinfelder, H., 2020 [14] attributes the extensive urban sprawl in the Flanders region to two social development factors. Firstly, the historical development of dense public transportation network in the nineteenth century, the transportation network attracted new and dispersed residential development which intensified in the first half of the twentieth century. Residents in the dispersed areas later demanded governments to invest in the provision of public goods such as public transport, energy and water supply and sewage infrastructure. Secondly, it is thought to result from inadequate regulation and planning. According to ESPON (2020), the daily land taken in Flanders is six hectares (e.g., for residential villa construction), significantly affecting the environmental quality, biodiversity, water management, and food production. To address these challenges, since 2010, the Flemish government has been preparing a new strategic planning document to introduce the ambition to gradually reduce the daily growth of urbanised areas from six to seven acres presently to zero in 2040 [14].
There is growing recognition and appeal of the need for GI planning and implementation in urban industrial areas to mitigate the negative impacts of urban development [15,16] and to contribute to the overall aim of integrating public blue and green spaces with the built environment to enhance ecosystem health and quality of life [4,13]. In the frame of this article, industrial platforms are defined as “geographic concentrations of interconnected companies and institutions that collaborate within a specific industry or sector” [17]. Examples of crucial aspects of GI planning in industrial areas include vegetation landscaping, porous surfaces, green roofs and walls, wetlands and ponds and biofiltration [18]. In urban brownfields and industrial areas, GI planning is often deployed to recover polluted areas with elements that can mitigate negative impacts and improve environmental conditions. Ref. [16] report that much of the land in industrial areas is wasted or degraded due to neglect, underuse, and soil contamination. Yet industrial areas are commonly located in ecologically rich sites, an advantage for integrating GI planning for sustainable development [19]. In addition, [20] highlights GI’s environmental and socio-economic benefits in industrial areas, including but not limited to managing wastewater, stormwater, and air pollution, minimising energy consumption and creating aesthetic beauty [18,20].
In this article, we highlight possible opportunities to enable green infrastructure planning in existing and future grey infrastructure towards Bouwshift policy in the Flanders region to mitigate current environmental stressors primarily associated with rapid infrastructural developments. We will address the following research question: what are the opportunities for GI implementation towards the Bouwshift policy in Flanders? which we will answer by (1) mapping opportunities for GI implementation and (2) assessing the multifunctionality of GI features in the industrial areas. As such, the study will contribute to actionable knowledge to guide GI implementation in industrial platforms, which has received limited attention in the scientific literature. This study stems from a broader strategic project Groen met grijs (Green With Grey GWG), funded by the Flemish Region Environmental Department Omgeving, in order to elaborate strategic desealing actions to address the land consuming and diffuse urbanization of Flanders. The project was conducted between 2019 and 2022 by Latitude platform for urban research and design, UCLouvain and KULeuven including the authors of this manuscript and co-led by Bruno Notteboom and Daniela Perrotti.

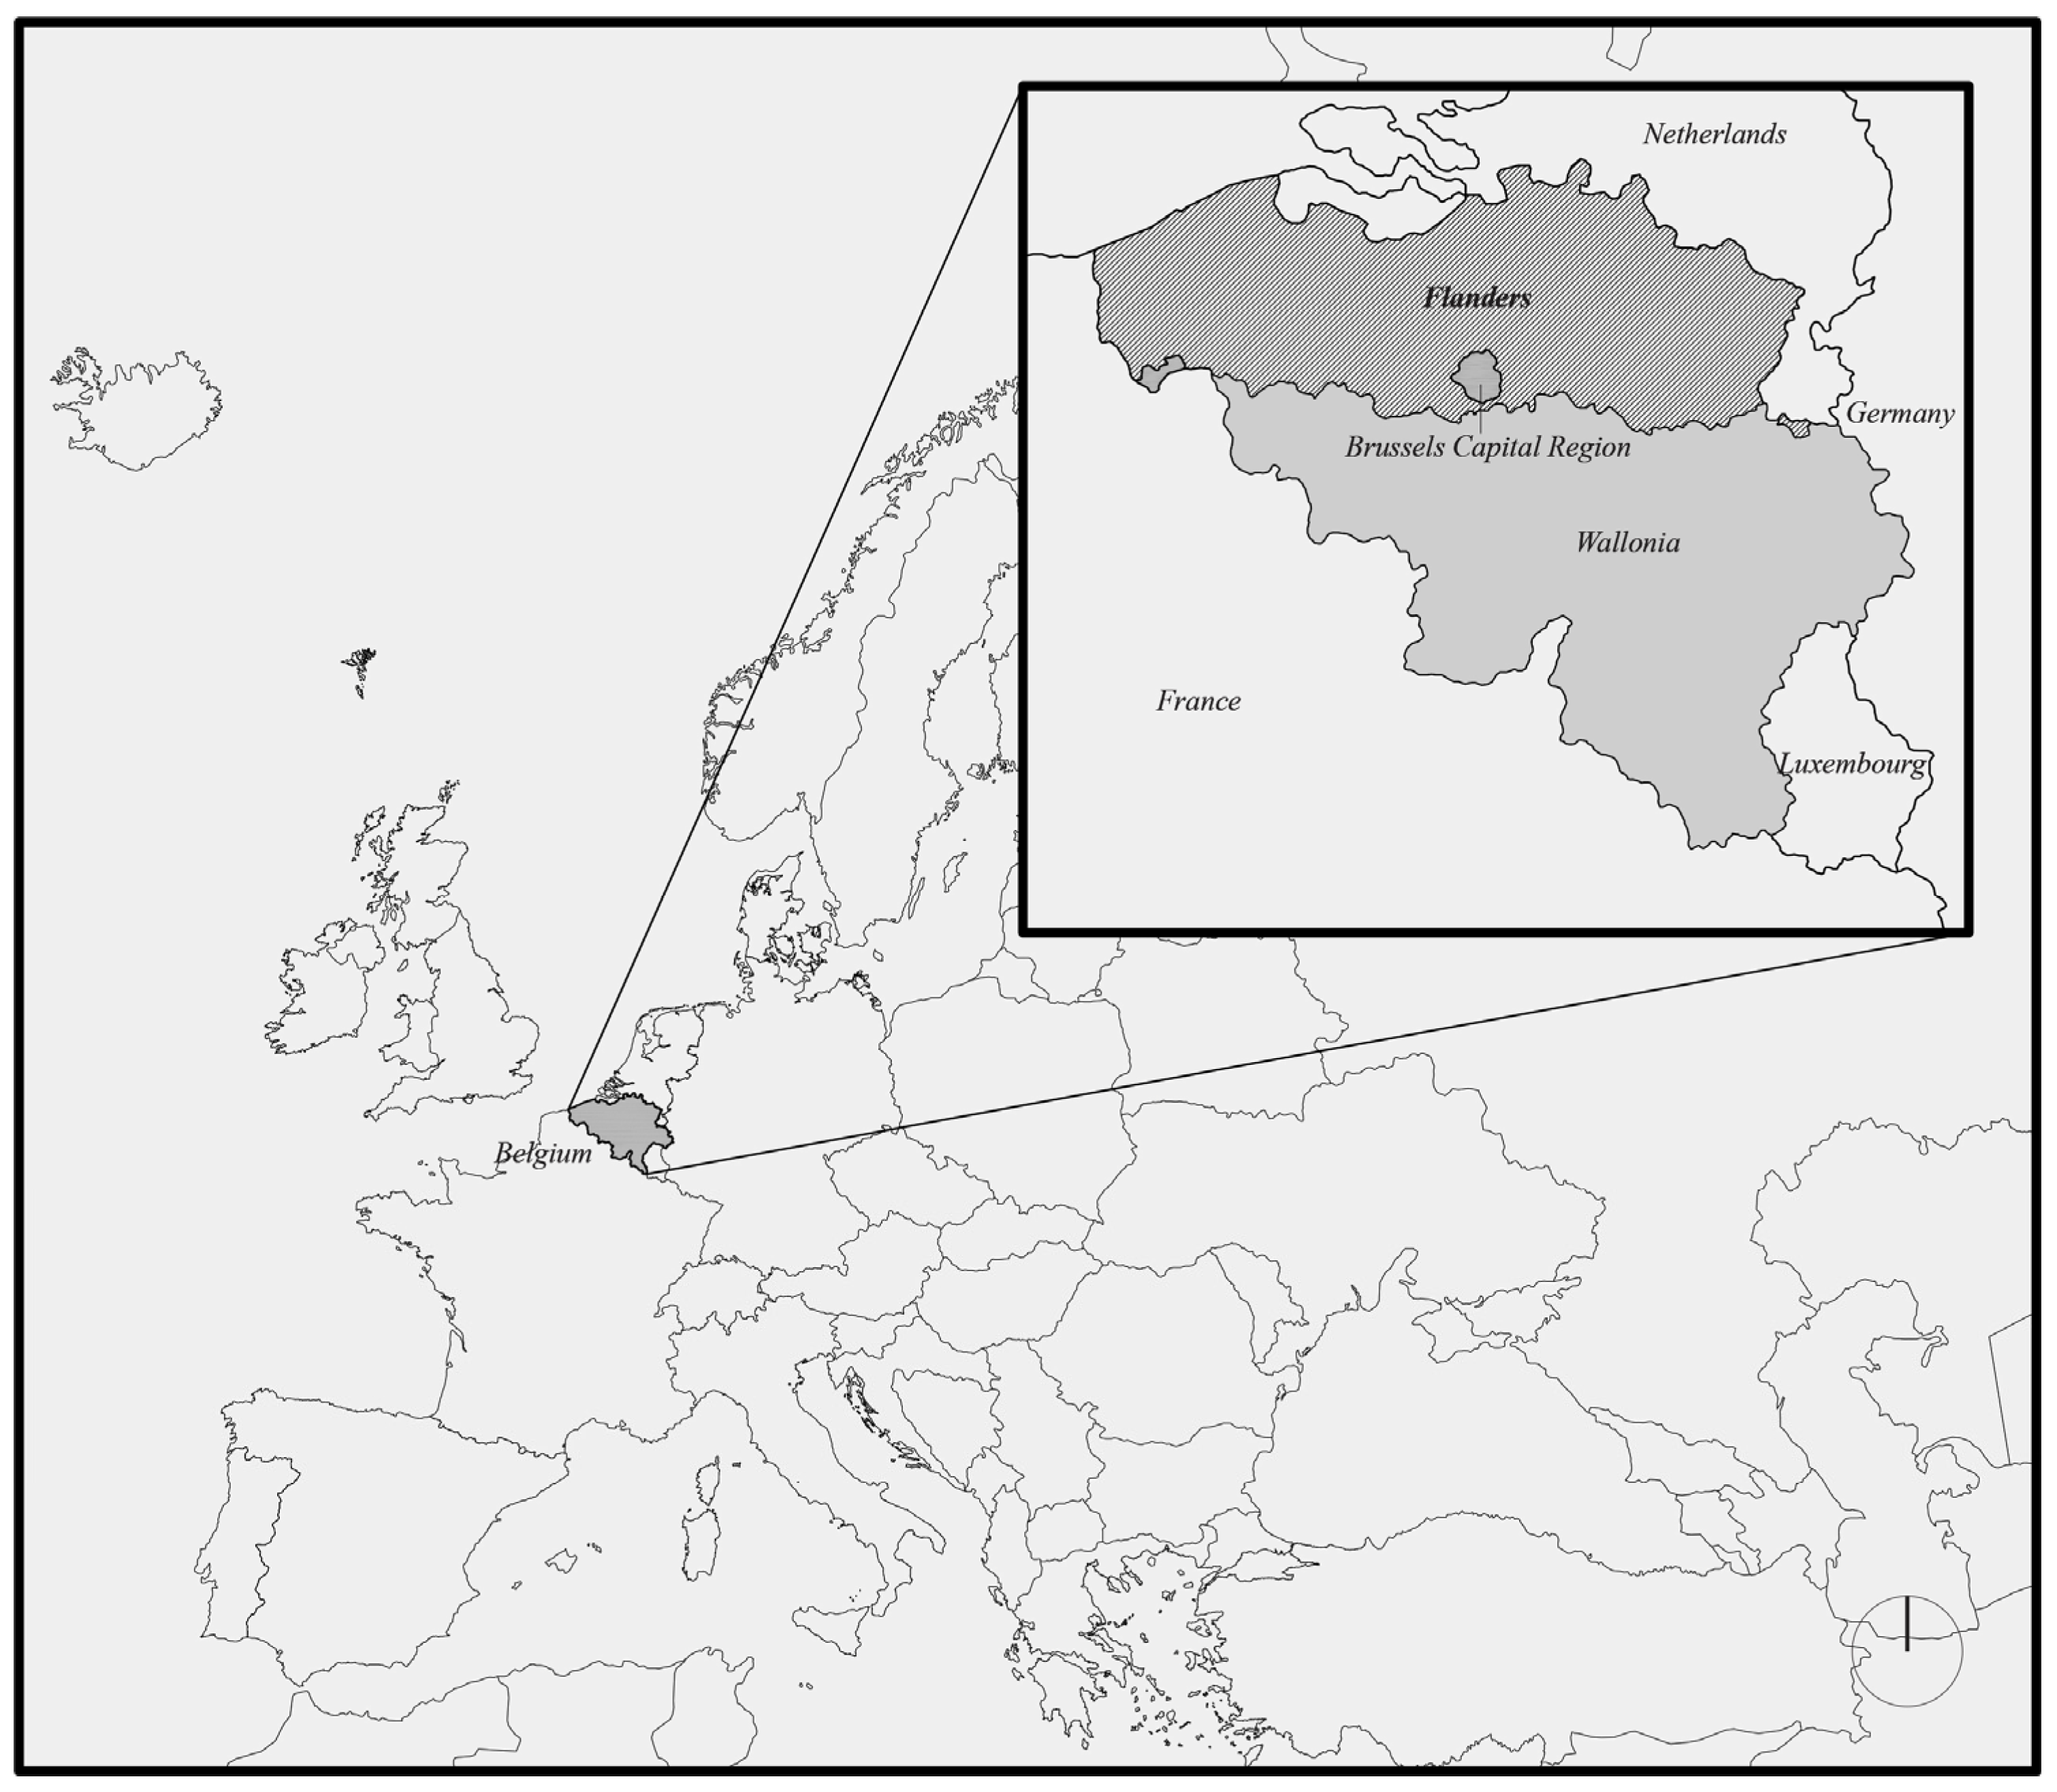
1.2. Background Flanders Region

Flanders is one of the three administrative regions of Belgium and is located on the northern side of the country (see Figure 1) with a total area of 13,625 km2 and a dense population of 483/km2 (1250/sq mi). According to Stabel, 2022 [21], Belgium’s population density is at 377 inhabitants per km2. However, this varies significantly from one region to the other. The Flemish Region registers a population density of 492 inhabitants/km2, the Walloon Region 217 inhabitants/km2, and the Brussels-Capital Region 7528 inhabitants/km. The area comprises processing industries such as construction, chemical, food, and drinks, with a sizeable servicing sector. The region is sensitive to flooding due to climate change and rapid urbanisation, particularly during intense rainfall [22,23]. Moreover, climate forecasts show that extreme weather events will happen more frequently [23], and are predicted to cause significant negative impacts on the social–ecological systems. Concerning the above report, a systematic approach is highly recommendable to enhance nature by finding strategic and region-specific sustainable solutions.

2. Materials and Methods

We adopted a blended methodology integrating spatial analysis with designing a multifunctionality framework for assessing GI based on an analysis of the scientific literature on benefits provided by GI. We performed a GIS-based assessment of the ecological connectivity of Flanders at two scales: the regional administrative boundary and the Maalbeek sub-catchment scale, ecological connectivity refers to the functional connection between the different ecosystem units, from energy to information and matter [24]. We have selected 16 sub-catchments from the 264 existing sub-catchments in the Flanders region based on specific criteria. These criteria encompass the inclusion of sub-catchments intersected by waterways, ensuring the representation of at least one primary catchment within each Flemish province and each major river system (e.g., the Schelde, Leie, Senne, Maas rivers). Additionally, our selection aimed to capture a diverse range of industrial platform cases concerning their spatial distribution within the sub-catchment and their proximity to linear infrastructure such as waterways, roads, and railroads. The sub-catchments located in polder areas were excluded from our selection because these areas follow engineered water management practices and follows different gravity logics from those characterizing the more common valley-shaped sub-catchments; likewise, the sub-catchments including the three main Belgian ports (Port of Antwerp, Port of Ghent, and Port of Zeebrugge) were excluded from our selection because the concentration of industrial platforms covers the entire catchment system. Among the 16 selected sub-catchments, we conducted a detailed study of the Maalbeek sub-catchment because it fulfilled all spatial conditions in relation to the industrial platforms, linear infrastructure network, and the morphology of the habitat patches within the green and blue network. We conducted a detailed study of the Maalbeek sub-catchment. The scales were studied through the compilation of primary GIS data based on land-use cover areas, including the following datasets: (1) landscape typologies, including crops, pasture grasslands, forests, shrubs, nonproductive meadows, private gardens, dunes, swamps, quarries, and urban areas; (2) geographic features of the region (e.g., topography and hydrography); (3) industrial platforms; and (4) underdeveloped areas (e.g., brownfields or areas with neither public nor private development).

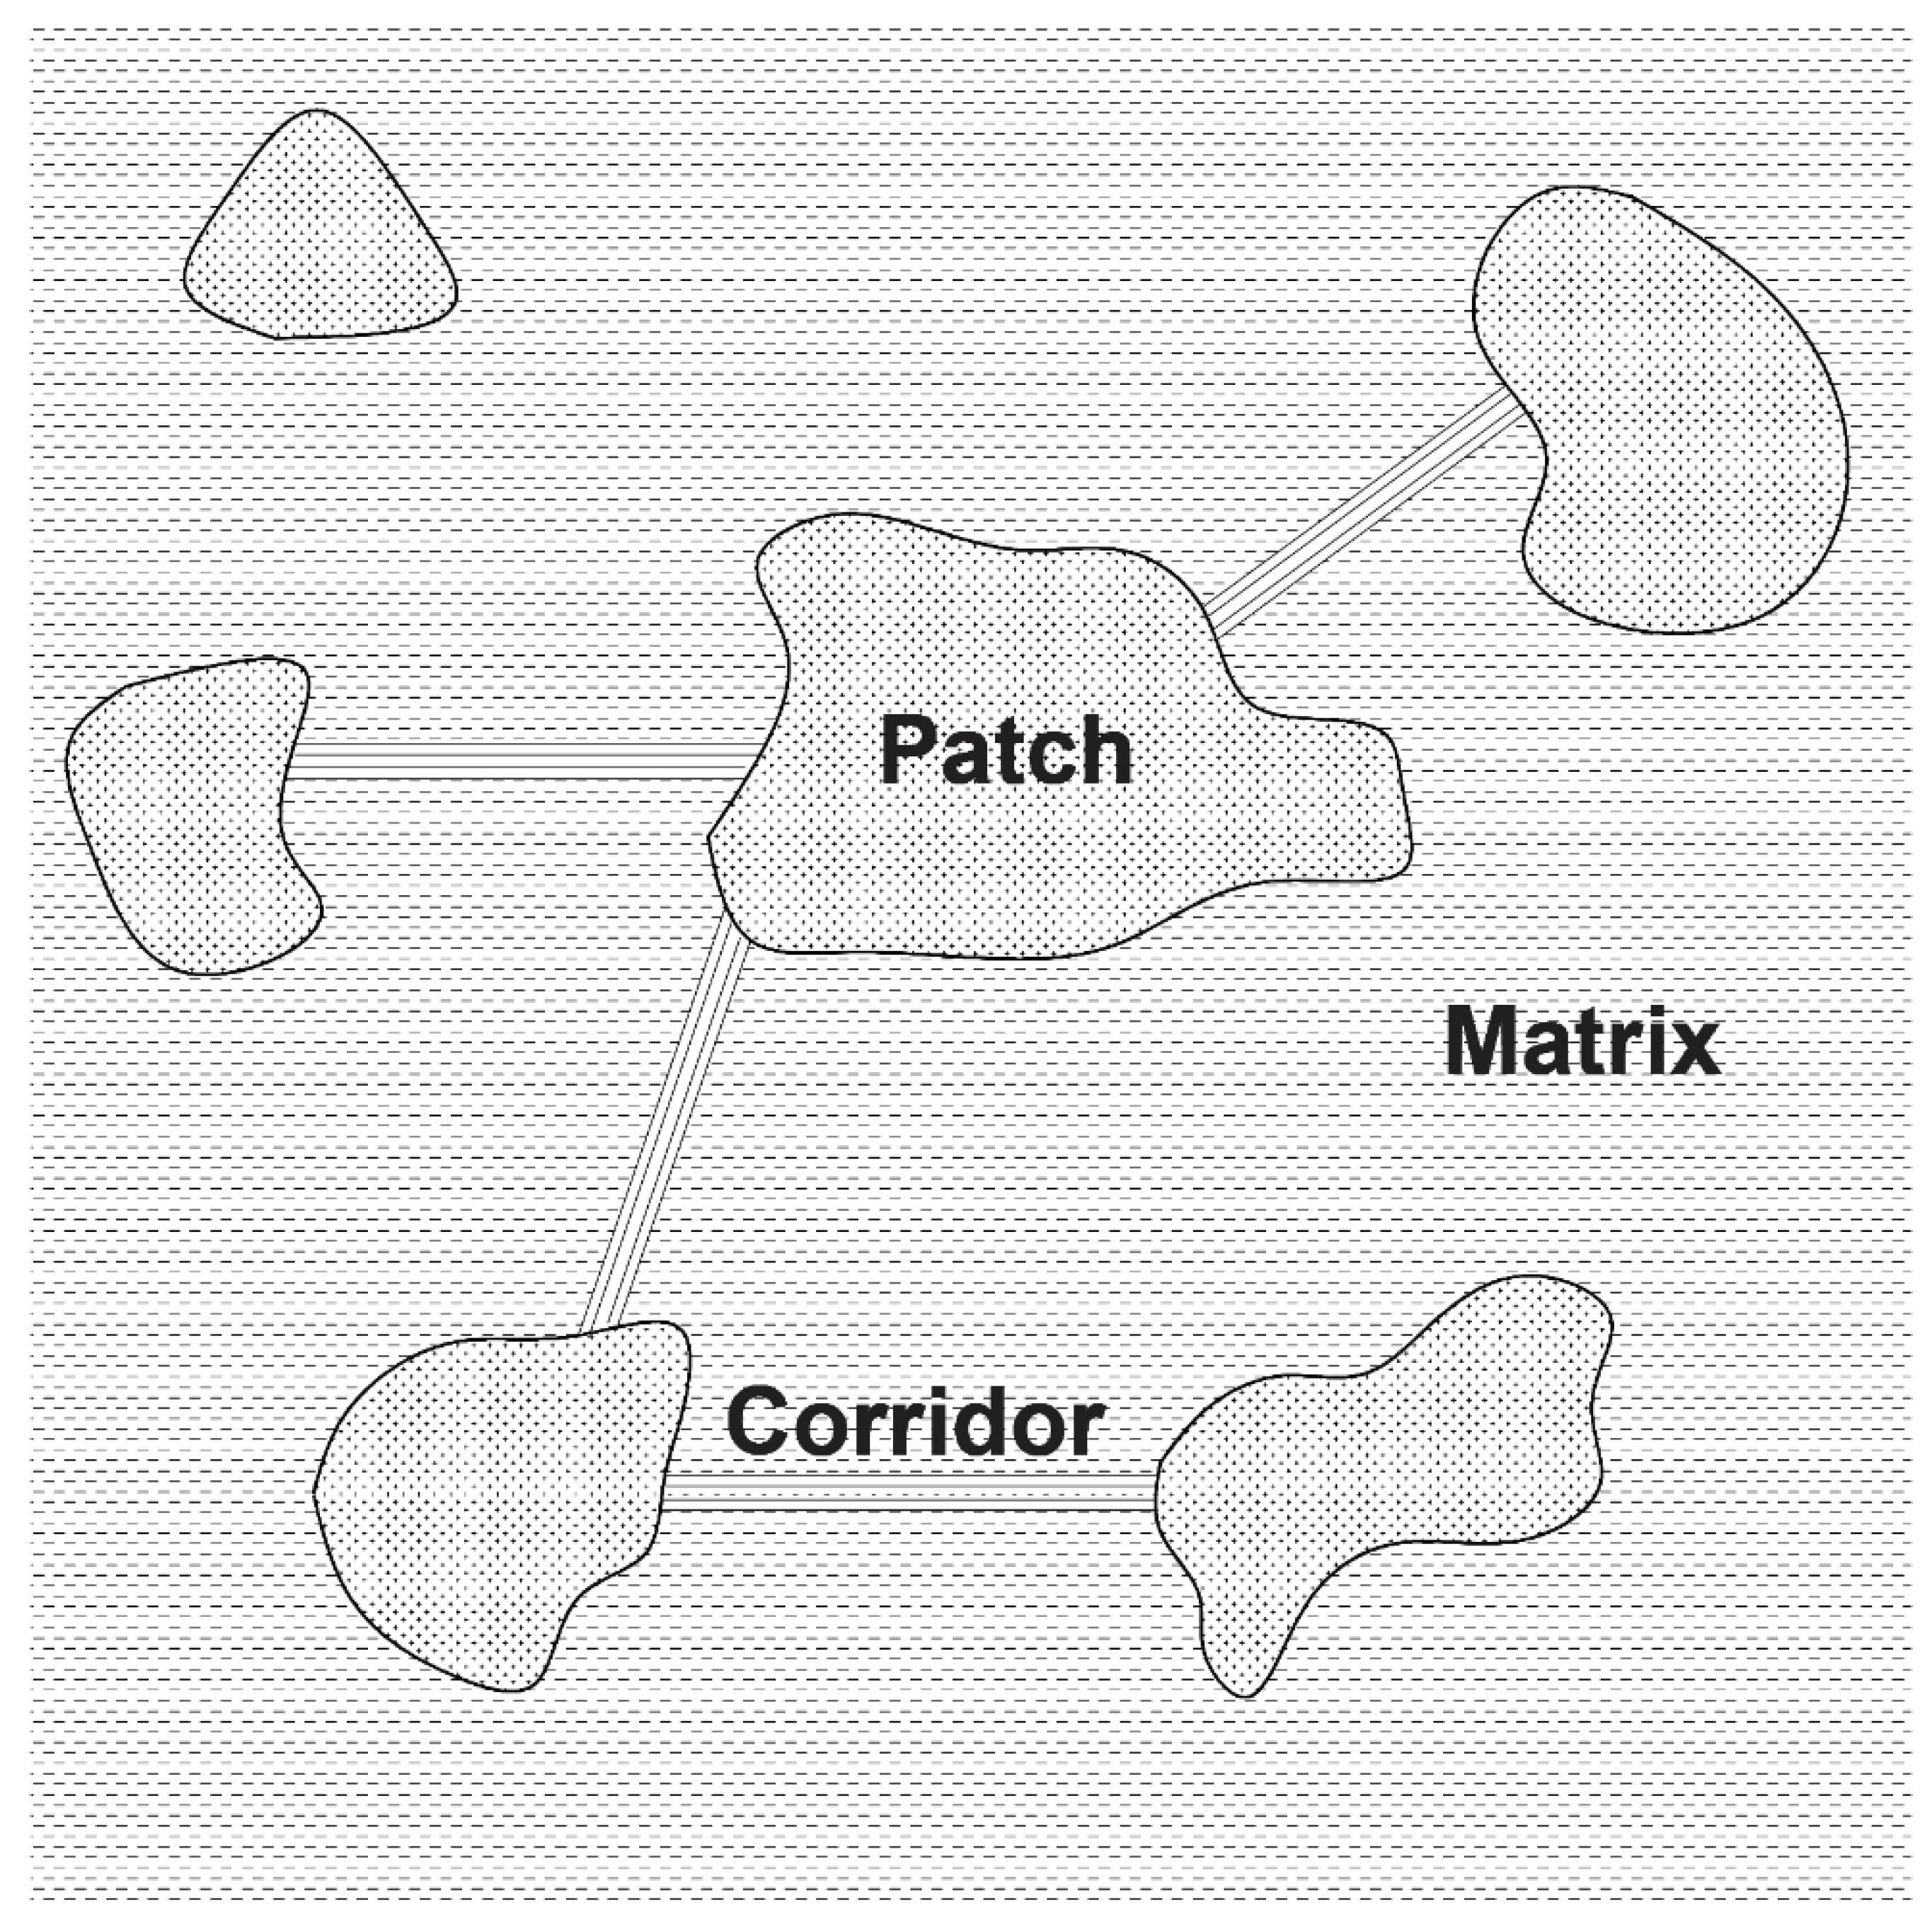
2.1. Patch–Corridor–Matrix Model

The ecological connectivity of the green network (habitat types and size) was analysed using the Patch–Corridor–Matrix (PCM) model [25]. The model allows for identifying and representing landscape elements in a categorical map pattern [26,27,28] and identified three types of landscape elements (see Figure 2): the matrix, the dominant element of a landscape characterised by a certain uniformity of land use; patches, relatively homogeneous areas that differ from their environment; and corridors, strips of a particular kind of habitat that differ from adjacent lands on both sides. A pattern created by overlapping patches, corridors, and a landscape matrix is identified as a mosaic. Depending on the scale of analysis, the ecological connectivity can vary based on the total surface area of land-use cover (type and size) and habitat fragmentation. Habitat fragmentation transforms a significant habitat into more patches with smaller isolated surface areas. Edges and interior patches’ surfaces provide habitats for different species with higher values; as the edge length ratio and the patches’ density decrease, the biodiversity increases [25].
GIS mapping using the PCM models is increasingly used to support strategic and sustainable GI planning at city or neighbourhood levels. For example, in Shenzhen, China, GIS mapping of GI was conducted and analysed using PCM to identify ecological areas and linkages for protection and restoration before development in suburban areas [27]. In Philadelphia, USA [29], GIS was used to plan GI implementation for stormwater management while promoting environmental equity. In addition, other studies have pointed out the relevance of mapping ecological connectivity [7,25,30,31] as a means to allow planners to (i) analyse and visualise spatial data related to [7] GI, including wetlands, forests, urban green areas, land use, soil type, and hydrology; (ii) support site selection and ensure equitable access to green areas by all residents; and (iii) provide data integration of various data sources. GIS mapping is valuable in GI planning because it provides evidence-based data to enable and support comprehensive data analysis, decision making, and management of green areas.
Figure 2. Patch–corridor–matrix model diagram: model for conceptualising and representing landscape elements in a categorical map pattern. Adapted from Forman and Godron, 1986 [26].
Sustainability 15 16103 g002

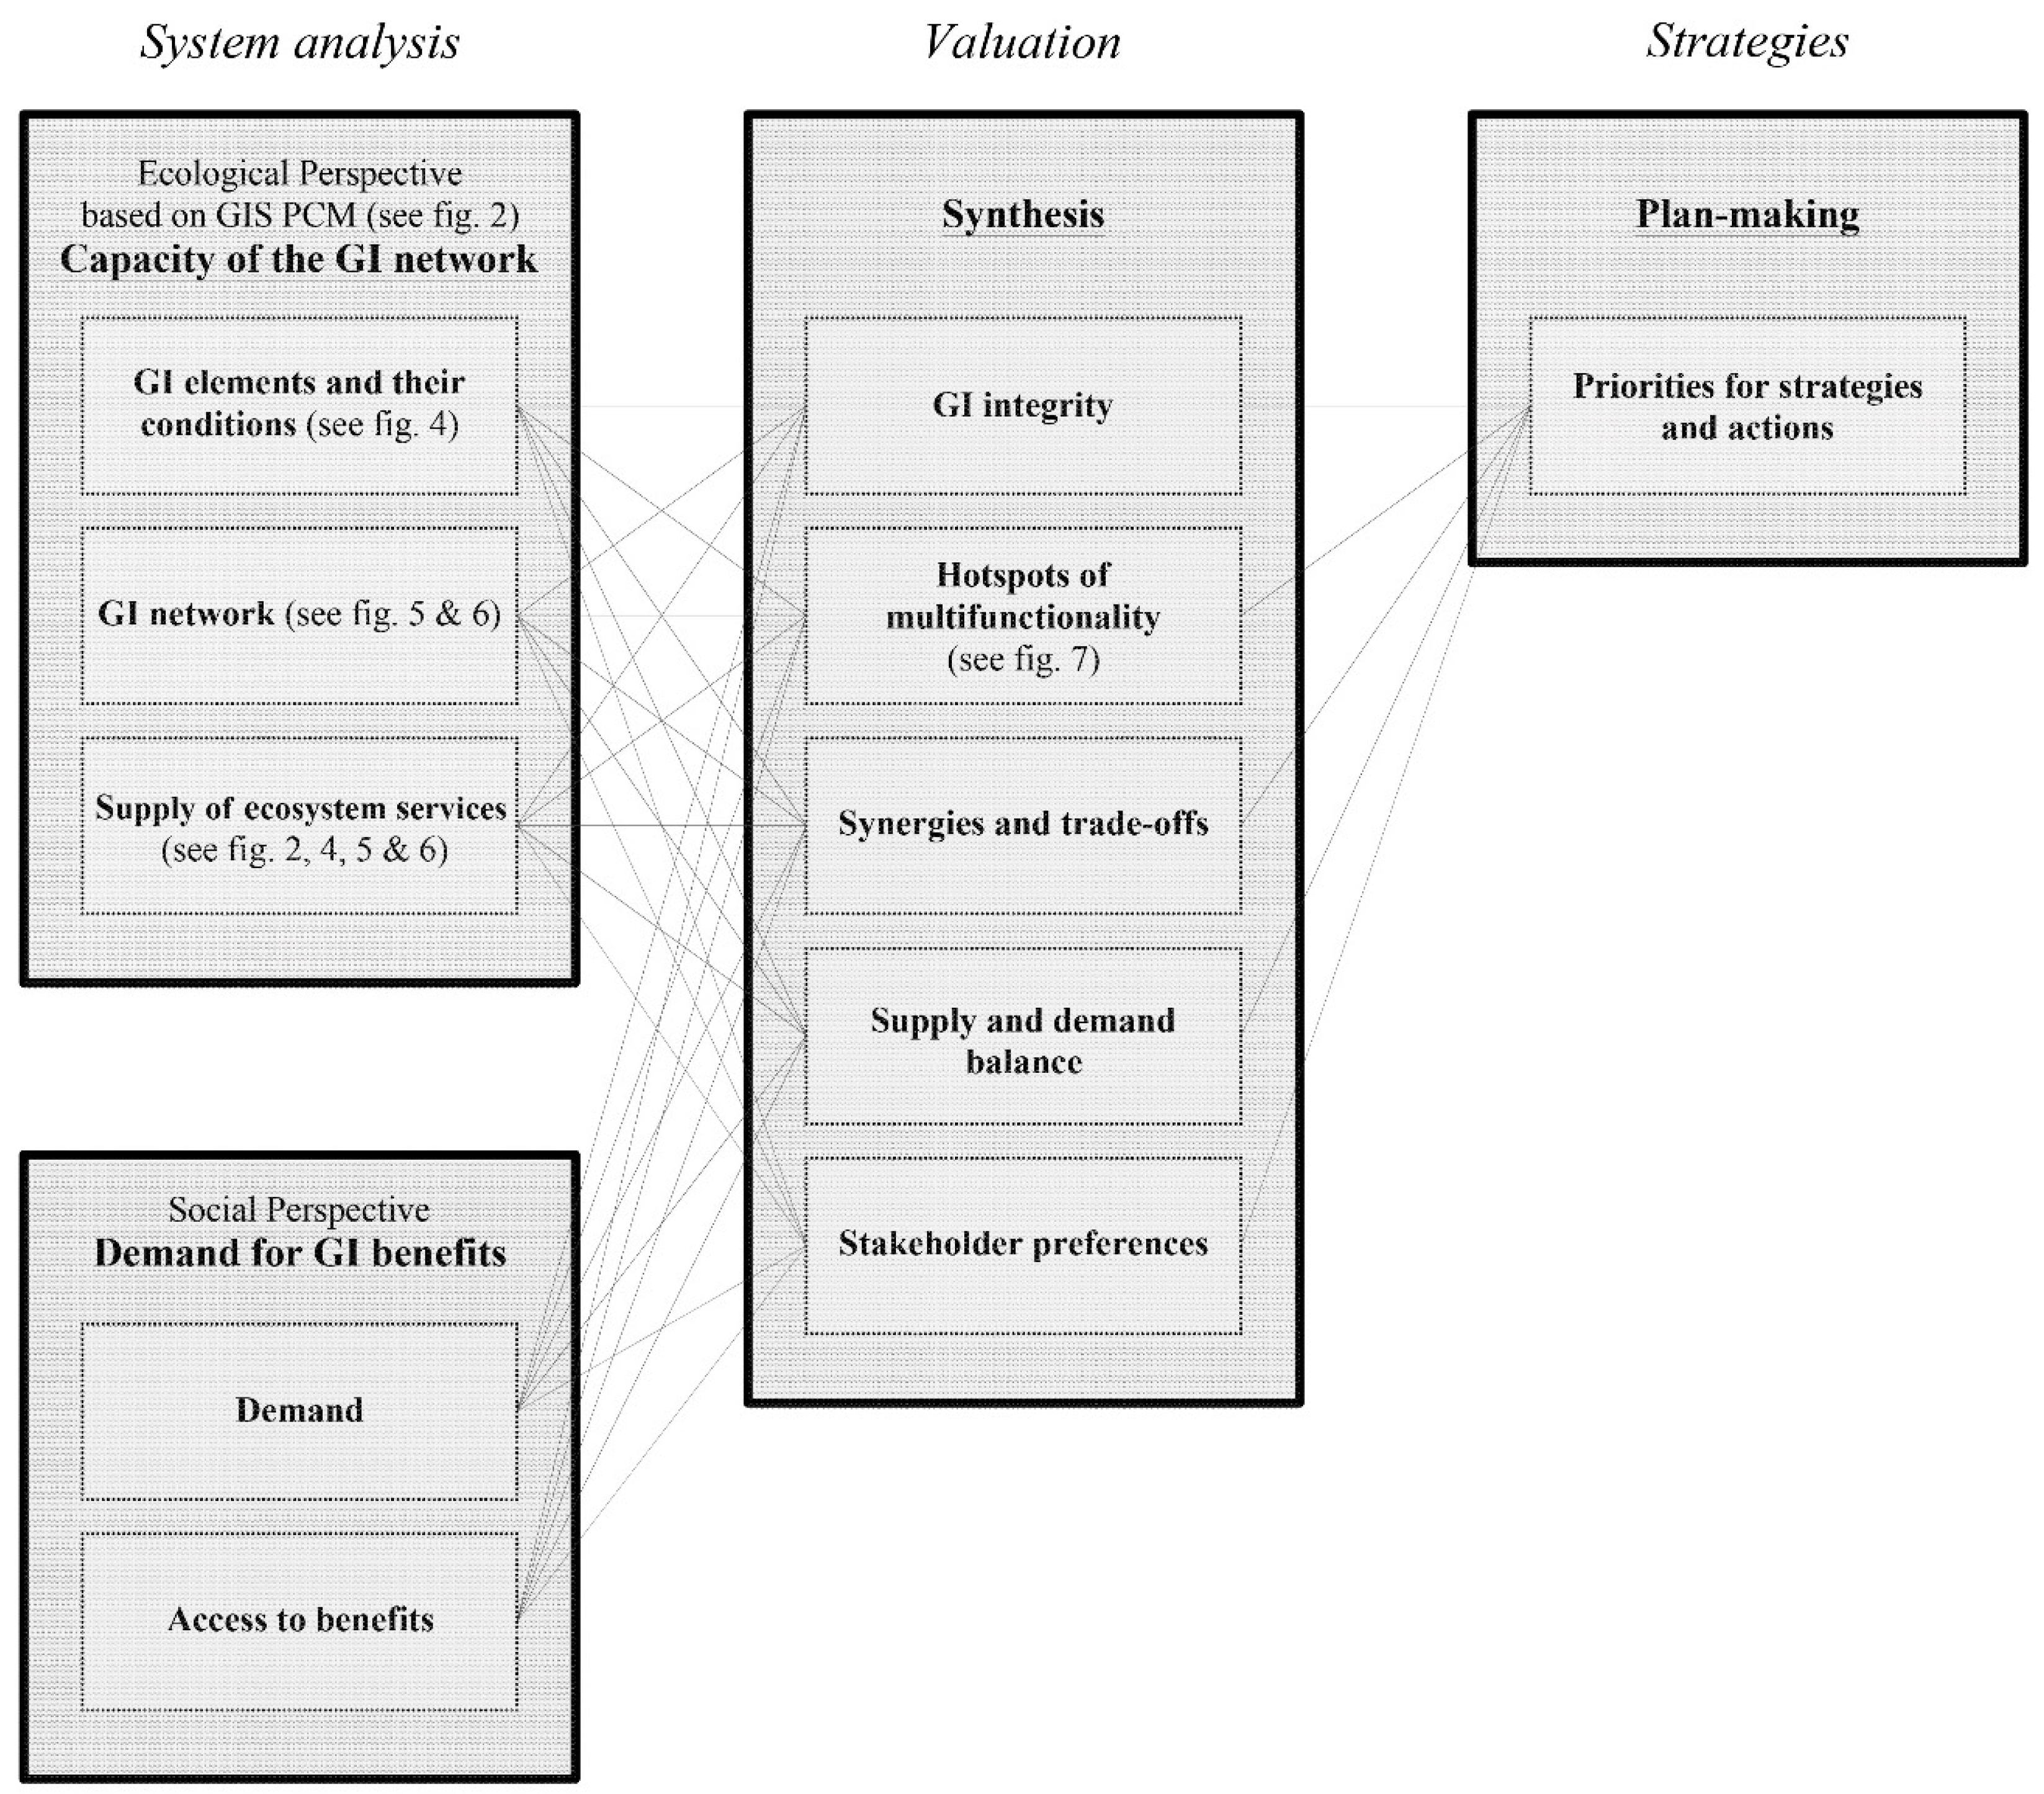
2.2. Multifunctionality Framework for Assessing GI Planning

Our research is based on the multifunctionality framework for GI planning framework adapted from [24] to analyse the ecological capacity of GI networks. The framework [24] describes the potential to understand social-ecological systems’ complex interrelations and dynamics and to enable planning practitioners to assess the multifunctionality of GI from a social-ecological perspective by integrating GI and ecosystem service research. GI infrastructure multifunctionality refers to the comprehensive capability of GI to simultaneously provide a range of benefits within a specific landscape. While the presence of GI relies on ecosystem function, these functions are not directly utilized by humans. Instead, they act as intermediary elements that contribute to ecosystem services, which are important to human well-being. Moreover, these functions can serve as source of services that directly benefits humans such as flood protection. The multifunctional framework for GI planning highlights on two important perspectives to be considered. The first perspective involves evaluating the ecological aspects by gathering data on the existing GI’s ability to provide ecosystem services in each area. The second perspective is the social aspect, which entails collecting data to understand the ecosystem services desired or needed by various stakeholders in a specific green infrastructure project.
Based on the above framework, an in-depth evaluation of the GI integrity (to combine information on GI elements and their conditions) is assessed concerning ecosystem services. While identifying GI hotspots for multifunctionality, synergies and trade-offs, supply and demand balance, and stakeholder preferences. In summary, the multifunctionality framework is a social-ecological system approach that uses strategic system analysis and evaluation to promote sustainable GI plans. Currently illustrated by multiple lines in Figure 3 below through interactions and feedback between the ecological and social perspectives. The ecological perspective addresses the spatial GI elements and structures of function and services they provide. The social perspective aims at the demand side and positive impacts of GI to deliver ecosystem services to human wellbeing. For example, researchers and practitioners often emphasise health benefits [32,33,34,35]; therefore, planners must be informed about the demand for ecosystem services to avoid measures that fail to meet social needs [36,37,38,39]. Secondly, to mitigate unintentional effects that can increase environmental injustice. In that line, [24] explains that demand can be determined through expert judgment or politically agreed standards towards a sustainable social-ecological enhancement. On the other hand, highlights that the ecological and social perspectives can be surveyed separately. In that sense, we relied on the GIS data, and the PCM model, to analyse the ecological connectivity of GI in the industrial platform of the Maalbeek sub-catchment scale, Flanders. The present study is primarily centered on the ecological perspective as detailed in Figure 3. However, we recognize the significance of simultaneously incorporating the social perspective while planning for the implementation of urban GI by integrating the social demand and access to GI benefits as proposed by Figure 3 below.

3. Results

The first set of maps (Figure 4) illustrates the location and quantification (surface coverage) of all existing ecosystem types in Flanders (excluding urban built-up areas), and it highlights crops as the dominant ecosystem, i.e., the matrix. The second set of maps (Figure 4 and Figure 5) illustrates the ecological connectivity of Flanders, identifying existing corridors and industrial platforms and classifying the habitat fragmentation at the scale of the water basin in the region. The last set of maps (Figure 6 and Figure 7) illustrates the analysis at the Maalbeek sub-catchment scale, localising primary and secondary corridors, industrial platforms, and non-productive areas and identifying areas of intervention.

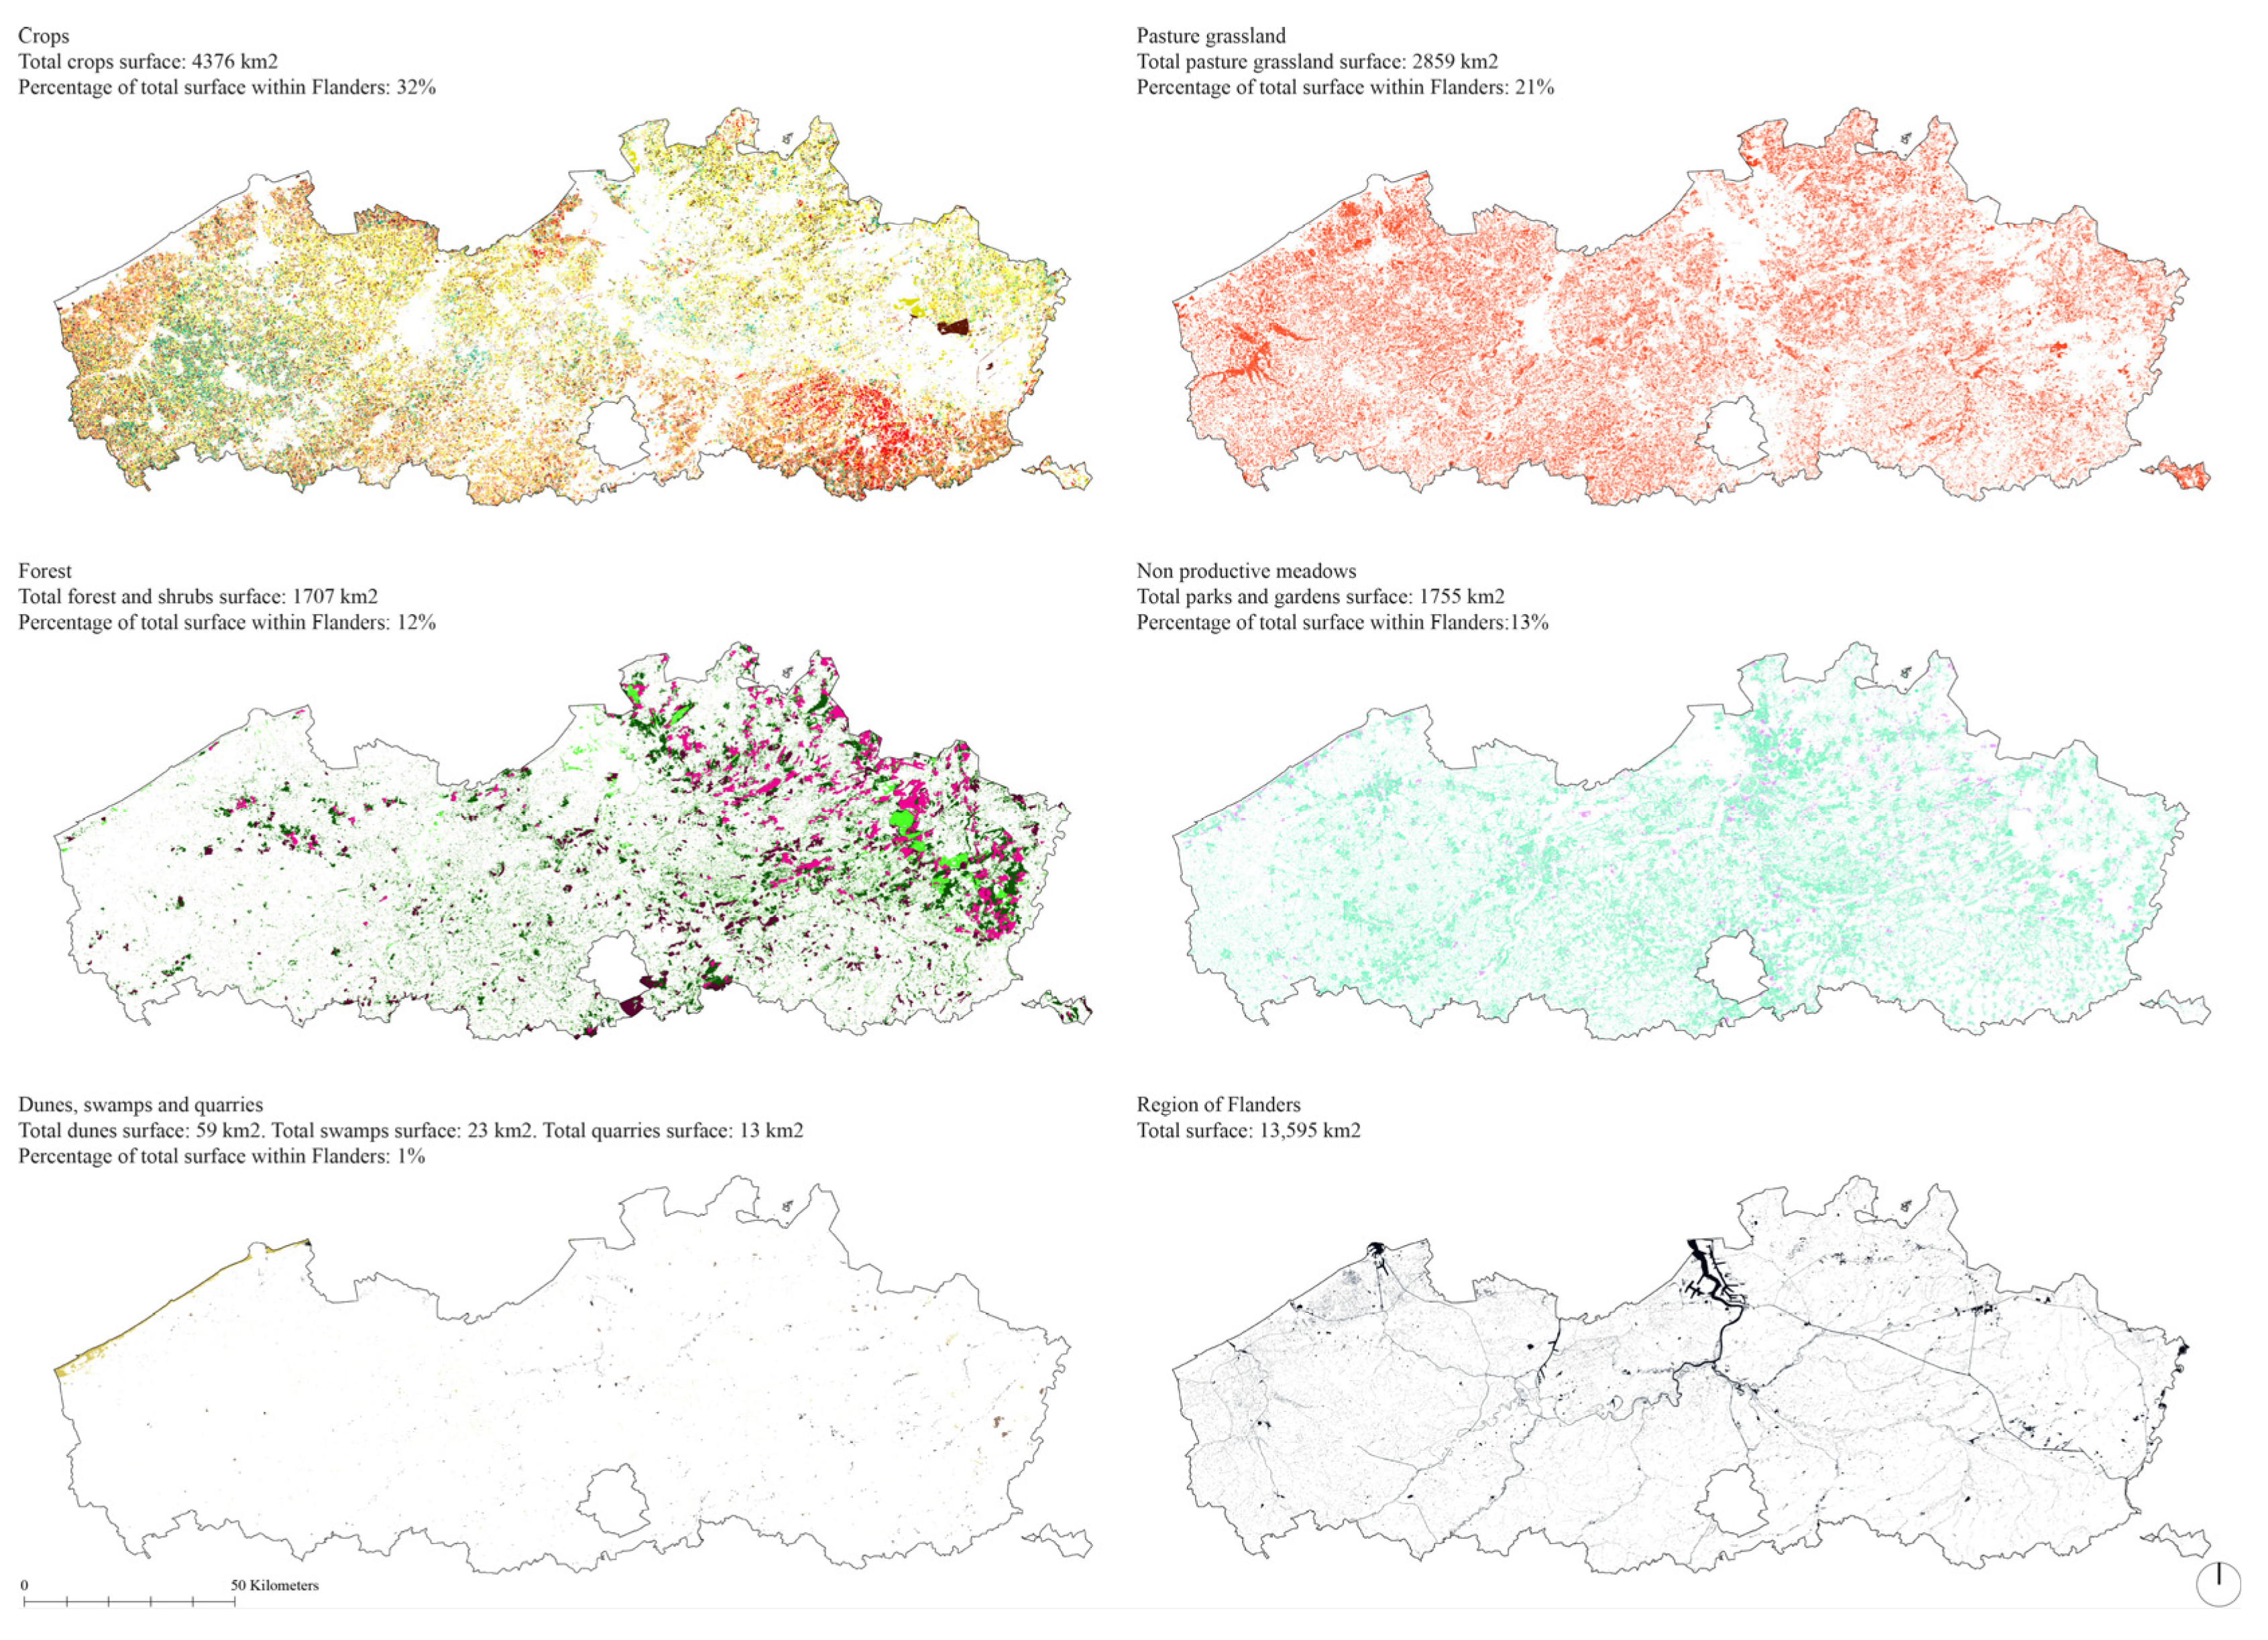
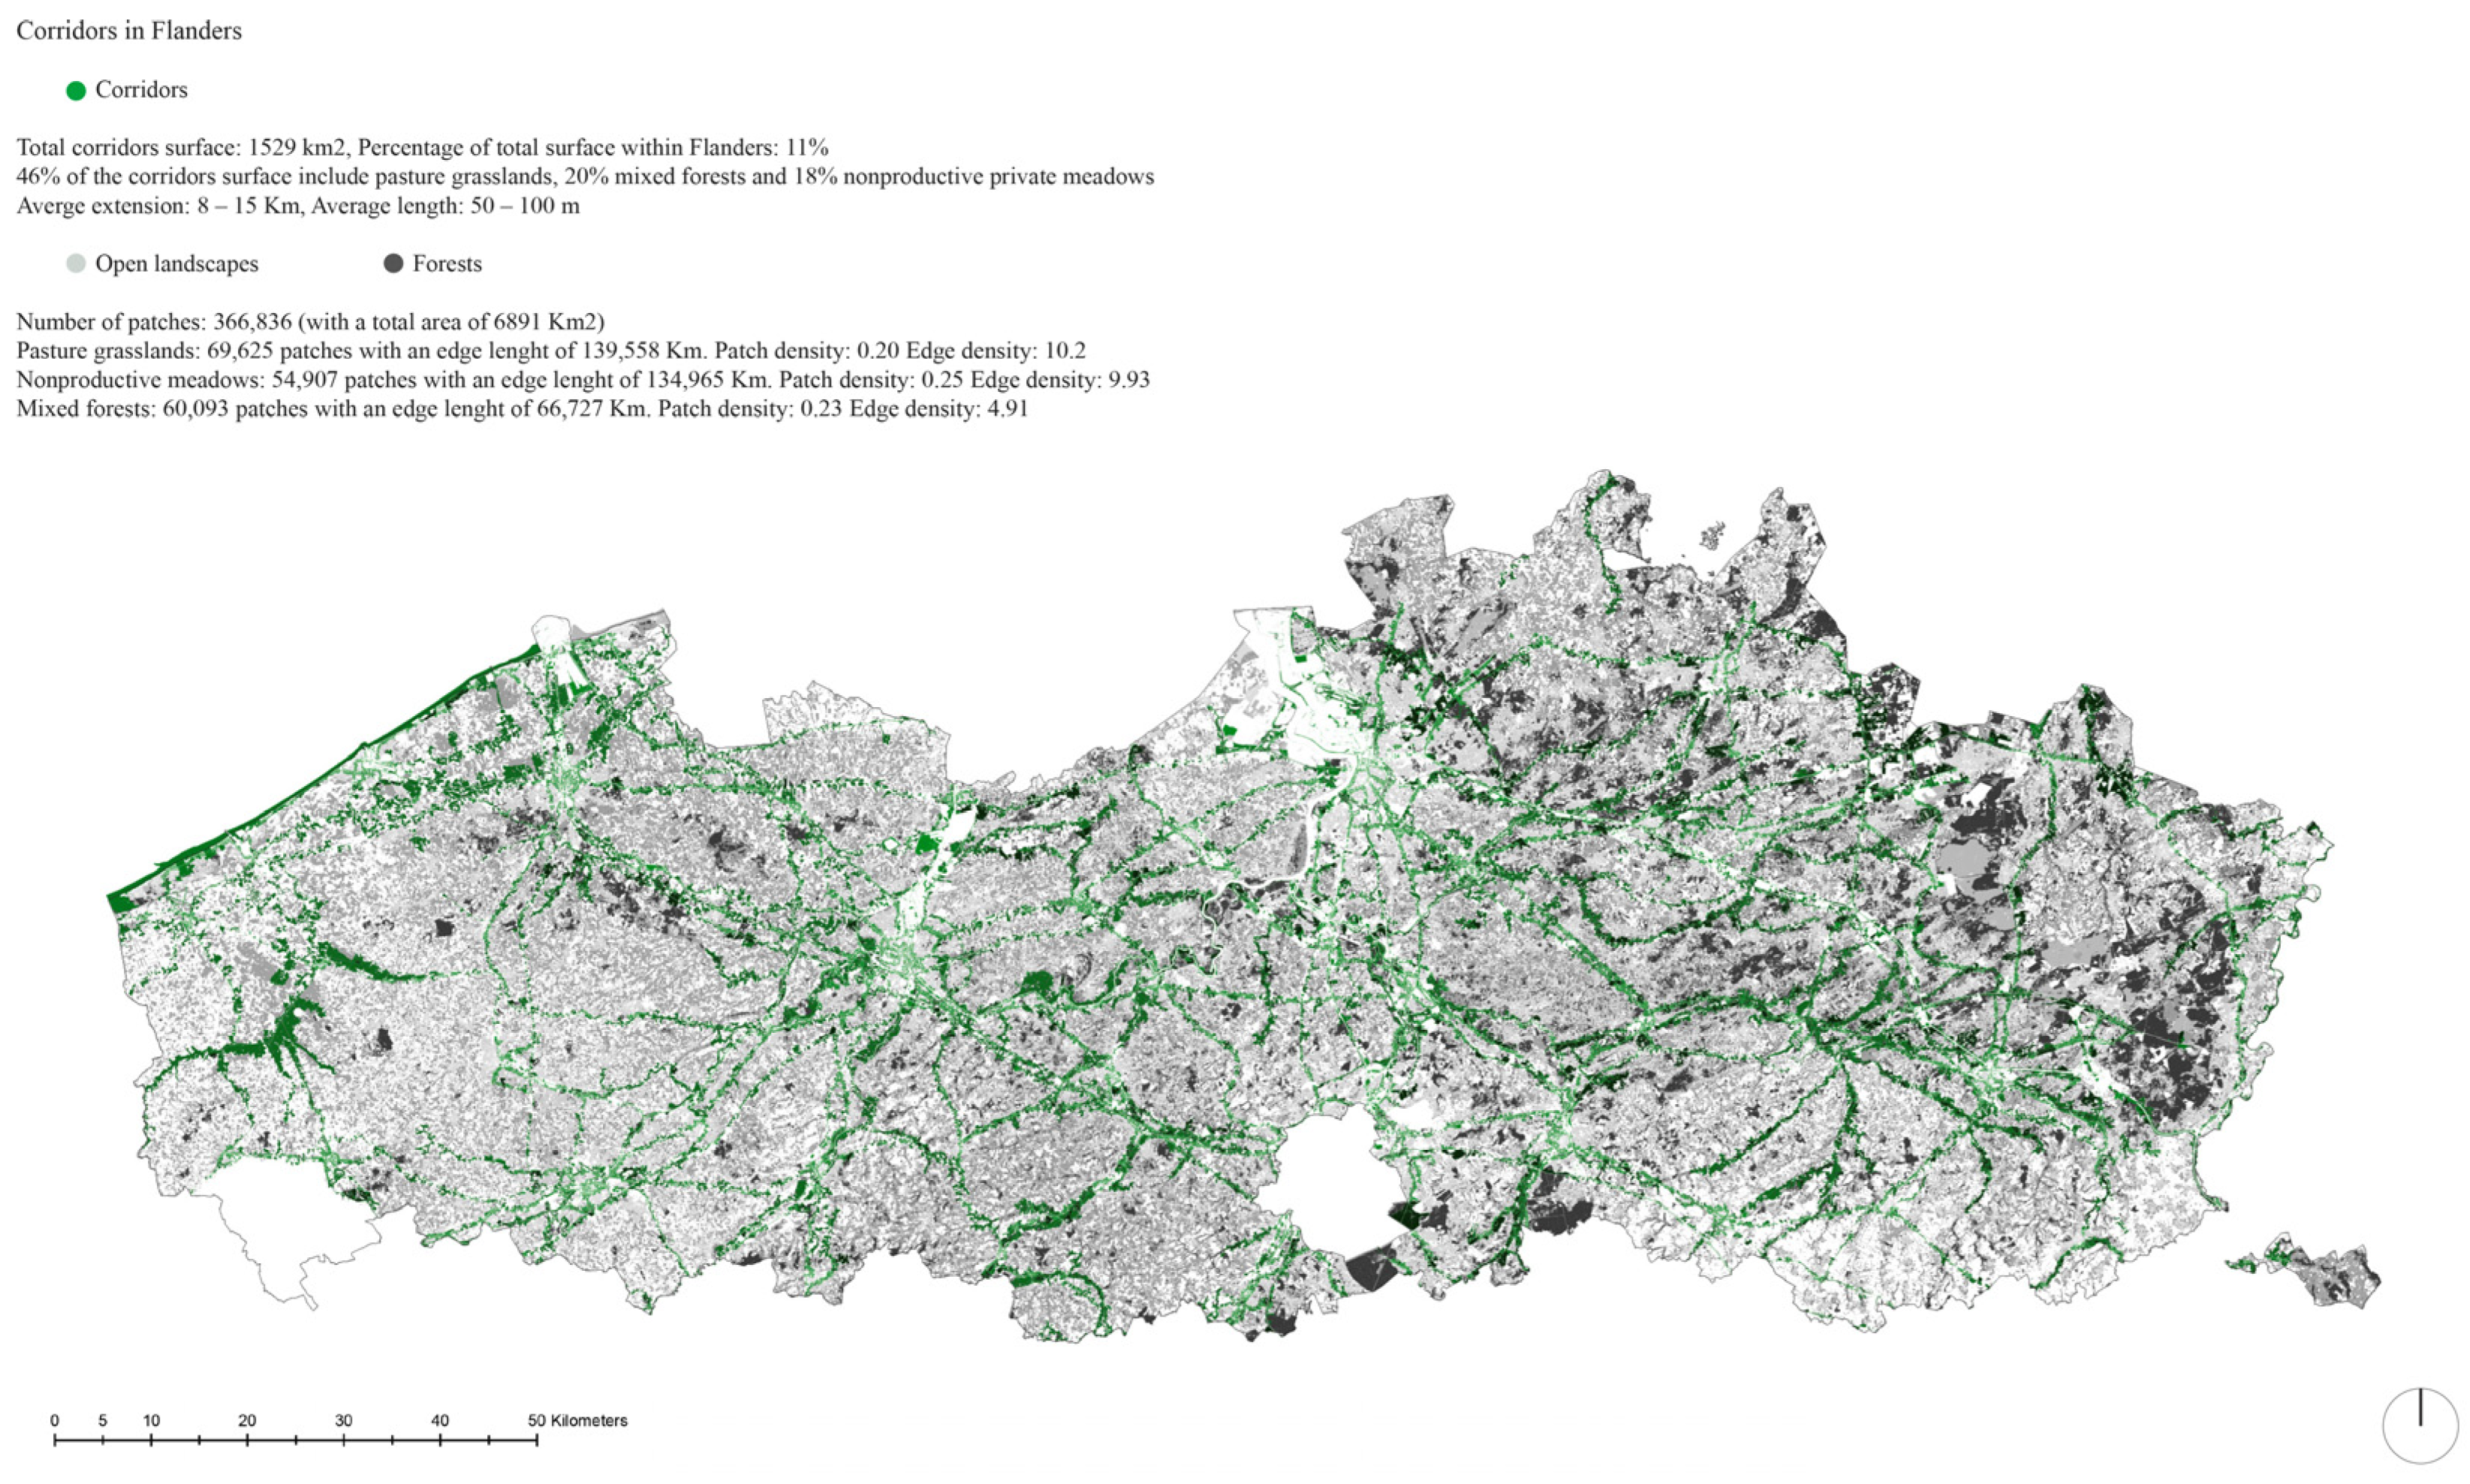
3.1. The Ecological Network Analysis of Flanders

In Flanders, cropland is the dominant matrix with a surface of 4.376 km2, which represents (32%) of the total regional area. This is followed by pasture grasslands, which cover 2.859 km2 (21%), and then forests, 1.707 km2 (12%), and non-productive meadows, 1.755 km2 (13%). Other ecosystem types include dunes (59 km2), swamps (23 km2), and quarries (13 km2), which together account for 1% of the total regional area (see Figure 4).
At the regional scale, we can identify three main types of natural and constructed corridors that cross the territory: riparian corridors (rivers, streams, and channels), railroads, and roads (“through” corridors); 60% of the total surface area is identified as riparian corridors, 19% as road corridors, 16% as railroad corridors, and 5% as other types of corridors such as hedgerows and dunes (waterfront). The surface of the total corridor is 1.529 km2, representing 11% of the total surface; 46% of the surface of the corridor includes pasture grasslands, 20% mixed forests, and 18% non-productive private meadows. The average extension is between 8 and 15 km, and the average length ranges between 50 and 100 m. The corridors connect 366,836 patches with a total area of 6.891 km2 (including pasture grasslands, non-productive meadows, and mixed forests). Pasture grasslands have the highest number of patches, with an edge length of 139,558 km. Moreover, 9.7 km2 of industrial platforms are located within the sub-catchment boundary, representing 4.6% of the total surface area.
Figure 5. Corridors (highlighted in green), open landscapes (highlighted in grey), and forests (highlighted in black) in the Flanders Region.
Sustainability 15 16103 g005
Figure 6. Habitat fragmentation in the Flanders Region based on the patches’ edge length and density.
Sustainability 15 16103 g006

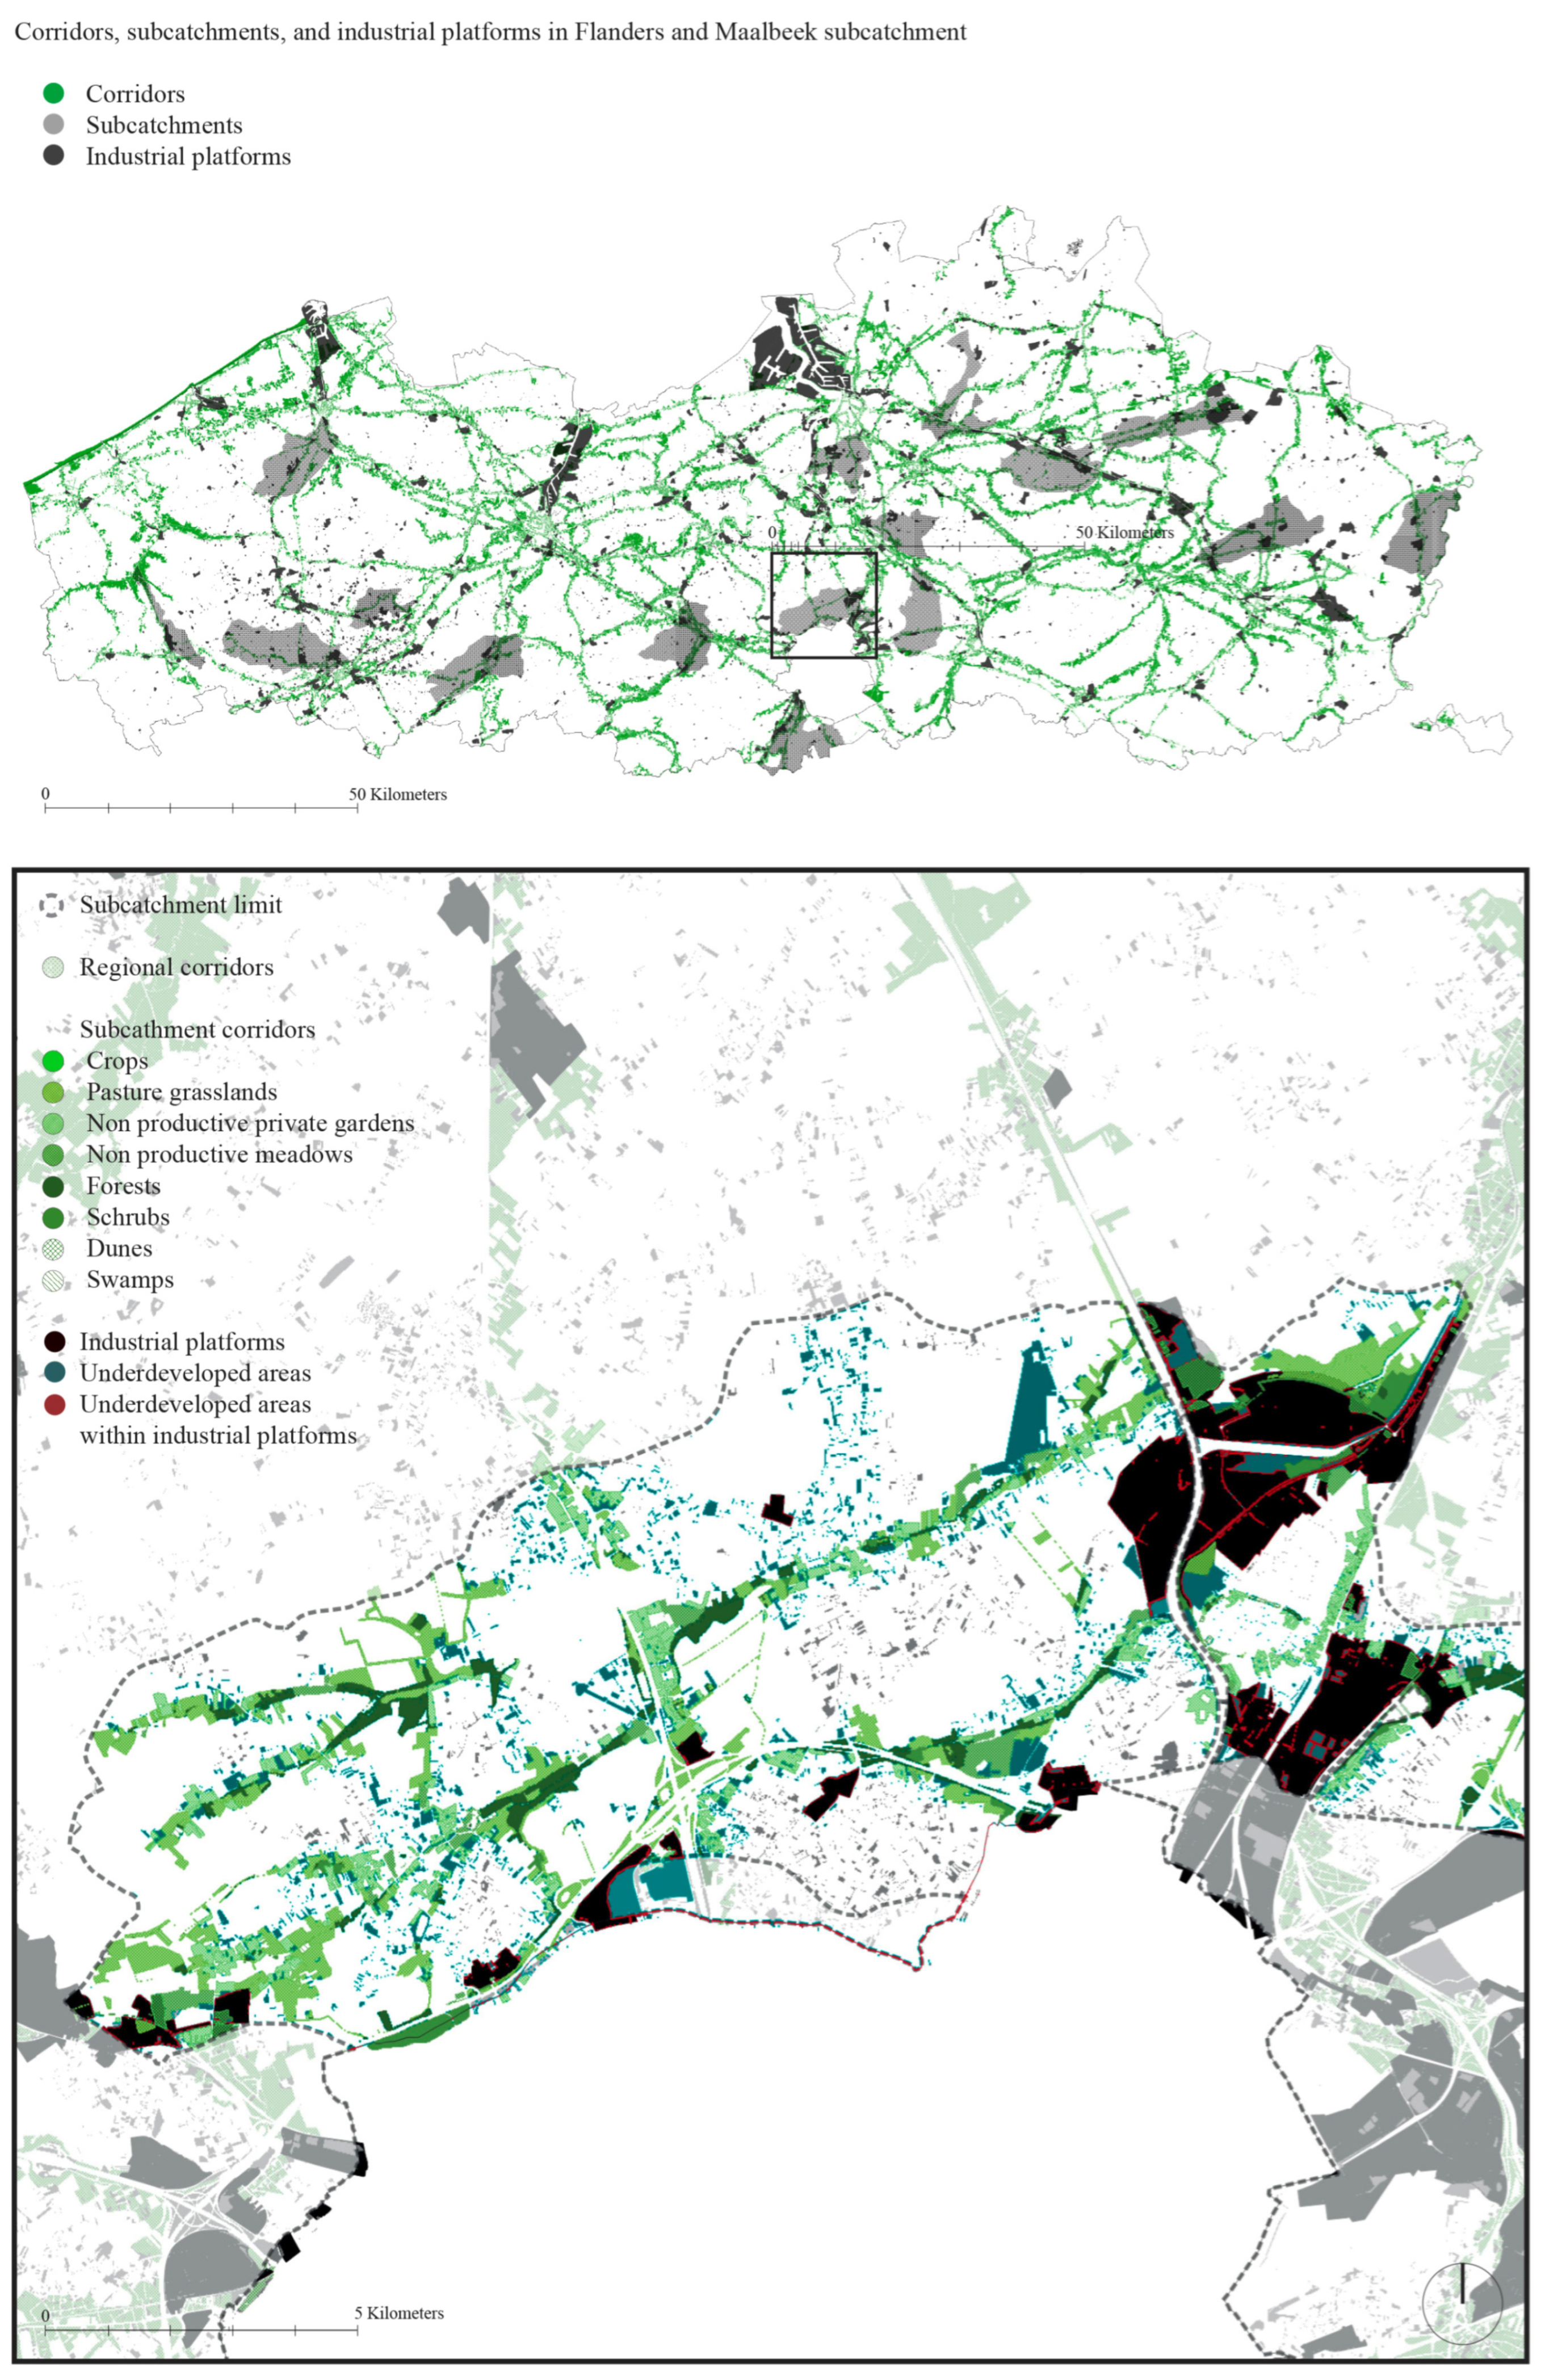
3.2. Ecological Network Analysis of the Industrial Platforms

The studied industrial platforms of Flanders are at the intersection between mobility and ecological networks (e.g., train lines, highway lanes, channels, etc.). Corridors in Flanders extend over a total surface of 1.539 km2, of which, 412 km2 are located within the industrial platforms (562 km2 of the total surface area occupied by industrial media); 10% of the corridors’ surface is located in the 16 selected sub-catchments. The industrial platforms in the Maalbeek sub-catchment account for 15% of the total surface (10 km2) and are bordered by three regional corridors and crossed by four in-boundary corridors. The Maalbeek sub-catchment has a total cropland matrix surface of 17 km2, representing 34% of the total surface area of the sub-catchment. In-boundary corridors connect 1818 patches with a total surface area of 32.4 km2 (including pasture grasslands, nonproductive meadows, and mixed forests); 9.7 km2 of industrial platforms are included within the sub-catchment boundary, representing 4.6% of the total surface area (see Figure 7). Figure 7 highlights in blue the underdeveloped areas located in proximity to the existing corridors and in red those located within the industrial platforms. The regional corridors and in-boundary sub-catchment corridors cross the Maalbeek sub-catchment area transversally and longitudinally and include both riparian corridors (blue network) and “through” corridors (railroad and highway networks).
Figure 7. Corridors, sub-catchments, and industrial platforms in Flanders and the Maalbeek sub-catchment. Highlighted in cyan are underdeveloped areas that could be used to reinforce the main corridors and secondary corridors. Highlighted in red are underdeveloped areas within the industrial platforms.
Sustainability 15 16103 g007

4. Discussion

Assessment of GI Multifunctionality in Flanders Industrial Area
The industrial areas in the Flanders Region have a broad spectrum for the multifunctionality of GI networks because of their strategic location (see Figure 6) in the blue and GI spaces, which could be an opportunity to expand biodiversity. These areas comprise pasture grassland, non-productive meadows, mixed forest, private gardens, shrubs, dunes, and swamps quarries. Moreover, Flanders has a total cropland matrix surface of 17 km2, representing 34% of the total surface area. They can be categorised as provisioning and regulating ecosystem benefits [40,41,42,43]. The spatial relationships of GI elements and networks form diverse ecological connectivity which can be assessed to identify opportunities for enhancing ecological connectivity and potential nature benefits [24].
Based on the PCM model and GI multifunctionality assessment of the Maalbeek sub-catchment, the underdeveloped areas within the industrial platforms are suitable for GI expansion. They include riverbanks, non-built surfaces, and abandoned lots that can be assessed to implement new GI elements. They represent 9% of the total surface (4.5 km2); together with the industrial platforms, they represent a reservoir of available land through which GI can be integrated to strengthen the ecological connectivity of the sub-catchment area. Based on the current and potential connectivity of the green and blue networks, north–south connections within the industrial platforms (in green) are suggested to reinforce existing ecological corridors or create new ones along the natural and built environment in the regional and in-boundary sub-catchment corridors.
Based on the configuration between regional and in-boundary corridors and underdeveloped areas within the industrial platforms of the Maalbeek sub-catchment, a hotspot can be identified where new GI elements that can enable multifunctionality can be integrated (see Figure 7). The possible synergies and trade-offs align with the Bouwshift legislation to implement desealing strategies at a finer scale for non-permeable surfaces to interconnect and reinforce the existing patches and corridors, while enhancing species’ ecological connectivity and mobility.
The mobility of species can be increased by creating corridors or habitat sinks in Flanders and industrial areas in small patches [25]. These can be designed and implemented as green roofs, wetlands, green walls, bio-retention areas, infiltration trenches, permeable pavements, retention ponds, vegetated swales, and sedimentation basins Green With Grey GWG [44,45,46,47] for regulation and provisioning ecosystem benefits in the industrial platforms. Moreover, most industrial platforms are located near residential and commercial centres; as such, residents and industrial workers can benefit from ecosystem benefits of specific GIs.
Our multifunctionality framework applied to GI planning allowed us to analyse GI networks’ ecological capacity by identifying GI elements, networks, function as a supply of services, and hotspots suitable for GI implementation. However, the recommendation to transform industrial platforms into valuable hotspots for enhancing ecological connectivity should be nurtured by ecological field observation and GIS modelling (land use, land cover, hydrology, and population density). GI implementation in industrial platforms in Flanders poses various opportunities to enhance ecological connectivity. These can be implemented in neighbourhoods, districts Green With Grey GWG or parks on private or public land in a specific industrial platform, GI can facilitate systemic water management. In that regard, various ecological and socio-economic datasets should be integrated into the current results, which might include environmental, social, and economic data to assess the multifaceted benefits of GI functionality and services comprehensively, such as improved air quality, reduced urban heat islands, mitigation of flood risks to enhance urban ecosystems while improving community wellbeing [48,49,50]. Further studies can be conducted to capture the social demand for GI benefits by assessing the perceptions of different stakeholders through a participatory bottom-up approach (capturing the inhabitants’ views starting at the household level).

5. Conclusions

We used the PCM model to map GI’s ecological connectivity in industrial platforms in Flanders. Cropland matrix was identified as the dominant land media, followed by pasture grassland. There are three main natural and constructed corridors: riparian corridors (rivers, streams, and channels), railroads, and roads. An interaction between the natural ecological system and the built environment was more profound at the industrial platforms (transportation network intersecting riparian blue corridors). Our study concluded that industrial platforms are significant hotspots as sites for GI implementation to improve and diversify ecological connectivity to provide multifaceted social–ecological benefits and reduce urban challenges.
This paper has demonstrated that the novel coupling of a GI multifunctionality framework with a GIS-based/PCM model can be used to identify opportunities for GI plans, proposals, and projects at different regional levels in other European regions and globally; our integrated method is tailored to suit a specific spatial area. Future studies based on our methodology should triangulate the results of our combined mapping with ecological and socio-economic fieldwork for a fuller assessment of GI multifunctionality and to close the gaps in the current analyses.
Finally, GI implementation in industrial areas in Flanders can play a pivotal role in mitigating land sealing through shifting in building attitude and to address existing environmental issues, such as increased flooding. Public-private partnerships that could leverage opportunities for implementing green infrastructure to combat land sealing at the neighborhood, district, or park level, were studied in a specific chapter of the GWG project, devoted to socio-economic coalitions and pathways into collaborative stakeholder involvement [51]. These can originate in government and municipality incentives and regulation enforcement to encourage GI implementation in the industrial areas, including, for example, grants and tax incentives that require green infrastructure implementation. In this context, public-private partnerships were also identified as crucial to promote collaboration with private businesses and industries to jointly invest and maintain GI projects to mitigate financial burdens while promoting sustainable practices.

Author Contributions

Conceptualization, D.P., D.O.P. and D.J.N.; methodology, D.P., D.O.P. and D.J.N.; validation, D.P.; formal analysis, D.P., D.O.P. and D.J.N.; data curation, D.O.P.; writing—original draft preparation, D.J.N. and D.O.P.; writing—review and editing, D.J.N., D.O.P. and D.P.; visualization, D.O.P.; supervision, D.P.; project administration, D.P.; funding acquisition, D.P. All authors have read and agreed to the published version of the manuscript.

Funding

Part of this research (ecological connectivity mapping and PCM model) was funded by the Department Omgeving, Flemish region, under the Proeftuinen Ontharding programme.

Institutional Review Board Statement

Not applicable.

Informed Consent Statement

Not applicable.

Data Availability Statement

No new data were created or analyzed in this study. Data sharing is not applicable to this article.

Acknowledgments

The authors would like to sincerely thank Bruno Notteboom (KU Leuven) for his valuable inputs and feedback on previous versions of the manuscript.

Conflicts of Interest

The authors declare no conflict of interest.

References

  1. Piper, J. Revising green infrastructure: Concepts between nature and design, by Daniel Czechowski, Thomas Hauck and Georg Hausladen, Boca Raton, FL, CRC Press, 2015, xxiv + 464 pp., £89.00 (hardback), ISBN 978-1-4822-3220-2. Int. J. Urban Sustain. Dev. 2015, 7, 245–247. [Google Scholar] [CrossRef]
  2. Perrotti, D. Landscape as Energy Infrastructure: Ecologic Approaches and Aesthetic Implications of Design. In Revising Green Infrastructure; CRC Press: Boca Raton, FL, USA, 2014; pp. 71–90. [Google Scholar] [CrossRef]
  3. Rodríguez-Espinosa, V.M.; Aguilera-Benavente, F.; Gómez-Delgado, M. Green infrastructure design using GIS and spatial analysis: A proposal for the Henares Corridor (Madrid-Guadalajara, Spain). Landsc. Res. 2020, 45, 26–43. [Google Scholar] [CrossRef]
  4. Perrotti, D.; Iuorio, O. Green Infrastructure in the Space of Flows: An Urban Metabolism Approach to Bridge Environmental Performance and User’s Wellbeing. In Cities and Nature; The Nature Conservancy: Arlington County, VA, USA, 2019; pp. 265–277. [Google Scholar] [CrossRef]
  5. Artmann, M.; Bastian, O.; Grunewald, K. Using the Concepts of Green Infrastructure and Ecosystem Services to Specify Leitbilder for Compact and Green Cities—The Example of the Landscape Plan of Dresden (Germany). Sustainability 2017, 9, 198. [Google Scholar] [CrossRef]
  6. Brueckner, J.K. Urban Sprawl: Diagnosis and Remedies. Int. Reg. Sci. Rev. 2000, 23, 160–171. [Google Scholar] [CrossRef]
  7. Liquete, C.; Kleeschulte, S.; Dige, G.; Maes, J.; Grizzetti, B.; Olah, B.; Zulian, G. Mapping green infrastructure based on ecosystem services and ecological networks: A Pan-European case study. Environ. Sci. Policy 2015, 54, 268–280. [Google Scholar] [CrossRef]
  8. Kalantari, Z.; Santos Ferreira, C.S.; Page, J.; Goldenberg, R.; Olsson, J.; Destouni, G. Meeting sustainable development challenges in growing cities: Coupled social-ecological systems modeling of land use and water changes. J. Environ. Manag. 2019, 245, 471–480. [Google Scholar] [CrossRef]
  9. Schiavina, M.; Melchiorri, M.; Corbane, C.; Florczyk, A.; Freire, S.; Pesaresi, M.; Kemper, T. Multi-Scale Estimation of Land Use Efficiency (SDG 11.3.1) across 25 Years Using Global Open and Free Data. Sustainability 2019, 11, 5674. [Google Scholar] [CrossRef]
  10. Maes, J.; Liquete, C.; Teller, A.; Erhard, M.; Paracchini, M.L.; Barredo, J.I.; Grizzetti, B.; Cardoso, A.; Somma, F.; Petersen, J.-E.; et al. An indicator framework for assessing ecosystem services in support of the EU Biodiversity Strategy to 2020. Ecosyst. Serv. 2016, 17, 14–23. [Google Scholar] [CrossRef]
  11. Cortinovis, C.; Haase, D.; Zanon, B.; Geneletti, D. Is urban spatial development on the right track? Comparing strategies and trends in the European Union. Landsc. Urban Plan. 2019, 181, 22–37. [Google Scholar] [CrossRef]
  12. Decoville, A.; Schneider, M. Can the 2050 zero land take objective of the EU be reliably monitored? A comparative study. J. Land Use Sci. 2015, 1–19. [Google Scholar] [CrossRef]
  13. Lacoere, P.; Leinfelder, H. No Net Land Take for Flanders. Towards a Roadmap for the Implementation of Europe’s Land Target; oekom verlag GmbH: München, Germany, 2023; pp. 1–16. [Google Scholar]
  14. Buitelaar, E.; Leinfelder, H. Public Design of Urban Sprawl: Governments and the Extension of the Urban Fabric in Flanders and the Netherlands. Urban Plan. 2020, 5, 46–57. [Google Scholar] [CrossRef]
  15. Jayasooriya, V.M.; Muthukumaran, S.; Ng, A.W.M.; Perera, B.J.C. Multi Criteria Decision Making in Selecting Stormwater Management Green Infrastructure for Industrial areas Part 2: A Case Study with TOPSIS. Water Resour. Manag. 2018, 32, 4297–4312. [Google Scholar] [CrossRef]
  16. Schippa, G.; Interlandi, S.; Russo, P.; Branca, F. Green restoration of the industrial area of the city of Catania for improving urban resilience and sustainability. Acta Hortic. 2018, 307–310. [Google Scholar] [CrossRef]
  17. Gavrilov, O.E.; Eremeeva, S.S.; Karaganova, N.G.; Kazakov, A.V.; Mironov, A.A. Ecological activity area formation of an industrial enterprise: Applied aspects. IOP Conf. Ser. Earth Environ. Sci. 2021, 677, 052059. [Google Scholar] [CrossRef]
  18. Jayasooriya, V.M.; Ng, A.W.M.; Muthukumaran, S.; Perera, C.B.J. Optimization of Green Infrastructure Practices in Industrial Areas for Runoff Management: A Review on Issues, Challenges and Opportunities. Water 2020, 12, 1024. [Google Scholar] [CrossRef]
  19. Sacirovic, S.; Ketin, S.; Vignjevic, N. Eco-industrial zones in the context of sustainability development of urban areas. Environ. Sci. Pollut. Res. 2019, 26, 24346–24356. [Google Scholar] [CrossRef]
  20. Zaykova, E.Y. Postindustrial Space: Integration of Green Infrastructure in the Center, Middle and Periphery of the City. In Springer Geography; Springer: Cham, Switzerland, 2018; pp. 106–117. [Google Scholar]
  21. Population Belgium. Available online: https://statbel.fgov.be/en/themes/population/structure-population (accessed on 16 September 2022).
  22. Davids, P.; Boelens, L.; Tempels, B. The effects of tailor-made flood risk advice for homeowners in Flanders, Belgium. Water Int. 2019, 44, 539–553. [Google Scholar] [CrossRef]
  23. Crabbé, A.; Coppens, T. Swapping Development Rights in Swampy Land: Strategic Instruments to Prevent Floodplain Development in Flanders. In Nature-Based Flood Risk Management on Private Land; Springer International Publishing: Cham, Switzerland, 2019; pp. 85–97. ISBN 9783030238421. [Google Scholar]
  24. Hansen, R.; Pauleit, S. From Multifunctionality to Multiple Ecosystem Services? A Conceptual Framework for Multifunctionality in Green Infrastructure Planning for Urban Areas. Ambio 2014, 43, 516–529. [Google Scholar] [CrossRef]
  25. Forman, R.T.T. Some general principles of landscape and regional ecology. Landsc. Ecol. 1995, 10, 133–142. [Google Scholar] [CrossRef]
  26. Perrotti, D. Revising Green Infrastructure; CRC Press: Boca Raton, FL, USA, 2018. [Google Scholar] [CrossRef]
  27. Chang, Q.; Li, X.; Huang, X.; Wu, J. A GIS-based Green Infrastructure Planning for Sustainable Urban Land Use and Spatial Development. Procedia Environ. Sci. 2012, 12, 491–498. [Google Scholar] [CrossRef]
  28. Eisenman, T.S. Book Review: The Ecological Design and Planning Reader. J. Plan. Educ. Res. 2017, 37, 374–376. [Google Scholar] [CrossRef]
  29. Heckert, M.; Rosan, C.D. Creating GIS-Based Planning Tools to Promote Equity Through Green Infrastructure. Front. Built Environ. 2018, 4, 27. [Google Scholar] [CrossRef]
  30. Otero Peña, D.; Perrotti, D.; Mohareb, E. Advancing urban metabolism studies through GIS data: Resource flows, open space networks, and vulnerable communities in Mexico City. J. Ind. Ecol. 2022, 26, 1333–1349. [Google Scholar] [CrossRef]
  31. Rall, E.; Hansen, R.; Pauleit, S. The added value of public participation GIS (PPGIS) for urban green infrastructure planning. Urban For. Urban Green. 2019, 40, 264–274. [Google Scholar] [CrossRef]
  32. Nieuwenhuijsen, M.J. Green Infrastructure and Health. Annu. Rev. Public Health 2021, 42, 317–328. [Google Scholar] [CrossRef]
  33. Babí Almenar, J.; Elliot, T.; Rugani, B.; Philippe, B.; Navarrete Gutierrez, T.; Sonnemann, G.; Geneletti, D. Nexus between nature-based solutions, ecosystem services and urban challenges. Land Use Policy 2021, 100, 104898. [Google Scholar] [CrossRef]
  34. Marando, F.; Heris, M.P.; Zulian, G.; Udías, A.; Mentaschi, L.; Chrysoulakis, N.; Parastatidis, D.; Maes, J. Urban heat island mitigation by green infrastructure in European Functional Urban Areas. Sustain. Cities Soc. 2022, 77, 103564. [Google Scholar] [CrossRef]
  35. Kabisch, N.; Korn, H.; Stadler, J.; Bonn, A. Nature-Based Solutions to Climate Change Adaptation in Urban Areas—Linkages Between Science, Policy and Practice; Springer: Cham, Switzerland, 2017; pp. 1–11. [Google Scholar]
  36. Mosleh, L.; Negahban-Azar, M.; Pavao-Zuckerman, M. Stormwater Green Infrastructure Resilience Assessment: A Social-Ecological Framework for Urban Stormwater Management. Water 2023, 15, 1786. [Google Scholar] [CrossRef]
  37. Voghera, A.; Giudice, B. Evaluating and Planning Green Infrastructure: A Strategic Perspective for Sustainability and Resilience. Sustainability 2019, 11, 2726. [Google Scholar] [CrossRef]
  38. Hansen, R.; Olafsson, A.S.; van der Jagt, A.P.N.; Rall, E.; Pauleit, S. Planning multifunctional green infrastructure for compact cities: What is the state of practice? Ecol. Indic. 2019, 96, 99–110. [Google Scholar] [CrossRef]
  39. Dennis, M.; Barker, A.; Anderson, J.; Ashton, J.C.; Cavan, G.; Cook, P.A.; French, D.; Gilchrist, A.; James, P.; Phillipson, C.; et al. Integrating knowledge on green infrastructure, health and well-being in ageing populations: Principles for research and practice. Ambio 2023, 52, 107–125. [Google Scholar] [CrossRef] [PubMed]
  40. Haines-Young, R.; Potschin, M. Common International Classification of Ecosystem Goods and Services (CICES): Consultation on Version 4, August-December 2012; EEA Framework Contract No EEA/IEA/09/003; Contract: København, Denmark, 2010. [Google Scholar]
  41. Mathey, J.; Rößler, S.; Banse, J.; Lehmann, I.; Bräuer, A. Brownfields As an Element of Green Infrastructure for Implementing Ecosystem Services into Urban Areas. J. Urban Plan. Dev. 2015, 141. [Google Scholar] [CrossRef]
  42. La Rosa, D.; Spyra, M.; Inostroza, L. Indicators of Cultural Ecosystem Services for urban planning: A review. Ecol. Indic. 2016, 61, 74–89. [Google Scholar] [CrossRef]
  43. Ziter, C. The biodiversity–ecosystem service relationship in urban areas: A quantitative review. Oikos 2016, 125, 761–768. [Google Scholar] [CrossRef]
  44. Otsuka, N.; Abe, H.; Isehara, Y.; Miyagawa, T. The potential use of green infrastructure in the regeneration of brownfield sites: Three case studies from Japan’s Osaka Bay Area. Local Environ. 2021, 26, 1346–1363. [Google Scholar] [CrossRef]
  45. Gyurkovich, M.; Gyurkovich, J. New Housing Complexes in Post-Industrial Areas in City Centres in Poland Versus Cultural and Natural Heritage Protection—With a Particular Focus on Cracow. Sustainability 2021, 13, 418. [Google Scholar] [CrossRef]
  46. Kristiánová, K.; Gécová, K.; Putrová, E. Old Industrial Sites—Conversion to Parks: Potential of Bratislava. Procedia Eng. 2016, 161, 1858–1862. [Google Scholar] [CrossRef]
  47. Draus, P.; Lovall, S.; Formby, T.; Baldwin, L.; Lowe-Anderson, W. A green space vision in Southeast Michigan’s most heavily industrialized area. Urban Ecosyst. 2019, 22, 91–102. [Google Scholar] [CrossRef]
  48. Venkataramanan, V.; Packman, A.I.; Peters, D.R.; Lopez, D.; McCuskey, D.J.; McDonald, R.I.; Miller, W.M.; Young, S.L. A systematic review of the human health and social well-being outcomes of green infrastructure for stormwater and flood management. J. Environ. Manag. 2019, 246, 868–880. [Google Scholar] [CrossRef]
  49. Marques, B.; McIntosh, J.; Chanse, V. Improving Community Health and Wellbeing Through Multi-Functional Green Infrastructure in Cities Undergoing Densification. Acta Hortic. Regiotect. 2020, 23, 101–107. [Google Scholar] [CrossRef]
  50. Panagopoulos, T. Special Issue: Landscape Urbanism and Green Infrastructure. Land 2019, 8, 112. [Google Scholar] [CrossRef]
  51. Grommen, C.; Aragone, A.; Notteboom, B. Actions for Water. In A Thousand Water Towers for Flanders; Report for Departement Omgeving; Vlaamse Overheid: Brussels, Belgium, 2022. [Google Scholar]
Figure 1. The geographic location of Flanders, Belgium.
Sustainability 15 16103 g001
Figure 3. Conceptual framework for assessment of GI multifunctionality. Adopted from Hansen and Pauleit [24].
Sustainability 15 16103 g003
Figure 4. Crop matrix in the Flanders Region. Croplands represent the predominant matrix and are a mosaic of varied crop types.
Sustainability 15 16103 g004
Disclaimer/Publisher’s Note: The statements, opinions and data contained in all publications are solely those of the individual author(s) and contributor(s) and not of MDPI and/or the editor(s). MDPI and/or the editor(s) disclaim responsibility for any injury to people or property resulting from any ideas, methods, instructions or products referred to in the content.

