
The Biofactory: Quantifying Life Cycle Sustainability Impacts of the Wastewater Circular Economy in Chile


Abstract
:1. Introduction
2. Methodology
2.1. Life Cycle Sustainability Assessment
2.1.1. Study Sites
2.1.2. Goal and Scope
2.1.3. System Boundaries
2.1.4. Integrated Life Cycle Inventories
2.1.5. Impact Characterization
2.2. Interpretation with Multi-Criteria Assessment of Sustainability Impacts
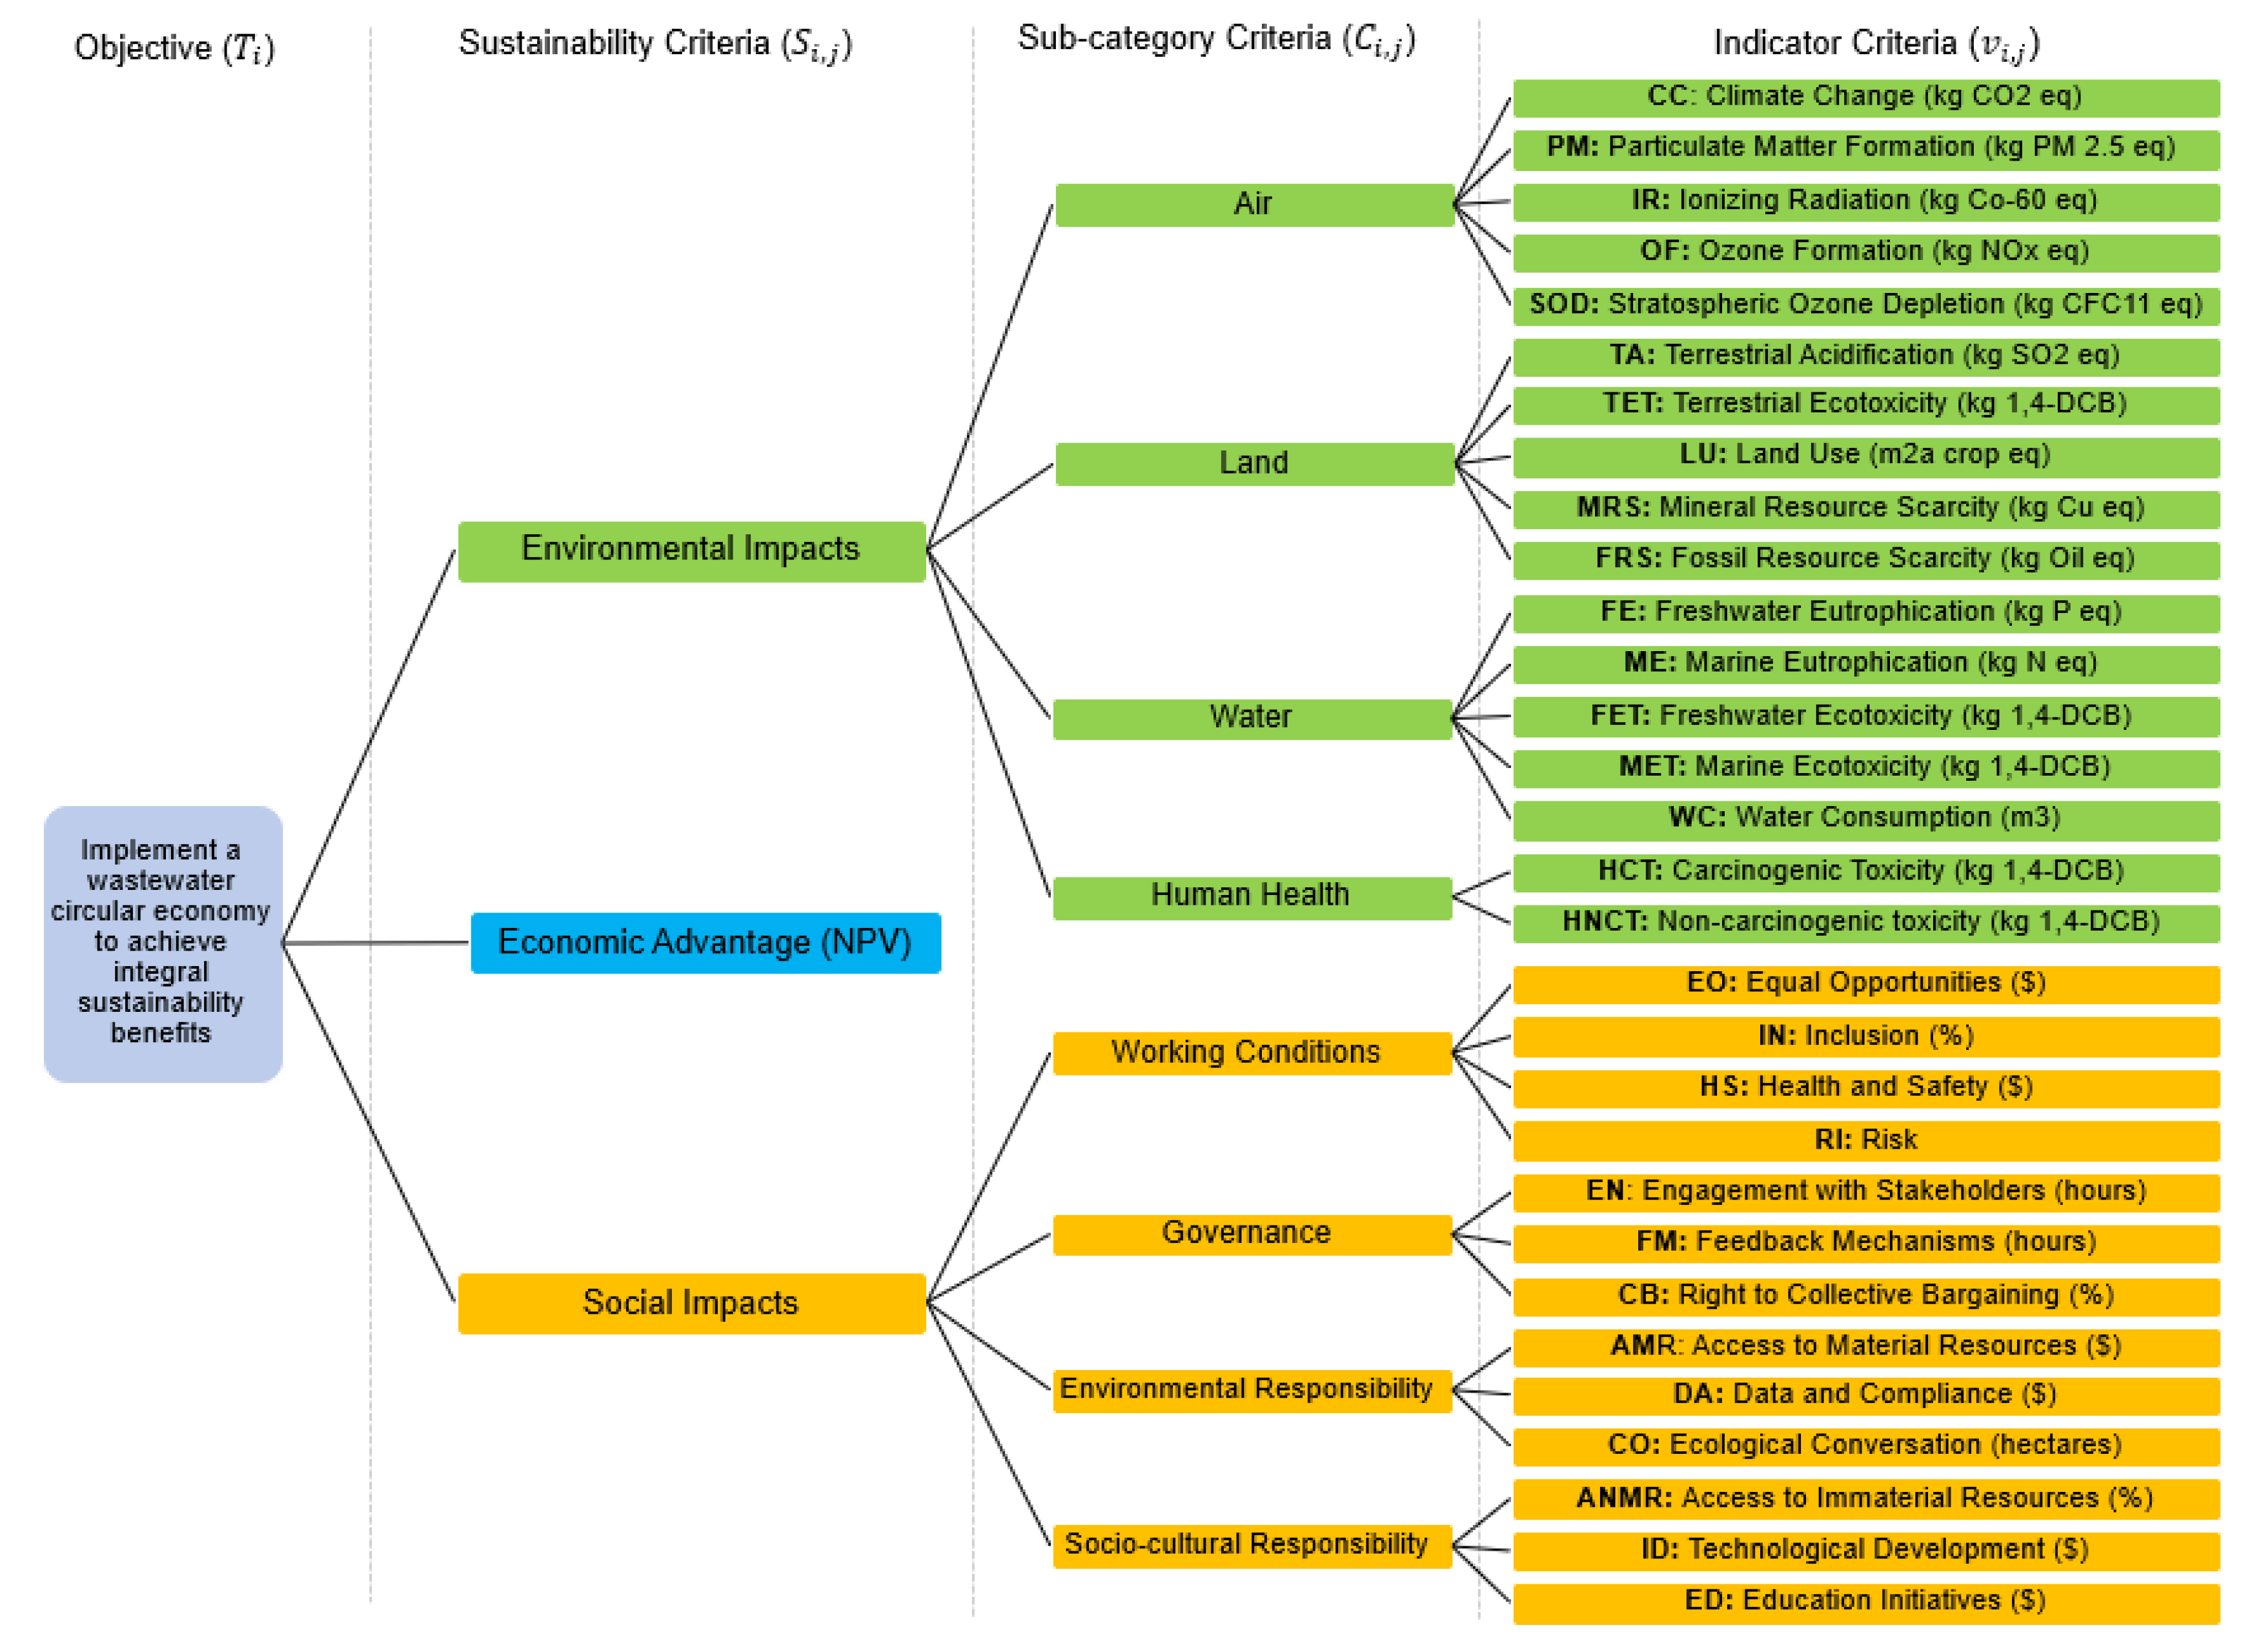
2.2.1. Overview of Decision Criteria
2.2.2. Criteria Weighting
2.2.3. Aggregated Sustainability Scores
3. Results
3.1. Environmental and Social Impact Indicators
3.1.1. Normalized LCA and SLCA Impact Indicators
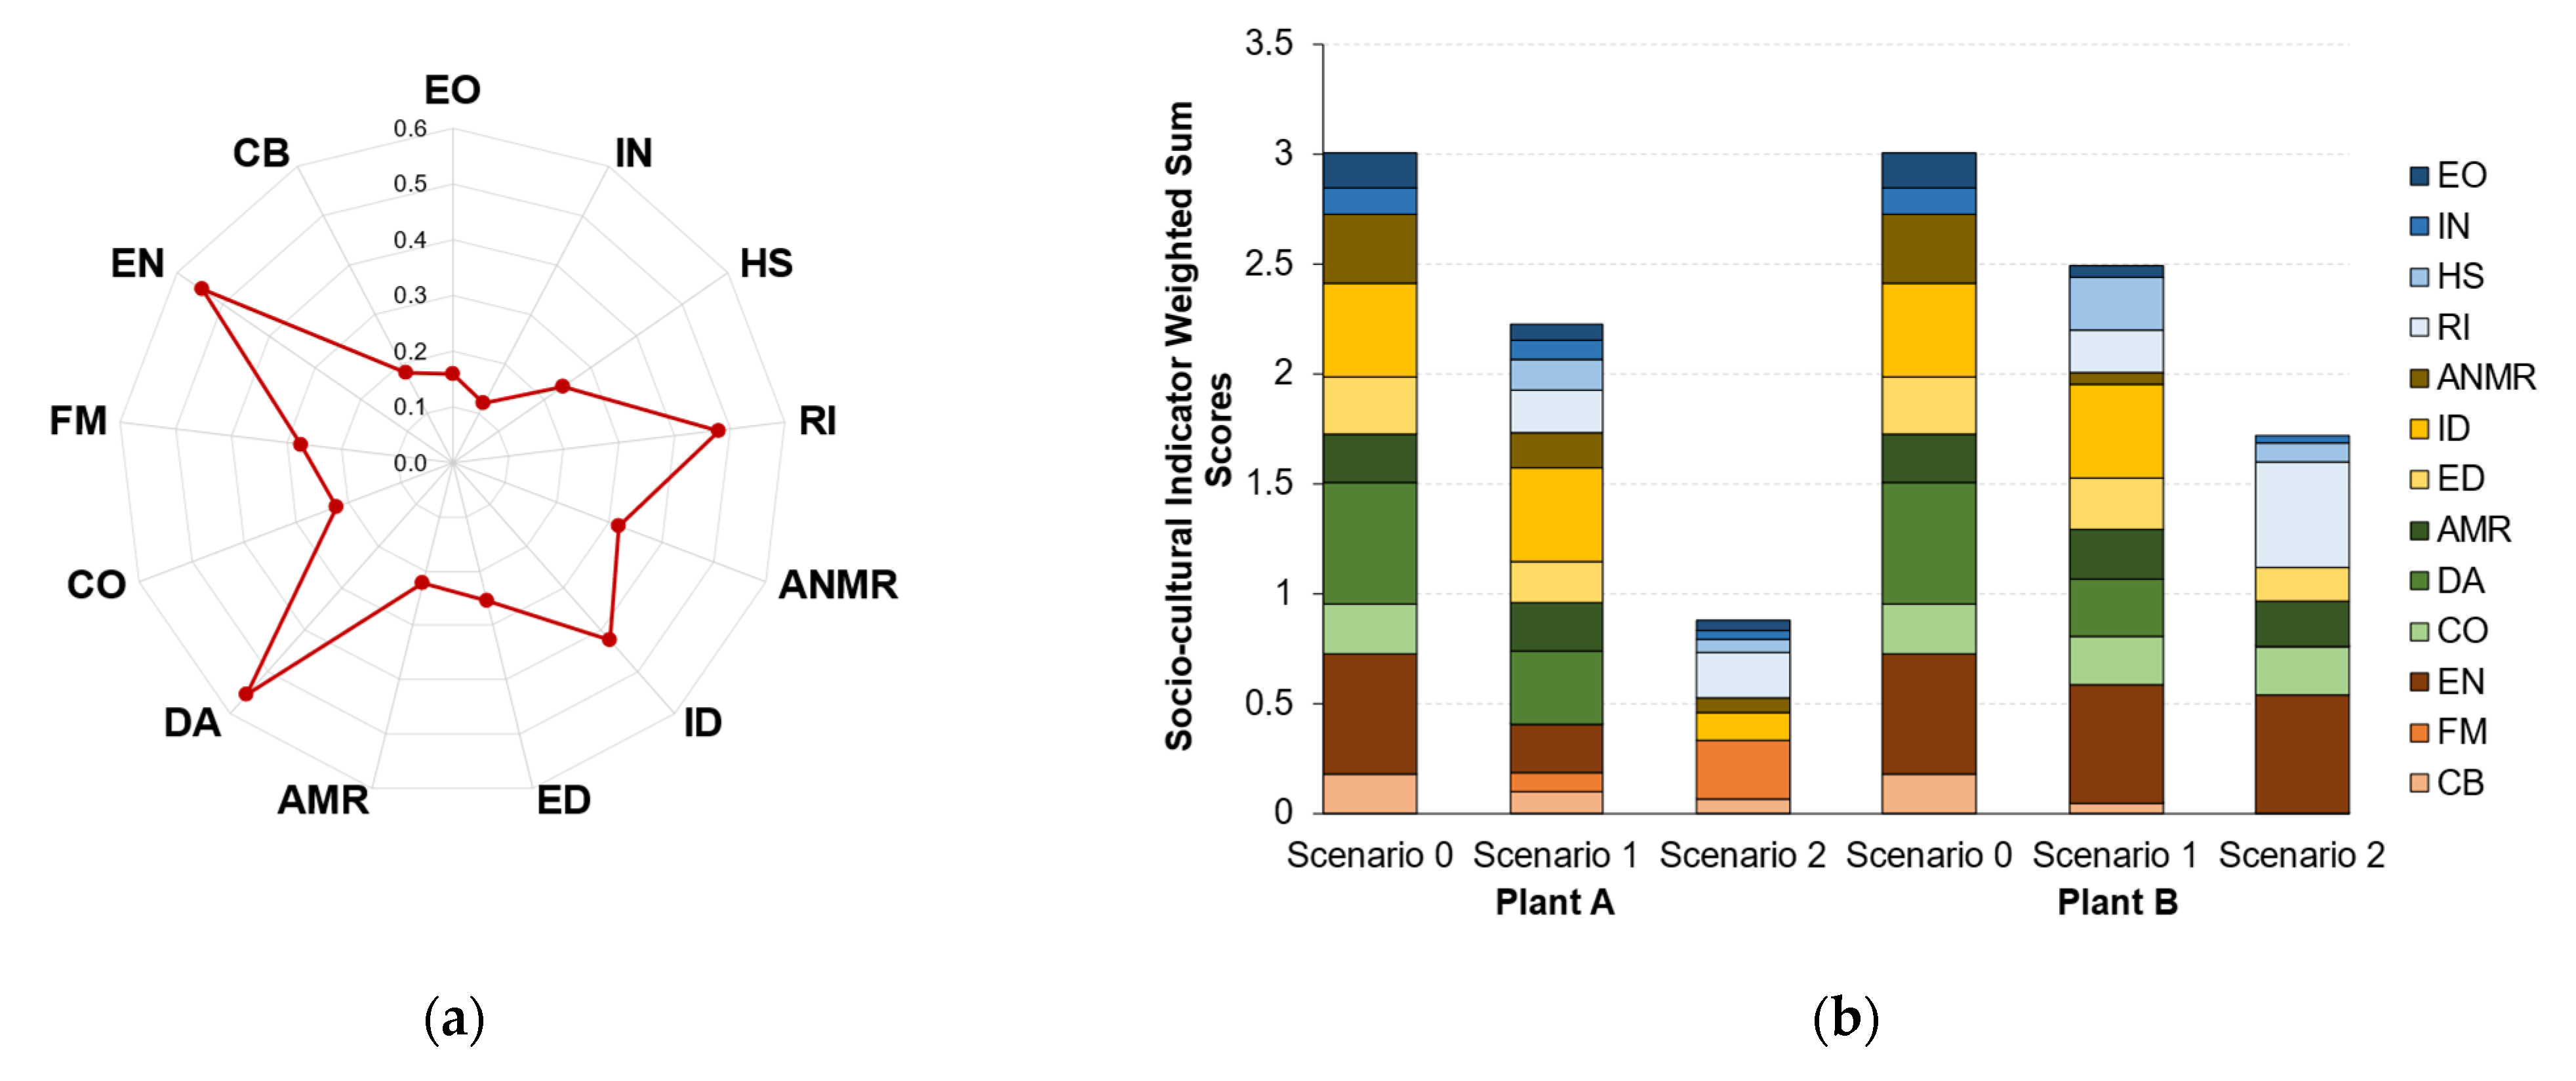
3.1.2. Indicator Criteria Weighted Sum Scores
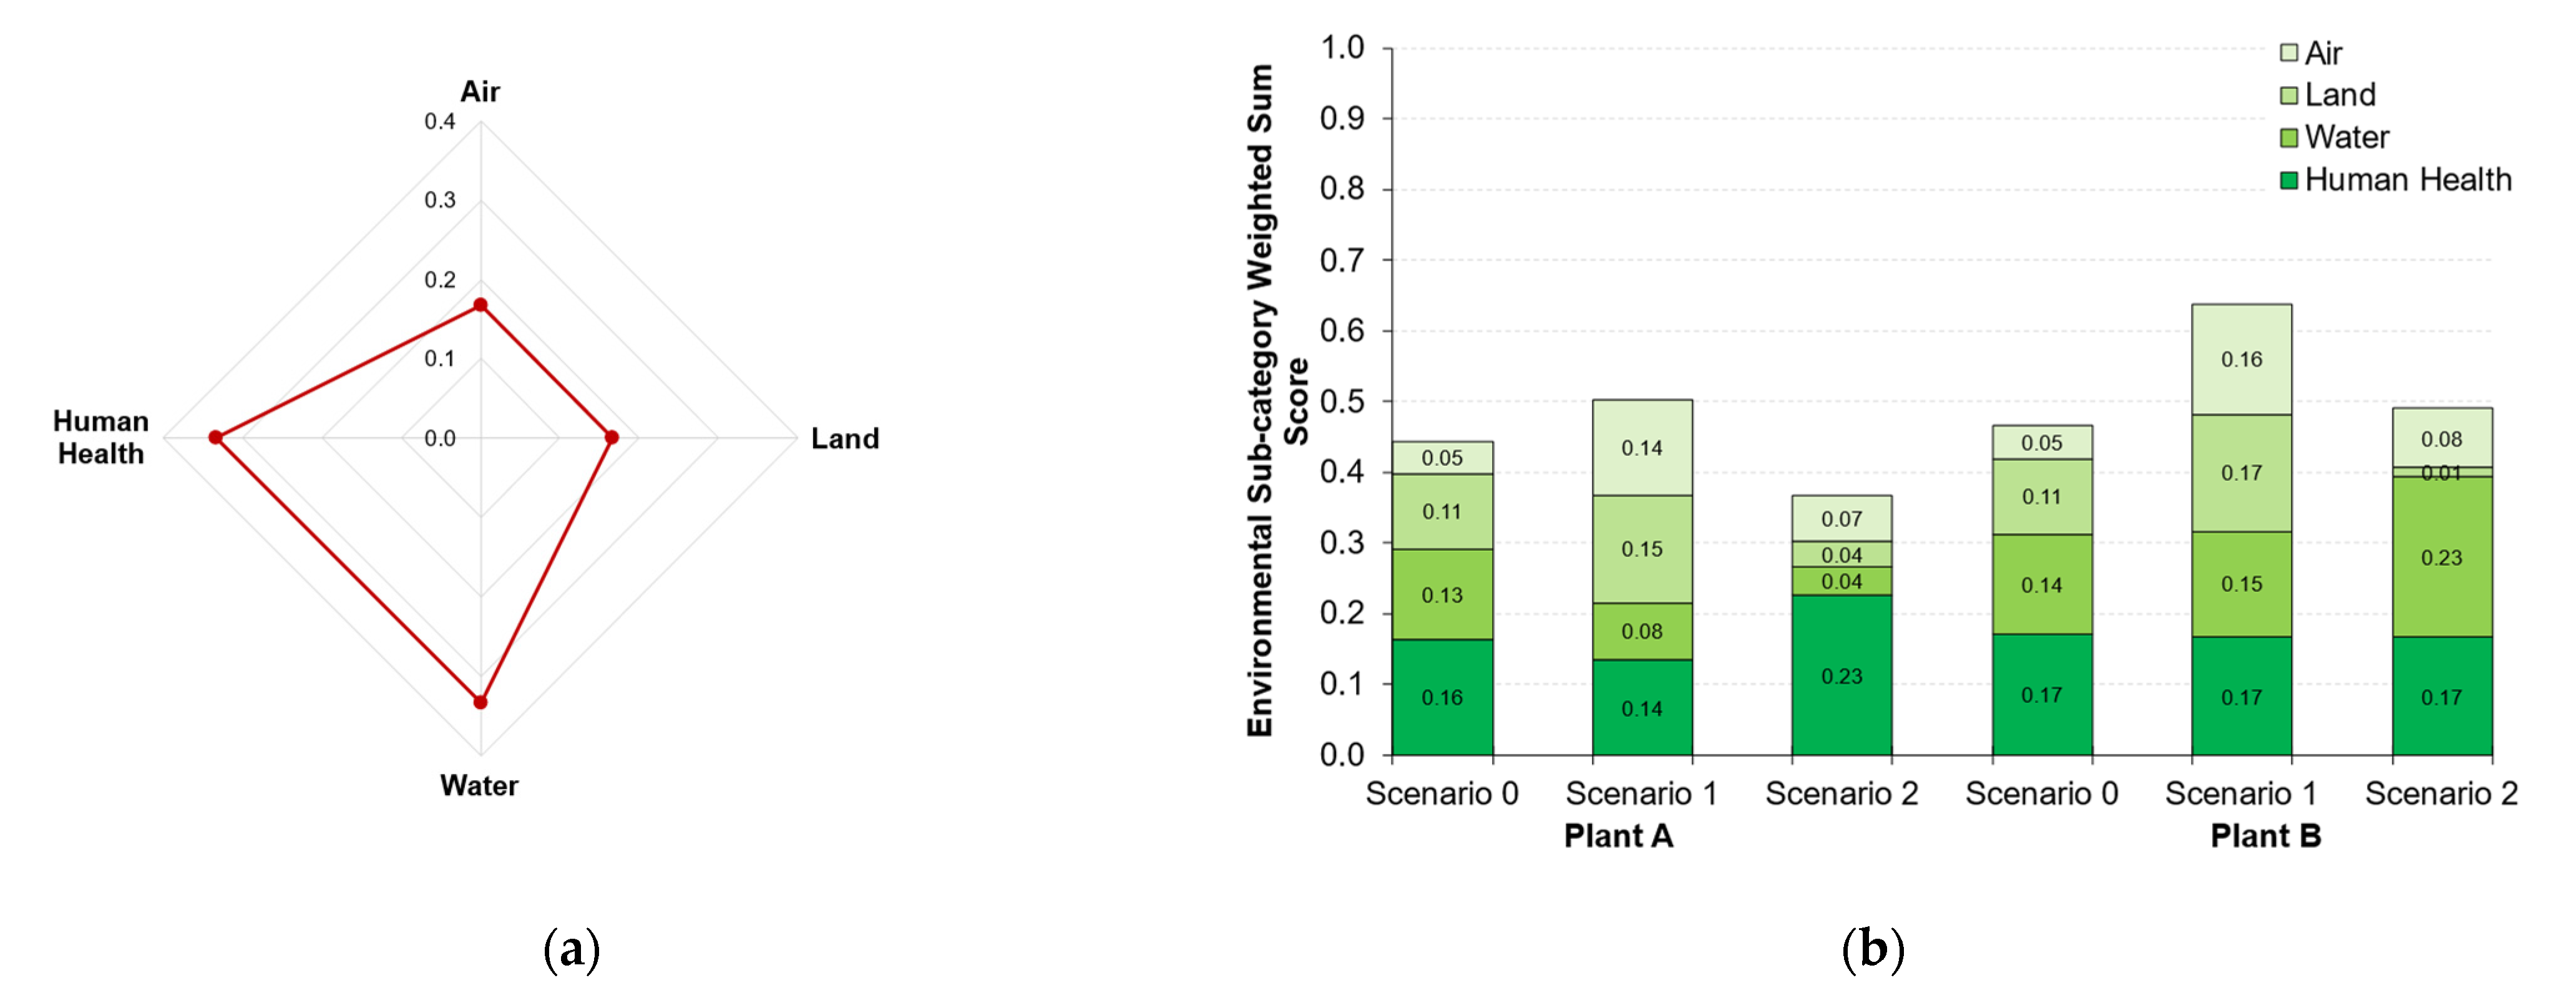
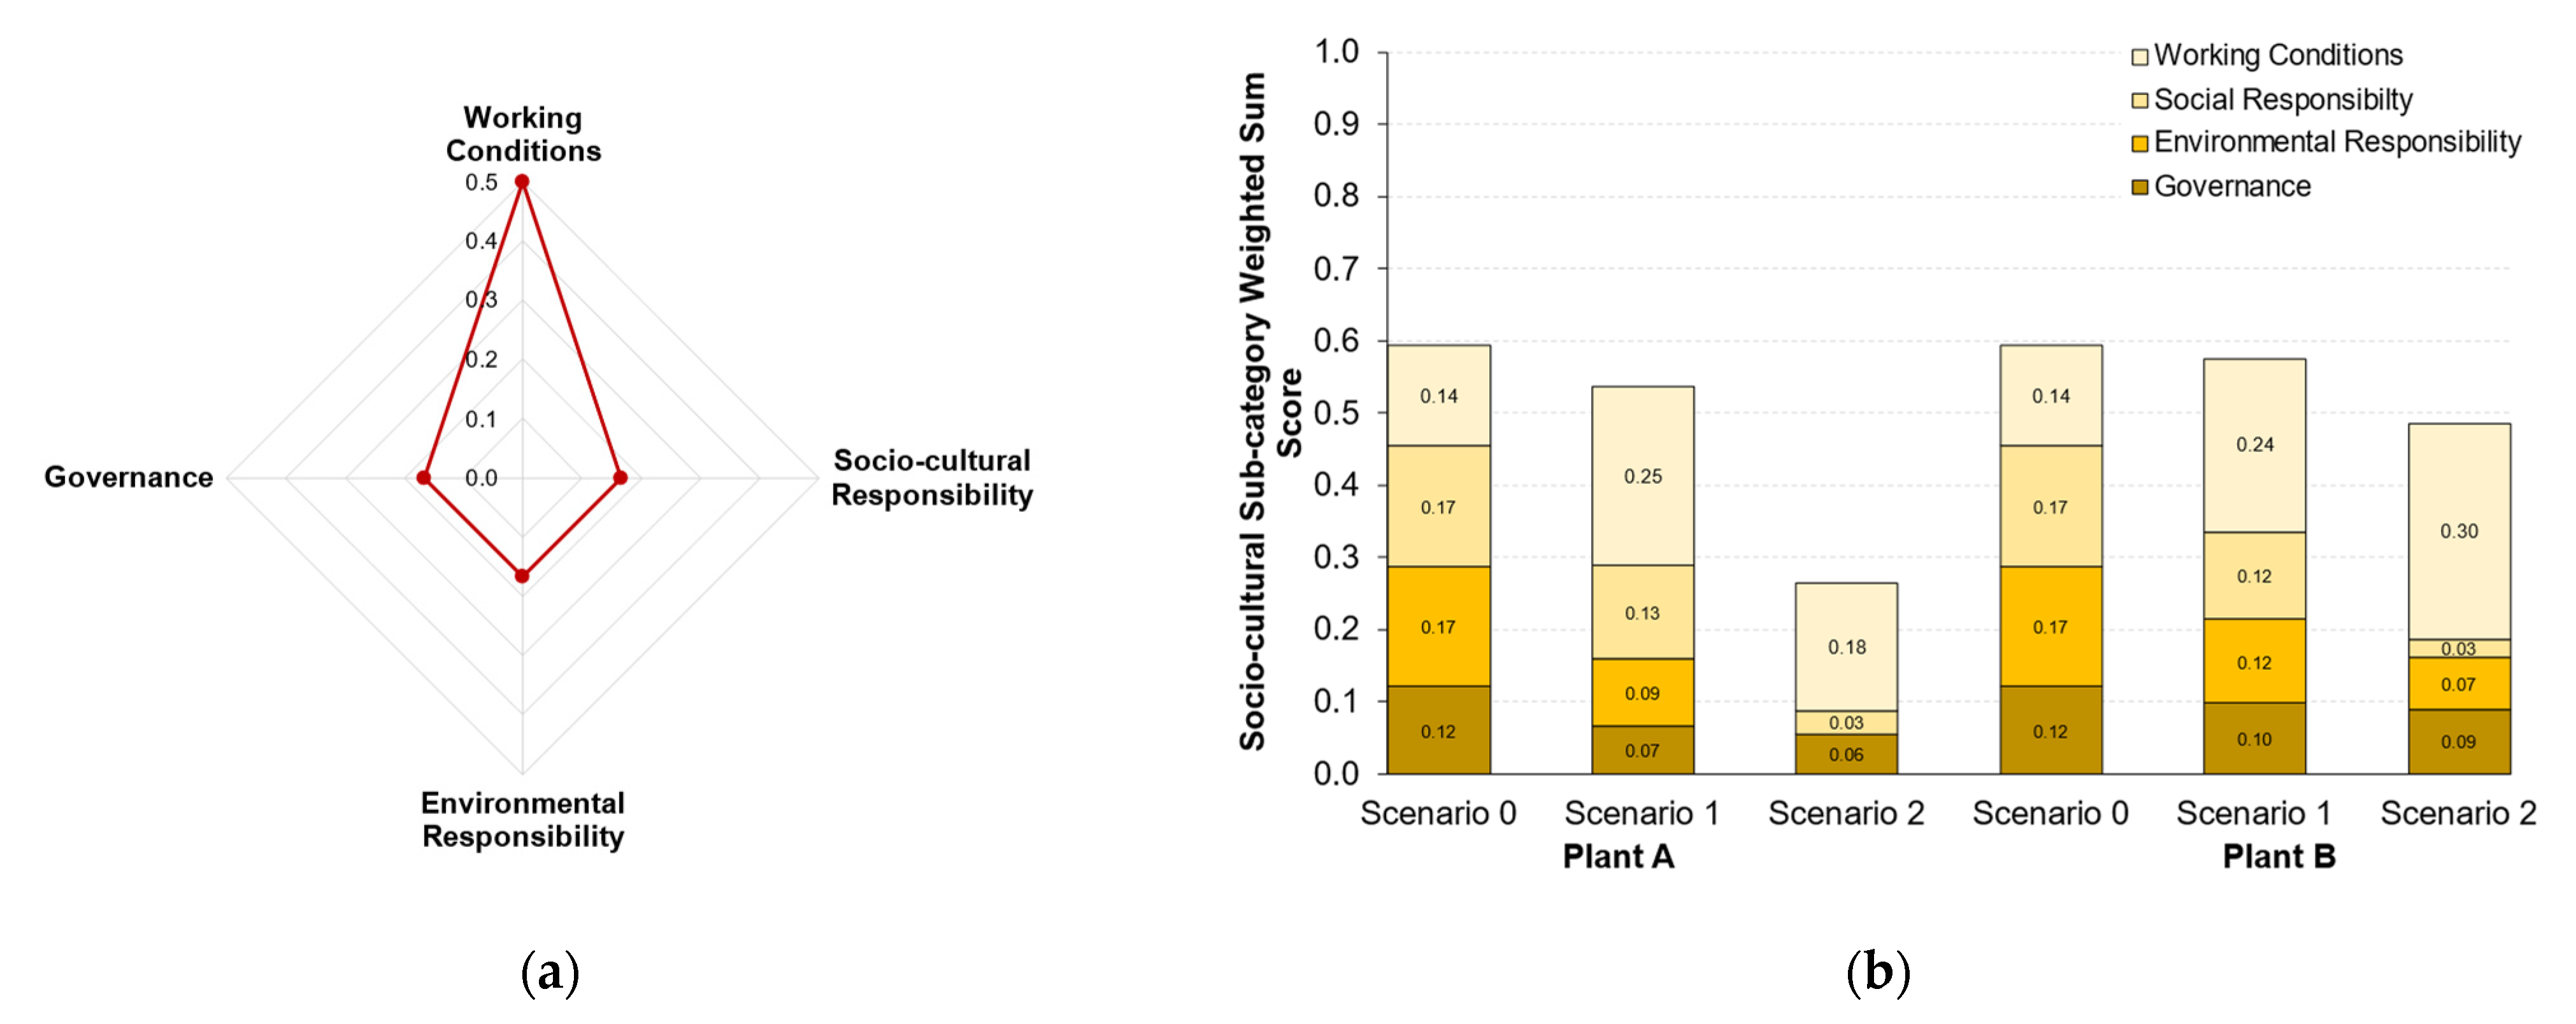
3.2. Environmental and Social Sub-Categories
3.2.1. Normalized LCA and SLCA Sub-Categories
3.2.2. Sub-Category Criteria Weighted Sum Scores
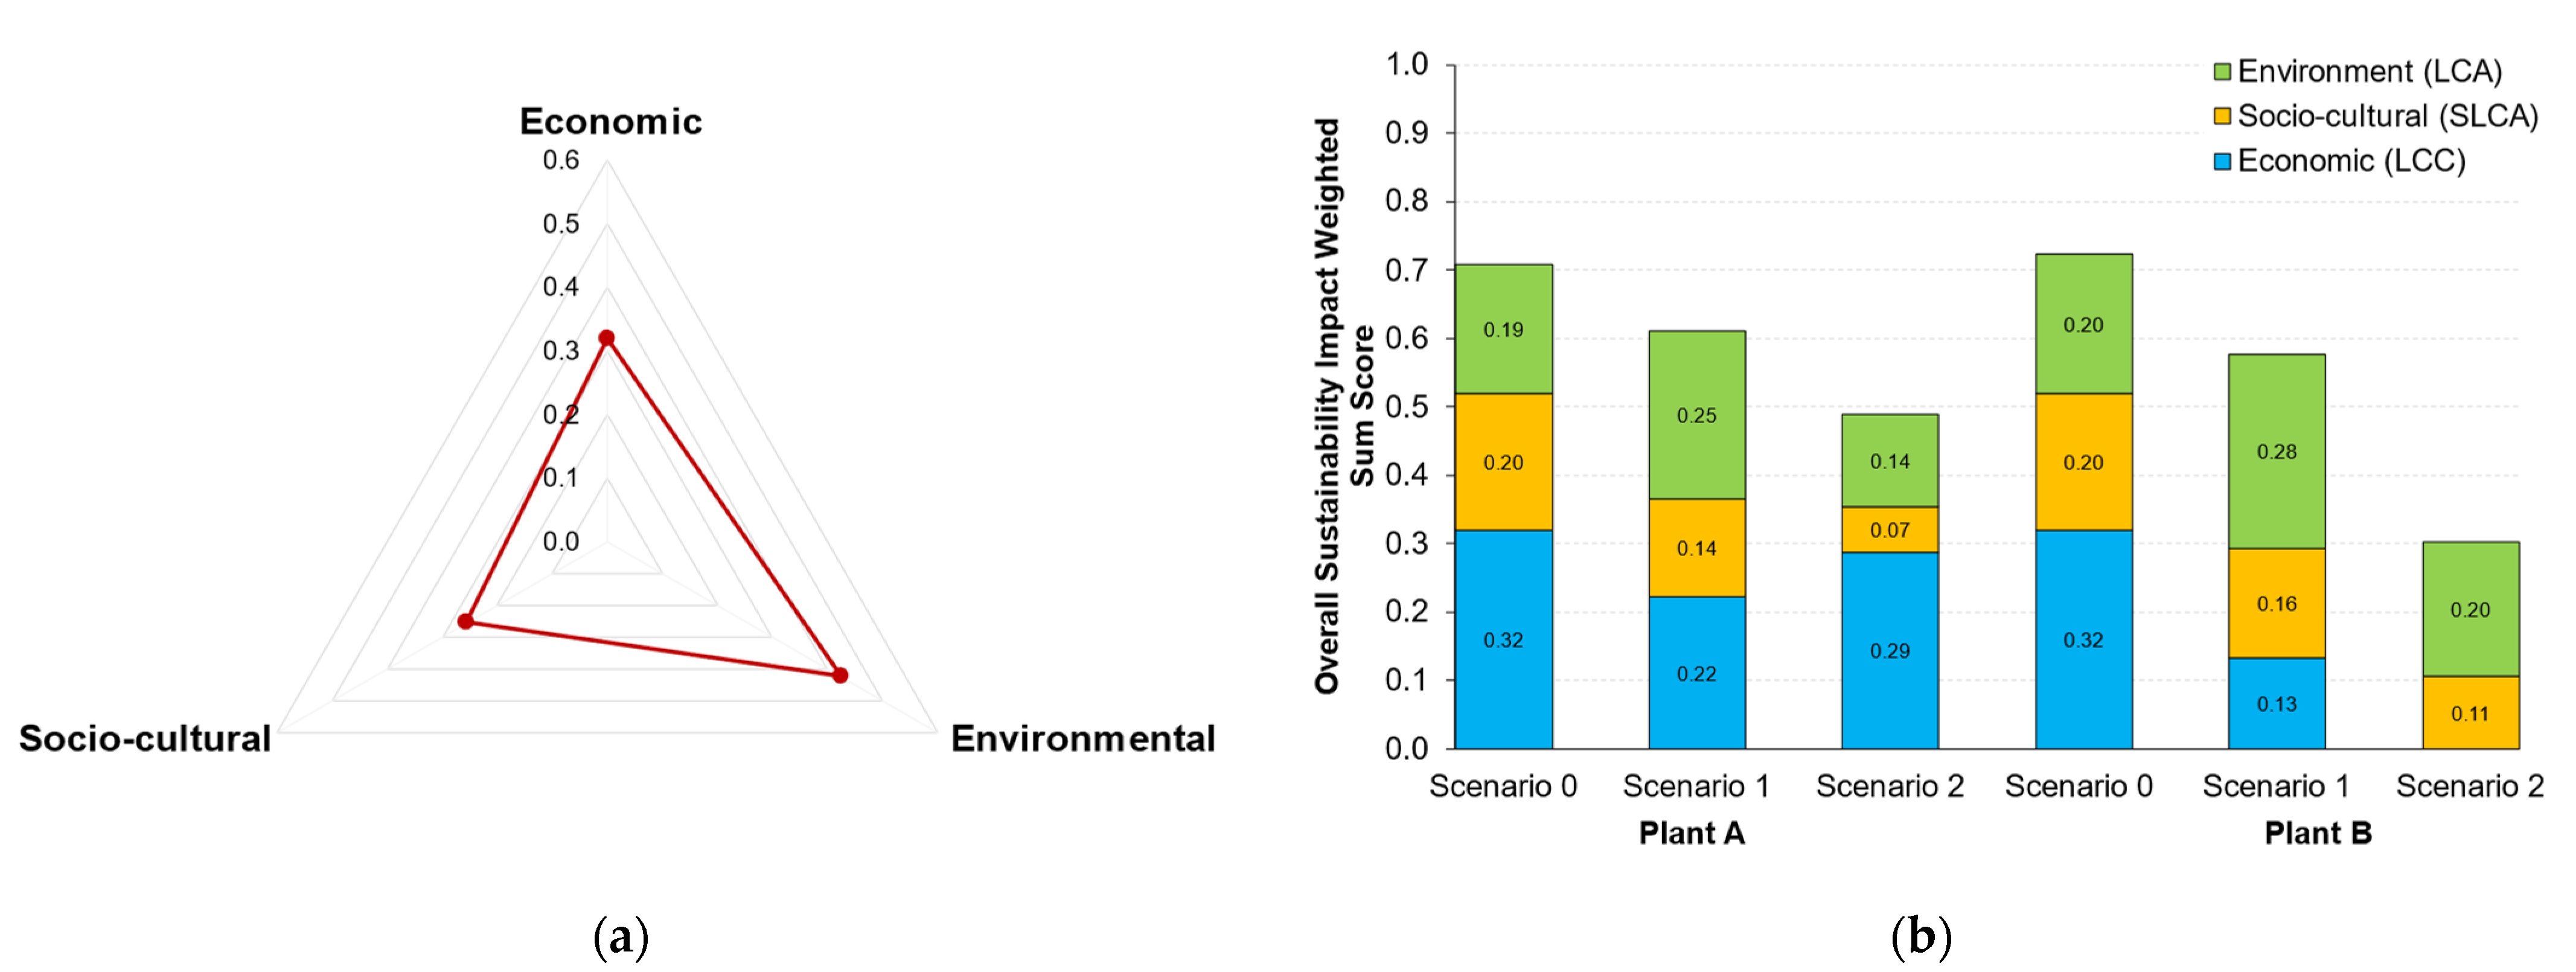
3.3. Overall Sustainability Impact
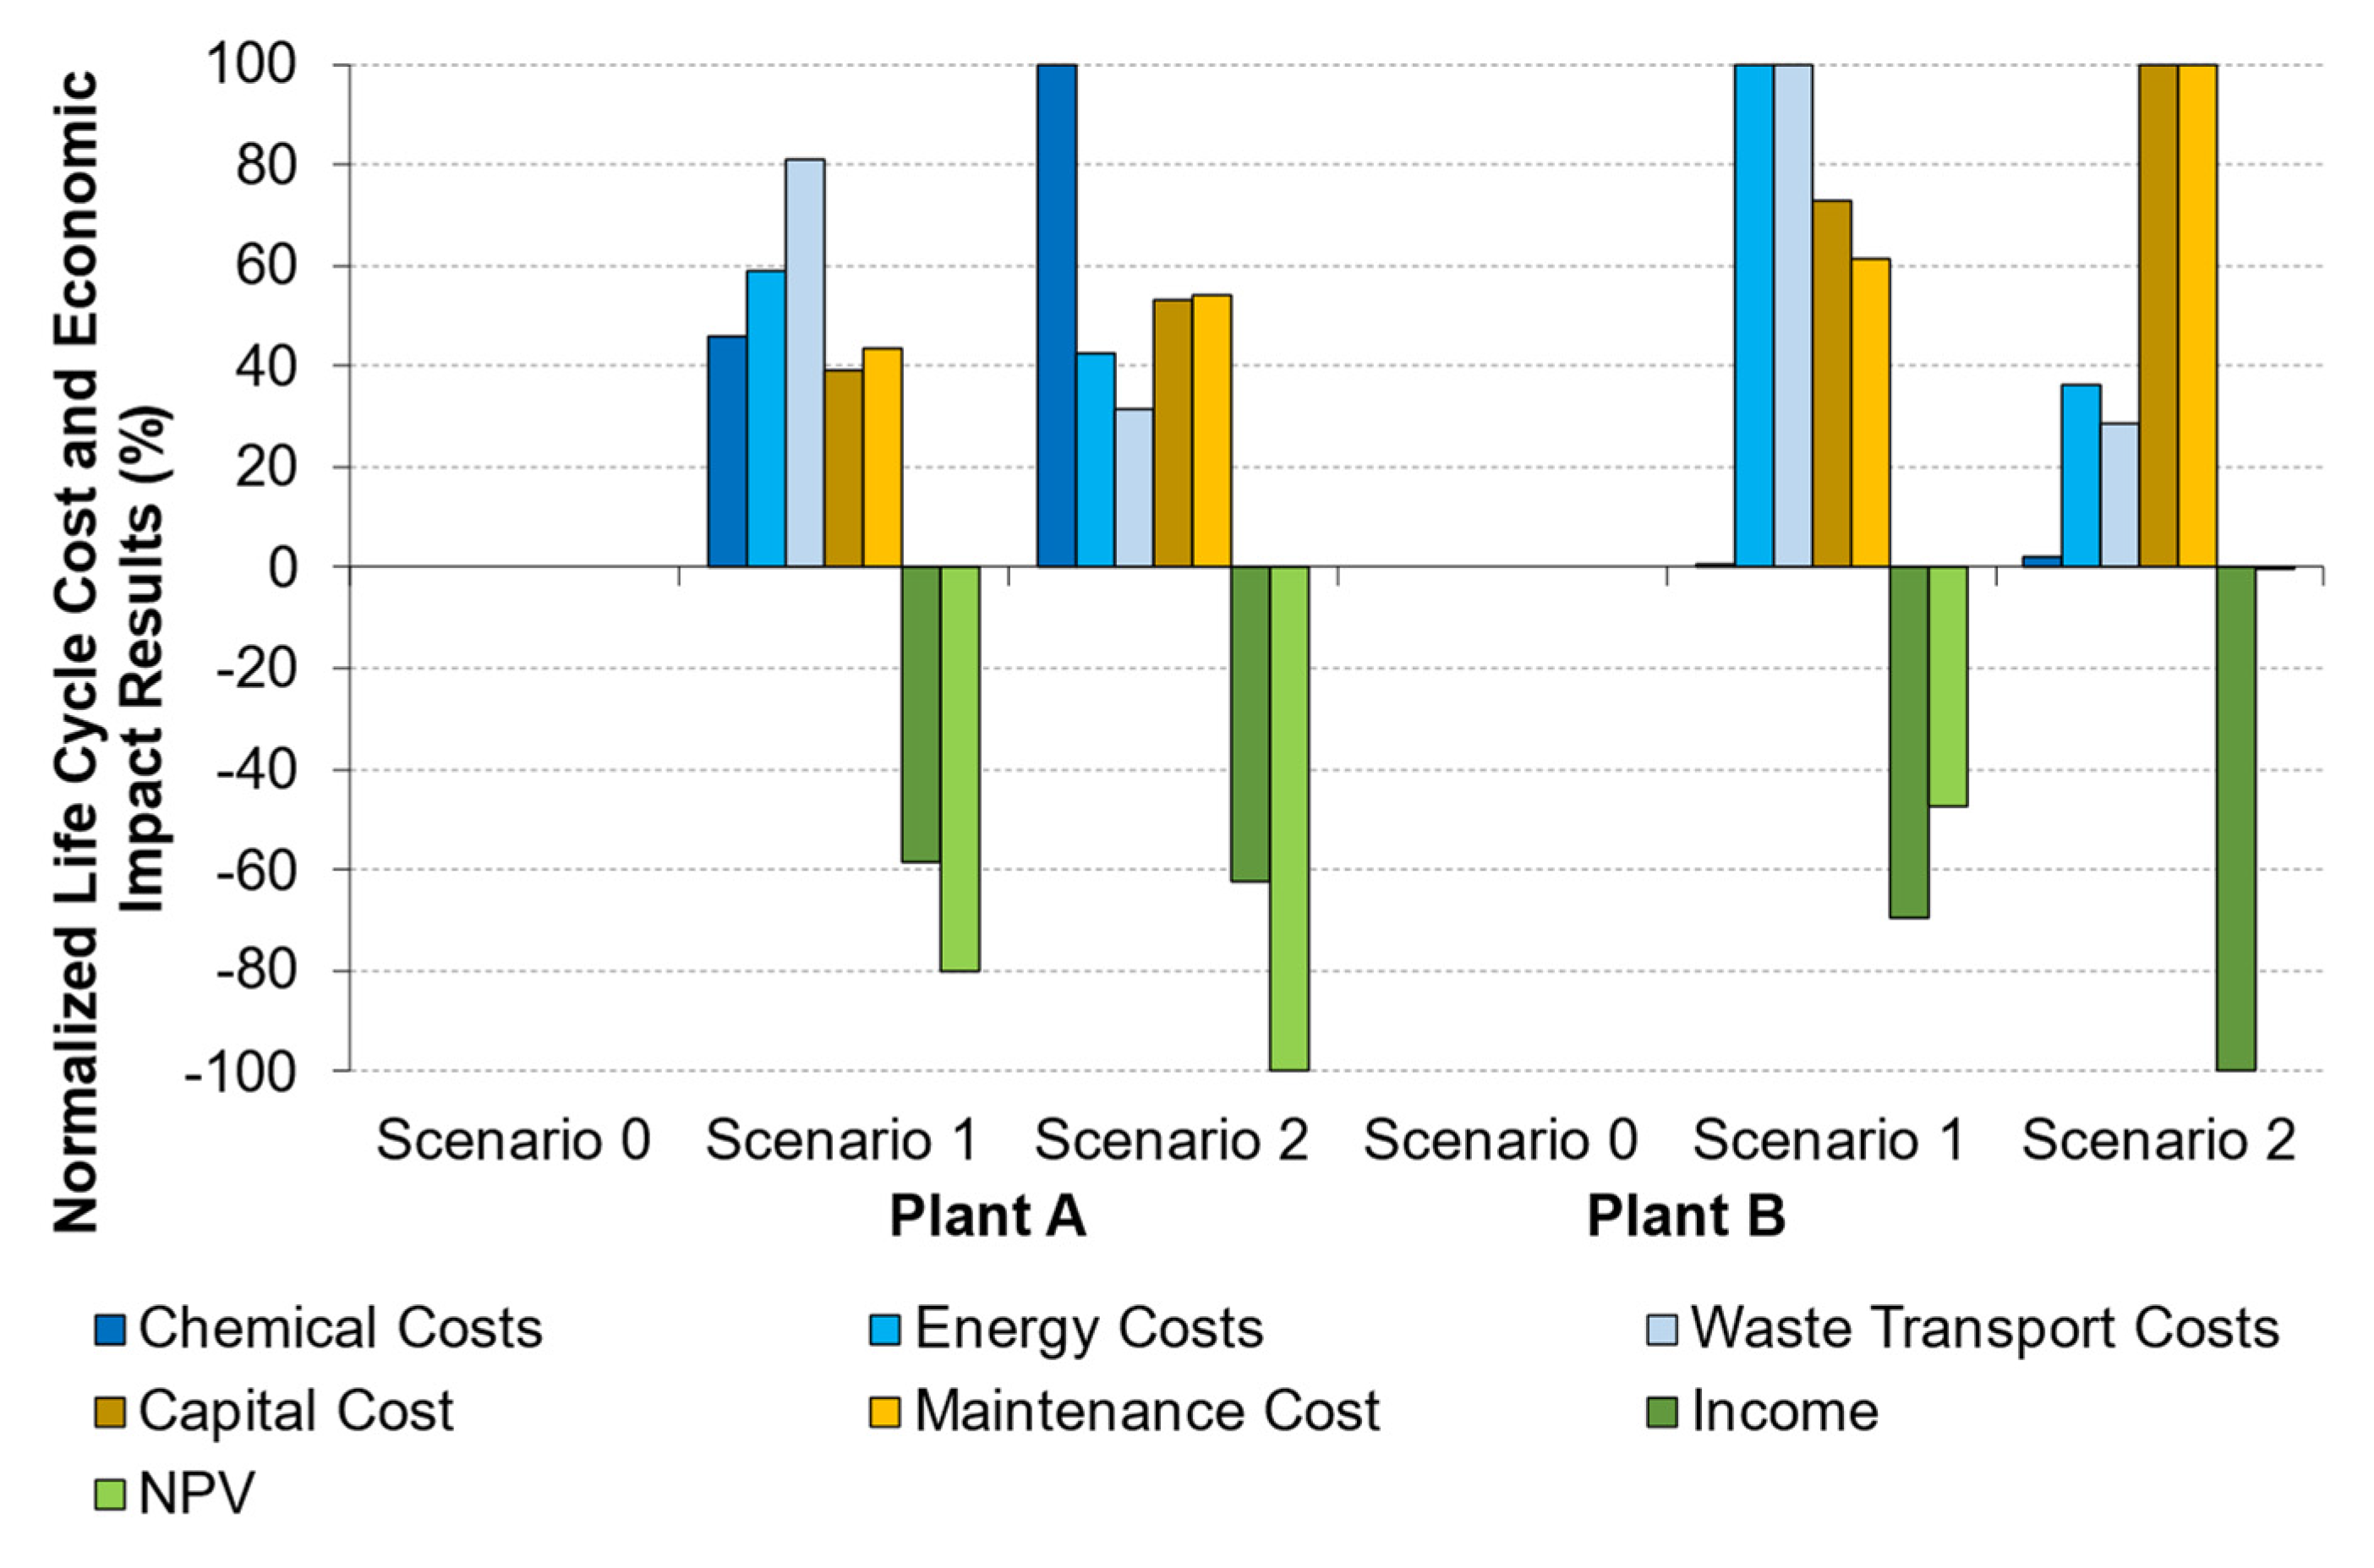
3.3.1. Normalized LCSA Performance Indicators
3.3.2. Overall Sustainability Impact Weighted Sum Scores
4. Discussion
4.1. Life Cycle Sustainability Assessment and Improving the Wastewater Circular Economy in Chile
4.2. Sensitivity and Uncertainty Assessment
4.3. Global Implications
5. Conclusions and Recommendations
Supplementary Materials
Author Contributions
Funding
Institutional Review Board Statement
Informed Consent Statement
Data Availability Statement
Acknowledgments
Conflicts of Interest
References
- UN-Water. Summary Progress Update 2021: SDG 6—Water and Sanitation for All; UN-Water’s Publications: Geneva, Switzerland, 2021; pp. 1–58. [Google Scholar]
- UN DESA. The Sustainable Development Goals Report 2022; UN DESA: New York, NY, USA, 2022. [Google Scholar]
- Ruggerio, C.A. Sustainability and sustainable development: A review of principles and definitions. Sci. Total Environ. 2021, 786, 147481. [Google Scholar] [CrossRef] [PubMed]
- Boretti, A.; Rosa, L. Reassessing the projections of the World Water Development Report. NPJ Clean Water 2019, 2, 15. [Google Scholar] [CrossRef]
- Rashid, S.S.; Harun, S.N.; Hanafiah, M.M.; Razman, K.K.; Liu, Y.-Q.; Tholibon, D.A. Life Cycle Assessment and Its Application in Wastewater Treatment: A Brief Overview. Processes 2023, 11, 208. [Google Scholar] [CrossRef]
- Andary, E.G.; Shdid, C.A.; Chowdhury, A.; Ahmad, I. Integrated project delivery implementation framework for water and wastewater treatment plant projects. Eng. Constr. Arch. Manag. 2019, 27, 609–633. [Google Scholar] [CrossRef]
- Tarpani, R.R.Z.; Azapagic, A. Life cycle costs of advanced treatment techniques for wastewater reuse and resource recovery from sewage sludge. J. Clean. Prod. 2018, 204, 832–847. [Google Scholar] [CrossRef]
- SuSanA. Contribution of Sustainable Sanitation to the Agenda 2030 for Sustainable Development. no. 1. 2017, pp. 1–4. Available online: https://www.susana.org/_resources/documents/default/3-2715-7-1542994110.pdf (accessed on 15 July 2023).
- Mannina, G.; Rebouças, T.F.; Cosenza, A.; Sànchez-Marrè, M.; Gibert, K. Decision support systems (DSS) for wastewater treatment plants—A review of the state of the art. Bioresour. Technol. 2019, 290, 121814. [Google Scholar] [CrossRef] [PubMed]
- Hosseinian-Far, A.; Ramachandran, M.; Sarwar, D. Strategic Engineering for Cloud Computing and Big Data Analytics; Springer: Berlin/Heidelberg, Germany, 2017. [Google Scholar]
- Brinsmead, T.S. Integrated Sustainability Assessment: Identifying Methodological Options Australian Energy View Project Safe Switching in Control View Project. no. May 2019. Available online: https://www.researchgate.net/publication/333413032_Integrated_Sustainability_Assessment_Identifying_Methodological_Options (accessed on 6 May 2023).
- Ghimire, U.; Sarpong, G.; Gude, V.G. Transitioning Wastewater Treatment Plants toward Circular Economy and Energy Sustainability. ACS Omega 2021, 6, 11794–11803. [Google Scholar] [CrossRef]
- Salgot, M.; Folch, M. Wastewater treatment and water reuse. Curr. Opin. Environ. Sci. Health 2018, 2, 64–74. [Google Scholar] [CrossRef]
- Collivignarelli, M.C.; Canato, M.; Abbà, A.; Miino, M.C. Biosolids: What are the different types of reuse? J. Clean. Prod. 2019, 238, 117844. [Google Scholar] [CrossRef]
- Ardolino, F.; Parrillo, F.; Arena, U. Biowaste-to-biomethane or biowaste-to-energy? An LCA study on anaerobic digestion of organic waste. J. Clean. Prod. 2018, 174, 462–476. [Google Scholar] [CrossRef]
- Kehrein, P.; Van Loosdrecht, M.; Osseweijer, P.; Garfí, M.; Dewulf, J.; Posada, J. A critical review of resource recovery from municipal wastewater treatment plants-market supply potentials, technologies and bottlenecks. Environ. Sci. Water Res. Technol. 2020, 6, 877–910. [Google Scholar] [CrossRef]
- Walling, E.; Vaneeckhaute, C. Developing successful environmental decision support systems: Challenges and best prac-tices. J. Environ. Manag. 2020, 264, 110513. [Google Scholar] [CrossRef]
- Taherdoost, H.; Madanchian, M. Multi-Criteria Decision Making (MCDM) Methods and Concepts. Encyclopedia 2023, 3, 77–87. [Google Scholar] [CrossRef]
- Rezaei, N.; Diaz-Elsayed, N.; Mohebbi, S.; Xie, X.; Zhang, Q. A multi-criteria sustainability assessment of water reuse ap-plications: A case study in Lakeland, Florida. Environ. Sci. Water Res. Technol. 2019, 5, 102–118. [Google Scholar] [CrossRef]
- Lohman, H.A.C.; Morgan, V.L.; Li, Y.; Zhang, X.; Rowles, L.S.; Cook, S.M.; Guest, J.S. DMsan: A Multi-Criteria Decision Analysis Framework and Package to Characterize Contextualized Sustainability of Sanitation and Resource Recovery Technologies. ACS Environ. Au 2023, 3, 179–192. [Google Scholar] [CrossRef] [PubMed]
- Ddiba, D.; Andersson, K.; Dickin, S.; Ekener, E.; Finnveden, G. A review of how decision support tools address resource recovery in sanitation systems. J. Environ. Manag. 2023, 342, 118365. [Google Scholar] [CrossRef]
- Valdivia, S.; Gerta, J.; Marzia, B.; Guido, T.; Stefano, S. Principles for the application of life cycle sustainability assessment. Int. J. Life Cycle Assess. 2021, 26, 1900–1905. [Google Scholar] [CrossRef]
- ISO 14040; Environmental Management—Life Cycle Assessment—Principles and Framework. ISO: Geneva, Switzerland, 2006.
- UNEP. Guidelines for Social Life Cycle Assessment of Products. 2020. Available online: https://www.lifecycleinitiative.org/wp-content/uploads/2021/01/Guidelines-for-Social-Life-Cycle-Assessment-of-Products-and-Organizations-2020-22.1.21sml.pdf (accessed on 1 January 2020).
- Rebitze, G.; Hunkeler, D.; Jollie, O. LCC-The Economic Pillar of Sustainability: Methodology and Application to Watewater Treatment. Environ. Prog. 2003, 22, 241–249. [Google Scholar] [CrossRef]
- Opher, T.; Friedler, E.; Shapira, A. Comparative life cycle sustainability assessment of urban water reuse at various centralization scales. Int. J. Life Cycle Assess. 2018, 24, 1319–1332. [Google Scholar] [CrossRef]
- Safarpour, H.; Tabesh, M.; Shahangian, S.A.; Hajibabaei, M.; Sitzenfrei, R. Life Cycle Sustainability Assessment of Wastewater Systems under Applying Water Demand Management Policies. Sustainability 2022, 14, 7736. [Google Scholar] [CrossRef]
- Liu, Y.; Ren, J. Developing a sustainability-oriented multi-criteria game theoretical decision analysis framework: A case study of sludge management. J. Clean. Prod. 2022, 354, 131807. [Google Scholar] [CrossRef]
- Tarpani, R.R.Z.; Azapagic, A. Life cycle sustainability assessment of advanced treatment techniques for urban wastewater reuse and sewage sludge resource recovery. Sci. Total. Environ. 2023, 869, 161771. [Google Scholar] [CrossRef] [PubMed]
- SETAC. Guidelines for Social Life Cycle Assessment of Products. 2009. Available online: https://www.lifecycleinitiative.org/wp-content/uploads/2012/12/2009%20-%20Guidelines%20for%20sLCA%20-%20EN.pdf (accessed on 4 March 2019).
- Padilla-Rivera, A.; Güereca, L.P. A proposal metric for sustainability evaluations of wastewater treatment systems (SEWATS). Ecol. Indic. 2019, 103, 22–33. [Google Scholar] [CrossRef]
- BCN. Decreto 4. 2009, pp. 1–15. Available online: https://www.bcn.cl/leychile/navegar?idNorma=1007456 (accessed on 29 August 2023).
- Devos, P.; Haddad, M.; Carrère, H. Thermal Hydrolysis of Municipal sludge: Finding the Temperature Sweet Spot: A Review. Waste Biomass Valorization 2020, 12, 2187–2205. [Google Scholar] [CrossRef]
- Rathore, P.; Killedar, D.J.; Parde, D.; Sahare, A. Life cycle cost analysis of wastewater treatment technologies. IOP Conf. Series: Earth Environ. Sci. 2022, 1032. [Google Scholar] [CrossRef]
- Traverso, M.; Valdivia, S.; Luthin, A.; Roche, L.; Arcese, G.; Neugebauer, S.; Petti, L.; D’Eusanio, M.; Tragnoone, B.M.; Mankaa, R.; et al. Methodological Sheets for Subcategories in Social Life Cycle Assessment (S-LCA). 2021, p. 150. Available online: https://www.lifecycleinitiative.org/library/methodological-sheets-for-subcategories-in-social-life-cycle-assessment-s-lca-2021/ (accessed on 1 January 2020).
- LWC. Intregrated Report 2022; LWC: Santiago, Chile, 2022. [Google Scholar]
- Andersson, E.R. Economic evaluation of ergonomic solutions: Part I—Guidelines for the practitioner. Int. J. Ind. Ergon. 1992, 10, 161–171. [Google Scholar] [CrossRef]
- Lauer, R. Is Social Ontology Prior to Social Scientific Methodology? Philos. Soc. Sci. 2019, 49, 171–189. [Google Scholar] [CrossRef]
- Wen, J.; Yan, Q.; Qu, J.; Liu, Y. Fuzzy Ensemble Ideal Solution Based Multi-Criteria Decision-Making Support Fuzzy Ensemble Ideal Solution Based Multi-Criteria Decision- Making Support for Heat Energy Transition in Danish House- holds. no. September, 2021. Mathematics 2021, 9, 2420. [Google Scholar] [CrossRef]
- Roszkowska, E. Rank Ordering Criteria Weighting Methods—A Comparative Overview. Optimum. Stud. Ekon. 2013, 5, 14–33. [Google Scholar] [CrossRef]
- Gherghel, A.; Teodosiu, C.; Notarnicola, M.; De Gisi, S. Sustainable design of large wastewater treatment plants considering multi-criteria decision analysis and stakeholders’ involvement. J. Environ. Manag. 2020, 261, 110158. [Google Scholar] [CrossRef]
- De Feo, G.; Ferrara, C. Investigation of the environmental impacts of municipal wastewater treatment plants through a Life Cycle Assessment software tool. Environ. Technol. 2016, 38, 1943–1948. [Google Scholar] [CrossRef] [PubMed]
- Al-Gheethi, A.A.; Efaq, A.N.; Bala, J.D.; Norli, I.; Abdel-Monem, M.O.; Kadir, M.O.A. Removal of pathogenic bacteria from sewage-treated effluent and biosolids for agricultural purposes. Appl. Water Sci. 2018, 8, 74. [Google Scholar] [CrossRef]
- Zhang, H. Using Biosolids as a Plant Nutrient Source. Oklahoma. 2017. Available online: https://extension.okstate.edu/fact-sheets/using-biosolids-as-a-plant-nutrient-source.html (accessed on 1 January 2020).
- Orner, K.D.; Smith, S.; Nordahl, S.; Chakrabarti, A.; Breunig, H.; Scown, C.D.; Leverenz, H.; Nelson, K.L.; Horvath, A. Environmental and Economic Impacts of Managing Nutrients in Digestate Derived from Sewage Sludge and High-Strength Organic Waste. Environ. Sci. Technol. 2022, 56, 17256–17265. [Google Scholar] [CrossRef] [PubMed]
- Gonçalves, B.d.S.M.; de Carvalho, F.L.; Fiorini, P.d.C. Circular Economy and Financial Aspects: A Systematic Review of the Literature. Sustainability 2022, 14, 3023. [Google Scholar] [CrossRef]
- Mayor, Á.; Vinardell, S.; Ganesan, K.; Bacardí, C.; Cortina, J.L.; Valderrama, C. Life-cycle assessment and techno-economic evaluation of the value chain in nutrient recovery from wastewater treatment plants for agricultural application. Sci. Total. Environ. 2023, 892, 164452. [Google Scholar] [CrossRef]
- Beltran, A.M.; Prado, V.; Vivanco, D.F.; Henriksson, P.J.G.; Guinée, J.B.; Heijungs, R. Quantified Uncertainties in Comparative Life Cycle Assessment: What Can Be Concluded? Environ. Sci. Technol. 2018, 52, 2152–2161. [Google Scholar] [CrossRef] [PubMed]
- Furness, M.F. The Biofactory: Implementing a Life Cycle Sustainability Assessment Decision Making Tool for Qunatifying Integral Sustainability Benefits of the Wastewater Circular Economy in Chile. Ph.D. Thesis, Pontificia Universidad Catolica de Valparaiso, Valparaíso, Chile, 2023. [Google Scholar]
- Onat, N.C.; Kucukvar, M.; Tatari, O. Uncertainty-embedded dynamic life cycle sustainability assessment framework: An ex-ante perspective on the impacts of alternative vehicle options. Energy 2016, 112, 715–728. [Google Scholar] [CrossRef]
- Andreas, R.; Serenella, S.; Jungbluth, N. Normalization and weighting: The open challenge in LCA. Int. J. Life Cycle Assess. 2020, 25, 1859–1865. [Google Scholar]
- OECD. Implementing the OECD Principles on Water Governance Indicator Framework and Evolving Practices: Indicator Framework and Evolving Practices; OECD Publishing: Paris, France, 2018. [Google Scholar]
- Sjöstrand, K.; Lindhe, A.; Söderqvist, T.; Rosén, L. Sustainability assessments of regional water supply interventions—Combining cost-benefit and multi-criteria decision analyses. J. Environ. Manag. 2018, 225, 313–324. [Google Scholar] [CrossRef]
- Cordella, M.; Horn, R.; Hong, S.H.; Bianchi, M.; Isasa, M.; Harmens, R.; Sonderegger, T.; Pihkola, H. Addressing sustainable development goals in life cycle sustainable assessment: Synergies, challenges and needs. J. Clean. Prod. 2023, 415, 137719. [Google Scholar] [CrossRef]
- LWC. Operational Data; LWC: Santiago, Chile, 2019. [Google Scholar]
- Vineyard, D.; Hicks, A.; Karthikeyan, K.; Barak, P. Economic analysis of electrodialysis, denitrification, and anammox for nitrogen removal in municipal wastewater treatment. J. Clean. Prod. 2020, 262, 121145. [Google Scholar] [CrossRef]
- Mills, N.; Panter, K.; Fountain, P.; Shana, A.; Martinicca, H.; Nilsen, P.J.; Ouki, S.; Thorpe, R. Second Generation Thermal Hydrolysis Processes. In Proceedings of the Residuals and Biosolids Conference 2014, Austin, TX, USA, 19–20 May 2014. [Google Scholar] [CrossRef]
- Maggi, R.C. Implementacion de Tecnologias Anammox en Biofactorias. Valparaiso. 2017. [Google Scholar]
- Ardolino, F.; Cardamone, G.F.; Parrillo, F.; Arena, U. Biogas-to-biomethane upgrading: A comparative review and as-sessment in a life cycle perspective. Renew. Sustain. Energy Rev. 2021, 139, 110588. [Google Scholar] [CrossRef]
- ODEPA. Evolucion de precios de fertilizantes internacional, importacion y nacional al mes de junio 2023. Reporte Interactivo de Precios de Fertilizantes. 2023. Available online: https://apps.odepa.gob.cl/powerBI/reporte_fertilizantes.html (accessed on 11 August 2023).
 ); sludge treatment and biosolids disposal to landfill (
 ); biogas flare (
 ); partial water recovery (
 ); biosolids recovery to agriculture (
 ); biogas energy recovery (
 ); advanced nitrogen removal (
 ); chemical transport (
 ); biosolids transport (
 ); local network energy input (
 ); atmospheric emissions (
 ); reference flow; mass of total solids produced by the water line and treated by the sludge line; mass of raw biogas; mass of upgraded biogas.
); sludge treatment and biosolids disposal to landfill (); biogas flare (); partial water recovery (); biosolids recovery to agriculture (); biogas energy recovery (); advanced nitrogen removal (); chemical transport (); biosolids transport (); local network energy input (); atmospheric emissions (); reference flow; mass of total solids produced by the water line and treated by the sludge line; mass of raw biogas; mass of upgraded biogas.
); reference flow; mass of total solids produced by the water line and treated by the sludge line; mass of raw biogas; mass of upgraded biogas.
); sludge treatment and biosolids disposal to landfill (); biogas flare (); partial water recovery (); biosolids recovery to agriculture (); biogas energy recovery (); advanced nitrogen removal (); chemical transport (); biosolids transport (); local network energy input (); atmospheric emissions (); reference flow; mass of total solids produced by the water line and treated by the sludge line; mass of raw biogas; mass of upgraded biogas.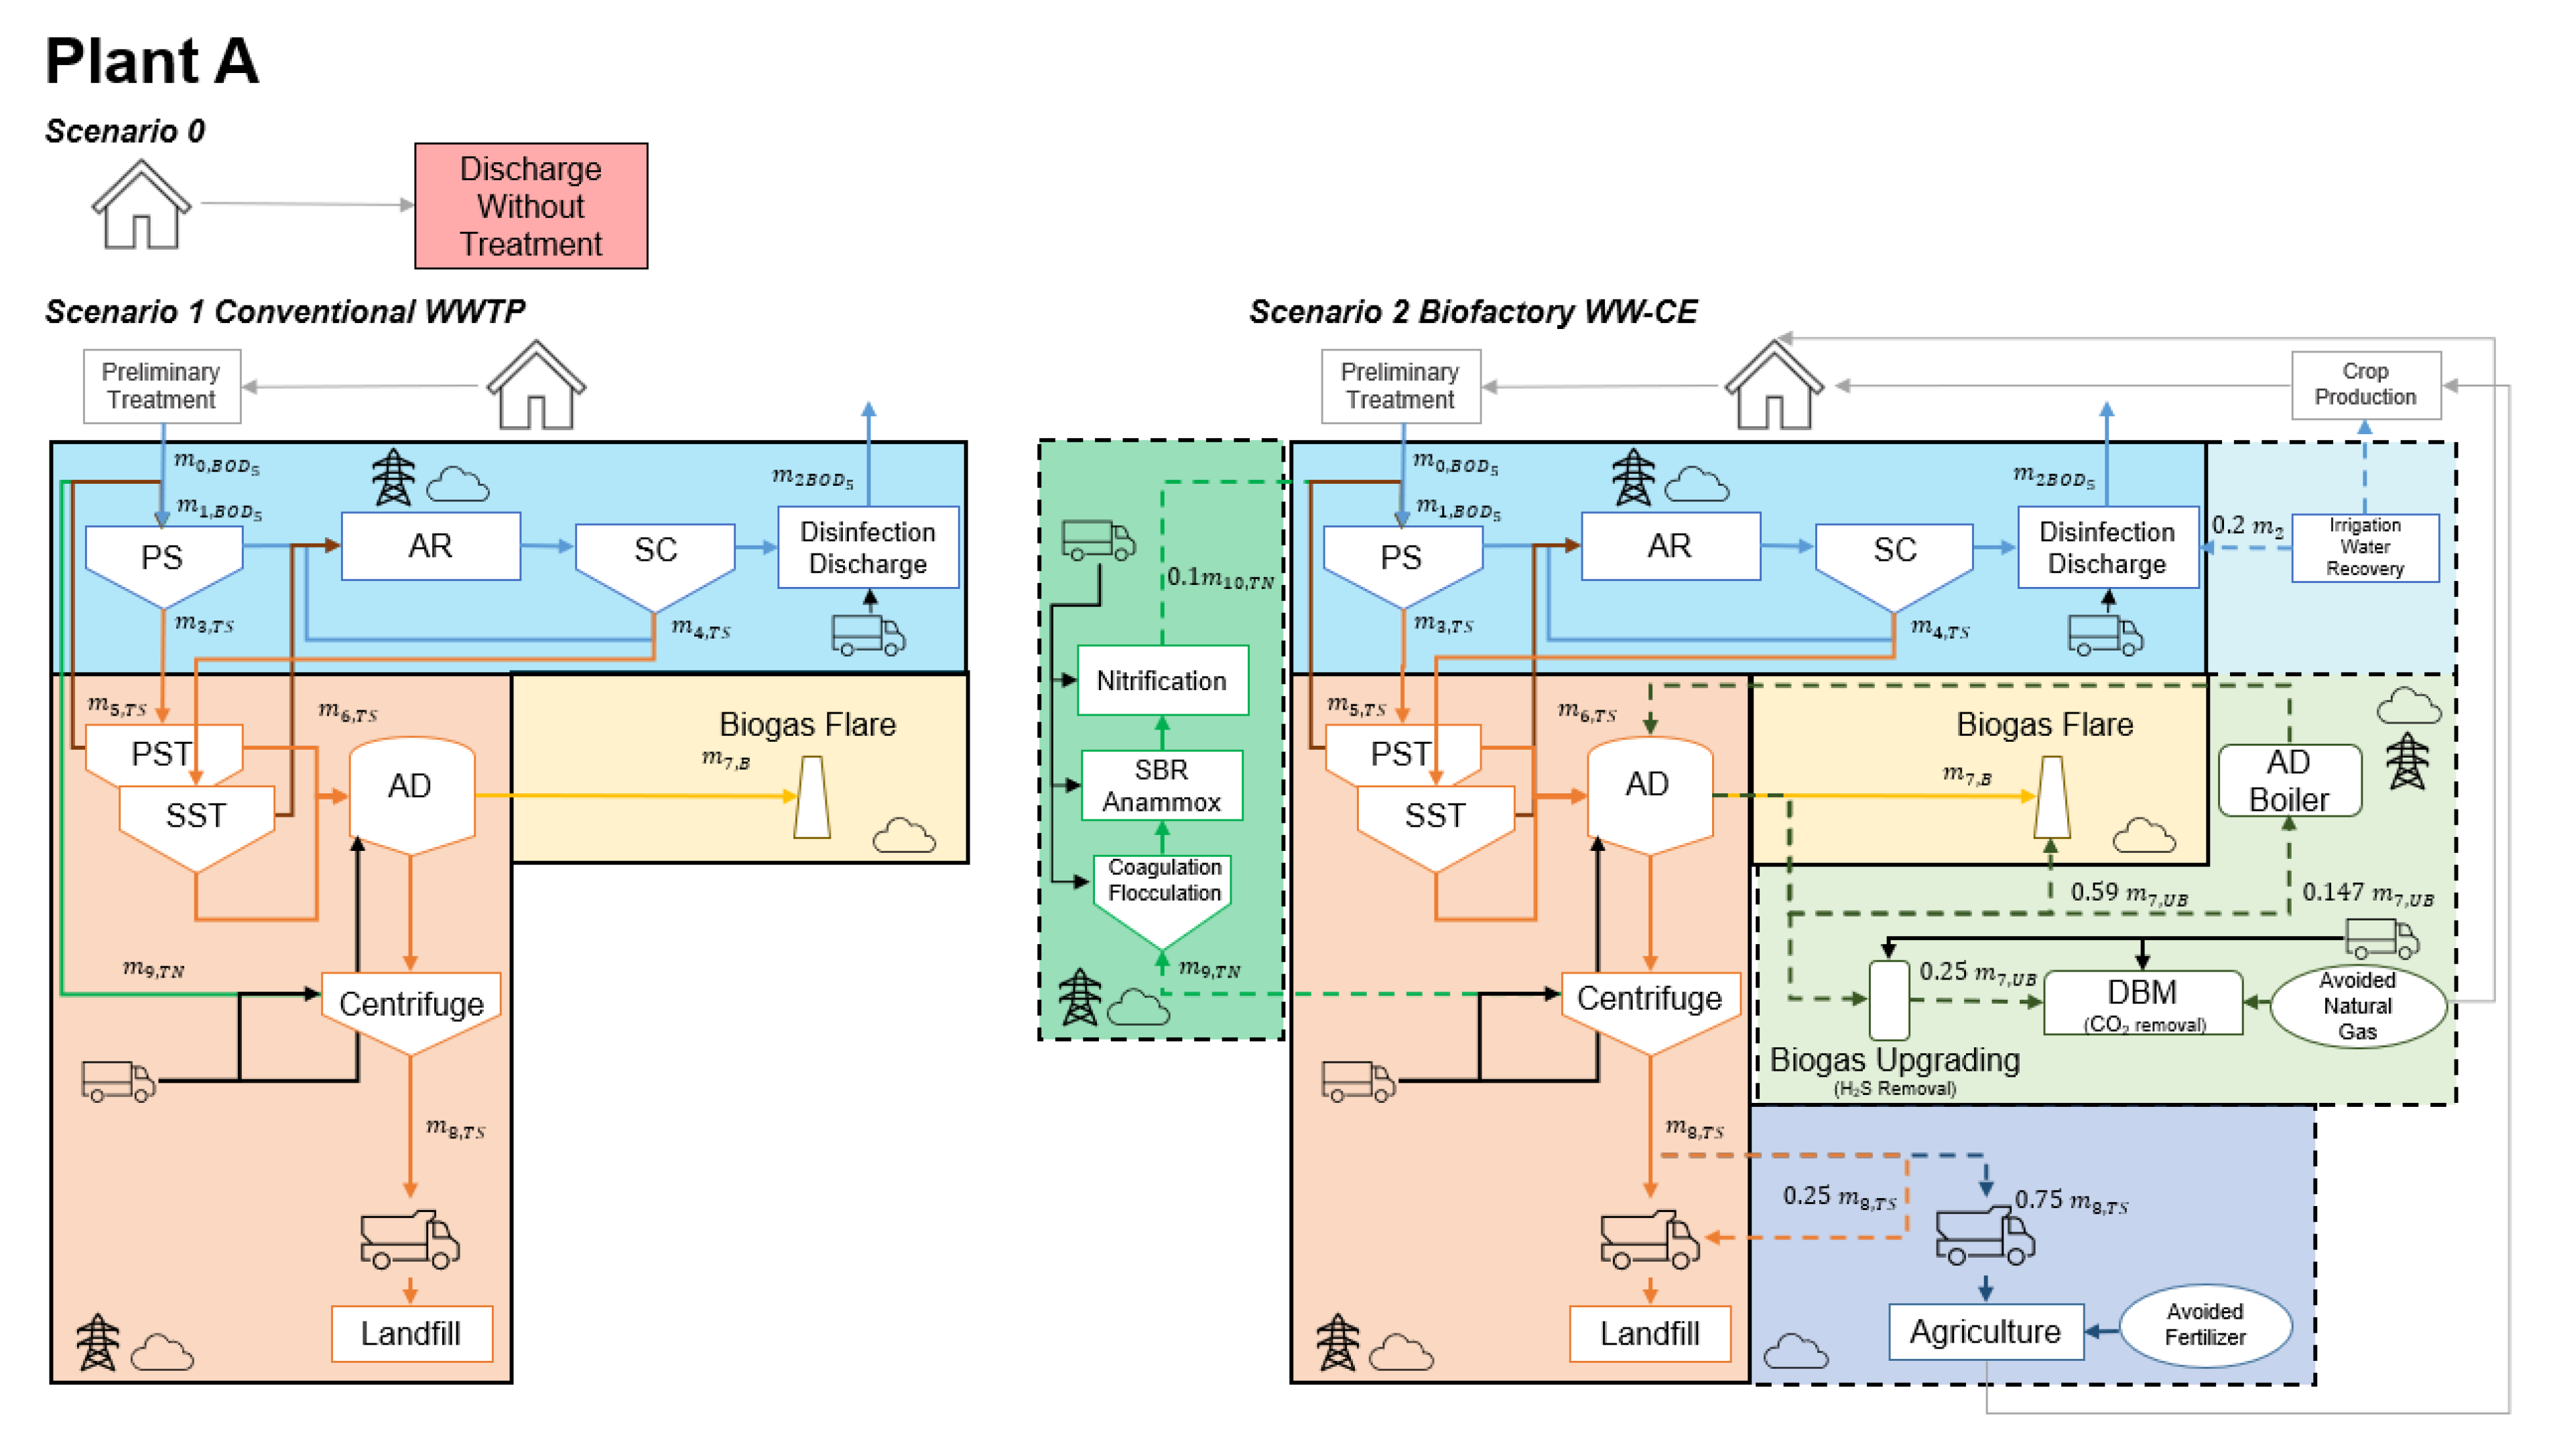 ); sludge treatment and biosolids disposal to landfill (); biogas flare (); biosolids recovery to agriculture (); biogas energy recovery (); advanced nitrogen removal (); chemical transport (); biosolids transport (); local network energy input (); atmospheric emissions (); reference flow; mass of total solids produced by the water line and treated by sludge line; mass of raw biogas; is mass of upgraded biogas.
); sludge treatment and biosolids disposal to landfill (); biogas flare (); biosolids recovery to agriculture (); biogas energy recovery (); advanced nitrogen removal (); chemical transport (); biosolids transport (); local network energy input (); atmospheric emissions (); reference flow; mass of total solids produced by the water line and treated by sludge line; mass of raw biogas; is mass of upgraded biogas.
); sludge treatment and biosolids disposal to landfill (); biogas flare (); biosolids recovery to agriculture (); biogas energy recovery (); advanced nitrogen removal (); chemical transport (); biosolids transport (); local network energy input (); atmospheric emissions (); reference flow; mass of total solids produced by the water line and treated by sludge line; mass of raw biogas; is mass of upgraded biogas.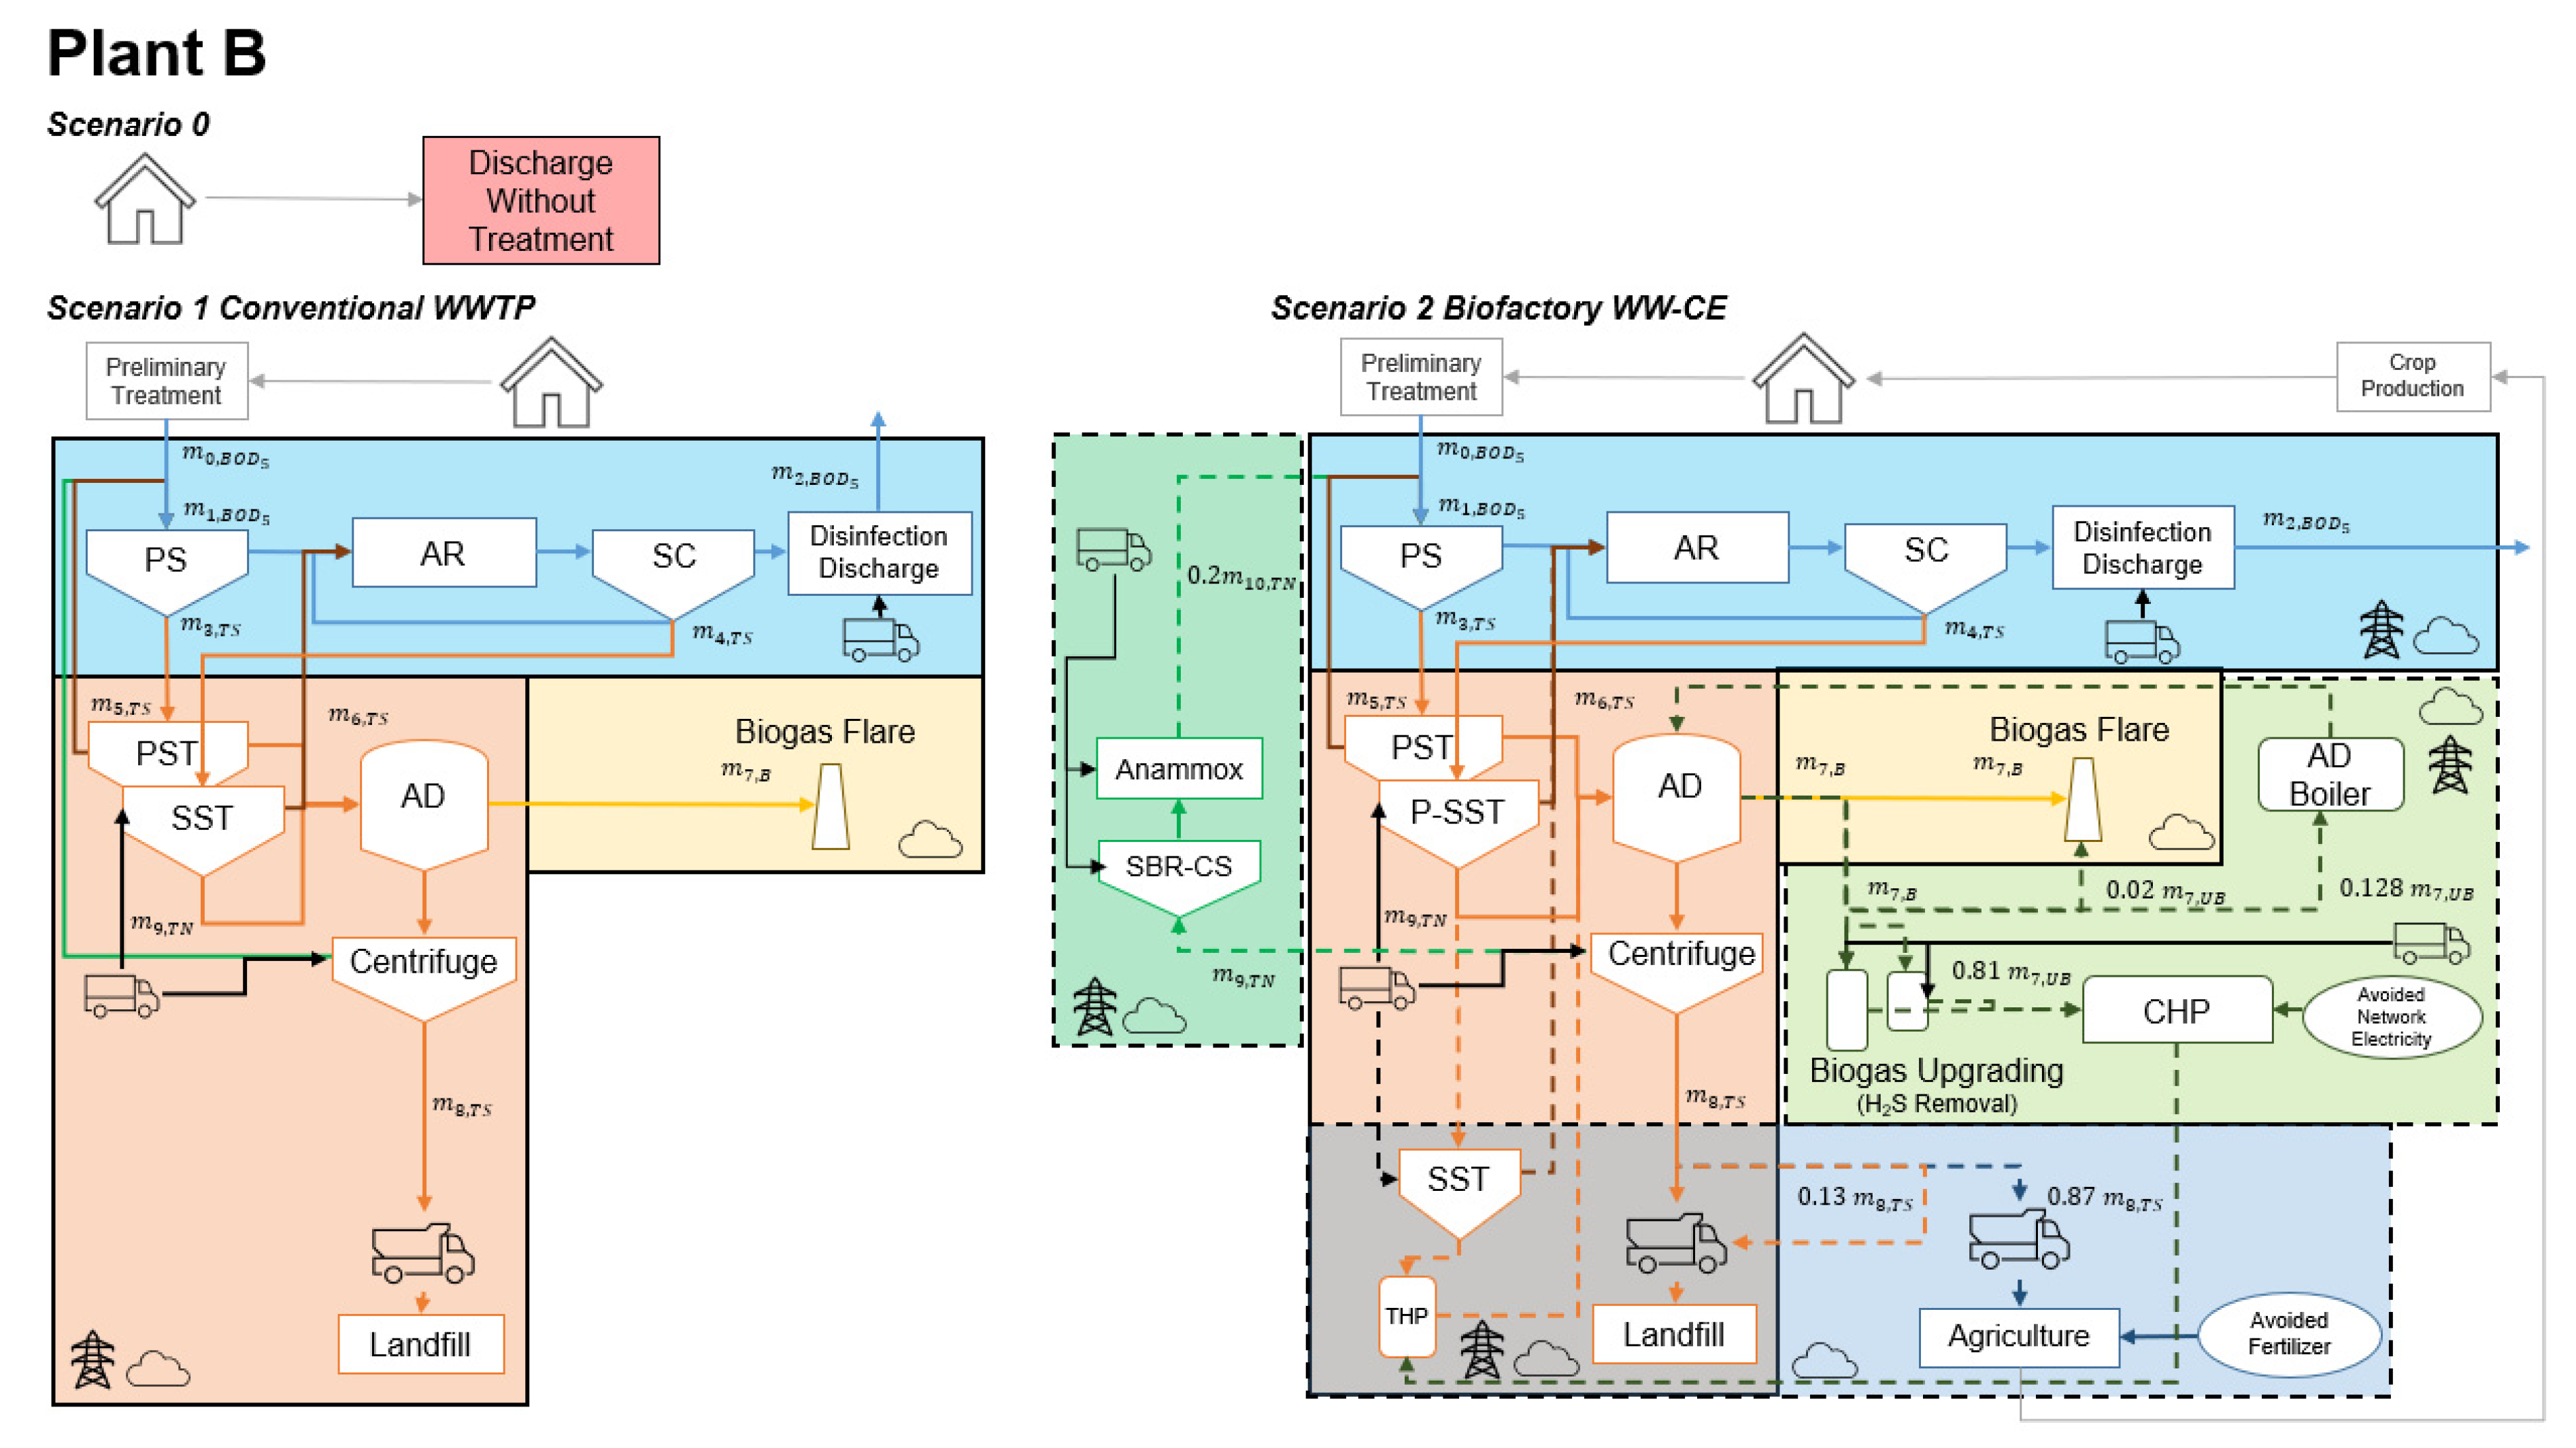


| Plant A | Plant B | |||||||
|---|---|---|---|---|---|---|---|---|
| Criteria Sub-Category | Indicator | S0 | S1 | S2 | S0 | S1 | S2 | |
| Environmental (LCA) | Air | CC | 0.00 | 0.74 | 0.37 | 0.00 | 0.78 | 1.00 |
| SOD | 0.00 | 0.97 | 0.28 | 0.05 | 1.00 | 0.97 | ||
| IR | 0.48 | 0.88 | 0.00 | 0.48 | 1.00 | 0.56 | ||
| OF | 0.49 | 0.79 | 0.53 | 0.49 | 1.00 | 0.00 | ||
| PM | 0.49 | 0.81 | 0.56 | 0.49 | 1.00 | 0.00 | ||
| Land | TA | 0.42 | 0.84 | 0.33 | 0.42 | 1.00 | 0.00 | |
| TET | 0.69 | 0.89 | 0.23 | 0.69 | 1.00 | 0.00 | ||
| LU | 0.93 | 0.97 | 0.22 | 0.93 | 1.00 | 0.00 | ||
| MRS | 0.48 | 1.00 | 0.00 | 0.52 | 0.97 | 0.48 | ||
| FRS | 0.51 | 0.80 | 0.28 | 0.51 | 1.00 | 0.00 | ||
| Water | FE | 1.00 | 0.45 | 0.00 | 0.94 | 0.47 | 0.51 | |
| ME | 0.00 | 0.02 | 0.64 | 0.00 | 0.03 | 1.00 | ||
| FET | 0.74 | 0.14 | 0.00 | 1.00 | 0.14 | 0.01 | ||
| MET | 0.76 | 0.15 | 0.00 | 1.00 | 0.15 | 0.00 | ||
| WC | 0.00 | 0.25 | 0.09 | 0.00 | 0.71 | 1.00 | ||
| Human Health | HCT | 0.49 | 0.79 | 0.51 | 0.49 | 1.00 | 0.00 | |
| HNCT | 0.50 | 0.02 | 0.84 | 0.53 | 0.00 | 1.00 | ||
| Social (SLCA) | Working Conditions | EO | 1.00 | 0.49 | 0.29 | 1.00 | 0.32 | 0.00 |
| IN | 1.00 | 0.70 | 0.37 | 1.00 | 0.00 | 0.28 | ||
| HS | 0.00 | 0.59 | 0.24 | 0.00 | 1.00 | 0.35 | ||
| RI | 0.00 | 0.39 | 0.42 | 0.00 | 0.40 | 1.00 | ||
| Social Responsibility | ANMR | 1.00 | 0.51 | 0.22 | 1.00 | 0.19 | 0.00 | |
| ID | 1.00 | 1.00 | 0.29 | 1.00 | 1.00 | 0.00 | ||
| ED | 1.00 | 0.74 | 0.00 | 1.00 | 0.91 | 0.60 | ||
| Environmental Responsibility | AMR | 1.00 | 0.99 | 0.00 | 1.00 | 0.99 | 0.93 | |
| DA | 1.00 | 0.60 | 0.00 | 1.00 | 0.47 | 0.01 | ||
| CO | 1.00 | 0.00 | 0.00 | 1.00 | 0.98 | 0.98 | ||
| Governance | FM | 0.00 | 0.30 | 1.00 | 0.00 | 0.00 | 0.00 | |
| EN | 1.00 | 0.40 | 0.00 | 1.00 | 1.00 | 0.99 | ||
| CB | 1.00 | 0.56 | 0.35 | 1.00 | 0.25 | 0.00 | ||
| Plant A | Plant B | ||||||
|---|---|---|---|---|---|---|---|
| Criteria Sub-Category | S0 | S1 | S2 | S0 | S1 | S2 | |
| Environmental (LCA) | Air | 0.27 | 0.81 | 0.39 | 0.28 | 0.93 | 0.50 |
| Land | 0.64 | 0.91 | 0.22 | 0.65 | 1.00 | 0.08 | |
| Water | 0.38 | 0.24 | 0.12 | 0.42 | 0.45 | 0.68 | |
| Human Health | 0.49 | 0.41 | 0.68 | 0.51 | 0.50 | 0.50 | |
| Social (SLCA) | Working Conditions | 0.50 | 0.54 | 0.33 | 0.50 | 0.43 | 0.41 |
| Social Responsibility | 1.00 | 0.75 | 0.17 | 1.00 | 0.70 | 0.20 | |
| Environmental Responsibility | 1.00 | 0.53 | 0.00 | 1.00 | 0.82 | 0.64 | |
| Governance | 0.67 | 0.42 | 0.45 | 0.67 | 0.42 | 0.33 | |
| Plant A | Plant B | |||||
|---|---|---|---|---|---|---|
| Criteria | S0 | S1 | S2 | S0 | S1 | S2 |
| Environmental (LCA) | 0.44 | 0.58 | 0.32 | 0.48 | 0.67 | 0.46 |
| Social (SLCA) | 0.79 | 0.57 | 0.00 | 1.00 | 0.70 | 0.29 |
| Economic (LCC) | 1.00 | 0.62 | 0.88 | 1.00 | 0.42 | 0.00 |
Disclaimer/Publisher’s Note: The statements, opinions and data contained in all publications are solely those of the individual author(s) and contributor(s) and not of MDPI and/or the editor(s). MDPI and/or the editor(s) disclaim responsibility for any injury to people or property resulting from any ideas, methods, instructions or products referred to in the content. |
© 2023 by the authors. Licensee MDPI, Basel, Switzerland. This article is an open access article distributed under the terms and conditions of the Creative Commons Attribution (CC BY) license (https://creativecommons.org/licenses/by/4.0/).
Share and Cite
Furness, M.; Bello-Mendoza, R.; Chamy Maggi, R. The Biofactory: Quantifying Life Cycle Sustainability Impacts of the Wastewater Circular Economy in Chile. Sustainability 2023, 15, 16077. https://doi.org/10.3390/su152216077
Furness M, Bello-Mendoza R, Chamy Maggi R. The Biofactory: Quantifying Life Cycle Sustainability Impacts of the Wastewater Circular Economy in Chile. Sustainability. 2023; 15(22):16077. https://doi.org/10.3390/su152216077
Chicago/Turabian StyleFurness, Madeline, Ricardo Bello-Mendoza, and Rolando Chamy Maggi. 2023. "The Biofactory: Quantifying Life Cycle Sustainability Impacts of the Wastewater Circular Economy in Chile" Sustainability 15, no. 22: 16077. https://doi.org/10.3390/su152216077
APA StyleFurness, M., Bello-Mendoza, R., & Chamy Maggi, R. (2023). The Biofactory: Quantifying Life Cycle Sustainability Impacts of the Wastewater Circular Economy in Chile. Sustainability, 15(22), 16077. https://doi.org/10.3390/su152216077