


Optimal Charging Station Placement and Scheduling for Electric Vehicles in Smart Cities


Abstract
:1. Introduction
2. Previous Approaches
- There is a lack of studies that focus on research in multi-objective optimization, which takes into account cost, convenience, environmental impact, and other considerations at the same time and has the potential to provide more holistic solutions.
- Lack of development of models that consider the key variables to determine optimal placement of EVCSs in smart cities.
- Research is needed to develop data analytics and machine learning algorithms that can adapt to changing electricity demands and the availability of charging stations.
3. Problem Formulation
Research Objectives
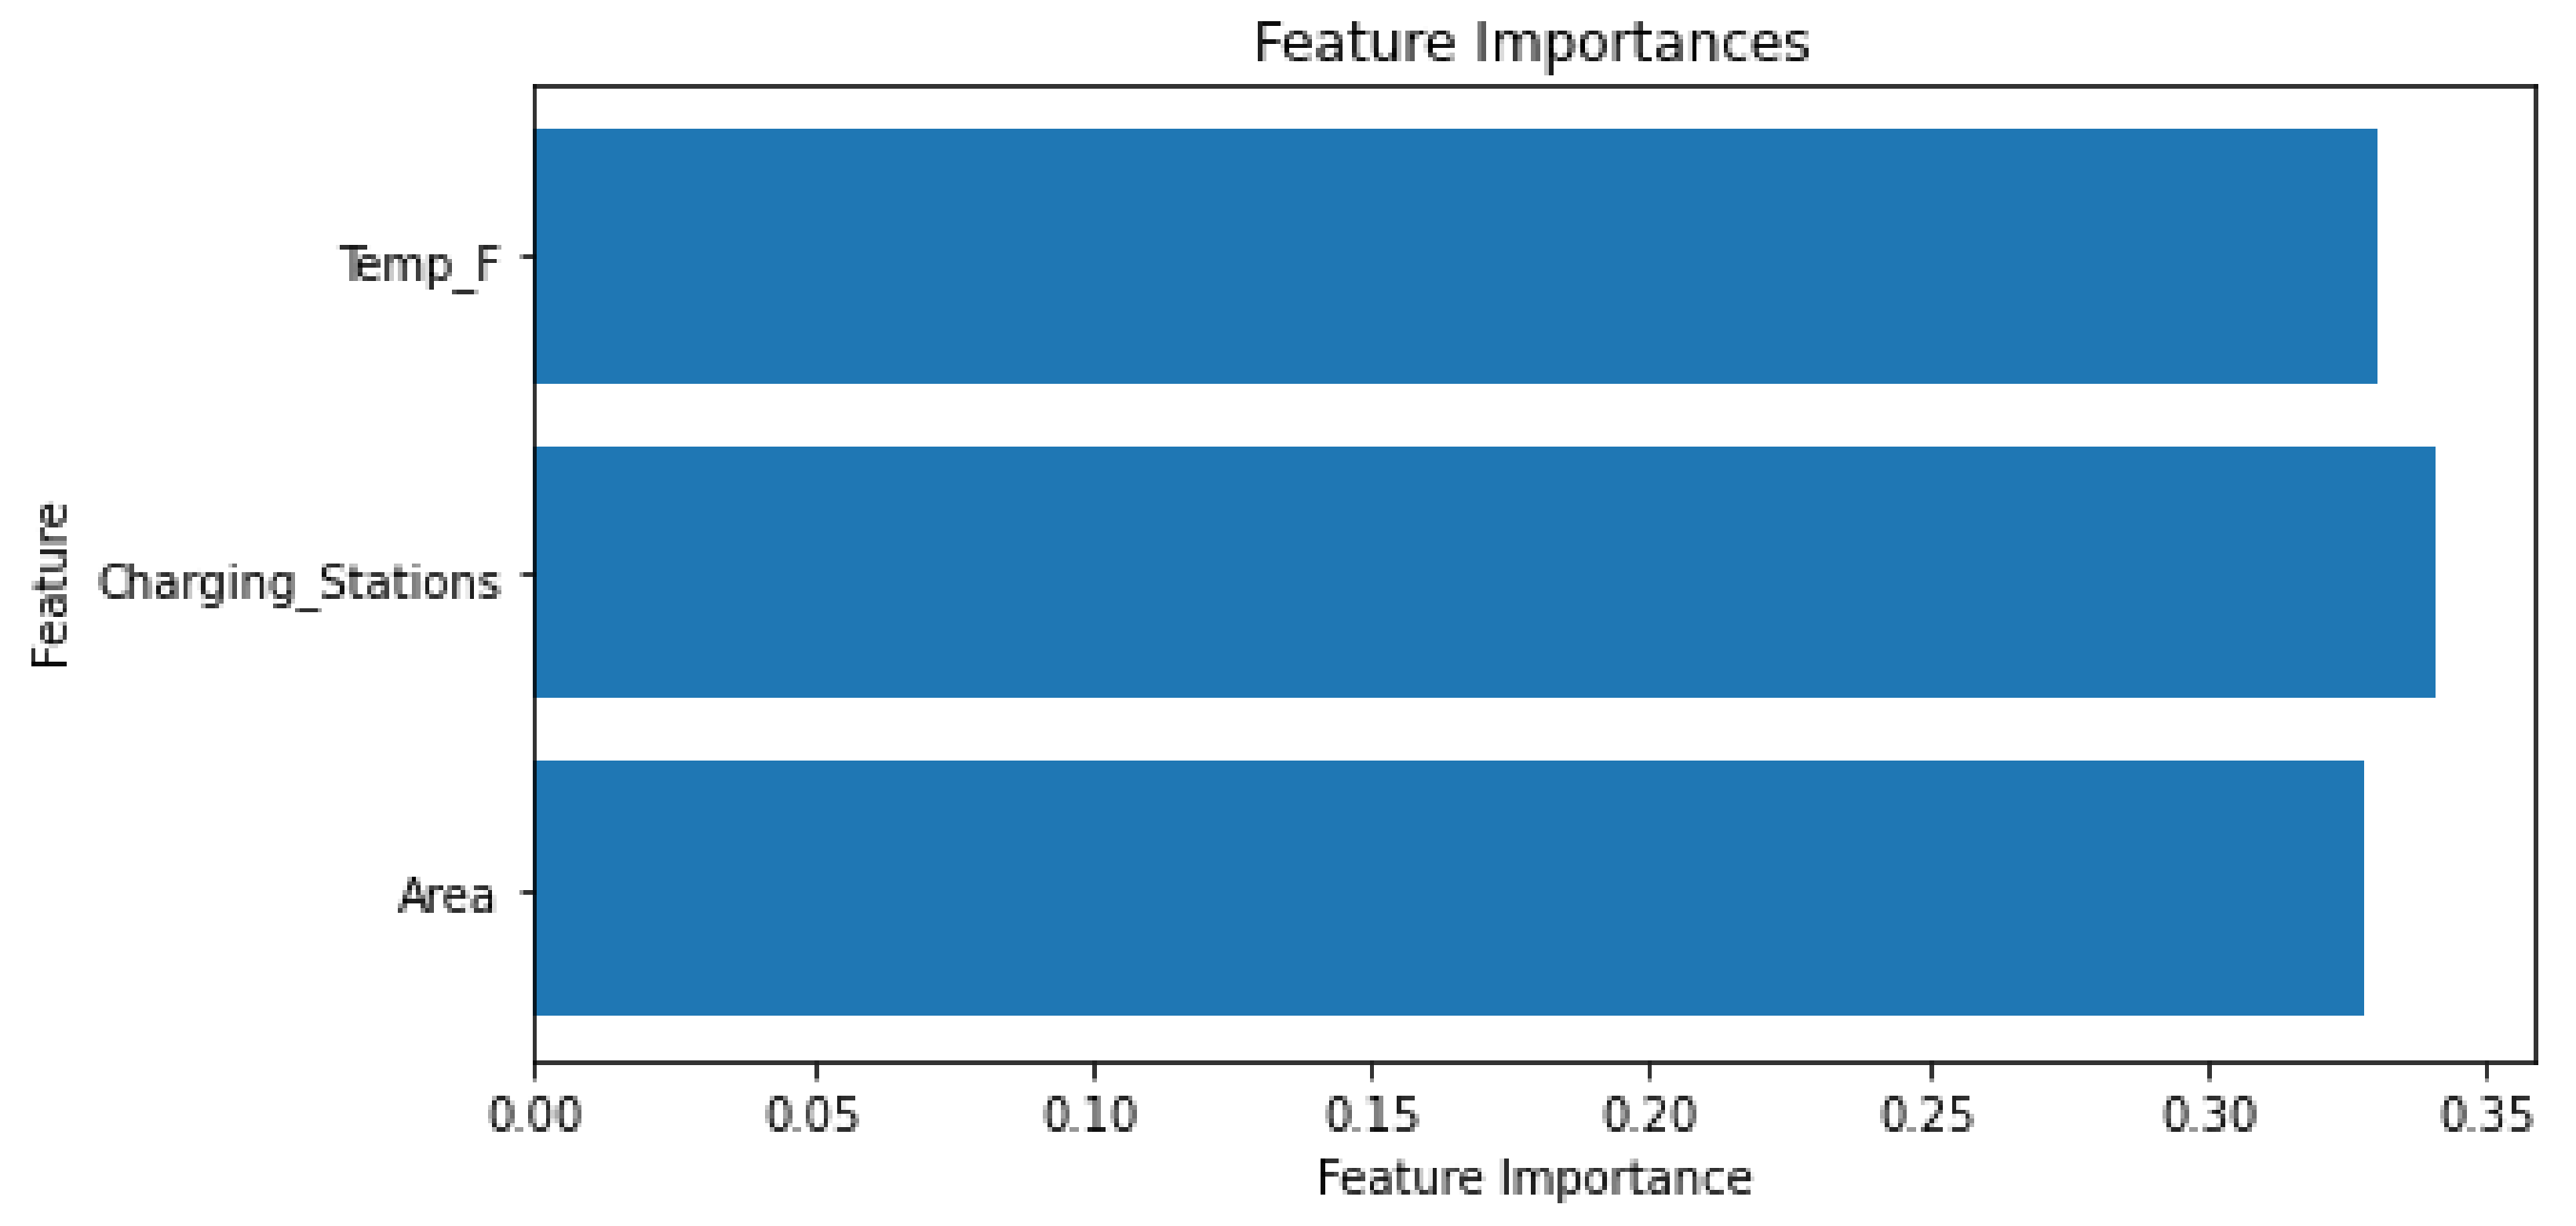
- Identify the key factors that significantly influence the optimal placement and scheduling of electric vehicle (EV) charging stations in urban areas. These factors include population density, area, EV ownership, environmental conditions (such as temperature and humidity), energy consumption patterns, and energy costs.
- Develop an optimization model that incorporates these key factors to determine the optimal placement and scheduling of EV charging stations in smart cities. This model will consider the aforementioned factors to ensure efficient and effective placement and scheduling strategies.
- This analysis will provide insights into the overall effectiveness and performance of the proposed ML model for charging infrastructure and compare the effectiveness of models in assessing the indicators for optimal placement.
- This evaluation will assess the model’s ability to optimize charging infrastructure and contribute to the sustainability of the transportation sector.
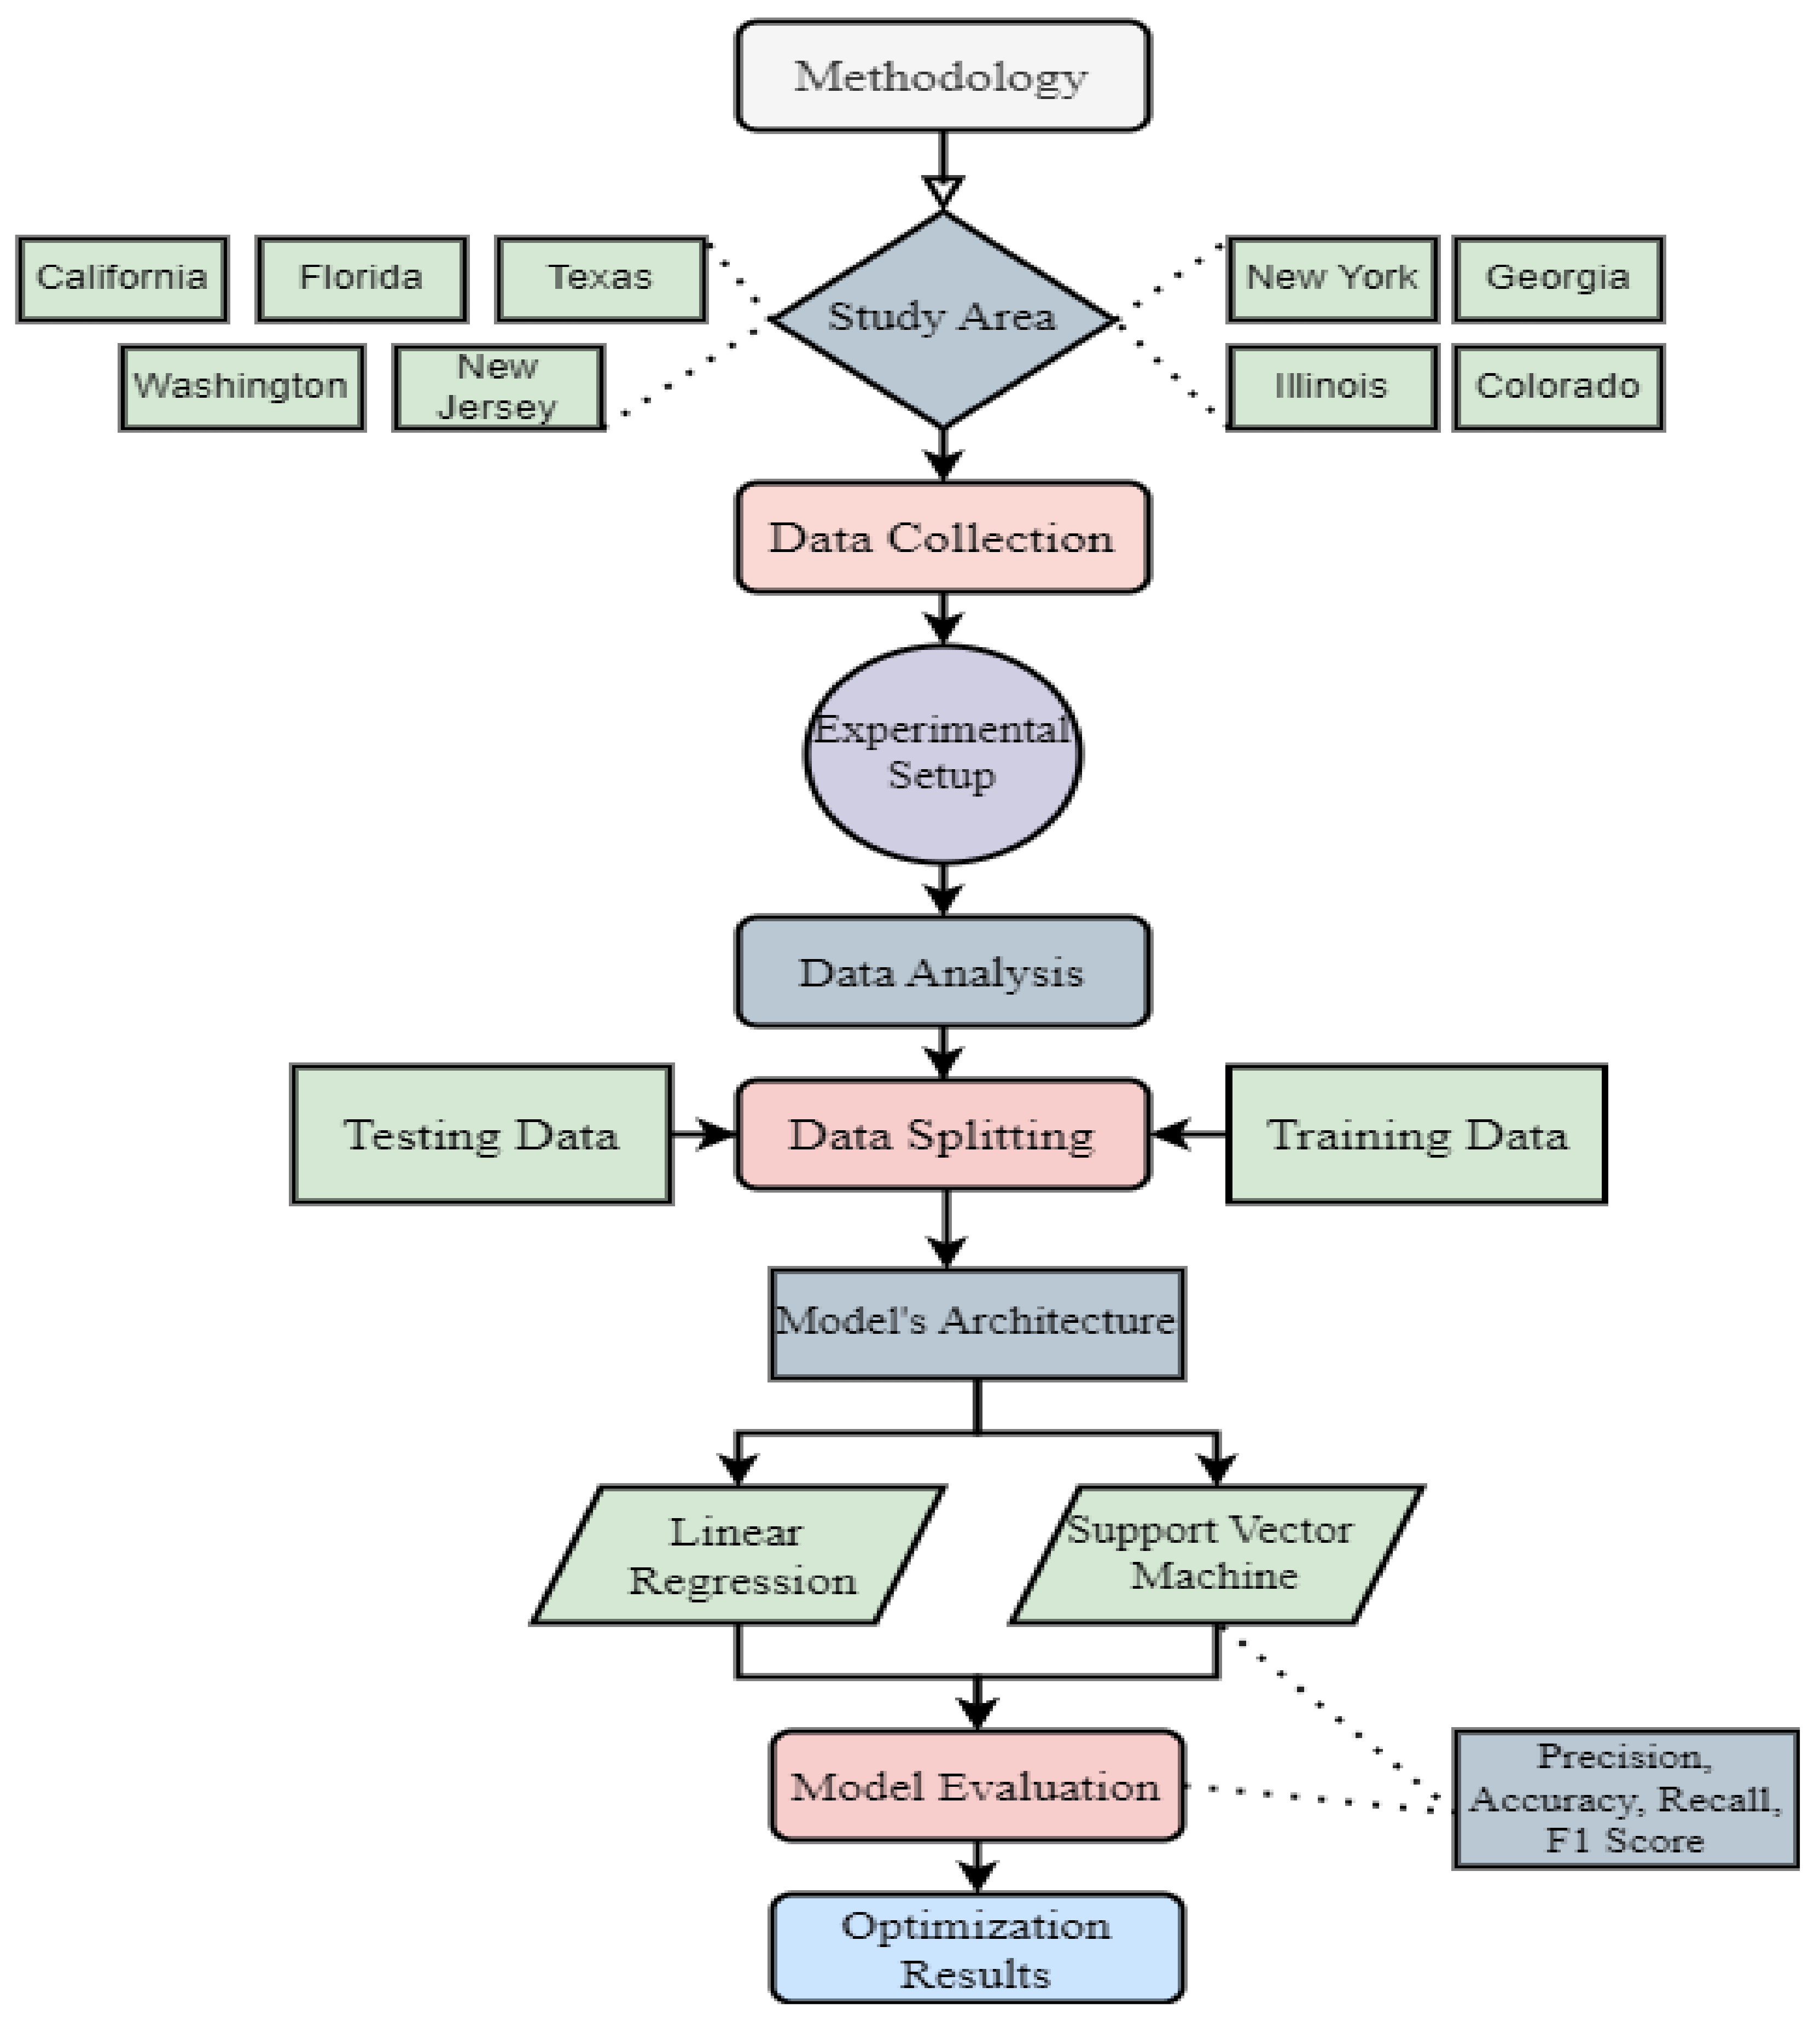
4. Research Methodology
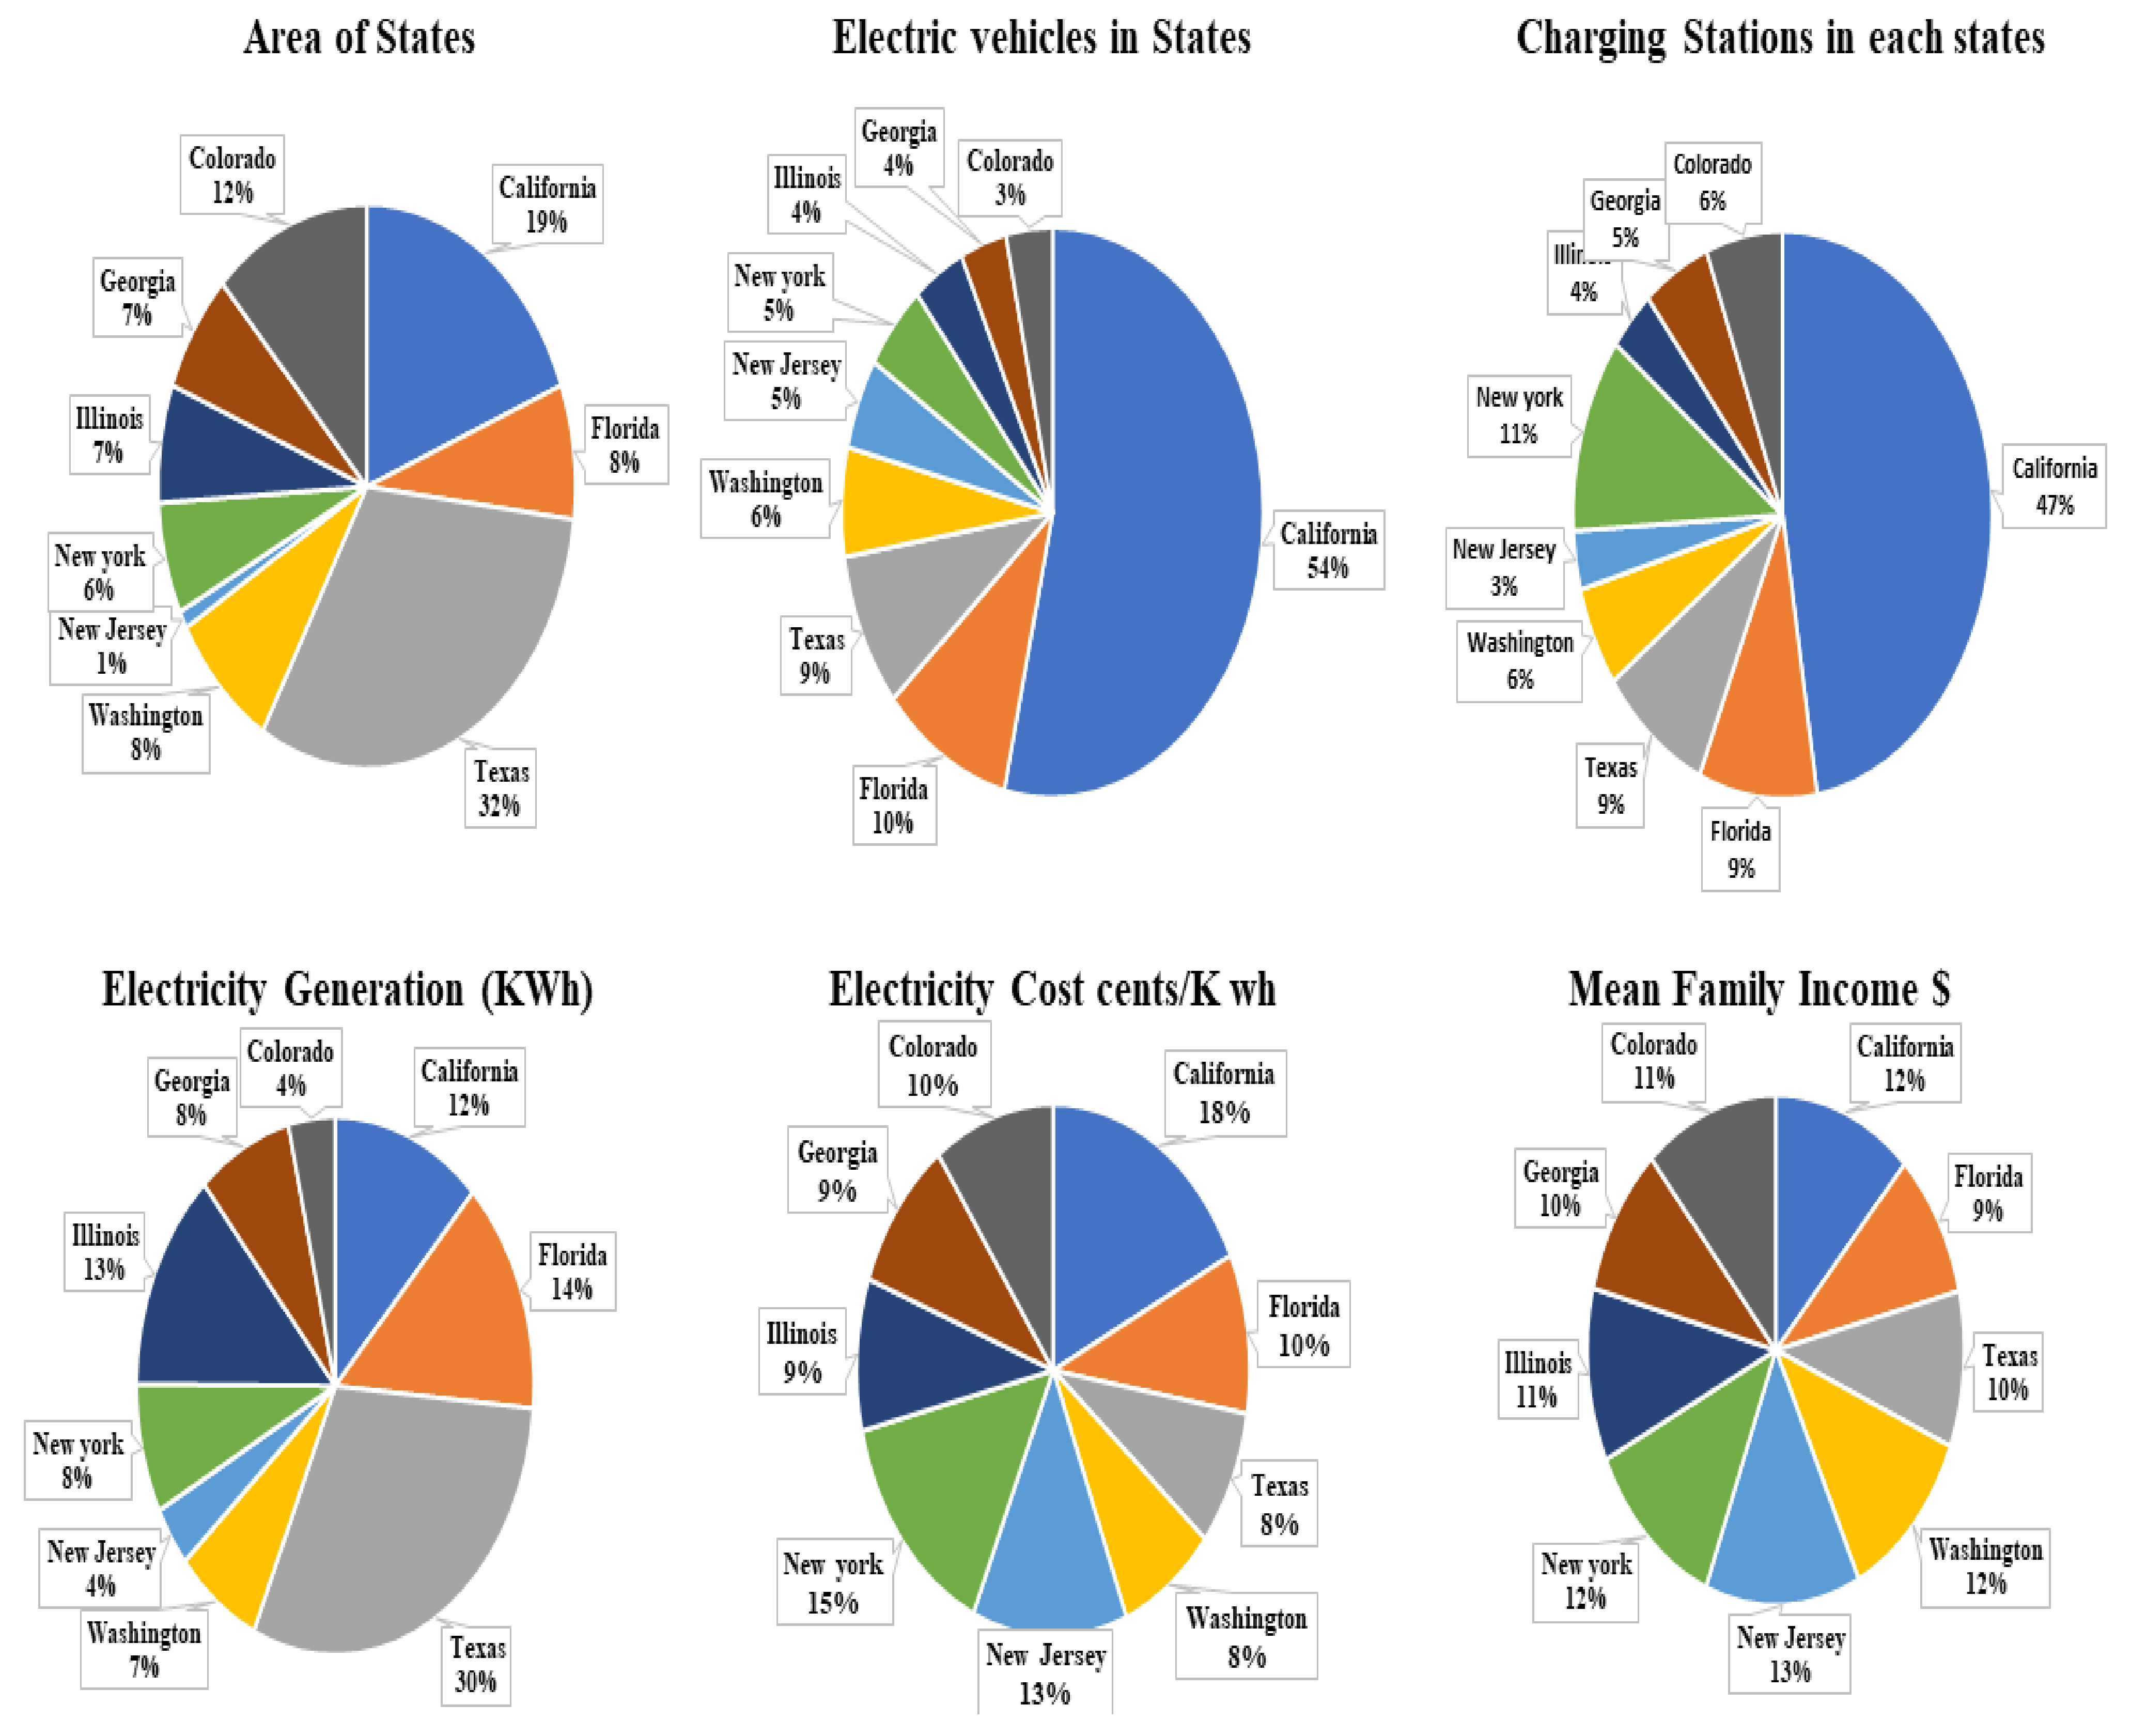
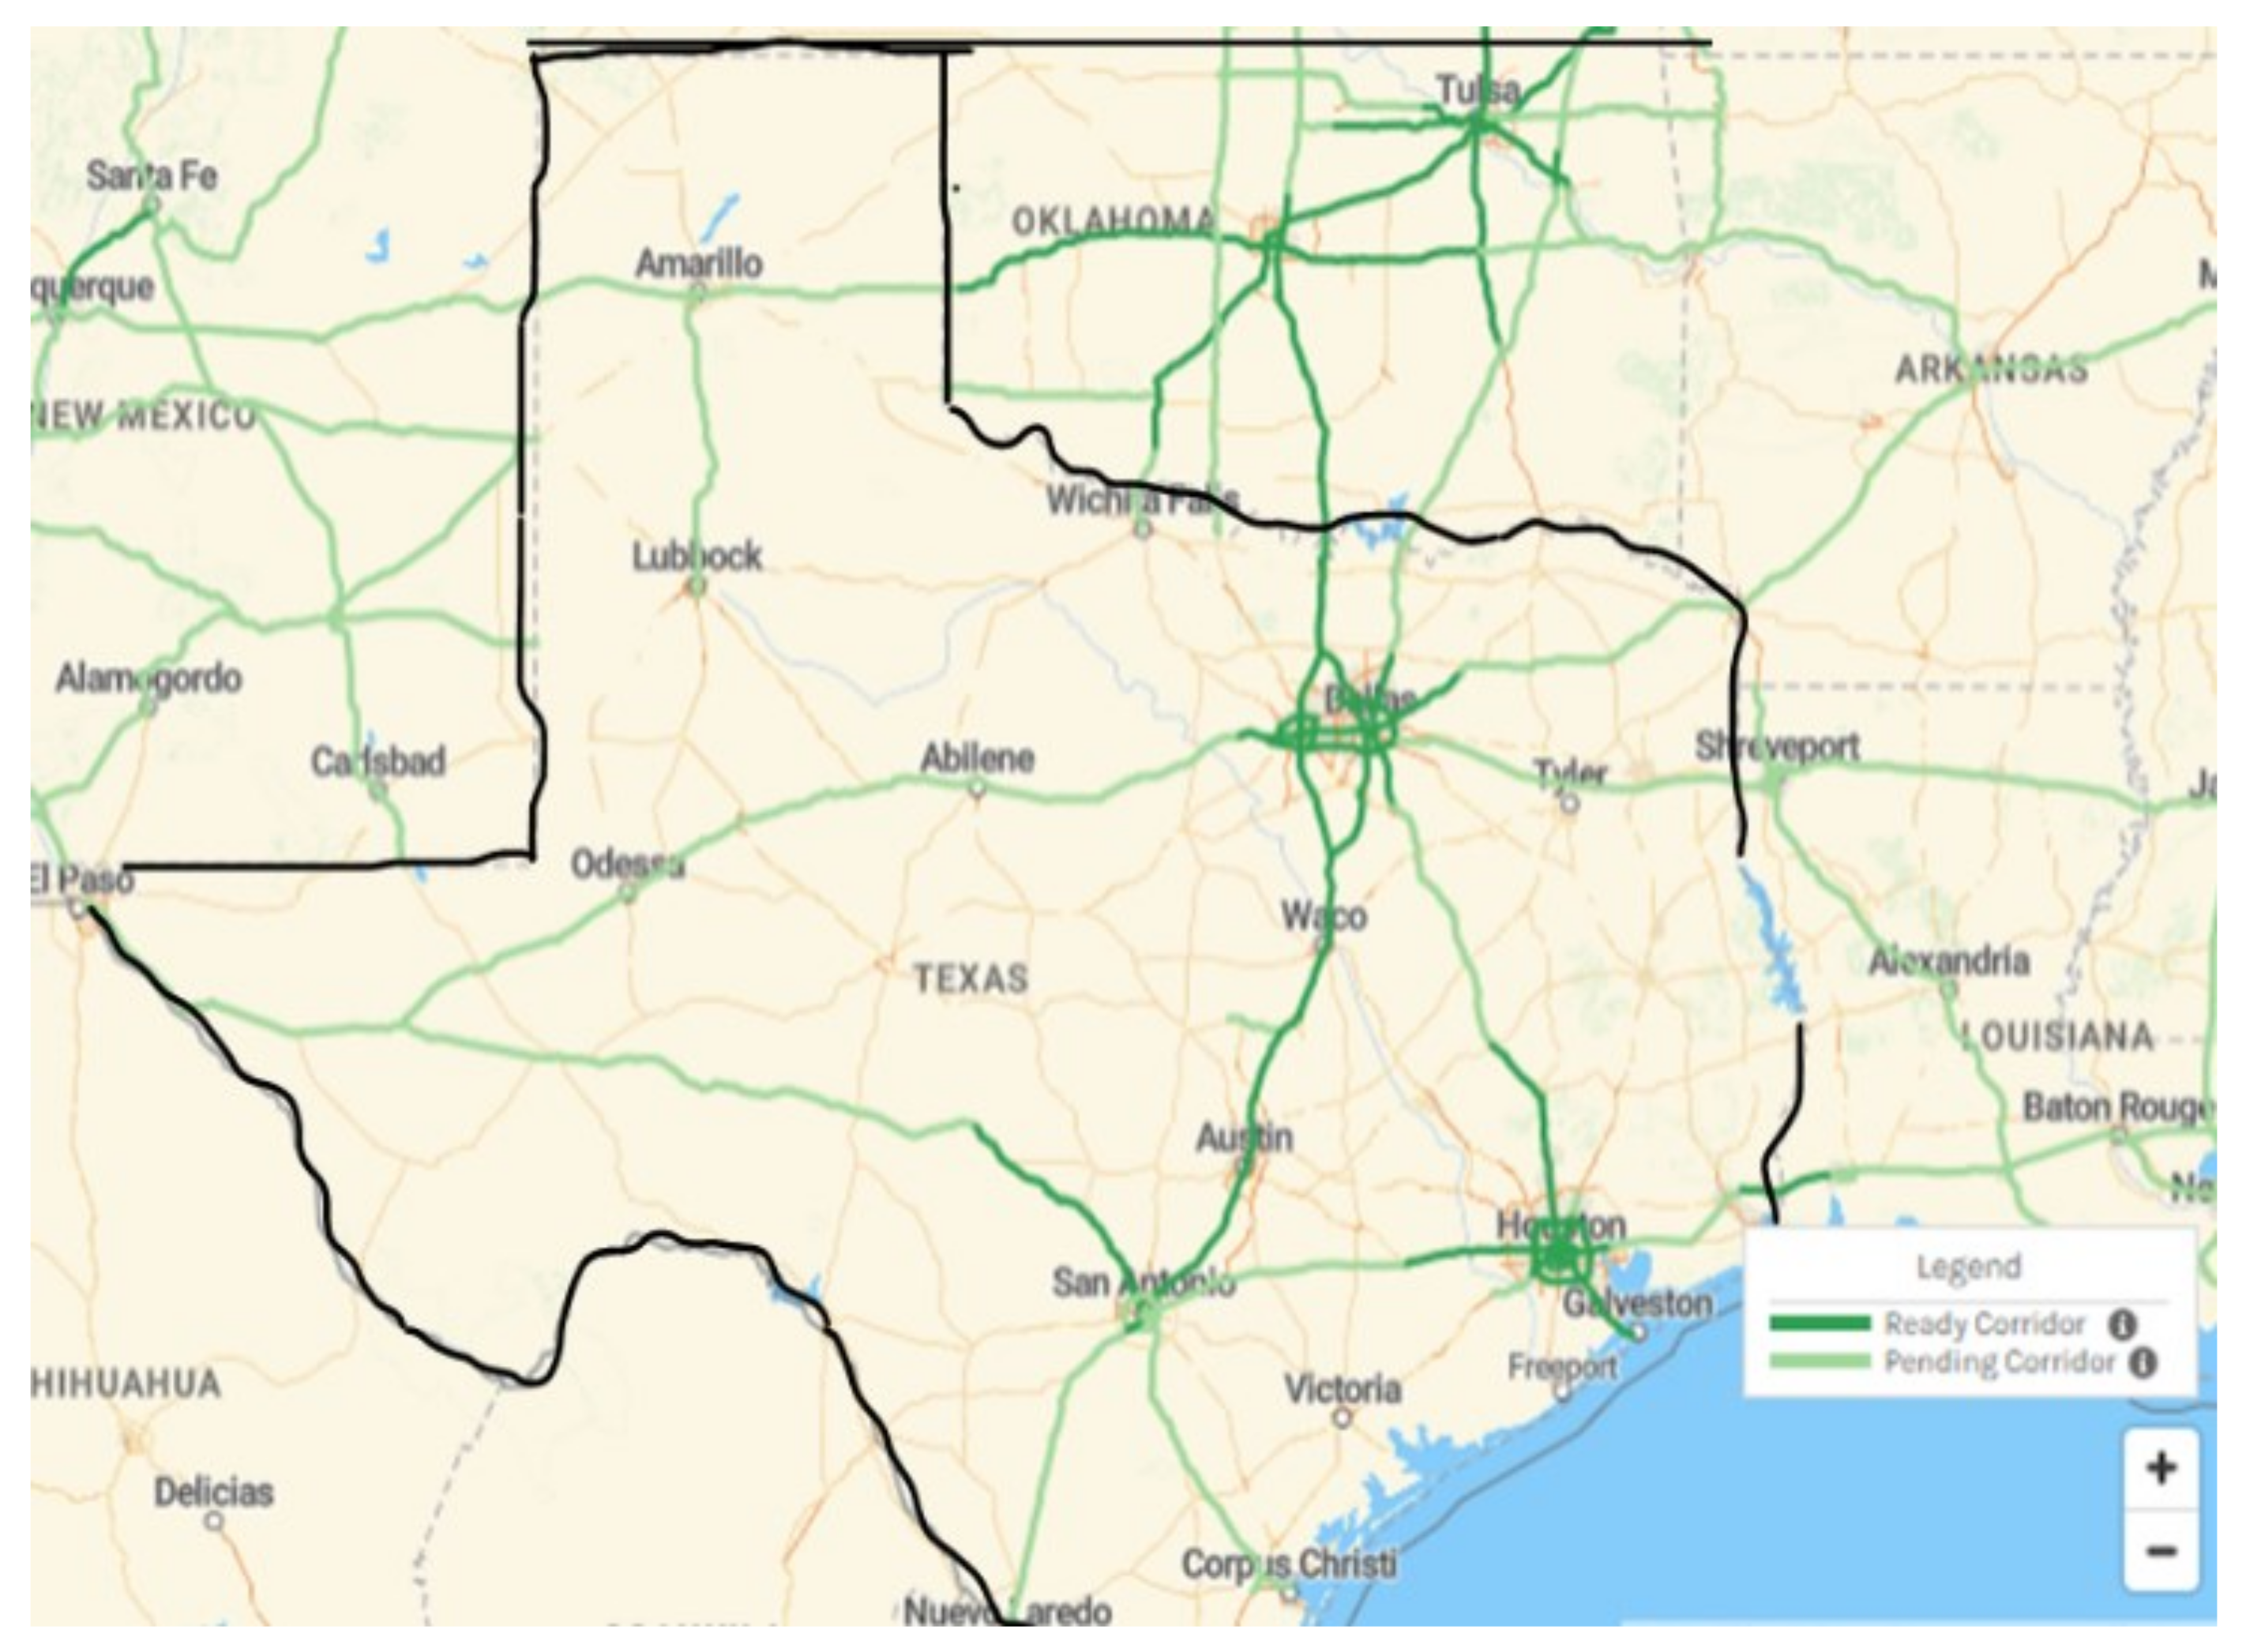
4.1. Study Area
4.2. Data Collection
- National Household Travel Survey (NHTS) (United States): This dataset provides information on travel behavior, vehicle ownership, and household demographics. It can be used to analyze the factors influencing EV adoption and charging demand in urban areas. Data access: [NHTS Data] (https://nhts.ornl.gov/) (accessed on 5 Septemeber 2023).
- US Department of Energy (DOE)—Alternative Fuels Data Center (AFDC): This source provides comprehensive data on existing EV charging stations, including their locations, charging capabilities, and usage statistics. Data access: [AFDC Station Locator] (https://afdc.energy.gov/stations/#/analyze) (accessed on 10 Sepetmber 2023).
- OpenStreetMap (OSM): This crowdsourced mapping platform can obtain geographical information on road networks, land use, and points of interest, which are essential for the placement analysis of charging stations. Data access: [OSM Data] (https://www.openstreetmap.org/) (accessed on 31 August 2023).
- National Oceanic and Atmospheric Administration (NOAA)—Climate Data Online (CDO): This dataset contains historical weather data, which can be utilized to estimate renewable energy generation potential and influence the placement of charging stations. Data access: [NOAA CDO] (https://www.ncei.noaa.gov/access/search/data-search/global-summary-of-the-day) (accessed on 2 Sepetmber 2023).
4.3. Experimental Setup
4.4. Model’s Architecture
4.4.1. Linear Regression
4.4.2. Support Vector Machine
4.5. Model’s Validation
4.6. Mapping Analysis
5. Results
5.1. Data Analysis
Graphical Analysis
5.2. Machine Learning Analysis
5.2.1. Linear Regression Model
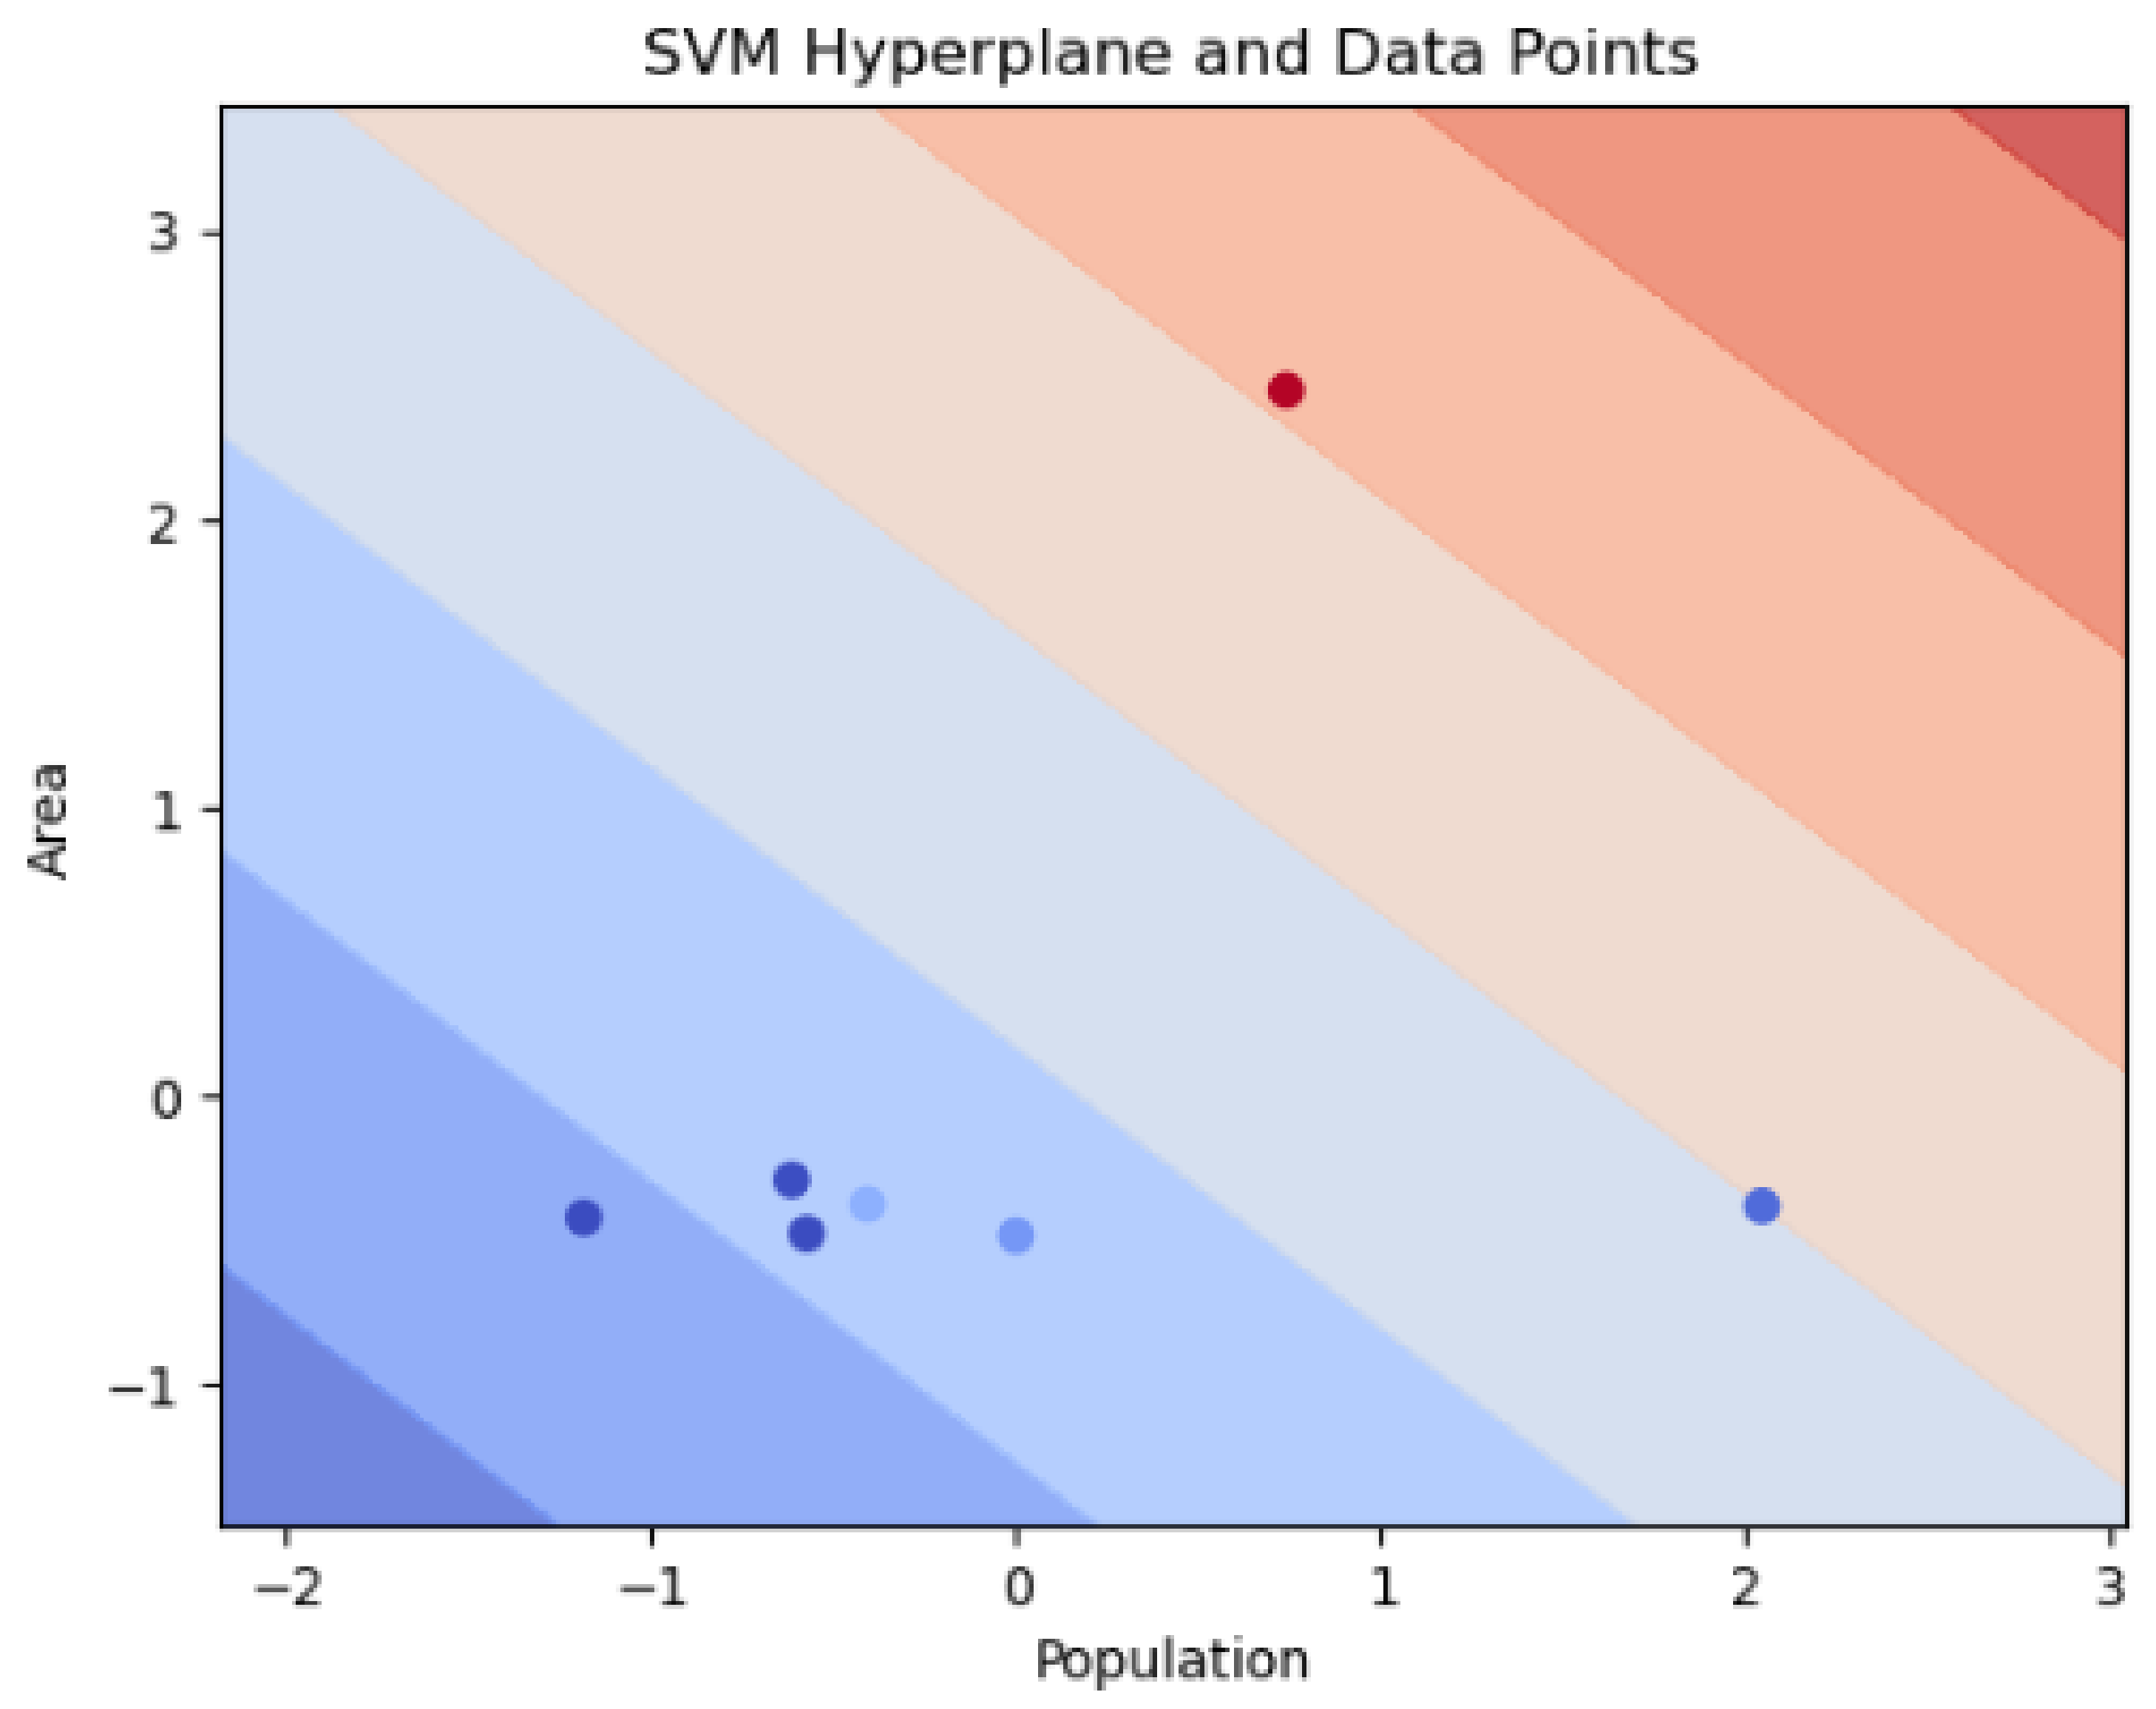
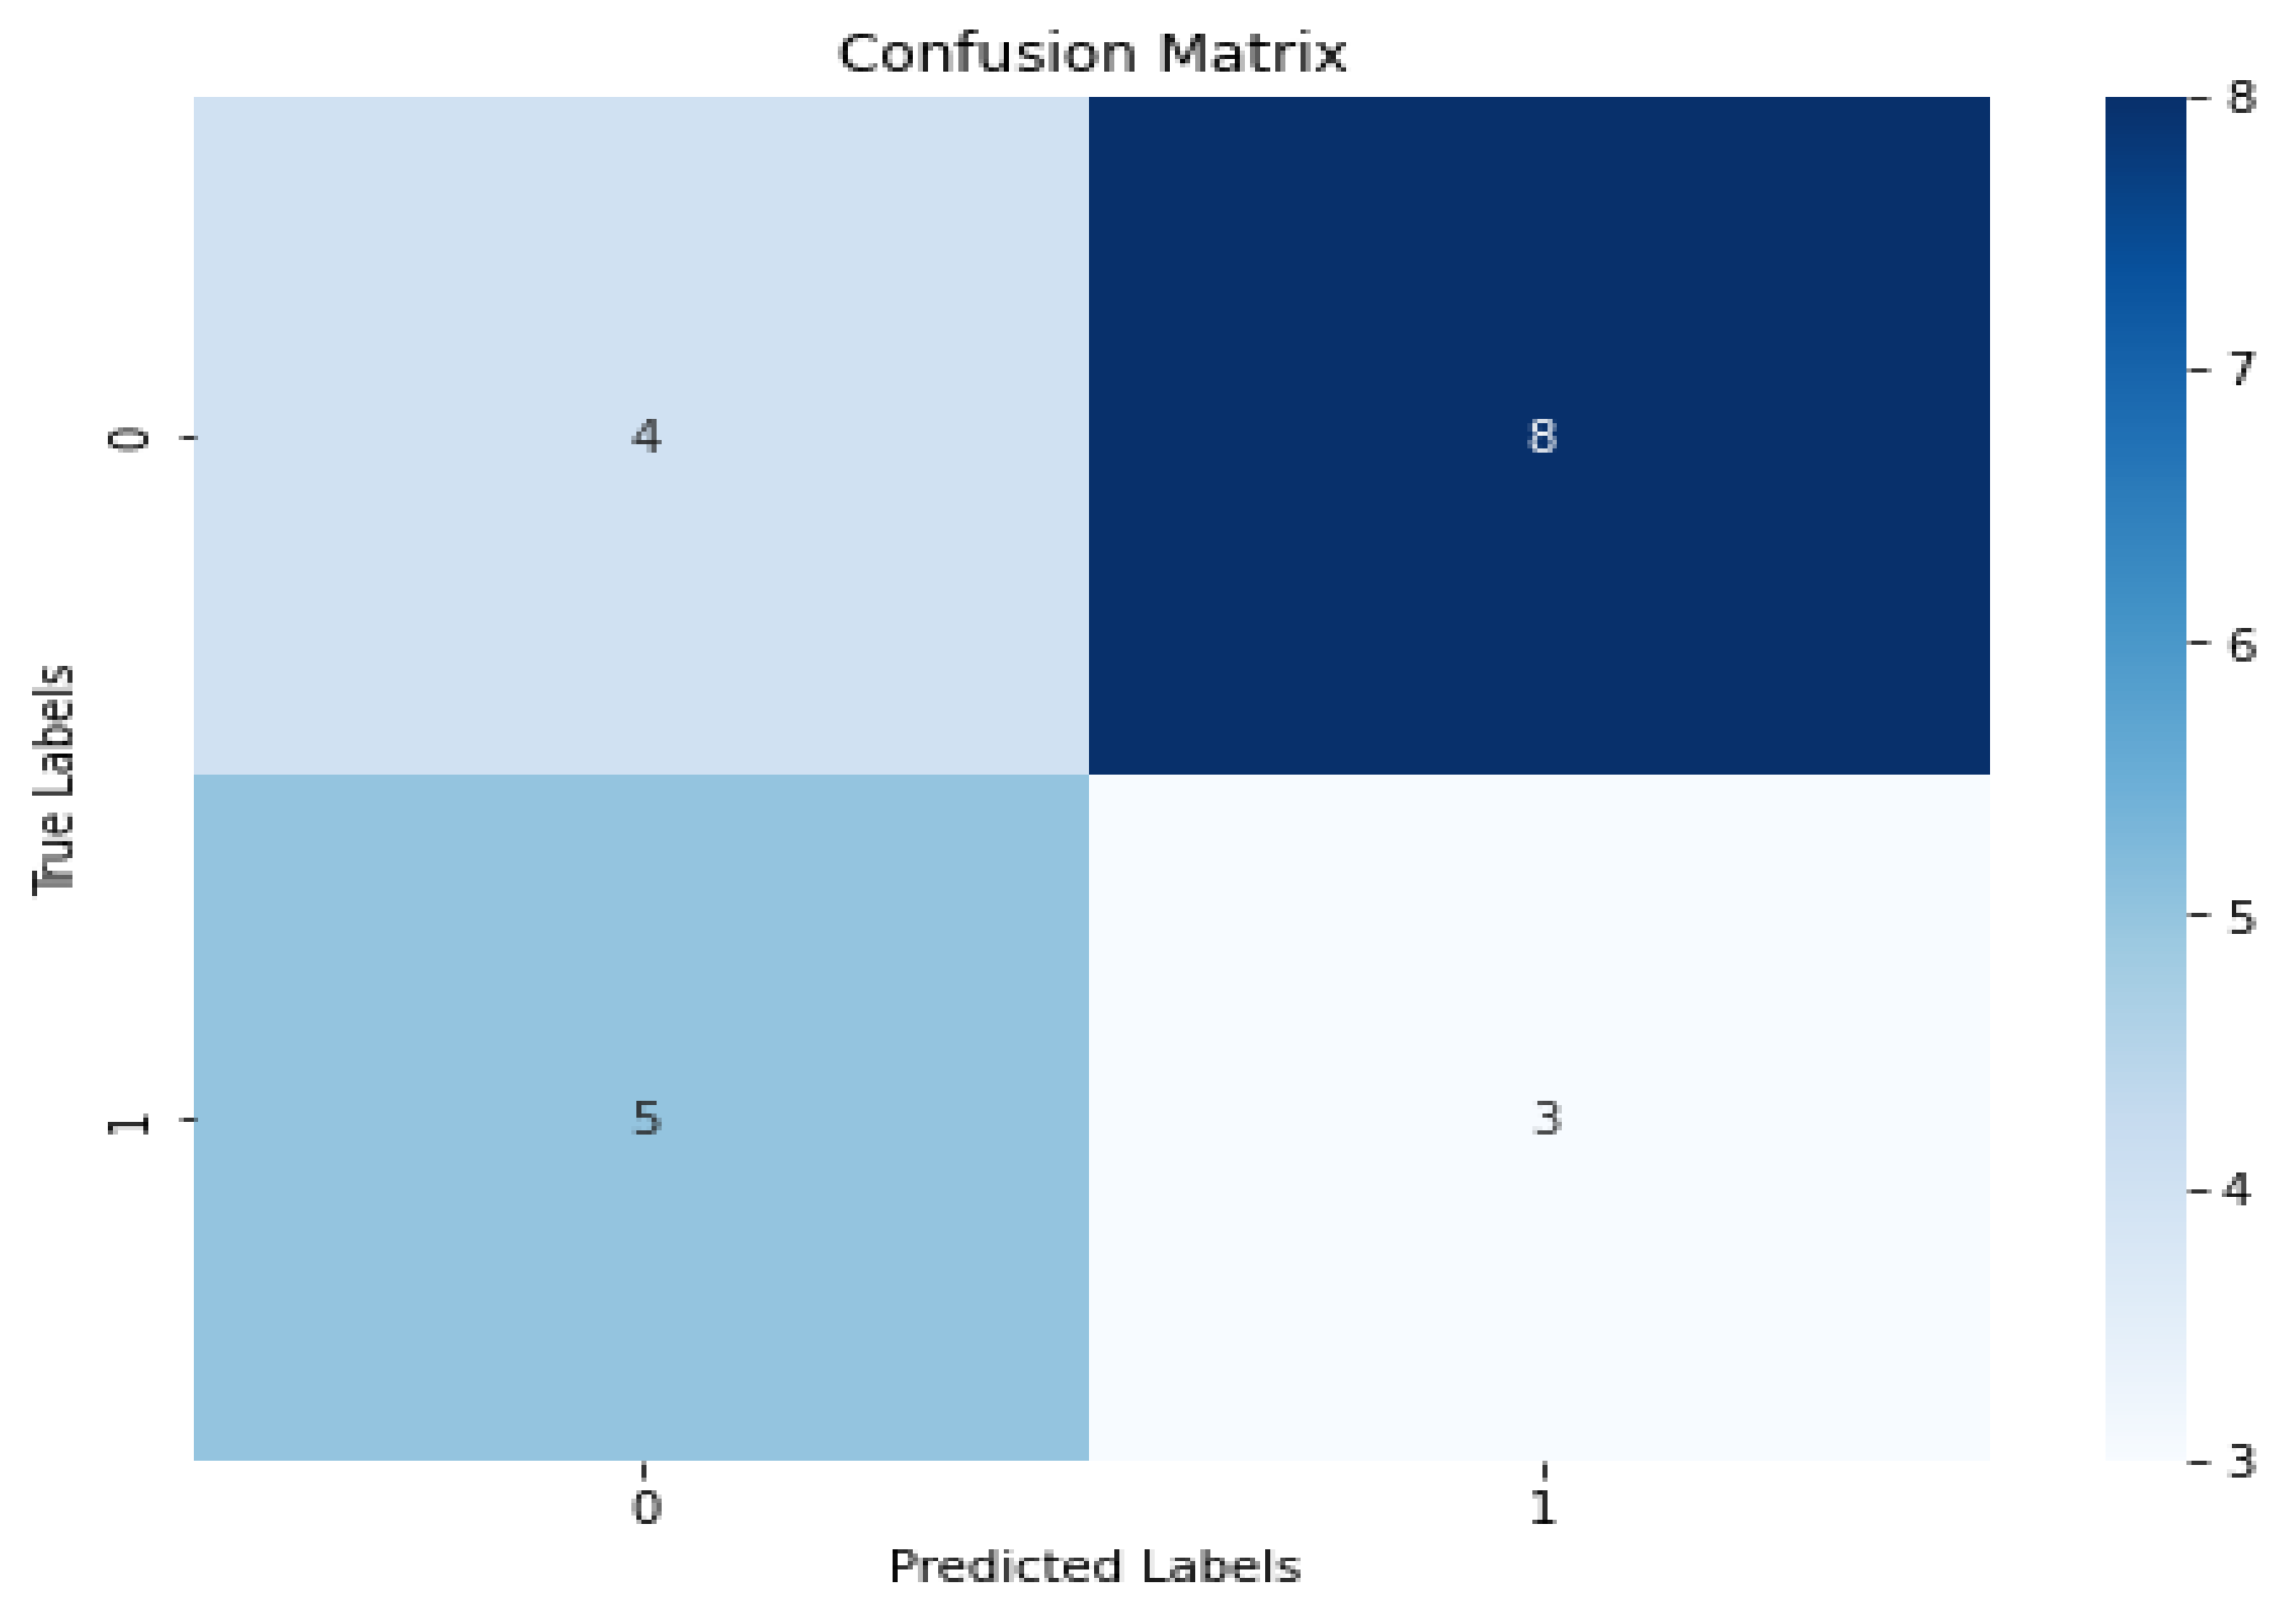
5.2.2. SVM Model
5.3. Mapping Analysis
6. Discussion
6.1. Key Findings and Implications
6.2. Limitations of Study
6.3. Future Prospects
7. Conclusions
Author Contributions
Funding
Institutional Review Board Statement
Informed Consent Statement
Data Availability Statement
Acknowledgments
Conflicts of Interest
Abbreviations
| Variables | Description |
| EV | Electric Vehicle |
| EVCSs | Electric Vehicles Charging Stations |
| EVSE | Electric vehicle supply equipment |
| EPRI | Electric Power Research Institute |
| SAE | Society of Automotive Engineers |
| MILP | Mixed Integer Linear Programming |
| PSO | Particle Swarm Optimization |
| ML | Machine Learning |
| RF | Random Forest |
| KNN | K-Nearest Neighbor |
| GB | Gradient Boost |
| SVM | Support Vector Machine |
| ANN | Artificial Neural Networks |
| MAE | Mean Absolute Error |
| RSME | Root Mean Square Error |
| TOU | Time of user |
| AUC-ROC | Area Under the Receiver Operating Characteristic Curve |
| NHTS | National Household Travel Survey |
| DOE | Department of Energy |
| AFDC | Alternative Fuels Data Center |
| OSM | OpenStreetMap |
| NOAA | National Oceanic and Atmospheric Administration |
| TPA | True positive of Class A |
| TPB | True positive of Class B |
| TPC | True positive of Class C |
| TP | True positive |
| FP | False positive |
| FN | False Negative |
| BEV | Battery electric vehicles |
| PHEV | Plug-in hybrid electric vehicles |
References
- Hao, L.; Cao, X.; Liu, Y.; Shao, Y.; Nan, Z.; Teng, L.; Peng, W.; Bian, J. Safety of hydrogen storage and transportation: An overview on mechanisms, techniques, and challenges. Energy Rep. 2022, 8, 6258–6269. [Google Scholar]
- Sanguesa, J.A.; Torres-Sanz, V.; Garrido, P.; Martinez, F.J.; Marquez-Barja, J.M. A review on electric vehicles: Technologies and challenges. Smart Cities 2021, 4, 372–404. [Google Scholar] [CrossRef]
- Costa, C.M.; Barbosa, J.C.; Castro, H.; Gonçalves, R.; Lanceros-Méndez, S. Electric vehicles: To what extent are environmentally friendly and cost effective?—Comparative study by European countries. Renew. Sustain. Energy Rev. 2021, 151, 111548. [Google Scholar] [CrossRef]
- Sun, X.; Li, Z.; Wang, X.; Li, C. Technology development of electric vehicles: A review. Energies 2019, 13, 90. [Google Scholar] [CrossRef]
- Panda, B.; Rajabi, M.S.; Rajaee, A. Applications of Machine Learning in the Planning of Electric Vehicle Charging Stations and Charging Infrastructure: A Review. In Handbook of Smart Energy Systems; Springer: Berlin/Heidelberg, Germany, 2022; pp. 1–19. [Google Scholar]
- Wu, Z.; Zhuang, Y.; Zhou, S.; Xu, S.; Yu, P.; Du, J.; Luo, X.; Abbas, G. Bi-level planning of multi-functional vehicle charging stations considering land use types. Energies 2020, 13, 1283. [Google Scholar] [CrossRef]
- Ramer, J. What is EVSE and why it matters to you. EV Connect, 14 February 2013; pp. 1–11. [Google Scholar]
- Smith, M.; Castellano, J. Costs Associated with Non-Residential Electric Vehicle Supply Equipment: Factors to Consider in the Implementation of Electric Vehicle Charging Stations; Technical Report DOE/EE-1289; U.S. Department of Energy Vehicle Technologies Office: Washington, DC, USA, 2015. [Google Scholar]
- Brooker, R.P.; Qin, N. Identification of potential locations of electric vehicle supply equipment. J. Power Sources 2015, 299, 76–84. [Google Scholar] [CrossRef]
- Morrissey, P.; Weldon, P.; O’Mahony, M. Future standard and fast charging infrastructure planning: An analysis of electric vehicle charging behaviour. Energy Policy 2016, 89, 257–270. [Google Scholar] [CrossRef]
- Luo, L.; Gu, W.; Zhou, S.; Huang, H.; Gao, S.; Han, J.; Wu, Z.; Dou, X. Optimal planning of electric vehicle charging stations comprising multi-types of charging facilities. Appl. Energy 2018, 226, 1087–1099. [Google Scholar] [CrossRef]
- Afshar, S.; Macedo, P.; Mohamed, F.; Disfani, V. Mobile charging stations for electric vehicles—A review. Renew. Sustain. Energy Rev. 2021, 152, 111654. [Google Scholar] [CrossRef]
- Broadbent, G.H.; Drozdzewski, D.; Metternicht, G. Electric vehicle adoption: An analysis of best practice pitfalls for policy making from experiences of Europe and the U.S. Geogr. Compass 2018, 12, e12358. [Google Scholar] [CrossRef]
- Brown, A.; Cappellucci, J.; White, E.; Heinrich, A.; Cost, E. Electric Vehicle Charging Infrastructure Trends from the Alternative Fueling Station Locator: First Quarter 2023; National Renewable Energy Laboratory (NREL): Golden, CO, USA, 2023. [Google Scholar]
- Xiong, Y.; Gan, J.; An, B.; Miao, C.; Bazzan, A.L. Optimal electric vehicle fast charging station placement based on game theoretical framework. IEEE Trans. Intell. Transp. Syst. 2017, 19, 2493–2504. [Google Scholar] [CrossRef]
- Chen, T.; Zhang, X.P.; Wang, J.; Li, J.; Wu, C.; Hu, M.; Bian, H. A review on electric vehicle charging infrastructure development in the UK. J. Mod. Power Syst. Clean Energy 2020, 8, 193–205. [Google Scholar] [CrossRef]
- Hall, D.; Lutsey, N. Emerging Best Practices for Electric Vehicle Charging Infrastructure; The International Council on Clean Transportation (ICCT): Washington, DC, USA, 2017; p. 54. [Google Scholar]
- Marcantonio, R.A.; Golub, A.; Karner, A.; Nelson Dyhle, L. Confronting inequality in metropolitan regions: Realizing the promise of civil rights and environmental justice in metropolitan transportation planning. Fordham Urb. LJ 2017, 44, 1017. [Google Scholar]
- Adepetu, A.; Keshav, S. The relative importance of price and driving range on electric vehicle adoption: Los Angeles case study. Transportation 2017, 44, 353–373. [Google Scholar] [CrossRef]
- She, Z.Y.; Sun, Q.; Ma, J.J.; Xie, B.C. What are the barriers to widespread adoption of battery electric vehicles? A survey of public perception in Tianjin, China. Transp. Policy 2017, 56, 29–40. [Google Scholar] [CrossRef]
- Kong, W.; Luo, Y.; Feng, G.; Li, K.; Peng, H. Optimal location planning method of fast charging station for electric vehicles considering operators, drivers, vehicles, traffic flow and power grid. Energy 2019, 186, 115826. [Google Scholar] [CrossRef]
- Tarafdar-Hagh, M.; Taghizad-Tavana, K.; Ghanbari-Ghalehjoughi, M.; Nojavan, S.; Jafari, P.; Mohammadpour Shotorbani, A. Optimizing Electric Vehicle Operations for a Smart Environment: A Comprehensive Review. Energies 2023, 16, 4302. [Google Scholar] [CrossRef]
- Taghizad-Tavana, K.; Alizadeh, A.A.; Ghanbari-Ghalehjoughi, M.; Nojavan, S. A comprehensive review of electric vehicles in energy systems: Integration with renewable energy sources, charging levels, different types, and standards. Energies 2023, 16, 630. [Google Scholar] [CrossRef]
- Islam, M.M.; Shareef, H.; Mohamed, A. A review of techniques for optimal placement and sizing of electric vehicle charging stations. Elect. Rev. 2015, 91, 122–126. [Google Scholar] [CrossRef]
- Valipour, E.; Nourollahi, R.; Taghizad-Tavana, K.; Nojavan, S.; Alizadeh, A.A. Risk assessment of industrial energy hubs and peer-to-peer heat and power transaction in the presence of electric vehicles. Energies 2022, 15, 8920. [Google Scholar] [CrossRef]
- Ahmad, F.; Iqbal, A.; Ashraf, I.; Marzband, M. Optimal location of electric vehicle charging station and its impact on distribution network: A review. Energy Rep. 2022, 8, 2314–2333. [Google Scholar] [CrossRef]
- Zeb, M.Z.; Imran, K.; Khattak, A.; Janjua, A.K.; Pal, A.; Nadeem, M.; Zhang, J.; Khan, S. Optimal placement of electric vehicle charging stations in the active distribution network. IEEE Access 2020, 8, 68124–68134. [Google Scholar] [CrossRef]
- Deb, S.; Tammi, K.; Kalita, K.; Mahanta, P. Review of recent trends in charging infrastructure planning for electric vehicles. Wiley Interdiscip. Rev. Energy Environ. 2018, 7, e306. [Google Scholar] [CrossRef]
- Liu, J.P.; Zhang, T.X.; Zhu, J.; Ma, T.N. Allocation optimization of electric vehicle charging station (EVCS) considering with charging satisfaction and distributed renewables integration. Energy 2018, 164, 560–574. [Google Scholar] [CrossRef]
- Lin, H.; Bian, C.; Li, H.; Sun, Q.; Wennersten, R. Optimal siting and sizing of public charging stations in urban area. In Proceedings of the 2018 Joint International Conference on Energy, Ecology and Environment (ICEEE 2018), Melbourne, Australia, 21–25 November 2018. [Google Scholar]
- Carra, M.; Maternini, G.; Barabino, B. On sustainable positioning of electric vehicle charging stations in cities: An integrated approach for the selection of indicators. Sustain. Cities Soc. 2022, 85, 104067. [Google Scholar] [CrossRef]
- Wang, J.; Alshahir, A.; Abbas, G.; Kaaniche, K.; Albekairi, M.; Alshahr, S.; Aljarallah, W.; Sahbani, A.; Nowakowski, G.; Sieja, M. A Deep Recurrent Learning-Based Region-Focused Feature Detection for Enhanced Target Detection in Multi-Object Media. Sensors 2023, 23, 7556. [Google Scholar] [CrossRef]
- Dong, J.; Liu, C.; Lin, Z. Charging infrastructure planning for promoting battery electric vehicles: An activity-based approach using multiday travel data. Transp. Res. Part C Emerg. Technol. 2014, 38, 44–55. [Google Scholar] [CrossRef]
- Dai, C.; Wang, Y.; Ye, M. A new multi-objective particle swarm optimization algorithm based on decomposition. Inf. Sci. 2015, 325, 541–557. [Google Scholar] [CrossRef]
- Zhang, Y.; Zhang, Q.; Farnoosh, A.; Chen, S.; Li, Y. GIS-based multi-objective particle swarm optimization of charging stations for electric vehicles. Energy 2019, 169, 844–853. [Google Scholar] [CrossRef]
- Pevec, D.; Babic, J.; Kayser, M.A.; Carvalho, A.; Ghiassi-Farrokhfal, Y.; Podobnik, V. A data-driven statistical approach for extending electric vehicle charging infrastructure. Int. J. Energy Res. 2018, 42, 3102–3120. [Google Scholar] [CrossRef]
- Ullah, I.; Liu, K.; Yamamoto, T.; Zahid, M.; Jamal, A. Prediction of electric vehicle charging duration time using ensemble machine learning algorithm and Shapley additive explanations. Int. J. Energy Res. 2022, 46, 15211–15230. [Google Scholar] [CrossRef]
- Shahriar, S.; Al-Ali, A.R.; Osman, A.H.; Dhou, S.; Nijim, M. Machine learning approaches for EV charging behavior: A review. IEEE Access 2020, 8, 168980–168993. [Google Scholar] [CrossRef]
- Abdullah, H.M.; Gastli, A.; Ben-Brahim, L. Reinforcement learning based EV charging management systems—A review. IEEE Access 2021, 9, 41506–41531. [Google Scholar] [CrossRef]
- Rolnick, D.; Donti, P.L.; Kaack, L.H.; Kochanski, K.; Lacoste, A.; Sankaran, K.; Ross, A.S.; Milojevic-Dupont, N.; Jaques, N.; Waldman-Brown, A.; et al. Tackling climate change with machine learning. ACM Comput. Surv. CSUR 2022, 55, 1–96. [Google Scholar] [CrossRef]
- Karamshuk, D.; Noulas, A.; Scellato, S.; Nicosia, V.; Mascolo, C. Geo-spotting: Mining online location-based services for optimal retail store placement. In Proceedings of the 19th ACM SIGKDD International Conference on Knowledge Discovery and Data Mining, Chicago, IL, USA, 11–14 August 2013. [Google Scholar]
- Verma, A.; Asadi, A.; Yang, K.; Tyagi, S. A data-driven approach to identify households with plug-in electrical vehicles (PEVs). Appl. Energy 2015, 160, 71–79. [Google Scholar] [CrossRef]
- Majidpour, M.; Qiu, C.; Chu, P.; Gadh, R.; Pota, H.R. Fast prediction for sparse time series: Demand forecast of EV charging stations for cell phone applications. IEEE Trans. Ind. Inform. 2014, 11, 242–250. [Google Scholar] [CrossRef]
- Straka, M.; De Falco, P.; Ferruzzi, G.; Proto, D.; Van Der Poel, G.; Khormali, S.; Buzna, L. Predicting popularity of electric vehicle charging infrastructure in urban context. IEEE Access 2020, 8, 11315–11327. [Google Scholar] [CrossRef]
- Zhang, X. Short-term load forecasting for electric bus charging stations based on fuzzy clustering and least squares support vector machine optimized by wolf pack algorithm. Energies 2018, 11, 1449. [Google Scholar] [CrossRef]
- Ramachandran, A.; Balakrishna, A.; Kundzicz, P.; Neti, A. Predicting electric vehicle charging station usage: Using machine learning to estimate individual station statistics from physical configurations of charging station networks. arXiv 2018, arXiv:1804.00714. [Google Scholar]
- Lucas, A.; Barranco, R.; Refa, N. EV idle time estimation on charging infrastructure, comparing supervised machine learning regressions. Energies 2019, 12, 269. [Google Scholar] [CrossRef]
- Almaghrebi, A.; Aljuheshi, F.; Rafaie, M.; James, K.; Alahmad, M. Data-driven charging demand prediction at public charging stations using supervised machine learning regression methods. Energies 2020, 13, 4231. [Google Scholar] [CrossRef]
- Dang, Q.; Wu, D.; Boulet, B. Ev charging management with ann-based electricity price forecasting. In Proceedings of the 2020 IEEE Transportation Electrification Conference & Expo (ITEC), Chicago, IL, USA, 23–26 June 2020; IEEE: Piscataway, NJ, USA, 2020. [Google Scholar]
- Worlddata. Statistics and Data of All Countries in America. Available online: https://www.worlddata.info/america/index.php (accessed on 2 November 2023).
- Zhou, H.; Yao, F.; Zhang, H. Functional linear regression for discretely observed data: From ideal to reality. Biometrika 2023, 110, 381–393. [Google Scholar] [CrossRef]
- James, G.; Witten, D.; Hastie, T.; Tibshirani, R.; Taylor, J. Linear regression. In An Introduction to Statistical Learning: With Applications in Python; Springer: Berlin/Heidelberg, Germany, 2023; pp. 69–134. [Google Scholar]
- Borlaug, B.; Yang, F.; Pritchard, E.; Wood, E.; Gonder, J. Public electric vehicle charging station utilization in the United States. Transp. Res. Part D Transp. Environ. 2023, 114, 103564. [Google Scholar] [CrossRef]
- Patil, S.D.; Satheesh, S.; Seema, S.M.; Chowdary, R.M. Linear Regression Based Demand Forecast Model in Electric Vehicles-LRDF. Int. J. Hum. Comput. Intell. 2023, 2, 82–93. [Google Scholar]
- Chauhan, V.K.; Dahiya, K.; Sharma, A. Problem formulations and solvers in linear SVM: A review. Artif. Intell. Rev. 2019, 52, 803–855. [Google Scholar] [CrossRef]
- Salam, S.; Veni, G.K.; Kamale, C.; Deepika, A.L.; Bruhathi, A. Forecasting the Behavior of EV Charging Using Machine Learning. In Proceedings of the 2023 9th International Conference on Advanced Computing and Communication Systems (ICACCS), Tamil Nadu, India, 17–18 March 2023; IEEE: Piscataway, NJ, USA, 2023. [Google Scholar]
- Zhou, J.; Gandomi, A.H.; Chen, F.; Holzinger, A. Evaluating the quality of machine learning explanations: A survey on methods and metrics. Electronics 2021, 10, 593. [Google Scholar] [CrossRef]
- Raschka, S. Model evaluation, model selection, and algorithm selection in machine learning. arXiv 2018, arXiv:1811.12808. [Google Scholar]


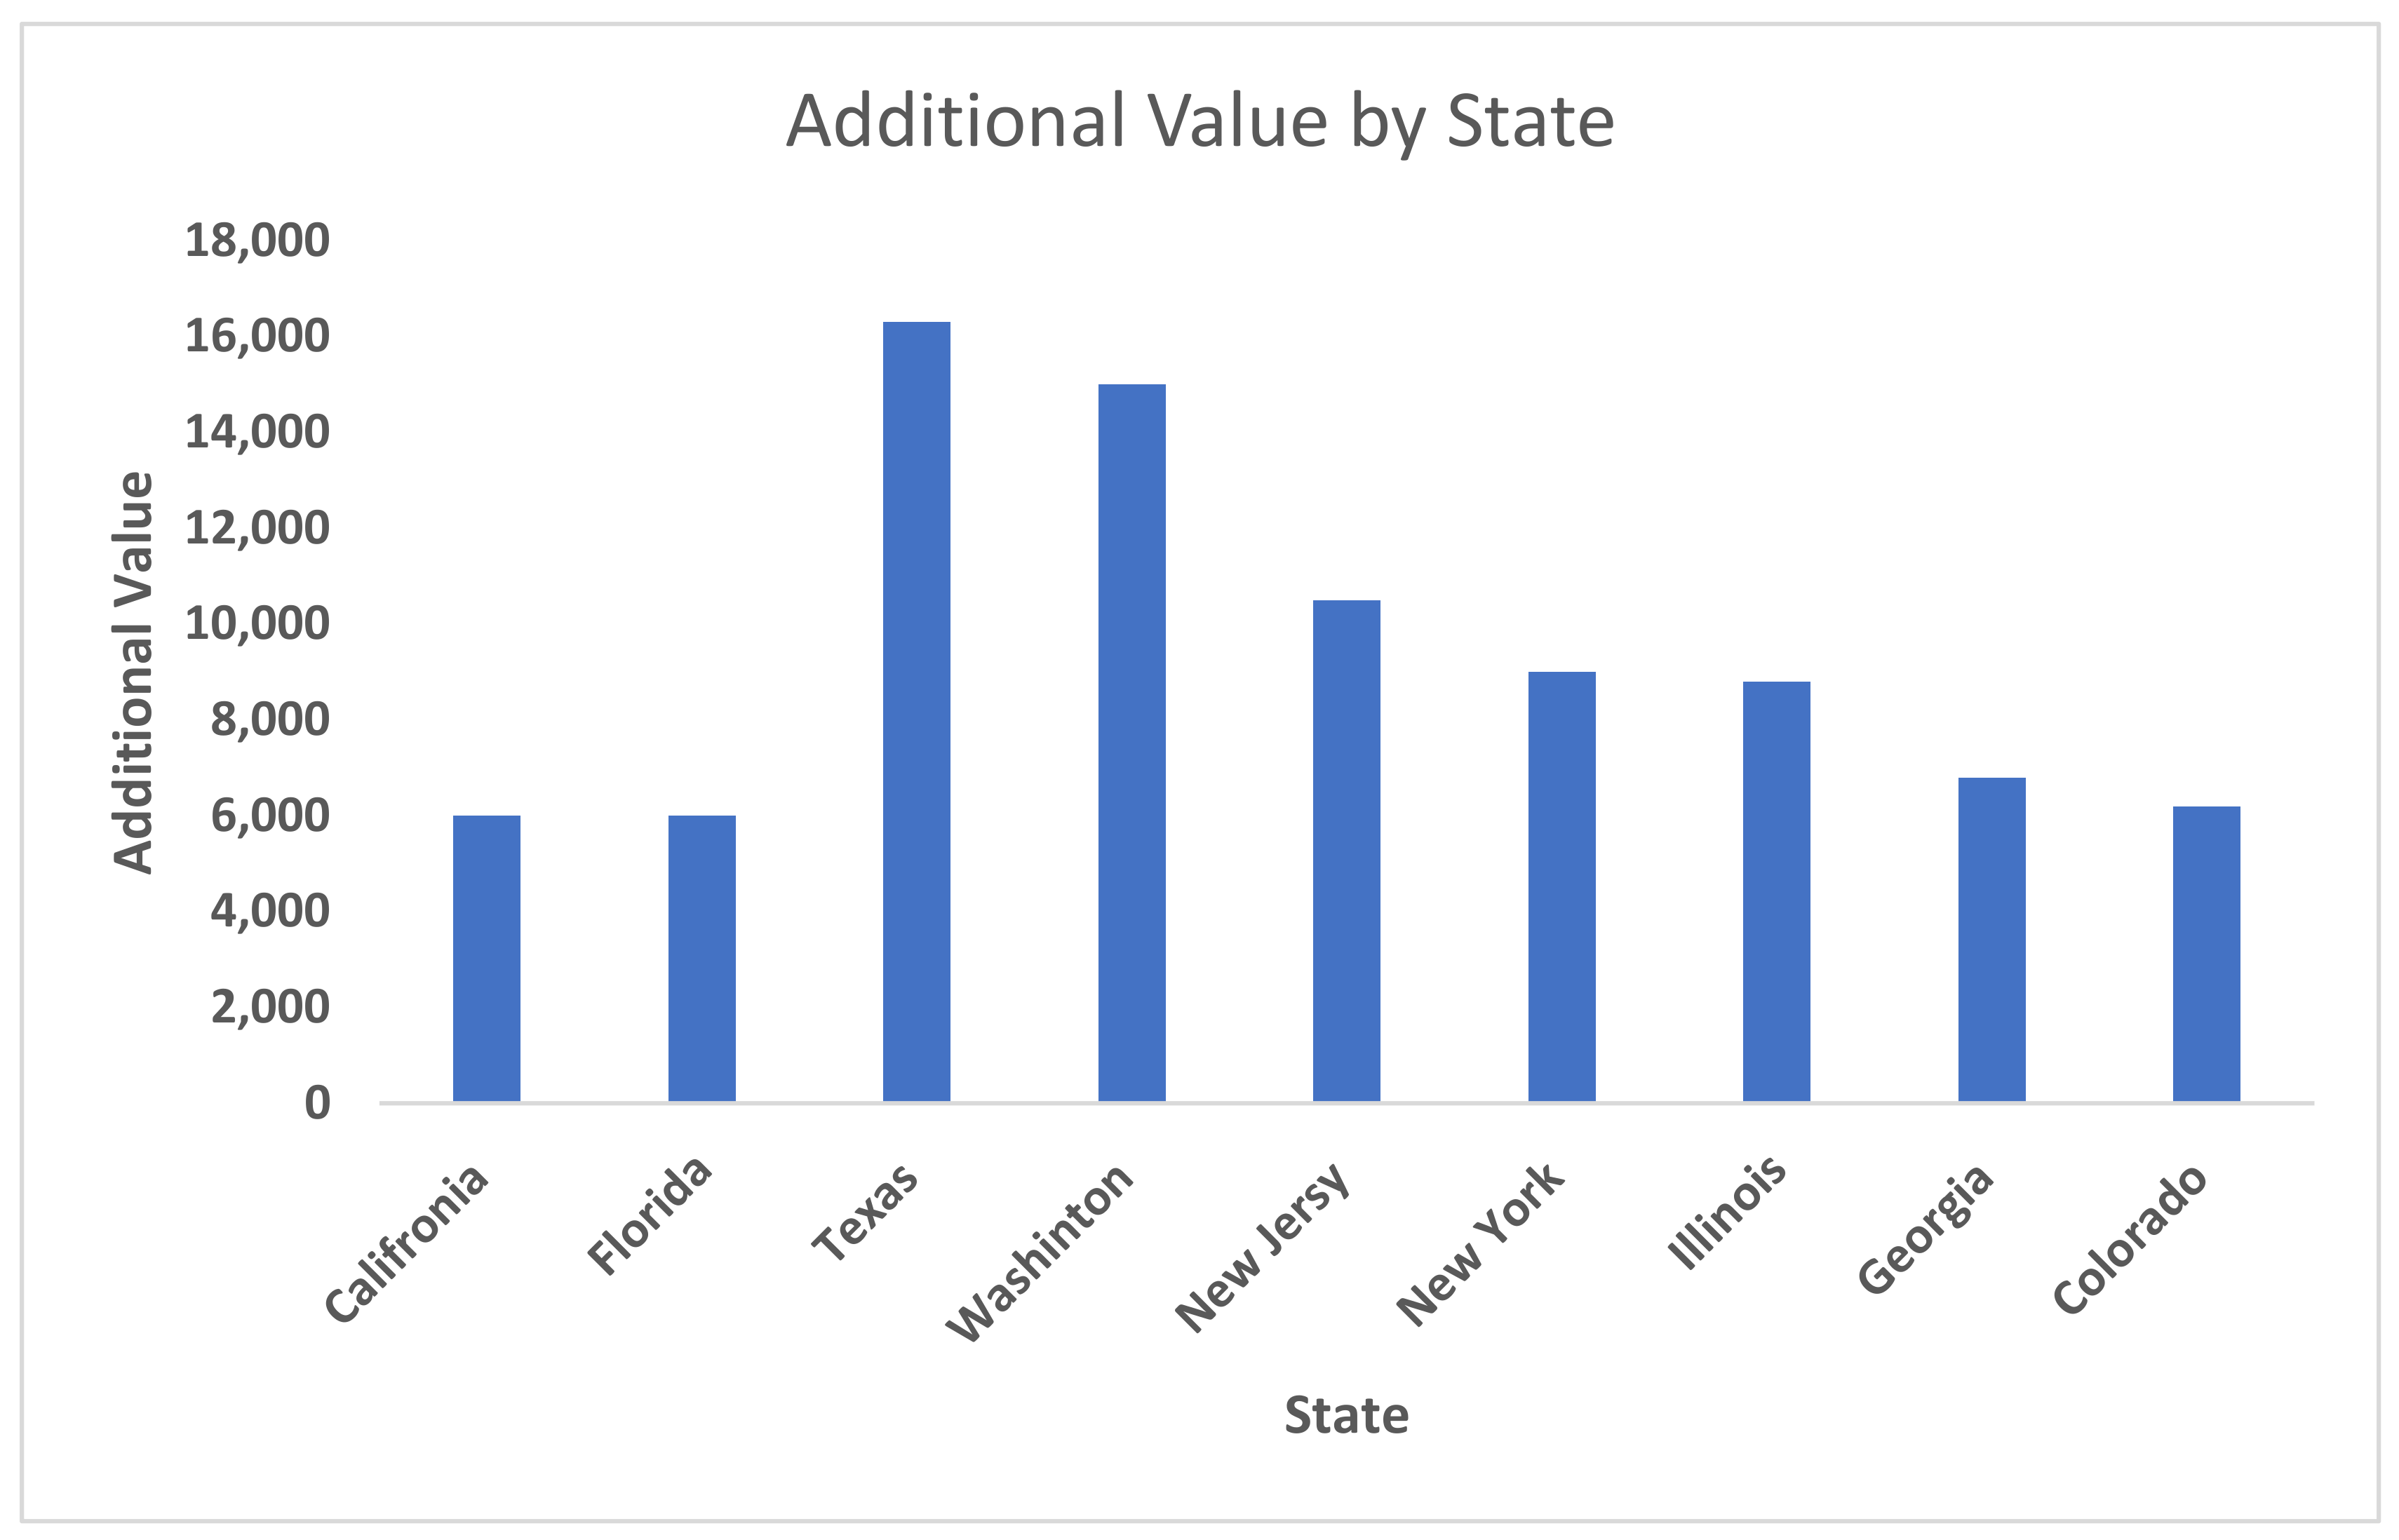
| States | % of Area | % of EVs | % of EVCSs | % of Energy Generation | % of Energy Cost | Mean Family Income |
|---|---|---|---|---|---|---|
| California | 19 | 54 | 47 | 12 | 18 | 12 |
| Florida | 8 | 10 | 9 | 14 | 10 | 9 |
| Texas | 32 | 9 | 9 | 30 | 8 | 10 |
| Washington | 8 | 6 | 6 | 7 | 8 | 12 |
| New Jersey | 1 | 5 | 3 | 4 | 13 | 13 |
| New York | 6 | 5 | 11 | 8 | 15 | 12 |
| Illinois | 7 | 4 | 4 | 13 | 9 | 11 |
| Georgia | 7 | 4 | 5 | 8 | 9 | 10 |
| Colorado | 12 | 3 | 6 | 4 | 10 | 11 |
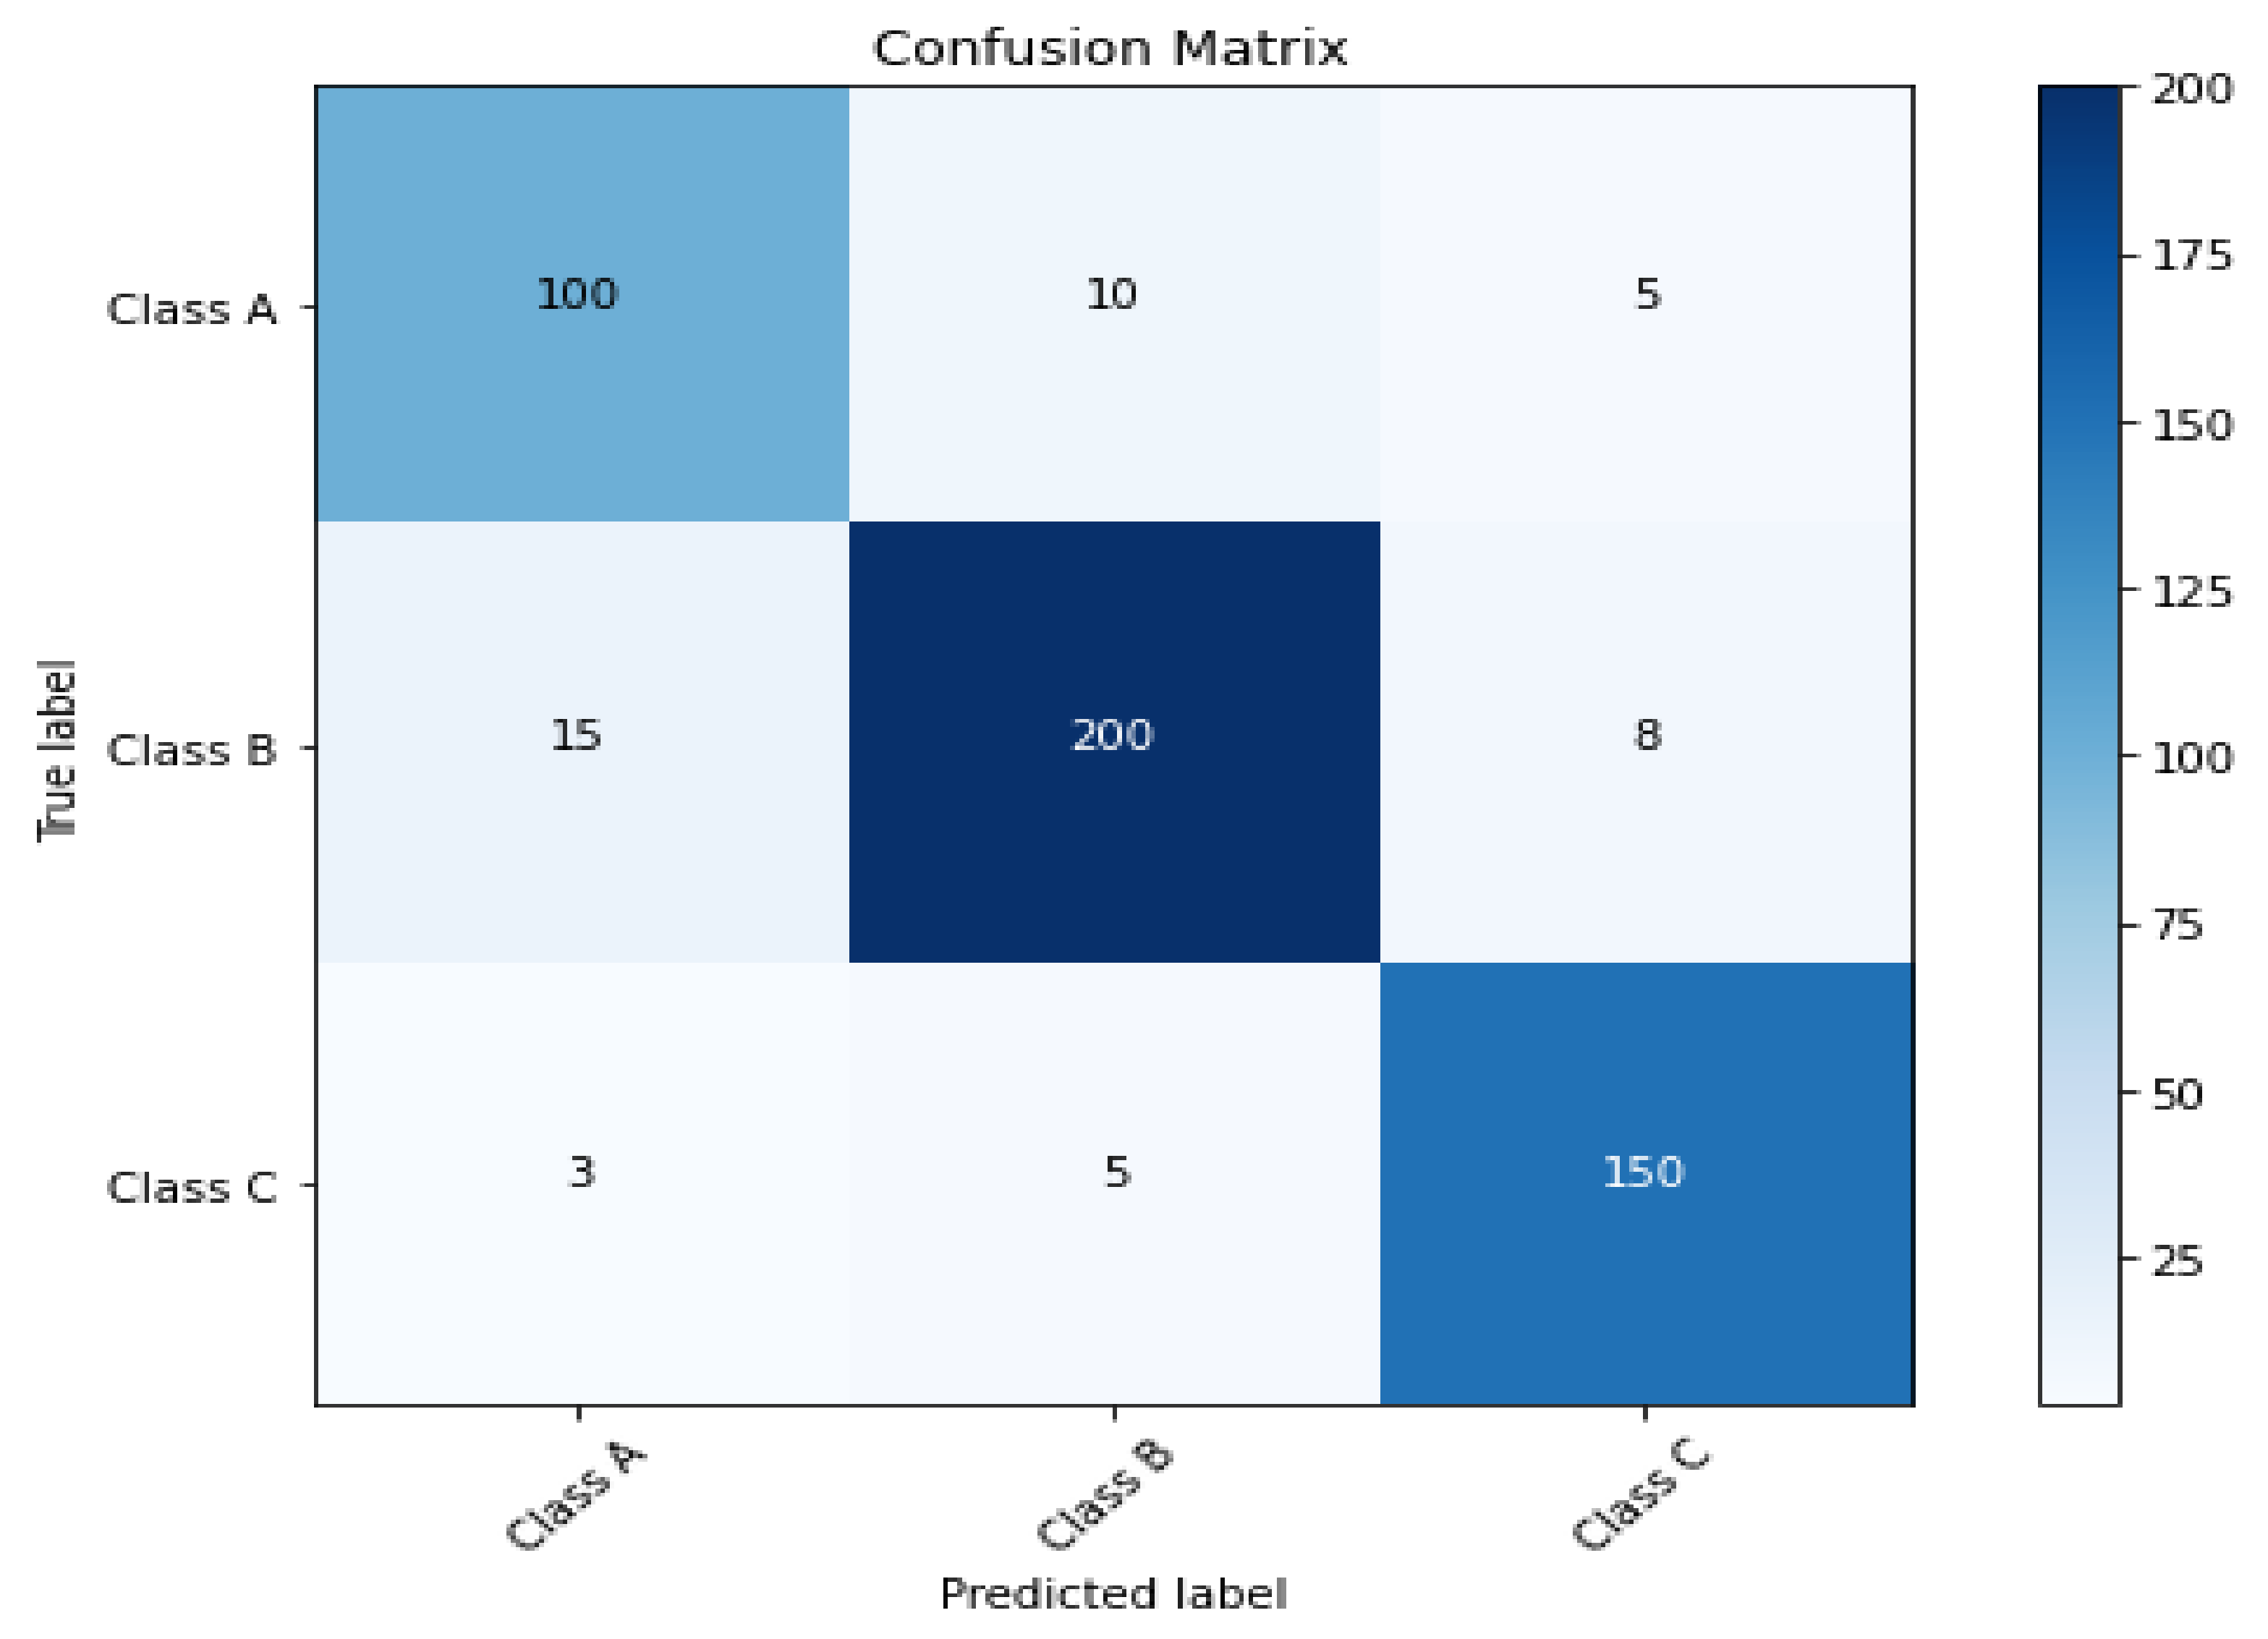
| Model | Accuracy | Precision | Recall | F1-Score |
|---|---|---|---|---|
| Linear Regression | 90% | 94% | 89% | 91% |
| SVM | 35% | 27% | 38% | 32% |
| Author | Model | Findings | Reference |
|---|---|---|---|
| Verma et al., 2015 | KNN, RFA | 79.28% and 84.95% accuracy indicated by KNN and RFA for forecasting household plug-in vehicles. | [42] |
| Majidpour et al., 2014 | KNN | KNN showed better prediction of energy consumption by EVs with 1 h granularity and 24 h horizon of prediction. | [43] |
| Straka et al., 2020 | Logistic regression, GB, RF | All models showed more than 80% accuracy in prediction of CSs. | [44] |
| Zhang et al., 2018 | Fuzzy clustering (FC), LSSVM, Wolf pack algorithm (WPA) | FC-WPA-LSSVM indicated higher forecasting ability of e-bus charging stations load with 2.07–2.29 RMSE | [45] |
| Ramachandran et al., 2018 | Neural networks | 0.2–0.3% error in predicting power statistics for individual EVSEs | [46] |
| Lucas et al., 2019 | RF, GB, XGBoost | XGBoost outperformed for estimating idle time on CSs with 1.11 mean absolute error. | [47] |
| Almaghrebi et al., 2020 | XGB, SVM, RF | XGB had greater efficiency in predicting charging demand with RMSE of 6.68 kW/h. | [48] |
| This study | Linear regression, SVM | Linear regression outperformed in optimized placement of EVCSs with 90% accuracy and 94% precision. This study elaborates on the factors influencing CS demand. |
Disclaimer/Publisher’s Note: The statements, opinions and data contained in all publications are solely those of the individual author(s) and contributor(s) and not of MDPI and/or the editor(s). MDPI and/or the editor(s) disclaim responsibility for any injury to people or property resulting from any ideas, methods, instructions or products referred to in the content. |
© 2023 by the authors. Licensee MDPI, Basel, Switzerland. This article is an open access article distributed under the terms and conditions of the Creative Commons Attribution (CC BY) license (https://creativecommons.org/licenses/by/4.0/).
Share and Cite
Alanazi, F.; Alshammari, T.O.; Azam, A. Optimal Charging Station Placement and Scheduling for Electric Vehicles in Smart Cities. Sustainability 2023, 15, 16030. https://doi.org/10.3390/su152216030
Alanazi F, Alshammari TO, Azam A. Optimal Charging Station Placement and Scheduling for Electric Vehicles in Smart Cities. Sustainability. 2023; 15(22):16030. https://doi.org/10.3390/su152216030
Chicago/Turabian StyleAlanazi, Fayez, Talal Obaid Alshammari, and Abdelhalim Azam. 2023. "Optimal Charging Station Placement and Scheduling for Electric Vehicles in Smart Cities" Sustainability 15, no. 22: 16030. https://doi.org/10.3390/su152216030
APA StyleAlanazi, F., Alshammari, T. O., & Azam, A. (2023). Optimal Charging Station Placement and Scheduling for Electric Vehicles in Smart Cities. Sustainability, 15(22), 16030. https://doi.org/10.3390/su152216030