
Electric Taxi Charging Load Prediction Based on Trajectory Data and Reinforcement Learning—A Case Study of Shenzhen Municipality

Abstract
1. Introduction
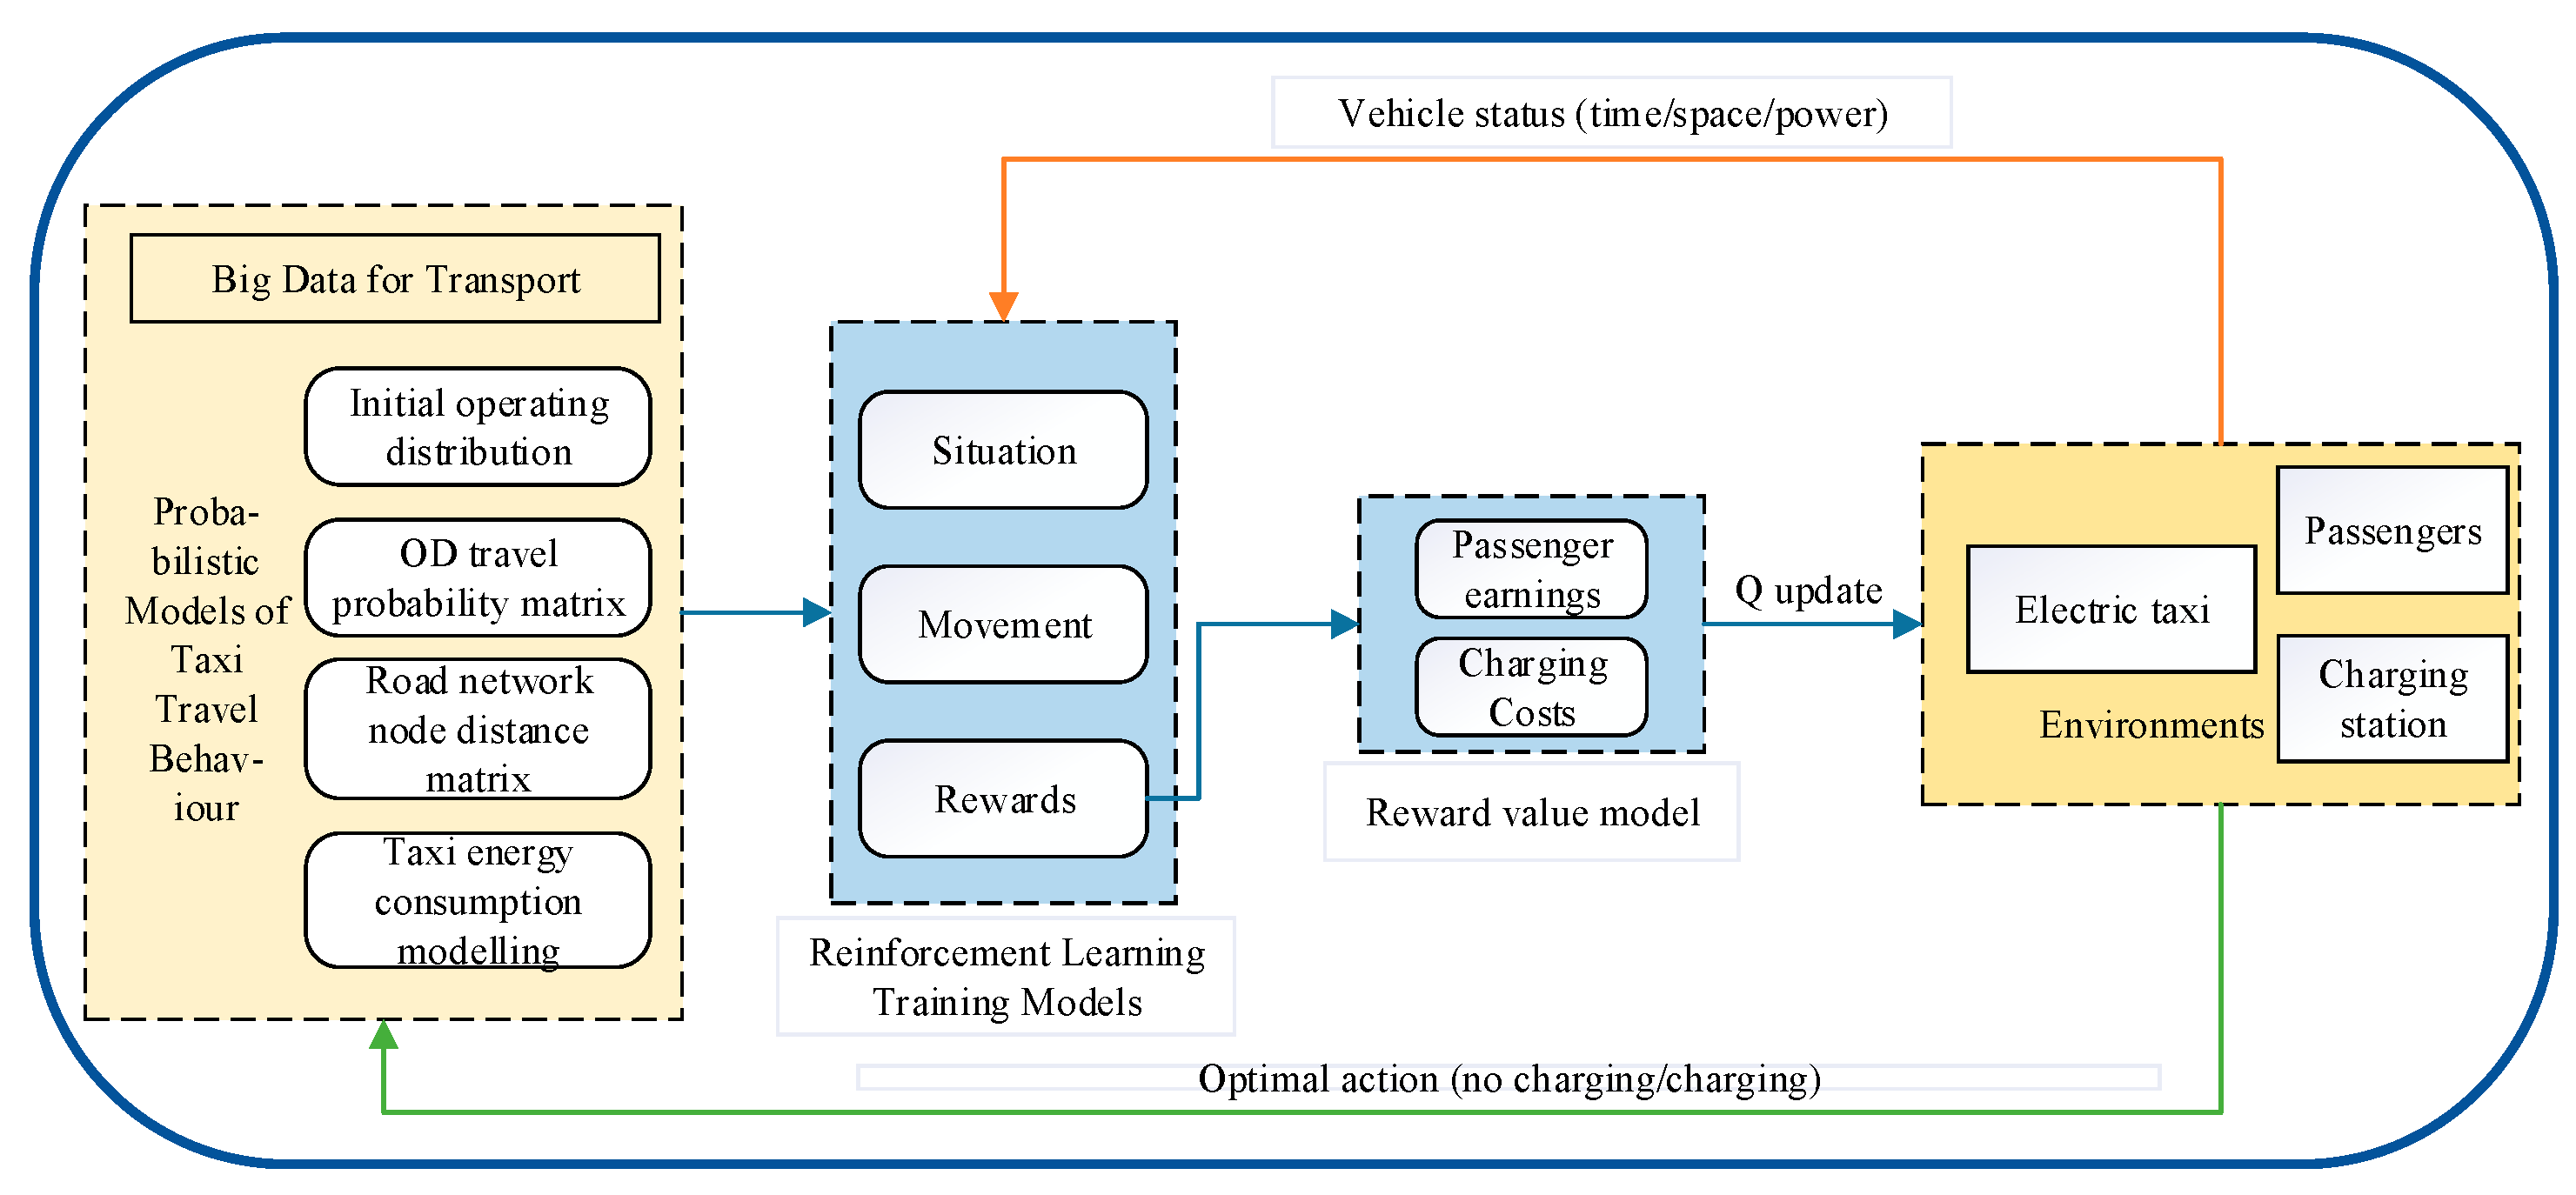
2. General Framework
3. Spatio-Temporal Probability of Electric Taxi Travel Behaviour Based on Trajectory Data
3.1. Data Preprocessing
3.1.1. Cleaning of Anomalous Data
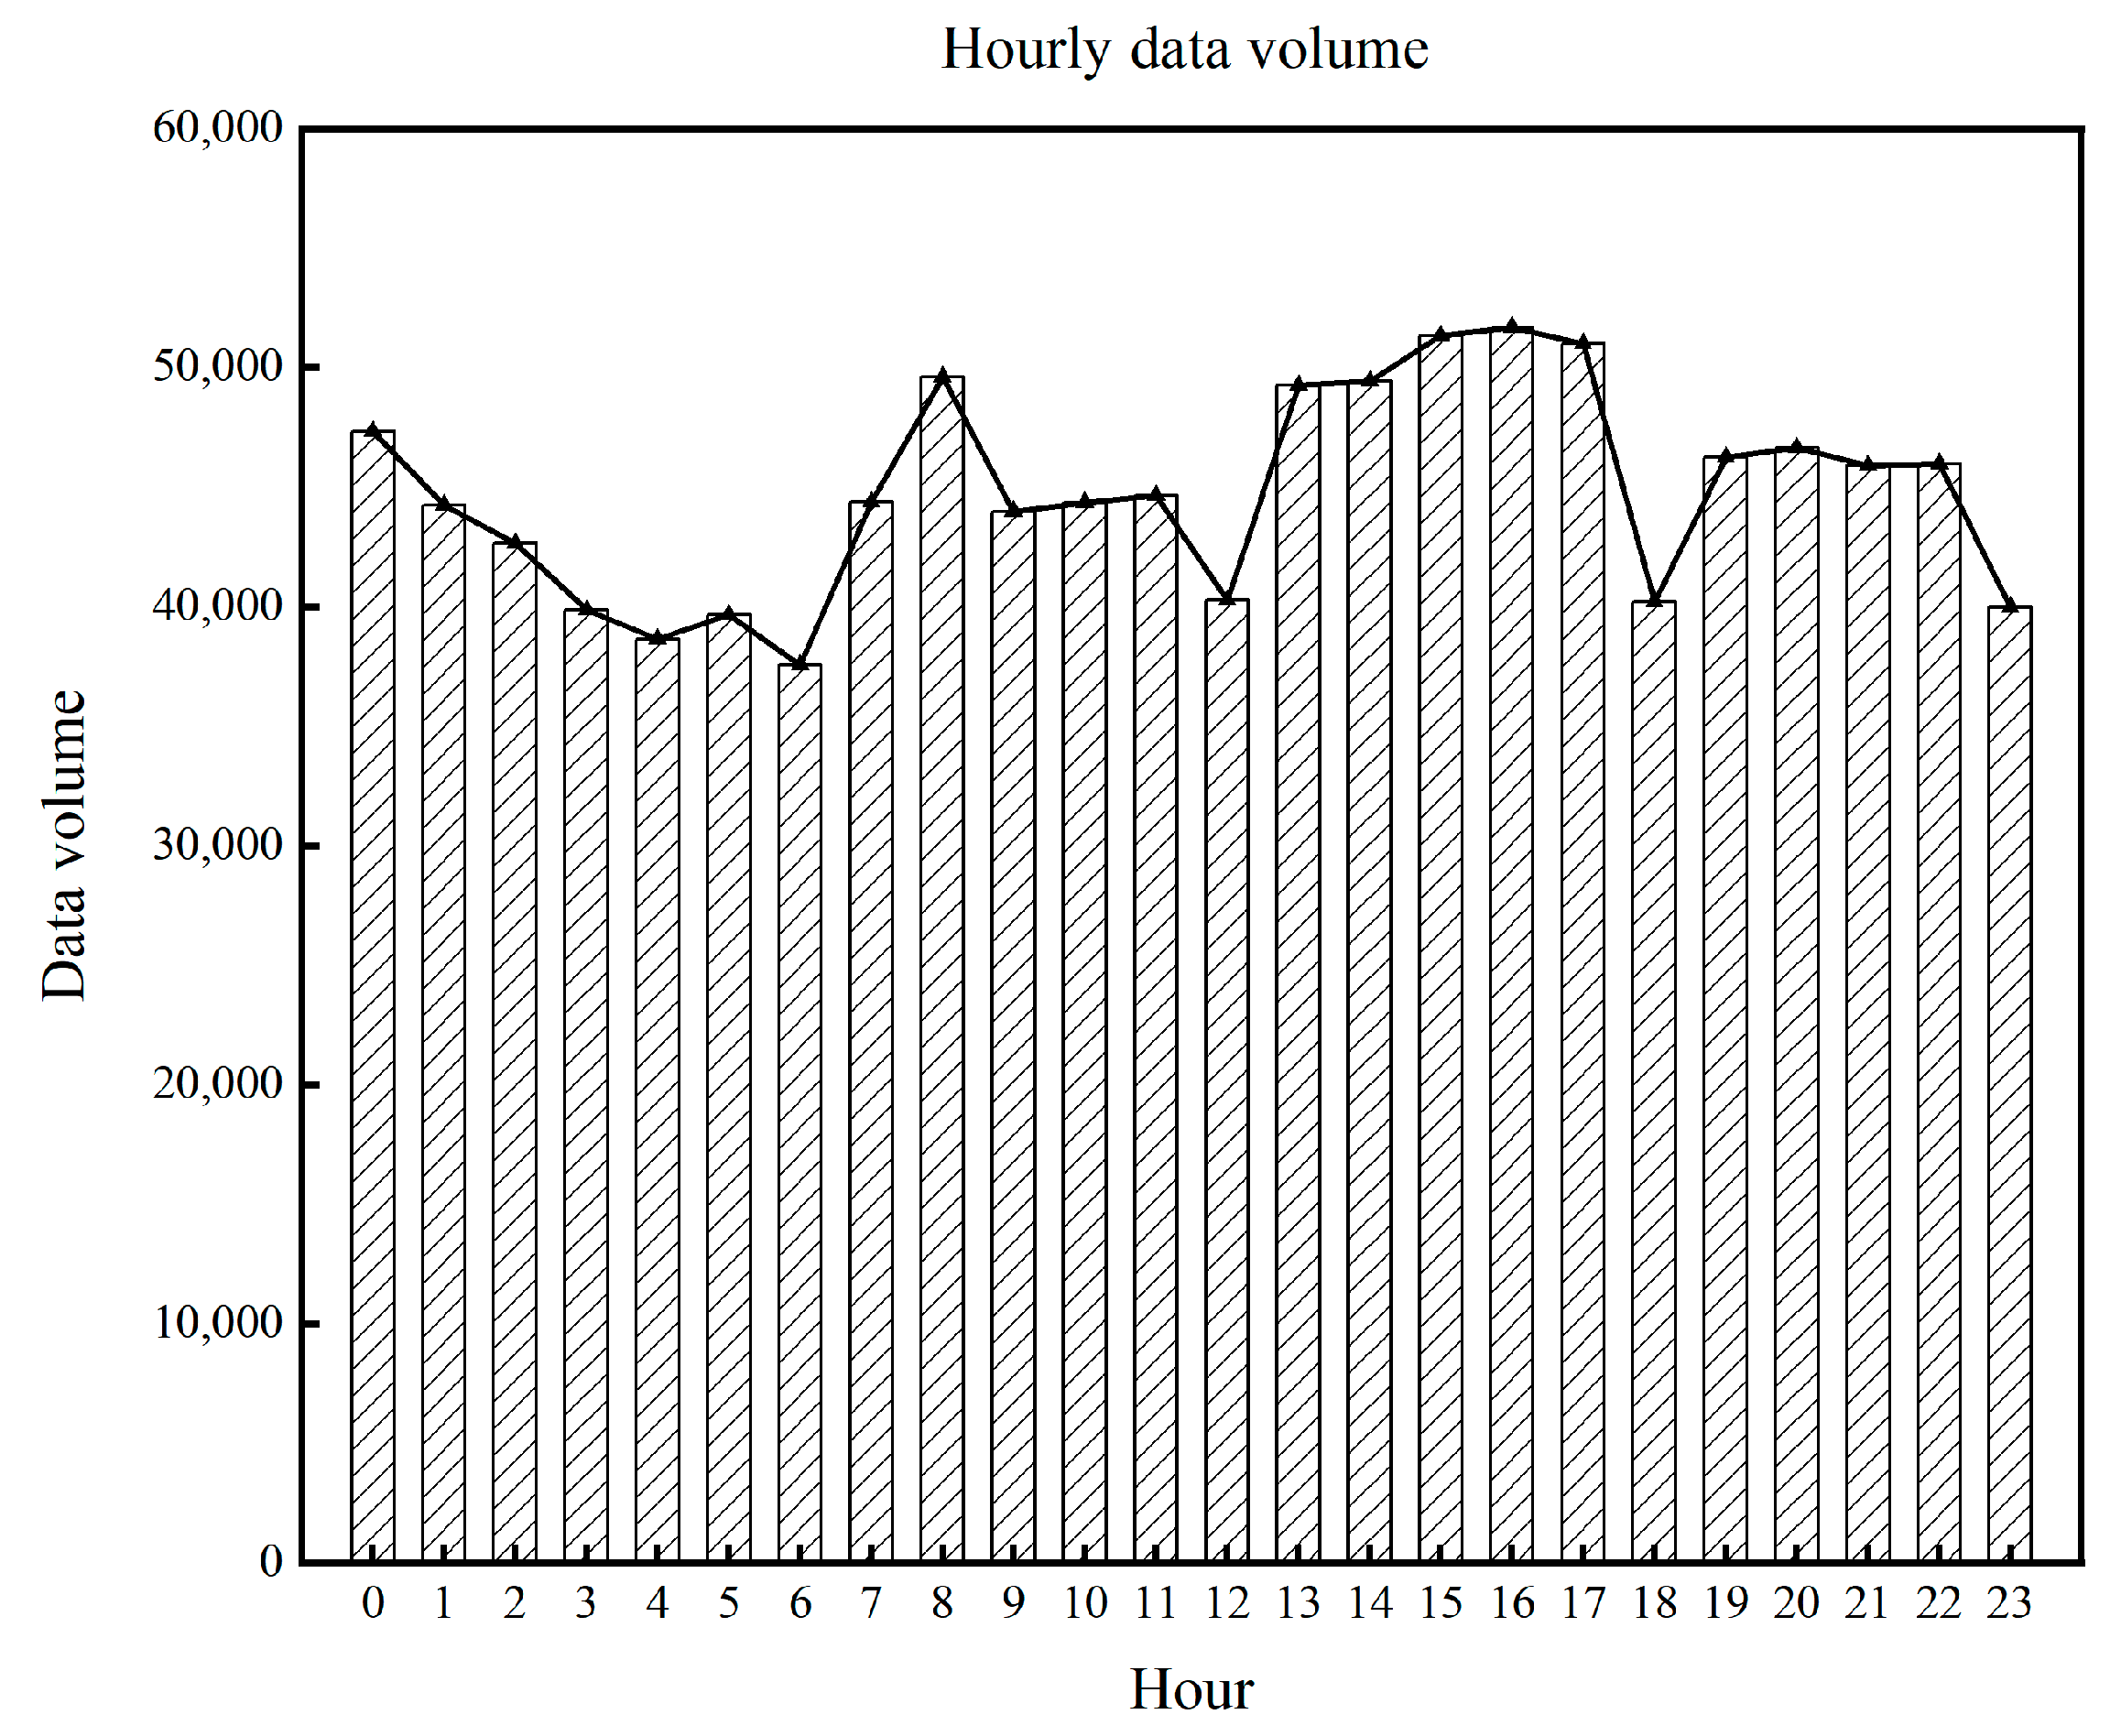
3.1.2. Data Quality Assessment
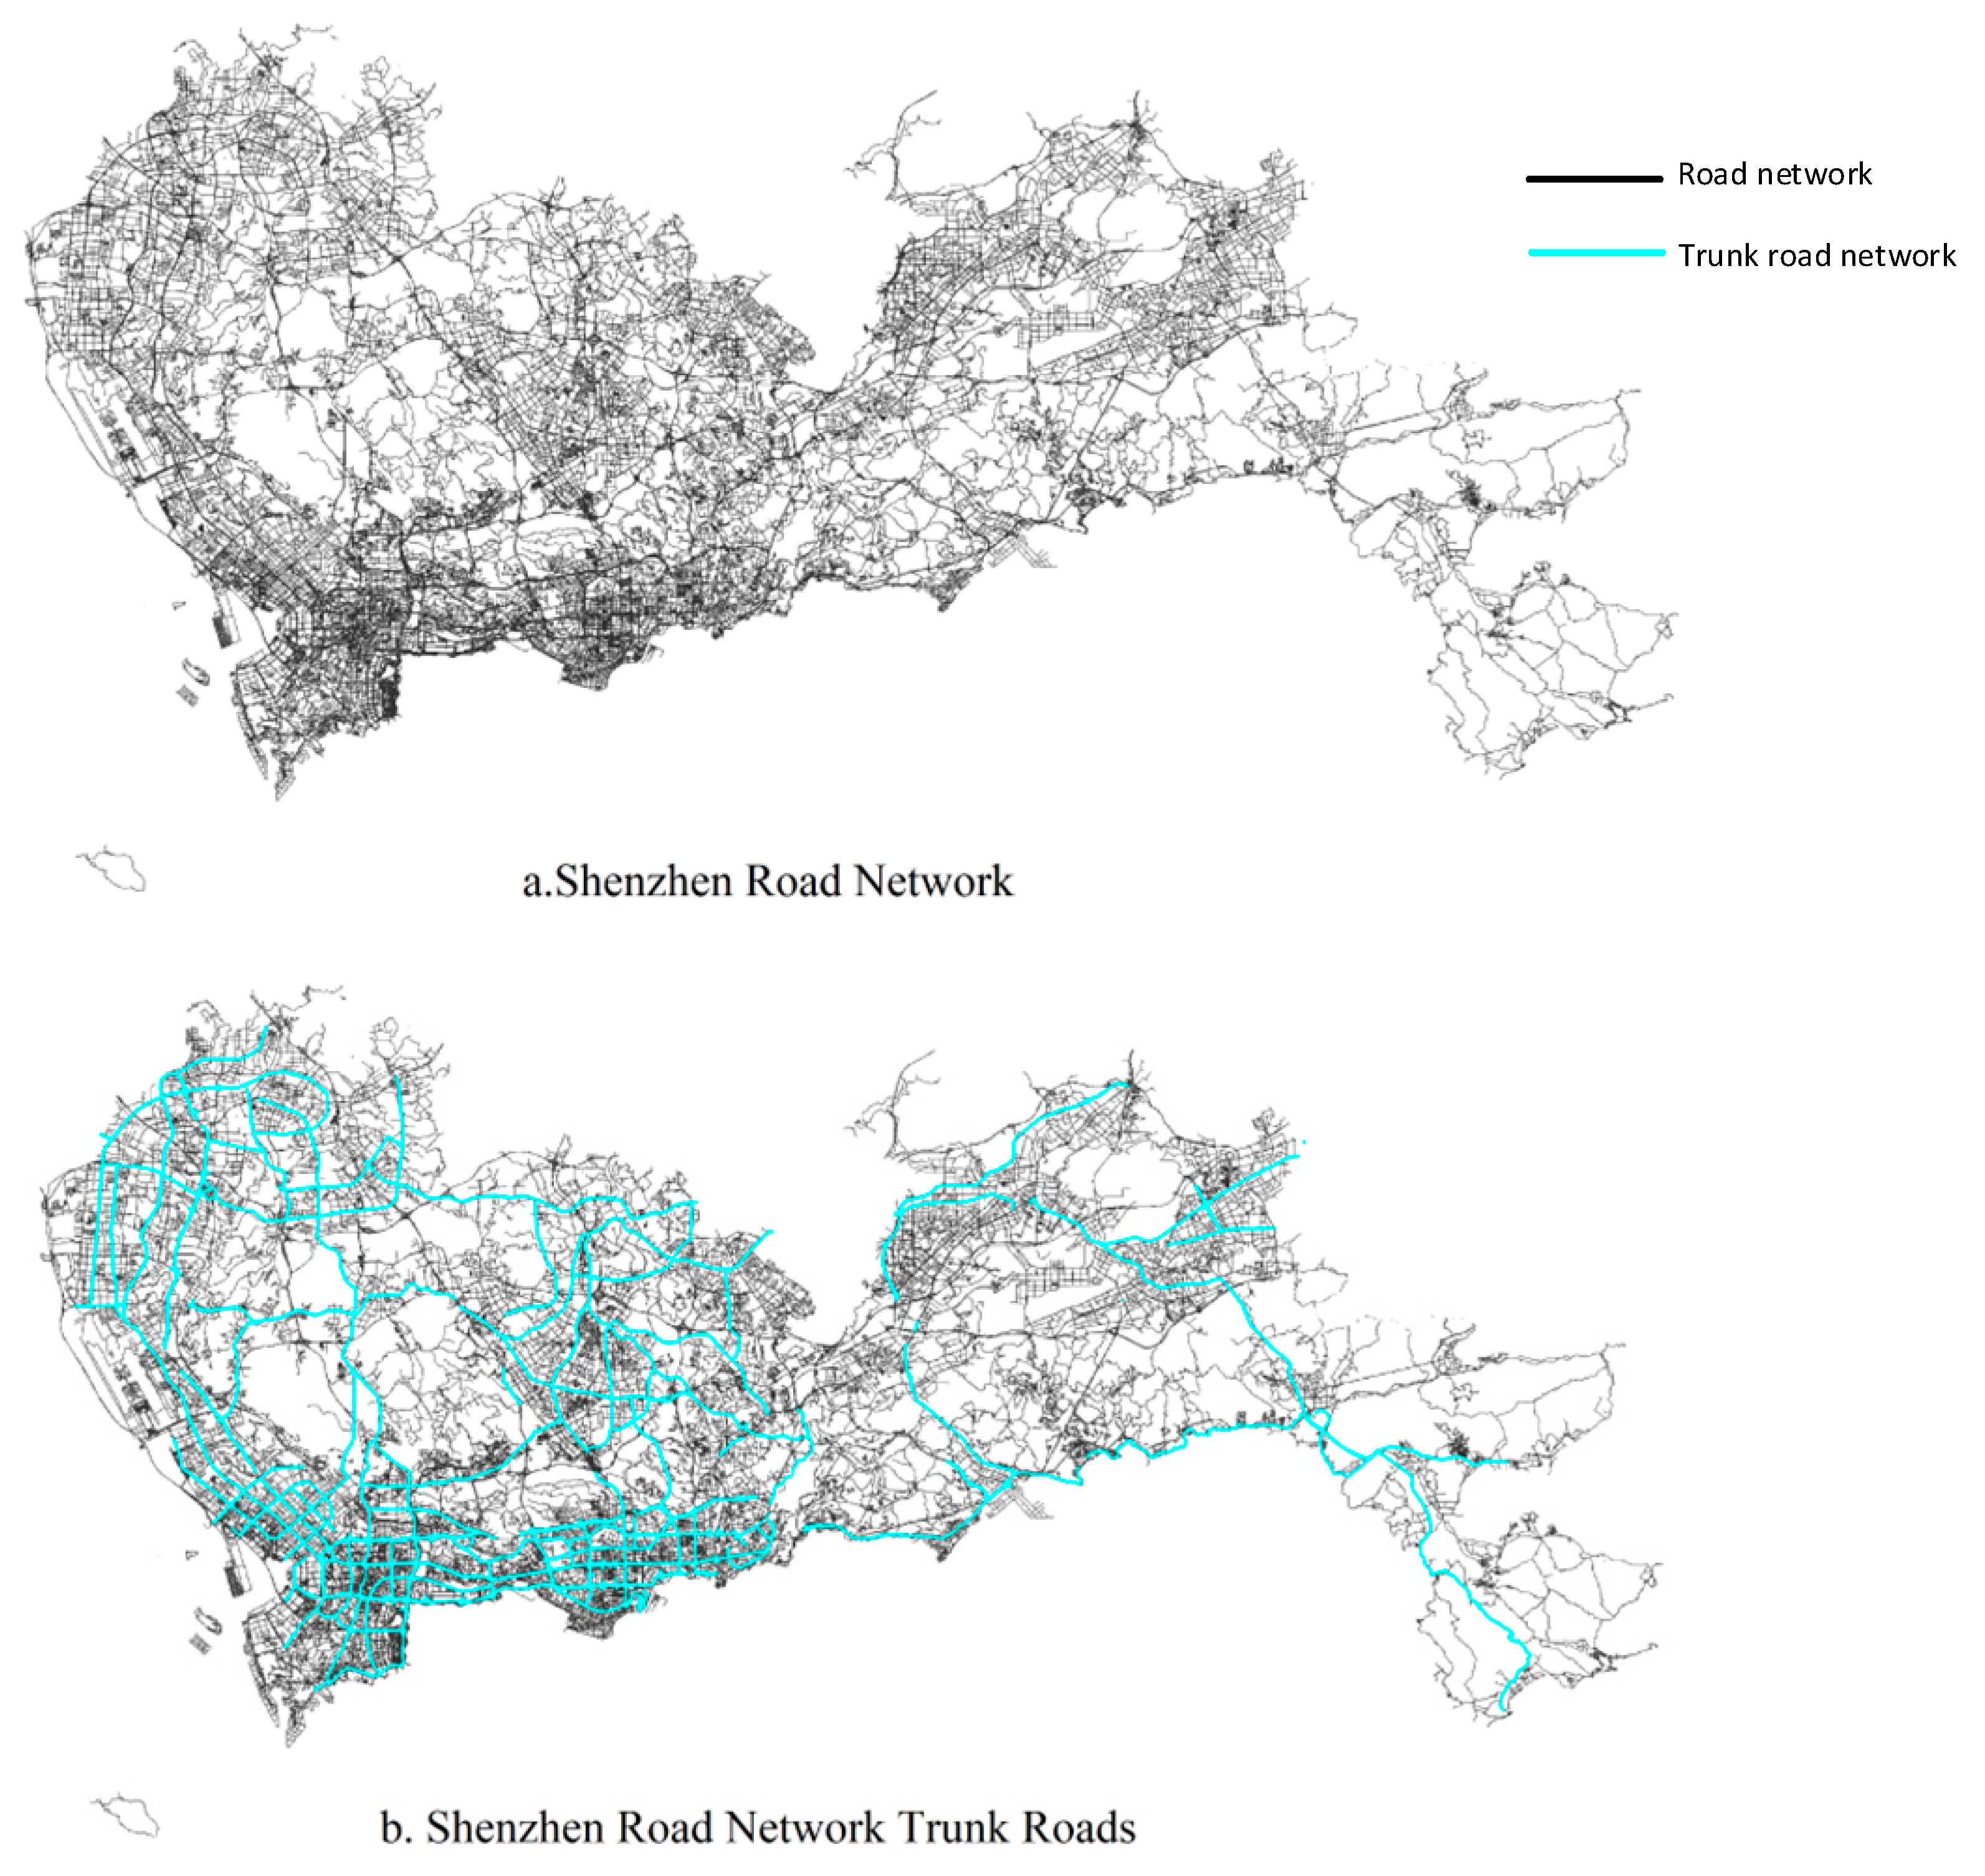
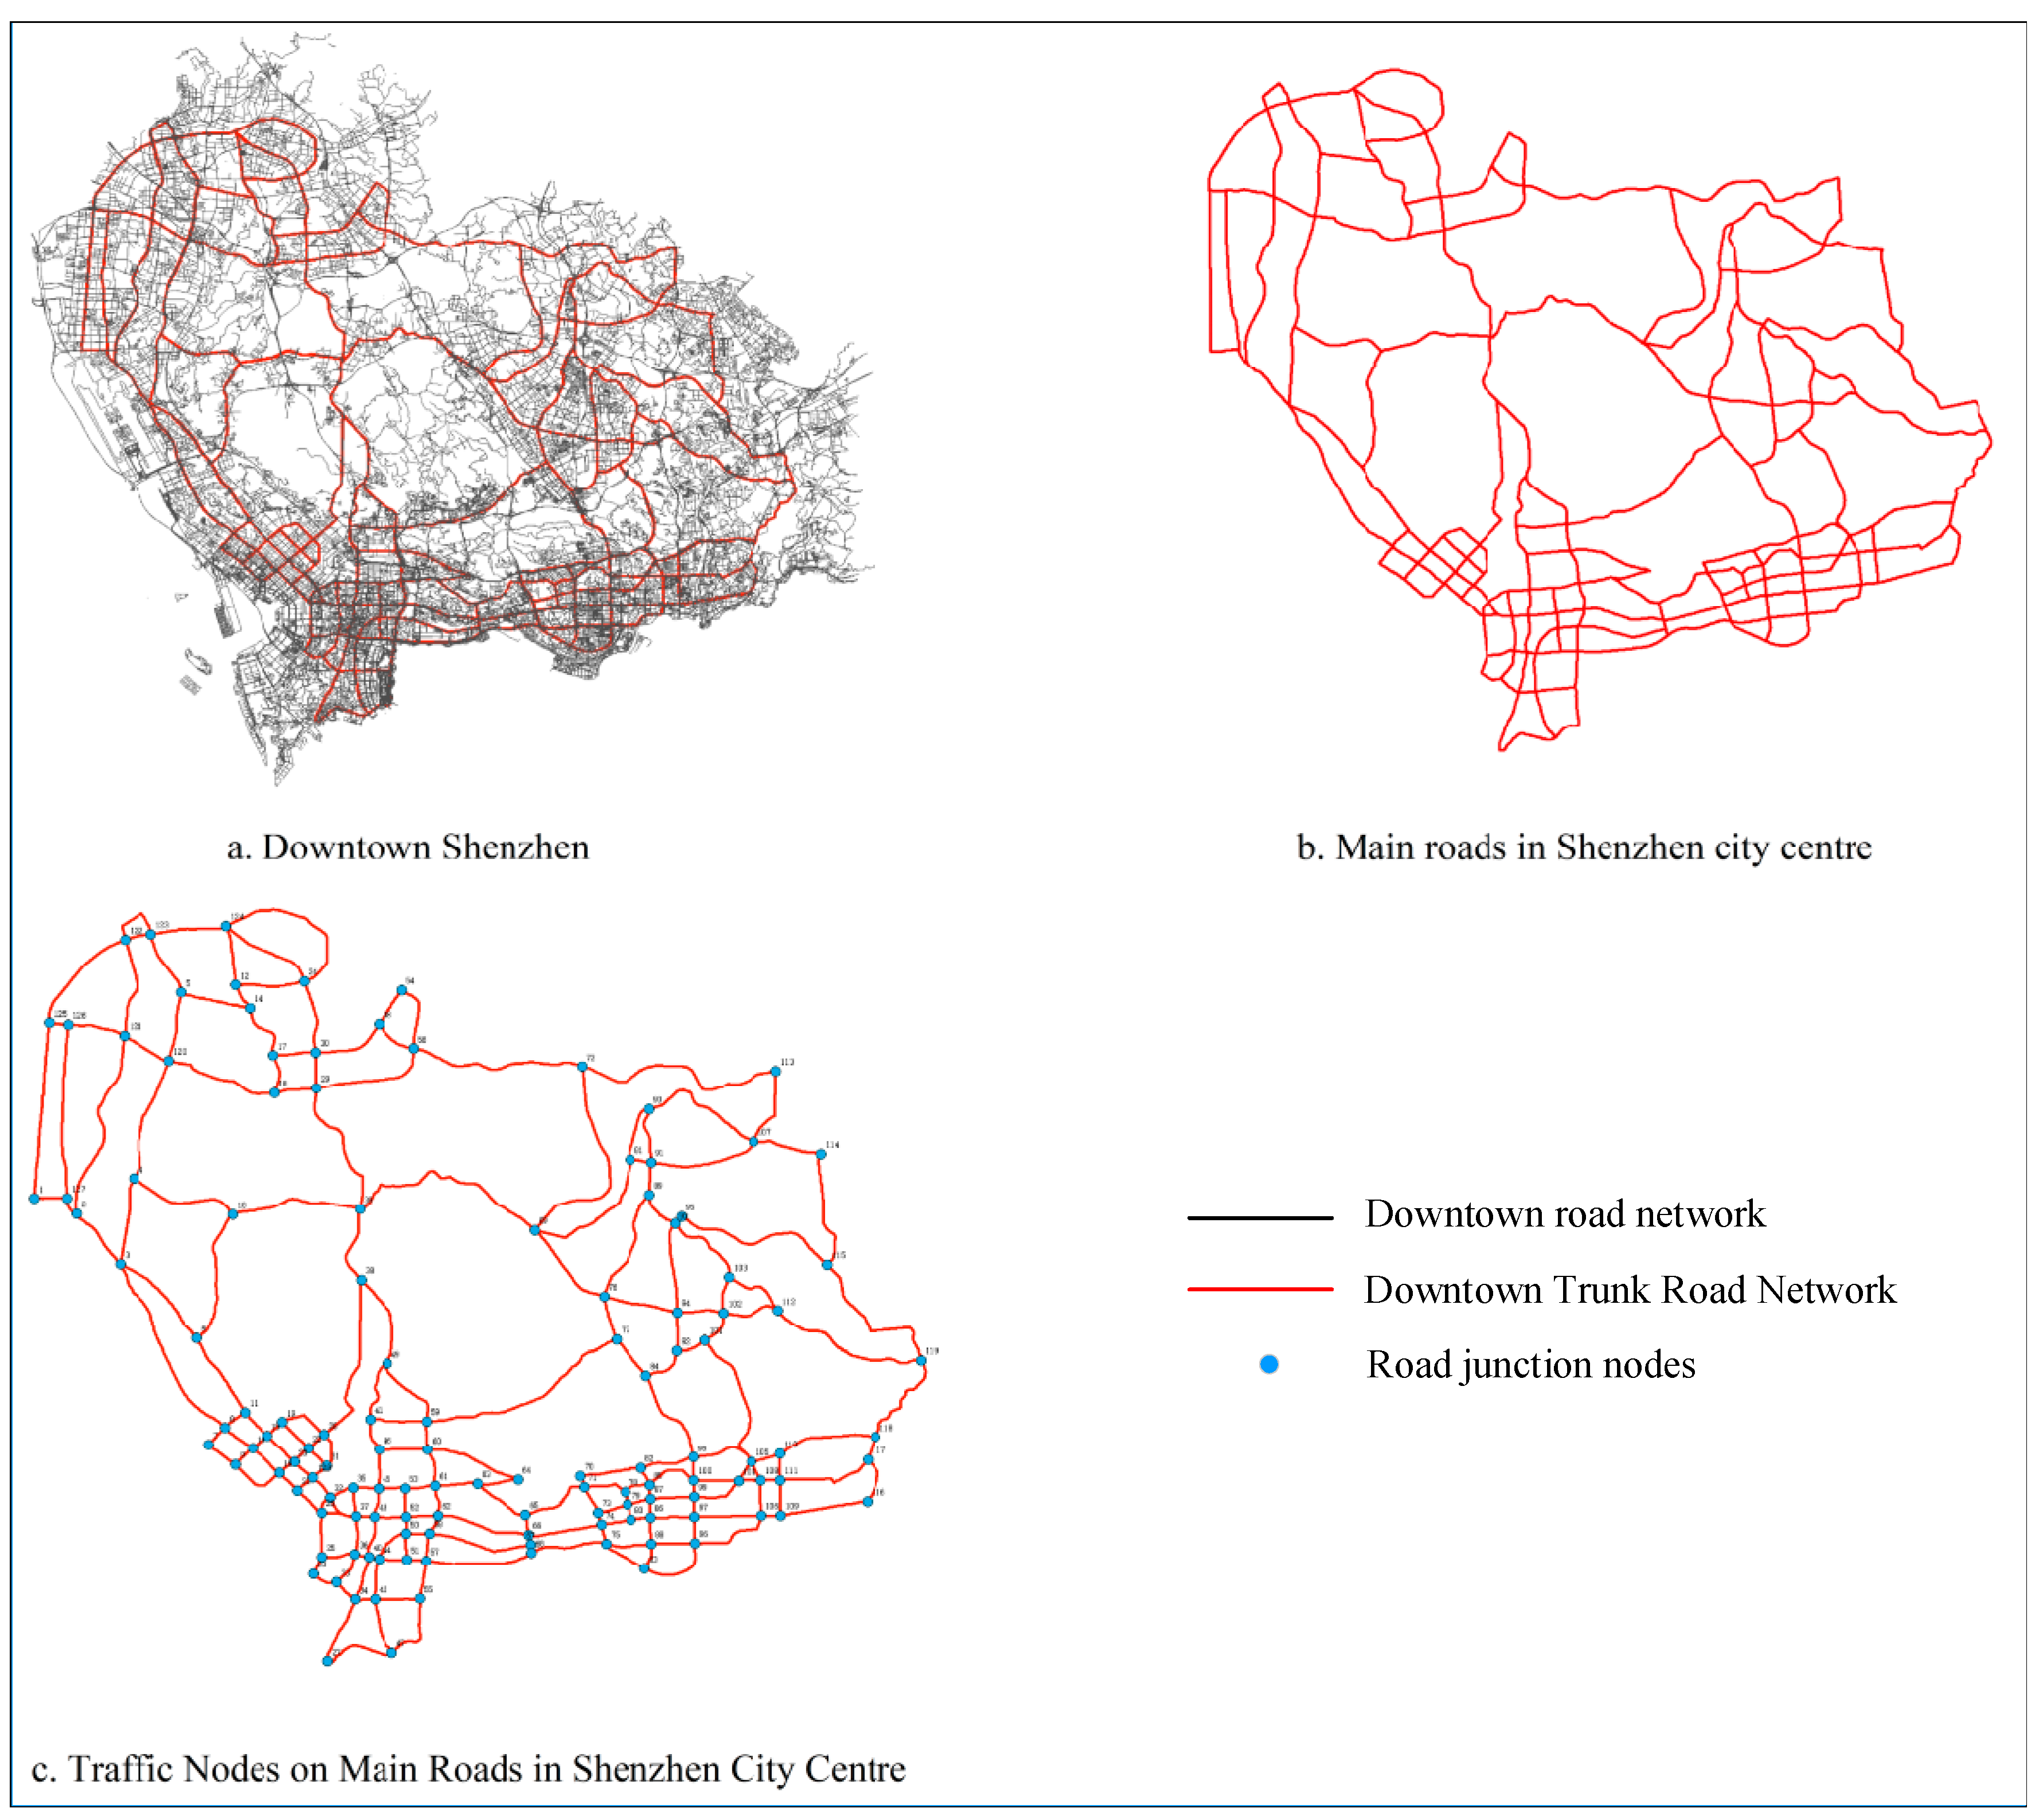
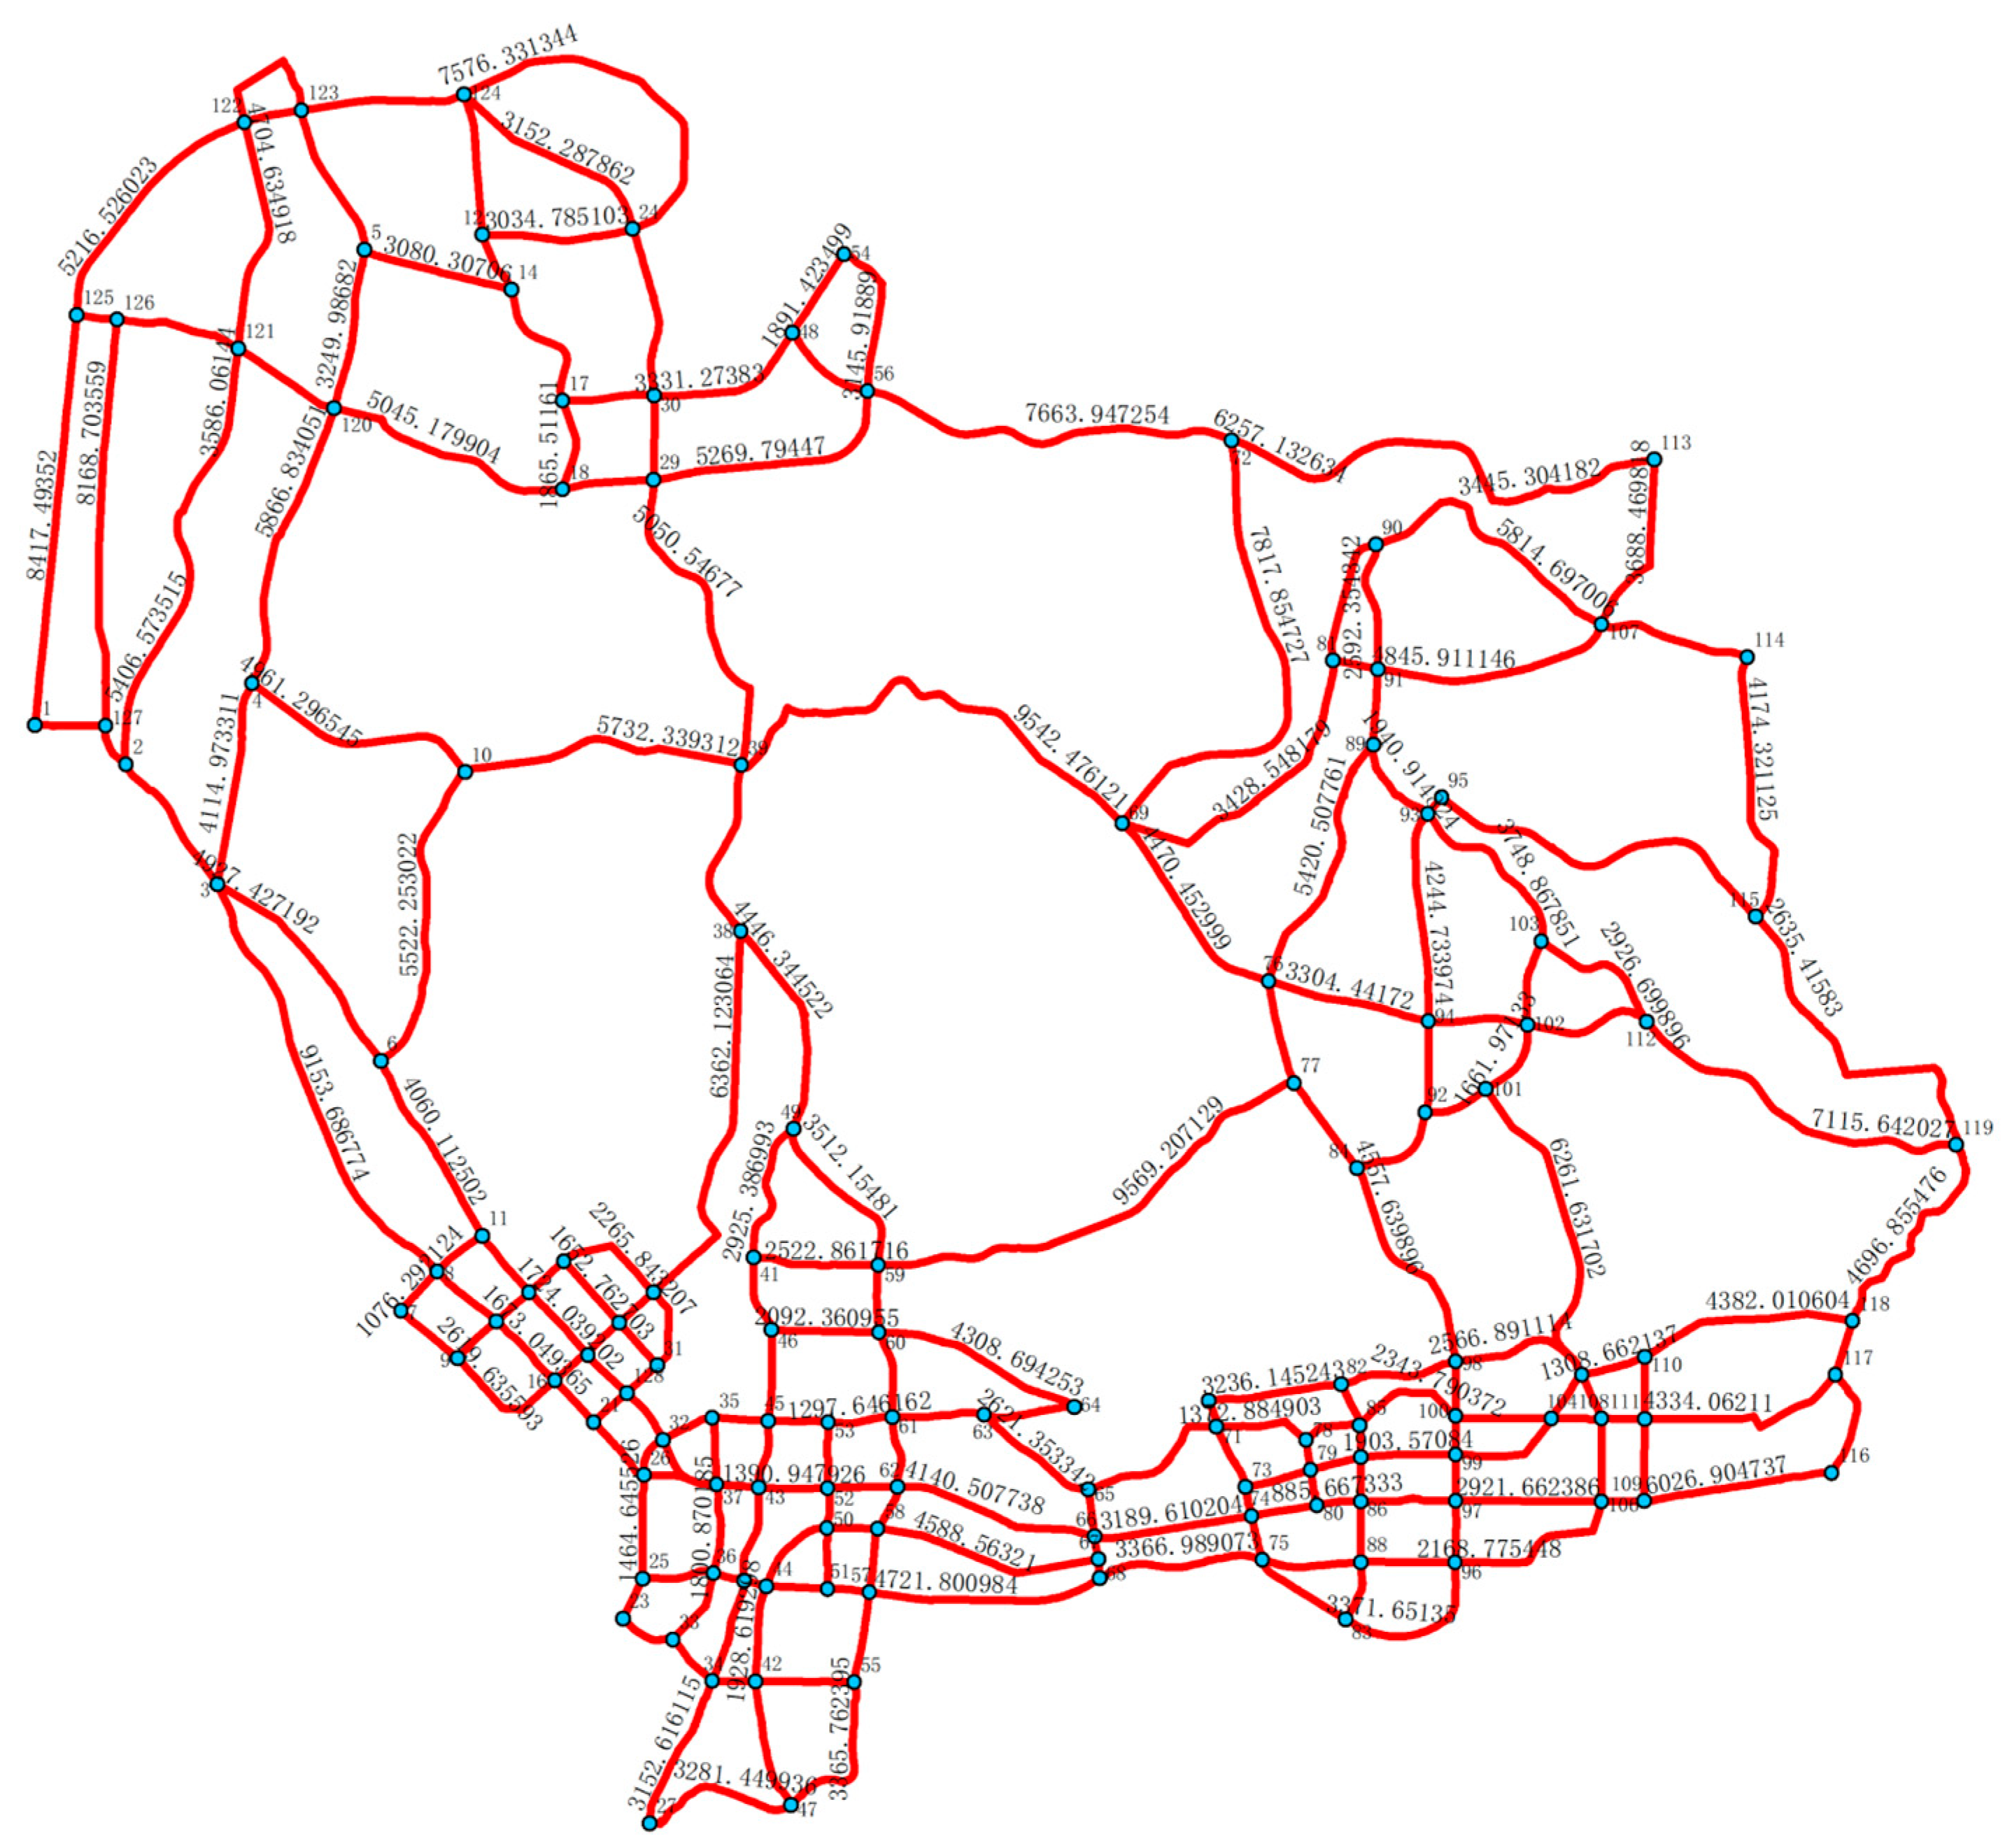
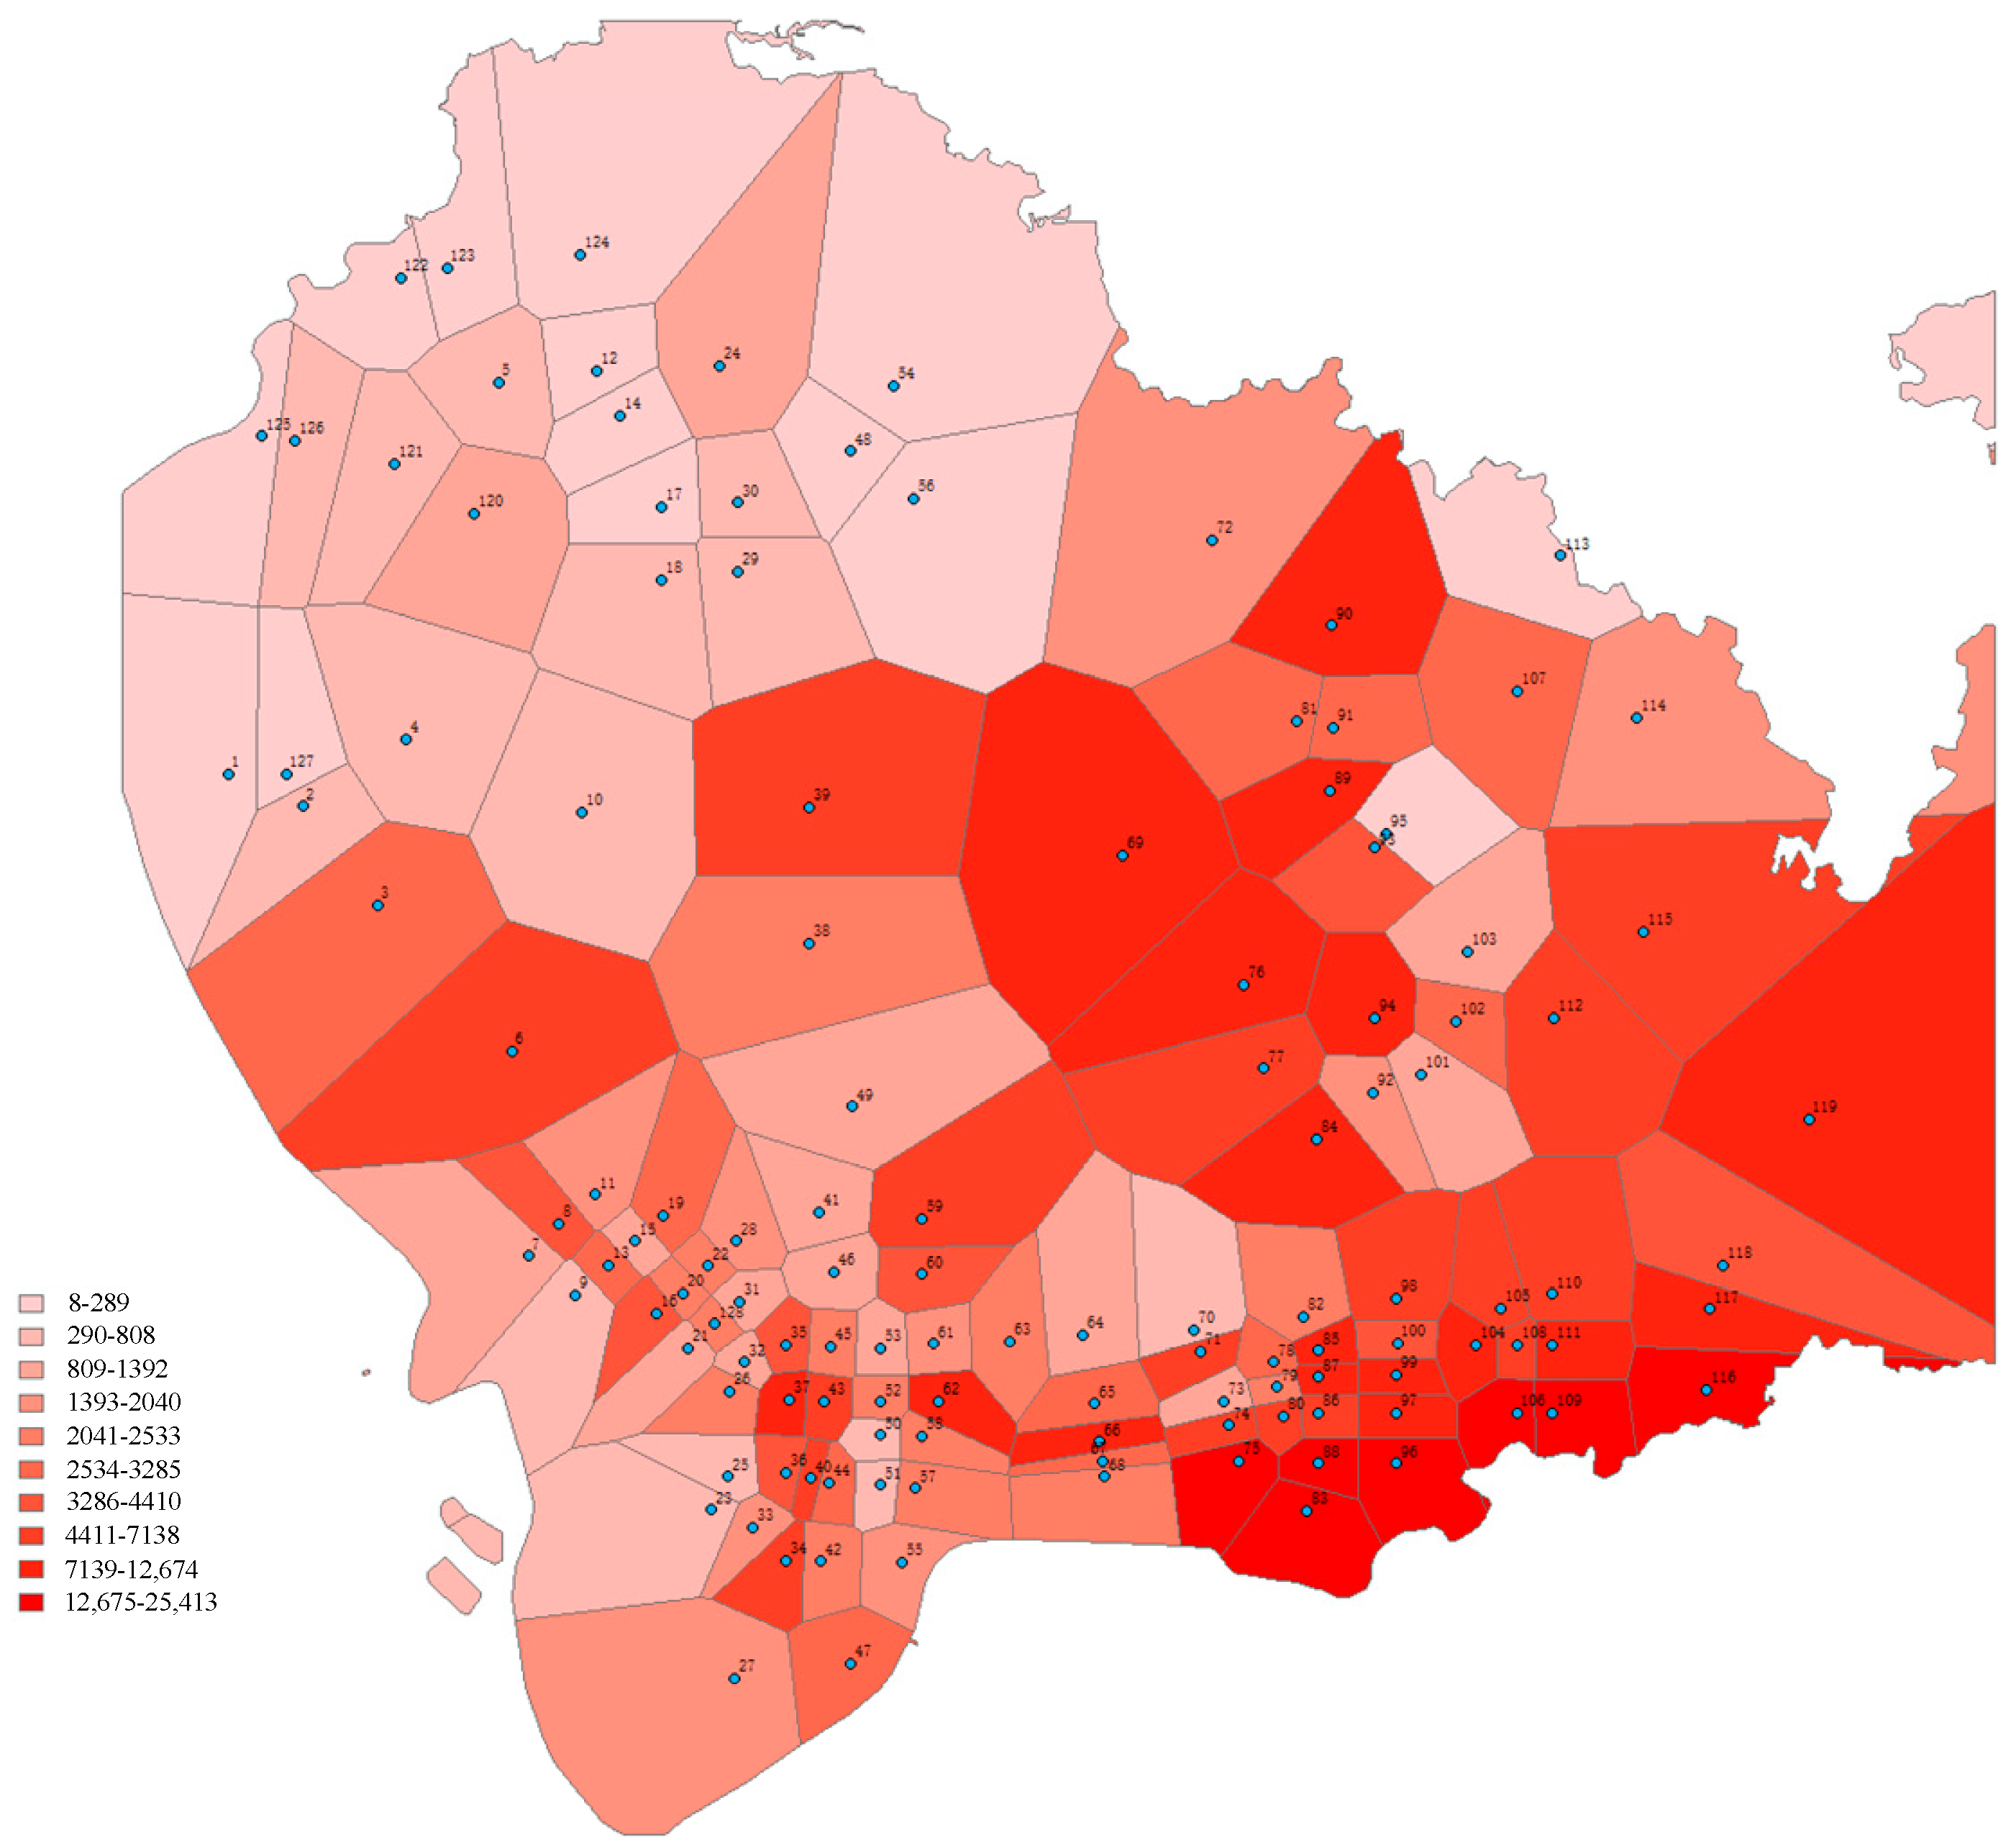
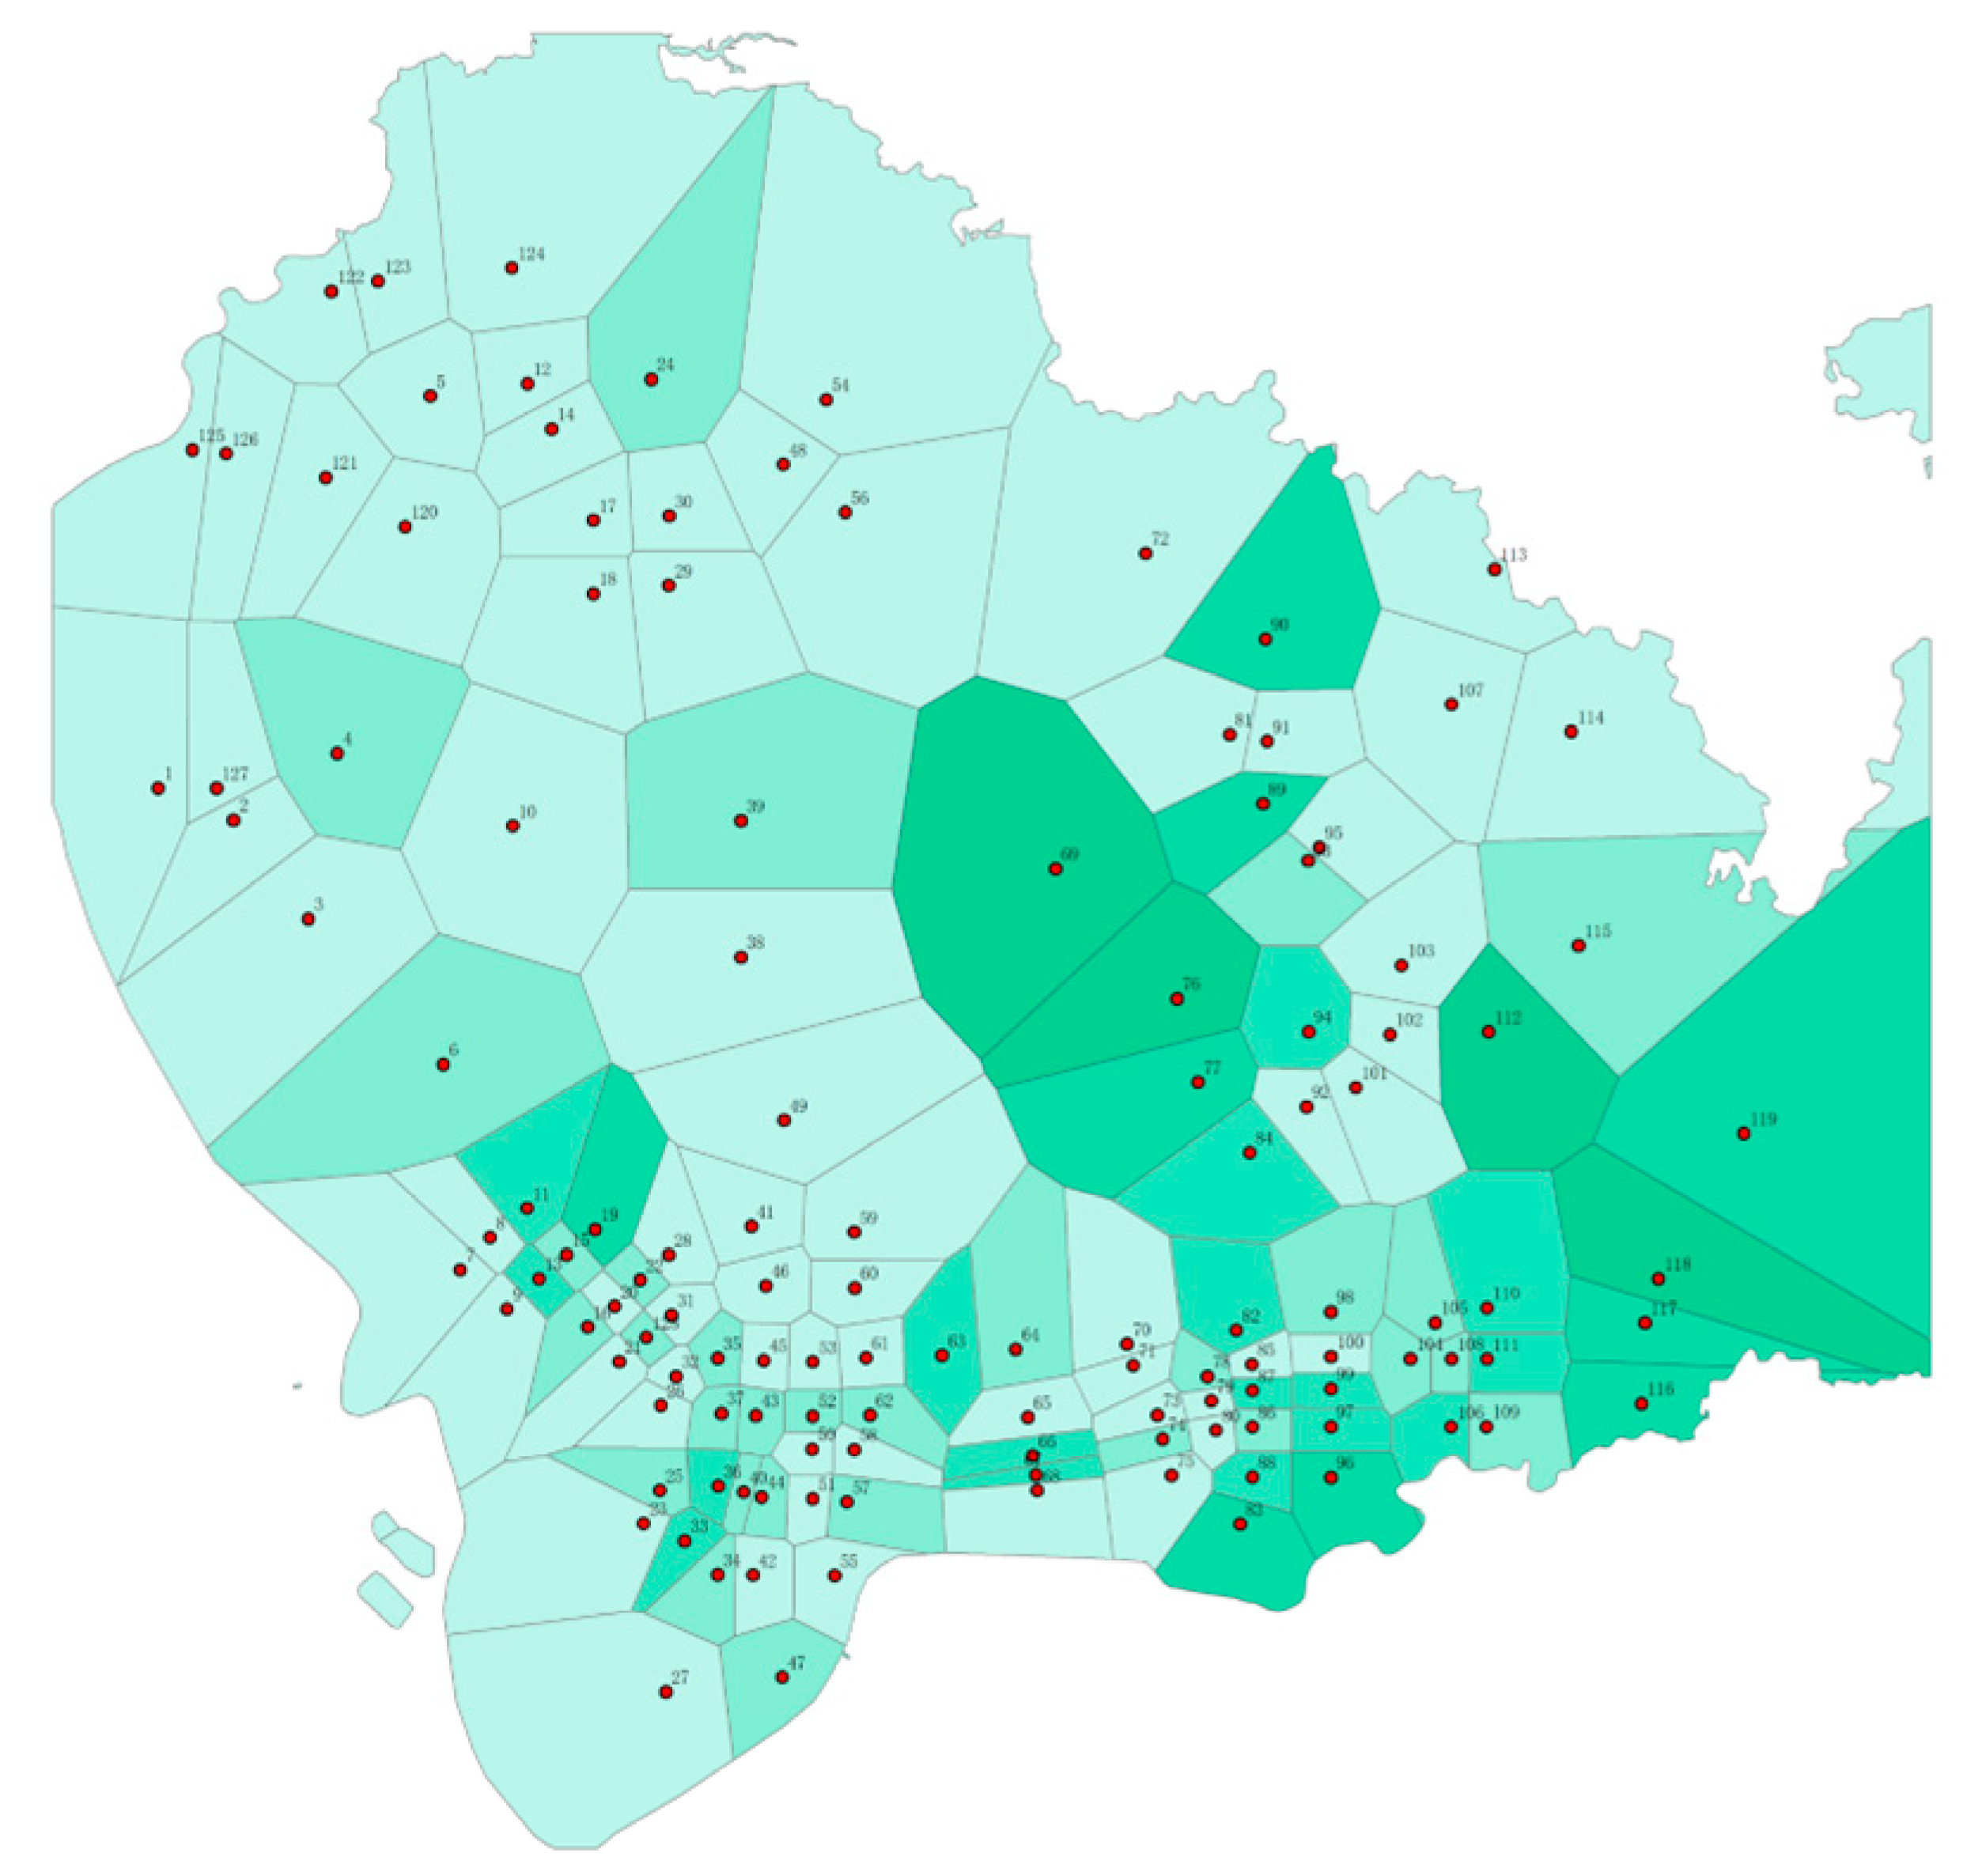
3.2. Urban Road Topology
3.3. Spatial and Temporal Distribution of Electric Taxis Starting Operation
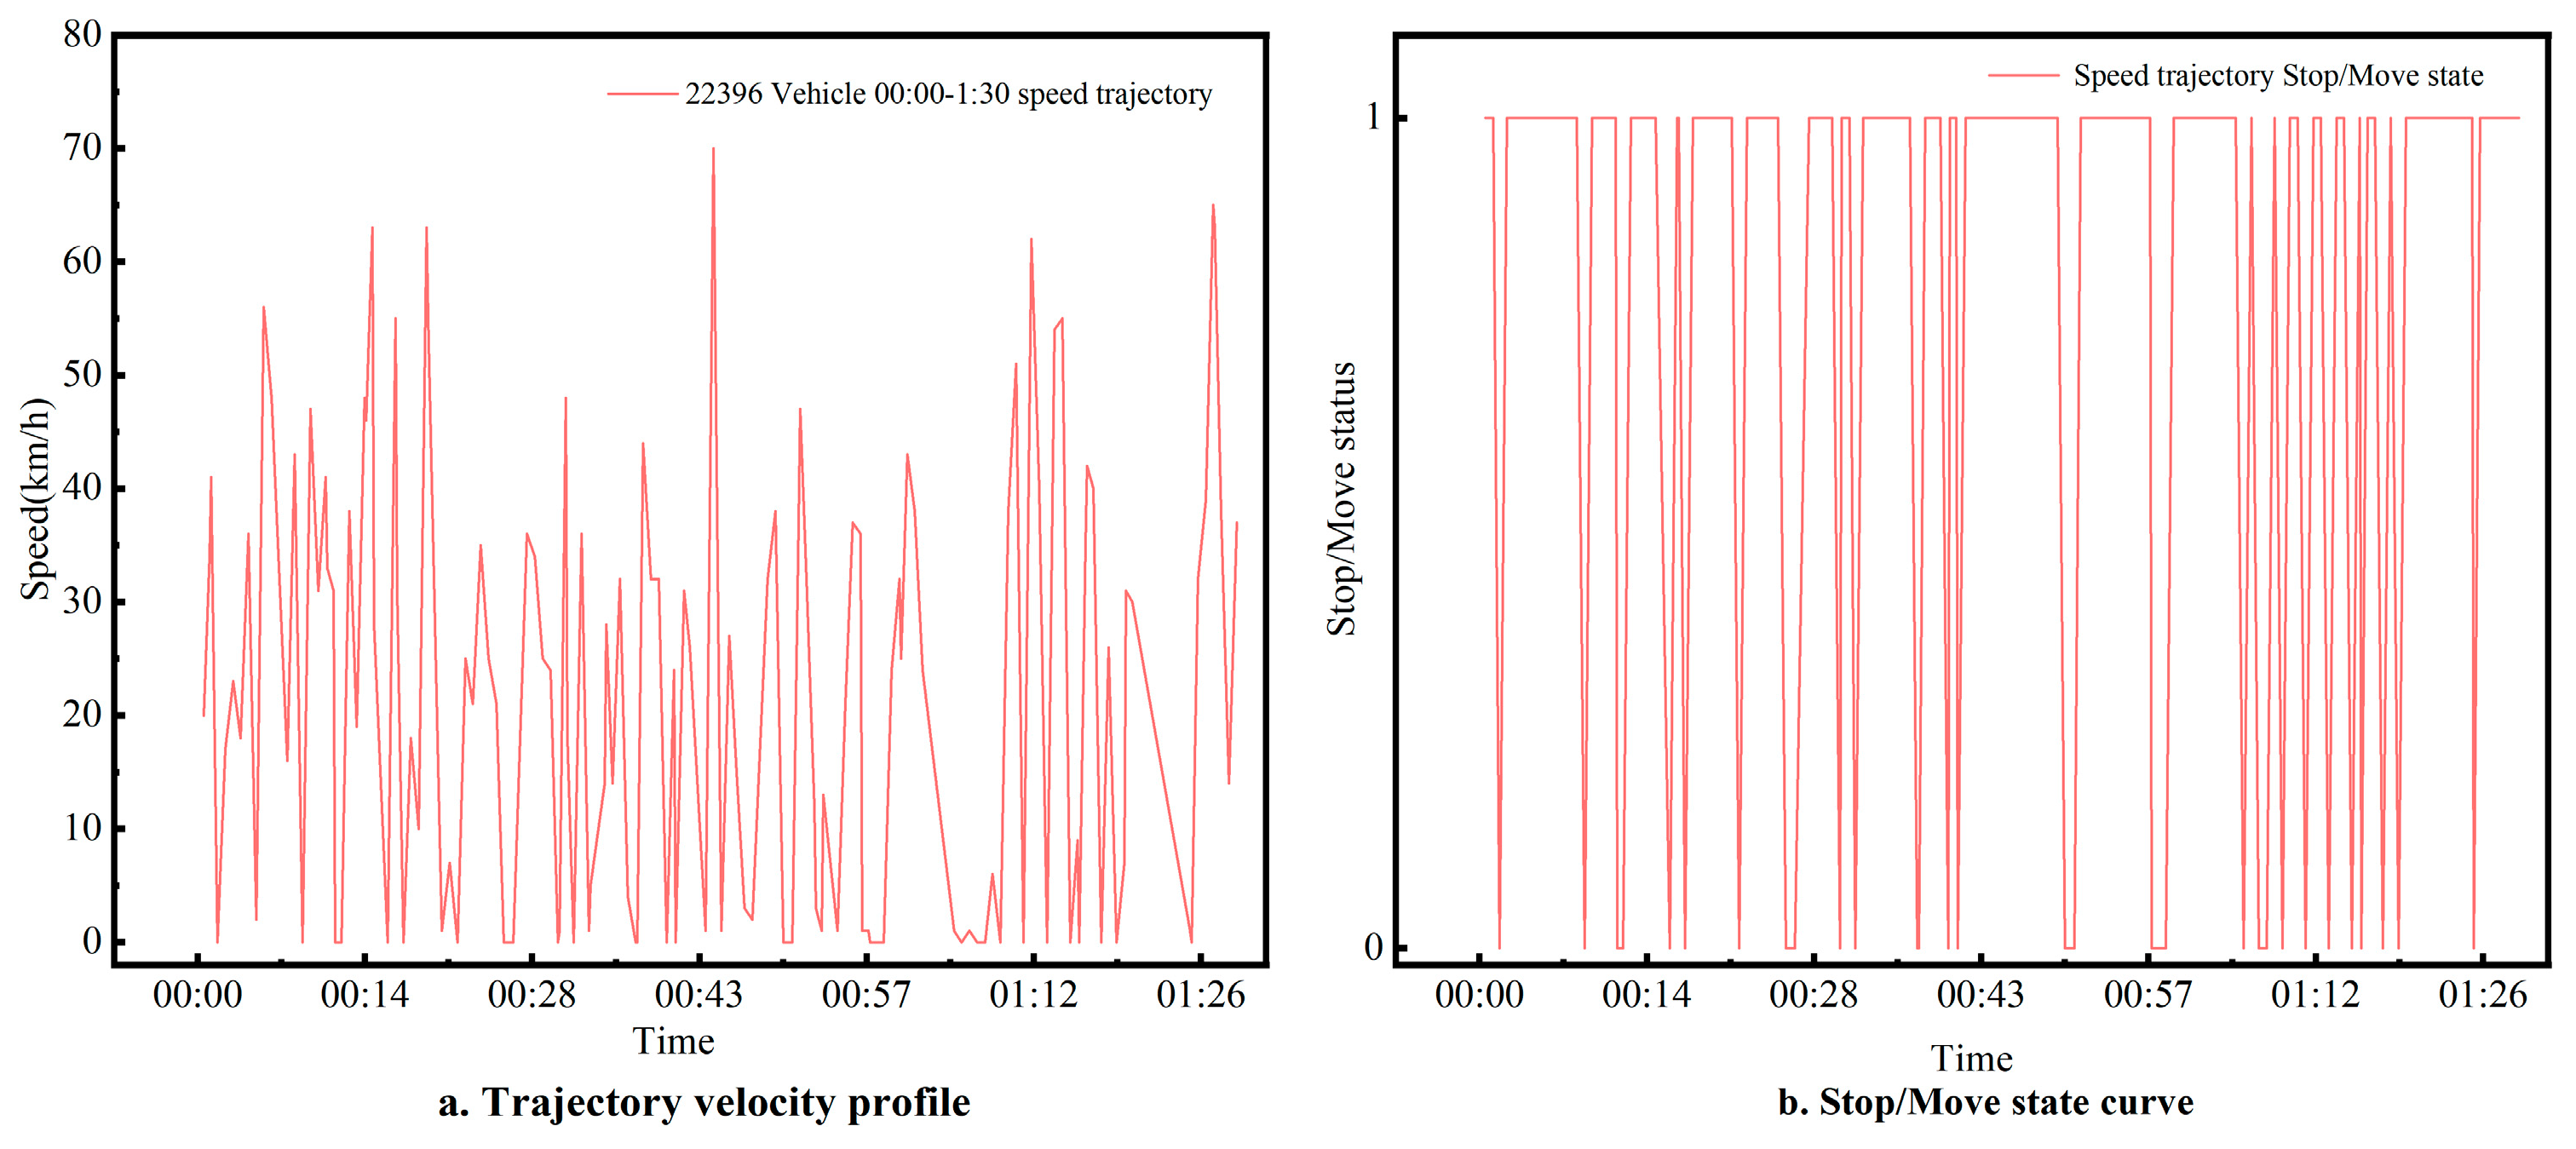
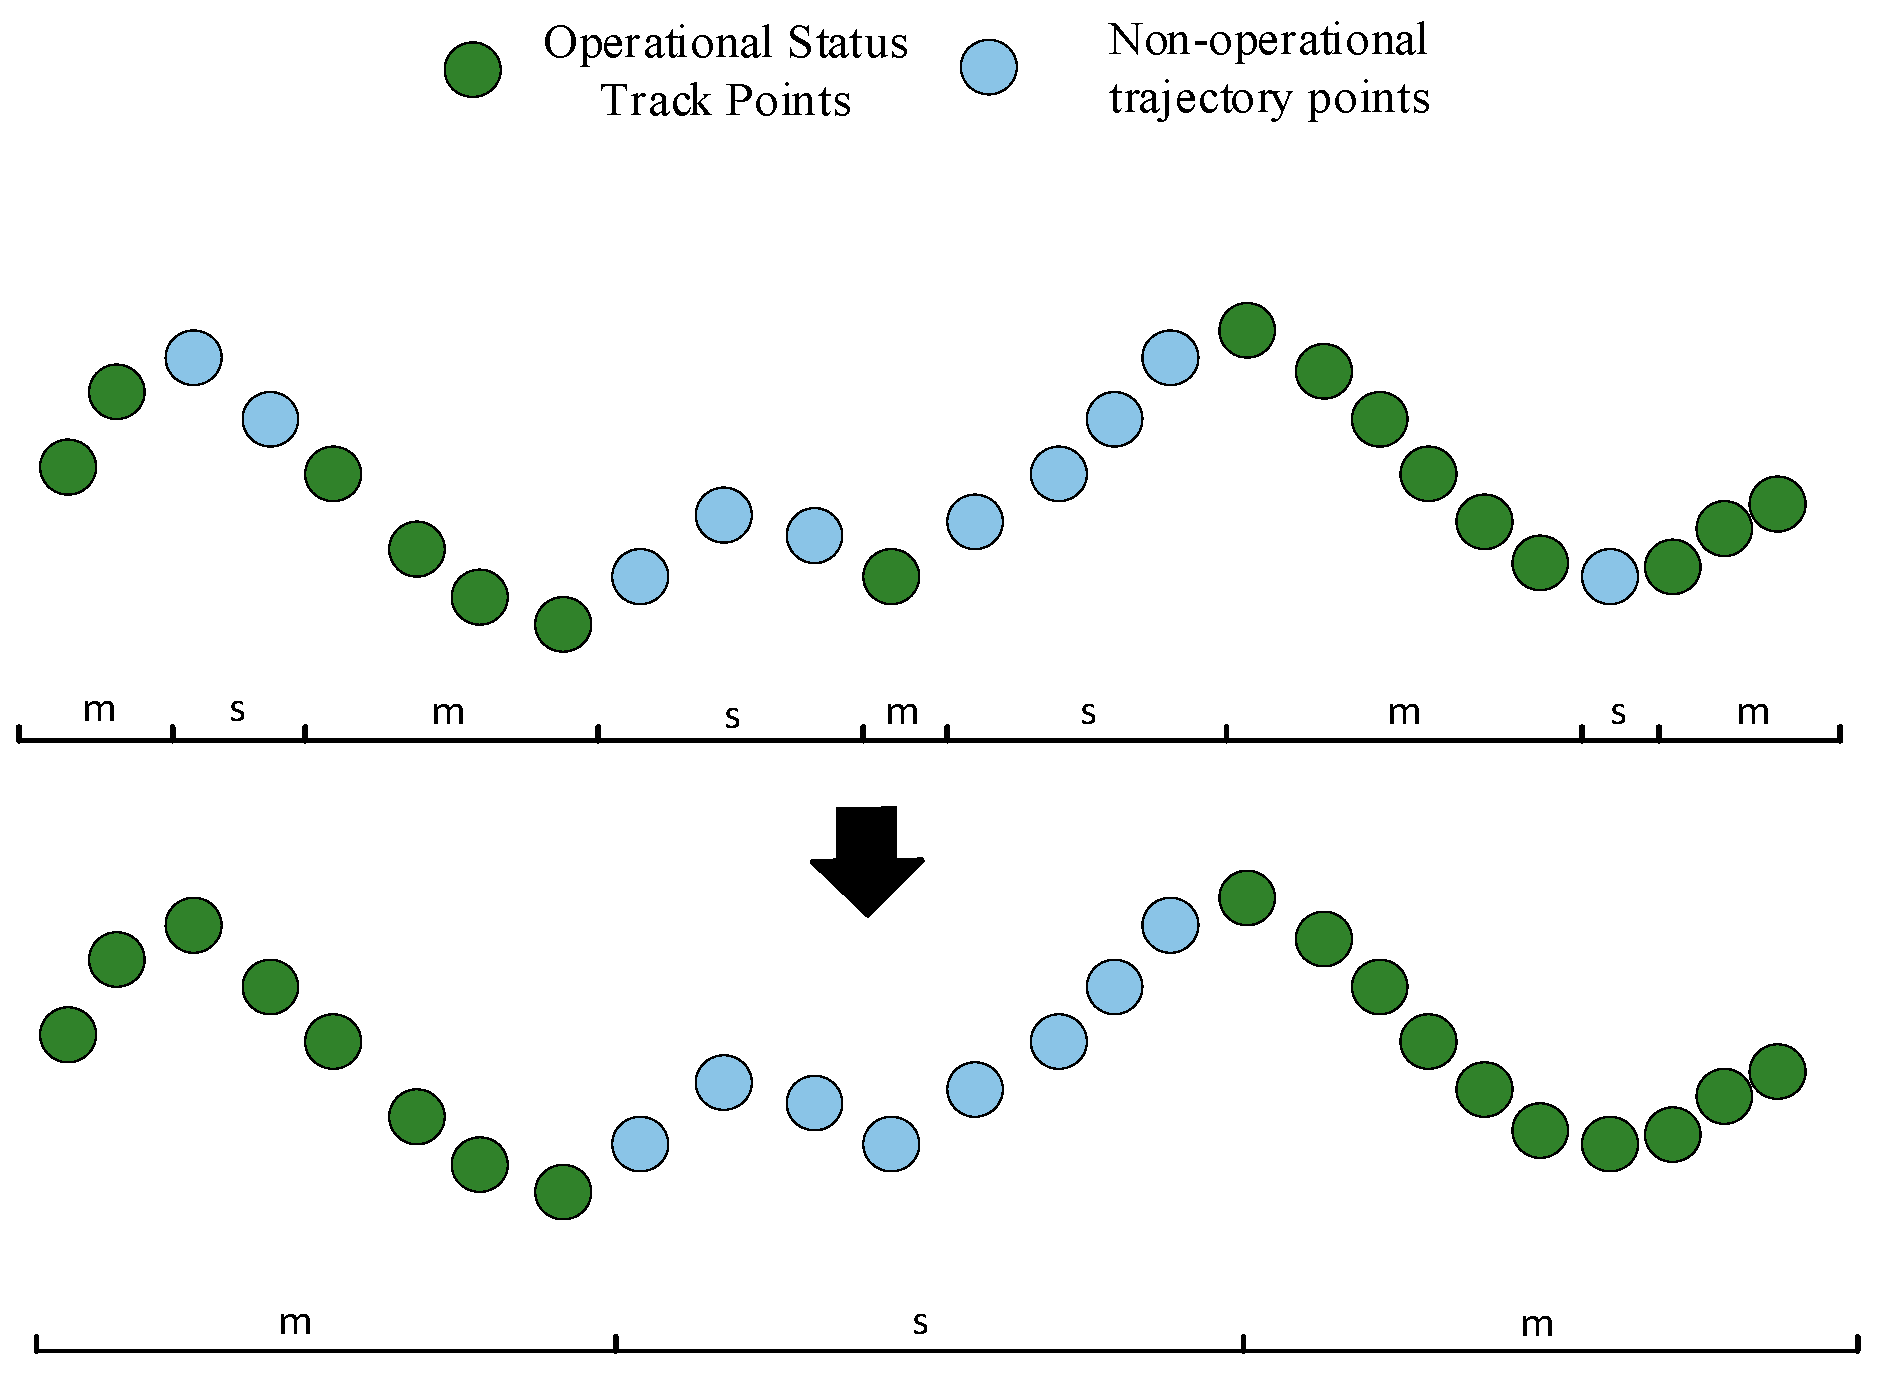
3.3.1. Dwell Point Detection
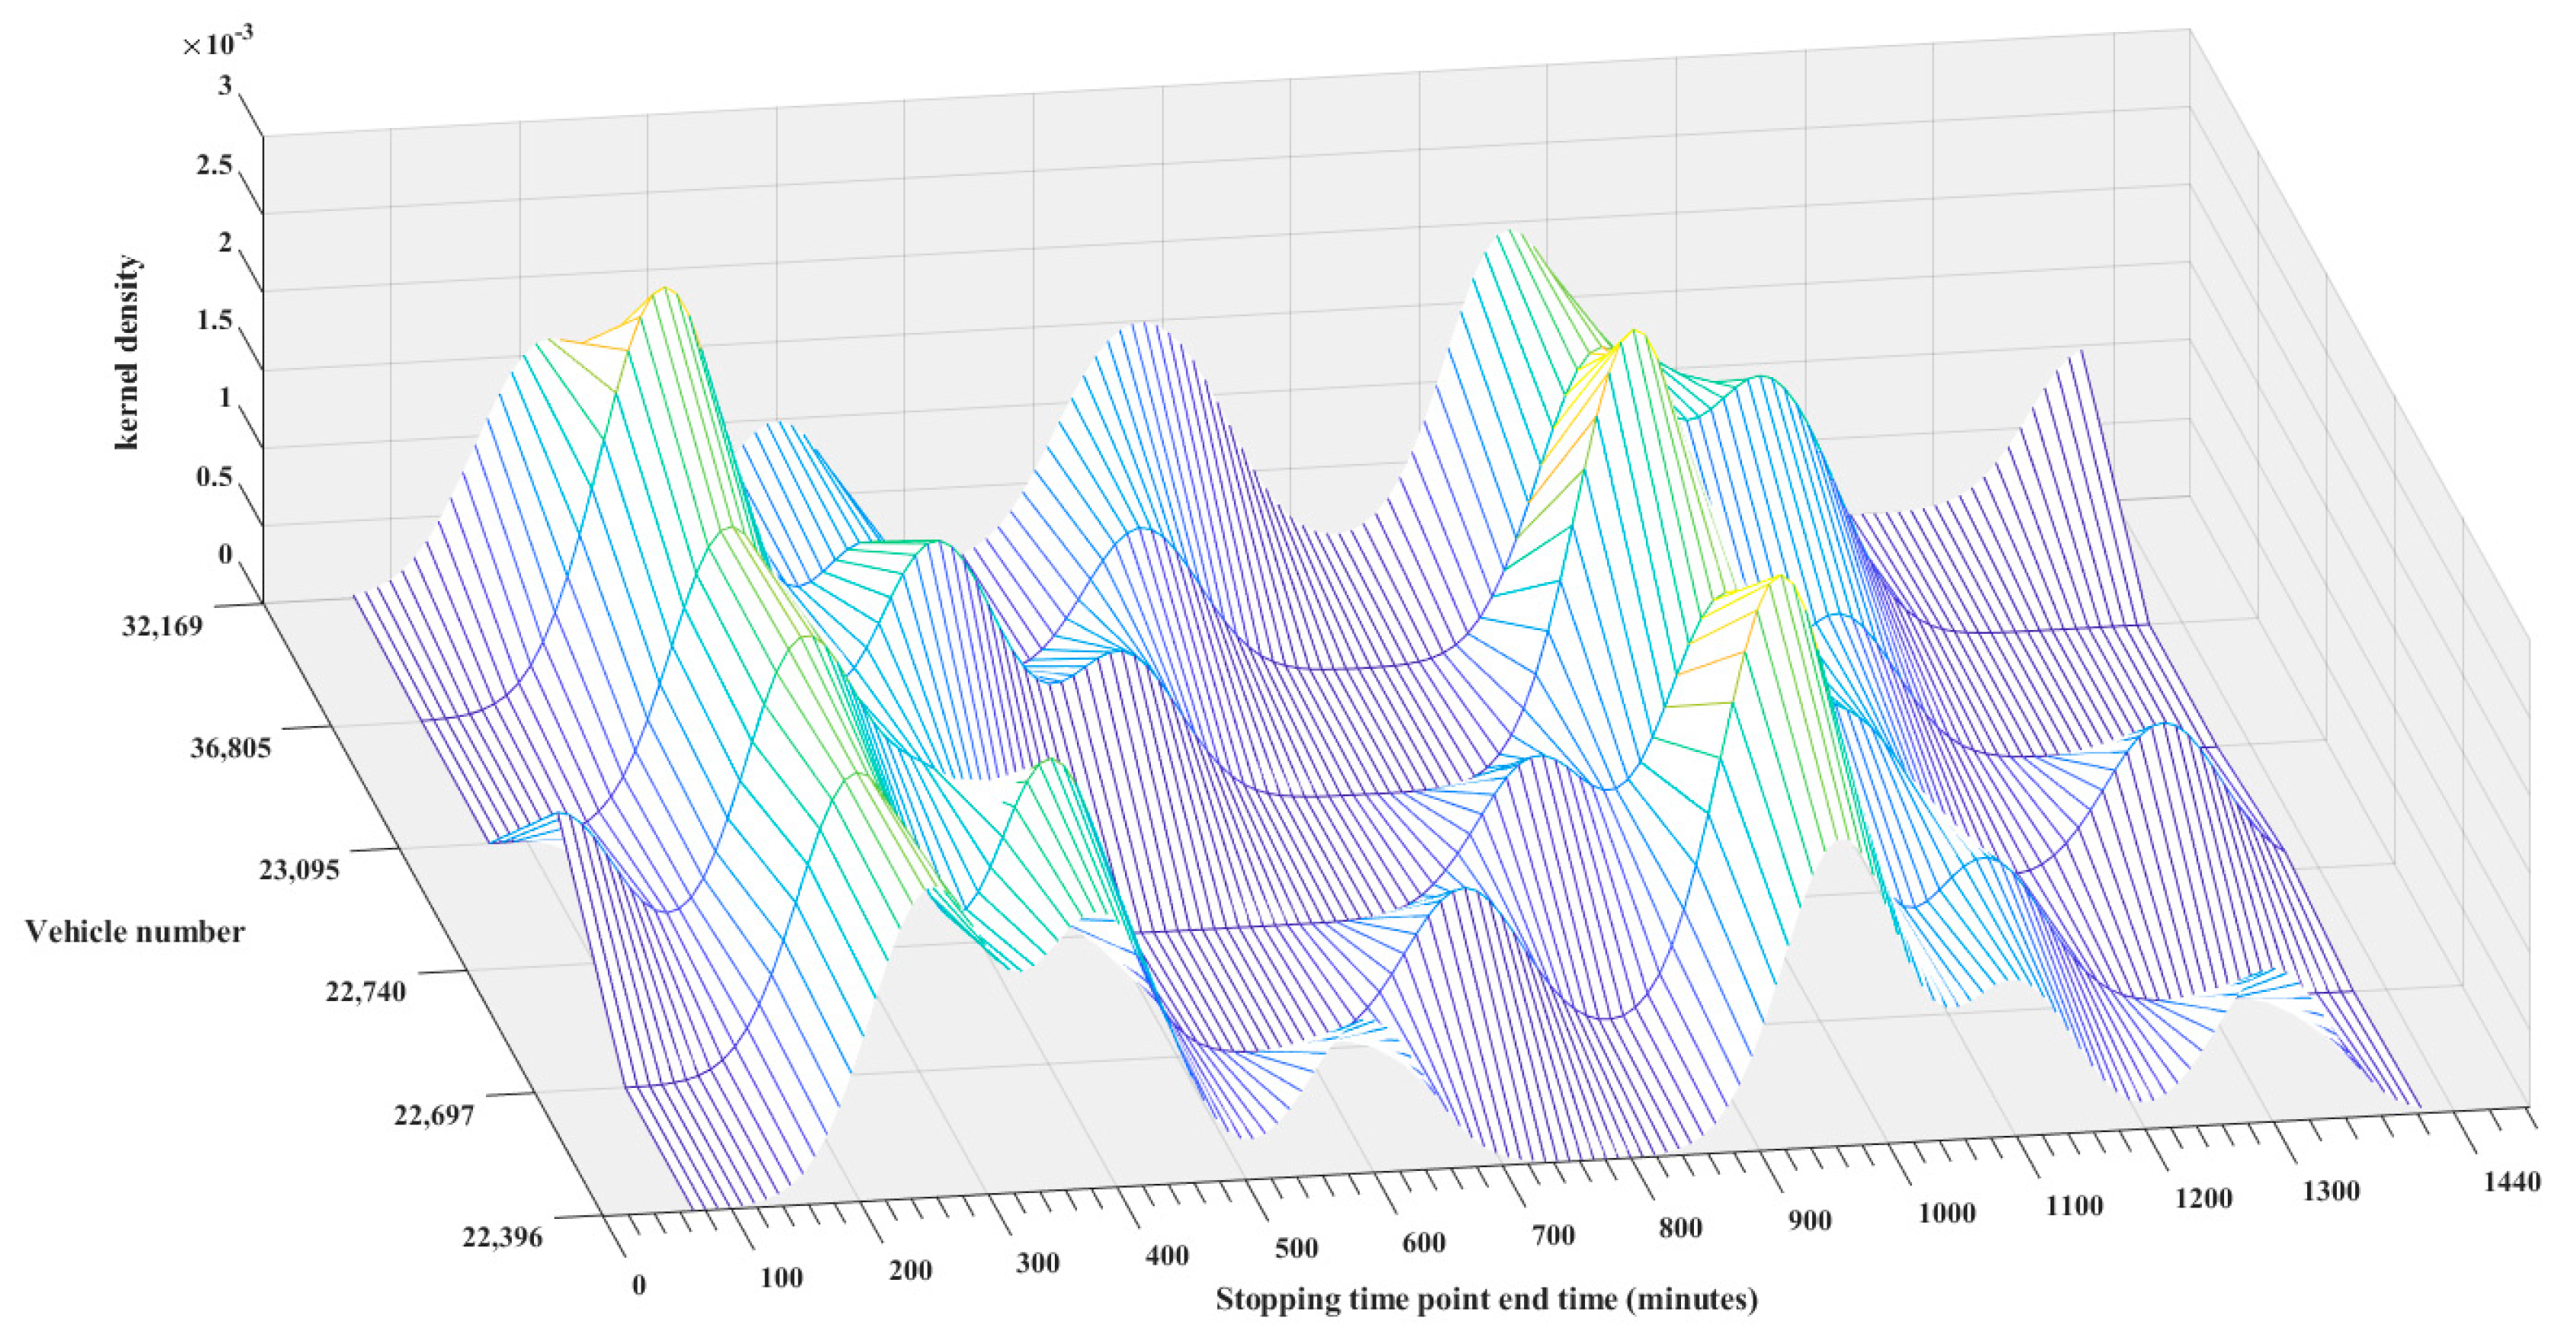
3.3.2. Distribution of Electric Taxi Operation Starting Time
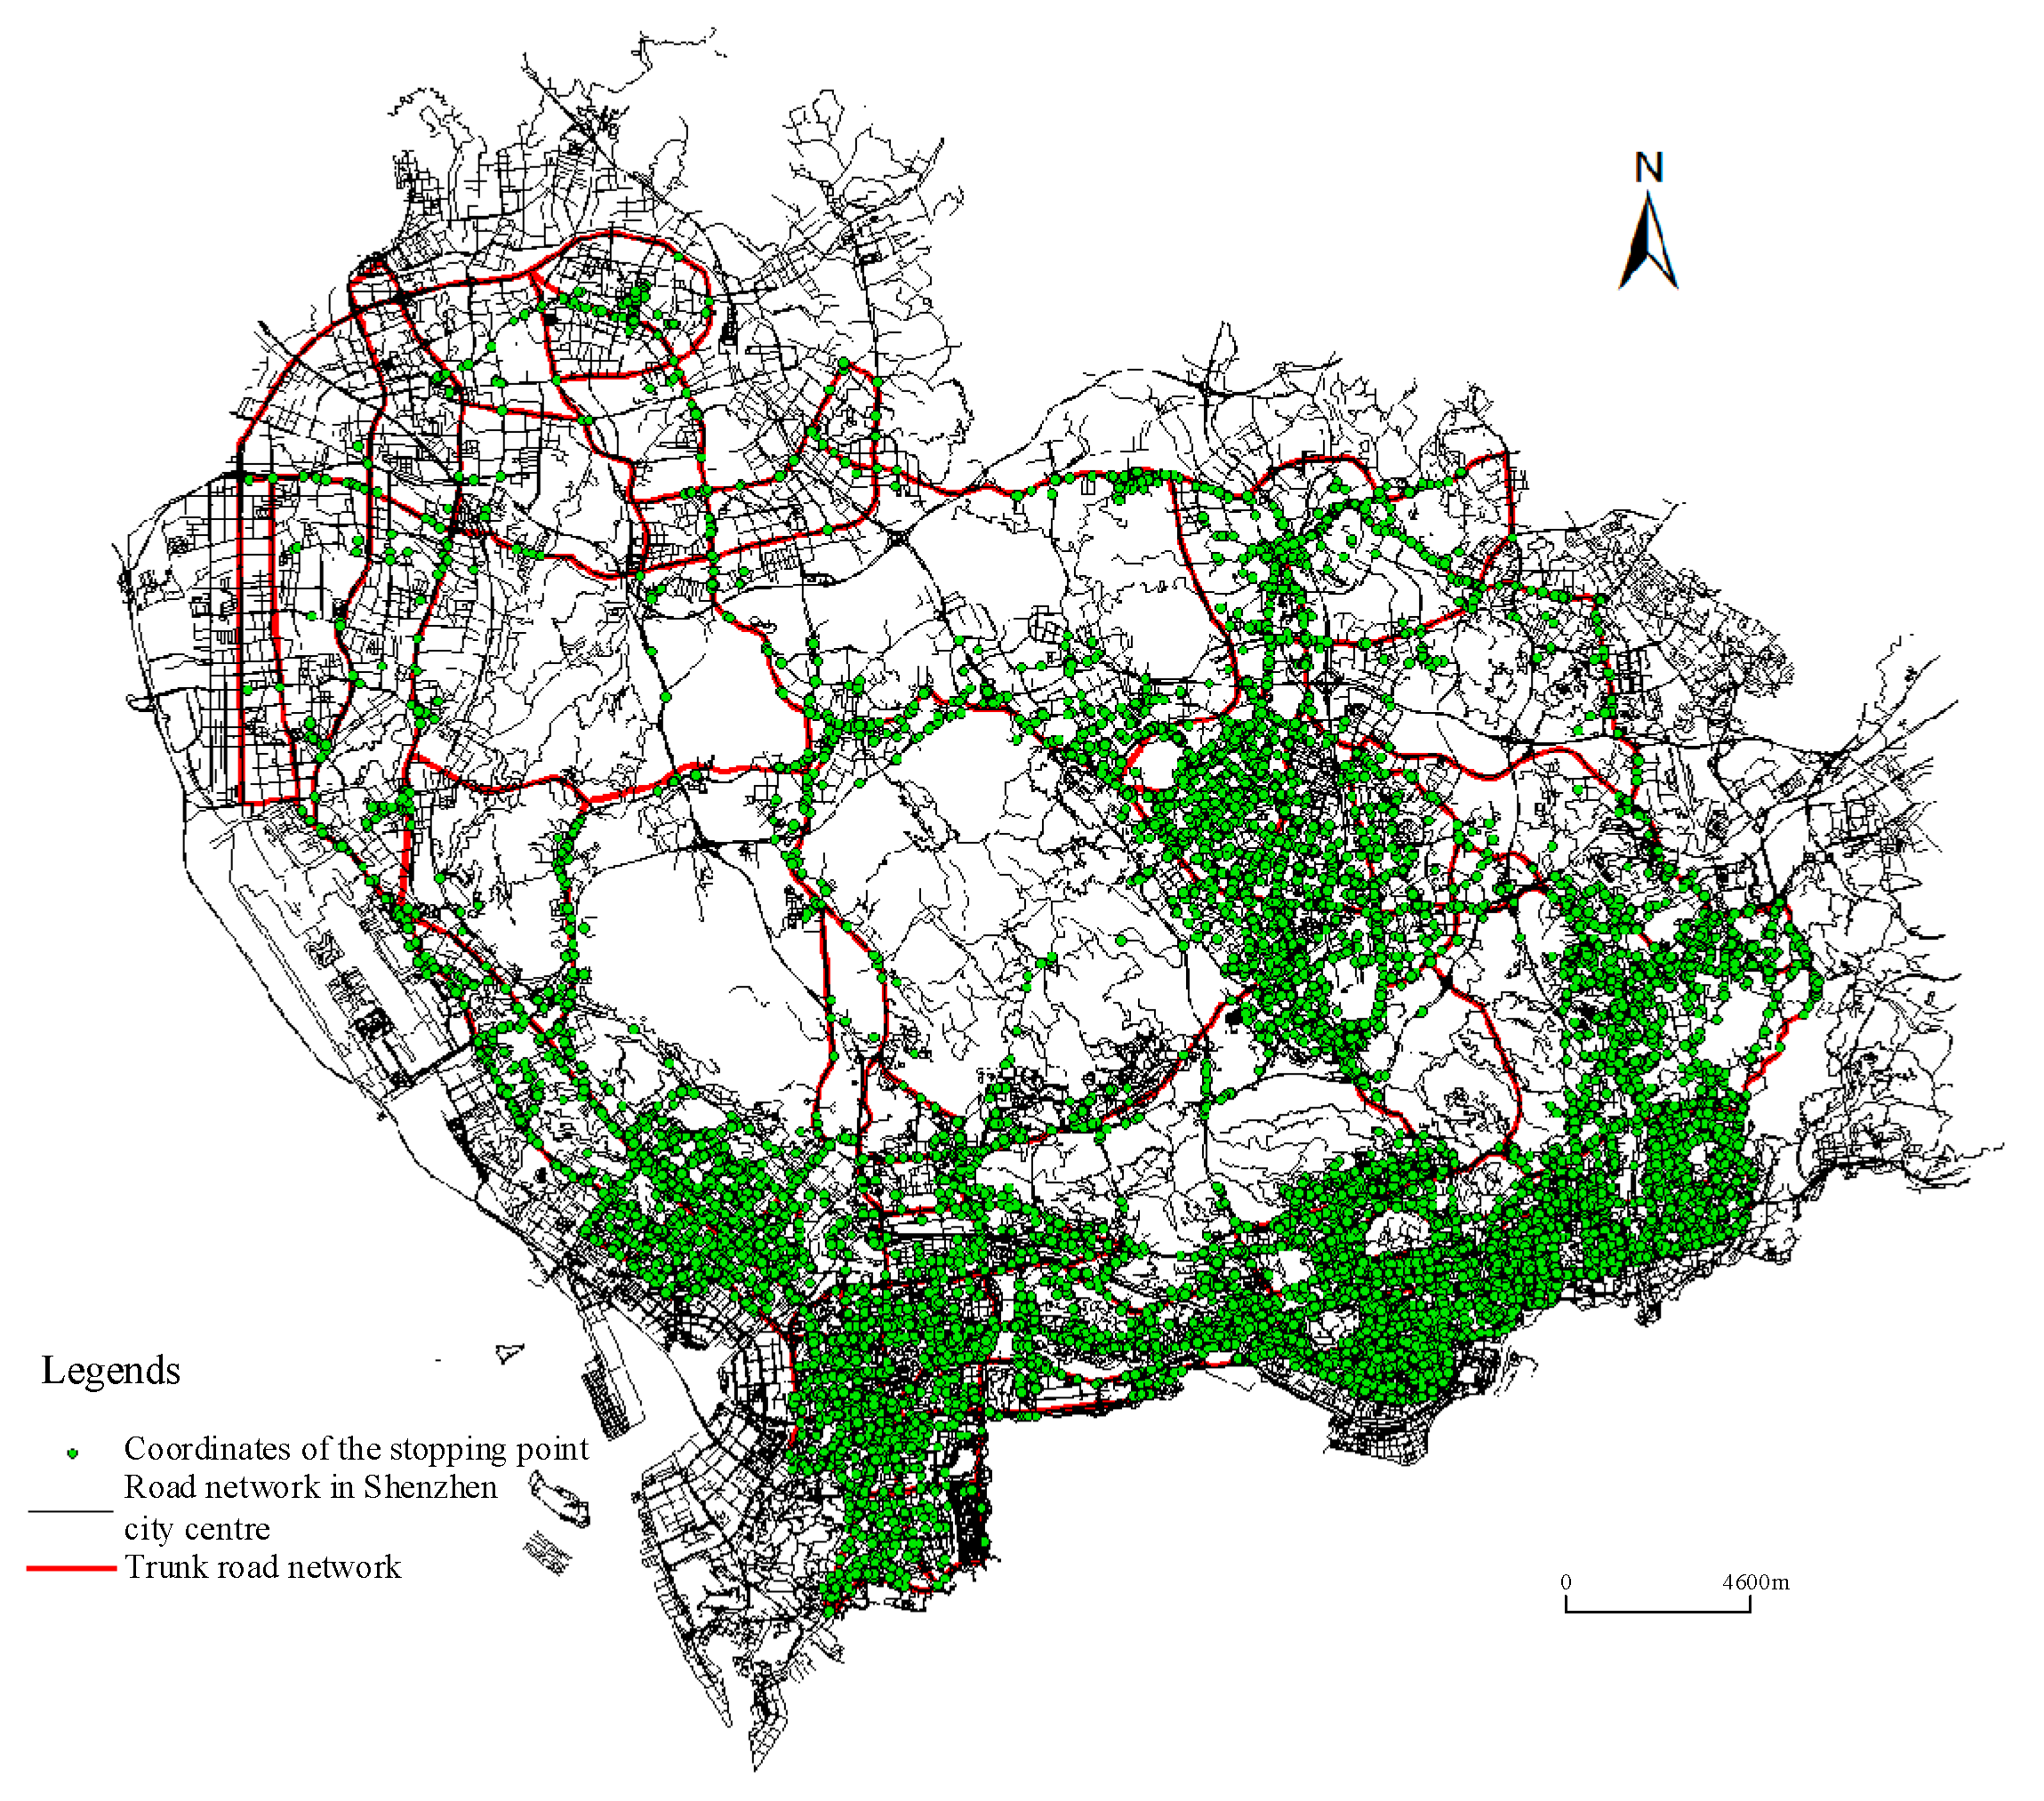
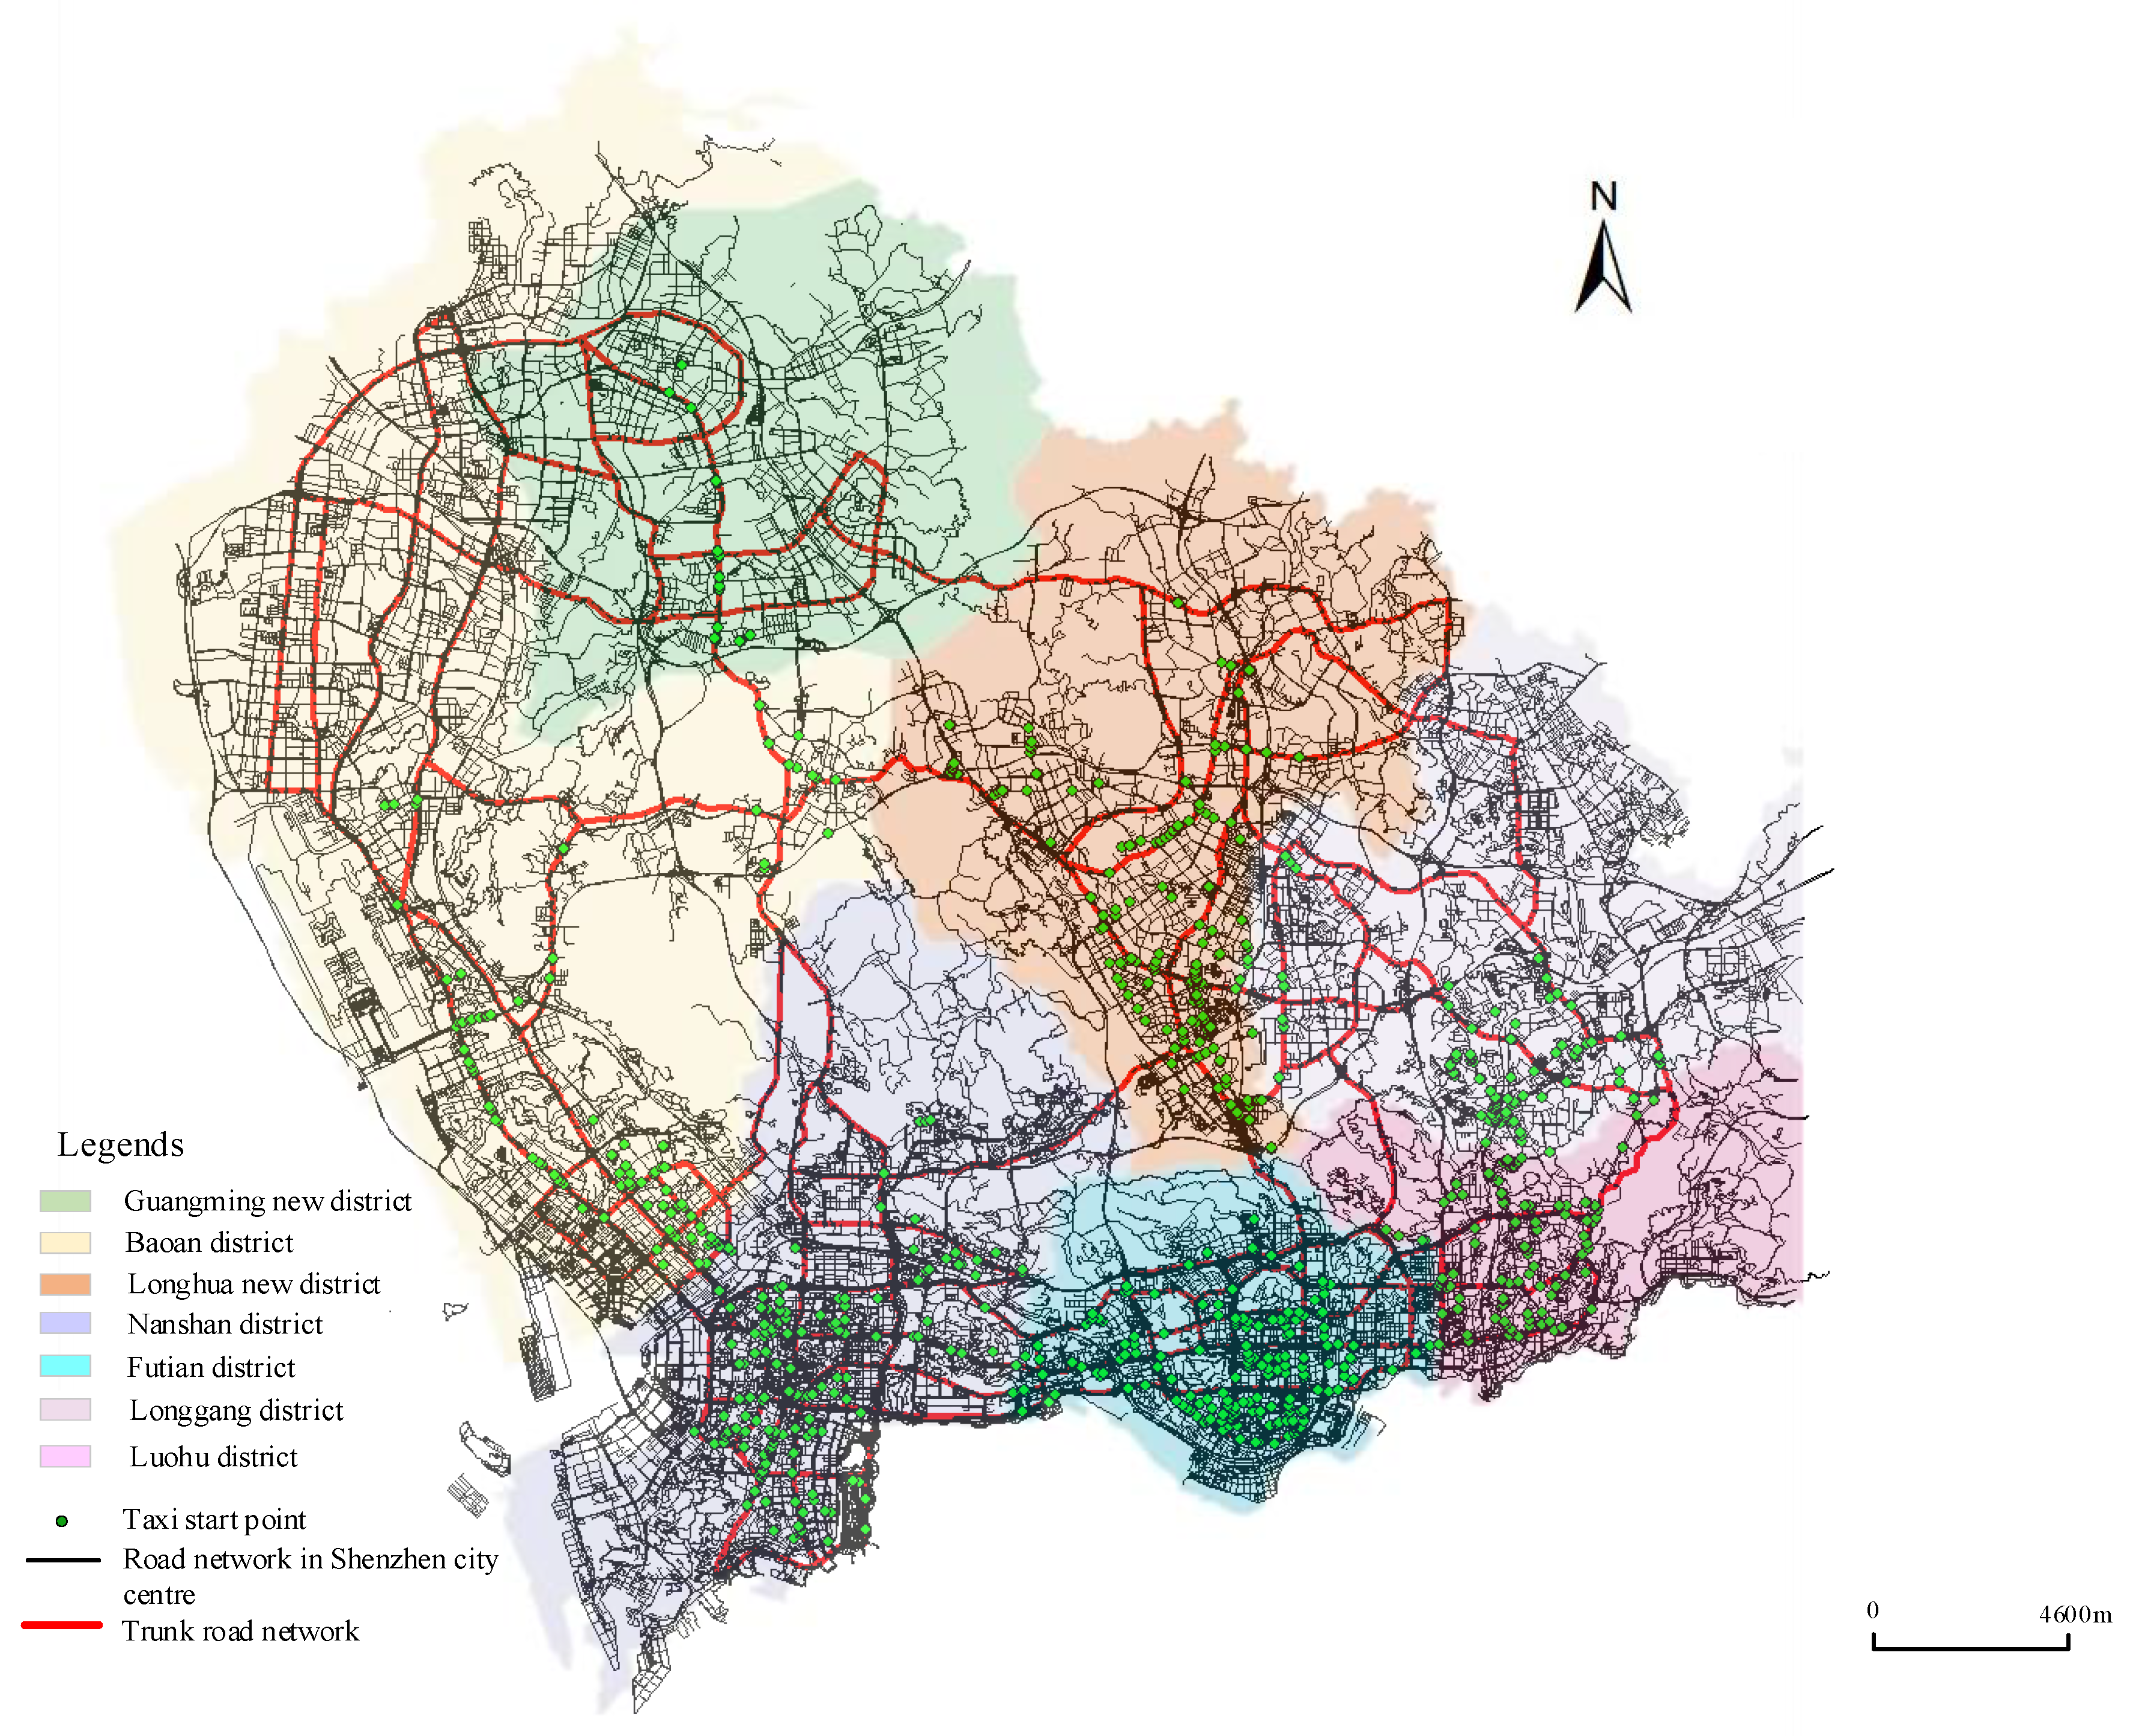
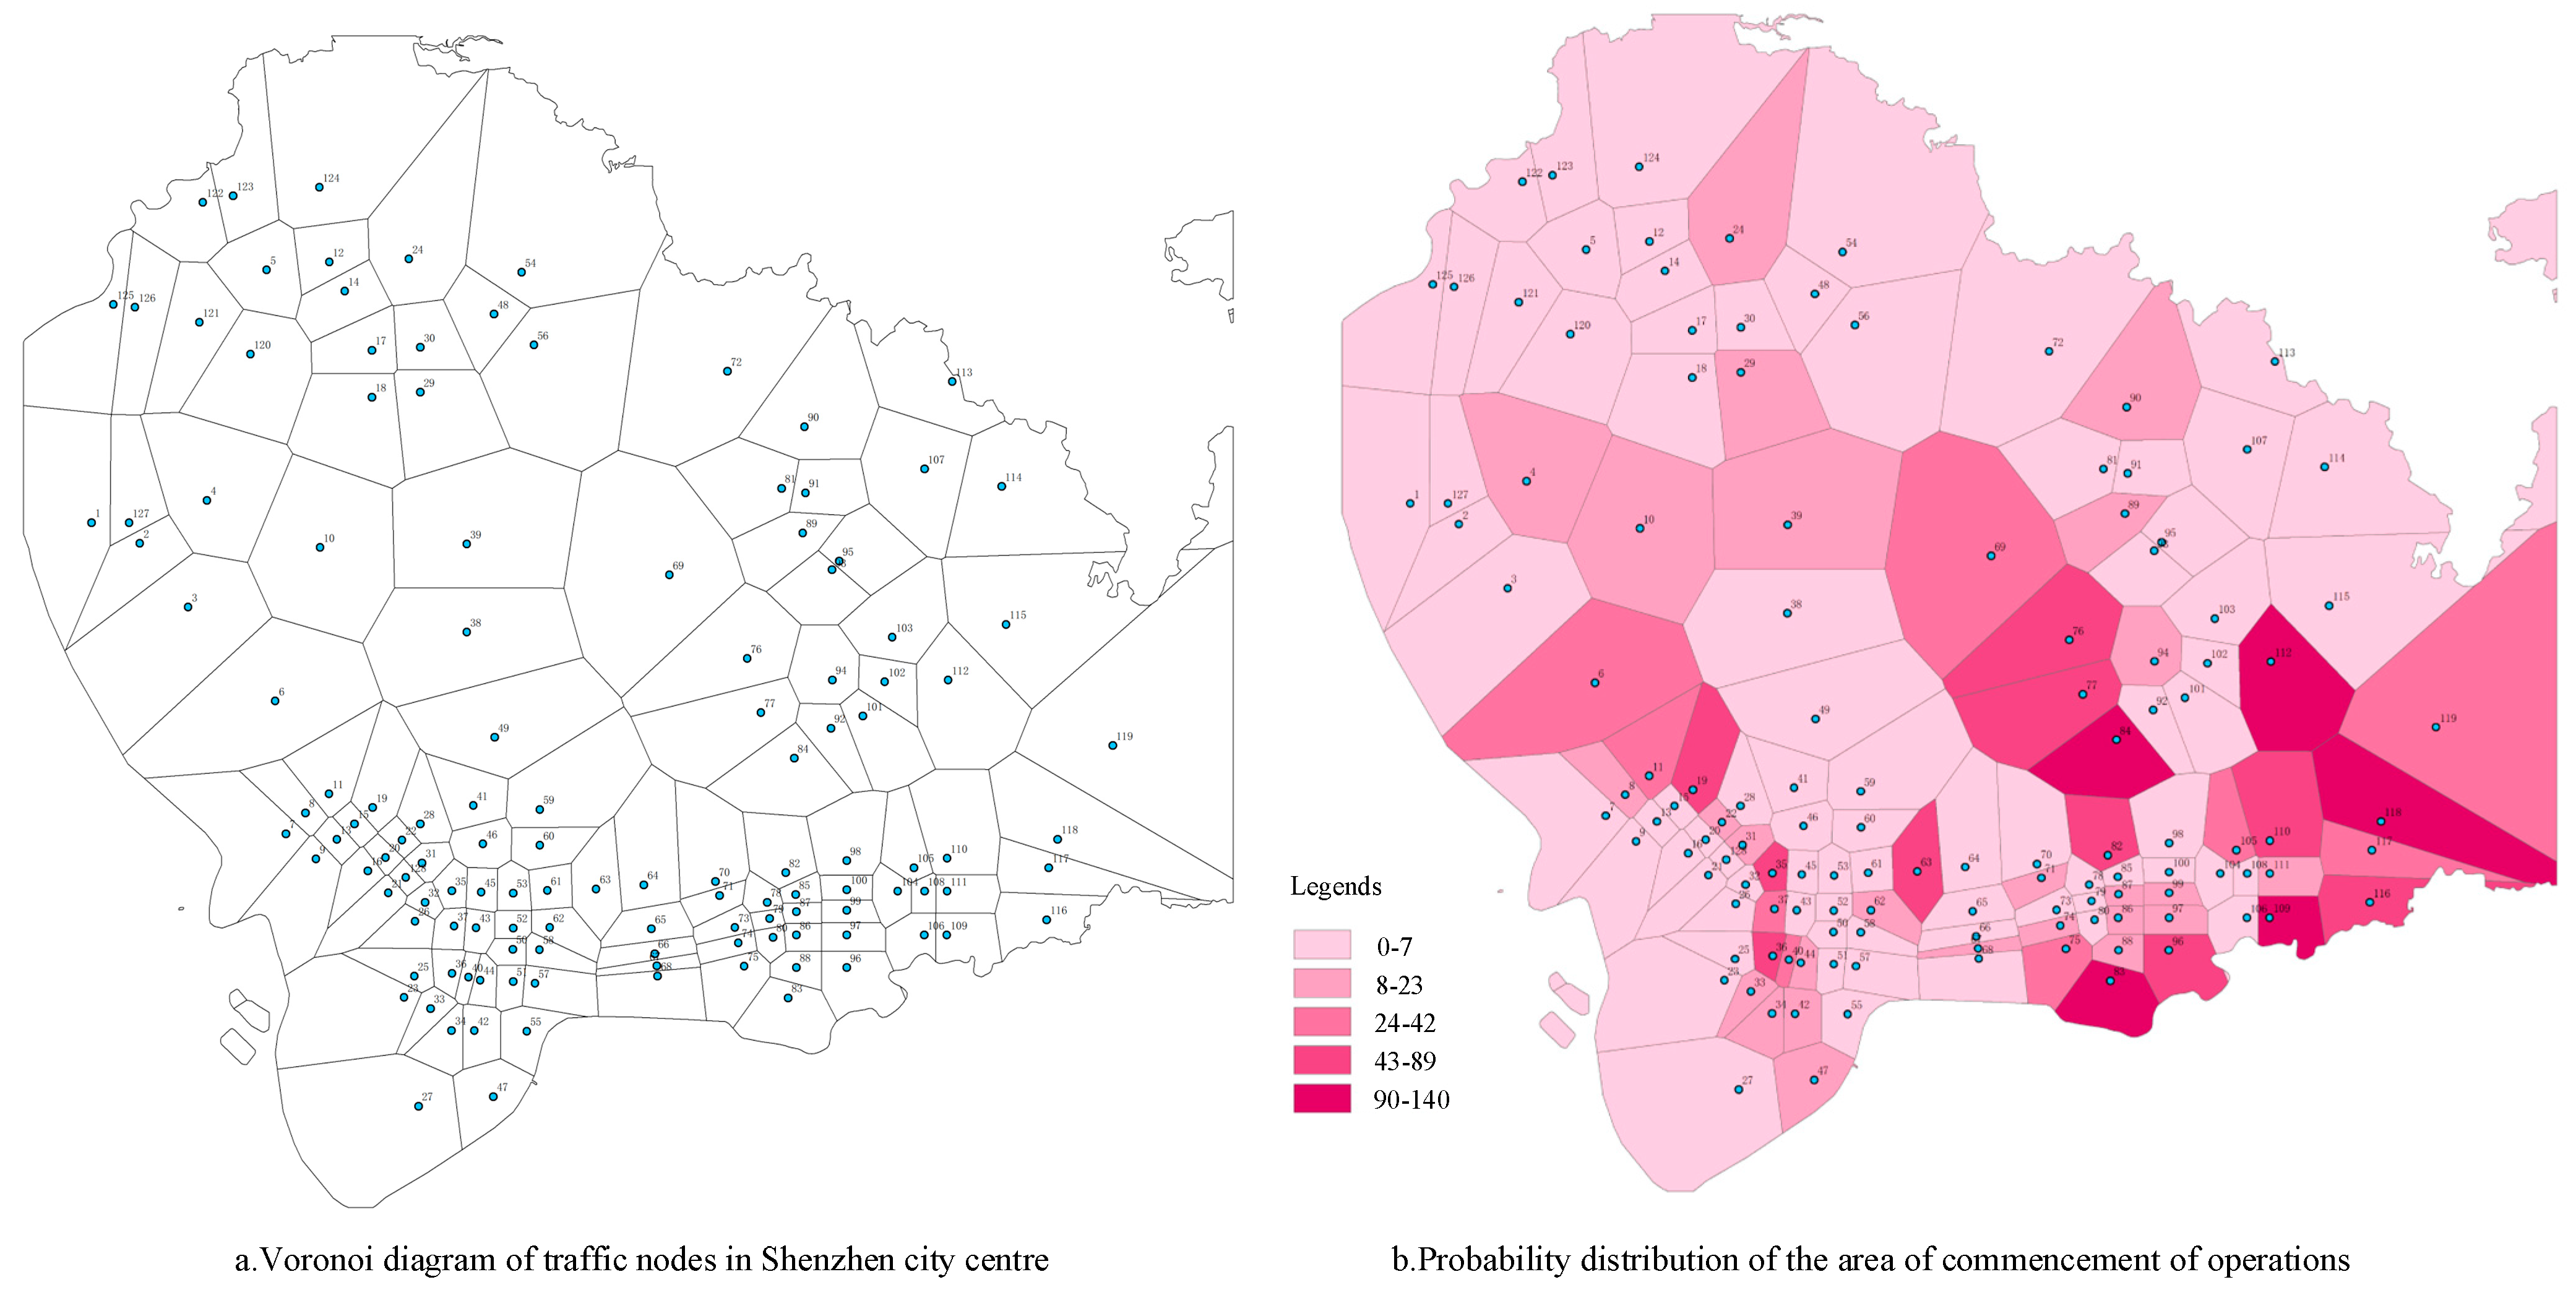
3.3.3. Spatial Distribution of Electric Taxi Starting Operations
3.4. OD Probability of Travelling by Electric Taxi
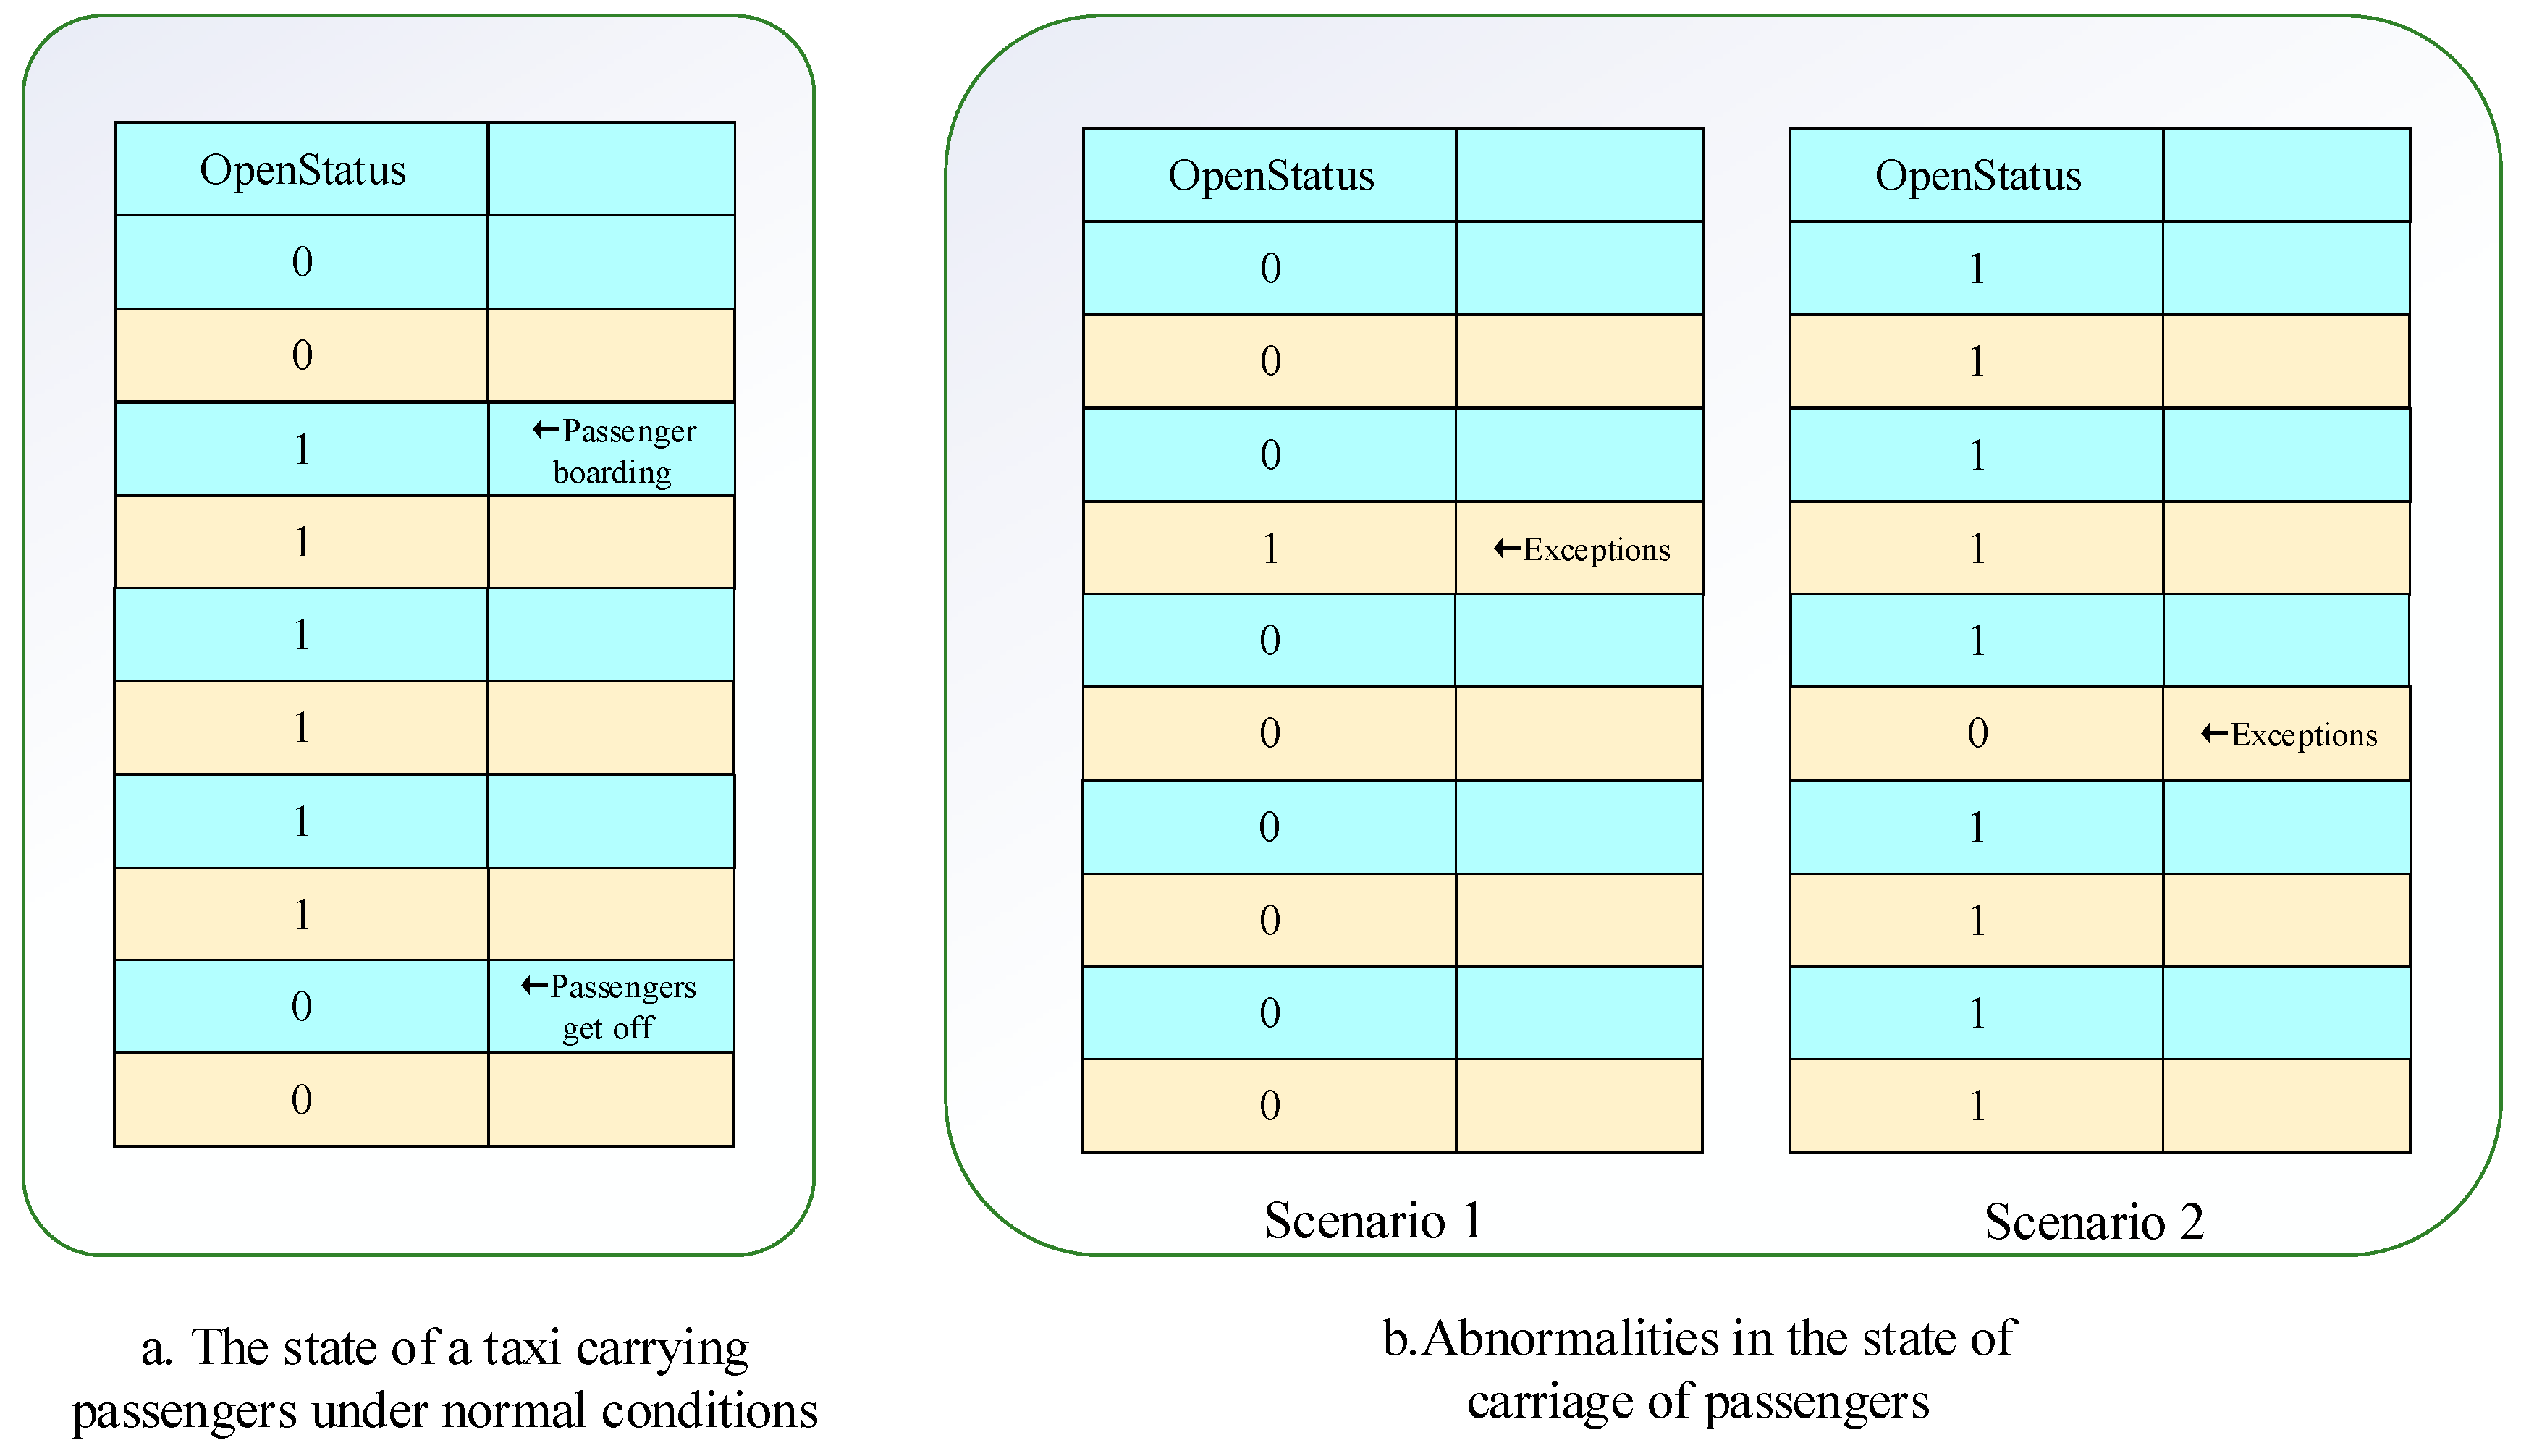
3.4.1. Travelling OD Extraction
- Extracting the operational trajectory Movetraj.
- Move the OpenStatus column in the Operations track down one row to get NewOpenStatus.
- Construct a new column StatusChange = OpenStatus − NewOpenStatus to record the change that occurred in the status of the loaded passenger, with 1 being boarded and −1 being disembarked.
- Determine whether the VehicleNum of the next data is equal to the VehicleNum of these data, and filter each taxi OD.
- Move all columns of the operation track up one row as a whole and splice them with the original operation track, keep the record with StatusChange = 1, and store it as a taxi travelling OD information table.

| ID | VehicleNum | SLng | SLat | ELng | ELat |
|---|---|---|---|---|---|
| 1 | 22,437 | 113.905806 | 22.577754 | 113.886984 | 22.561491 |
| 2 | 22,437 | 114.042281 | 22.60275 | 114.024386 | 22.636292 |
| … | … | … | … | … | … |
| 1292 | 25,956 | 113.928941 | 22.525063 | 113.918656 | 22.527208 |
| 1293 | 25,956 | 113.934658 | 22.485559 | 114.044273 | 22.542579 |
| … | … | … | … | … | … |
| 2045 | 28,098 | 113.928941 | 22.525063 | 114.055438 | 22.613142 |
| 2046 | 28,098 | 113.949449 | 22.583541 | 114.091121 | 22.543436 |
| … | … | … | … | … | … |
3.4.2. Probability of Travelling OD
3.5. Shortest Route for Travelling by Electric Taxi
- Initialise the node number, shortest path, and distance matrix.
- The loop traverses each node as a central node, selects i as the central node, initialises the distance between node i and other nodes, creates a labelling matrix, and determines whether the labelled node has been visited.
- Iterate through all the nodes and select the unvisited nearest node, MinNode.
- Add the distance and path from node i to the MinNode to the set of shortest distances and paths for node i.
- With the MinNode as the search object, calculate the distance to its neighbouring nodes and find the next shortest distance node, NextMinNode.
- If the NextMinNode is not the last node, repeat step 5.
- If i is not the last node, repeat step 3.
- Output the shortest path and distance between each node.
| Unit: m | Area 1 | Area 2 | Area 3 | … | Area 64 | … | Area 127 | Area 128 |
|---|---|---|---|---|---|---|---|---|
| Area 1 | 0 | 2343 | 5411 | … | 26,018 | … | 1413 | 16,415 |
| Area 2 | 2343 | 0 | 3068 | … | 23,675 | … | 934 | 14,072 |
| Area 3 | 5411 | 3068 | 0 | … | 20,607 | … | 3998 | 11,004 |
| … | … | … | … | … | … | … | … | … |
| Area 64 | 26,018 | 23,675 | 20,607 | … | 0 | … | 24,605 | 9603 |
| … | … | … | … | … | … | … | … | … |
| Area 127 | 1412 | 934 | 3998 | … | 24,605 | … | 0 | 15,002 |
| Area 128 | 16,415 | 14,072 | 11,004 | … | 9603 | … | 15,002 | 0 |
4. Electric Taxi Charging Decision-Making Model Based on DQN Algorithm
4.1. Definition of Elements of Reinforcement Learning in Charging Decisions
4.1.1. Basic Assumptions of the Model
- When charging is selected in an area of the city, charging is performed in this area.
- The travelling speed of the electric taxi is fixed and is the average speed of the operational trajectory data.
- During the charging process, most taxi drivers would like to replenish the required power in a short period of time in order to carry passengers subsequently. Therefore, it is assumed that fast-charging chargers are selected for the charging process.
- Taxi drivers always fully charge their vehicles at the end of the last working hour for the next operation of the vehicle, so it is assumed that the taxi is fully charged before operation, i.e., 90% of the battery capacity of the electric taxi.
- Exclude the time taken up by situations caused by road traffic congestion, natural disasters, or possible risks affecting the behavioural decisions of taxi drivers, i.e., the time to the destination from all origins is related to distance only.
- For the time being, we do not consider the impact of the drivers’ fatigue level and emotional state, as well as the carrier’s incentive and penalty mechanisms on drivers’ operational behavioural decisions.
4.1.2. State Space
4.1.3. Action Space
4.1.4. Reward Value Modelling
- 1.
- Take passengers on board
- 2.
- Idle
- 3.
- Fast charging up to 60%
- 4.
- Fast charging up to 90%
4.2. Optimisation of Electric Taxi Charging Decision Based on DQN Model
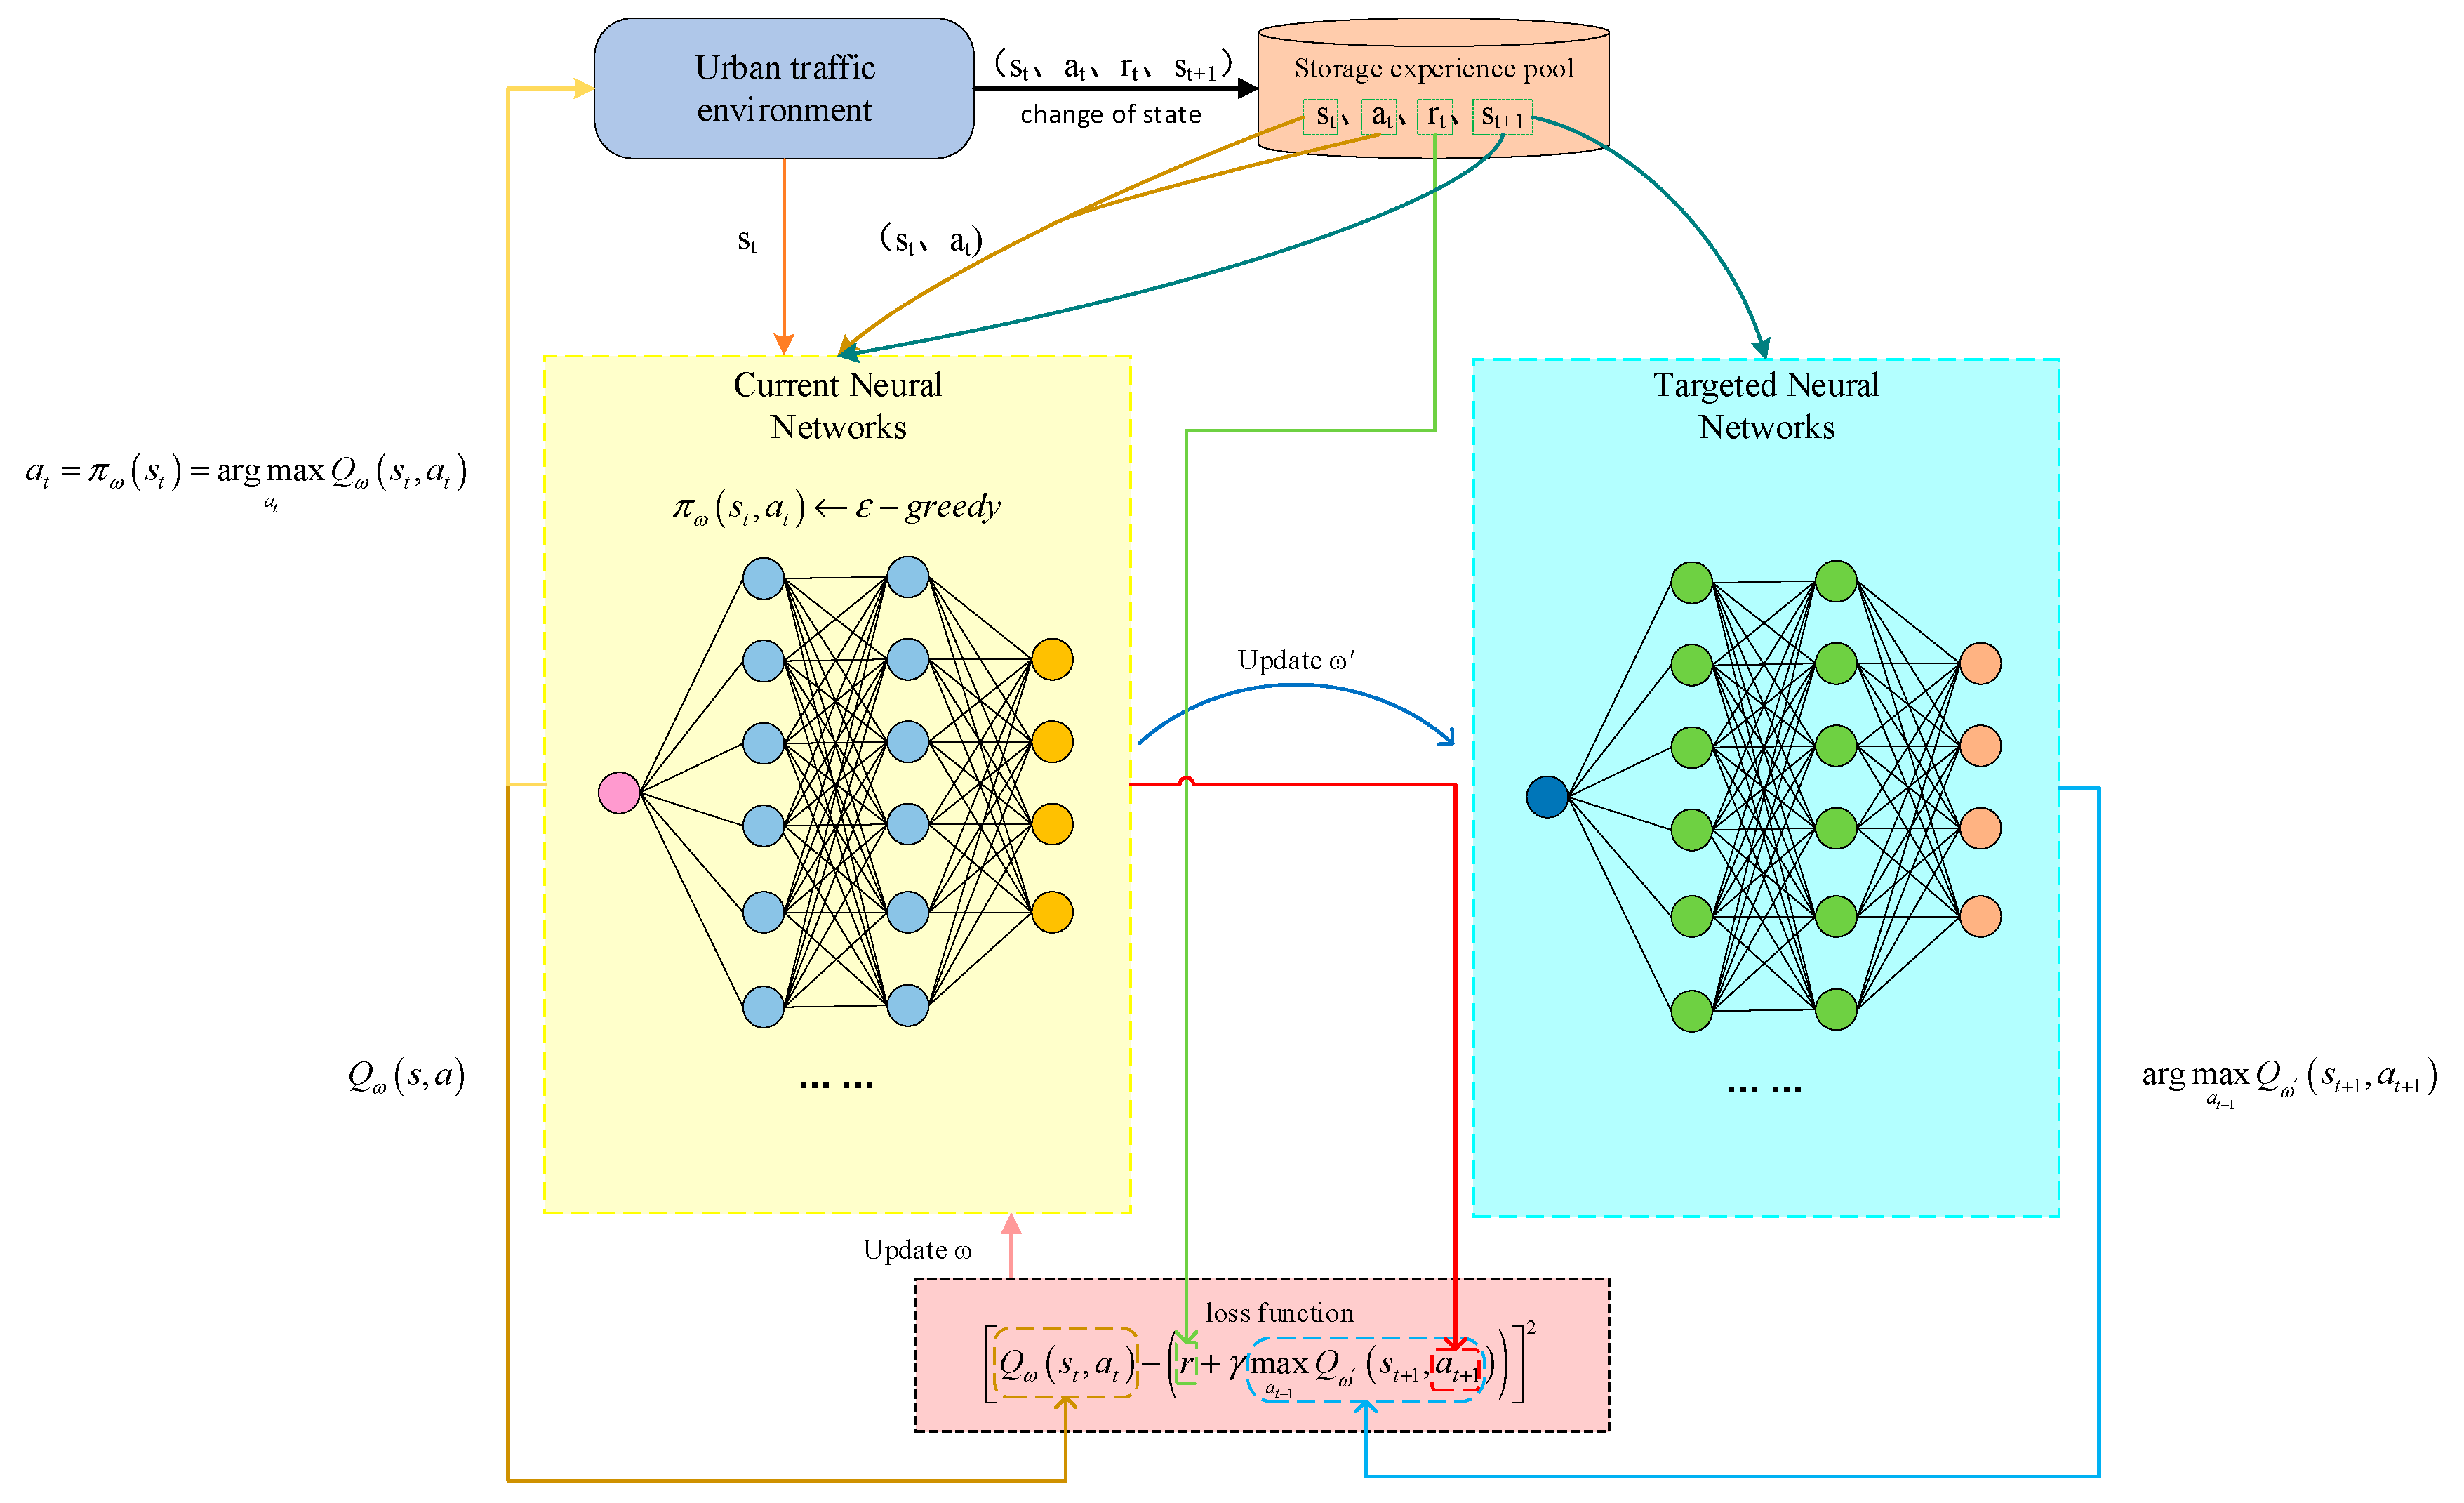
4.2.1. Deep Q Learning Algorithm
4.2.2. DQN-Based Charging Decision Optimisation Strategy Training Approach
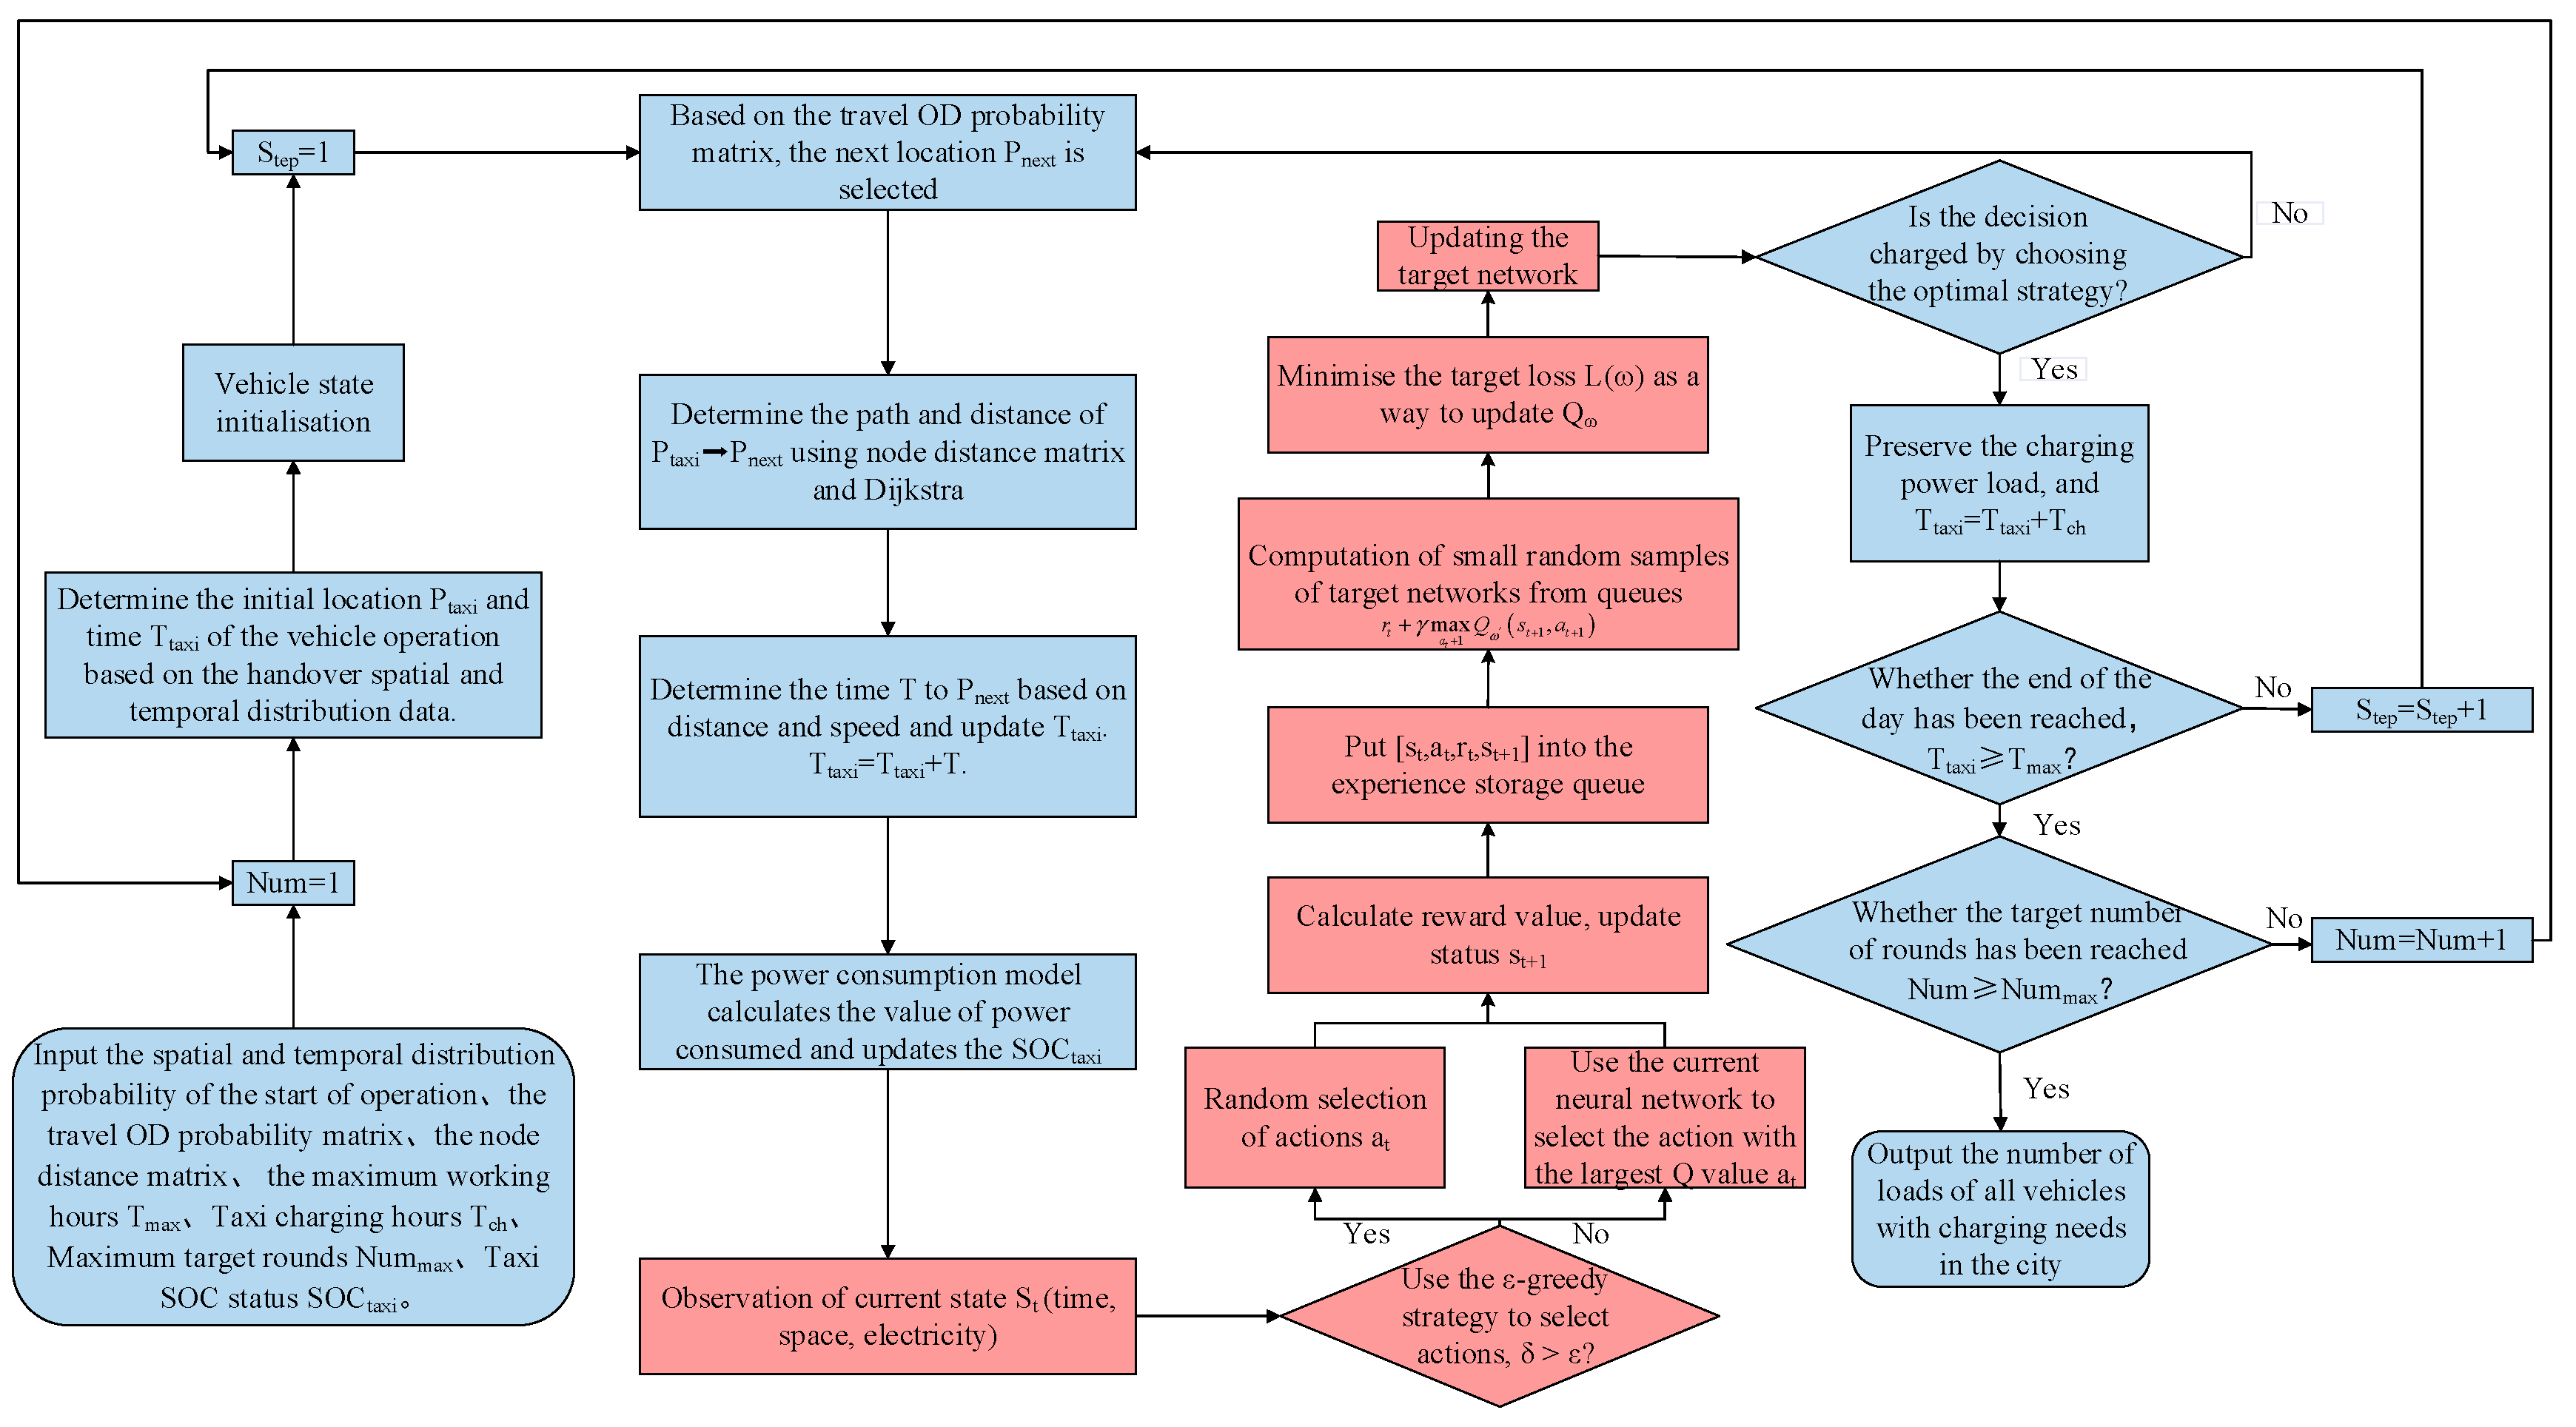
4.3. Electric Taxi Charging Load Prediction Process Based on Trajectory Data
5. Tests and Analyses
5.1. Intelligent Body Environment and Parameter Settings
5.2. Simulation Results and Analysis
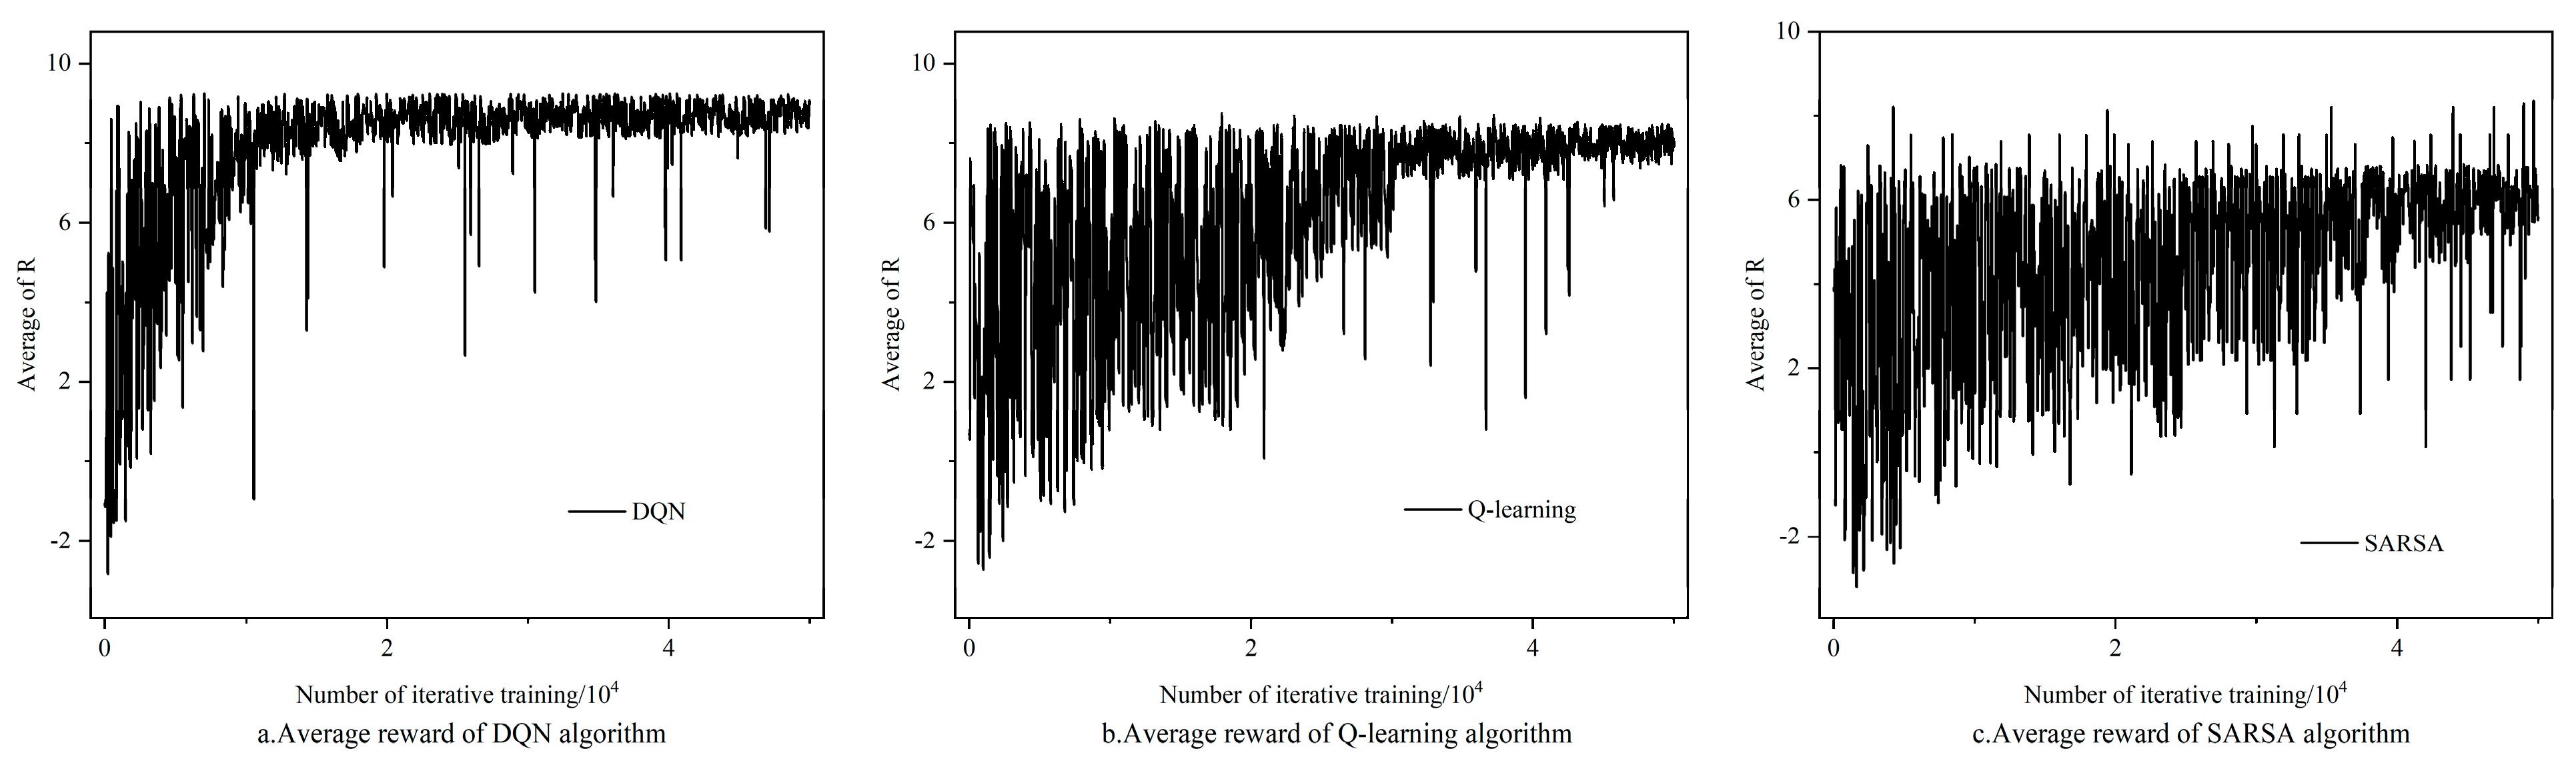
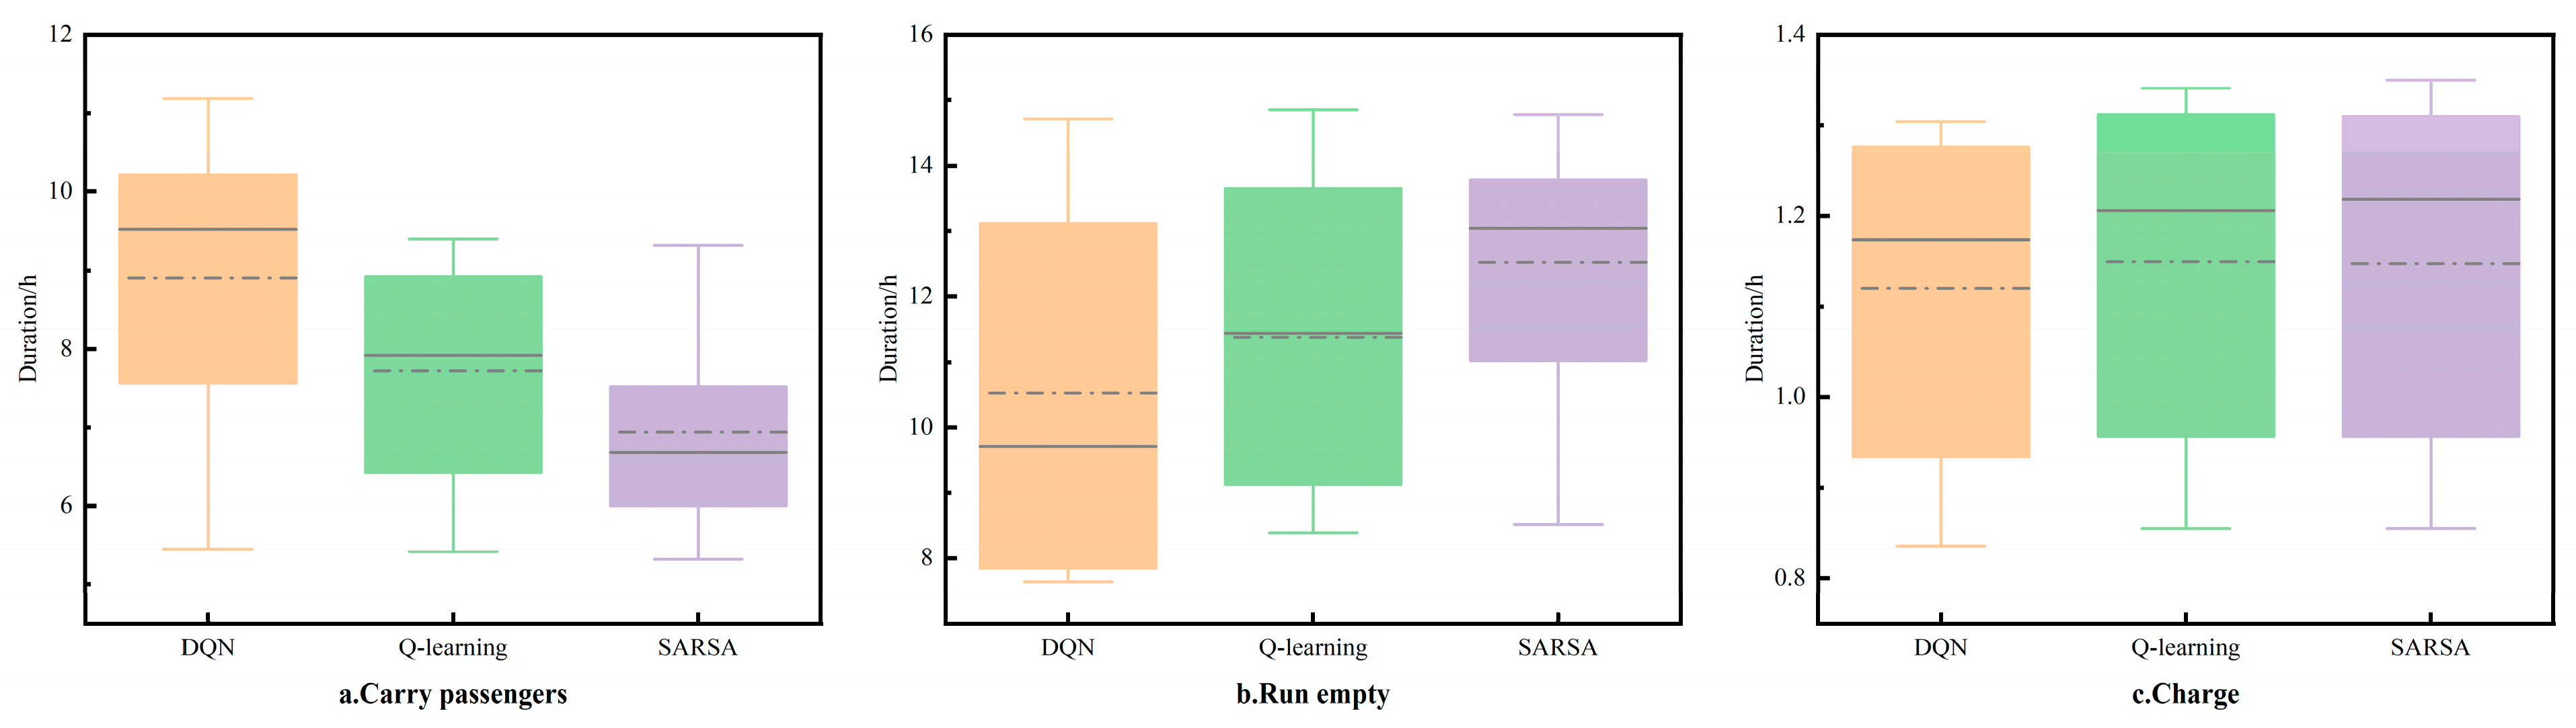
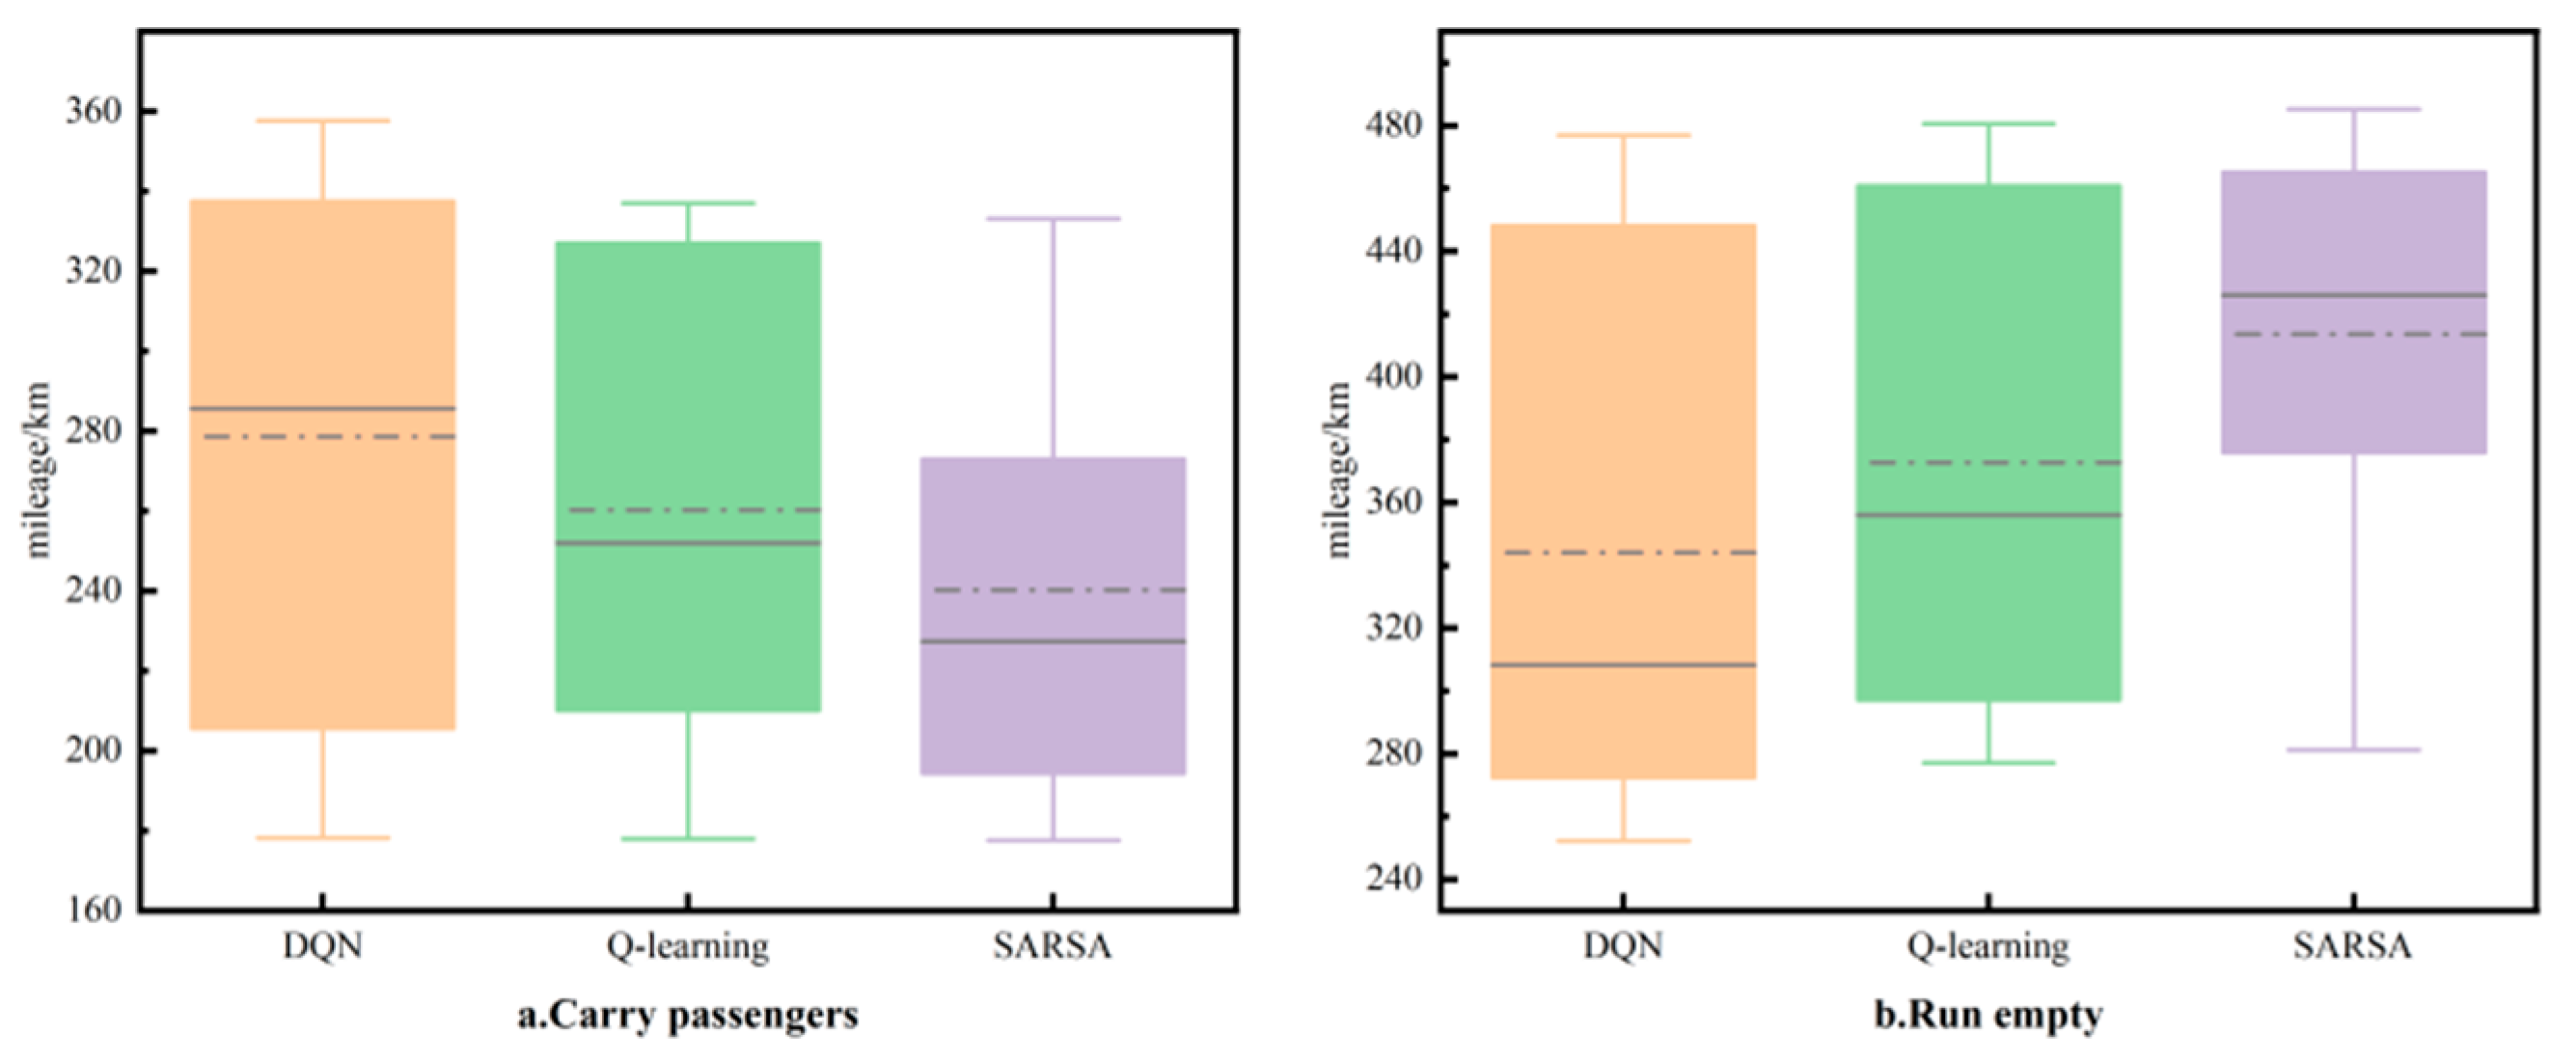
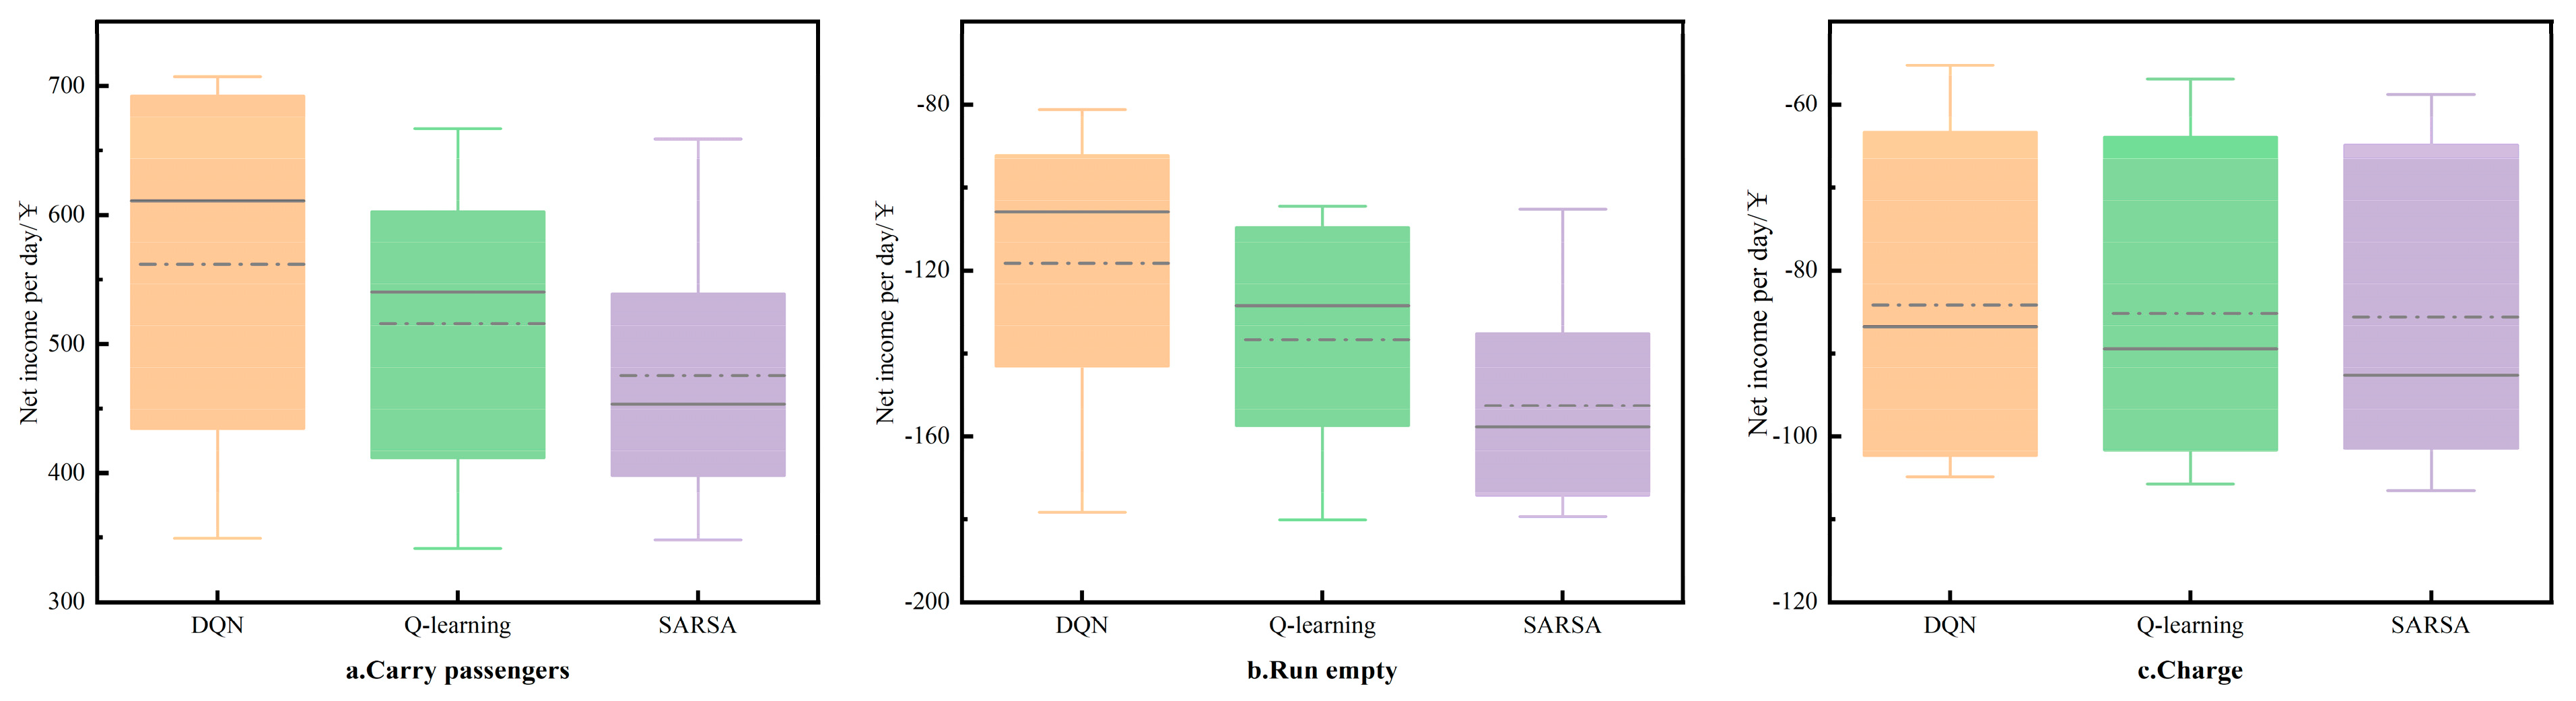
5.2.1. Analysis of Intensive Learning Outcomes
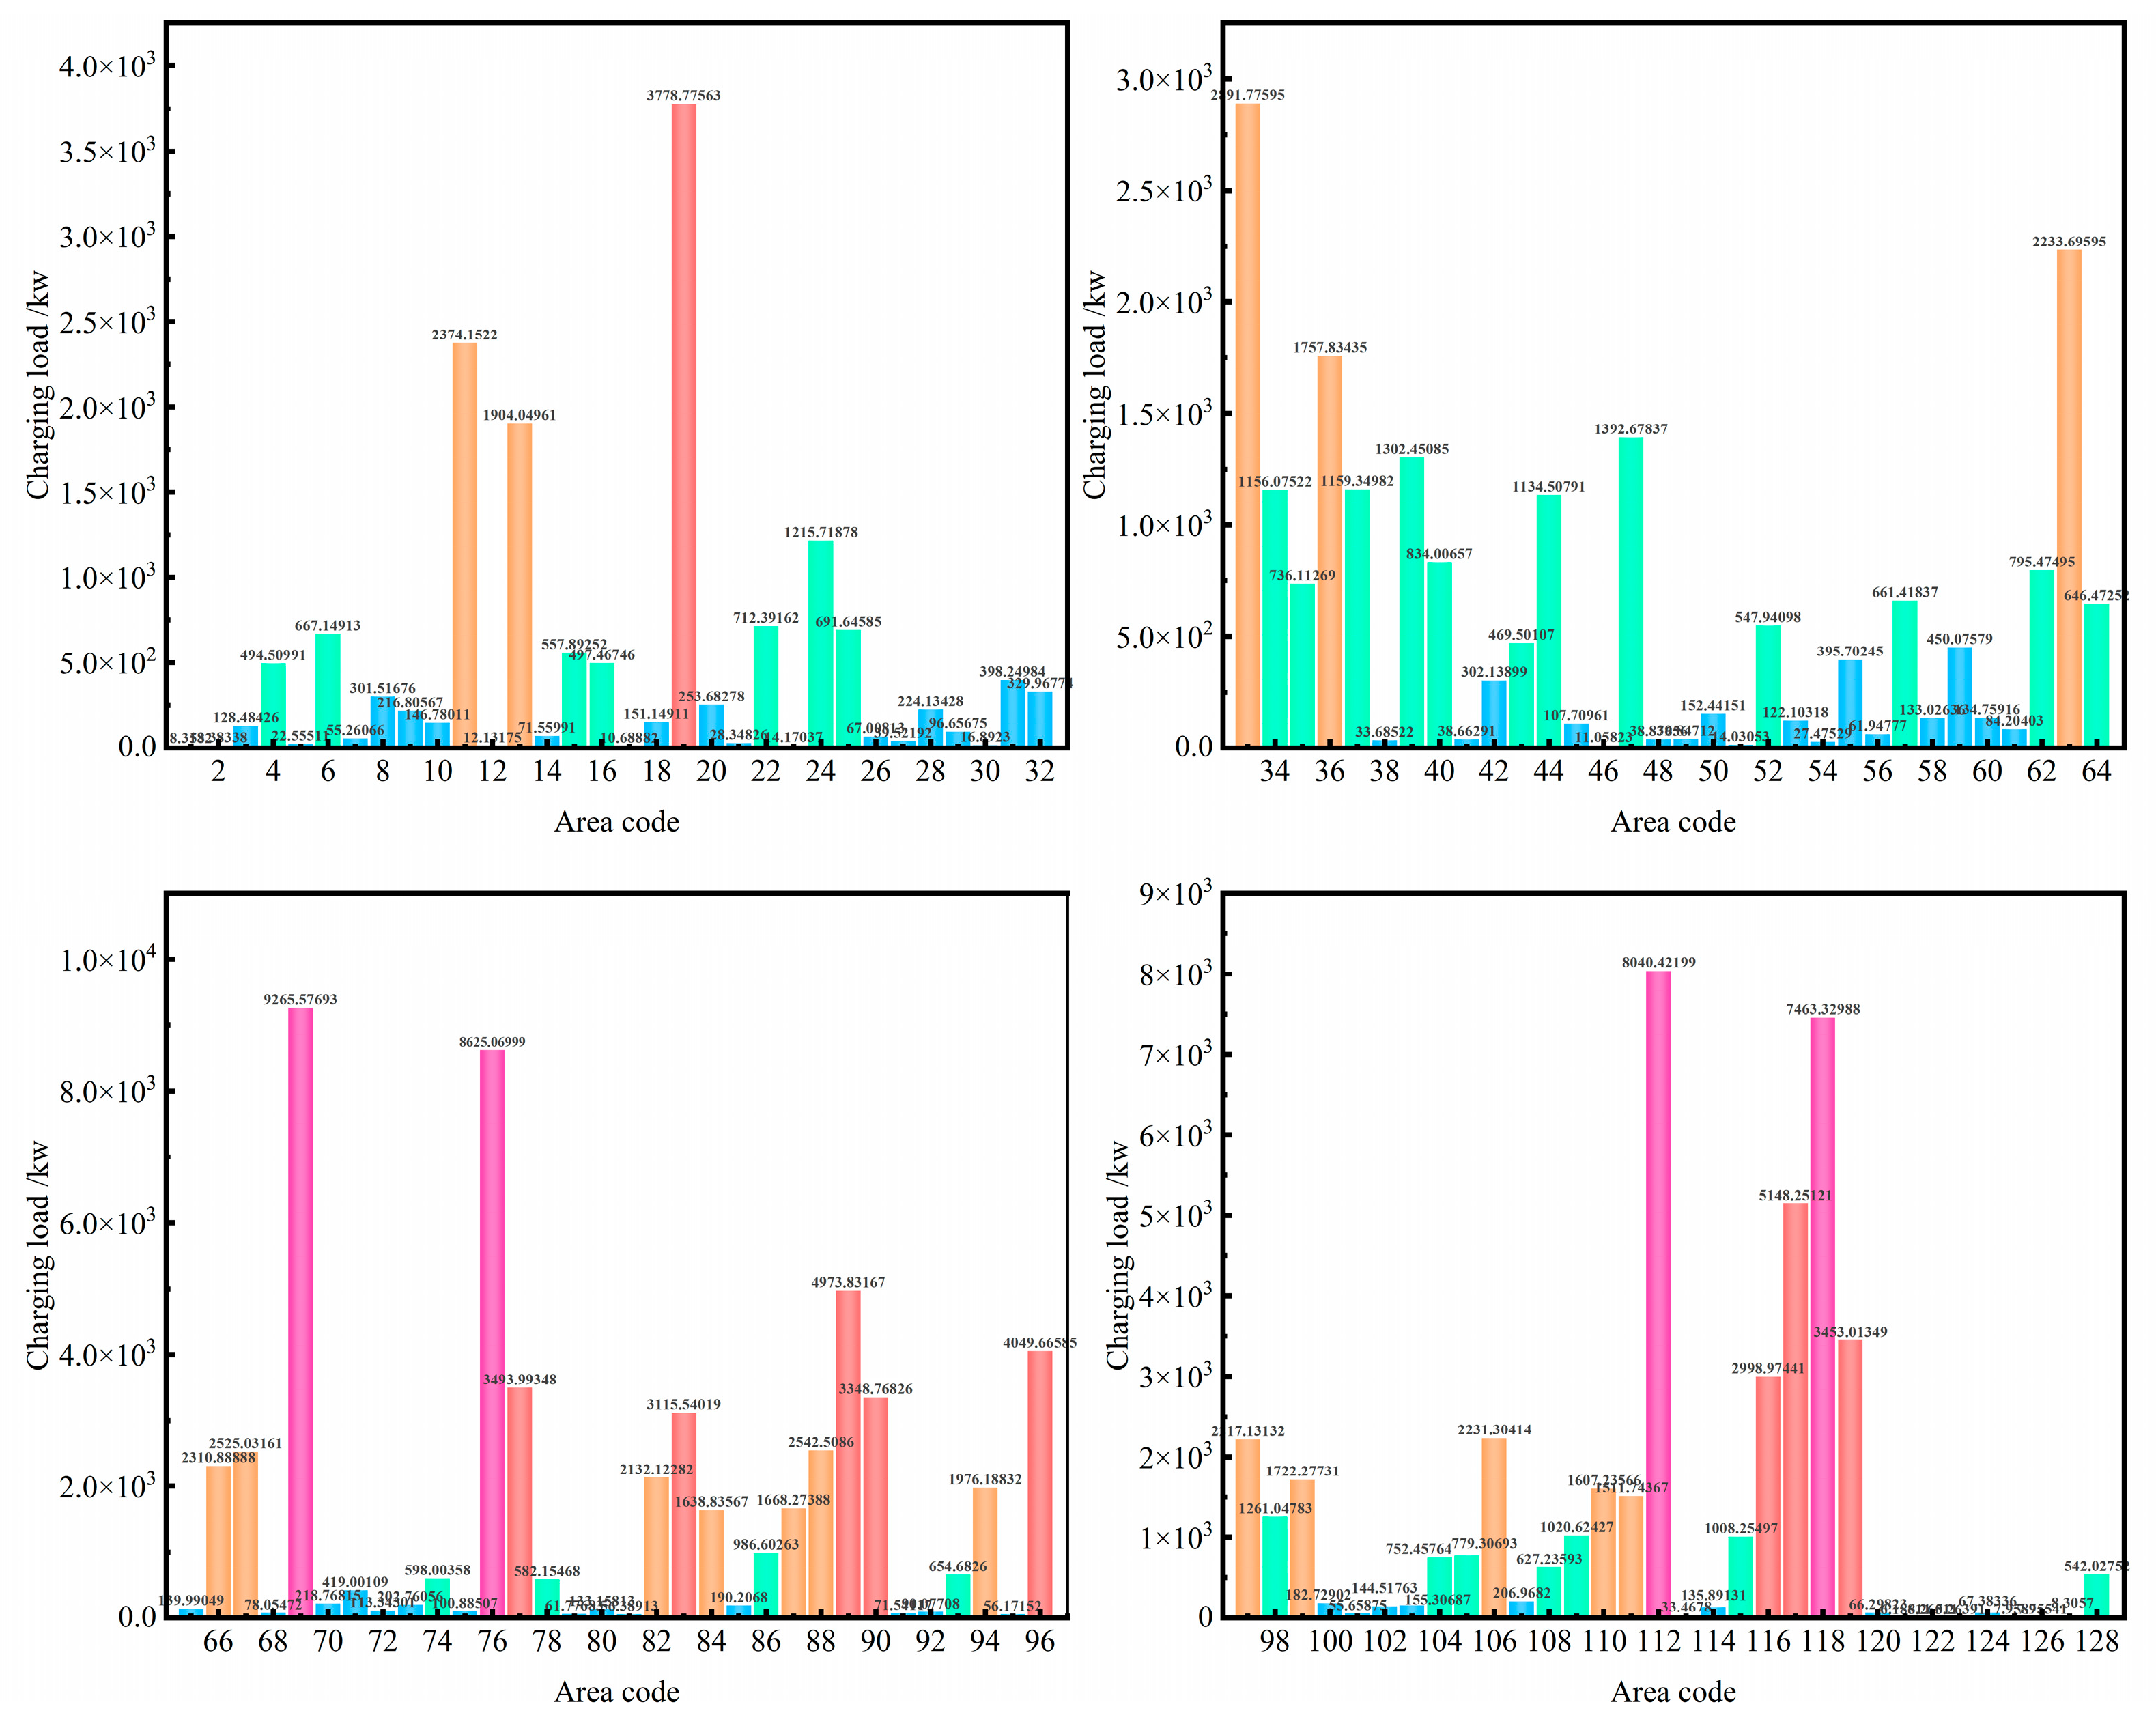
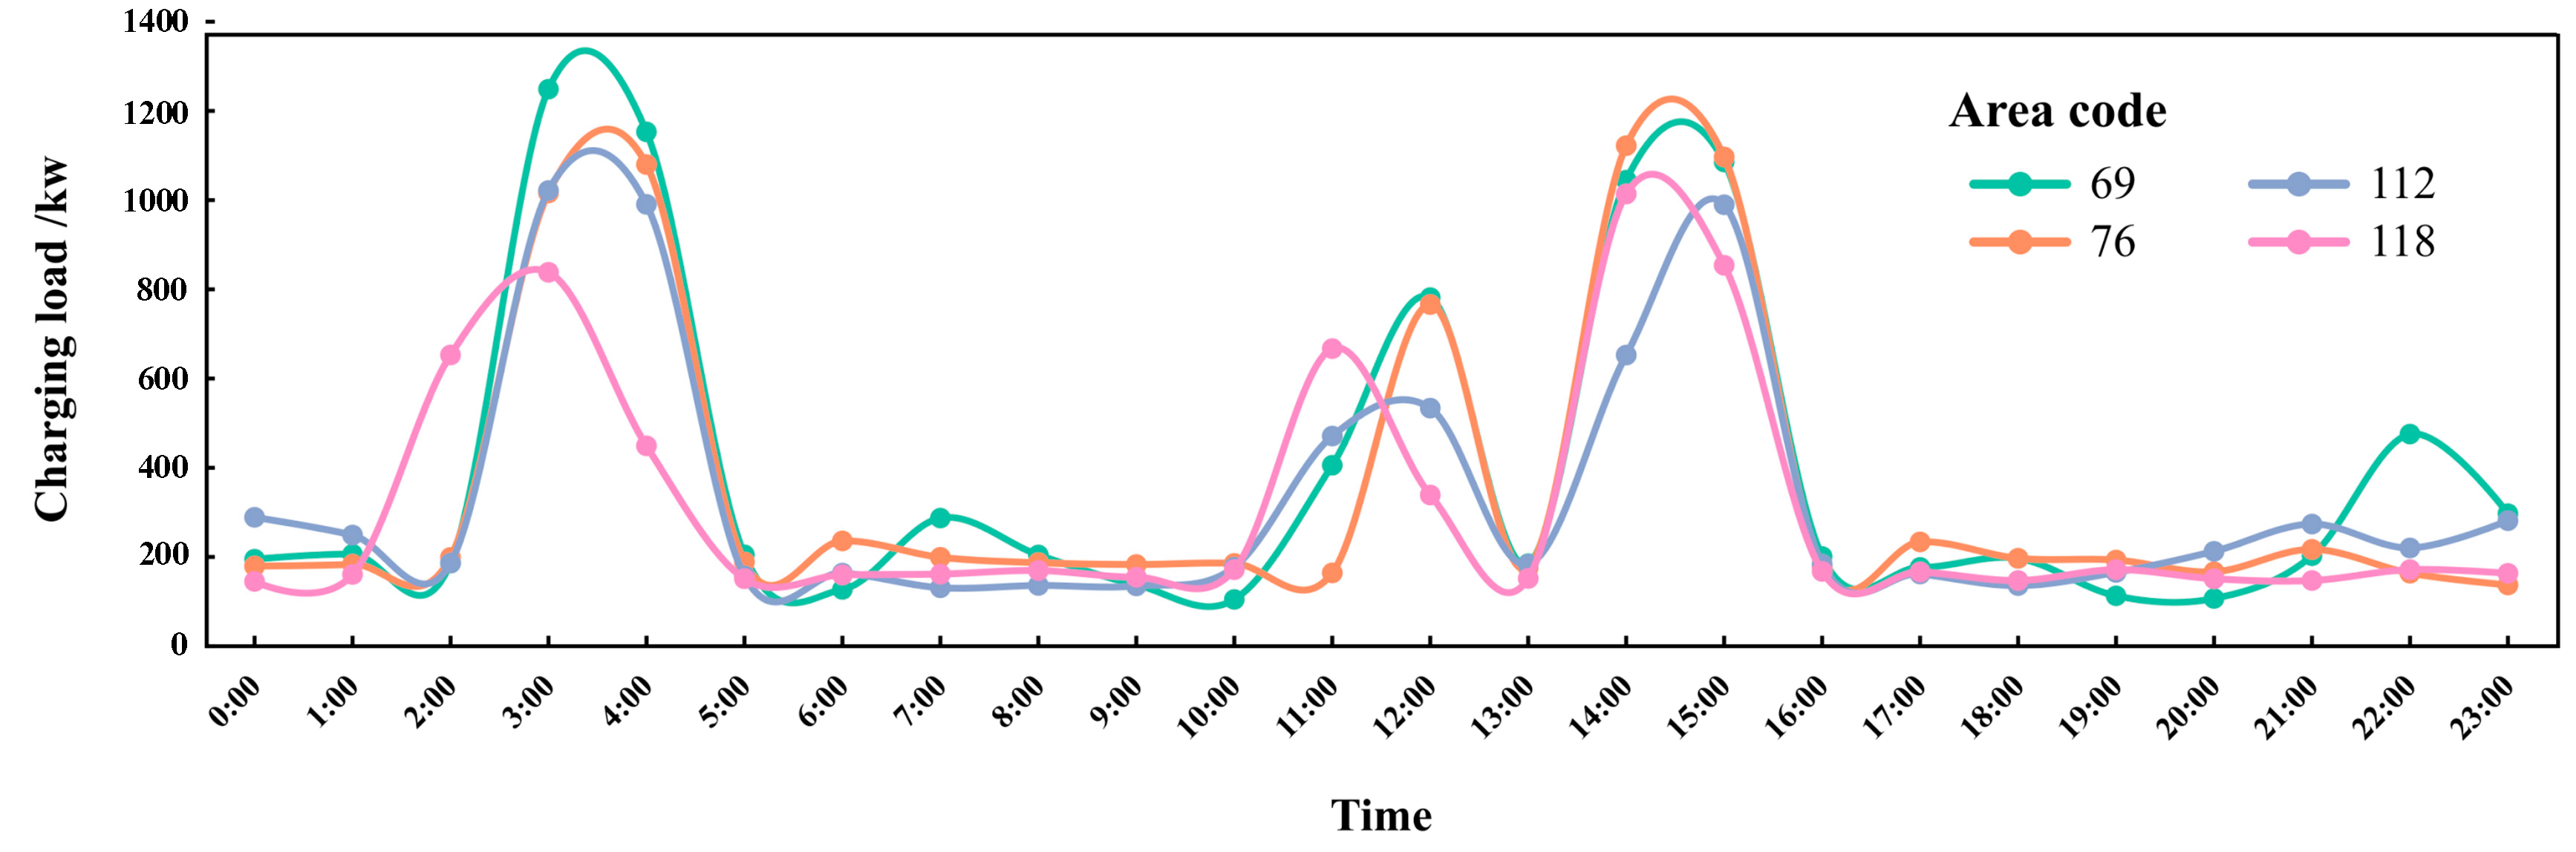
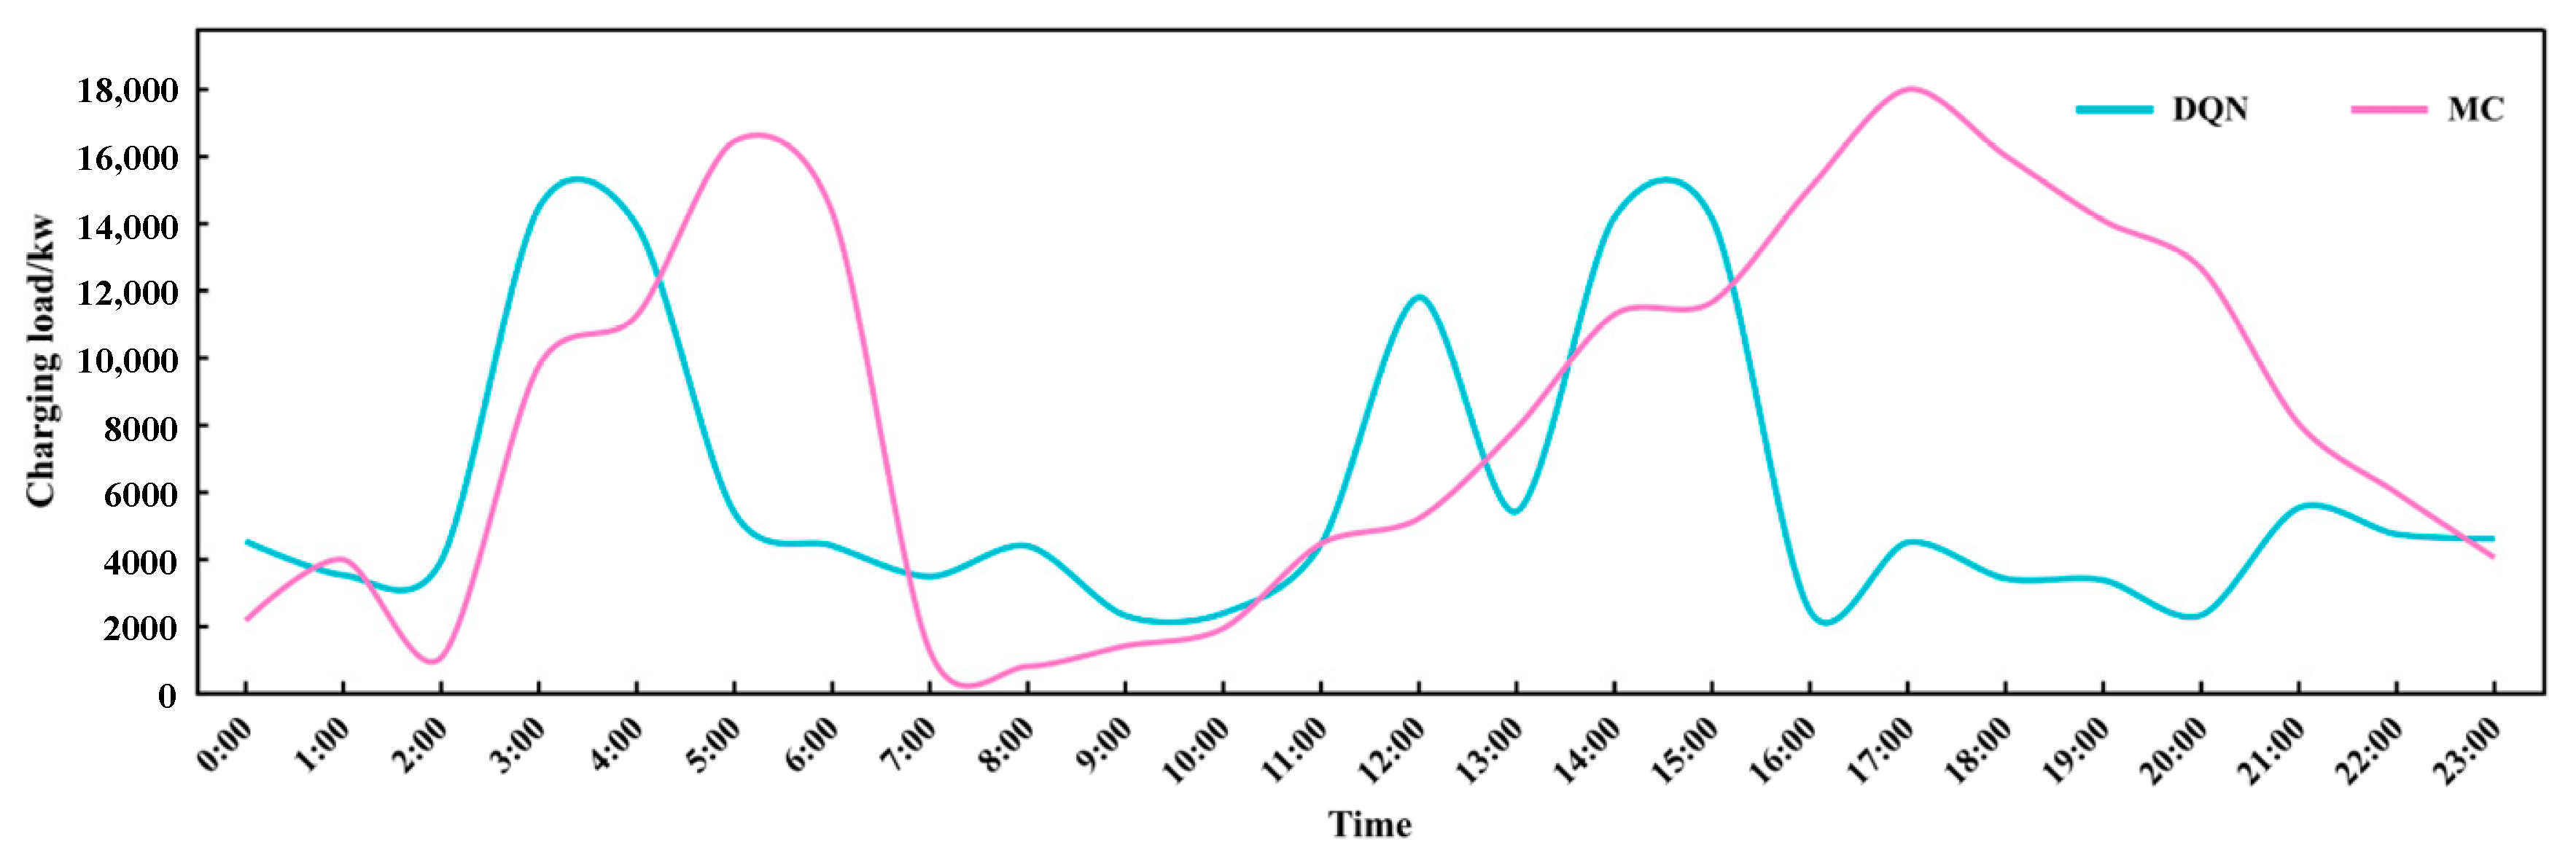
5.2.2. Charging Load Prediction Results
6. Conclusions
Author Contributions
Funding
Institutional Review Board Statement
Informed Consent Statement
Data Availability Statement
Conflicts of Interest
References
- Li, H.; Wang, Y.; Hu, Z.; Luo, F. Carrying Capacity Assessment of Distribution Network for Multiple Access Bodies Under the Background of Double Carbon. Power Syst. Technol. 2022, 46, 3595–3603. [Google Scholar]
- Wang, H.J.; Wang, B.; Fang, C.; Li, W.; Huang, H.W. Charging Load Forecasting of Electric Vehicle Based on Charging Frequency. IOP Conf. Ser. Earth Environ. Sci. 2019, 237, 062008. [Google Scholar] [CrossRef]
- Zhang, Z.; Wang, W.; Zhang, X. Renewable Energy Capacity Planning Based on Carrying Capacity Indicators of Power System. Power Syst. Technol. 2021, 45, 632–639. [Google Scholar]
- Zhang, X.; Xiao, X. Charging power demand of electric taxi modeling and influence factors analysis. Adv. Technol. Electr. Eng. Energy 2014, 33, 21–25. [Google Scholar]
- Santos, A.; McGuckin, N.; Nakamoto, H.Y.; Gray, D.; Liss, S. Summary of Travel Trends: 2009 National Household Travel Survey; Federal Highway Administration: Washington, DC, USA, 2011. [Google Scholar]
- Xing, Y.; Li, F.; Sun, K.; Wang, D.; Chen, T.; Zhang, Z. Multi-type electric vehicle load prediction based on Monte Carlo simulation. Energy Rep. 2022, 10, 966–972. [Google Scholar] [CrossRef]
- Yang, B.; Chen, W.; Wen, M.; Chen, X. Probabilistic load modelling of electric vehicle charging stations. Power Syst. Autom. 2014, 38, 67–73. [Google Scholar]
- Liao, B.J.; Yang, J.; Wen, F.S.; Li, B.; Li, L.; Mao, J.W. Temporal and spatial random distribution characteristics of electric taxi charging load. Electr. Power Constr. 2017, 38, 8–16. [Google Scholar]
- Xydas, S.; Marmaras, C.E.; Cipcigan, L.M.; Hassan, A.S.; Jenkins, N. Electric Vehicle Load Forecasting using Data Mining Methods. In Proceedings of the IET Hybrid and Electric Vehicles Conference 2013 (HEVC 2013), London, UK, 6–7 November 2013. [Google Scholar]
- Brady, J.; O’Mahony, M. Modelling charging profiles of electric vehicles based on real-world electric vehicle charging data. Sustain. Cities Soc. 2016, 26, 203–216. [Google Scholar] [CrossRef]
- Lee, B.; Lee, H.; Ahn, H. Improving Load Forecasting of Electric Vehicle Charging Stations Through Missing Data Imputation. Energies 2020, 13, 4893. [Google Scholar] [CrossRef]
- Zhang, T. New Energy Vehicle Ownership Reaches 18.21 Million. People’s Daily, 11 October 2023. [Google Scholar]
- Zhang, W.N.; Shen, K.; Yu, Y. Hands-on Learning for Intensive Learning; People’s Posts and Telecommunications Press: Beijing, China, 2022. [Google Scholar]
- Wang, G.; Chen, X.Y.; Zhang, F.; Wang, Y.; Zhang, D.S. Lessons learnt: Understanding long-term evolutionary patterns of shared electric vehicle networks. In Proceedings of the 2019 25th International Conference on Mobile Computing and Networking, Los Cabos, Mexico, 21–25 October 2019. [Google Scholar]
- Zou, F.; Luo, S.; Chen, Z. A spatial and temporal distribution identification method for taxi handover based on trajectory data. Comput. Appl. 2021, 41, 3376–3384. [Google Scholar]
- Spaccapietra, S.; Parent, C.; Damiani, M.L.; de Macedo, J.A.; Porto, F.; Vangenot, C. A Conceptual View on Trajectories. Data Knowl. Eng. 2008, 65, 126–146. [Google Scholar] [CrossRef]
- Yang, W.; Ai, T. Detection of refuelling stopping behaviours and extraction of refuelling station points by crowd-sourced vehicle trajectories. J. Surv. Mapp. 2017, 46, 918–927. [Google Scholar]
- Rocha, J.A.M.R.; Times, V.C.; Oliveira, G.; Alvares, L.O.; Bogorny, V. DB-SMoT: Adirection-based spatio-temporal clustering method. In Proceedings of the 2010 5th IEEE International Conference on Intelligent Systems, London, UK, 7–9 July 2010. [Google Scholar]
- Preparata, F.P.; Shamos, M.I. Computational Geometry: An Introduction; Springer: Berlin/Heidelberg, Germany, 1985; pp. 226–329. [Google Scholar]
- Zhang, F.H.; Liu, J.P.; Li, Q.Y. A shortest path optimisation algorithm based on Dijkstra’s algorithm. Remote Sens. Inf. 2004, 2, 38–41. [Google Scholar]
- Chen, Z. Research on Intelligent Site Selection Method of Urban Taxi Charging Station by Integrating Multi-Dimensional Information. Master’s Thesis, Fujian University of Engineering, Fuzhou, China, 2020. [Google Scholar]
- Mnih, V.; Kavukcuoglu, K.; Silver, D.; Graves, A.; Antonoglou, I.; Wierstra, D.; Martin, A. Riedmiller. Playing Atari with Deep Reinforcement Learning. arXiv 2013, arXiv:1312.5602. [Google Scholar]
- Sutton, R.; Barto, A. Reinforcement Learning: An Introduction; The MIT Press: Cambridge, MA, USA, 2018. [Google Scholar]
- Shan, Q. Research on Multi-Source Cooperative Operation Optimisation of Active Distribution Network. Master’s Thesis, Shandong University, Jinan, China, 2021. [Google Scholar]
- Shenzhen Development and Reform Commission. Notice on Issues Related to Further Improvement of Peak and Valley Time Division Electricity Tariff Policy in the Province; Shenzhen Power Supply Bureau Limited: Shenzhen, China, 2021. [Google Scholar]
- Chen, P.; Meng, Q.; Zhao, Y. Electric vehicle charging load calculation based on Monte Carlo method. J. Electr. Eng. 2016, 11, 40–46. [Google Scholar]
- Yang, W.; Li, Y.; Wang, H.; Feng, J.; Yang, J. Combination Prediction Method of Electric Vehicle Charging Load Based on Monte Carlo Method and Neural Network. J. Phys. Conf. Ser. 2021, 2022, 012026. [Google Scholar] [CrossRef]
| ID | VehicleNum | SArea | SLng | SLat | EArea | ELng | ELat |
|---|---|---|---|---|---|---|---|
| 1 | 22,437 | 37 | 113.905806 | 22.577754 | 11 | 113.886984 | 22.561491 |
| 2 | 22,437 | 95 | 114.042281 | 22.60275 | 112 | 114.024386 | 22.636292 |
| … | … | … | … | … | … | … | … |
| 1292 | 25,956 | 15 | 113.928941 | 22.525063 | 16 | 113.918656 | 22.527208 |
| 1293 | 25,956 | 12 | 113.934658 | 22.485559 | 75 | 114.044273 | 22.542579 |
| … | … | … | … | … | … | … | … |
| 2045 | 28,098 | 15 | 113.928941 | 22.525063 | 98 | 114.055438 | 22.613142 |
| 2046 | 28,098 | 20 | 113.949449 | 22.583541 | 84 | 114.091121 | 22.543436 |
| … | … | … | … | … | … | … | … |
| Unit: m | Area 1 | Area 2 | Area 3 | … | Area 64 | … | Area 127 | Area 128 |
|---|---|---|---|---|---|---|---|---|
| Area 1 | 0 | Inf | Inf | … | Inf | … | 1412 | Inf |
| Area 2 | Inf | 0 | 3068 | … | Inf | … | 934 | Inf |
| Area 3 | Inf | 3068 | 0 | … | Inf | … | Inf | Inf |
| … | … | … | … | … | … | … | … | … |
| Area 64 | Inf | Inf | Inf | … | Inf | … | Inf | Inf |
| … | … | … | … | … | … | … | … | … |
| Area 127 | 1412 | 934 | Inf | … | Inf | … | 0 | Inf |
| Area 128 | Inf | Inf | Inf | … | Inf | … | Inf | 0 |
| Parametric | Notation | Retrieve a Value | Unit |
|---|---|---|---|
| Battery capacity | 60 | kwh | |
| Fast-charging power | 40 | kw | |
| Electricity costs | 5 | rmb/kwh | |
| Average speed of operation | 42 | km/h | |
| Power consumption per unit | 0.2 | kwh/km |
| Time Period | 7:00–8:00, 11:00–18:00 | 8:00–11:00, 18:00–23:00 | 23:00–07:00 the Following Day | |
|---|---|---|---|---|
| Area Code | ||||
| 75, 83, 88, 96, 106, 109, 116 | 1.17 | 1.42 | 0.87 | |
| 37, 62, 66, 69, 76, 84, 85, 87, 89, 90, 94, 97, 99, 104, 111, 117, 119 | 1.14 | 1.39 | 0.84 | |
| 6, 34, 39, 40, 43, 59, 71, 74, 77, 80, 86, 98, 105, 108, 110, 112, 115 | 1.11 | 1.36 | 0.81 | |
| 8, 16, 35, 36, 60, 93, 100, 118 | 1.08 | 1.33 | 0.78 | |
| 3, 13, 19, 44, 47, 65, 67, 78, 81, 91, 102, 107 | 1.05 | 1.3 | 0.75 | |
| 20, 22, 26, 38, 42, 45, 52, 57, 58, 63, 68, 79, 82, 128 | 1.02 | 1.27 | 0.72 | |
| 11, 27, 28, 33, 55, 61, 72, 92, 114 | 0.99 | 1.24 | 0.69 | |
| 7, 15, 21, 24, 31, 32, 41, 46, 49, 53, 64, 73, 101, 102, 120 | 0.96 | 1.21 | 0.66 | |
| 2, 4, 5, 9, 10, 18, 23, 25, 29, 30, 50, 51, 70, 121, 126 | 0.93 | 1.18 | 0.63 | |
| 1, 12, 14, 17, 48, 54, 56, 95, 113, 122, 123, 124, 125, 127 | 0.9 | 1.15 | 0.6 | |
| Parametric | Notation | Retrieve a Value | Parametric | Notation | Retrieve a Value |
|---|---|---|---|---|---|
| Discount factor | γ | 0.8 | Samples drawn from the experience pool each time | Batch size | 50 |
| Larning rate | α | 0.001 | Number of training sessions (number of simulated taxis) | Num | 1000 |
| ε initial value | ε0 | 0.7 | Expected passenger yield per unit of time (rmb/h) | 8.79 | |
| ε decay rate | εrate | 0.01 | Low-battery penalty factor | 0.25 |
Disclaimer/Publisher’s Note: The statements, opinions and data contained in all publications are solely those of the individual author(s) and contributor(s) and not of MDPI and/or the editor(s). MDPI and/or the editor(s) disclaim responsibility for any injury to people or property resulting from any ideas, methods, instructions or products referred to in the content. |
© 2024 by the authors. Licensee MDPI, Basel, Switzerland. This article is an open access article distributed under the terms and conditions of the Creative Commons Attribution (CC BY) license (https://creativecommons.org/licenses/by/4.0/).
Share and Cite
Liu, X.; Liu, B.; Chen, Y.; Zhou, Y.; Yu, D. Electric Taxi Charging Load Prediction Based on Trajectory Data and Reinforcement Learning—A Case Study of Shenzhen Municipality. Sustainability 2024, 16, 1520. https://doi.org/10.3390/su16041520
Liu X, Liu B, Chen Y, Zhou Y, Yu D. Electric Taxi Charging Load Prediction Based on Trajectory Data and Reinforcement Learning—A Case Study of Shenzhen Municipality. Sustainability. 2024; 16(4):1520. https://doi.org/10.3390/su16041520
Chicago/Turabian StyleLiu, Xiaojia, Bowei Liu, Yunjie Chen, Yuqin Zhou, and Dexin Yu. 2024. "Electric Taxi Charging Load Prediction Based on Trajectory Data and Reinforcement Learning—A Case Study of Shenzhen Municipality" Sustainability 16, no. 4: 1520. https://doi.org/10.3390/su16041520
APA StyleLiu, X., Liu, B., Chen, Y., Zhou, Y., & Yu, D. (2024). Electric Taxi Charging Load Prediction Based on Trajectory Data and Reinforcement Learning—A Case Study of Shenzhen Municipality. Sustainability, 16(4), 1520. https://doi.org/10.3390/su16041520