Article

Examining Sustainability Alignment of Supplier Selection Criteria during Industrial Revolutions

1
School of Business, The University of the Virgin Islands, Orville E. Kean Campus—St. Thomas, Virgin Islands, VA 00802, USA
2
Albers School of Business and Economics, Seattle University, Seattle, WA 98122, USA
3
Quality Technology Inc., Edmonds, WA 98206, USA
*
Author to whom correspondence should be addressed.
Sustainability 2023, 15(22), 15930; https://doi.org/10.3390/su152215930
Submission received: 26 September 2023 / Revised: 29 October 2023 / Accepted: 2 November 2023 / Published: 14 November 2023

Abstract

:
Suppliers have evolved alongside industrial revolutions induced by their selection criteria for over two centuries. While sustainability has remained a pledge in their inter-creditor agreements, the claims of 11,000 scientists regarding the Earth’s colossal pollution and the calls of 196 nations to reach net-zero emissions by 2030 have accentuated concerns regarding the sustainability of supply selection criteria. Twenty supply selection criteria and seventy associated indicators were identified in industrial revolutions. The identified criteria and indicators were forwarded to 250 volunteers with expertise in the supply chain across six industries. Maintaining confidentiality, the volunteers were first requested to rank the criteria and related indicators concerning the three pillars of sustainability, the environmental, economic, and social, using The second request was to mark the percentage of influence of economic criteria and the related indicators on environmental and social sustainability. The third request was to state their professional views on sustainability during the industrial revolutions. Statistical analyses of the responses suggested that the identified supplier selection criteria were not equally driven by economic, environmental, and social sustainability. Supply chain professionals supported the statistical analysis and confirmed that the economic indicators dominating the selection of suppliers were significantly higher than the environmental and social criteria. They also confirmed that economic indicators have negatively impacted environmental and social sustainability during industrial revolutions. They recommended that transitioning into sustainable supply chains requires shifting emphasis from economic to environmental and social sustainability.

1. Introduction

Suppliers have evolved alongside industrial revolutions, induced by their selection criteria for over two centuries. They have marched in step from mechanization (Industry 1.0) to mass production (Industry 2.0), customization (Industry 3.0), and digitalization (Industry 4.0 and 5.0). They have grown from standalone competitors to supply chains as their selectivity has escalated from a single measure to multiple criteria [1]. Meanwhile, sustainability has remained a pledge with no enforceable indicators in their inter-creditor agreement, leading to a lack of social responsibility and ecological accountability [2].
Testament to this dearth are 11,000 scientists scrambling to their blackboards, concluding that the Earth suffers from colossal pollution and overexploitation of natural resources, leading to calamities such as the collapse of biodiversity, deforestation, ocean acidification, soil degradation, and unprecedented encounters with potent viruses [3]. Additional evidence has come from the claims of 196 signatory nations committed to the Paris Agreement to halve or at least cut their anthropogenic greenhouse gas emissions by 2030 compared with 1990, reaching net zero by 2050. Tobin and Kottasová claimed that the ecological compass was headed to the point of no return [4].
According to the US Environmental Protection Agency, human-created greenhouse gas emissions began to rise from 1970 at an annual rate of 2.72% to 6340.2 million metric tons of carbon dioxide equivalents in 2021 [5]. In this setting, industries have been responsible for 32% of global greenhouse gas emissions, blaming supply chains for 80% of industrial emissions and 90% of the environmental degradation of the consumer industries. These views have created a circle of blame that accentuates the need to examine the sustainability of supplier selection criteria enforced during the industrial revolutions that marked suppliers’ evolution [6].
This article is organized into four sections. Following the introduction, Section 2 offers a literature review divided into two parts. Part one is an overview of sustainability, and part two reviews industrial revolutions and supplier selection criteria while suppliers evolved from independent entities into technology- and value-driven supply networks. Section 3 presents the research methodology, highlighting the contextual data collection process and the analytical framework. Section 4 is the summary.

2. Literature Review

2.1. Part One: Overview of Sustainability

The concept of sustainability can be traced back to Hans Carl von Carlowitz, who used the term to describe maintaining forests through reforestation projects [7]. He emphasized social responsibility and ecological accountability by meeting the needs of people while preserving the Earth’s resources. The subject emerged as an environmental issue and became a political debate, with an explosion of articles in academic journals since 1990.
In the 21st century, sustainability has been viewed as a vision [8], a preanalytical representation [9], a brilliant metaphor [10], a mission [11], a discipline [12], common sense [13], and a slogan [14] that has turned into a policy [15], with targets and indicators for sustainable development [16].
Noticeable in this phenomenon is the shift in focus from sustaining as an action to sustainability as a cyclical process. Sustaining is the capability to endure various actions without termination [17]. Sustainability is a process of improvement in well-adjusted environments in which the exploitation of natural resources, the orientation of technological enhancements, and institutional changes permit present needs to be fulfilled without compromising natural resources for future generations [18]. Others have suggested that sustainability is, in fact, an oxymoron, highlighting the harmonious interaction and interdependencies between the three pillars of sustainability: the ecological, economic, and social. The common indicators for the pillars of sustainability (Table 1) are to secure longevity for humans in the ecological system.
The United Nations established a framework to support sustainability with 17 goals, 169 targets, and 230 indicators approved to monitor a justifiable distribution of resources across the ecological, economic, and social dimensions [21]. Of the 17 goals, 7 are related to the environmental protection of ecosystems and biodiversity, with 92 indicators for the sustainable management of water and energy, the consumption of natural materials, production patterns, climate change, the use of marine resources, desertification, and land degradation; 8 are associated with social responsibility, with 124 indicators to end poverty, eradicate hunger, promote well-being, ensure equality and affordable housing, provide safe societies, empower women, promote peaceful and inclusive societies with access to one-tier justice, and foster global partnership; and 1 is related to economic growth and resilient infrastructure, with 14 indicators [19]. The US Environmental Protection Agency defines environmental sustainability as “creating and maintaining conditions under which societies and nature coexist in productive harmony” [5]. This relates to the integrity of the Earth’s carrying capacity to support rare species and maintain sustainable development without damaging the ecosystem [22].
Holden et al. [23] consider environmental sustainability as a mechanism for social sustainability with equality, eradicating poverty, and eliminating hunger. Others [19,24,25] have placed social sustainability at the center of corporate responsibility for social inclusion and community development through global partnerships advocating for education, nutrition, sanitation, healthcare, solidarity, peace, and an acceptable standard of living.
From an economic standpoint, sustainable development is associated with ecological supplies to satisfy present demands without jeopardizing ecological functions and services for future generations [26]. Daily and Matson [27] classified ecological services into four areas, including provision (e.g., food, water, and air), regulation (e.g., carbon sequestration, pollution, and the absorption of waste), cultural (e.g., recreation, aesthetics, and spirituality), and support (e.g., photosynthesis, nutrient cycling, and soil formation). The United Nations’ Sustainability Goals relate economic sustainability to efficiency by emphasizing the optimum utilization of biocapacity [15,18] and requiring a balance between human demands and natural supplies to avoid an irreversible ecological footprint [28,29].
As a measure of economic sustainability, the ecological footprint calculates the consumption of the Earth’s resources and waste generated compared with the ability to provide natural supplies and absorb this waste. The ecological footprints necessary for supporting humanity are considered thresholds in biophysical systems, namely, the amount of biologically productive land and sea area individuals, regions, or human activities use to satisfy their needs, including renewable resources and waste absorption [28]. This measure shifted the challenge of conserving the Earth’s capital for forthcoming generations while meeting the present need to reinforce resilience and adaptive capacity in socioecological systems requiring incorporating ecological footprints into industrial operations [30].
According to Pincetl [31], ecological footprints are rooted in the industrial revolutions that have changed ecological systems so fast that they have driven the Earth into the Anthropocene Epoch, leading to anthropogenic radiative forcing. The most observed indicators of radiative forcing are greenhouse gases, which comprise 78% CO2, with the remainder being non-CO2 species [32]. The National Oceanic and Atmospheric Administration (33) reports that greenhouse gas emissions have increased from the first Industrial Revolution in 1950 to the arrival of Industrial Revolutions 4 and 5 in 2019, thus increasing the atmospheric levels of CO2 by 69%, from approximately 280 parts per million (ppm) in 1750 to 407 ppm in 2019. CO2 has acted as a blanket, trapping approximately half of the heat that the Earth might have otherwise radiated out into space, causing global temperatures to rise. Between 1990 and 2022, the reported heat collected on Earth reached its highest level in the last 800,000 years, causing oceans to warm up by more than 337 Zella joules [20].
Non-CO2 species have further contributed to the Earth’s rising temperature through anthropogenic emissions. The most significant non-CO2 emissions are methane, nitrogen oxide, hydrofluorocarbons, perfluorocarbons, sulfur hexafluoride, and nitrogen trifluoride. Carbon monoxide, sulfur dioxide, nitrous oxides, ammonia, black carbon, organic carbon, and non-methane volatile organic compounds are other pollutants. An increase in carbon monoxide concentrations in the atmosphere with ozone (O3) and vapor trails (contrails) mixed with black carbon and partially combusted fossil fuels, biofuels, and biomass can create particles with naturally occurring soot, causing human morbidity and premature mortality [33].
The anthropogenic radiative forcing has been linked to the frequency, intensity, and longevity of growing weather-related disasters such as wildfires, landslides, hurricanes, and rising oceans, causing biodiversity loss, species extinction, serious human health issues, and the Earth’s rising temperature. Other reported environmental degradation [34] includes a 12.6%-per-decade decrease in Arctic ice since 1979, a decrease of 447 billion metric tons in ice sheets per year, and an increase in sea levels by 4 inches since 1998.
The above literature review proves that sustainability was introduced decades ago to ensure the welfare of people and the planet. However, industrial revolutions have imposed an environmental crisis, causing the global average surface temperature to rise from –0.07 to 0.98 degrees Celsius between 1900 and 2019, leading to 19 of the 20 warmest years on record from the beginning of the 21st century (31, 32). According to the Guardian, only 100 companies have been responsible for 71% of global emissions since 1988, while industrialists blame supply chains for 80% of industrial emissions and 90% of the environmental degradation of the consumer industries (6). This creates a circle of blame that amplifies the need to examine the sustainability of supply selection criteria during the industrial revolutions. The following part reviews the industrial revolutions and supplier selection criteria as suppliers have evolved from independent entities into technology- and value-driven supply networks, as explained in the Industry 1.0 to Industry 5.0 sections in Figure 1.

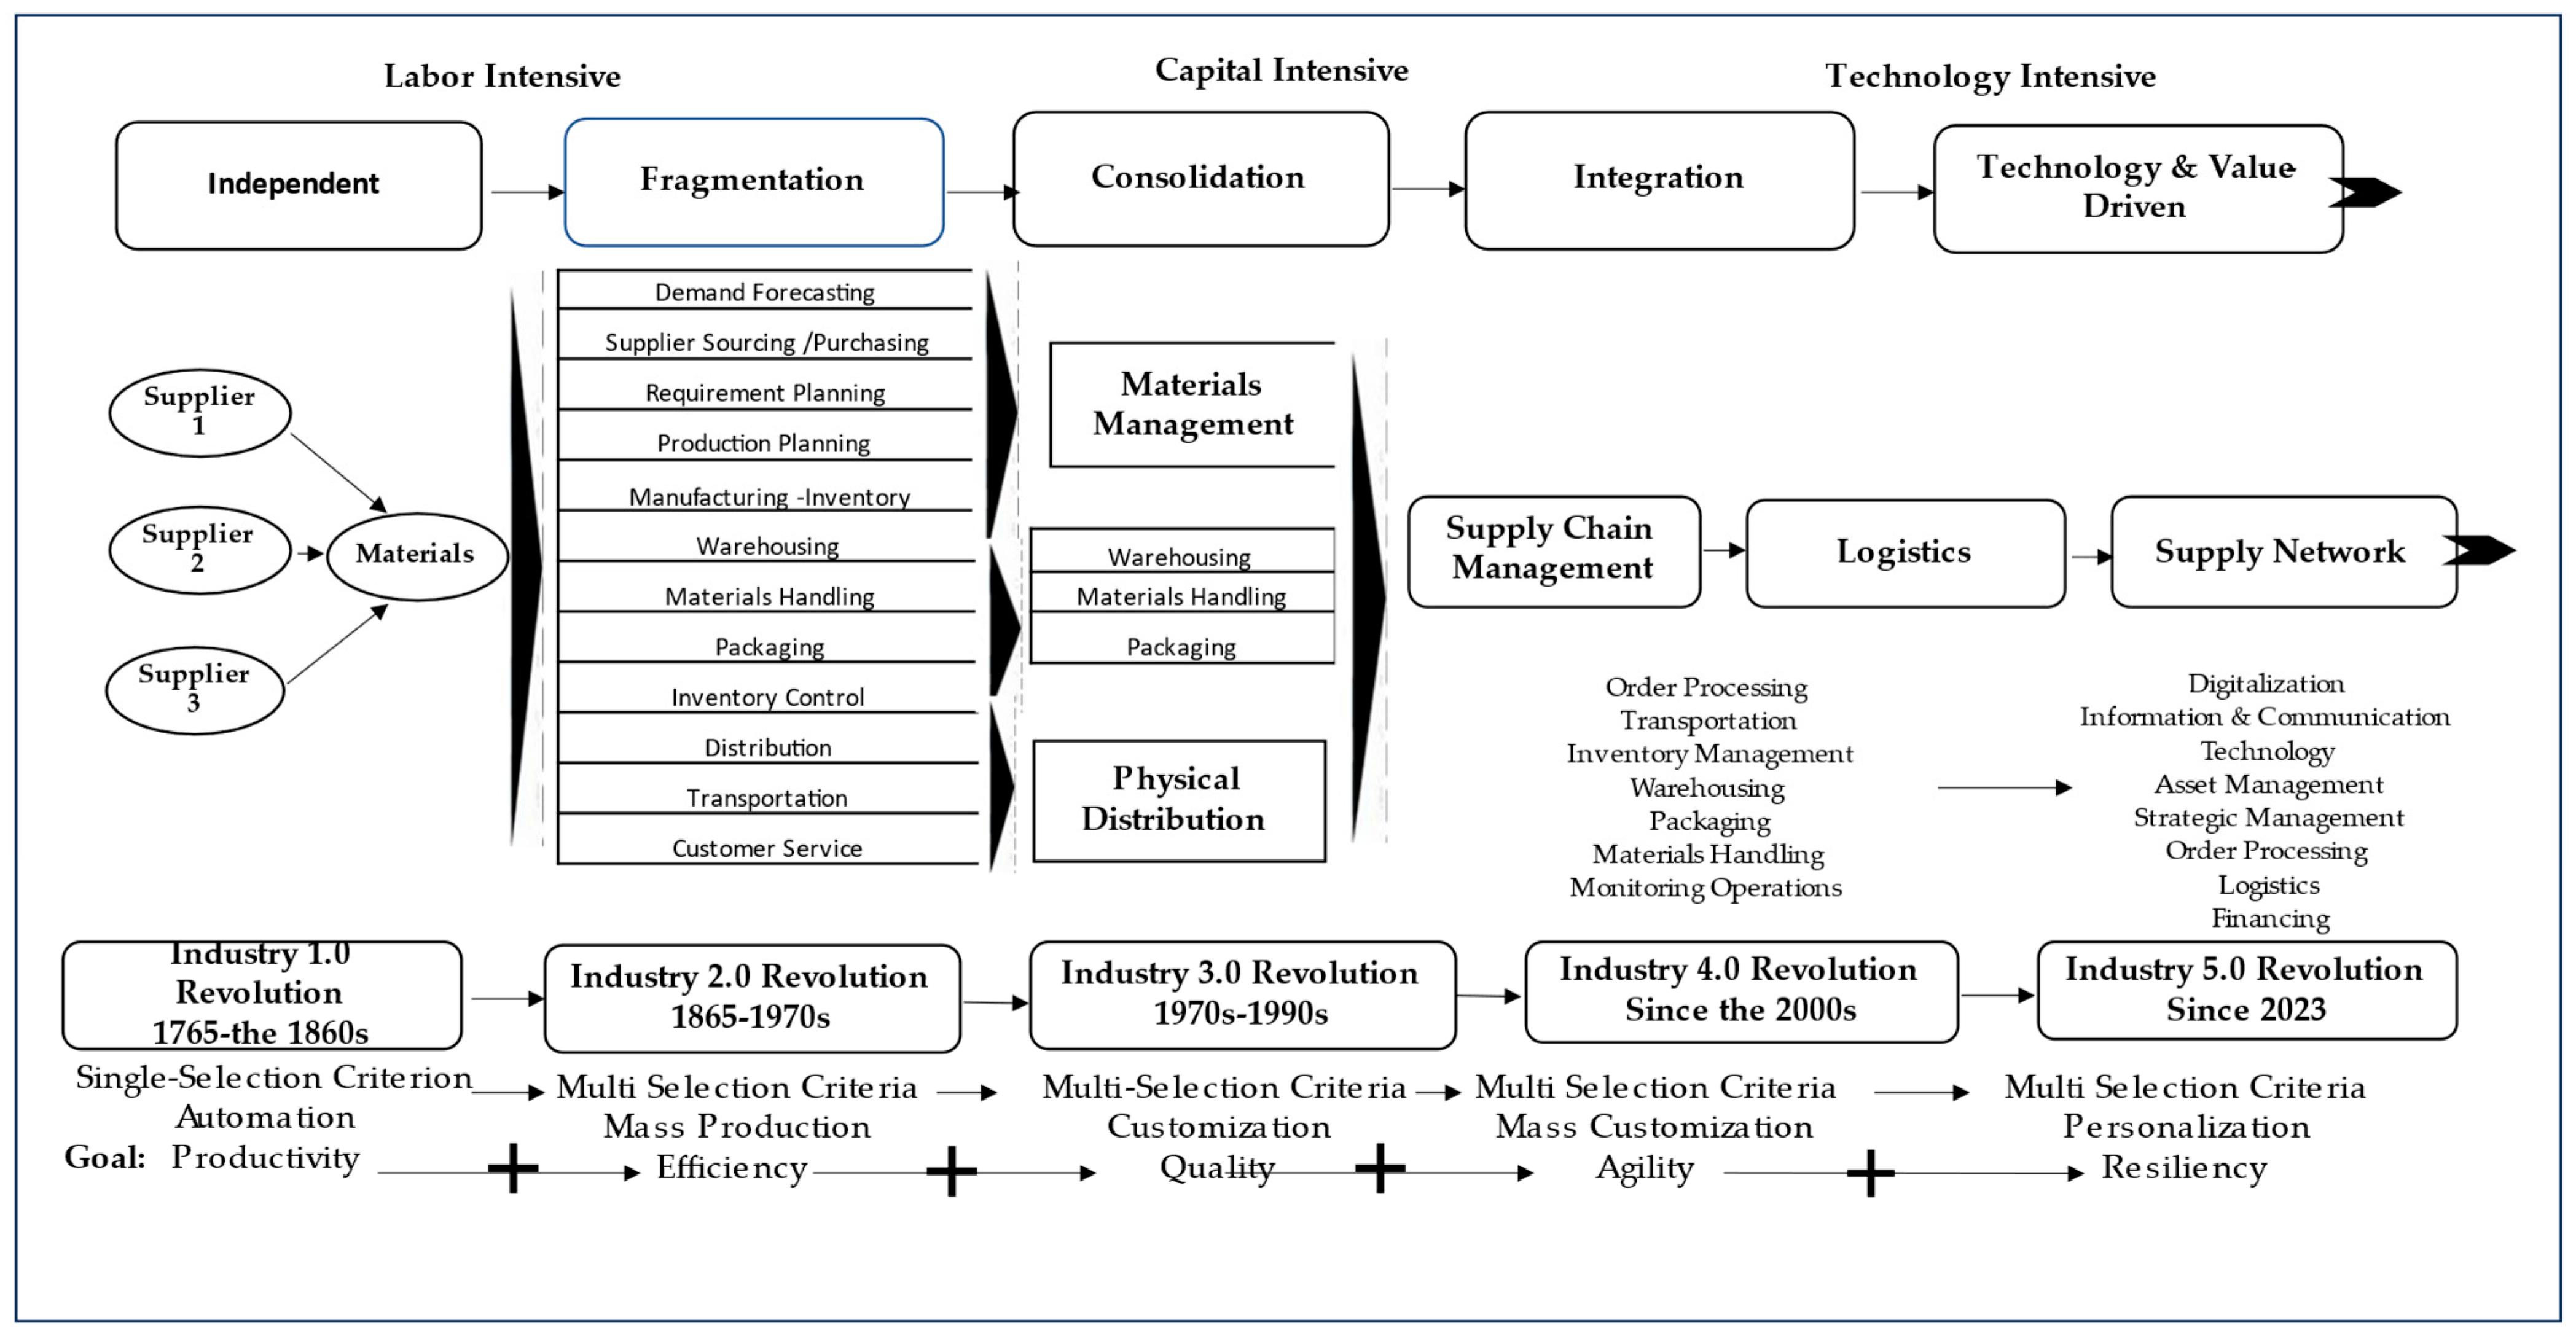
2.2. Part Two: Industrial Revolutions

For two centuries, industrial revolutions have transformed suppliers from independent entities into digital networks of supply chains induced by their selection criteria. Meanwhile, environmental degradation and the depletion of natural resources are traced back to the onset of industrialization.

2.2.1. Industry 1.0

The first industrial revolution was celebrated in the mid-18th century in England in a society depending on agrarian and artisan production [36]. The characteristics of this revolution were a transition to the use of steam-powered engines, benefiting the textile and transportation industries, which led to the construction of factories, increased urbanization, and labor mobility. By the end of the 18th century, accelerated mechanization had increased productivity with low product variety in a high-demand market spreading throughout the UK and Europe [37]. In 1869, the first transcontinental railroad in the US was built, followed by Samuel Morse creating the telegraph, Andrew Carnegie building the first steel mills, and Alexander Graham Bell inventing the telephone [38]. Coal became the main energy source for manufacturing processes and transportation [39] as ashes contaminated the environment, and the atmospheric CO2 rose from 280 ppm. Meanwhile, suppliers navigated alongside the revolutionists as independent and fragmented entities from the mid-1750s to the early 1860s. While supplier selection was regarded as the most important function, selectivity was based on the net unit price based on three indicators: price, freight charges, and ordering costs. There was no sign of social responsibility and environmental accountability for industrialists, as presented in Figure 1.

2.2.2. Industry 2.0

Industry 2.0 emerged from the ashes and CO2 of Industry 1.0 in the late 18th century, illuminated by electricity to pave the path to the Fordist paradigm in the 19th century in Germany, America, and the UK. The revolution penetrated other regions and altered commerce by integrating science and new technologies that featured productivity, specialized workers, and well-planned manufacturing processes. Streamlined mass production was based on volume, variety, and the principle of scientific management, with which Henry Ford (1863–1947) and Frederick Taylor (1856–1915) were linked. The discovery of oil also marked this era. Thus, transportation extended from land and water to air as cars, buses, planes, and ships became the means of conveyance. Materials such as metals, synthetic materials such as plastic and nylon derived from the oil industry, and dyes spawned inventions, transforming the communication system with the associated advances in chemistry and metallurgy [36].
The growing production of steel, iron, coal, oil, chemical, and agricultural fertilizer supplies met the demands of industries such as automobiles, textiles, agriculture, and the construction of transportation infrastructure. The inventions of the combustion engine, semi-trucks, forklifts, equipment for handling materials, pallets, and rudimentary equipment led to efficient fragmented suppliers [40]. This era saw industrial engineering and operations research consolidation in purchasing processes. Suppliers’ selection requirements increased from net unit price to productivity and production capacity [41].
Supply sourcing was selected based on multi-selection criteria, while the related activities (purchasing, warehousing, and logistics) were fragmented. The indicators for supply selection were the unit net price considering the associated costs (ordering and transportation), productivity, and quantity. The sources of energy were coal, wood, and electricity, and the immediate roots of greenhouse gas emissions were established between the late 1950s and the early 1980s (Figure 1).

2.2.3. Industry 3.0

The third industrial revolution emerged in the early 1980s, marked by the rise of electronics and the innovation of technology from analog to digital. Automated systems replaced mechanical ones in mass production, with the ability to carry out complicated human tasks. Industries began to use computers, information technology (IT), and electronics in many production processes, thus engendering memory-programmable logic controller robots, flexible manufacturing [42], computer-integrated manufacturing [43], computer-aided design [44], and lean manufacturing as an extension of just-in-time manufacturing. In the 1990s, with the transition to digitalization and the internet, the term “metaverse” was coined to denote a three-dimensional space within which people and physical objects could interact and share information [45]. This transition paved the path to a virtual environment with numerous advantages, such as productivity, efficiency, and flexibility. Electronic devices and software systems facilitated supply activities such as inventory management, tracking products, planning the resources of enterprises, scheduling product flows, and shipping logistics. The third supplier’s evolution occurred in two phases. Phase one was between the 1930s and 1950s, as functional activities consolidated into two branches: (a) the management of materials associated with producing parts and finished goods, including their packaging, and (b) physical distribution, which involved making parts and finished goods available for consumption, transportation, and warehousing [41].
The competitive advantage of oil imports over domestic coal initiated a new energy source with low prices, easier material handling, and lower environmental pollution. By 1980, the share of coal had dropped to 22% while that of oil had risen to 60%. Yet, environmental contamination in this period is considered the transition to the rapid loss of global sustainability.
Consolidated suppliers were evaluated based on multi-selection criteria, customization, and quality. In 1982, Oliver and Webber coined the term “supply chain management,” defined as the sequence of activities from the procurement of raw materials to their transformation into finished goods, packaging, and distribution to customers. It involves planning, implementing, and controlling the interconnected supply operations to meet customers’ requirements. The supply chain incorporates facilities that transform raw materials into intermediate/final products and deliver them to customers through a distribution system to the users. It bridges procurement, manufacturing, and distribution [46]. During this evolution, several hardware and software providers supported supply chain management in communication, optimization, and modeling, such as i2 Technologies, SAP, Oracle, and Invensys [47].
During this period, supply evolution highlighted the integration of purchasing activities with logistics, acting as a fundamental connection emphasizing the upstream and downstream flow of materials, with the reorder point based on the available inventory and associated costs. The distribution of materials shifted from railroad to intermodal, air, and maritime transportation with containerization in 1990. This reduced logistics and transportation costs while creating an infrastructure for global supply chains supported by IBM’s first computerized inventory management and forecasting system in 1967. This system streamlined logistics and created opportunities in inventory management and warehousing [48]. Enterprise resource planning systems and radio frequency identification (RFID) tags helped to manage goods and shipments electronically [49].
In 2000, supply chain networks introduced a framework for value chains with five criteria, including (1) an input–output structure (i.e., a set of products and services connected in a sequence of value-adding economic activities), (2) territoriality (i.e., the spatial dispersion or concentration of production and marketing networks comprising enterprises of different sizes and types), (3) a governance structure (i.e., the authority and power relationships that determine how financial, material, and human resources are allocated and flow within a chain), (4) the manufacturing/technology governing producer-driven chains, and (5) the buyer-driven chains of the commercial and service sector [41,50,51].
During the third industrial revolution, suppliers’ selection criteria extended from net price and productivity to performance and warranty policies, with 23 indicators [52], with order processing, forecasting, warehousing, packaging, scheduling, and transportation added later. Other supplier selection criteria were quality (percentage of rework and percentage of returned items), reliability (supplies availability from certified/reputable third-party suppliers), service responsiveness (after-sale dependability and return policy), financial stability (revenue, profit, financial assets, and credit ratio), location capacity (geographical location and capacity of distribution centers), and consistency (in terms of price, quantity, quality, delivery, liability, and responsiveness/just-in-time purchasing). Additionally, suppliers’ selection criteria for transitioning from analog to digital required software, such as flexible spreadsheets, mapping, and route planning, which tracked costs and schedules [35,53,54] (Figure 1). There were still no signs of sustainability requirements, and the price to pay for these advancements was the gradual destruction of the environment because these advancements relied on fossil fuels such as coal, natural gas, and petroleum.

2.2.4. Industry 4.0

The Industry 4.0 revolution outshone its predecessors with digitalization and the convergence of breakthrough technologies (such as advanced robotics, artificial intelligence, the Internet of Things, virtual and augmented reality, wearables, and additive manufacturing). It was introduced as a three-dimensional architecture at the 2011 Hannover Fair in Germany. This industry encompasses the products’ lifecycle, business layers, and factory hierarchy by converging digital and physical control through intelligent network systems capable of exchanging information and controlling operations autonomously [55,56,57]. Physical technologies include smart assets, 3D/additive manufacturing, cyber–physical systems, uncrewed aerial vehicles (drones), autonomous robots, virtual and augmented reality, radio frequency identification, sensors and actuators, advanced materials, and nanotechnology in horizontally and vertically integrated systems [58]. These technologies and predictive/prescriptive analyses allow more accurate and reliable decision making for quality and efficiency.
Supply chains supporting Industrial Revolution 4.0 leverage embedded intelligence in their processes, enabled by artificial intelligence [59], machine learning as a subset of artificial intelligence (AI) [60], virtual and augmented reality, big data and analytics, cloud computing, cloud manufacturing, cybersecurity, automation, robotics, the Internet of Things, cyber–physical systems, and additive manufacturing (3D, 4D, and 5D printing) [61].
This evolution emphasizes integrating communication and smart information technologies with the mass utilization of network connections that incorporate automation and computer technologies to increase transparency and optimize time, cost, materials, people, and equipment [62]. According to Frederico et al. [63], this evolution is a holistic approach utilizing advanced technologies to streamline operational processes. The goals are product customization and personalization by allowing for automated data ingestion and contextualization to predict and understand customers’ preferences while harnessing artificial intelligence, deep learning, and data analytics.
Supply chains of Industry 4.0 are at the center of the digital enterprise encompassing the complexity of lateral links, reverse loops, and two-way exchanges that require a broad, strategic view of resource acquisition, development, management, and transformation. They comprise the general state of business affairs in which integrated planning and execution, logistics, procurement, warehousing, data analysis, and materials (i.e., work-in-process and finished goods) are transformed and moved through a value chain (Figure 1).
The predominant selection criteria for the fourth supply chain revolution are efficiency, responsiveness, flexibility, agility, transparency, safety, compliance, and special customer relationships. Valeske et al. and Lee and Seshia [55,58] believe that the suppliers’ selection criteria in Industry 4.0 are founded on the previous criteria with the addition of technical capabilities (real-time monitoring, control, lifecycle management, service-based interaction, advanced analytics, autonomous collaboration, security, and trust), engineering (model-based methods, safe programming, validation, resilience, risk mitigation, tools for lifecycle support, advanced operating systems and programming languages, and simulations), infrastructure (multi-domain interoperability, migration, compatibility with legacy systems, integration, resilience, robustness, and the sustainability of critical infrastructure), human-centric and updated ecosystems (education/training, collaborative intelligence, a cross-industry knowledge base, benchmarked practices, and emergent behavior), and information systems (artificial intelligence (AI), the industrial Internet of Things (IoT), cross-domain large-scale information management, the transformation of data and information analytics into actionable knowledge, automated knowledge-driven decision making, management, risk analysis, and autonomous smart systems within an ambient intelligence ecosystem).
The environmental sustainability of Industry 4.0 and the percentage of CO2 emissions depends on the mode of transport (road accounting for 57%, ocean freight 17%, air freight 9%, and rail freight 6%). The technologies associated with the fourth industrial revolution can cause significant ecological damage due to generating electronic waste.

2.2.5. Industry 5.0

Industry 5.0 is built on the technological platforms of Industry 4.0, shifting the focus from being technology-driven to being value-driven, moving away from social welfare to social well-being [64]. This revolution reflects a vision beyond productivity and efficiency, sustainability, and resiliency, reinforcing industries’ contributions to society concerning the Earth’s limited resources. Targeting mass customization, the foundation of Industry 5.0 is based on three pillars: intelligent devices, intelligent systems, and intelligent automation/autonomous robots, all fully merged with the physical world in cooperation with human intelligence for flawless production and minimum waste. It utilizes six enabling technologies: (1) collaborative robots (cobots) as human–machine interaction technologies that interconnect and combine the strengths of humans and machines, bio-inspired technologies, and smart materials that allow materials to be embedded with smart sensors and enhanced features while being recyclable; (2) digital twins and simulations to model entire systems; (3) the internet of everything and the artificial intelligence of things, blockchain, edge and fog computing, cognitive computing, 6G, and beyond; (4) augmented reality; (5) mixed reality; and (6) holography [61].
Industry 5.0 disrupts supply chains and the related networks in their infancy because the transactions are managed within the platform and governed by blockchain [65]. Therefore, intermediaries within the supply chain disappear. Additionally, new relationships, such as those between the companies that own the platforms, technology designers, and internet servers, change the structure of the supply chains [66], requiring visibility, transparency, and trust by all participants [67]. These features allow supply chain leaders to evaluate the suppliers’ green attitudes and thus select only truly green suppliers to be included in the supply chain network.
A serious challenge is that modern technologies, such as using blockchain to manage transactions, require skills and competencies for efficient transactions. This can be extended only to regions and countries where the available infrastructure supports technology, augmenting territorial discrimination and disparities [68,69].
Thus, the criteria of a supply chain extend to digital capabilities, hyper-connectivity, the integration of intelligence and cognitive computing, being human-centric, and resilience (Figure 1). As such, suppliers’ technological capabilities have to extend to cyber–physical systems connecting the worlds of humans, machines, information, and organizations for integrated operation, an approach driven by adopting new disruptive technologies for flexibility in the face of changing requirements. For example, digital twins are used for simulation and testing before implementation to ensure products’ precision and faster execution without bottlenecks. Asset performance management is used for real-time diagnoses of plants and equipment to predict and plan convenient maintenance schedules and eliminate unplanned shutdowns. Lifecycle product management integrates and simulates the compatibility of all components of a new product in real time and is used to plan for a successful launch. Industrial IoT-driven total automation integrates the management of the plant, logistics, and supply chain. Human/machine collaboration involves collaborative robots to enable better precision, faster execution, the personification of products, and the minimization of waste. Digital transformation enables a connected process linking the plant, the supply chain, OEMs, customers, and all other stakeholders to ensure quality, the availability of products, a proper feedback system, and the customization of products, thus ensuring continuity and a sustainable process. Cybersecurity ensures a risk-free cyber–physical platform with continuously upgraded and strong security standards. These criteria create challenges for supply chains due to significant increases in the investment costs of digital technologies and AI-based solutions, the high cost of energy, and the unavailability of raw materials. Other challenges are skill shortages, slow training progress, and an unprecedented rate of resignations for the frustrated unskilled workforce, putting the continuity of operations at risk.
In brief, the literature related to the industrial revolutions and supplier selection criteria offers a body of knowledge from the 1750s to 2022, highlighting that the surge of technology and the transition into digitalization are intrinsic to suppliers’ progress and selection criteria. Societies have shifted from an agrarian economy to a manufacturing economy, opting for finite resources for mass production to support other new 21st-century imperatives, capitalism, and urbanization. However, according to environmentalists, the costs of industrial waste, pollutants, and toxic materials have been growing, exacerbating climate change in the 21st century. McKinsey [6] blames the supply chains of the consumer industry as being responsible for 80–90% of pollution. There have been attempts to identify the sources of pollution in a circular phenomenon, which were exercises of utter futility [70].

3. Research Methodology

Thus, there needs to be scientific agreement in the existing literature to provide a testable framework to examine the sustainability alignment of supplier selection criteria during the industrial revolutions. Two proposals can be presented as a basis for a feasible examination.
Proposition One (P1).
Suppliers’ selection criteria enforced during the industrial revolutions equally influenced the three dimensions of sustainability (economic =μ1, environmental= μ2, and social =μ3).
Proposition Two (P2).
Suppliers’ economic selection criteria positively influenced environmental and social criteria during the industrial revolutions.
To justify a proper methodology pertinent to the above multidisciplinary propositions, this study referred to Ivankova’s [71] mixed-method approach (85) in multidisciplinary research. The rationale for using a mixed method was to use quantitative and qualitative perspectives to examine the sustainability alignment of suppliers’ selection criteria in the industrial revolutions.

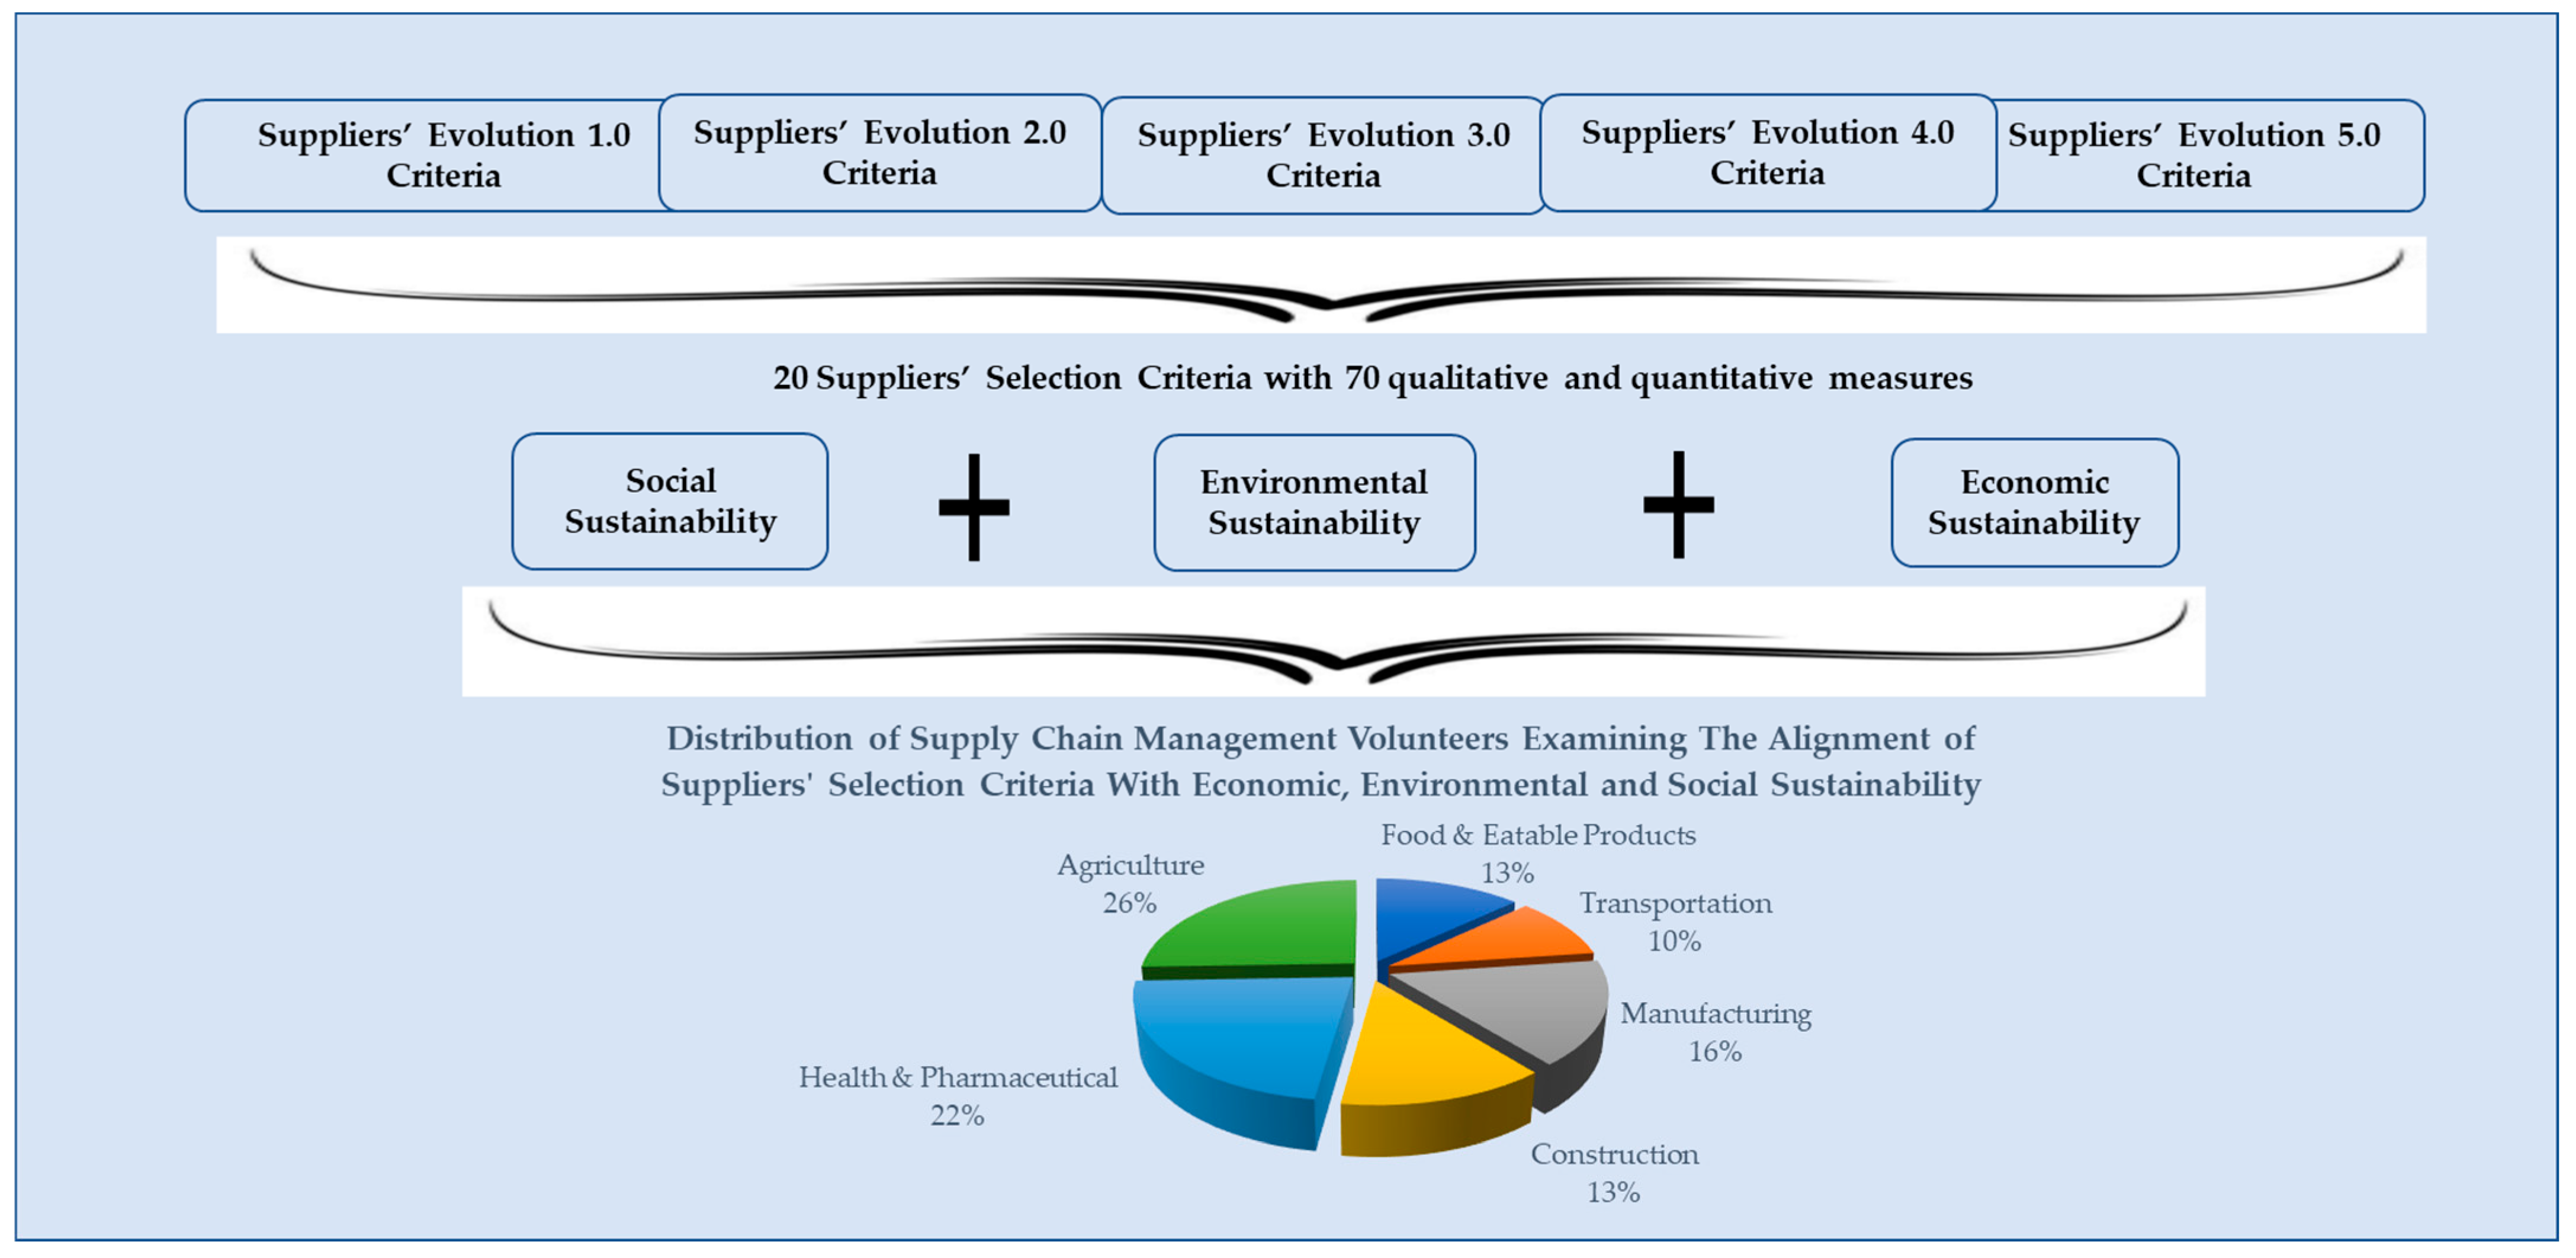
3.1. Data Collection

Table 2 presents data from the literature review to test the above propositions. They include 20 supplier selection criteria with 70 indicators from Industry 1.0 in the 18th century to Industry 4.0 and the beginning of Industry 5.0 in the 21st century. The number of indicators for each supplier selection criterium is identified under each industrial revolution. The data collected were emailed to 250 volunteers with expertise in supply chains across six industries applying to Industry 4.0 and 5.0. Maintaining confidentiality, the volunteers were first requested to rank the 20 supplier selection criteria and 70 related indicators concerning the three pillars of sustainability, the environmental, economic, and social, using Table 2 and Figure 2 as references. The second request was to mark the percentage of influence of the economic criteria and the related indicators on environmental and social sustainability. The third request was to state their professional views of sustainability during the industrial revolutions.
One hundred and eighty-four volunteers returned completed answers. With a response rate of 73.5% from six industries, the distribution of returned responses was 26% from agriculture, 13% from food and eatables, 10% from transportation (air and land), 16% from manufacturing, 13% from construction, and 22% from health and pharmaceutical companies (Figure 2).

3.2. Data Analysis

To test Proposition One (P1) (the supplier selection criteria enforced by the industrial revolutions equally influenced the three dimensions of sustainability (economic = μ1, environmental = μ2, and social = μ3), as recommended by Christensen Ronald [72], one-way analysis of variance was used. According to the analysis of variance presented in Table 3, there was a significant difference across industries in the means of economic (μ1 = 77.55), environmental (μ2 = 11.6), and social sustainability (μ3 = 24.9). The F-ratio of 88.47 was greater than the table value of F (for 2 to 57 degrees of freedom at α = 0.05), and the critical value was 3.15. Furthermore, the p-value (p = 3.33 × 10⁻¹⁸) was smaller than the predetermined significance level of α = 0.05, suggesting a noteworthy difference between the three means. Therefore, the supplier selection criteria did not equally impact the three pillars of sustainability, with significant differences between economic, environmental, and social sustainability. Thus, P1 was rejected.
To test Proposition Two (P2) (the economic supplier selection criteria positively influenced the environmental and social criteria), a cross-correlation matrix (Table 4) was used to examine the relationship and directions of the three dimensions of sustainability. This revealed that the economic criteria had a weak negative relationship with the environmental criteria (−r = 0.38), while their relationship with the social criteria was significantly highly negative (−0.85). On the other hand, the environmental criteria had a weak negative relationship with the social criteria (−0.16). Therefore, Proposition Two was refuted.

3.3. Discussion

3.3.1. Brief Background

The statistical analysis of the supplier selection criteria enforced during the industrial revolutions from the 18th to the second decade of the 21st century indicated they were economically induced, with low priority given to environmental and social sustainability. Furthermore, as economic sustainability grew, it had weakly negative to significantly strong influences on environmental and social sustainability. The analysis also suggested that negative environmental sustainability negatively influences social sustainability. This analysis revealed that economic growth translates into increased real output, demanding higher natural resource consumption, which imposes pressure on the environment. Special emphasis was placed on the increased consumption of non-renewable resources, higher levels of pollution, global warming, and the potential loss of environmental habitats. Therefore, Proposition One and Proposition Two were rejected.

3.3.2. Professional Views on Sustainability during Industrial Revolutions

(a)
Views on Sustainability During the First Industrial Revolution
Newly invented machines increased productivity with efficient production processes, allowing the economy to flourish, leading to high employment and satisfying wages spread throughout the European countries and the United States. However, no regulations or respect for the biosphere’s carrying capacity existed, as demands exceeded supplies, and productivity for higher economic growth became the main criterion of nations’ prosperity. Suppliers ripped throughout the Earth’s ecological spheres to meet industrial demands. Natural resources were rapidly transformed, reducing the planet’s stock of valuable capital and causing the Earth to suffer from exploitation [36]. The main energy source, coal, accelerated the level of pollutants, releasing ashes, CO2, and non-CO2 emissions into the atmosphere and poisoning the air, soil, water, and marine ecosystems. In the late 1950s, the Keeling curve, developed by the geochemist Charles Keeling, revealed a steady rise in CO2 levels that predicted climate change in the 21st century. In addition, mining and construction led to deforestation, alterations in the land’s profile, and the destruction of wildlife habitats.
Higher productivity led to the rise of factories and the growth of capitalism under corporations. Rich investors recruited workers who believed in the trickle-down theory that toiling in industries along class lines would eventually lead them to utopia. Sadly, the rich indulged themselves through the labor of millions of young, fit, functional, flexible, leasable, knowledgeable, controllable, replaceable, and expendable workers, who were considered to be low class. The impressive riches did not trickle down to the workers’ level while they suffered inhumanely in sweatshops, working long hours in unhealthy conditions. The lack of sanitation, proper planning for health care, nutrition, and the working environment caused serious health issues and fatalities in England and the United States. Deplorable child labor, organized alienation, racial uplift ideology, and female exploitation grew increasingly rampant globally [73].
(b)
Views on Sustainability During the Second Industrial Revolution
The advent of mechanization and unprecedented technological inventions led to significant improvements in mass production and increased demands for a higher workforce. This led to the development of sweatshops, where laborers were subjected to inhumane conditions, child labor, unsanitary living conditions, food shortages, pollution, and the spread of diseases. Relying on wood, coal, and fossil fuels as energy sources made the Earth pay a high price. The continued reconfiguration of lands due to deforestation, mining, and excavation to support higher productivity led to the extensive discharge of hazardous pollutants into the lithosphere, resulting in soil and water contamination. As the Industrial Revolution gained momentum, three sources of energy dominated civilization: electricity, coal, and petroleum. The primitive computer model of the 1970s showed a doubling in CO2, leading to a rise in global temperatures. By the end of the 20th century, complete dependence on oil increased greenhouse gas emissions and the concentration of CO2 in the atmosphere to 280 ppm (The United Nations Environmental Program, 2022). Environmentalists believe that mass production led to the creation of consumerism, which encouraged people to buy more than they needed. This resulted in waste and overconsumption, which strained the environment.
The notable cultural shift in the Second Industrial Revolution was the enforcement of the 1833 Factory Act prohibiting the exploitation of children under nine years old in textile factories (except for silk factories). In addition, the act limited children aged 9 to 12 to working nine hours per day for up to 48 h per week, with a requirement to attend school [74].
(c)
Views on Sustainability During the Third Industrial Revolution
The global economy was unstable during the Third Industrial Revolution, with extreme political movements failing to retreat from the brink and environmental degradation accelerating species’ journey to extinction. Demands were higher than the supply of natural resources, especially for fossil fuels, leading to elevated pollution [75]. Commentators such as [76] and Flannery [77] stated that humanity was beyond the global carrying capacity. At the same time, Rees [78] focused on the ecological footprint, stating that the concept of human carrying capacity must be revised, considering the current demands for natural resources and ecological boundaries. However, by 2005, the CO2 level was 380 ppm, an increase of 37%, of which 65% was associated with burning fuels. Clean water, clean air, and safe food became issues of great concern for managing, preserving, and protecting natural resources.
The intensified pollution and release of large quantities of toxic material into the atmosphere led to diseases such as cholera and typhoid. The hydrosphere (surface waters of lakes, rivers, and streams) and the lithosphere contributed to the direct contamination of surface soils and subterranean water (groundwater) penetrating freshwater and rivers (e.g., Ohio’s Cuyahoga River), which destroyed natural resources.
The Third Industrial Revolution also saw the intensification of land use with industrialization, urbanization, and population growth, which resulted in increased pollution and solid waste, leading to public health issues and concerns about environmental quality. According to a CNN report in 2007, approximately 500 million tons of heavy metals, solvents, and toxic sludge have slipped into the global water supply every year. In the developing world, as much as 70% of industrial waste is dumped untreated into rivers and lakes. Given the significance of environmental pollution, it is surprising how little attention was paid in the literature to the sustainability criteria for supply chain selection. Using nuclear power reduced greenhouse gas emissions compared with fossil fuels, but the costs, time, risk of accidents, radioactive waste, and the limited uranium supply created serious concerns.
(d)
Views on Sustainability During the Fourth and Fifth Industrial Revolutions
This evolution had a significant economic impact, allowing companies to accelerate production and develop digital marketing and sales. They could penetrate international regions, create new markets [79], promote user purchases [80], and build spaces and products that were not bound by traditional physical limitations through e-commerce and omnichannel solutions [38]. The technologies of this revolution support sustainability regarding the optimum use of materials and renewable energy.
Nevertheless, some economic downsides concerning enabling technologies such as artificial intelligence are their capability to replace human decision making and act autonomously to solve complex problems. Experts believe that digitization and the emergence of labor-saving technologies will eliminate many lower-skilled jobs while creating countless job opportunities in skilled areas such as automation, system design, machine learning, and software engineering. According to the UN’s Department of Economics and Social Affairs [16], over 80% of the low and medium classes are losing their jobs. The new skilled positions present increasing wage disparity, widening the gap between the rich and poor and concentrating wealth at the political and executive levels [81].
Alongside employment, the high requirements of investment and the implementation costs of modern technologies add to the high production rate associated with higher resource and energy consumption and elevated pollution. Moreover, digitalization requires a large amount of space for data storage and extensive computing power [82]. Energy is also required for the transactions finalized through blockchain and the continuous usage of technologies that increase energy consumption, leading to CO2 emissions [83]. A fully digital world needs better knowledge and skills than traditional digital and physical channels since it deals with international customers, heterogeneous demands, and customer–business interactions [80]. The focus is on improving productivity and processes’ efficiency, inadvertently ignoring human development and social sustainability. Furthermore, skills, experience, and proficiency must be developed for artificial intelligence, machine learning, the Internet of Things, big data, blockchain, cloud and edge computing, robots and cobots, autonomous vehicles, 5G, genomics and gene editing, and quantum computing.
The technological advance during the Fourth Industrial Revolution paralleled the increase in the production of electronic devices and the growing mass of discarded electronic products, known as e-waste. With an annual increase of 2.5 million tons (MT) or a 187% rise since the turn of the new millennium, the World Health Organization [84] considers e-waste a serious threat to the world’s economic sustainability and ecosystem human health. In 2021, for example, the world generated 57.4 MT of e-waste worth USD 62.5 billion, of which less than 20% (or USD 10 billion in value) was recycled. The remainder was either lost, buried in landfills, or found in less-developed nations, poorly managed, and badly recycled. For e-waste, recycling involves dismantling, shredding, and acid-washing in the open air, where toxic dust particles are emitted. Gases float into the air and seep into the soil and the water table, causing irreparable damage to the environment and people’s health.
Furthermore, the escalating demand for electronics has tripled manufacturing since 1970. This has required mineral processing, which adversely affects the environment through land alterations, causing deforestation, biodiversity loss, and water and soil contamination. This process has also triggered alterations in soil profiles, causing erosion and the formation of sinkholes. Thus, electronic waste has escalated greenhouse gases and CO2 emissions.
(e)
Sustainability During the Fifth Industrial Revolution
Industry 5.0 is setting the entire realm of human activity at the internet’s heart, accelerated by AI and the IoT, which interact between the physical and digital spheres. While the number of internet-connected devices grew from being a compelling notion to more than three times the world’s population in 2022, sadly, so did that of discarded devices, threatening the ecosystem. In addition, the information technology industry generates 5.5% of the world’s gas emissions and industrial pollution (air, water, thermal, soil, and noise) [85].

4. Summary

Tracing back to the 18th century, suppliers have navigated alongside industrialists as fragmented entities induced by economic rewards. They ripped through the Earth’s ecological spheres to meet demands for productivity and the accumulation of profit from the mechanization of the first industrial revolution to digitalization in the Fourth and Fifth Industrial Revolutions. Coal-powered steam engines, electricity, and fossil fuels have contaminated the air, water, and land with many toxic greenhouse gas emissions. Today, the planet is on the verge of a climate crisis, with minimum environmental and social integrity priorities, for which environmentalists and McKinsey blame supply chains.
This study examined supply chains’ sustainability by testing suppliers’ selection criteria across the economic, social, and environmental dimensions and their influences. Two propositions were offered and tested: Proposition One (P1) (suppliers’ selection criteria enforced during the industrial revolutions equally influenced the three dimensions of sustainability (economic = μ1, environmental = μ2, and social = μ3)), and Proposition Two (P2) (suppliers’ economic selection criteria positively influenced the environmental and social criteria during the industrial revolutions). A list of 20 supplier selection criteria with 70 indicators was collected from the literature review to test the propositions. The list was forwarded to 250 volunteers with expertise in supply chains across six industries. Maintaining confidentiality, the volunteers were first requested to rank the 20 supplier selection criteria and 70 related indicators associated with the three pillars of sustainability, environmental, economic, and social, using Table 2 and Figure 2 as references. The second request was to mark the percentage of influence of economic criteria and the related indicators on environmental and social sustainability. The third request was to state their professional views on sustainability during the industrial revolutions. Statistical analyses of the responses suggested that the identified supplier selection criteria were not equally driven by economic, environmental, and social sustainability: 77.5% of the supplier selection criteria were based on economic measures, 11.6% were associated with environmental measures, and 26.9% were associated with social sustainability. In other words, industrial revolutions have been economically motivated, with low environmental and social sustainability priorities.
The professional views of the volunteers on sustainability during the five industrial revolutions support the statistical analysis. The respondents believed that the industrial revolutions overused the world’s material wealth and economically induced the transformation of supply chains for higher productivity. Thus, natural resources were rapidly transformed, reducing the planet’s stock of valuable capital and causing the Earth to suffer from exploitation. Furthermore, burning coal, wood, and fossil fuels accelerated the level of pollutants, releasing ashes, CO2, and non-CO2 emissions into the atmosphere and poisoning the air, soil, water, and marine ecosystems. In addition, setting human activities at the heart of interactions between physical and digital spheres enabled by the Internet and the proliferation of the Internet of Things (IoT), devices are destined to be discarded. These rejected devices/e-wastes contain toxic substances that negatively impact environmental sustainability and human health. Thus, transitioning to a sustainable supply chain requires completely resetting the supplier selection criteria based on the United Nations’ Sustainability Goals.

Author Contributions

Conceptualization, methodology, B.M.-F.; Software, investigation, A.A. (Alexander Ansari); validation, formal analysis, resources, A.A. (Al Ansari); data curation, B.M.-F. and A.A. (Al Ansari); writing—original draft preparation, B.M.-F.; writing—review and editing, B.M.-F. and A.A. (Alexander Ansari), visualization, A.A. (Al Ansari); supervision, All the authors. All authors have read and agreed to the published version of the manuscript.

Funding

This research received no external funding.

Institutional Review Board Statement

Not applicable.

Informed Consent Statement

Not applicable.

Data Availability Statement

Data are contained within the article.

Conflicts of Interest

The authors declare no conflict of interest.

References

  1. Che, H.; Wang, S. Supplier selection and supply quantity allocation of common and non-common parts with multiple criteria under multiple products. Comput. Ind. Eng. 2008, 55, 110–133. [Google Scholar] [CrossRef]
  2. Nath, D.; Eweje, G.; Sajjad, A. The hidden side of sub-supplier firms’ sustainability—An empirical analysis. Int. J. Oper. Prod. Manag. 2020, 40, 1771–1799. [Google Scholar] [CrossRef]
  3. Ripple, W.J.; Wolf, C.; Gregg, J.W.; Levin, K.; Rockström, J.; Newsome, T.M.; Betts, M.G.; Huq, S.; Law, B.E.; Kemp, L.; et al. World Scientists’ Warning of a Climate Emergency 2022. BioScience 2022, 72, 1149–1155. [Google Scholar] [CrossRef]
  4. Tobin, E.; Kottasová, I. 11,000 Scientists Warn of ‘Untold Suffering’ Caused by Climate Change. CNN. 2019. Available online: https://www.cnn.com/2019/11/05/world/climate-emergency-scientists-warning-intl-trnd/index.html (accessed on 10 March 2023).
  5. The US Environmental Protection Agency. Sustainability and the U.S. EPA. 2011. Available online: https://nap.nationalacademies.org/catalog/13152/sustainability-and-the-us-epa (accessed on 10 April 2023).
  6. McKinsey & Company. Starting at the Source: Sustainability in Supply Chains. 2016. Available online: https://www.mckinsey.com/~/media/McKinsey/Business%20Functions/Sustainability/Our%20Insights/Starting%20at%20the%20source%20sustainability%20in%20the%20supply%20chain/Starting-at-the-source-Sustainability-in-supply-chains.pdf (accessed on 10 January 2023).
  7. Environmental and Society Portal. 2013. Available online: https://www.environmentandsociety.org/tools/keywords/hans-carl-von-carlowitz-and-sustainability. (accessed on 5 October 2023).
  8. Van Weenen, H. Towards a vision of a sustainable university. Int. J. Sustainability. 2000, 1, 20–34. [Google Scholar] [CrossRef]
  9. Costanza, R. Ecological Economics: All scientific analysis is based on a “pre-analytic vision”, the major source of uncertainty about current environmental policies results from differences in visions and world views. BioScience 2001, 51, 459–468. [Google Scholar] [CrossRef]
  10. Henriques, A.; Richardson, J. The Triple Bottom Line. Does it All Add Up? Taylor & Francis Group: Abingdon, UK, 2004. [Google Scholar] [CrossRef]
  11. Werbach, A. Strategy for Sustainability: A Business Manifesto; Harvard Business; Springer: Berlin/Heidelberg, Germany, 2009; Available online: https://store.hbr.org/product/strategy-for-sustainability-a-business-manifesto/12169 (accessed on 14 May 2023).
  12. Hasna, M. Sustainability classifications in engineering: Discipline and approach. Int. J. Sustain. Eng. 2010, 3, 258–276. [Google Scholar] [CrossRef]
  13. Moldan, B.; Janouskova, S.; Hak, T. How to understand and measure environmental sustainability: Indicators and targets. Ecol. Indic. 2012, 17, 4–13. [Google Scholar] [CrossRef]
  14. Slimane, M. Role and the relationship between leadership and sustainable development to release social, human, and cultural dimension. Procedia-Soc. Behav. Sci. 2012, 41, 92–99. [Google Scholar] [CrossRef]
  15. The Earth Summit on Environmental. 1992. Available online: https://www.un.org/en/conferences/environment/rio1992 (accessed on 6 April 2023).
  16. The United Nations’ Sustainable Development. Open SDG Data Hub. 2015. Available online: https://sdgs.un.org/goals#icons (accessed on 11 May 2023).
  17. Basiago, D. Economic, social, and environmental sustainability in development theory and urban planning practice. Environmentalist 1998, 19, 145–161. [Google Scholar] [CrossRef]
  18. Brundtland Commission. Our Common Future. 1987. Available online: https://sustainabledevelopment.un.org/content/documents/5987our-common-future.pdf. (accessed on 29 May 2023).
  19. The United Nations, Department of Economic and Social Affairs Sustainable Development. 17 Goals. 2015. Available online: https://sdgs.un.org/goals#icons (accessed on 1 February 2023).
  20. The United Nations Environmental Programme, Emissions Gap Report. 2022. Available online: https://www.unep.org/resources/emissions-gap-report-2022?gclid=CjwKCAjwrdmhBhBBEiwA4Hx5gxUtxyaMMltoEktFB3uJWle5-DY-r5BjmgEAjT1gQtpHyWLtukIFbhoChJsQAvD_BwE (accessed on 10 March 2023).
  21. Stoddart, H.; Bottero, M.; Cornforth, J.; Dodds, F.; Lingan, J.; Schneeberger, K.; Shaw, A.; Smith, N.; Strachan, J.; White, R. A Pocket Guide to Sustainable Development Governance. Stakeholder Forum. 2011. Available online: https://sustainabledevelopment.un.org/index.php?menu=35&nr=147&page=view&type=400 (accessed on 29 May 2023).
  22. Brodhag, C.; Talière, S. Sustainable development strategies: Tools for policy coherence. Nat. Resour. Forum 2006, 30, 136–145. [Google Scholar] [CrossRef]
  23. Holden, E.; Linnerud, K.; Banister, D. The imperatives of sustainable development. Sustain. Dev. 2017, 25, 213–226. [Google Scholar] [CrossRef]
  24. Guo, F. The spirit and characteristics of the general provisions of civil law. Law Econ. 2017, 3, 5–16. Available online: https://scholar.google.com/scholar?hl=en&as_sdt=0%2C48&q=Guo%2C+F.+%282017%29.+The+spirit+and+characteristics+of+the+general+provisions+of+civil+law.+&btnG= (accessed on 9 May 2023).
  25. Gray, R. Is accounting for sustainability, and how would we know? An exploration of narratives of organizations and the planet. Account. Organ. Soc. 2010, 35, 47–62. Available online: https://www-sciencedirect-com.proxy.seattleu.edu/science/article/pii/S0361368209000427 (accessed on 1 February 2023). [CrossRef]
  26. Morelli, J. Environmental sustainability: A definition for environmental professionals. J. Environ. Sustain. 2017, 1, 2. Available online: https://scholarworks.rit.edu/cgi/viewcontent.cgi?article=1007&context=jes (accessed on 1 February 2023).
  27. Daily, G.; Matson, P. Ecosystem services: From theory to implementation. Proc. Natl. Acad. Sci. USA 2008, 105, 9455–9456. [Google Scholar] [CrossRef]
  28. Mathis, W.; Beyers, B. Ecological Footprint: Managing Our Biocapacity Budget; New Society Publishers: Gabriola Island, BC, Canada, 2019; Available online: https://books.google.com/books?hl=en&lr=&id=TzCEDwAAQBAJ&oi=fnd&pg=PP1&dq=Mathis,+W.+Ecological+footprint:+managing+our+biocapacity+budget.+&ots=QULQbqsqql&sig=WKbRUI62GAJSrvT_eKS8sxA5mNY#v=onepage&q=Mathis%2C%20W.%20Ecological%20footprint%3A%20managing%20our%20biocapacity%20budget.&f=false (accessed on 1 March 2023).
  29. Global Footprint Network. 2016. Available online: http://www.footprintnetwork.org/en/index.php/GFN/ (accessed on 1 March 2023).
  30. Henfrey, T.; Penha-Lopes, G. Policy and community-led action on sustainability and climate change: Paradox and possibility in the interstices. Environ. Innov. Soc. Transit. 2018, 29, 52–54. [Google Scholar] [CrossRef]
  31. Pincetl, S. Cities in the age of the Anthropocene: Climate change agents and the potential for mitigation. Anthropocene 2017, 20, 74–82. [Google Scholar] [CrossRef]
  32. Bruhwiler, L.; Basu, S.; Butler, J.H.; Chatterjee, A.; Dlugokencky, E.; Kenney, M.A.; McComiskey, A.; Montzka, S.A.; Stanitski, D. Observations of greenhouse gases as climate indicators. Clim. Chang. 2021, 165, 12. [Google Scholar] [CrossRef]
  33. Wall, C.J.; Norris, J.R.; Possner, A.; McCoy, D.T.; McCoy, I.L.; Lutsko, N.J. Assessing effective radiative forcing from aerosol-cloud interactions over the global ocean. Proc. Natl. Acad. Sci. USA 2022, 119, e2210481119. [Google Scholar] [CrossRef]
  34. Boyd, P. Toward quantifying the response of the oceans’ biological pump to climate change. Front. Mar. Sci. 2015, 2, 77. Available online: https://www.frontiersin.org/articles/10.3389/fmars.2015.00077/full (accessed on 16 January 2023). [CrossRef]
  35. Kar, A.; Pani, A. Exploring the importance of different supplier selection criteria. Manag. Res. Rev. 2014, 37, 89–105. [Google Scholar] [CrossRef]
  36. Freeman, C.; Soete, L. The Economics of Industrial Innovation; Psychology Press: London, UK, 1997. [Google Scholar] [CrossRef]
  37. Jensen, C. The modern industrial revolution, exit, and the failure of internal control systems. J. Financ. 1993, 48, 831–880. [Google Scholar] [CrossRef]
  38. Chen, L.; Nan, G.; Liu, Q.; Peng, J.; Ming, J. How do consumer fairness concerns affect an E-commerce Platform’s choice of selling scheme? J. Theor. Appl. Electron. Commer. Res. 2022, 17, 1075–1106. Available online: https://www.mdpi.com/0718-1876/17/3/55 (accessed on 1 March 2023). [CrossRef]
  39. Thompson, H. Industrial Purchasing; Principles and Practice; Richard D. Irwin, Inc.: Washington, DC, USA, 1947; Available online: https://books.google.com/books/about/Industrial_Purchasing.html?id=lIPVAAAAMAAJ (accessed on 1 March 2023).
  40. The History and the Evolution of Global Supply Chain. Blume Global. 2023. Available online: https://www.blumeglobal.com/learning/history-of-supply-chain/ (accessed on 1 March 2023).
  41. Rodrigue, P. The Geography of Transport Systems; Routledge: London, UK, 2020. [Google Scholar] [CrossRef]
  42. Kaplan, M.; Haenlein, M. Toward a parsimonious definition of traditional and electronic mass customization. J. Prod. Innov. Manag. 2006, 23, 168–182. [Google Scholar] [CrossRef]
  43. Alavudeen, A.; Venkateshwaran, N. Computer-Integrated Manufacturing; PHI Learning Pvt. Ltd.: Delhi, India, 2008; Available online: https://books.google.com/books?hl=en&lr=&id=GlL0TO6n320C&oi=fnd&pg=PR2&dq=Alavudeen+A.,++Venkateshwaran+N.,+Computer+integrated+manufacturing,+2008&ots=9a5ghsvjqM&sig=iQA6j4LY1tFSl6 (accessed on 1 February 2023).
  44. Kennard, W.; Stone, A. Computer-aided design of experiments. Technometrics 1969, 11, 137–148. Available online: https://www.tandfonline.com/doi/abs/10.1080/00401706.1969.10490666 (accessed on 7 January 2023). [CrossRef]
  45. Stephenson, N. Snow Crash: A Novel; Spectra: New York, NY, USA, 2003; Available online: https://scholar.google.com/scholar?hl=en&as_sdt=0%2C48&q=44.%09Stephenson%2C+N.+Snow+crash%3A+A+novel.+Spectra.+2003&btnG (accessed on 12 February 2023).
  46. Lee, L.; Billington, C. The evolution of supply-chain-management models and practice at Hewlett-Packard. Interfaces 1995, 25, 42–63. [Google Scholar] [CrossRef]
  47. Singh, N. Emerging technologies to support supply chain management. Commun. ACM 2003, 46, 243–247. Available online: https://dl.acm.org/doi/fullHtml/10.1145/903893.903943 (accessed on 12 February 2023). [CrossRef]
  48. Kemppainen, K.; Vepsäläinen, P. Trends in industrial supply chains and networks. Int. J. Phys. Distrib. Logist. Manag. 2003, 33, 701–719. Available online: https://www.emerald.com/insight/content/doi/10.1108/09600030310502885/full/html (accessed on 12 February 2023). [CrossRef]
  49. Weber, A.; Current, R.; Benton, C. Vendor selection criteria and methods. Eur. J. Oper. Res. 1991, 50, 2–18. [Google Scholar] [CrossRef]
  50. Gereffi, G.; Fernandez-Stark, K. Global Value Chain Analysis: A Primer. 2016. Available online: https://dukespace.lib.duke.edu/dspace/bitstream/handle/10161/12488/2016-07-28_GVC%20Primer%202016_2nd%20edition.pdf (accessed on 12 February 2023).
  51. Ponte, S.; Gereffi, G.; Raj-Reichert, G. Introduction to the handbook on global value chains. In Handbook on Global Value Chains; Edward Elgar Publishing: Cheltenham, UK, 2019; pp. 1–27. [Google Scholar] [CrossRef]
  52. Dickson, G. An analysis of vendor selection systems and decisions. J. Purch. 1966, 2, 5–17. [Google Scholar] [CrossRef]
  53. Wilson, E.J. The relative importance of supplier selection criteria: A review and update. Int. J. Purch. Mater. Manag. 1994, 30, 34–41. [Google Scholar] [CrossRef]
  54. Menon, M.; McGinnis, A.; Ackerman, B. Selection criteria for providers of third-party logistics services: An exploratory study. J. Bus. Logist. 1998, 19, 121. Available online: https://www.library.northwestern.edu/find-borrow-request/requests-interlibrary-loan/lending-institutions.html (accessed on 18 April 2023).
  55. Lee, A.; Seshia, S. Introduction to Embedded Systems—A Cyber-Physical Systems Approach, 2nd ed; MIT Press: Cambridge, MA, USA, 2016; Available online: https://ptolemy.berkeley.edu/books/leeseshia/ (accessed on 18 April 2023).
  56. Ibarra, D.; Ganzarain, J.; Igartua, I. Business model innovation through Industry 4.0: A Review. Procedia Manuf. 2018, 22, 4–10. [Google Scholar] [CrossRef]
  57. Frank, A.; Dalenogare, L.; Ayala, N. Industry 4.0 technologies: Implementation patterns in manufacturing companies. Int. J. Prod. Econ. 2019, 210, 15–26. [Google Scholar] [CrossRef]
  58. Valeske, B.; Osman, A.; Römer, F.; Tschuncky, R. Next Generation NDE Sensor System as Industrial Internet-of-Things Elements of Industry 4.0. Res. Nondestruct. Eval. 2020, 31, 340–369. [Google Scholar] [CrossRef]
  59. Muthuswamy, P.; Shunmugesh, K. Artificial intelligence-based tool condition monitoring for digital twins and industry 4.0 applications. Int. J. Interact. Des. Manuf. 2023, 17, 1067–1087. [Google Scholar] [CrossRef]
  60. Xu, D. Industry 4.0—Frontiers of the Fourth Industrial Revolution. Syst. Res. Behav. Sci. 2020, 37, 531–534. [Google Scholar] [CrossRef]
  61. Santhi, A.; Muthuswamy, P. Industry 5.0 or Industry 4.0S? Introduction to Industry 4.0 and a Peek into the prospective Industry 5.0 technologies. Int. J. Interact. Des. Manuf. (IJIDeM) 2023, 17, 947–979. [Google Scholar] [CrossRef]
  62. Barreto, L.; Amaral, A.; Pereira, T. Industry 4.0 implications in logistics: An overview. Procedia Manuf. 2017, 13, 1245–1252. [Google Scholar] [CrossRef]
  63. Frederico, G.F.; Garza-Reyes, J.A.; Anosike, A.; Kumar, V. Supply Chain 4.0: Concepts, maturity, and research agenda. Supply Chain. Manag. Int. J. 2020, 25, 262–282. [Google Scholar] [CrossRef]
  64. European Commission. Research and Innovation Industry: 5. 2022. Available online: https://research-and-innovation.ec.europa.eu/research-area/industrial-research-and-innovation/industry-50_en (accessed on 9 January 2023).
  65. De Giovanni, P. Leveraging the circular economy with a closed-loop supply chain and a reverse omnichannel using blockchain technology and incentives. Int. J. Oper. Prod. Manag. 2022, 42, 959–994. Available online: https://www.emerald.com/insight/content/doi/10.1108/IJOPM-07-2021-0445/full/html (accessed on 9 January 2023). [CrossRef]
  66. Vishkaei, B. Metaverse: A New Platform for Circular Smart Cities. In Cases on Circular Economy in Practice; IGI Global: Hershey, PA, USA, 2022; Available online: https://www.igi-global.com/chapter/metaverse/312035 (accessed on 16 April 2023).
  67. Queiroz, M.M.; Wamba, S.F.; Pereira, S.C.F.; Jabbour, C.J.C. The metaverse as a breakthrough for operations and supply chain management: Implications and call for action. Int. J. Oper. Prod. Manag. 2023, 43, 1539–1553. Available online: https://www.emerald.com/insight/content/doi/10.1108/IJOPM-01-2023-0006/full/html (accessed on 1 May 2023). [CrossRef]
  68. Fu, Y.; Li, C.; Yu, F.R.; Luan, T.H.; Zhao, P.; Liu, S. A survey of blockchain and intelligent networking for the metaverse. IEEE Internet Things J. 2023, 10, 3587–3610. [Google Scholar] [CrossRef]
  69. Yu, R.; Yu, A. The Metaverse and the Real-World Universe. In A Brief History of Intelligence: From the Big Bang to the Metaverse; Springer International Publishing: Cham, Switzerland, 2022; pp. 5–109. Available online: https://link.springer.com/chapter/10.1007/978-3-031-15951-0_9 (accessed on 22 January 2023).
  70. Rowling, J.; Ménard, J.; Ménard, J. Harry Potter à L’école des Sorciers; Gallimard Jeunesse: Paris, France, 2000; Available online: https://scholar.google.com/scholar?hl=en&as_sdt=0%2C48&q=70.%09Rowling%2C+J.+%281998%29.+Harry+Potter+%C3%A0+l%27%C3%A9cole+des+sorciers.+Triangle&btnG (accessed on 13 April 2023).
  71. Ivankova, N.V. Mixed Methods Applications in Action Research: From Methods to Community Action; Sage Publications: Washington, DC, USA, 2015; Available online: https://books.google.com/books?hl=en&lr=&id=RNQ5DQAAQBAJ&oi=fnd&pg=PP1&dq=71.%09Ivankova+N.+V.+Mixed+methods+applications+in+action+research:+From+methods+to+community+action,+2015.+Sage,+ISBN+978-1-4522-2003.++&ots=pv76FhMC2X&sig=fO9jmlnLmxdjQGX_fCGq4xmiVlM#v=onepage&q&f=false (accessed on 22 October 2023).
  72. Christensen, R. Analysis of Variance, Design, and Regression: Linear Modeling for Unbalanced Data; CRC Press: Boca Raton, FL, USA, 2018. [Google Scholar]
  73. The Richmond Vale Academy. The Second Industrial Revolution: The Technological Revolution. Global Issue. World History. 2022. Available online: https://richmondvale.org/blog/second-industrial-revolution/#What (accessed on 29 January 2023).
  74. Nardinelli, C. Child labor and the Factory Acts. J. Econ. Hist. 2010, 40, 739–755. [Google Scholar] [CrossRef]
  75. Saeed, F.; Malik, M. Oceanic pollution; A threat to life. Pure Appl. Biol. 2022, 11, 483–490. [Google Scholar] [CrossRef]
  76. Cocks, D. Use with Care: Managing Australia’s Natural Resources in the 21st Century; University of New South Wales Press: Kensington, NSW, Australia, 1992; Available online: http://dougcocks.labshop.com.au/MAKEWINFINAL.pdf (accessed on 14 January 2023).
  77. Flannery, T. The Future Eaters: An Ecological History of the Australasian Lands and People; Reed New Holland: Sydney, NSW, Australia, 1994. Available online: https://catalogue.nla.gov.au/Record/2197719 (accessed on 10 May 2023).
  78. Rees, W. Ecological footprints and appropriated carrying capacity: What urban economics leaves out. Environ. Urban. 1992, 4, 121–130. [Google Scholar] [CrossRef]
  79. Karampournioti, E.; Wiedmann, K. Storytelling in online shops: The impacts on explicit and implicit user experience, brand perceptions, and behavioral intention. Internet Res. 2022, 32, 228–259. [Google Scholar] [CrossRef]
  80. Shen, B.; Tan, W.; Guo, J.; Zhao, L.; Qin, P. How to promote user purchases in the metaverse? A systematic literature review on consumer behavior research and virtual commerce application design. Appl. Sci. 2021, 11, 11087. [Google Scholar] [CrossRef]
  81. Acemoglu, D.; Restrepo, P. The race between man and machine: Implications of technology for growth, factor shares, and employment. Am. Econ. Rev. 2018, 108, 1488–1542. Available online: https://www.nber.org/system/files/working_papers/w22252/w22252.pdf (accessed on 18 January 2023). [CrossRef]
  82. Dhelim, S.; Kechadi, T.; Chen, L.; Aung, N.; Ning, H.; Atzori, L. Edge-enabled metaverse: The convergence of metaverse and mobile edge computing. arXiv 2022, arXiv:2205.02764. [Google Scholar] [CrossRef]
  83. Sisi, Z.; Souri, A. Blockchain technology for energy-aware mobile crowd sensing approaches in the Internet of Things. Trans. Emerg. Telecommun. Technol. 2021, e4217. [Google Scholar] [CrossRef]
  84. World Health Organization. Solid Waste—Compendium of WHO and Other UN Guidance on Health and Environment. 2021. Available online: https://cdn.who.int/media/docs/default-source/who-compendium-on-health-and-environment/who_compendium_chapter4_v2_01092021.pdf?sfvrsn=b4e99edc_5 (accessed on 18 January 2023).
  85. Sinha, S. State of IoT 2023: Number of Connected IoT Devices Growing 18% to 14.4 Billion Globally. IoT Analytics. 2023. Available online: https://iot-analytics.com/number-connected-iot-devices/ (accessed on 2 June 2023).
Figure 1. Suppliers’ evolution alongside industrial revolutions and their selection criteria [35].
Sustainability 15 15930 g001
Figure 2. Supplier selection criteria identified through literature review from 1765 to 2023.
Sustainability 15 15930 g002
Table 1. Common sustainability indicators [16,19,20].
EnvironmentalEconomicSocial
Global warmingGross domestic productHealth
Acidification potentialTrade balanceEducation
Ozon depletionGovernment revenueIncome
Aerosol optical depthProfitLiving standards
EutrophicationProductivity ValueEquity
Ionization radiation potentialTaxCommunity cohesion
Waste production treatmentEqualitySocial security
Freshwater useInflation
Energy resources useGovernment debt
Level of Biodiversity
Table 2. Supply chain selection criteria and their indicators during industrial revolutions.
Selection CriteriaQualitative and Quantitative Indicators During Each Industrial RevolutionIndustry 1.0
1765–1860s
Industry 2.0
1865–1930s
Industry 3.0
1930–2000s
Industry 4.0
2011–2020s
Industry 5.0
After 2022
PriceLowest price, transportation cost, and ordering cost3
ProductivityQuantity, production capacity, and outputs/inputs 3
Performance historyCompliance, control variability, adapting to changes, and fulfillment rate 4
Warranty policyRepairs, replacement, duration of warranty, and frequency of maintenance 3
Two-way delivery and logisticsRight product, right quantity, right place, right schedule, and right price 5
ProximityGeographical locations, capacity of distribution centers, capability of delivery 3
ReliabilityAccepted delivery/total orders ratio, responsiveness, and collaboration 3
Quality% of rework and returned items, commitments to TQM, and Six Sigma 3
Service and responsivenessAfter-sales dependability, return policy, responsiveness, and transparency 4
Financial stabilityRevenue, profit, financial resources, and investment-to-loan ratio 3
EfficiencyOutput/inputs and resource utilization 2
Safety and securityEnvironmental, building, equipment, human resources, and cyber 5
Agility and flexibilitySpeed in responding to unpredictable events/changes and coordination 2
Repair servicesOn-call repair, no delays, speedy recovery, and no repair charges 4
Continuity of operationsBackup: building, hardware, software, human resource skills, and digital platform 5
Technical capabilityHardware, software, human skills, and network 4
Infrastructure capabilityPhysical assets, hardware, software, robots, and human resource development 5
Hyper-connectivityDigital platforms, information and communication technologies: AI, IoT, 3D, and RFID 2
Labor relations and business reputationCustomer relations, safety, and labor legal complains 3
Intercreditor agreementPrice, quantity, % of rejection, and delivery 4
20 criteria70 indicators from Industry 1.0 to 5.0
Table 3. ANOVA Single Factor.
Summary
GroupsCountSumAverageVariance
Environmental Sustainability20155177.55382.7868
Economic Sustainability2023211.6106.6737
Social Sustainability2049824.9335.4632
ANOVA
Source of VariationSSdfMSFp-ValueF Crit
Between Groups48,655.43333224,327.7288.472613.33 × 10−183.158843
Within Groups1567.5557274.9746
Total64,328.9833359
Table 4. Cross-correlation matrix.
GroupsEconomic SustainabilityEnvironmental SustainabilitySocial Sustainability
Economic sustainability1
Environmental sustainability−0.3783426411
Social sustainability−0.853764998−0.15881055321
Disclaimer/Publisher’s Note: The statements, opinions and data contained in all publications are solely those of the individual author(s) and contributor(s) and not of MDPI and/or the editor(s). MDPI and/or the editor(s) disclaim responsibility for any injury to people or property resulting from any ideas, methods, instructions or products referred to in the content.

